Embed Size (px)
Citation preview

WP 3 Confidential: (no) 02.05.2011 How will users react to off-peak charging schemes and V2G services?
Work Package (WP) No: 3 WP title: Evaluation of economic, environmental, regulatory and social aspects Editor: Ingo Bunzeck, C.F.J. (Ynke) Feenstra, Mia Paukovic Date: 31.03.2011 Version: 1.0 STATUS The research leading to these results has received funding from the European Union Seventh Framework Programme (FP7/20072013) under grant agreement No. 241295.
D3.2. Preferences of potential users of electric cars related to charging - A survey in eight EU countries.
Confidential (Y / N) N
in process (Y / N)
in revision (Y / N)
approved (Y / N)
changes to be
incorporated until
N
dd.mm.jjjj
NY

WP 3 Confidential: (no) 02.05.2011 How will users react to off-peak charging schemes and V2G services?
Bunzeck/Feenstra/Paukovic Version 1.0 page 2 of 2
Track changes Name Date
(dd.mm.jjjj) Version Changes
Subject of change page Lennart Spante 15.03.2011 0.5 Spelling corrected 4 Anh Tuan Le 16.03.2011 0.5 Spelling corrected Various Anser Shakoor 18.03.2011 0.5 Spelling corrected Various Vera da Silva 30.03.2011 0.7 Improved methodology 7‐10 Magali Pierre 31.03.2011 0.7 Improved methodology 7‐10 Julia Backhaus 14.04.2011 0.8 Spelling corrected Various

WP 3 Confidential: (no) 02.05.2011 How will users react to off-peak charging schemes and V2G servvices
Table of Contents Executive Summary .............................................................................................................................. 3 1. Introduction ................................................................................................................................... 6 1.1. Acceptance of electric vehicles ............................................................................................... 6
1.2. Approach ................................................................................................................................. 7
1.3. Methodology ........................................................................................................................... 8
1.4. Limitations ............................................................................................................................... 9
1.5. Assumptions .......................................................................................................................... 10
2. Current behaviour and preferences of car drivers................................................................... 11 2.1. Car possession ....................................................................................................................... 11
2.2. Parking behaviour .................................................................................................................. 12
3. Survey results on intended behaviour of EV users ................................................................... 13 3.1. Background and general information about respondents .................................................... 13
3.2 Charging location ................................................................................................................... 18
3.2. Delayed charging ................................................................................................................... 20
3.3. Vehicle‐to‐grid schemes (V2G) .............................................................................................. 23
4. Important observations and conclusions ................................................................................... 27 Resources .............................................................................................................................................. 29 Appendix – Full Questionnaire .......................................................................................................... 30

WP 3 Confidential: (no) 02.05.2011 How will users react to off-peak charging schemes and V2G servvices
List of Figures Figure 1: Categorisation of some aspects related to use and purchase of EV and to user and vehicle used in the preparation of this study. 7 Figure 2: Survey start page screenshot 9 Figure 3: Motorisation rate (source: European Motor Vehicle Parc 2008, 2010a) 11 Figure 4: Number of respondents per country 13 Figure 5: Percentage of respondents that have seen and heard about electric cars per country 14 Figure 6: Percentage of respondents per age category and gender 15 Figure 7: Size of municipality in which respondents live 15 Figure 8: Current car possession of respondents by country 16\ Figure 9: Parking place opportunities of respondents by country 16 Figure 10: Current average daily travel distances by country 17 Figure 11: Minimal required battery capacity to consider buying an electric car per country (in km) 18 Figure 12: Preferred charging location of respondents in percentages (answers have been aggregated by categories private/no private parking place) 19 Figure 13: Location of preferred charging with price incentive 20 Figure 14: Interest of respondents in delayed charging on scale from 1 (no interest) to 7 (very interested) 21 Figure 15: Reasons for not participating in the delayed charging scheme 22 Figure 16: Recharging up to specified battery capacity in km 23 Figure 17: Reasons for not participating in V2G schemes and incentive 24 Figure 18: Effects of price incentives in interest to participate in V2G schemes (for those not interested in V2G schemes without price incentive) 25 Figure 19: Percentage of respondents indicating a minimum required amount of electricity for 120km or less when joining V2G schemes (Answer possibility was user defined amount of km). 25 Figure 20: Interest of respondents in delayed charging and V2G schemes when batteries are leased instead of owned 26
List of Tables Table 1: Summary of assumptions used in the questionnaire 11

WP 3 Confidential: (no) 02.05.2011 How will users react to off-peak charging schemes and V2G servvices
[‘...current car density and willingness to buy newly built cars, can be indicators for interest in buying an EV and future EV density...’]
Executive Summary Introduction Although the discussions around the market introduction of electric vehicles (EVs) currently revolve mainly around technical issues related to the vehicles and infrastructure, also user preferences play a large role in the process and can be a determining factor for success. Due to different vehicle characteristics compared to conventional cars, in particular unfamiliarity with the recharging process and expectations towards vehicle performance, users could be potentially faced with interventions in their usual travelling and refuelling patterns that can influence their overall willingness for technology adoption. The initial segment of people purchasing an EV, ‘technology pioneers’, is considered to be well-prepared for necessary adaptations in personal behaviour (e.g. limited availability of recharging infrastructure in the build-up phase). Nevertheless, in order for EVs to reach a mass market impact they need to correspond with the requirements of the majority of car drivers. People are used to routines with regard to vehicle usage and fuelling. It should be therefore investigated how these routines and preferences would affect an electric infrastructure roll-out. Also, in order to reach the full benefits of EVs from an environmental and economic perspective, they are foreseen to take over a special role in our future electricity system, e.g. as peak buffer and storage medium for intermittent energy sources. It is virtually unknown how EV users would respond to such new functions, possibly requiring interventions while the vehicle is connected to the grid by the charging infrastructure operator. This study aims to provide new research results regarding the preferred charging locations for EVs, the acceptance of delayed (off-peak) charging schemes and vehicle-to-grid services among potential EV-users, as well as the possible impact of leased batteries on the participation in both schemes. This study is performed within the Grid for Vehicles (www.g4v.eu) project funded by the European Commission. It is part of the work package that analyzes the economic, environmental, regulatory and social constraints linked to a large-scale EV rollout in Europe. Approach Data about current car possession and parking behaviour were collected via a desk research. To collect data about potential EV-user behaviour and preferences, an online survey was chosen as the instrument that served best the objectives of fast data collection and easy processing. In order to get a representative picture of Europe, the survey was made available in eight languages: English, German, French, Spanish, Italian, Dutch, Swedish and Portuguese. The survey was further distributed through the project consortium with the particular intention to cover the general public. Although the survey was distributed via family members, social networks and company websites to reach a broad coverage of society, the risk cannot be excluded that the respondents do not represent a statistical perfect sample of the general population. Results – existing car possession and parking behaviour With more than 500 cars per 1,000 inhabitants, current car density is high in Italy, Austria, Lithuania, Finland and Germany. The average age of a car in Europe is 8.2 years. Youngest cars (6,9 years on average) are driven in the UK. Most of the oldest cars in EU are to be found in Germany, Italy and France (ACEA, 2010a/b and Eurostat, 2011). Not a lot of data about current parking behaviour is available. The few studies show however that most cars (56%) are parked most of the day at home or at work (20%). Current car density and willingness to buy newly built cars can be indicators for the interest in buying an EV and future EV-density in specific regions in the future. Data about parking behaviour could be an indicator for preferred charging locations for EV.

WP 3 Confidential: (no) 02.05.2011 How will users react to off-peak charging schemes and V2G servvices
[‘...86 % travel less than 100km per day, but only 18% would buy an EV with a battery capacity for 120km..’]
[‘...even those respondents that do not own a private parking place at this moment, would prefer to charge at home...’]
Results – demographics and parking facilities 1,899 respondents from eight European countries provided feedback regarding their preferences and requirements for electric vehicles via the online survey. Respondents are moderately positive to buy an electric vehicle in the coming two years (average 3,76 on a scale from 1-7) with the highest interest from Portugal, the UK and Sweden. The majority of respondents also has either a private parking place available or a place in a parking lot. There is a difference between North/South of EU as many Swedish, British and Dutch respondents have a private outdoor parking facility while the Southern respondents usually have access to a parking lot. Results – driving range Interestingly, the actual daily distances people travel (on average 24% drive <20km and 61% between 21-100km per day) do not match with the requirements drawn up by survey respondents in order to consider buying an EV: Only 18% would buy an EV with a battery capacity allowing for a driving range of 120 km. This means that although the daily travel requirements can be perfectly covered by an EV, the occasional longer trip, e.g. for holidays abroad have a significant impact on their driving range requirements. A further aspect might be consumers’ mistrust regarding the indications on feasible driving range indicated by the car manufacturers compared to reality. On average, survey respondents required 308 km minimal battery capacity in order to consider buying an EV, with as high as almost 400 km in the Netherlands and close to 200 km in Sweden. Results – preferred charging Respondents do prefer home recharging – most respondents possess a private parking place at home or work (average 69.9% of respondents) of which 20.3% which would like to use home exclusively to recharge, while 49.6% would also have to use public infrastructure due to expected long distances. It
is hardly surprising that there are differences regarding charging preferences in urban compared to rural environments. Respondents living in small cities (<100,000 inhabitants, where they usually have a parking place) prefer to charge at home, while those living in larger cities with no parking place are afraid not to find a recharging place. Of course, the major share of all respondents (85%) also prefers to charge their vehicle at home if it is connected to a price
incentive (€3 per battery for home recharging, €5 for public recharging). Even those respondents that do not own a private parking place at this moment, would in this case prefer to charge at home. Results – charging schemes and vehicle-to-grid Asked about the interest in joining delayed charging schemes (off-peak times 22.00-06.00) the respondents answered positively, with an average of 5.74 on a scale from 1-7. Very high interest comes from the UK (6.09), while Spanish (5.6) and Dutch (5.65) people are less enthusiastic. Being afraid of not having the possibility to use their car is the most frequently given reason not to be interested. Faced with the option of having their battery partially recharged immediately in order to have a price incentive, the options to charge 40km (2€), 80km (2.5€) or 120km (3€, full range) were almost equally preferred by the respondents, with a slight tendency for a full battery immediately. Interest to participate in vehicle-to-grid (V2G) schemes is above average with 4.38 on a 1-7 point scale, with UK and Portugal showing highest interest. Compared to the interest stated for delayed charging schemes this is however a significant lower interest. Through a follow-up question regarding the reasons of not being interested to participate in V2G, it became clear that the low level of benefits that would be received to participate in such a scheme is the prime reason (45% of respondents). Offers to choose between €20 or €60 shows that a higher benefit has an impact on people and stimulates participation. 71% of the respondents that are interested in the V2G services also indicate that they would accept a minimum battery capacity of 120km or less when their car battery is used for balancing the grid.
WP 3 Confidential: (no) 02.05.2011 How will users react to off-peak charging schemes and V2G servvices
According to these respondents, an average of 70km should be left in the battery which can be seen as safety measure in order to be able to travel a least amount of kilometres. Implications for infrastructure roll-out The results of the survey show that most people prefer to recharge their car at home. This is of course depending on the availability of a private parking place at home or at work. Also, financial incentives to influence consumer behaviour to some extent towards home charging have been shown to be effective in stimulating home charging. On the other hand, there is also a clear signal that nevertheless, public infrastructure is desired or even absolutely necessary to cover distances that are accumulated during the day. Certainly, distinctions need to be made for the infrastructure rollout between urban and suburban areas, and even incorporating different preconditions throughout the EU. Some city dwellers without private parking place at home or at work are afraid of being stranded without a recharging pole nearby. As people indicated to drive mostly small distances each day, it can be sufficient to charge at public charging points at e.g. shopping centres, car park at railway station, parking lot of office building. New technical possibilities to recharge electric cars might be able to offer solutions to current perceived limitations concerning vehicle driving range. Inductive charging integrated under the pavement, providing the opportunity to charge at occasions where cars have to stop anyway, e.g. on red traffic lights, intersections can be a solution to charge ‘on the go’. Other solutions include fast charging that would move the recharging process closer to a time span people are used to from conventional liquid fuels. Battery swapping stations are another solution for long-distance travel, but also require a great deal of infrastructure.

WP 3 Confidential: (no) 02.05.2011 How will users react to off-peak charging schemes and V2G servvices
1. Introduction
1.1. Acceptance of electric vehicles
The media features abundant communication on electric vehicles (EVs) and their potential role for a sustainable transport system. Although still some technical issues revolve around the market introduction of EVs, it seems to be one of the most realistic options to be available for consumers in the showroom very soon. Electricity companies are meanwhile also busy with figuring out the best configuration for an EV recharging infrastructure, serving an expected numbers of customers over the next years. In order to reach the full benefits of EVs from an environmental and economic perspective, they are also foreseen to take over a special role in our future electricity system, e.g. as peak buffer and storage for intermittent energy sources. While this new role potentially requires quite some intervention on people’s daily routines and behaviour regarding individual transport, it can also result in serious constraints regarding the actual vehicle usage. It is virtually unknown how the consumer would respond to such interventions from the charging infrastructure operator. This report presents new research results regarding the acceptance of this new vehicle functions and connected charging schemes. There are many categories and factors influencing the societal acceptance of electric vehicles. These include factors from technical categories (e.g. driving range and performance of a vehicle, charging infrastructure, competing technologies), financial ones (e.g. purchasing costs and fuel prices), demographic and geographic (e.g. gender, urban vs rural, parking availability, climate), political (e.g. existing policies, taxes and subsidies) and cultural/social categories. This last category contains again many different subcategories ranging from person-related aspects as willingness to pay, environmental awareness, current driving behaviour, personal perceptions etc to broader society-related aspects like prevailing norms and values related to transport and mobility and public opinion general image of EVs. Some of these social factors have an origin in one of the other categories (e.g. perceptions on vehicle performance or trust in continuity of policies). Although (a variation of) this categorisation is often used in research and practices related to societal acceptance (e.g. Heiskanen, et al., 2008), another categorisation was used in this study. The Grid4Vehicles project focuses on the effects of a large-scale rollout of electric vehicles on the electricity grid. It was therefore chosen not to focus on all aspects influencing the acceptance of electric vehicles in this study, but to focus on those that would have a direct impact on the grid. This includes the factors related to vehicle use, but especially those related to the charging process of electric vehicles. Therefore, it was also decided to abandon the original foreseen report title ‘Description of the social aspects (challenges) of the integration of EV/PHEV’ in favour of the new one that is more adequate and specific. Factors more related to the general acceptance or purchase of electric vehicles are thus not taken into account. A more detailed analysis of first user typology and motives to purchase electric vehicles was carried out in France based on interviews. France also had a large EV RD&D programme in the 1990s facilitated by Electricité de France (Magali et al, 2009).
Within the category of charging related factors another focus is put on those factors that are user dependent. This means that vehicle or infrastructure dependent factors (like battery lifetime and duration of charging) are less focussed on. Between the categories of aspects influencing the acceptance of electric vehicles used and purchase related factors and technical and user related factors, some grey areas of overap exist.
The schematic overview in Figure 1 illustrates the categorisation of a selection of aspects influencing the acceptance of electric vehicles used in the preparation of this study.

WP 3 Confidential: (no) 02.05.2011 How will users react to off-peak charging schemes and V2G servvices
Figure 1: Categorisation of some aspects related to use and purchase of EV and to user and vehicle used in the preparation of this study.
1.2. Approach
Electric vehicles in the form of passenger cars are not widely available yet. Apart from some participants in demonstration projects, many potential users of electric vehicles have never even seen an electric vehicle, and definitely not driven or charged one. People are thus also not familiar with the characteristics of these vehicles either. This limits to a large extent research on some factors related to the acceptance of electric cars, especially those related to use (and charging) preferences. In such cases it is often advised to base predictions of future behaviour on current or past behaviour of people (Oulette and Wood, 1998). The big differences between the refuelling of conventional and the recharging of electrical cars in terms of price and duration and other vehicle characteristics, e.g. driving range, however, makes current behaviour a poor predictor of future electric car charging behaviour. Research on user (and charging) behaviour of electric cars therefore has to be based on the preferred behaviour potential users foresee. This is a challenge in itself, because a person would have to take many factors of not only the electric car, but also their own behaviour and the context of recharging infrastructure into account which at present are unknown to them. Current predictions of behaviour and preferences will be far from perfect. However, by presenting respondents with several options, their choices will give insight into their general preferences and how they value different aspects of the options. For example, it is hard to say whether respondents who indicate they will charge their car at home will in reality do so. Nevertheless asking people where they would prefer to charge gives an indication of their preference in the ideal situation when they could charge exactly where they want. Similarly, it is impossible to predict how much of the public will actually join particular charging schemes offered to them. It is, however, possible to explore their perceptions about and interest in it and reveal general interest or aversion to different options. By presenting different charging options the differences found between how these are evaluated will give an indication of how the different aspects are weighted. To accommodate the challenge of asking respondents about a topic which they are inexperienced with, several measures were taken. First of all, respondents received short information about the relevant topic, such as general information about electric cars, charging and capacity characteristics of electric cars and different charging options available. Secondly, respondents were asked for their interest and

WP 3 Confidential: (no) 02.05.2011 How will users react to off-peak charging schemes and V2G servvices
preference. Thirdly, the options and some associated factors such as price were kept as clear and simple as possible. Monetary incentives were for instance not intended to establish the exact level at which respondents choose for different options, but to explore the role any incentive would pay in their deliberation and how they weigh it against other factors, such as for instance control over their own charging.
1.3. Methodology
Data on existing car possession and parking behaviour were collected via a desk research and are presented in chapter 2. These data are however mostly based on conventional cars. To collect data on user behaviour and preferences in relation to electric vehicles, it was necessary to choose another data collection method. The objectives of fast data collection over the duration of only some weeks, easy processing of the data stock for analysis and the coverage of several EU member states (to distinguish regional differences) had to be served. Therefore, it was decided that an online anonymous questionnaire would be the most optimal tool. First, an initial questionnaire was developed in cooperation with the project consortium. Since the G4V project aims more on the grid perspective and not so much on aspect related to the vehicle itself, it was decided to specifically aim at aspects of preferred recharging location and the acceptance of delayed charging as well as vehicle-to-grid (V2G) services in which the battery would be used for backup storage and can be accessed by the utility. For the development of the survey, a selection of topics and questions suggested by the consortium partners was made on basis of the aforementioned considerations of what is feasible to ask of respondents in the current context. The draft surveys were tested using think out loud interviews with lay people. These tests revealed misunderstandings and difficulties respondents had while filling in the survey. The outcomes of these tests were integrated in the final version of the survey. The topics included in the survey are: minimum required driving range, preferences for parking and charging locations, interest in delayed and vehicle to grid charging schemes and the role of price incentives and a leased battery. Several background variables were taken into account as well. Respondents were asked about their general awareness of and their interest in electric cars and the environment, their current car ownership and driving distance, the size of the municipality they live in, their age and gender and current parking facilities. The survey was initially created in English. To achieve sufficient coverage of different geographical and cultural differences in the EU that could influence the consumer responses, the survey was subsequently translated to seven other languages: German, Dutch, Swedish, French, Italian, Spanish and Portuguese. The translations were carried out by ECN (supported by native staff from each of the relevant countries) and in cooperation with the respective country partners. Thereby, it was ensured that the meaning of each of the question has been properly understood by respondents in different countries, albeit taking into account that sometimes the semantics compared to the original English version had to be altered. The survey itself was set-up through a questionnaire software, ZOOMERANG (www.zoomerang.com). For each of the eight survey languages, a dedicated hyperlink was created that led the users to the start of the survey. (see Figure 2 below)

WP 3 Confidential: (no) 02.05.2011 How will users react to off-peak charging schemes and V2G servvices
Figure 2: Survey start page screenshot
To collect as much as possible data, the survey links needed to be brought to the attention of the general public. The dissemination of each of the links to the survey was organized in a two-fold way. First, the respective partners from the involved countries distributed the link to the survey in their respective language among friends and family using social networks and other communication channels such as placing it on company websites, mentioning it in news articles, blogs or other publications. The second channel for dissemination was the G4V project website (www.g4v.eu). A call for support was prominently placed on the website and the links to each of the country surveys were available. The survey was online and available for responses from the end of December 2010 and finished in the first week of February 2011. This period was depending on the timeframe set up for this subtask within the G4V consortium agreement.
1.4. Limitations
The authors are aware of the limitations of this study. For the interpretation of results, the reader as well must continuously be aware of the following four limitations:
- The survey was created and distributed with the intention to achieve responses from the general public and potential users of electric vehicles. Due to the anonymity of the respondents, it is however impossible to judge whether respondents have had (a lot of) additional previous knowledge on the topic.
- The method of recruiting respondents was likely to create some bias in the sample. The media used to distribute the survey reach a certain part of the population, but also through self-selection of respondents with interest in the topic or by attracting those that are confident enough about their own knowledge of the topic to state their opinion. To address the last issue in the introduction text of the survey it was specifically mentioned no prior knowledge was required to complete the survey and that any individual above 18 years old, living in the EU could fill in the survey. As for self-selection due to interest, despite the likely bias this creates, the respondents are also possibly the most likely users of electric vehicles in the near future. It must thus be recognised that the sample of respondents is not a representations of the general public.

WP 3 Confidential: (no) 02.05.2011 How will users react to off-peak charging schemes and V2G servvices
- A third limitation of this study is the measuring of preferences, of intended behaviour. Respondents were asked to imagine that they would have an electric car and to indicate how they would use and charge it. The answers provided are thus not necessarily in line with the real behaviour of the respondents in the future.
- A fourth limitation relates to the achieved response rate. A statistical base for analysis has been achieved for six out of the eight countries (UK and France yielded less than 100 responses). Nevertheless, statistical accuracy could only be achieved up to a certain point and within the given time and resources of this project task. The project consortium is well aware that the ways in which the questionnaire was circulated as well as the number of respondents could have lead to deviated answers compared to the average population. Therefore, the results of the analysis should be also seen in this context.
1.5. Assumptions
Through the survey, the questions are based on several assumptions that influence the responses. The assumptions are summarized in Table 1. Assumption Value SourceEV Availability Market introduction phase, EVs
available in the showroom G4V Project consortium
Average time needed to recharge the battery (normal charging, 120km)
4 hours G4V Project consortium
Indicative battery capacity 120km G4V Project consortium Price for home recharging €3 G4V Project consortium Price for public recharging €5 G4V Project consortium Price for delayed (home) charging (22:00-06:00)
€2 G4V Project consortium
Table 1: Summary of assumptions used in the questionnaire

WP 3 Confidential: (no) 02.05.2011 How will users react to off-peak charging schemes and V2G servvices
2. Current behaviour and preferences of car drivers This study focuses on electric vehicles (EV) and the preferences of potential EV-users. To place the outcomes of the survey presented in chapter 3 in a relevant context, some background about current conventional car possession and use is provided in this chapter.
2.1. Car possession
Electric vehicles could (in the foreseeable future) replace existing conventional cars on the roads in Europe. To investigate the potential for EV, the data about current car possession in the EU are thus relevant. Such data are available in statistical resources from organisations like ACEA (European Automobile Manufacturers’ Association). In their publication European Motor Vehicle Parc 2008 (2010a) data about vehicles in use in the different members states between 2003 and 2008 are presented. From this we learn that in the EU-23 in total 224 million passenger cars existed in 2008. Countries with most cars on the roads are Germany (41 million), Italy (36 million) and France and UK (30 million).
Figure 3: Motorisation rate (source: European Motor Vehicle Parc 2008, 2010a)
When linking these numbers to the number of inhabitants the car density of countries is measured. Highest car density exists in Italy with 601 cars in 2008 per 1,000 inhabitants according to ACEA (2010a). Other countries with a high density of more than 500 cars/1,000 inhabitants are Austria, Lithuania, Finland and Germany. Least dense are Denmark, Slovakia and Turkey with less than 400 cars / 1,000 inhabitants. These numbers are in line with data from Eurostat on motorisation rate in 2009 (Eurostat, 2011) presented in Figure 3. The current density of cars is of interest for the potential effects on the electricity grid of a large implementation of EV. When EV enter the market and start replacing conventional cars in those countries which have a high car density, a high EV density could occur. Higher EV density obviously has a larger effect on the grid balance than lower EV density. Some studies predict however a decreasing motorization rate, especially in bigger cities because

WP 3 Confidential: (no) 02.05.2011 How will users react to off-peak charging schemes and V2G servvices
especially among younger people the car loses its pole position in emotional preferences, meaning the importance of the car as status symbol. (Roland Berger Strategy Consultants, 2011). Another element that could influence the introduction of EVs in the EU is the age of existing cars. If we assume that an EV will replace an existing car, the fastest introduction of EV will take place in those countries where people prefer to drive a ‘new and young’ car. According to ACEA (2010b) the average age of the cars on the road in 2008 is 8.2 years. Oldest cars are on the roads in Latvia (average 15.9 years) and youngest in the UK (6.9 years). The total car fleet in the EU can be divided almost equally in age groups of 0-5 years (33.6%), 5-10 years (31.9 %) and over 10 years old (34.5%). Most of the cars over 10 years are on the roads in Germany (14 million), Italy (13 million) and France (10 million). More interesting however are data about the owners of the cars. An early market for EV is said to be households with a second car (which could be an EV). ACEA (2010a) provides detailed data about car ownership in 2008 in France, Denmark, Poland and Lithuania. In all these countries a majority of the households owns a car. Of the households that own cars in France, more than 35% owns two or more cars. This number is however much lower in for example Denmark (12%). These big differences in car ownership might also affect the introduction of EVs in these countries.
2.2. Parking behaviour
The biggest difference between using an EV and a conventional car is the fuelling. Charging an EV takes much more time (30 min to 8 hours) than fuelling a car with diesel, gasoline or LPG (a few minutes). This has large implications for the user. Charging an EV implies parking the car for a longer period on a specific place close to a charging point. Fuelling a car becomes linked to parking, instead of just making a quick stop at a fuelling station during a trip. Ideally the charging points for EV are thus situated at the locations that EV users want to park their car for at least 30 minutes. This could be on private parking places (at home or at work), but also at public or shared parking places on the street, in parking garages or at car parks of shopping malls, cinemas, sport clubs, etc. Existing parking behaviour might give some insights in where EV could be charged. Data about parking behaviour are difficult to find. A survey performed within the MERGE project among 1,621 respondents in six countries, asked where the car of the respondents was parked the longest period of time in a given day. “56% of the cars are parked either in the garage or on the driveway on weekdays, rising to 72% on weekends.” (Bending et al, 2010, pp.III-23). The same study shows that during weekdays, around 20% of the respondents indicate that their cars are parked most of the time at work. During weekends the same amount of cars is parked most of the day at a parking space away from home (which is less during the week, around 16%). Fewer percentages of cars are parked most of the day at intermediate locations (e.g. railway stations) or at a shopping district.
Lessons learned: current car possession and car use • Current car density is high in Italy, Austria, Lithuania, Finland and Germany • Current car density could predict future EV-density. Areas with high EV-density will
experience a larger impact of EV on the grid than areas with a lower EV-density • Average age of a car in Europe is 8,2 years. Youngest cars drive around in the UK. Most
of the oldest cars (>10 years) are on the roads in Germany, Italy and France. • Numbers about the current age and willingness to buy a new car could predict differences
in willingness to buy an EV in the coming years. • Currently most of the cars (56%) are parked most of the day on a private parking place (or
in garage) at home or at work (20%). • Knowledge about current parking behaviour could indicate where car users may want to
recharge EVs.

WP 3 Confidential: (no) 02.05.2011 How will users react to off-peak charging schemes and V2G servvices
3. Survey results on intended behaviour of EV users
3.1. Background and general information about respondents
Number of respondents, awareness and willingness to buy an electric car In total, 1,899 responses were received from the eight countries (Germany, Netherlands, Sweden, France, Italy, Spain and Portugal) that formed the geographical scope of this study. Six out of eight countries have yielded more than 100 responses in total. The largest number of responses were received from Portugal with 489, followed by Spain with 422 and Sweden with 311. In Figure 4 the numbers of response for each country are displayed. The only two countries that did not reach 100 responses were the UK and France. For this reason, the results related to these countries must be read with caution.
Figure 4: Number of respondents per country
Figure 5 shows the awareness of respondents about electric cars. All respondents have heard about electric cars (only 9 out of the 1,899 have not). Most respondents have heard a lot about electric cars (68% of all respondents). Some differences exist between countries (52% of the Italian respondents have heard a lot about electric cars versus 77% of the Swedish and even 78% of the French respondents). The majority of respondents (68%) has also seen (or think they have seen) an electric car in real life. Again some differences between the respondents in the different countries exist. In Sweden the largest percentage of respondents has seen an electric car (80%) compared to 57% of the Portuguese respondents. When looking at the overall dataset we can conclude that the respondents are highly aware of electric vehicles. Around the same number of respondents (70%) have seen an electric car in real life and/or heard a lot about electric cars.
Portugal (PT); 489
Spain (ES); 422
Sweden (SE); 311
Netherlands (NL); 216
Italy (IT); 181
Germany (DE); 148
France (FR); 78 United Kingdom (UK); 54
Number of respondents by country

WP 3 Confidential: (no) 02.05.2011 How will users react to off-peak charging schemes and V2G servvices
Figure 5: Percentage of respondents that have seen and heard about electric cars per country
Respondents were asked to indicate whether they are interested in buying an electric car within the coming two years on a scale of 1 (not at all interested) to 7 (very interested). Least interested are the German respondents (with a score of 3.09 on average). Most interested are the Portuguese respondents (average 4.4 on the scale of 1 to 7). In total, the respondents are just slightly above average interested in buying an electric car in the coming two years (3.76 on the scale of 1 to 7). Respondents were also asked to indicate on a scale of 1-7 whether emission reduction is an important goal in their daily life and behaviour. With an average score of 5.37, respondents seem to be quite active in reducing emissions, although one should be aware that there can be also a large mismatch between intentions and actual behaviour. Dutch (4.95) and French (4.82) respondents agree least with the statement, while Italian respondents agree most (5.95) with the statement that emission reduction is an important goal in their daily life and behaviour. Demographics, gender and age A large majority (66%) of the respondents are younger than 45 years. Most of the respondents are between 31 and 45 years old. Some differences between countries exist which can be seen in Figure 6. Most important deviation between countries is the large percentage of German respondents under 30 and the high percentages of respondents between 31 and 45 years old from the UK and Spain. The survey respondents are predominantly male (76%). No significant differences between countries exist regarding the gender respondents pattern. Highest percentages of female respondents (over 30%) are found in Germany and France. Least amount of female respondents come from Portugal (only 17% of the Portuguese respondents are female).
0%
20%
40%
60%
80%
100%
Heard
Seen
Heard
Seen
Heard
Seen
Heard
Seen
Heard
Seen
Heard
Seen
Heard
Seen
Heard
Seen
Heard
Seen
PT ES SE NL IT DE FR UK Average
Respondents EV awareness levels
I have not heard of electric cars I have heard a bit about electric cars
I have heard a lot about electric cars No, I haven't seen an electric car in real life
Yes, I have seen an electric car in real life

WP 3 Confidential: (no) 02.05.2011 How will users react to off-peak charging schemes and V2G servvices
Figure 6: Percentage of respondents per age category and gender
When looking at the size of the municipalities where respondents live, large differences are noticed between the different countries. On average, about half of the respondents live in municipalities with more than 100,000 inhabitants. A large majority of the Spanish residents live in big cities with more than 500,000 inhabitants. Also more than 40% of the Swedish and British respondents live in big cities. The majority of the German respondents lives in medium size cities (100,000 – 499,999 inhabitants), while the majority of the Dutch, Portuguese, French and Italian lives in smaller cities (10,000 – 99,000 inhabitants). The size of the municipality, and the related household and car density influences the local effects on the grid when large numbers of electric vehicles would be connected to the grid at the same time.
Figure 7: Size of municipality in which respondents live
0%
10%
20%
30%
40%
50%
60%
70%
80%
90%
100%
Age
Gen
der
Age
Gen
der
Age
Gen
der
Age
Gen
der
Age
Gen
der
Age
Gen
der
Age
Gen
der
Age
Gen
der
Age
Gen
der
PT ES SE NL IT DE FR UK Average
Respondents by age and gender
Male
Female
Older than 75
61‐75 years old
46‐60 years old
31‐45 years old
18‐30 years old
0%10%20%30%40%50%60%70%80%90%100%
Respondents by size of municipality
>500,000 inhabitants
100,000‐499,999 inhabitants
10,000‐99,000 inhabitants
<10,000 inhabitants

WP 3 Confidential: (no) 02.05.2011 How will users react to off-peak charging schemes and V2G servvices
Current car and available parking place Most of the respondents (43%) currently own a medium sized car (e.g. VW Golf, Opel Astra). Some differences between the countries exist. In Italy and Spain more respondents own a small car (e.g. Smart, VW Lupo, Fiat Punto) compared to the other countries. A majority of the French (55%) and Portuguese (53%) respondents own a medium sized car. Most large cars (e.g. VW Passat, BMW 5 series) are owned by the Swedish and Dutch respondents. A lot of the German and British respondents do not own a car at all or have a leased car, see Figure 8. Somewhat surprisingly there is almost no correlation (0.089) between the current size of respondents’ car and their agreement with the statement ‘helping to reduce emissions that contribute to global warming is an important goal in my daily life and behaviour’.
Figure 8: Current car possession of respondents by country
The current available parking opportunities for respondents vary a lot over the different countries. While many of the Swedish, British and Dutch respondents have a private outdoor parking or designated parking place, these options are rarely chosen by the southern European respondents where most respondents have a place in a parking lot. On average, the majority (32.5%) has a single car garage at their home or a place in a multiple car garage which could facilitate charging of electric vehicles.
Figure 9: Parking place opportunities of respondents by country
0%10%20%30%40%50%60%70%80%90%
100%
Car possession
No car or leased car
Large car
Medium car
Small car
0%10%20%30%40%50%60%70%80%90%100%
Available parking opportunities
no private parking place
private outdoor parking or designated parking place
a place in a multiple car garage
single car garage
WP 3 Confidential: (no) 02.05.2011 How will users react to off-peak charging schemes and V2G servvices
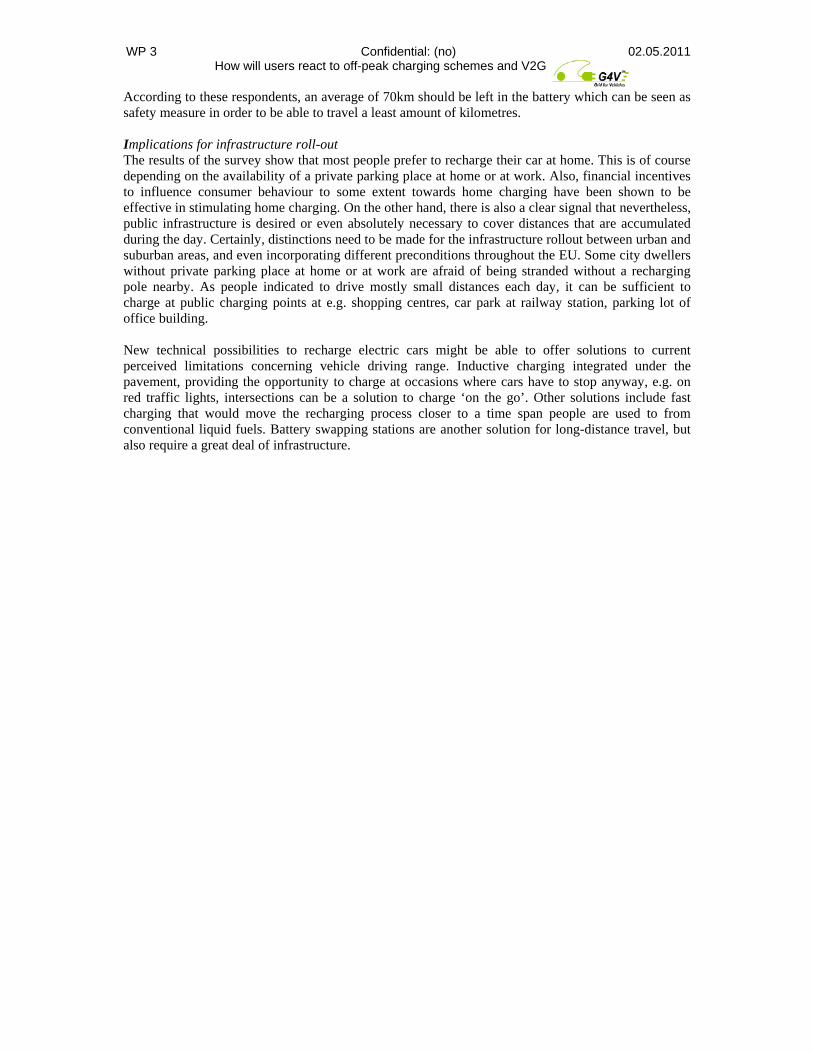
Daily travel distances and minimum requirements for electric cars A large majority of the respondents (61%) drives less than 100 km per day on average (most of them drive between 21 and 100 km per day). On average, a quarter of respondents even drives less than 20km per day. About 10% of respondents travel up to 150 km daily. No large differences between the countries exist regarding the daily kilometres travelled. This means that on average the respondents in all countries would be able to cover their daily travelling requirements with the battery capacity of electric cars as indicated in the survey (120 km) without having to recharge during the day.
Figure 10: Current average daily travel distances by country
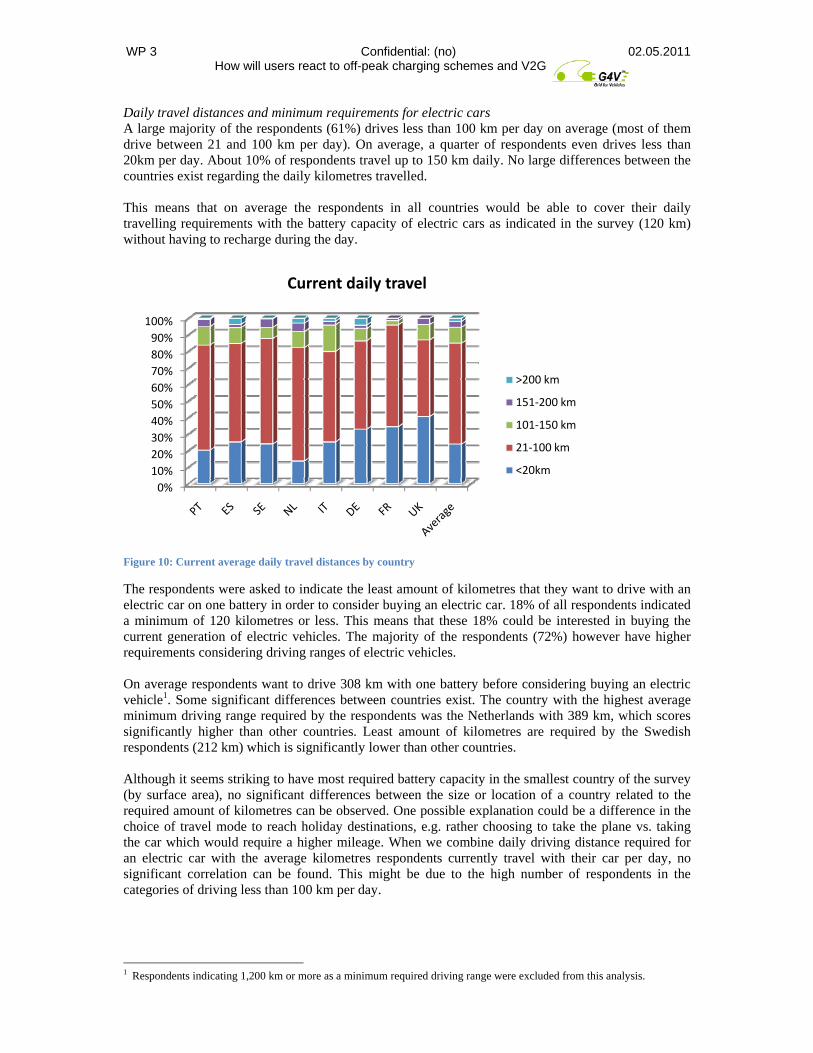
The respondents were asked to indicate the least amount of kilometres that they want to drive with an electric car on one battery in order to consider buying an electric car. 18% of all respondents indicated a minimum of 120 kilometres or less. This means that these 18% could be interested in buying the current generation of electric vehicles. The majority of the respondents (72%) however have higher requirements considering driving ranges of electric vehicles. On average respondents want to drive 308 km with one battery before considering buying an electric vehicle1. Some significant differences between countries exist. The country with the highest average minimum driving range required by the respondents was the Netherlands with 389 km, which scores significantly higher than other countries. Least amount of kilometres are required by the Swedish respondents (212 km) which is significantly lower than other countries. Although it seems striking to have most required battery capacity in the smallest country of the survey (by surface area), no significant differences between the size or location of a country related to the required amount of kilometres can be observed. One possible explanation could be a difference in the choice of travel mode to reach holiday destinations, e.g. rather choosing to take the plane vs. taking the car which would require a higher mileage. When we combine daily driving distance required for an electric car with the average kilometres respondents currently travel with their car per day, no significant correlation can be found. This might be due to the high number of respondents in the categories of driving less than 100 km per day.
1 Respondents indicating 1,200 km or more as a minimum required driving range were excluded from this analysis.
0%10%20%30%40%50%60%70%80%90%
100%
Current daily travel
>200 km
151‐200 km
101‐150 km
21‐100 km
<20km
WP 3 Confidential: (no) 02.05.2011 How will users react to off-peak charging schemes and V2G servvices
Figure 11: Minimal required battery capacity to consider buying an electric car per country (in km)
3.2 Charging location
Preferred charging location The responses regarding which charging location is preferred by the respondents show an unambiguous picture across the EU, see Figure 12. The majority of the respondents in all countries have a private parking place at home or at work where they would charge their car. In France and Germany, most prefer to recharge their car only at their private parking place2. Private recharging in combination with the use of public recharging spots is preferred by the majority of the respondents in Italy, Spain, the Netherlands, Portugal, UK and Sweden. The majority of the respondents who don’t have a private parking place at home or at work to charge their car, is in most countries afraid that they will not find a public charging place3. Exceptions are
2 As the French survey was distributed by partner EDF, the risk cannot be excluded that some survey respondents are in fact
employees of EDF or are in direct relationship to a EDF employee. It should be noted that since household electricity consumption is free for EDF employees, this could have had an impact on the survey results on preferred charging location.
3 By mistake the Dutch survey contained twice the same option on preferred charging location (I don’t have a private parking place and therefore I will charge my car only in public places). The option “I don’t have a private parking place and I’m afraid I will not find public places to charge my car” was not included in the Dutch survey.
329
318
212
389
279
328
336
268
308
0 50 100 150 200 250 300 350 400 450
PT
ES
SE
NL
IT
DE
FR
UK
Average
Minimum required battery capacity in km
Lessons learned: Survey demographics, residence and parking
• From a total of 1,899 respondents, most are from Portugal (489), Spain (422) and Sweden (311).
• On average 70% of respondents have heard about and/or seen an electric car. • Respondents are moderate interested (3.76 on a scale of 7) to buy an EV the coming
two years. Most interested are Portuguese; least interested are German respondents • Majority of respondents (66%) are younger than 45 years and male (76%). • About half of all respondents live in cities with >100,000 inhabitants. • Majority has access to single parking garage at home/work, predominantly Swedish,
British and Dutch respondents have access to private outdoor parking • 61% of respondents drive in between 21-100km per day, 25% drives less than 20km
per day • But almost 2/3 (72%) requires more than 120km driving range of an EV in order
consider buying one, medium 308km (highest NL with 389km)

WP 3 Confidential: (no) 02.05.2011 How will users react to off-peak charging schemes and V2G servvices
Italy and the UK where the majority of people not having a private parking place, indicate that they will charge their car at public charging points.
Figure 12: Preferred charging location of respondents in percentages (answers have been aggregated by categories private/no private parking place)
When combining these outcomes with the demographic situation (the size of the municipality in which respondents live), we see one not very surprising pattern is that in smaller municipalities (less than 100,000 inhabitants) there is a higher percentage of people who want to exclusively charge at home (25% of those in smaller communities compared to 14% in larger municipalities). Respondents living in larger municipalities who don’t have a private parking place at home or at work indicate more often that they are afraid that they will not find a public charging location. Influence of price incentive on charging location To measure the influence of price incentives on recharging, respondents could choose between different charging options but also had to take into account that charging at public spaces will cost €5 per battery charge, while home recharging only costs €3. When comparing the answers of respondents when they take a price incentive into account to the previous answers without incentive we can see for example that 85% of the respondents who prefer to charge at a private parking place also prefer to charge at home with the price incentive. 13% of those wants to keep their car fully charged as often as possible and will also charge in public regardless of the price difference. Interesting is that those respondents who have no private parking place at home or work, 25% still say that they would prefer to charge only at home. This means that respondents interpret and answer the questions hypothetically. Another interesting observation is that those respondents who say that they will only charge at home if there is a price incentive to do so are also more interested in buying an electric vehicle in the coming two years than the respondents that indicate that they can’t charge at home because they have no private parking place.
0
10
20
30
40
50
60
70
80
90private parking
I don
't know
no private parking
private parking
I don
't know
no private parking
private parking
I don
't know
no private parking
private parking
I don
't know
no private parking
PT ES SE NL IT DE FR UK
Prefered charging location
I don't know
I don't have a private parking place and I'm afraid I will not find public places to charge my car
I don't have a private parking place, therefore I will only charge at public places
I have a private parking place, but I will also need to charge my car because of long distances
I have a private parking place, but I will also carge my car in public places
I have a private parking place and I will prefer to only charge my car here

WP 3 Confidential: (no) 02.05.2011 How will users react to off-peak charging schemes and V2G servvices
Figure 13: Location of preferred charging with price incentive
3.2. Delayed charging
Acceptance of delayed charging schemes To measure the preferences of delayed charging schemes, it was indicated to the respondents that in general, electricity is cheaper in off-peak times (22:00-06:00) compared to the morning and evening when electricity consumption peaks. It was furthermore indicated that charging the car overnight would cost €2 instead of €3 during peak times. The prices indicated assumed home recharging for a battery capacity of 120 km. Across the different countries, high average acceptance for a delayed charging scheme is shown with 5.74 on a 7-point scale. Little differences between countries exist, but still highest acceptance can be found in UK and Sweden with and the lowest in Spain with 5.60.
0%10%20%30%40%50%60%70%80%90%
100%
PT ES
SE NL IT DE FR UK
Average
Charging with price incentive
Don't know
No private parking place
Only recharging at home or work with lower price
Use public charging regardless of price difference
Lessons learned: Preferred charging location
• Majority of respondents has a private parking place at home/work • Majority of owners of a private parking place prefers to charge at home • French/German respondents prefer to charge only at home • A combination of private/public recharging is preferred in Italy, Spain, Netherlands,
Portugal, UK and Sweden • Respondents living in smaller cities (<100,000 inhabitants) prefer home recharging • Respondents living in larger cities don’t possess private parking places and are
therefore afraid to find a public charging station • Price incentive for home charging has positive influence • Respondents preferring to charge at home are also more likely to buy an EV within
the next two years

WP 3 Confidential: (no) 02.05.2011 How will users react to off-peak charging schemes and V2G servvices
Figure 14: Interest of respondents in delayed charging on scale from 1 (no interest) to 7 (very interested)
Most interested in the delayed charging are respondents between 31 and 45 years old. They are significantly more interested than older respondents. Concerning the availability of a private parking place, we see that respondents which do not have a private or designated parking place are much less interested in joining a delayed charging scheme. There are no significant differences found between male and female respondents, nor based on the size of the municipality respondents live in nor based on the size of the current car of respondents. The group of respondents that choose between 1-4 on the 7-point scale (18.9% of total respondents) in the question addressing preferences of delayed charging schemes were presented with a follow up question to find out their reasoning. The results are presented in Figure 15. By far, people are most concerned with the fact that the car would not be sufficiently charged for driving in case they need their car unexpectedly and urgently. Other reasons for people not willing to join a delayed charging scheme are almost equally distributed. There are not significant differences in terms of reasoning between different countries.
5.71
5.6
5.94
5.65
5.8
5.67
5.85
6.09
5.74
1
2
3
4
5
6
7
Level of interest for delayed charging
Interest in delayed charging (1‐7)

WP 3 Confidential: (no) 02.05.2011 How will users react to off-peak charging schemes and V2G servvices
Figure 15: Reasons for not participating in the delayed charging scheme
Partial recharging with delay To get a better understanding of respondents’ preferences concerning charging up to a certain range and delaying further charging and associated prices, respondents were asked to choose between three options. The first option foresees charging the battery up to a capacity for 40 km, while the rest of the charging process would be delayed. The car owner would pay €2 for the full battery (120 km capacity). The second option allows to charge the battery up to 80 km with a price of €2.50. Thirdly, the battery would be immediately charged up to the maximum capacity of 120 km. The car owner will pay €3 for the battery charge. Figure 16 shows the differences between the respondents in different countries. Immediate charging up to the maximum capacity is most favourite in the Netherlands and Spain (over 40% of the respondents) and least favourite in Italy where the majority of the respondents prefers to charge 80 km of the battery immediately. Charging 40 km immediately and enjoying the lowest price for a full battery is most favourite in Sweden (43% of the Swedish respondents). On average interest in the three options is about equal.
0%
20%
40%
60%
Want my car fully charged as
quickly as possible
Dislike idea of utilities taking
control
Uncertain about effects on battery
Price difference too low
Not confident car is charged
on time
Concerned to need car
suddenly and not sufficiently charged at this
moment
Other
Percen
t of respo
nden
ts
Reason for not participating

WP 3 Confidential: (no) 02.05.2011 How will users react to off-peak charging schemes and V2G servvices
Figure 16: Recharging up to specified battery capacity in km
When combining the data about the interest in delayed charging and the choice between the above presented 40 km, 80 km and 120 km schemes, we see that 36% of respondents who are most interested (5-7 on the scale of 1-7) in joining delayed charging schemes, prefer the 40 km option. 35% of these respondents prefer the 80 km scheme and the rest (30%) prefers the 120 km scheme. The latter basically means that they do not want to join a delayed charging scheme although they indicated a different preference in the previous question. On the other hand, of the respondents that indicate that they are not interested (1-3 on the scale of 1-7), 10% still prefers to join the 40 km scheme and 21% the 80 km scheme. There is no straightforward explanation for these differences in answers of respondents to measure their interest in delayed charging schemes. A possible explanation could be that the price indication or the in-between question about their reasons for not willing to join the schemes changes their opinion.
3.3. Vehicle-to-grid schemes (V2G)
Participation in V2G scheme and reasons for reluctance to join To measure interest of respondents in joining vehicle to grid schemes, information was provided about the possibility of using car batteries as a backup system in unusually high peaks of electricity consumption (e.g. extreme cold or hot weather). It was explained to the respondents that electricity providers could discharge batteries of electric cars a little to balance out the peak demand and recharge the cars later again. It was also indicated to the respondents that these V2G systems could help make the electricity system more environmentally friendly and cheaper.
0%10%20%30%40%50%60%70%80%90%
100%
Recharging with specified battery capacity
Without delay 120km
Without delay 80km
Without delay 40km
Lessons learned: Delayed charging scheme
• Overall high interest to participate in the scheme across the 8 countries participating in survey (average 5.74 on a 7-point scale)
• Respondents with private parking place are more interested to join the scheme • Concerns about the car being ready to drive in case of urgency is by far the most
mentioned reason not to participate in delayed charging scheme (52%) • Respondents have a tendency (35%) to have their battery immediately fully recharged
even if lower amount of recharged battery capacity would come with a price incentive may be less about money and more about control and safety
• Partial recharging up to 40km and up to 80km is also chosen by 30% of respondents

WP 3 Confidential: (no) 02.05.2011 How will users react to off-peak charging schemes and V2G servvices
Interest in the V2G schemes is highest in the UK and Portugal (4.94 and 4.58 on a scale of 7). Significantly lowest interest is shown in France (3.88) while all other countries score between 4.17 and 4.56 on the scale of 7). There is a moderate correlation between interest in the V2G and delayed charging schemes. Interest in joining V2G schemes decreases with age. Respondents between 18 and 34 years old are significantly more interested compared to the groups of 46-60 years old and older. Related to gender, men are a little more interested than woman. People living in the smallest municipalities (<10,000 inhabitants) are slightly less interested than others. An interesting correlation is found between the interest in V2G schemes and the current car. People who currently do not own a car are most interested in the V2G schemes. Least interested are respondents which currently own a big car. Respondent currently driving more than 200 km per day are also less interested in joining V2G services. A pattern is seen that the more respondents drive per day, the less interested they are in V2G services. Respondents who indicated low interest to participate in a V2G scheme (1-3 on a 7-point scale) were presented with a follow-up question to find out more about their reasons. The majority of respondents points out that the benefits to participate in the scheme are not attractive enough. Users also do not favour the idea that a utility or recharging network operator would take control of the charging process. Similarly, car owners fear that they need their car suddenly and will not have sufficient battery energy available.
Figure 17: Reasons for not participating in V2G schemes and incentive
Impact of price incentives on participating in a V2G scheme Respondents that indicated that benefits are too low (45% of all respondents) were presented with the possibility to receive either €20 or €60 per year from their utility. In most countries (except Sweden and the Netherlands) more than 20% of the respondents were more interested in joining V2G schemes with a 20 euro incentive. In all countries more than 40% of the respondents were more interested in these schemes with a 60 euro price incentive. For the latter, highest interest (more than 60% of the respondents) is shown in Portugal and Spain.
Want my car fully charged as quickly
as possible8%
Dislike idea of utilities taking
control16%
Uncertain about effects on battery
13%
Benefit too low45%
Concerned to need car suddenly
and not sufficiently
charged at this moment13%
Other5%
Reasons for no V2G
WP 3 Confidential: (no) 02.05.2011 How will users react to off-peak charging schemes and V2G servvices
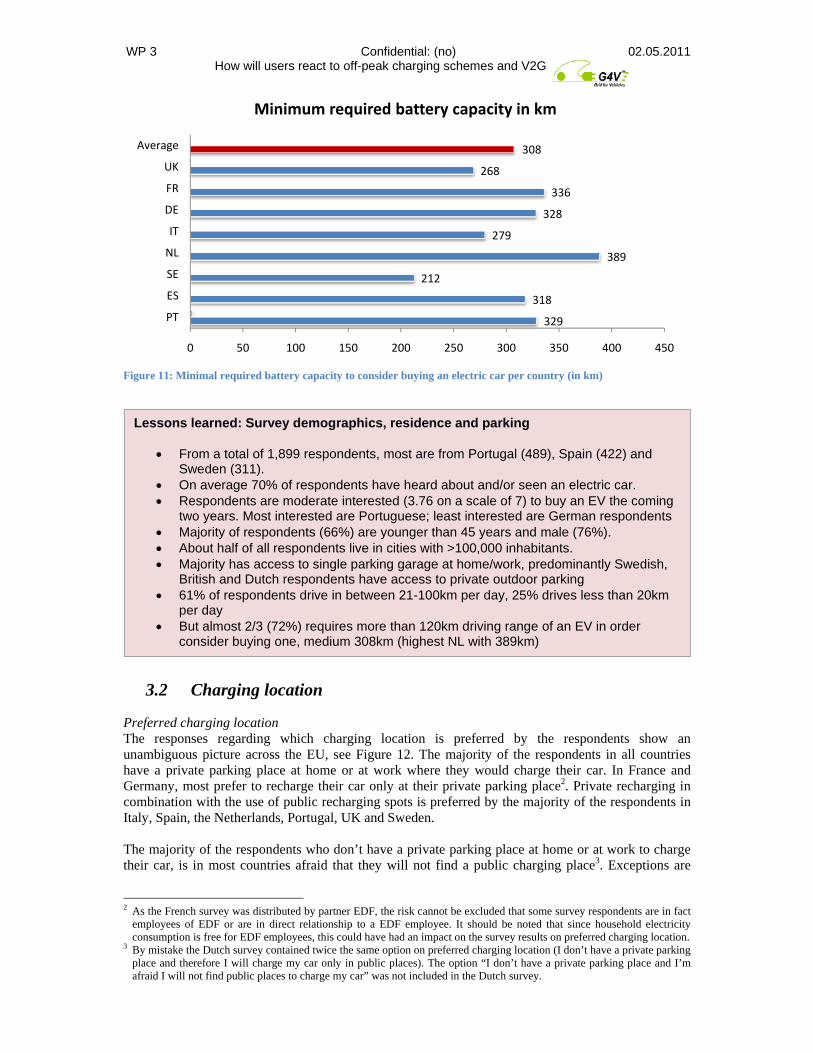
Figure 18: Effects of price incentives in interest to participate in V2G schemes (for those not interested in V2G schemes without price incentive)
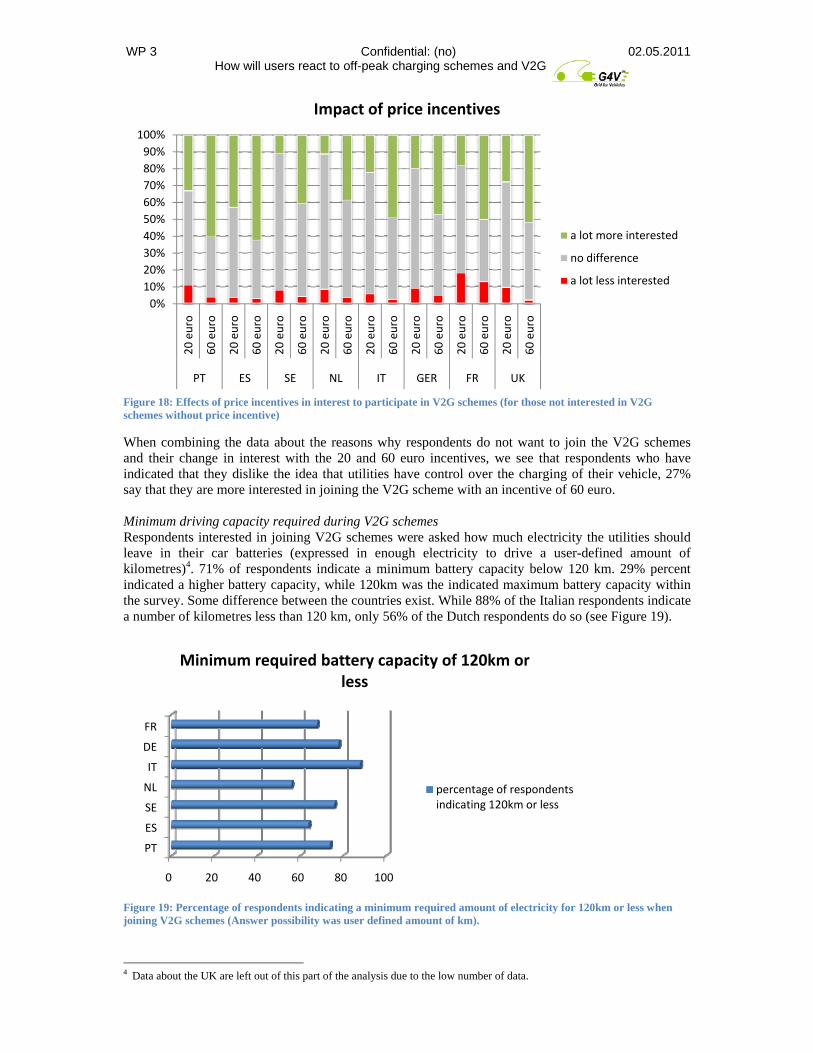
When combining the data about the reasons why respondents do not want to join the V2G schemes and their change in interest with the 20 and 60 euro incentives, we see that respondents who have indicated that they dislike the idea that utilities have control over the charging of their vehicle, 27% say that they are more interested in joining the V2G scheme with an incentive of 60 euro. Minimum driving capacity required during V2G schemes Respondents interested in joining V2G schemes were asked how much electricity the utilities should leave in their car batteries (expressed in enough electricity to drive a user-defined amount of kilometres)4. 71% of respondents indicate a minimum battery capacity below 120 km. 29% percent indicated a higher battery capacity, while 120km was the indicated maximum battery capacity within the survey. Some difference between the countries exist. While 88% of the Italian respondents indicate a number of kilometres less than 120 km, only 56% of the Dutch respondents do so (see Figure 19).
Figure 19: Percentage of respondents indicating a minimum required amount of electricity for 120km or less when joining V2G schemes (Answer possibility was user defined amount of km).
4 Data about the UK are left out of this part of the analysis due to the low number of data.
0%10%20%30%40%50%60%70%80%90%100%
20 euro
60 euro
20 euro
60 euro
20 euro
60 euro
20 euro
60 euro
20 euro
60 euro
20 euro
60 euro
20 euro
60 euro
20 euro
60 euro
PT ES SE NL IT GER FR UK
Impact of price incentives
a lot more interested
no difference
a lot less interested
0 20 40 60 80 100
PT
ES
SE
NL
IT
DE
FR
Minimum required battery capacity of 120km or less
percentage of respondents indicating 120km or less

WP 3 Confidential: (no) 02.05.2011 How will users react to off-peak charging schemes and V2G servvices
Those respondents indicating a number below 120 km, on average indicate 70km battery capacity. There is no significant difference between countries related to this number (all range between 66 and 72km). When looking at the exact numbers, we see that 37% of the respondents are interested in a V2G scheme which leaves enough electricity to less than 80km (which equals 2/3rd of the overall battery capacity). Effects of battery leasing After answering the questions about their interest in the different schemes for delayed charging and vehicle to grid (V2G) presented in the previous paragraphs, respondents were asked to indicate whether they would me more interested in these schemes when the batteries would be leased instead of owned by the car owner. For both type of schemes the majority of respondents indicated that it would not make a difference for them whether the batteries would be owned or leased by them (See Figure 20). A minority (less than 10%) even thinks that the schemes are less interesting for them when the batteries of their electric vehicles would be leased.
Figure 20: Interest of respondents in delayed charging and V2G schemes when batteries are leased instead of owned
Of those respondents that indicated that they are not interested in joining V2G schemes because of the possible negative effect on the battery, 47% is more interested in joining the V2G scheme with a leased battery. This percentage is much higher than among those respondents that rejected the V2G schemes for other reasons in the earlier question(17%).
0%10%20%30%40%50%60%70%80%90%
100%
Delay
V2G
Delay
V2G
Delay
V2G
Delay
V2G
Delay
V2G
Delay
V2G
Delay
V2G
Delay
V2G
UK UK NL NL FR FR SE SE PT PT DE DE ES ES IT IT
Impact of leased battery
More interesting
No difference
Less interesting
Lessons learned: V2G scheme and impact of leased battery
• Only about half of respondents interest to participate (47,7%) • Medium interest of those that indicate to be interested (4,38 on a 7-point scale) • People that currently don’t own a car are most interested to participate, less interest of
people that own a big car (VW Passat, BMW 5 etc.) • Interest for V2G decreases with increasing daily travel distances (<200km) • Too low benefits is main reason not to join the scheme, but also the fear to have the
car not ready to use in case of urgency • Majority is significantly more interested to join a V2G scheme with €60 annual
incentive, less so for €20 incentive • Respondents interested in V2G want to retain 120km or less in their battery (71%),
70km are sufficient on average • Leased battery has no major impact to stimulate participation in either delayed
charging nor V2G scheme • Respondents that indicated to be afraid of impacts on the battery when joining V2G
are more interested to participate with a leased battery

WP 3 Confidential: (no) 02.05.2011 How will users react to off-peak charging schemes and V2G servvices
4. Important observations and conclusions In this last chapter, we present observations based on the lessons learned in chapter 2 about current car use and possession and chapter 3 on the preferences and interests of potential EV-users. From these observations we also draw some conclusions about the implications for several aspects of EV introduction, including infrastructure roll-out, first user groups, delayed charging and V2G schemes and geographic differences. However, the reader should keep in mind that the survey results are only based on a relatively small sample per country which needs verification on a larger scale. Observations about first users groups and preferred charging location The survey respondents indicated that they (currently) have moderate interest in buying an electric vehicle. Certainly, this can be at least partially attributed to the large uncertainties surrounding the technology, triggered by initial high sales price for vehicles and an infrastructure in the build-up phase. In 2011, the market is set to receive a number of new EVs such as the Nissan Leaf, Mitsubishi i-MIEV and Renault’s Z.E. vehicle range. It is expected that once EVs become more visible on the streets and people can actually observe deployment and the viability of the charging process, more trust for the technology will develop. Citizens will become more familiar with the technology through e.g. something known as the ‘neighbourhood effect’, meaning that the EV purchasing intent of people could be stimulated through a vehicle appearing on a nearby street in proximity to their home. Differences in interest in buying an EV between countries exist. A possible indicator is the current age of the car stock. As currently youngest cars drive on the roads in the UK, this might be an indication that also EV will be bought sooner here than in countries with relatively older cars on the roads. This assumption is strengthened by the relatively high interest of the survey respondents in the UK to buy an EV in the coming two years. Although in reality the majority of citizens drives less than 100km per day, most request a much larger range to be able to cover the occasional trip beyond the daily mileage. This might also be caused by an uncertainty about the achievable EVs range in practice. Most cars arriving at the market during the last years were retrofitted models of conventional cars and did not live up to their expectations. In a recent fleet test of EVs by a large German car rental company, the cars sometimes only managed to drive 70km instead of the predicted 140km battery capacity (Sueddeutsche, 2011). Another possible reason for requiring a larger mileage could be the problem that people have in judging whether the capacity of an EV will fit their real driving plus an additional ‘safety window’, combined with the uncertainty of finding a charging spot in time. The perceptions of consumers about the available and necessary driving range could be influenced by provision of information of near-by charging stations via e.g. smart phones. EV producers must be aware that in order to make the majority of people interested in buying an EV, they need to be able to cover also longer distances. If this will not be possible, the EV will not be seen as adequate replacement of the conventional car, but merely as a 2nd car in the household for short distances. Higher mileages can be achieved through smart recharging solutions such as inductive charging, fast-charging or battery swapping facilities, although these technologies or services will not be available in the early market phase. Most respondents have a private parking place at home or at work where they prefer to charge, although also public charging would be required. These people are mostly living in smaller municipalities. Not surprisingly, people living in bigger cities often do not have a private parking access and therefore are more afraid they will not be able to recharge. To overcome this fear, more public charging locations must be built in urban areas. Apart from an urban/rural differentiation in the charging roll-out also a country differentiation could be necessary because some differences between countries exist about the preferred use of public charging places. The most important geographic distinction that can be made is between Northern EU (more single private place at home/work) and Southern EU (more private parking place in multiple parking garage). The existing data about the current overall parking behaviour is in line with the answers of the respondents of this survey. Preference for home charging is a dominant feeling, as people who do not have a private parking place at this moment, still indicate that they prefer to charge their car there. This could be an indicator for utilities to focus throughout Europe on home charging and on those user groups possessing a private

WP 3 Confidential: (no) 02.05.2011 How will users react to off-peak charging schemes and V2G servvices
parking place. For the construction of public charging locations, factors such as urban vs. suburban and parking possibilities play a role. Observations about delayed charging and V2G schemes Interest in joining off-peak charging schemes (meaning the car is charged only during night times) is relatively high. This indicates that people do not expect to use their car once they arrived back home. Still, one fifth of people is afraid that the car will not be sufficiently charged when needed. Of the countries investigated in the survey, Germany and Italy currently have the highest car density which might be an indicator for also a high EV-density in the future, including the associated effects on the grid. Interest of the respondents from these countries to buy an EV in the coming two years, is low (Germany) and average (Italy). In Germany also the interest in joining a delayed charging scheme is relatively low (5.67 on scale of 7) while this is above average in Italy (5.8). Interest in joining the V2G scheme is however higher in Germany than in Italy. Compared to Italy, the roll out of EV might be more difficult in Germany due to the smaller interest in buying an EV. Additionally, the impact of EV on the grid might be larger in Germany due to the smaller interest in joining delayed charging schemes.

WP 3 Confidential: (no) 02.05.2011 How will users react to off-peak charging schemes and V2G servvices
Resources ACEA (2010a), European Motor Vehicle Parc 2008. http://www.acea.be/images/uploads/files/20100427_EU_Motor_Vehicles_in_Use_2008.pdf ACEA (2010b), Average car age. http://www.acea.be/images/uploads/files/20100520_average_car_age.pdf Bending, S. et al (2010), Specifications for EV-grid interfacing, communication and smart metering technologies, including traffic patterns and human behaviours. D1.1 of the MERGE (Mobile Energy Resources in Grids of Electricity) project. http://www.ev-merge.eu/images/stories/uploads/MERGE_WP1_D1.1.pdf Eurostat (2011), Motorisation rate. http://epp.eurostat.ec.europa.eu/tgm/table.do?tab=table&init=1&plugin=1&language=en&pcode=tsdpc340 Magali, P., et al (2009), Driving an electric vehicle. A sociological analysis of pioneer users. ECEEE Summer study, Panel 6: Energy efficiency in transport and mobility, http://www.eceee.org/conference_proceedings/eceee/2009/Panel_6/6.340/ Oellette, Judith A. and Wendy Wood (1998), "Habit and Intention in Everyday Life: The Multiple Processes by Which Past Behavior Predicts Future Behavior," Psychological Bulletin, 124 (1), 54-74. Roland Berger Strategy Consultants (2011), Automotive landscape 2025. http://www.consultancy.nl/rapporten/roland-berger/automotive-landscape-2025 Sueddeutsche (2011), http://www.sueddeutsche.de/wirtschaft/erich-sixt-elektro-autos-eine-absolute-katastrophe-1.1073489

WP 3 Confidential: (no) 02.05.2011 How will users react to off-peak charging schemes and V2G servvices
Appendix – Full Questionnaire
Electric cars
Electric cars
Page 1 - Heading
Hello, Welcome to this questionnaire about electric cars. This anonymous questionnaire will give you the opportunity to indicate your preferences related to electric cars. It is open for everybody living in the European Union (above the age of 18) no matter how much you know about electric cars. Answering the questions will only take 10-15 minutes of your time and will be anonymous. It will take you just some clicks. Your answers will be of great value to us and therefore we thank you in advance for your time and effort! The questionnaire team *This questionnaire is part of the European project Grid 4 Vehicles about the charging of electric cars, funded by the European Commission. More information is available at www.g4v.eu. The outcomes of this questionnaire will also be published on this website in spring 2011.
Page 2 - Question 1 - Choice - One Answer (Bullets)
Have you heard of electric cars (cars that are fully powered by an electric engine and use no fuel)?
I have not heard about it I have heard a bit about it I have heard a lot about it
Page 2 - Question 2 - Choice - One Answer (Bullets)
Have you ever seen an electric passenger car in real life?
No I have not / Not that I know of Yes I have / I think I have
Page 2 - Question 3 - Rating Scale - One Answer (Horizontal)
Would you be interested in buying an electric car within the next 2 years? Not at all interested 2 3 4 5 6 Very interested

WP 3 Confidential: (no) 02.05.2011 How will users react to off-peak charging schemes and V2G servvices
Page 3 - Heading
Electric cars Electric cars are identical to our current normal cars, except the fact that they are completely powered by electricity from a battery in the car instead of a fuel as gasoline or diesel. An electric car looks the same as a traditional car, a main difference is however that it is silent. Electric cars emit less greenhouse gases and pollutants which could improve local air quality. Charging an electric car Just like normal cars have to be refueled, electric cars can drive a certain amount of kilometers before they need to be charged again. Currently, it takes on average 4 hours to fully charge the battery.
Page 3 - Question 4 - Name and Address (General)
A fully charged electric car can drive a maximum amount of miles before it has to be charged again. What is the least amount of miles that it has to be able to drive on one battery for you to consider buying an electric car?
……Miles
Page 4 - Heading
Battery capacity The current average car battery has a capacity to drive 75 miles before it has to be charged again. You can charge your car via a plug-socket (similar to any other socket) at home, at work or public spaces such as car parks at supermarkets, shopping malls, train stations, or parking places on the street. The car performs just as well on a low battery charge as on a full one.
Page 4 - Question 5 - Choice - One Answer (Bullets)
Imagine you have an electric car. Please indicate below what your preferred charging location would be
I have a private parking place (at home or at work) and I will prefer to only charge my car there.
I have a private parking place (at home or at work), but I will also need to charge my car in public places because I want to keep my car continuously as fully charged as possible
I have a private parking place (at home or work), but I will also need to charge my car in public places because I will drive long distances
I don’t have a private parking place (at home or work) and therefore I will charge my car only in public places
I don’t have a private parking place (at home or work) and I'm afraid I will not find public places to charge my car
I don’t know
Page 5 - Question 6 - Choice - One Answer (Bullets)
To fully charge your car battery at a private parking place (at home or work) would cost around £2.50 (for a driving range of about 75 miles), while charging your car in public costs around £4.25. Please indicate below what your preferred charging location would be
I will prefer to keep my car as fully charged as possible and therefore also use public charging places regardless the price difference
I will prefer to only charge my car at home or at work at a lower price, even if it means driving on a lower battery charge during the day until I get home
I don’t have a private parking place (at home or work) and therefore could not charge my car at home
I don’t know

WP 3 Confidential: (no) 02.05.2011 How will users react to off-peak charging schemes and V2G servvices
Page 6 - Heading
Electricity price People use different amounts of electricity during the day. At some moments, for example between 18h and 20h, a lot of people use electricity. While at other times, for example at night, not a lot of electricity is used. A system with a more constant electricity demand is cheaper to service and could eventually have environmental benefits. Charging your electric car during the night (between 22h and 6h) will thus be cheaper. For a battery capacity of about 75 miles you would pay £2.50 if you charge during the day and £1.70 if you charge during the night.
Page 6 - Question 7 - Rating Scale - One Answer (Horizontal)
Please indicate whether you would be interested in participating in the following scheme A scheme in which the electricity provider delays charging a part of the battery to night-time when the electricity is cheaper and the battery is fully charged by the morning. If you want your car charged immediately anyway, you pay the normal electricity price. not at all interested 2 3 4 5 6 very interested
Page 7 - Question 8 - Choice - One Answer (Bullets)
Please select the main reason why you would not be interested
I want to have my car fully charged as quickly as possible I dislike the idea of electrical companies being in control of my car charging I’m unsure what effect this will have on my battery For me the price difference is not big enough I’m not confident the car will be charged on time I’m concerned I will suddenly need my car and it will not be charged enough to drive as far as I
need Other, please specify
Page 8 - Question 9 - Choice - One Answer (Bullets)
It is possible to charge just a part of your battery to reach a specified travel capacity, with the remaining charge delayed until the lower cost charging period. The more capacity you allow for delayed charging the cheaper you get the electricity. Please choose the option that you would find the most interesting.
The battery will be charged without delay up to a capacity of 25 miles while the rest of the charging is delayed and I will pay a total of £ 1.70 for a full tank (around 75 miles)
The battery will be charged without delay up to a capacity of 50 miles while the rest of the charging is delayed and I will pay a total of £2.10 for a full tank (around 75 miles)
The battery will be charged up to a full capacity of 75 miles without delay and I will pay a total of £2.50

WP 3 Confidential: (no) 02.05.2011 How will users react to off-peak charging schemes and V2G servvices
Page 9 - Heading
Electricity demand peaks Sometimes there are unusually high peaks of electricity consumption, this can occur due to two reasons. First, for instance when it is extremely cold and a lot of people turn up their heating or when it is extremely warm and a lot of people turn on their air-conditioning. Second, renewable resources such as wind turbines and solar panels produce different amounts of electricity at different times. The batteries in electric cars could be used as a backup for such peak moments. This would mean you would allow the electricity provider to discharge your car a little bit (when it is plugged in) so they can use a part of the electricity from your car during the peak and recharge your car later again. This would lead to a cheaper and eventually more environmentally friendly electricity system. Moreover, it would make large scale use of renewable energy such as wind and solar power easier.
Page 9 - Question 10 - Rating Scale - One Answer (Horizontal)
Please indicate whether you would be interested in participating in the following scheme: A scheme in which I allow the electricity provider to use a part of the electricity stored in my car battery as a buffer during extreme peaks in electricity use, under the condition that the battery remains full enough to drive a minimum amount of miles specified by me Not at all interested 2 3 4 5 6 Very interested
Page 10 - Question 11 - Choice - One Answer (Bullets)
Please select the main reason why you would not be interested
I want to have my car fully charged as quickly as possible I dislike the idea of electrical companies being in control of my car charging I’m unsure what effect this will have on my battery The benefits for me are not high enough I’m concerned I will suddenly need my car and it will not be charged enough to drive as far as I
need Other, please specify
Page 11 - Question 12 - Choice - One Answer (Bullets)
If the electricity provider gives me £17 per year in return, I would be:
A lot less interested No difference A lot more interested
Page 12 - Question 13 - Choice - One Answer (Bullets)
If the electricity provider gives me £50 per year in return, I would be:
A lot less interested No difference A lot more interested
Page 12 - Question 14 - Name and Address (General)
How much electricity do you want the electricity provider to leave in your car? Enough so I can drive at least...
…..miles

WP 3 Confidential: (no) 02.05.2011 How will users react to off-peak charging schemes and V2G servvices
Page 13 - Heading
Battery leasing Because car batteries are quite expensive you could buy an electric car and lease the battery. This means you wouldn't own the battery, but pay a certain fee to use it. You could than also replace it when the quality of the battery decreases. Thinking back to your previous answers, please answer the following
Page 13 - Question 15 - Choice - One Answer (Bullets)
Having a leased battery makes participating in the scheme where the electricity provider is allowed to delay a part of my charging to the night:
A lot less interesting No difference A lot more interesting
Page 13 - Question 16 - Choice - One Answer (Bullets)
Having a leased battery makes participating in the scheme where I allow the electricity provider to use a part of my car battery as an electricity buffer during extreme peaks in electricity use:
A lot less interesting No difference A lot more interesting
Page 14 - Heading
Finally we would like to ask you a few questions about yourself
Page 14 - Question 17 - Choice - One Answer (Bullets)
Your age:
18 - 30 31 - 45 46 - 60 61 - 75 76 - higher
Page 14 - Question 18 - Choice - One Answer (Bullets)
Your gender:
Female Male
Page 14 - Question 19 - Choice - One Answer (Bullets)
Please select how large your municipality is:
< 10.000 inhabitants 10.000 - 99.999 inhabitants 100.000 - 499.999 inhabitants > 500.000 inhabitants

WP 3 Confidential: (no) 02.05.2011 How will users react to off-peak charging schemes and V2G servvices
Page 14 - Question 20 - Choice - One Answer (Bullets)
What parking option do you have available at home for you?
Single car garage A place in a multiple car garage Outdoor private or designated parking place No private parking place
Page 14 - Question 21 - Choice - One Answer (Bullets)
Which vehicle size do you currently own/lease?
Small car (e.g. Smart, Lupo, etc) Medium size car (VW Golf, etc) Large car (VW Passat, van, etc ) I don't own/lease a car
Page 14 - Question 22 - Choice - One Answer (Bullets)
How much do you drive / travel during one day on average (whether by car or another type of transport) ?
less than 20 km 21 - 100 km 101 - 150 km 151 - 200 km more than 200 km
Page 14 - Question 23 - Rating Scale - One Answer (Horizontal)
Please indicate to what extent you agree with the following statement: Helping to reduce emissions that contribute to global warming is an important goal in my daily life and behaviour Strongly disagree 2 3 4 5 6 Strongly agree
Page 15 - Heading
Thank you very much for participating in our survey!