Embed Size (px)
Citation preview
APPENDIX A
WORK‐LIFE SURVEY REPORT
Findings of the Work‐Life Survey: Appendix A 1

Table of Contents Executive Summary of the Survey Study .......................................................................................... 3 The Work-Life Survey Report ........................................................................................................... 5 Introduction ........................................................................................................................................ 5 Methodology ...................................................................................................................................... 5 Description of the Sample .................................................................................................................. 6 Work-Family Conflict ........................................................................................................................ 12 Benefits and Servicers to Help Employees Find Balance .................................................................. 15 Other Comments Provided by Respondents ...................................................................................... 26 References .......................................................................................................................................... 30
Findings of the Work‐Life Survey: Appendix A 2

Executive Summary of the Survey Study
Overview
This survey was administered to Missouri State University employees to determine the degree of conflict they perceive between their work and personal lives and to identify the types of benefits and services that will help them balance their work and personal lives.
Key Findings from the Survey
Employees’ Perceptions of Work LIfe‐Personal Life Interference
Employees report an average degree of work interfering with their personal life, but this perception differed greatly by job category, care-giving responsibilities, and gender.
• Faculty, Executive/Administrators/Managers, and Support Professionals report higher levels of work interfering with their personal lives compared to employees in other job categories.
• Employees with children and employees with adult-care responsibilities perceive higher levels of work interfering with their personal lives compared to those without care-giving responsibilities.
• Men report slightly higher levels of work interfering with their personal life than do women.
Overall, employees do not perceive that their personal life interferes with work life. This perception differed slightly based on care-giving responsibilities and gender.
• Employees with children at home reported higher levels of their personal life interfering with their work compared to employees without children at home.
• Men reported higher levels of their personal life interfering with their work compared to women.
Helpful Work‐Life Benefits and Services
We presented three categories of benefits and services that may help employees balance their work and personal lives. The categories were (1) work and scheduling, (2) home and family, and (3) financial and legal. We asked employees to rate how important each benefit and service was for the University community. If they rated the benefit or service as important, we asked them if they would use the benefit and service.
Three highest rated benefit or service as important to the University community
Findings of the Work‐Life Survey: Appendix A 3

Findings of the Work‐Life Survey: Appendix A 4
• Work and scheduling o Staff reported (1) variable starting and ending hours, (2) option to donate paid
sick or vacation days to others, and (3) short-term disability coverage. o Faculty reported (1) sabbatical leave, (2) short-term disability coverage, and (3)
tenure-clock extension. • Home and family
o Bother staff and faculty reported (1) drop-in childcare on campus, (2) paid parental leave, and (3) Leave in excess of the Family and Medical Leave Act.
• Financial and legal (Only two options were given to respondents. The highest rated option is shown.)
o Both staff and faculty reported expanded options for credit course fee waiver.
Top three benefits or services rated as most likely used by staff and faculty
• Work and scheduling o Staff reported (1) variable starting and ending hours, (2) option to donate paid
sick or vacation days to others, and (3) compressed work week. o Faculty reported (1) sabbatical leave, (2) phase-in to retirement, and (3) a three-
way tie among short-term disability coverage, variable starting/ending hours and paid educational/professional development leave.
• Home and family o Staff reported (1) after hours or weekends on-campus medical clinic for
employees and families, (2) leave in excess of the Family and Medical Leave Act, and (3) eldercare/adultcare information resource and referral.
o Faculty reported (1) after hours or weekends on-campus medical clinic for employees and families, (2) leave in excess of the Family and Medical Leave Act, and (3) paid parental leave.
• Financial and legal (Only two options were given to respondents. The highest rated option is shown.)
o Staff and faculty reported expanded options for credit course fee waiver.
Some of the survey findings were puzzling because it was unclear why employees thought some benefits or services would help them balance their work and personal life. For example, how would expanded options for credit course fee waiver help someone find balance between their work and family life? In addition, written comments provided by survey respondents revealed complex issues that were not addressed in the survey items, such as a campus culture that is not amenable to work-life balance and work overload that contributes to the stress employees feel at work and at home. In order to better understand the issues employees face in trying to balance their work and personal lives, we asked Dr. Charlene Berquist to conduct focus group interviews with employees across campus.

Work‐Life Survey Report
Introduction
This study was conducted to examine employees’ perception of the degree to which they experience conflict between their work and non-work lives and to determine what types of benefits, programs, or services the University could offer that may help employees reduce the conflict they feel between their work and non-work lives.
Methodology
A web-based survey was designed to gather information concerning Missouri State University’s employees’ level of conflict they perceive between their work and non-work lives and the types of benefits and services that will help them balance their work and non-work lives. The survey was pre-tested using cognitive interviews with five Missouri State University employees in different job categories (Secretarial, Service, Faculty, Administrative, and Support Professional). The survey items are shown in Appendix A.
Conflict between work and non‐work. We assessed employees’ perception of the degree of interference of between their work and non-work lives with a 10 item scale developed by Netemeyer, Boles, and McMurrian (1996). This scale measures two dimensions of work-non-work conflict. The first dimension is work interferes with family life and the second dimension is non-work interfering with work life. The items were responded to using a 5-point response scale of 1 (strongly disagree) to 5 (strongly agree).
Benefits and Services. Thirty five benefits and services were presented to survey respondents. We constructed items using information from work-life surveys conducted at other universities (University of Texas, 2001; University of California, Santa Barbara, 2003; University of New Mexico, 2004) and information about different types of work life benefits and services found at Sloan Work and Family Research Network at Boston College (http://wfnetwork.bc.edu/). We classified the benefits and services into one of three categories: (1) work and scheduling, (2) home and family, and (3) financial and legal. We asked respondents to tell us how important each benefit or service would be for the university. Ratings were made on a 5-point scale of 1(Not at all important) to 5 (Very important). If the respondent marked Quite important (4) or Very important (5), we asked respondents to tell us if they would use the benefit or service (yes or no).
Demographic information. Items were included on the survey to measure employees’ work characteristics, such as hours worked per week and length of time with Missouri State University, and family characteristics, such as number of children in the home and adult care-giving responsibilities. These items are shown in Appendix A.
Findings of the Work‐Life Survey: Appendix A 5

Participants and Procedures
On July 9, 2007, President Nietzel sent an email announcing the survey to all full-time and part-time faculty and staff of Springfield and Mountain Grove campuses. A reminder to respond to the survey by July 27, 2007 was announced in the July 20, 2007 edition of E-ssential News.
At the time of the survey, there were 1,856 full-time employees and 750 part-time employees. Of the 692 usable responses, 93.9% (n = 650) were full-time employees, 5.2% (n = 36) were part-time employees, and 0.9% (n = 6) did not respond to the questionnaire item about full-time or part-time employment. Because of the low number of responses from service employee (n = 8; 11.4% of the total number of service employees), we sent a paper-and-pencil survey to employees in the job category of “service” on September 13, 2007. We asked employees to return them through campus mail to the researchers by September 25, 2007. We received responses from 31 additional employees.
Description of the Sample
Our final sample included 723 usable responses; 94.2% (n = 680) were full-time employees, 5.0% (n = 36) were part-time employees, and 0.8% (n = 6) chose not to respond.
To determine if employees who chose to respond to the survey differed from campus demographics, we compared basic demographics of survey respondents to demographics of the campus population. Table 1 compares the number of full-time and part-time employees at Missouri State University (Springfield and Mtn. Grove) to the number of full-time and part-time respondents.
Table 1 Basic Characteristics of the Population Compared to Respondents of the Work-Life Survey
Characteristic
Campus Demographics Springfield and Mtn.
Grove
Survey Respondents Springfield and Mtn.
Grove
Response rate for each
category Full-time or part-time status N % N % % Full-time 1856 71.2% 681 94.2% 36.7% Part-time 750 28.8% 36 5.0% 4.8% No response 6 0.8%
Of the 36 part-time employees, 58.3% (n = 21) were faculty and the remaining 41.7% (n = 15) respondents were from among four other job categories. Many part-time employees at Missouri State University work irregularly. For example, they are employed for a specific function, such as security personnel at sporting events. Because of the small number of part-time employees responding to the questionnaire (n = 36), no further analyses examined part-time employees as a separate group and we included their responses with the responses from full-time employees.
Findings of the Work‐Life Survey: Appendix A 6
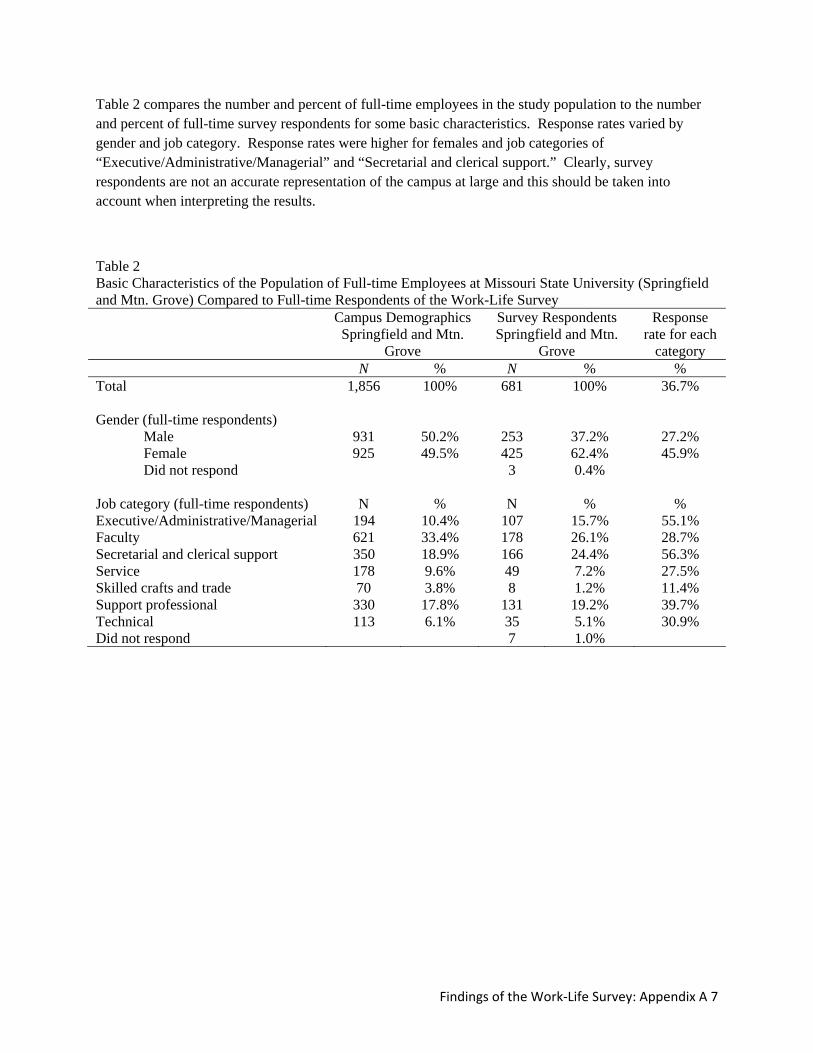
Table 2 compares the number and percent of full-time employees in the study population to the number and percent of full-time survey respondents for some basic characteristics. Response rates varied by gender and job category. Response rates were higher for females and job categories of “Executive/Administrative/Managerial” and “Secretarial and clerical support.” Clearly, survey respondents are not an accurate representation of the campus at large and this should be taken into account when interpreting the results.
Table 2 Basic Characteristics of the Population of Full-time Employees at Missouri State University (Springfield and Mtn. Grove) Compared to Full-time Respondents of the Work-Life Survey Campus Demographics
Springfield and Mtn. Grove
Survey Respondents Springfield and Mtn.
Grove
Response rate for each
category N % N % % Total 1,856 100% 681 100% 36.7% Gender (full-time respondents) Male 931 50.2% 253 37.2% 27.2% Female 925 49.5% 425 62.4% 45.9% Did not respond 3 0.4% Job category (full-time respondents) N % N % % Executive/Administrative/Managerial 194 10.4% 107 15.7% 55.1% Faculty 621 33.4% 178 26.1% 28.7% Secretarial and clerical support 350 18.9% 166 24.4% 56.3% Service 178 9.6% 49 7.2% 27.5% Skilled crafts and trade 70 3.8% 8 1.2% 11.4% Support professional 330 17.8% 131 19.2% 39.7% Technical 113 6.1% 35 5.1% 30.9% Did not respond 7 1.0%
Findings of the Work‐Life Survey: Appendix A 7

Other Demographic Information
We collected other demographic information to determine if there are groups on campus who may experience different work and non-work balance issues. The demographic information is presented in this section.
1.2%
6.8%
18.1%
27.4%
34.6%
11.6%
0.3%0%
10%
20%
30%
40%
18 to 24 years
25 to 29 years
30 to 39 years
40 to 49 years
50 to 59 years
60 years or older
Did not respond
Age of Respondents The majority of respondents (34.6%) are from 50 to 59 years old. There is a slightly greater proportion of women than men in the 50 to 59 age group (36.2% and 32.2%) and a slightly greater proportion of men than women in the 60 or older age group (14.2% and 10.2%).
The majority of respondents (72.9%) are married or with a relationship partner. There are differences in relationship status by gender, with a greater percentage of men (83.5%) reporting being married or with a relationship partner compared to women (66.7%).
Married or with partner,
72.9%
Divorced, separated, or widowed, 11.6%
Single, 14.7%
Did not respond, 0.8%
Relationship Status
7.2%
32.5%
22.5%
14.7%
8.4%
14.2%
0.4%0%
10%
20%
30%
40%
Less than 1 year
1 to 5 years
6 to 10 years
11 to 15 years
16 to 20 years
More than 20 years
Did not respond
Length of Employment at Missouri State University
About 32% of respondents have worked at Missouri State University for 1 to 5 years and 22% have worked for 6 to 10 years.
Findings of the Work‐Life Survey: Appendix A 8

Six out of ten respondents report they travel 10 miles or less from home to work and 25% said they travel 11 to 20 miles.
About 30% of respondents report that their yearly salary was between $25,000 to $35,000.
Responsibility for Children
The majority of respondents do not have primary responsibility for children and given the modal age of respondents is 50 to 59 years, this is expected.
Yes, 33.1%
No, 66.5%
Did not respond0.4%
Parenthood Status
62.8%
25.4%
6.5%3.0% 1.8% 0.4%
0%
10%
20%
30%
40%
50%
60%
70%
0 to 10 miles
11 to 20 miles
21 to 30 miles
31 to 40 miles
More than 40 miles
Did not respond
Number of Miles Traveled Each Way From Home to Work
Yearly Salary
16.3%
29.5%
18.1%14.8%
7.7%3.5%
5.7%2.5% 1.9%
0%
5%10%15%20%25%
30%35%
Findings of the Work‐Life Survey: Appendix A 9

46.4%
40.2%
8.8%4.6%
0%
10%
20%
30%
40%
50%
One child Two children Three children Four or more children
Number of Children
Of those respondents with primary responsibility for children, the majority of respondents indicate they have responsibility for one or two children (average of 1.72 children).
14.2%18.4%
43.5%
34.7%
23.8%
0%
10%
20%
30%
40%
50%
Under 2 years old
2 to 5 years old
6 to 12 years old
13 to 18 years old
Over 18 years old
Percent of Respondents with Children in Each Age Group
More respondents indicate that their children are between six years and 12 years old. The next most frequently report age category was 13 years to 18 years old.
Findings of the Work‐Life Survey: Appendix A 10
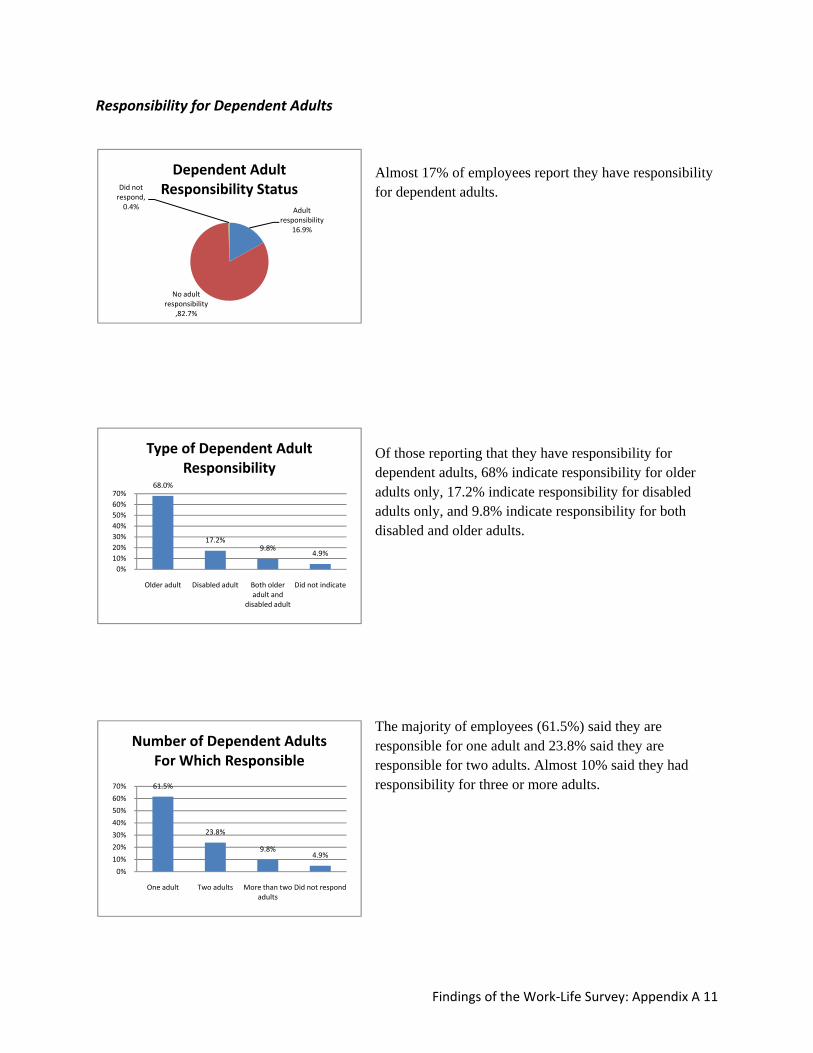
Responsibility for Dependent Adults
Adult responsibility
16.9%
No adult responsibility
,82.7%
Did not respond, 0.4%
Dependent Adult Responsibility Status
Almost 17% of employees report they have responsibility for dependent adults.
68.0%
17.2%9.8%
4.9%
0%10%20%30%40%50%60%70%
Older adult Disabled adult Both older adult and
disabled adult
Did not indicate
Type of Dependent Adult Responsibility
Of those reporting that they have responsibility for dependent adults, 68% indicate responsibility for older adults only, 17.2% indicate responsibility for disabled adults only, and 9.8% indicate responsibility for both disabled and older adults.
The majority of employees (61.5%) said they are responsible for one adult and 23.8% said they are responsible for two adults. Almost 10% said they had responsibility for three or more adults. 61.5%
23.8%
9.8%4.9%
0%
10%
20%
30%
40%
50%
60%
70%
One adult Two adults More than two adults
Did not respond
Number of Dependent Adults For Which Responsible
Findings of the Work‐Life Survey: Appendix A 11
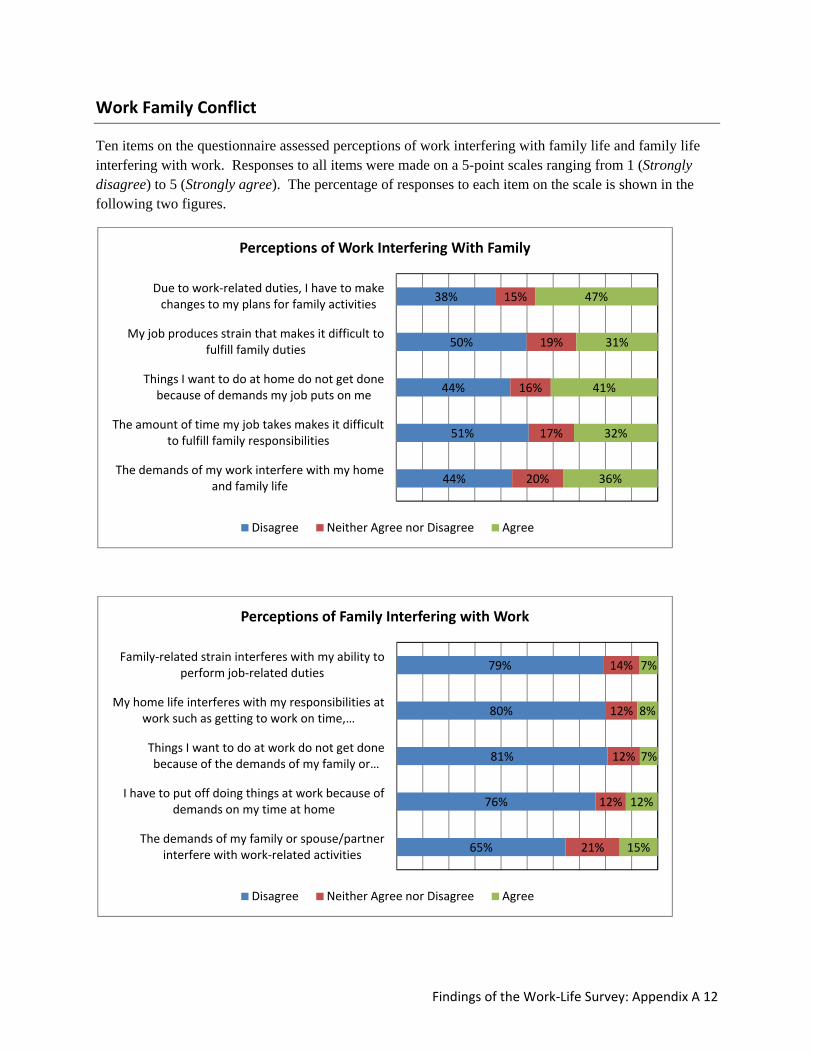
Work Family Conflict
Ten items on the questionnaire assessed perceptions of work interfering with family life and family life interfering with work. Responses to all items were made on a 5-point scales ranging from 1 (Strongly disagree) to 5 (Strongly agree). The percentage of responses to each item on the scale is shown in the following two figures.
44%
51%
44%
50%
38%
20%
17%
16%
19%
15%
36%
32%
41%
31%
47%
The demands of my work interfere with my home and family life
The amount of time my job takes makes it difficult to fulfill family responsibilities
Things I want to do at home do not get done because of demands my job puts on me
My job produces strain that makes it difficult to fulfill family duties
Due to work‐related duties, I have to make changes to my plans for family activities
Perceptions of Work Interfering With Family
Disagree Neither Agree nor Disagree Agree
65%
76%
81%
80%
79%
21%
12%
12%
12%
14%
15%
12%
7%
8%
7%
The demands of my family or spouse/partner interfere with work‐related activities
I have to put off doing things at work because of demands on my time at home
Things I want to do at work do not get done because of the demands of my family or …
My home life interferes with my responsibilities at work such as getting to work on time, …
Family‐related strain interferes with my ability to perform job‐related duties
Perceptions of Family Interfering with Work
Disagree Neither Agree nor Disagree Agree
Findings of the Work‐Life Survey: Appendix A 12

We calculated a composite score of overall perceptions of work interfering with family and family interfering with work by computing the mean of the five items for the respective scales.
2.90
2.04
1
2
3
4
5
Work interferes with family
Family interferes with work
Strongly disagree to Stron
gly agree
Mean Ratings of Work and Family Interference Employees report higher levels of work
interfering with their family life than family interfering with their work life. This is a typical finding in organizations. Researchers consistently find that people report higher levels of work interfering with family than family interfering with work (Bryon, 2005).
Shown in the next figure are perceptions of work and family interference by job category. Of all job categories, faculty report the highest level of work interfering with family. Faculty also report the highest level of family interfering with work.
3.143.30
2.322.65 2.63
2.99
2.52
1.912.23
1.852.02 2.15 2.17
1.66
1
2
3
4
5
Executive/ Admin/
Managerial
Faculty Secretarial & Clerical Support
Service Skilled Crafts & Trade
Support Professional
Technical
Strongly disagree to Stron
gly Agree
Perceptions of Work and Family Interference by Job Category
Work Interferes With Family Family Interferes With Work
Findings of the Work‐Life Survey: Appendix A 13
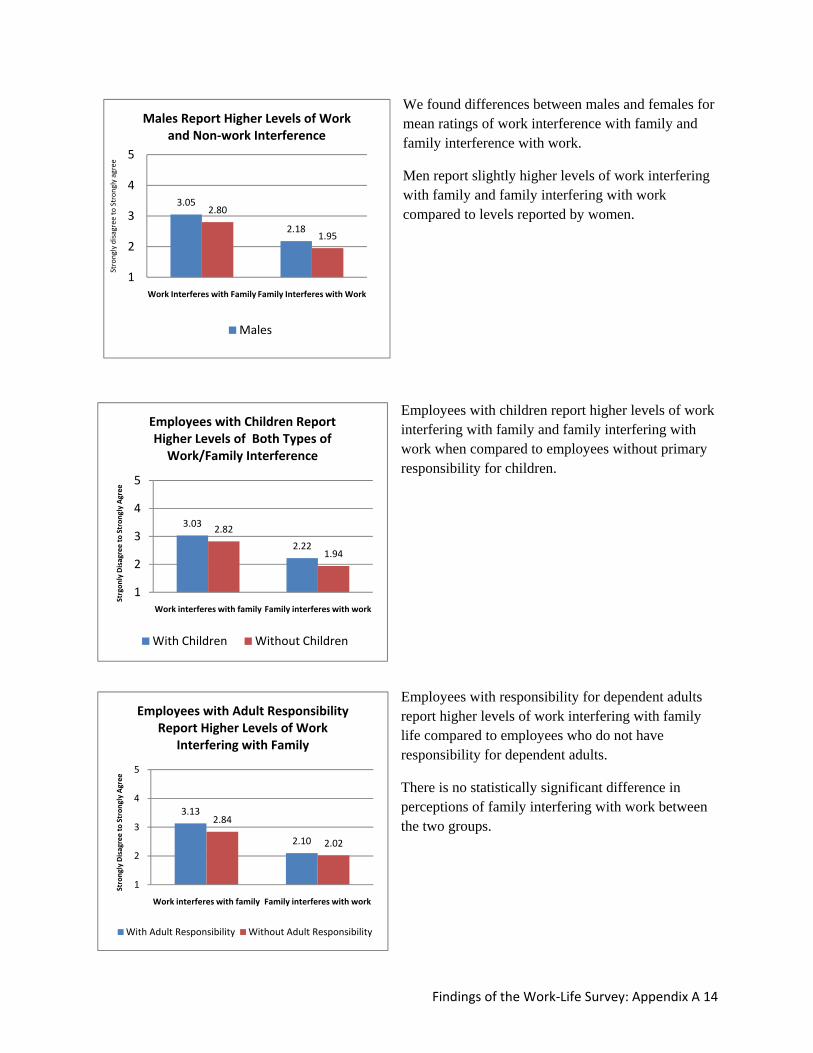
We found differences between males and females for mean ratings of work interference with family and family interference with work.
3.05
2.18
2.80
1.95
1
2
3
4
5
Work Interferes with Family Family Interferes with Work
Strongly disagree to Stron
gly agree
Males Report Higher Levels of Work and Non‐work Interference
Findings of the Work‐Life Survey: Appendix A 14
Males
Men report slightly higher levels of work interfering with family and family interfering with work compared to levels reported by women.
Employees with children report higher levels of work interfering with family and family interfering with work when compared to employees without primary responsibility for children.
3.03
2.22
2.82
1.94
1
2
3
4
5
Work interferes with family Family interferes with work
Strgon
ly Disagree to Stron
gly Agree
Employees with Children Report Higher Levels of Both Types of Work/Family Interference
With Children Without Children
Employees with responsibility for dependent adults report higher levels of work interfering with family life compared to employees who do not have responsibility for dependent adults.
3.13
2.10
2.84
2.02
1
2
3
4
5
Work interferes with family Family interferes with work
Strongly Disagree to Stron
gly Agree
Employees with Adult Responsibility Report Higher Levels of Work
Interfering with Family
There is no statistically significant difference in perceptions of family interfering with work between the two groups.
With Adult Responsibility Without Adult Responsibility

Benefits and Services to Help Employees Find Balance
We presented three categories of benefits and services that may help people balance their work and non-work life. The categories were (1) work and scheduling, (2) home and family, and (3) financial and legal. We examined responses separately for faculty and staff because some of the items on the survey pertained only to faculty and some items pertained only to staff. Presented in Table 3 through Table 8 are the average ratings of each benefit and service in descending order. Also shown in the tables are the percent who responded that the benefit or service was Quite Important or Very important, and the percent who said they would use the benefit or service.
Staff and faculty ratings of work and scheduling benefits and services are presented in Table 3 and Table 4, respectively. For staff, the highest rated benefit was variable starting and ending hours. Of all staff respondents, 65.6% reported they would use the benefit. This benefit is currently available to Missouri State University through a flex-time option. The second highest rated item for staff was option to donate paid sick or vacation days for catastrophic personal or family emergencies. Over 60% of staff respondents indicated they would use this benefit. Rated slightly lower than option to donate days was short-term disability coverage with 55% of staff respondents indicating they would use the benefit.
Table 3 Staff Average Ratings of Work and Scheduling Benefits and Services in Descending Order
Rank Work and Scheduling Benefit or service N
Mean Std. Dev.
Percent of staff
responding quite
important or very
important
Percent of staff who would use the service,
if rated quite or very
important
Percent who would use
service based on total
number of staff
respondents
1 Variable starting/ending hours 500 4.07 1.01 72.1 88.2 65.6
2
Option to donate paid sick or vacation days to others for catastrophic personal/family emergencies 496
3.91 1.12 69.0 90.9 63.2
3 Short-term disability coverage 496 3.86 1.01 64.0 86.1 55.5
4 Compensatory time 485 3.76 1.10 58.8 74.7 43.9
5 Compressed work week 499 3.72 1.22 63.2 90.0 59.0
6
Paid leave for degree completion, professional development, or other educational leave 494
3.71 1.17 60.4 78.4 49.9
7 Paid time off bank 497 3.56 1.28 55.6 91.4 52.9
8 Telecommuting/work at home 495 3.53 1.24 54.6 76.4 44.3
9 Modified duties 494 3.49 1.13 49.1 77.3 39.2
10 Phase-in to retirement 496 3.46 1.21 50.9 79.0 42.7
11 Phase-back from leave of absence 496 3.34 42.3 72.4 32.8
Findings of the Work‐Life Survey: Appendix A 15

Table 3 Staff Average Ratings of Work and Scheduling Benefits and Services in Descending Order
Rank Work and Scheduling Benefit or service N
Mean Std. Dev.
Percent of staff
responding quite
important or very
important
Percent of staff who would use the service,
if rated quite or very
important
Percent who would use
service based on total
number of staff
respondents 1.12
12 Sabbatical leave for staff 492 3.34 1.23 45.9 75.9 37.6
13 Tenure-clock extension 463 3.28 1.10 36.0 25.8 10.1
14 Sabbatical leave for faculty 455 3.26 1.23 45.7 10.3 4.4
15
Temporary reduced faculty appointment with reduced benefits for personal reasons 481
3.09 1.20 35.4 19.6 7.6
16 Flexible tenure probationary period 451 3.02 1.09 25.6 9.4 2.8
17 Part-time work week with reduced benefits 499
2.72 1.28 26.2 34.4 10.7
18 Split faculty position 464 2.68 1.14 18.9 7.6 1.8
19 Job sharing with reduced benefits 497 2.66 1.23 25.0 26.3 8.0
20 Reduced work week with reduced benefits 495
2.65 1.31 26.2 49.0 15.1
21 Shared faculty position 463 2.42 1.51 13.9 2.1 0.4
As shown in Table 4, the highest rated benefit for faculty was sabbatical leave. Over 70% of faculty respondents indicated they would use this benefit. The next highest rated benefit was short-term disability coverage. Slightly over 50% of faculty respondents said they would use this benefit. The third highest rated benefit was tenure-clock extension with 28.7% of faculty reporting they would use the benefit.
Table 4 Faculty Average Ratings of Work and Scheduling Benefits and Services in Descending Order
Rank Work and Scheduling Benefit or service N
Mean Std. Dev.
Percent of faculty
responding quite
important or very
important
Percent of faculty who would use the service,
if rated quite or very
important
Percent who would use
service based on total
number of faculty
respondents
1 Sabbatical leave for faculty 214 4.40 .97 85.6 87.8 73.1
2 Short-term disability coverage 212 4.02 .98 69.0 79.7 52.8
3 Tenure-clock extension 215 3.95 1.10 73.1 40.8 28.7
Findings of the Work‐Life Survey: Appendix A 16

Findings of the Work‐Life Survey: Appendix A 17
Table 4 Faculty Average Ratings of Work and Scheduling Benefits and Services in Descending Order
Rank Work and Scheduling Benefit or service N
Mean Std. Dev.
Percent of faculty
responding quite
important or very
important
Percent of faculty who would use the service,
if rated quite or very
important
Percent who would use
service based on total
number of faculty
respondents
4 Variable starting/ending hours 212 3.91 1.10 70.4 75.3 52.3
5
Paid leave for degree completion, professional development, or other educational leave 214
3.88 1.18 68.1 77.9 52.3
6 Phase-in to retirement 213 3.85 1.13 67.1 87.5 58.3
7
Option to donate paid sick or vacation days to others for catastrophic personal/family emergencies 213
3.76 1.18 65.7 80.3 50.9
8 Modified duties 211 3.71 1.14 59.3 71.2 41.2
9
Temporary reduced faculty appointment with reduced benefits for personal reasons 213
3.71 1.15 63.4 62.4 38.4
10 Paid time off bank 208 3.70 1.26 57.9 54.1 30.6
11 Compensatory time 207 3.62 1.13 54.6 42.0 21.8
12 Telecommuting/work at home 212 3.60 1.28 56.0 87.4 48.1
13 Flexible tenure probationary period 215 3.53 1.23 63.0 38.7 22.2
14 Phase-back from leave of absence 211 3.47 1.13 47.7 69.0 31.9
15 Split faculty position 214 3.34 1.27 49.1 53.3 25.9
16 Compressed work week 211 3.32 1.30 46.7 73.7 33.8
17 Sabbatical leave for staff 208 3.20 1.33 41.7 29.1 11.6
18 Job sharing with reduced benefits 208 3.17 1.25 41.7 36.7 15.3
19 Part-time work week with reduced benefits 211
2.73 1.18 25.5 23.1 5.6
20 Reduced work week with reduced benefits 212
2.62 1.20 24.6 28.8 6.9
21 Shared faculty position 214 2.62 1.34 28.3 47.5 13.4

Table 5 presents the highest rated home and family benefits and services for staff and Table 6 presents the same information for faculty. For both faculty and staff, the three highest rated benefits were (1) drop-in childcare on campus, (2) paid parental leave, and (3) leave in excess of FMLA. After hours or weekends on-campus medical clinic received the highest percentage of use by both faculty and staff.
Table 5 Staff Average Ratings of Home and Family Benefits and Services in Descending Order
Rank Home and Family Benefit or service N
Mean Std. Dev.
Percent of staff
responding quite
important or very
important
Percent of staff who would use the service,
if rated quite or very
important
Percent who would use
service based on total
number of staff
respondents
1 Drop-in childcare on campus 494 3.87 1.11 64.2 34.7 22.7
2 Paid parental leave 497 3.83 1.10 61.8 48.1 30.4
3 Leave in excess of the Family and Medical Leave Act (FMLA) 498
3.70 1.12 58.8 76.2 45.1
4
After hours or weekends on-campus medical clinic for employees and their families 495
3.65 1.12 58.2 88.3 52.7
5 Childcare financial assistance 489 3.46 1.20 46.0 35.8 17.3
6 Childcare information resource and referral 488
3.41 1.15 44.2 36.8 16.7
7 Eldercare/Adultcare information resource and referral 488
3.39 1.18 45.7 69.2 33.0
8 Dual career partner information resource and referral 490
3.25 1.18 38.8 48.1 19.9
9 Family/personal problems information resource and referral 490
3.21 1.10 36.8 67.2 26.4
10 Housing information resource and referral 494
3.18 1.13 35.8 51.1 19.3
11 Breastfeeding support programs 490 2.95 1.27 30.4 18.8 6.2
12 Adoption costs reimbursement 493 2.68 1.34 26.4 40.4 12.1
Table 6 Faculty Average Ratings of Home and Family Benefits and Services in Descending Order
Rank Home and Family Benefit or service N
Mean Std. Dev.
Percent of faculty
responding quite
important or very
important
Percent of faculty who would use the service,
if rated quite or very
important
Percent who would use
service based on total
number of faculty
respondents
1 Drop-in childcare on campus 213 3.97 1.12 69.9 36.0 25.0
2 Paid parental leave 213 3.92 1.12 66.3 49.3 31.5
Findings of the Work‐Life Survey: Appendix A 18

Findings of the Work‐Life Survey: Appendix A 19
Table 6 Faculty Average Ratings of Home and Family Benefits and Services in Descending Order
Rank Home and Family Benefit or service N
Mean Std. Dev.
Percent of faculty
responding quite
important or very
important
Percent of faculty who would use the service,
if rated quite or very
important
Percent who would use
service based on total
number of faculty
respondents
3 Leave in excess of the Family and Medical Leave Act (FMLA) 213
3.77 1.13 60.7 70.3 41.7
4
After hours or weekends on-campus medical clinic for employees and their families 214
3.75 1.10 64.8 87.1 56.5
5 Dual career partner information resource and referral 213
3.66 1.13 57.0 45.9 25.9
6 Childcare financial assistance 211 3.59 1.32 56.4 42.1 23.6
7 Childcare information resource and referral 213
3.47 1.24 50.0 41.5 20.4
8 Housing information resource and referral 214
3.36 1.19 46.8 48.0 22.2
9 Eldercare/Adultcare information resource and referral 211
3.36 1.22 48.1 57.8 27.3
10 Family/personal problems information resource and referral 212
3.23 1.16 41.2 59.1 24.1
11 Breastfeeding support programs 211 3.08 1.34 39.4 21.7 8.3
12 Adoption costs reimbursement 213 2.74 1.39 31.1 44.8 13.9
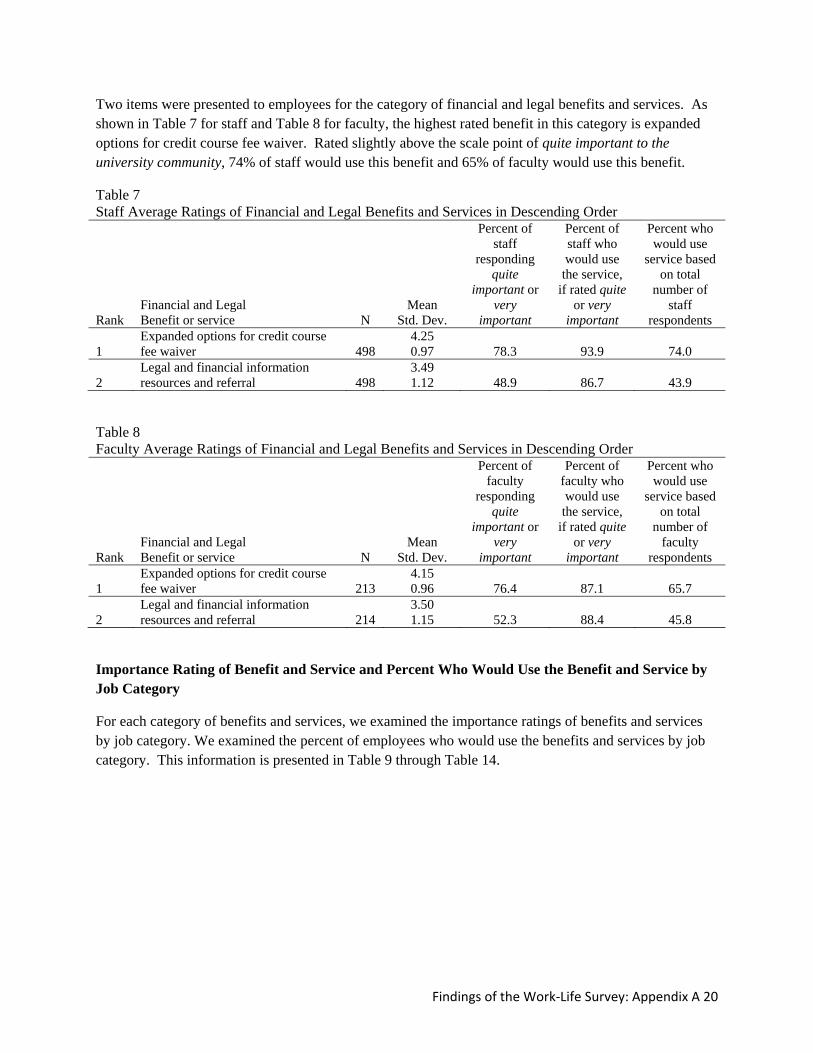
Two items were presented to employees for the category of financial and legal benefits and services. As shown in Table 7 for staff and Table 8 for faculty, the highest rated benefit in this category is expanded options for credit course fee waiver. Rated slightly above the scale point of quite important to the university community, 74% of staff would use this benefit and 65% of faculty would use this benefit.
Table 7 Staff Average Ratings of Financial and Legal Benefits and Services in Descending Order
Rank Financial and Legal Benefit or service N
Mean Std. Dev.
Percent of staff
responding quite
important or very
important
Percent of staff who would use the service,
if rated quite or very
important
Percent who would use
service based on total
number of staff
respondents
1 Expanded options for credit course fee waiver 498
4.25 0.97 78.3 93.9 74.0
2 Legal and financial information resources and referral 498
3.49 1.12 48.9 86.7 43.9
Table 8 Faculty Average Ratings of Financial and Legal Benefits and Services in Descending Order
Rank Financial and Legal Benefit or service N
Mean Std. Dev.
Percent of faculty
responding quite
important or very
important
Percent of faculty who would use the service,
if rated quite or very
important
Percent who would use
service based on total
number of faculty
respondents
1 Expanded options for credit course fee waiver 213
4.15 0.96 76.4 87.1 65.7
2 Legal and financial information resources and referral 214
3.50 1.15 52.3 88.4 45.8
Importance Rating of Benefit and Service and Percent Who Would Use the Benefit and Service by Job Category
For each category of benefits and services, we examined the importance ratings of benefits and services by job category. We examined the percent of employees who would use the benefits and services by job category. This information is presented in Table 9 through Table 14.
Findings of the Work‐Life Survey: Appendix A 20

Findings of the Work‐Life Survey: Appendix A 21
rk and Scheduling Benefit or Service by Job Category
sented in Table 9 are the six highest rated as important to the university community work and scheduling benefits services by job category. Ratings differed based on the job category.
ble 9 Highest Rated Work and Scheduling Benefit or Service that Respondents Considered Important to the University Community bCategory
k
Executive/ Administrative/
Managerial Faculty Secretarial &
Clerical Support Service Skilled Crafts &
Trade Support
Professional Technical Did NotRespond
Donate sick or vacation days to others (3.94)
Sabbatical leave for faculty (4.38)
Variable starting/ ending hours (4.09)
Short-term disability coverage (3.92)
Short-term disability coverage (4.13)
Variable starting/ ending hours (4.23)
Variable starting/ ending hours (4.39)
Sabbatical lefor faculty (4.07)
Short-term disability coverage (3.85)
Short-term disability coverage (4.01)
Short-term disability coverage (3.95)
Variable starting/ ending hours (3.78)
Paid time off bank (4.00)
Paid leave for professional development (4.01)
Compressed work week (3.95)
Paid leave foprofessional developmen(4.00)
Variable starting/ ending hours (3.84)
Tenure-clock extension (3.92)
Donate sick or vacation days to others (3.94)
Donate sick or vacation days to others (3.76)
Compensatory time off (4.00)
Donate sick or vacation days to others (3.98)
Compensatory time off (3.78)
Variable starting/ ending hour(4.00)
Paid leave for professional development (3.81)
Variable starting/ ending hours (3.90)
Compensatory time off (3.83)
Compensatory time off (3.53)
Variable starting/ ending hours (4.00)
Compressed work week (3.89)
Telecommute/ work at home (3.76)
Short-term disability coverage (3.93)
Compensatory time off (3.79)
Phase-in to retirement (3.84)
Compressed work week (3.79)
Compressed work week (3.38)
Donate sick or vacation days to others (3.75)
Telecommute/ work at home (3.82)
Donate sick or vacation days to others (3.74)
Sabbatical lefor staff (3.86)
Sabbatical leave for faculty (3.58)
Modified duties (3.73)
Paid time-off bank (3.70)
Modified duties (3.35)
Modified duties (3.63)
Short-term disability coverage (3.81)
Paid leave for professional development (3.70)
Phase-in to retirement (3.86)

Presented in Table 10 are the six most frequently chosen work and scheduling benefit that employees said they would use by job category.
Table 10 Top Six Work and Scheduling Benefit and Service that Respondents Indicated They Would Use by Job Category1
Rank
Executive/ Administrative/
Managerial Faculty Secretarial &
Clerical Support Service Skilled Crafts &
Trade Support
Professional Technical Did Not Respond
1
Donate sick or vacation days to others (63%)
Sabbatical leave for faculty (72%)
Variable starting/ ending hours (67%)
Short-term disability coverage (66%)
Short-term disability coverage (75%)d
Variable starting/ ending hours (71%)
Compressed work week (74%)f
Variable starting/ ending hours (71%)
2
Paid leave for professional development (56%)a
Phase-in to retirement (59%)
Donate sick or vacation days to others (65%)
Donate sick or vacation days to others (60%)
Compressed work week (75%)d
Donate sick or vacation days to others (63%)
Variable starting/ ending hours (74%)f
Donate sick or vacation days to others (64%)
3
Variable starting/ ending hours (56%)a
Paid leave for professional development (53%)c
Compressed work week (63%)
Variable starting/ ending hours (54%)
Paid time off bank (75%)d
Compressed work week (62%)
Compensatory time off (61%)
Paid leave for professional development (57%)
4
Short-term disability coverage (52%)
Variable starting/ ending hours (53%)c
Short-term disability coverage (62%)
Compressed work week (46%)
Variable starting/ ending hours (63%)e
Paid leave for professional development (61%)
Donate sick or vacation days to others ( 58%)
Compensatory time off (43%)g
5
Compressed work week (50%)b
Short-term disability coverage (52%)
Paid time off bank (59%)
Paid time-off bank (44%)
Donate sick or vacation days to others (63%)e
Telecommute/ work at home (56%)
Telecommute/ work at home (55%)
Short-term disability coverage (43%)g
6
Paid time-off bank (50%)b
Donate sick or vacation days to others (50%)
Compensatory time (58%)
Compensatory time (42%)
Compensatory time (50%)
Short-term disability coverage (52%)
Paid leave for professional development (50%)
Sabbatical leave for staff (43%)g
1 Benefits and services with equal percentages within a job category are designated by a character superscript and listed alphabetically.
Findings of the Work‐Life Survey: Appendix A 22

Home and Family Benefit or Service by Job Category
Presented in Table 11 are the six highest rated as important to the university community home and family benefit or service by job category. Ratings differed based on the job category.
Table 11 Six Highest Rated Home and Family Benefit or Service that Respondents Considered Important to the University Community by Job Category
Rank
Executive/ Administrative/
Managerial Faculty Secretarial &
Clerical Support Service Skilled Crafts &
Trade Support
Professional Technical Did Not Respond
1
Drop-in childcare on campus (3.81)
Drop-in childcare on campus (4.01)
Paid parental leave (3.89)
Leave in excess of FMLA (3.73)
After hours or weekends on-campus medical clinic (4.00)
Paid parental leave (4.01)
Drop-in childcare on campus (3.68)
Paid parental leave (4.21)
2
Paid parental leave (3.75)
Paid parental leave (3.93)
Drop-in childcare on campus (3.88)
Drop-in childcare on campus (3.67)
Drop-in childcare on campus (3.88)
Drop-in childcare on campus (4.00)
Paid parental leave (3.55)
Drop-in childcare on campus (3.93)
3
After hours or weekends on-campus medical clinic (3.51)
After hours or weekends on-campus medical clinic (3.77)
Leave in excess of FMLA (3.88)
After hours or weekends on-campus medical clinic (3.63)
Paid parental leave (3.88)
After hours or weekends on-campus medical clinic (3.76)
Leave in excess of FMLA (3.47)
Leave in excess of FMLA (3.79)
4
Leave in excess of FMLA (3.48)
Leave in excess of FMLA (3.77)
After hours or weekends on-campus medical clinic (3.69)
Paid parental leave (3.49)
Leave in excess of FMLA (3.63)
Leave in excess of FMLA (3.73)
Childcare information resource (3.41)
Childcare information resource (3.79)
5
Childcare financial assistance (3.37)
Dual career partner information (3.65)
Childcare financial assistance (3.48)
Eldercare/ Adultcare information resource (3.29)
Childcare financial assistance (3.38)
Childcare financial assistance (3.72)
After hours or weekends on-campus medical clinic (3.32)
After hours or weekends on-campus medical clinic (3.71)
6
Childcare information resource (3.23)
Childcare financial assistance (3.63)
Eldercare/ Adultcare information resource (3.47)
Childcare information resource (3.23)
Childcare information resource (3.25)
Eldercare/ Adultcare information resource (3.60)
Eldercare/ Adultcare information resource (3.25)
Housing information resource (3.71)
Findings of the Work‐Life Survey: Appendix A 23

Findings of the Work‐Life Survey: Appendix A 24
Presented in Table 12 are the six most frequently chosen home and family benefit or service that employees said they would use by job category.
Table 12 Top Six Home and Family Benefit or Service that Respondents Indicated They Would Use by Job Category2
Rank
Executive/ Administrative/
Managerial Faculty Secretarial &
Clerical Support Service Skilled Crafts
& Trade Support
Professional Technical Did Not Respond
1
After hours or weekends on-campus medical clinic (47.7%)
After hours or weekends on-campus medical clinic (57.2%)
After hours or weekends on-campus medical clinic (56.5%)
After hours or weekends on-campus medical clinic (52%)
After hours or weekends on-campus medical clinic (75%)
After hours or weekends on-campus medical clinic (55.6%)
After hours or weekends on-campus medical clinic (39.5%)
Paid parental leave (42.9%)
2
Leave in excess of FMLA (35.5%)
Leave in excess of FMLA (41.3%)
Leave in excess of FMLA (52.9%)
Leave in excess of FMLA (50%)
Leave in excess of FMLA (50%)
Leave in excess of FMLA (43%)
Leave in excess of FMLA (36.8%)
Housing information resource (35.7%)b
3
Paid parental leave (29.9%)
Paid parental leave (32.3%)
Eldercare/ Adultcare information resource (35.9%)
Eldercare/ Adultcare information resource (34%)
Dual career partner information (25%)a
Paid parental leave (37.8%)
Paid parental leave (31.6%)
Leave in excess of FMLA (35.7%)b
4
Eldercare/ Adultcare information resource (26.2%)
Eldercare/ Adultcare information resource (27.4%)
Family/personal problems information resource (31.2%)
Family/personal problems information resource (32%)
Eldercare/ Adultcare information resource (25%)a
Eldercare/ Adultcare information resource (37%)
Drop-in childcare on campus (23.7%)
After hours or weekends on-campus medical clinic (28.6%)c
5
Drop-in childcare on campus (24.3%)
Dual career partner information (26.9%)
Paid parental leave (22.4%)
Paid parental leave (30%)
Housing information resource (25%)a
Drop-in childcare on campus (30.4%)
Eldercare/ Adultcare information resource (21.1%)
Dual career partner information (28.6%)c
6
Childcare financial assistance (21.5%)
Drop-in childcare on campus (25.4%)
Drop-in childcare on campus (15.3%)
Housing information resource (26%)
Paid parental leave (25%)a
Family/personal problems information resource (28.1%)
Dual career partner information (15.8%)
Eldercare/ Adultcare information resource (28.6%)c
2 Benefits and services with equal percentages within job categories are designated by a character superscript and listed alphabetically.

Financial and Legal Benefit or Service by Job Category
Only two benefits and services were presented in the category of financial and legal Benefit or Service. Presented in Table 13 are the ratings for the two items by job category. Respondents in all job categories gave the highest ratings to Expanded options for credit course fee waiver.
Table 13 Average Ratings Importance to the University Community for the Financial and Legal Benefit and Service by Job Category
Rank
Executive/ Administrative/
Managerial Faculty Secretarial &
Clerical Support Service Skilled Crafts &
Trade Support
Professional Technical Did Not Respond
1
Expanded options for credit course fee waiver (4.06)
Expanded options for credit course fee waiver (4.18)
Expanded options for credit course fee waiver (4.29)
Expanded options for credit course fee waiver (4.12)
Expanded options for credit course fee waiver (4.13)
Expanded options for credit course fee waiver (4.36)
Expanded options for credit course fee waiver (4.34)
Expanded options for credit course fee waiver (3.86)
2
Legal and financial information resources (3.25)
Legal and financial information resources (3.50)
Legal and financial information resources (3.56)
Legal and financial information resources (3.40)
Legal and financial information resources (3.75)
Legal and financial information resources (3.59)
Legal and financial information resources (3.47)
Legal and financial information resources (3.38)
Presented in Table 14 are the percent of respondents indicating they would use the benefit or service.
Table 14 Percent of Respondents Who Would Use the Financial and Legal Benefit and Service by Job Category
Rank
Executive/ Administrative/
Managerial Faculty Secretarial &
Clerical Support Service Skilled Crafts &
Trade Support
Professional Technical Did Not Respond
1
Expanded options for credit course fee waiver (68.2%)
Expanded options for credit course fee waiver (67.2%)
Expanded options for credit course fee waiver (74.7%)
Expanded options for credit course fee waiver (64%)
Expanded options for credit course fee waiver (75%)
Expanded options for credit course fee waiver (77.8%)
Expanded options for credit course fee waiver (84.2%)
Expanded options for credit course fee waiver (35.7%)
2
Legal and financial information resources (32.7%)
Legal and financial information resources (47.3%)
Legal and financial information resources (46.5%)
Legal and financial information resources (42%)
Legal and financial information resources (62.5%)
Legal and financial information resources (46.7%)
Legal and financial information resources (47.4%)
Legal and financial information resources (28.6%)
Findings of the Work‐Life Survey: Appendix A 25

Other Comments Provided by Respondents
We asked respondents to tell us about other programs or benefits that would help them balance their work and personal life. This was an open-ended item that allowed respondents to write additional comments. Of the 723 respondents, 30% (n = 218) offered additional insight about programs, services, or benefits that would help them.
We coded the content of these comments into general categories. These categories and the number and percent of respondents providing the comment are shown in the following table.
Table 15 Categories of Comments and Percent of Respondents Providing the Comments within a Category Category n Percent Work flexibility and work scheduling 40 18.3 Wellness 36 16.5 Expanded tuition waiver options 28 12.8 Other benefits 27 12.4 Workload 23 10.6 Healthcare benefits and insurance 24 11.0 Pay 16 7.3 Policies and procedures 15 6.9 Childcare/maternity/adoption benefits 15 6.9 Training/education 12 5.5 Benefits for domestic partner 10 4.6 Telecommuting 8 3.7 Benefits for part-time/Per course/Adjunct faculty 8 3.7 Retirement 7 3.2 Work/family culture 6 2.8 Entertainment benefits 4 1.8
Note: Some respondents made multiple comments. Percentages sum to more than 100.
Most comments were in support of the benefits and services listed on the survey. Often reported comments by category follow.
Work flexibility and work scheduling • Flexible work schedule to make it easier to attend to non-work issues • Compressed work week, such as 10 hours a day for four days with three days off • Four day work weeks during the summer • Sharing a job with another employee • A standard policy across campus for flexible work schedules, because flexibility seems to be
handled unofficially within units • Flexibility in scheduling classes to better fit with faculty family responsibilities • Accumulated sick leave in excess of a certain number of days to be used as personal or vacation
days • Release time to complete research projects when sabbatical time is not available • Teaching evening courses interferes with family life
Findings of the Work‐Life Survey: Appendix A 26
• Tenure clock extension is not applied equitably across campus • Sabbatical leave for staff professional development
Wellness • Fitness center on campus for faculty and staff use only • Hours available in the current fitness areas devoted for faculty and staff only • Hours devoted for faculty and staff to exercise during lunch and before or after work • Discounts for off-campus fitness centers • Psychological counseling • There were positive comments about the new focus on wellness and fitness for faculty and staff
Expanded tuition waiver options • Allowing tuition fee waivers to apply to Greenwood tuition • Banking of tuition fee waivers for future use by employee, spouse, children, domestic partners,
and/or grandchildren • Allowing tuition fee waivers to be used at other colleges and universities • A greater number of credit hours covered by tuition fee waivers per semester • Full-tuition reimbursement for employees and their children • Using tuition waiver for other benefits
Workload • Workload is not equitably distributed for staff and faculty across campus • Demanding workload for unclassified/exempt positions do not allow for flexible schedules or
time away from work • Extensive workload due to demands for on-line courses • Additional staffing to help with increased workload • Expectation that employees have to work more than 40 hours a week to be considered valued by
the University • Unclassified (i.e., exempt) employees typically work 50, 60, or 70 + hours per week because of
new initiatives and programs Healthcare benefits and insurance
• Improved healthcare coverage • Lower deductible for insurance • Vision/eye care insurance • Increased dental insurance • Health insurance for part-time employees and per course instructors • Flexibility in choosing health benefits
Other benefits • Car-pooling resources • Free parking • Flexible benefits package • Time off for volunteering • Assistance with caring for elderly parents • Better policy for hiring spouses • Financial planning resources
Findings of the Work‐Life Survey: Appendix A 27

Pay • Increase pay/salaries for faculty, staff, and administrators to be comparable to the national
average • Merit pay systems should equitable reward additional dimensions of performance (service, public
affairs, teaching) other than research • Equitable pay among employees • Compensate unclassified/exempt employees for inordinate time spent working during non-work
hours Policies and procedures
• Simplify university policies and procedures • Make it easier to find out about benefits and services available to employees • Provide information about work-life programs and benefits
Childcare/maternity/adoption benefits • On campus childcare is not affordable for most employees • Childcare available for extended hours – early mornings and evenings • After-school care for adolescents • Time off during the day to attend physician appointments with pregnant partner • Financial assistance with adoptions
Training/education • Training classes for university policies and procedures • Time management classes • Classes for staff to develop skills for better paying positions on campus • Training for supervisors about how to deal with employees with care giving responsibilities
Benefits for domestic partners • Allow tuition waivers for domestic partners • Change retirement system in order for long-term domestic partner to have access to benefits after
employee’s death • Health insurance for domestic partners
Telecommuting • Resources/equipment/software to assist an employee to work from home • Training administrators/supervisors to find telecommuting an acceptable alternative
Part-time/Per course/Adjunct faculty • Provide benefits to part-time/per course/adjunct faculty
Retirement • Information/seminars for retirement planning • Benefits after retirement • Phase in to retirement • Better options for early retirement
Work/family culture • Educate administrators/supervisors about importance of work-family balance • Campus culture does not value work-family balance
Entertainment benefits • Continue to offer free tickets to sporting events and other local entertainment venues
Findings of the Work‐Life Survey: Appendix A 28

Findings of the Work‐Life Survey: Appendix A 29
• Offer faculty and staff free access to campus sporting events • Discounts to Juanita K. Hammons events.

References
Byron, D. (2005). A meta-analytic review of work-family conflict and its antecedents. Journal of Vocational Behavior, 67, 169-198.
Netemeyer, R.G., Boles, J. S., & McMurrian, R. (1996). Development and validation of work-family conflict and family-work conflict scales. Journal of Applied Psychology, 81, 400-410.
Findings of the Work‐Life Survey: Appendix A 30