Embed Size (px)
Citation preview
Work-Life Balance and Happiness
Prof. Andrew OswaldUniversity of Warwick
WBS Lecture
Economics is changing
Economics is changing
Researchers are studying mental wellbeing.
Economics is changing
Researchers are studying mental wellbeing.
We are drawing closer to psychology and medicine.
Could we perhaps learn how to …

make nations and prime ministers cheerier..?
or perhaps a whole organization…like a bank

… or a business school (even) happier?

Some good news to start:

Some good news to start:
In Western nations, most people are happy with their lives
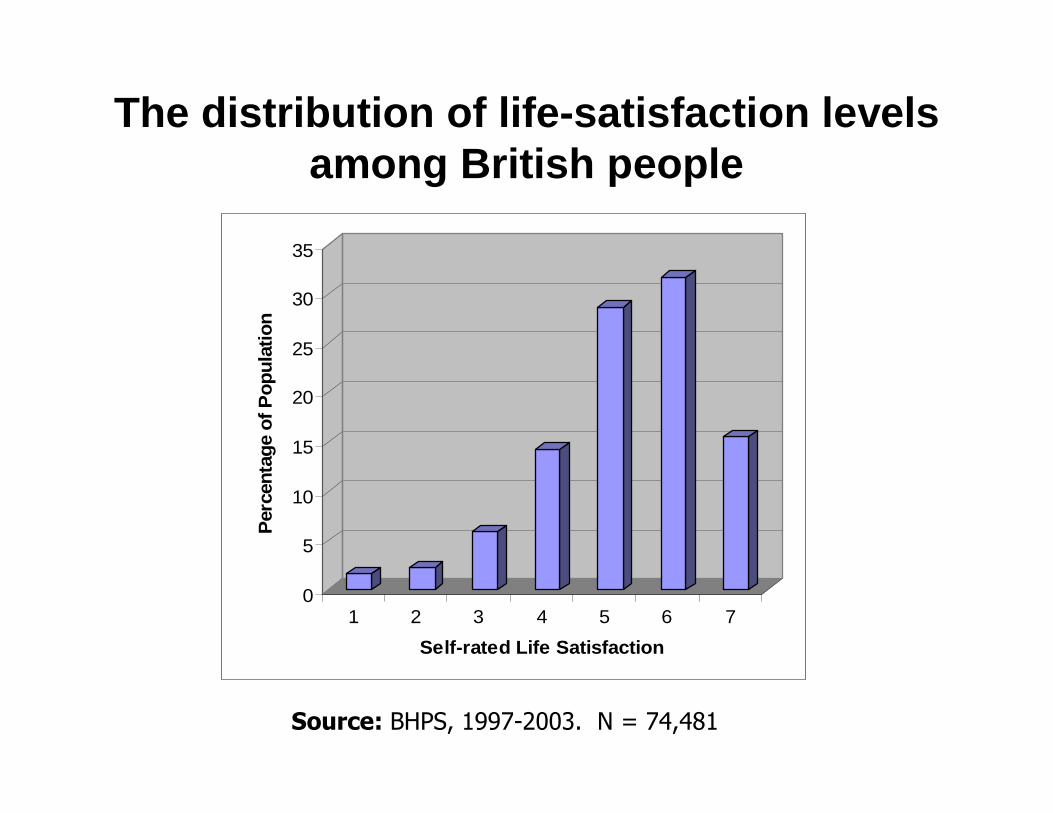
The distribution of life-satisfaction levels among British people
0
5
10
15
20
25
30
35P
erce
ntag
e of
Pop
ulat
ion
1 2 3 4 5 6 7
Self-rated Life Satisfaction
Source: BHPS, 1997-2003. N = 74,481
But the time trend is less encouraging.
Despite economic growth, there is evidence that society is not becoming happier.
For example
A simple graph to worry finance ministers all over the world:
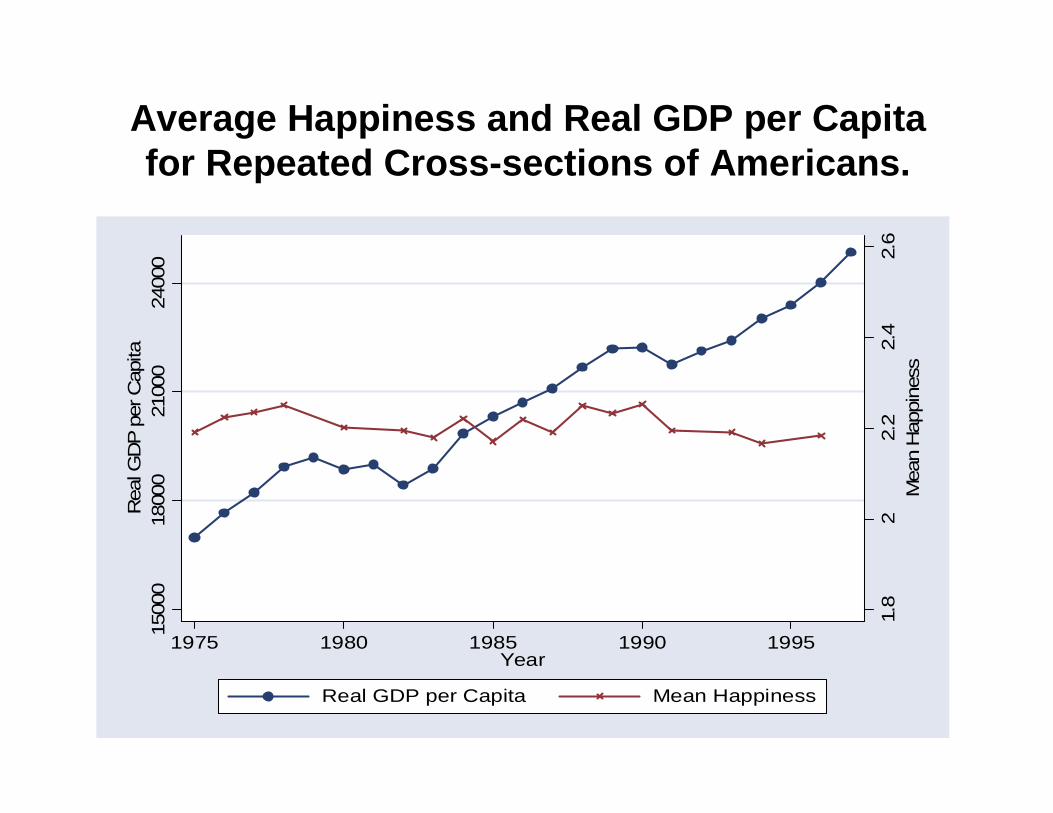
Average Happiness and Real GDP per Capita for Repeated Cross-sections of Americans.
1.8
22.
22.
42.
6M
ean
Hap
pine
ss
1500
018
000
2100
024
000
Rea
l GD
P p
er C
apita
1975 1980 1985 1990 1995Year
Real GDP per Capita Mean Happiness
Statistical methods
How is it possible to study happiness and mental wellbeing in a systematic way?
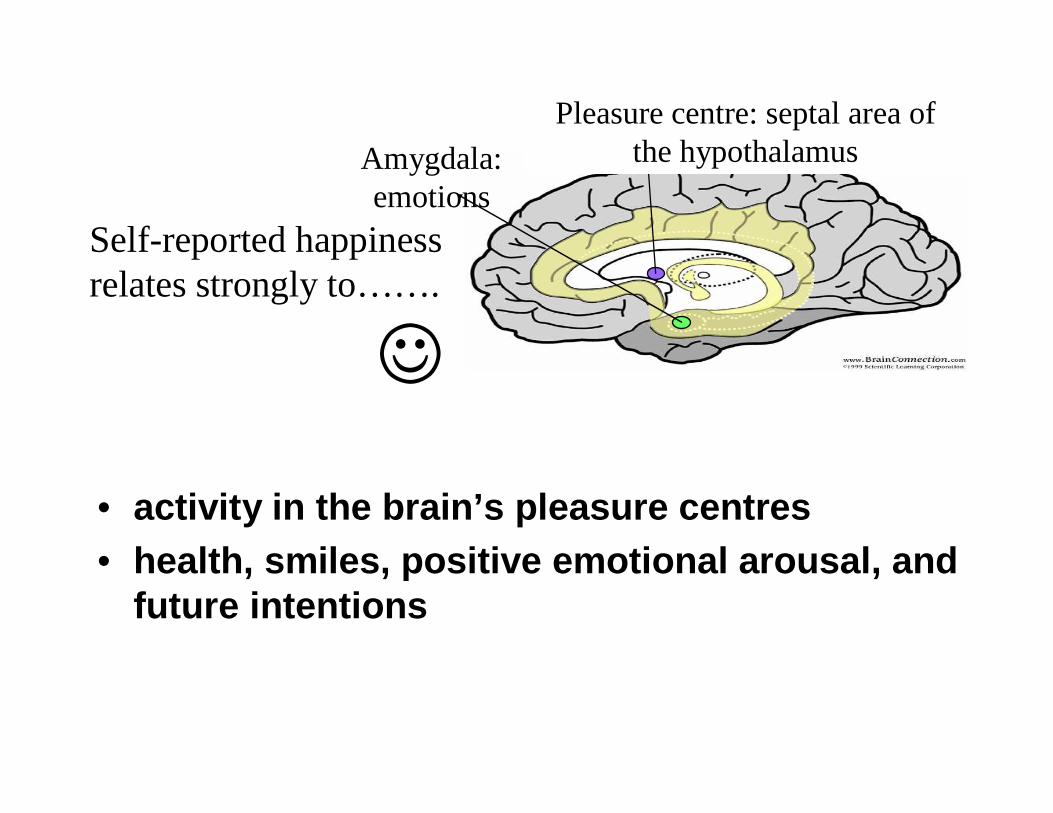
• activity in the brain’s pleasure centres• health, smiles, positive emotional arousal, and
future intentions
Self-reported happiness relates strongly to…….
☺
Pleasure centre: septal area of the hypothalamusAmygdala:
emotions
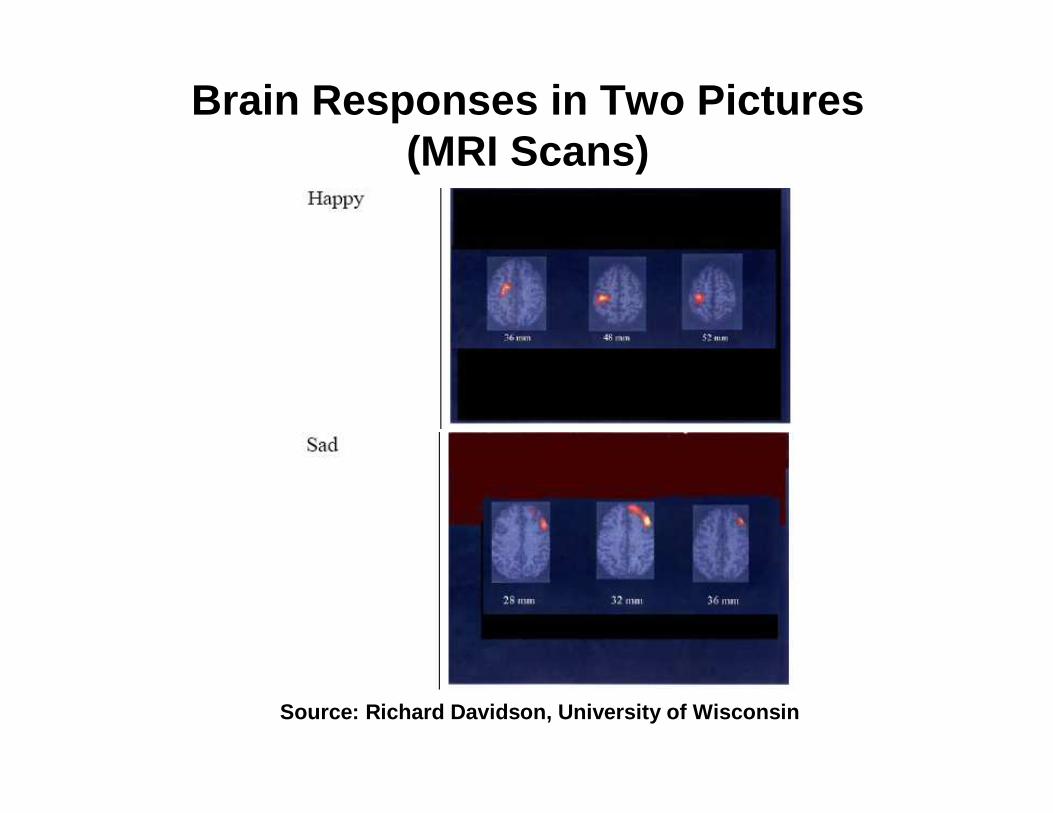
Brain Responses in Two Pictures(MRI Scans)
Source: Richard Davidson, University of Wisconsin
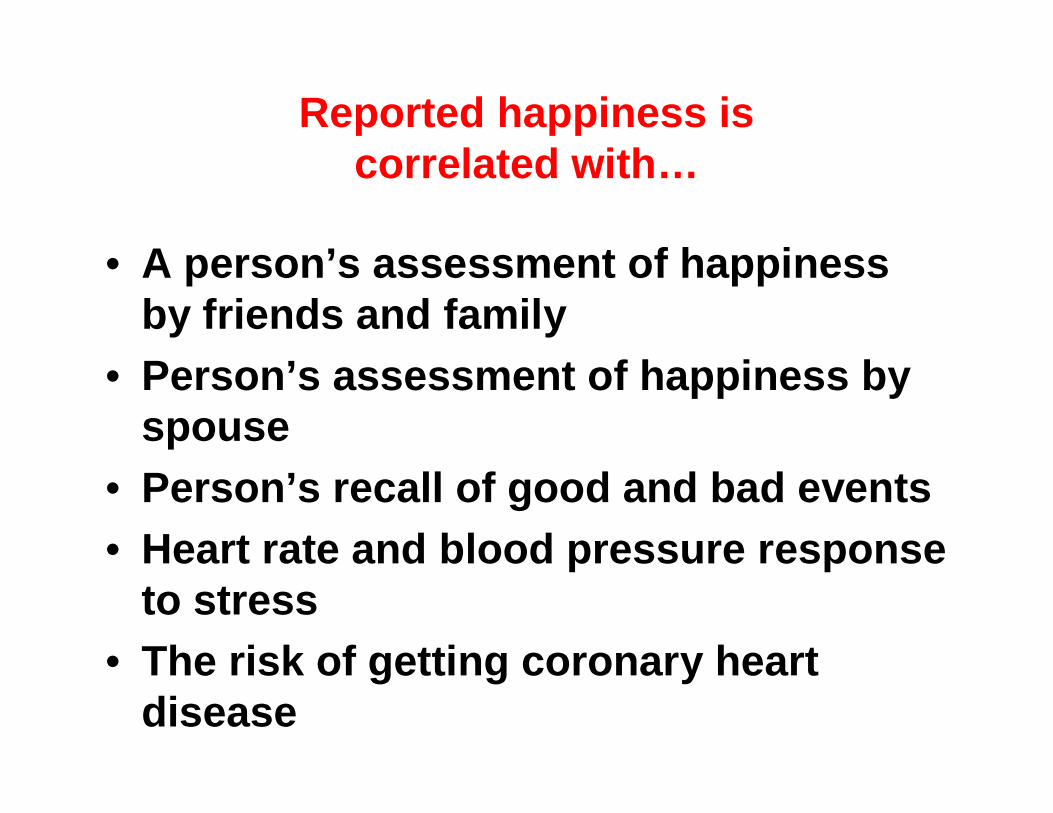
Reported happiness is correlated with…
• A person’s assessment of happiness by friends and family
• Person’s assessment of happiness by spouse
• Person’s recall of good and bad events• Heart rate and blood pressure response
to stress• The risk of getting coronary heart
disease
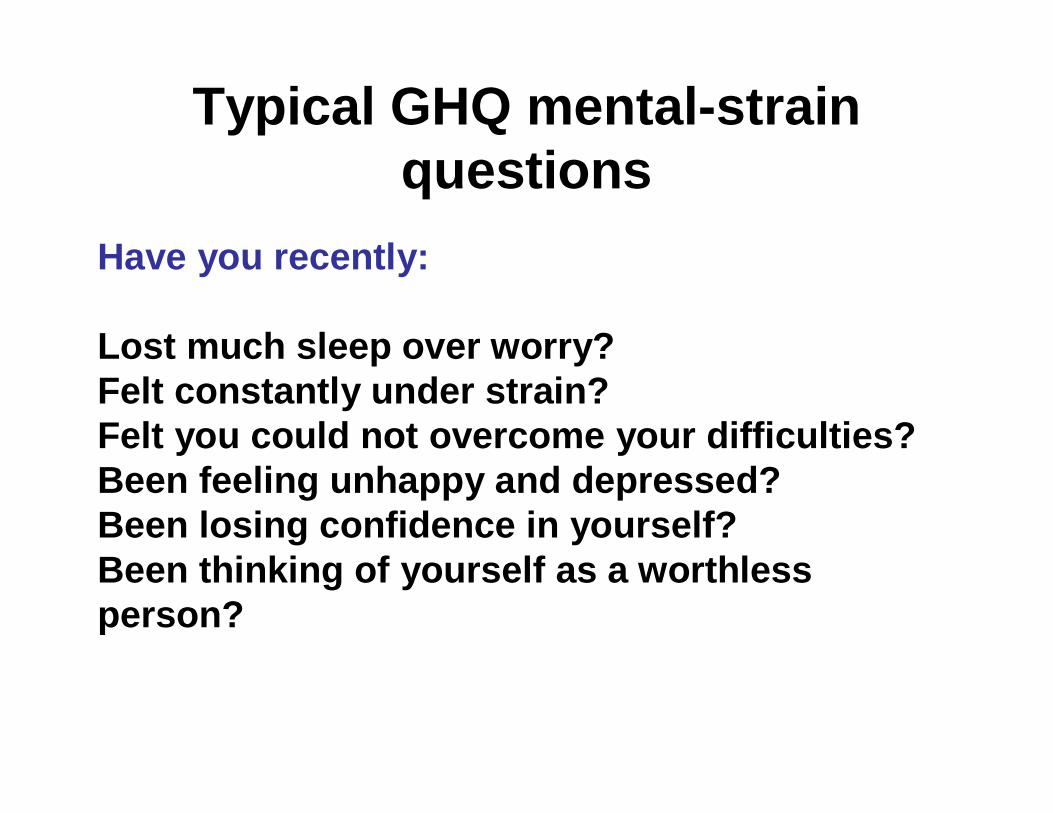
Typical GHQ mental-strain questions
Have you recently:
Lost much sleep over worry?Felt constantly under strain?Felt you could not overcome your difficulties?Been feeling unhappy and depressed?Been losing confidence in yourself?Been thinking of yourself as a worthless person?
Work and Jobs in Britain
What do the latest data show about strain and work-life balance?
In our country, GHQ mental strain levels appear to be worsening over time.
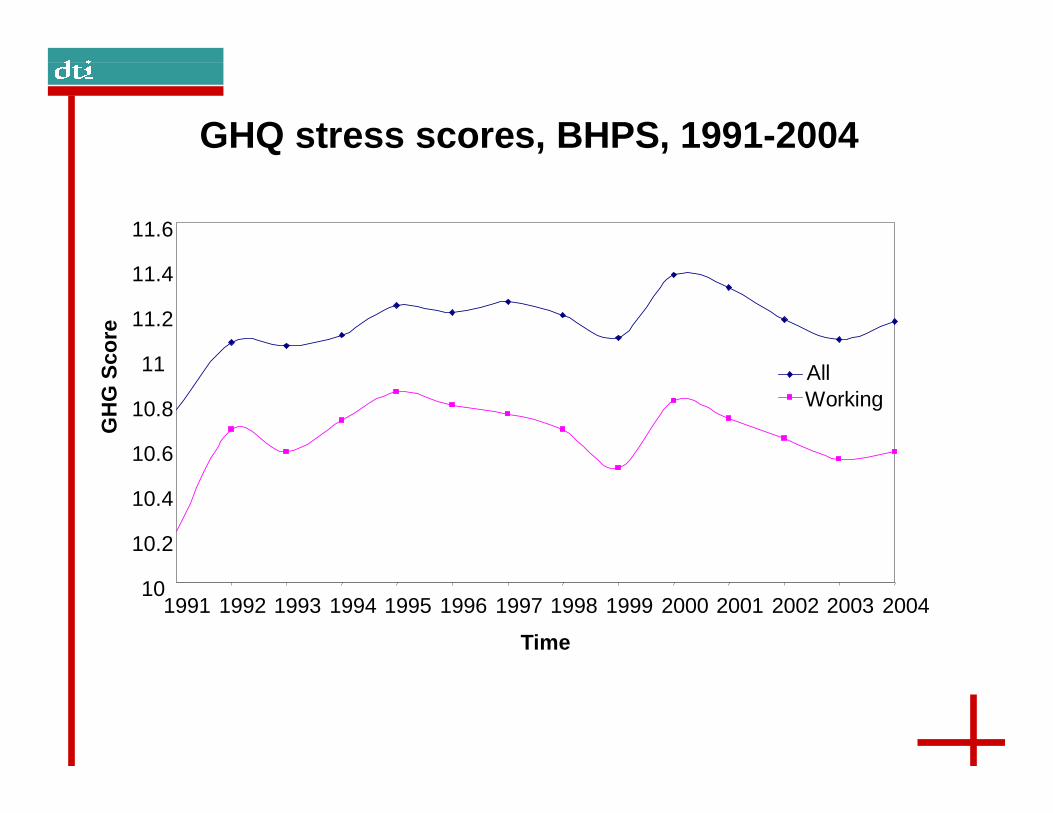
New Perspectives on Job GHQ stress scores, BHPS, 1991-2004
10
10.2
10.4
10.6
10.8
11
11.2
11.4
11.6
1991 1992 1993 1994 1995 1996 1997 1998 1999 2000 2001 2002 2003 2004
Time
GH
G S
core
AllWorking
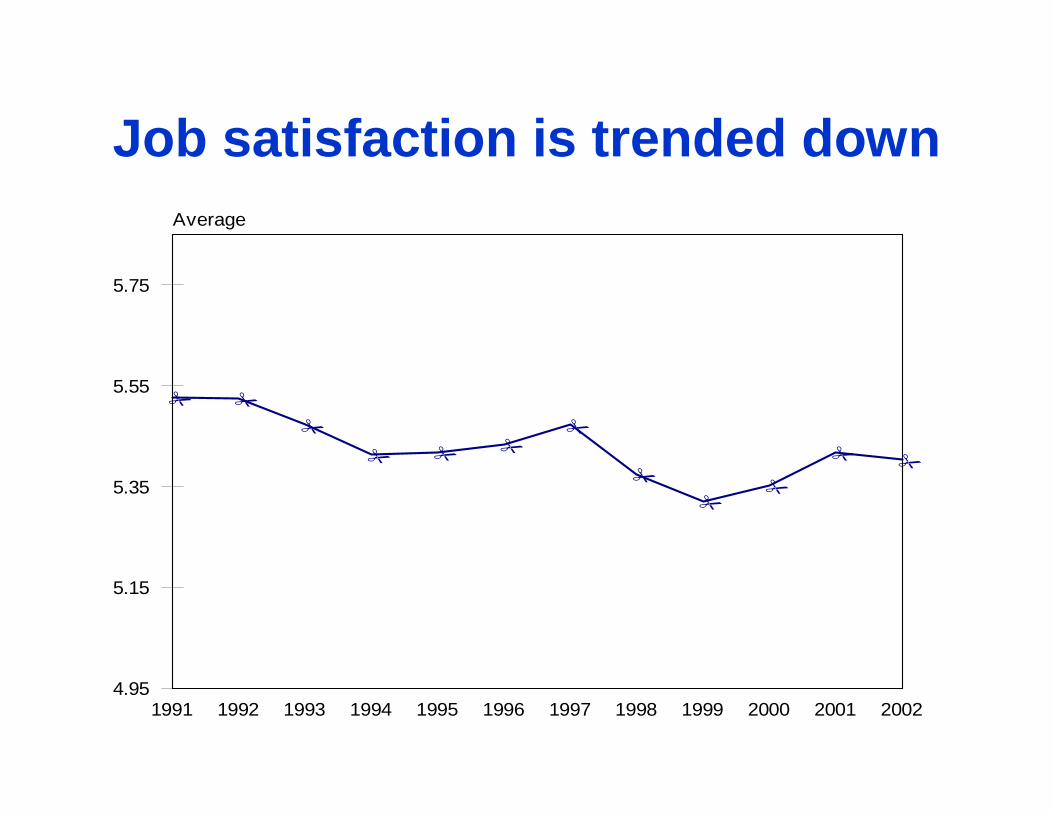
Job satisfaction is trended down
�
�
�
�
� ��
�
�
��
�
1991 1992 1993 1994 1995 1996 1997 1998 1999 2000 2001 20024.95
5.15
5.35
5.55
5.75
Average
Why?
• It is not because of increases in job insecurity.
• Instead, there seems to have been a noticeable rise in work intensity and tiredness.
ISSP international data on work-life balance
“If you could change the way you spend your time, how would you…?”
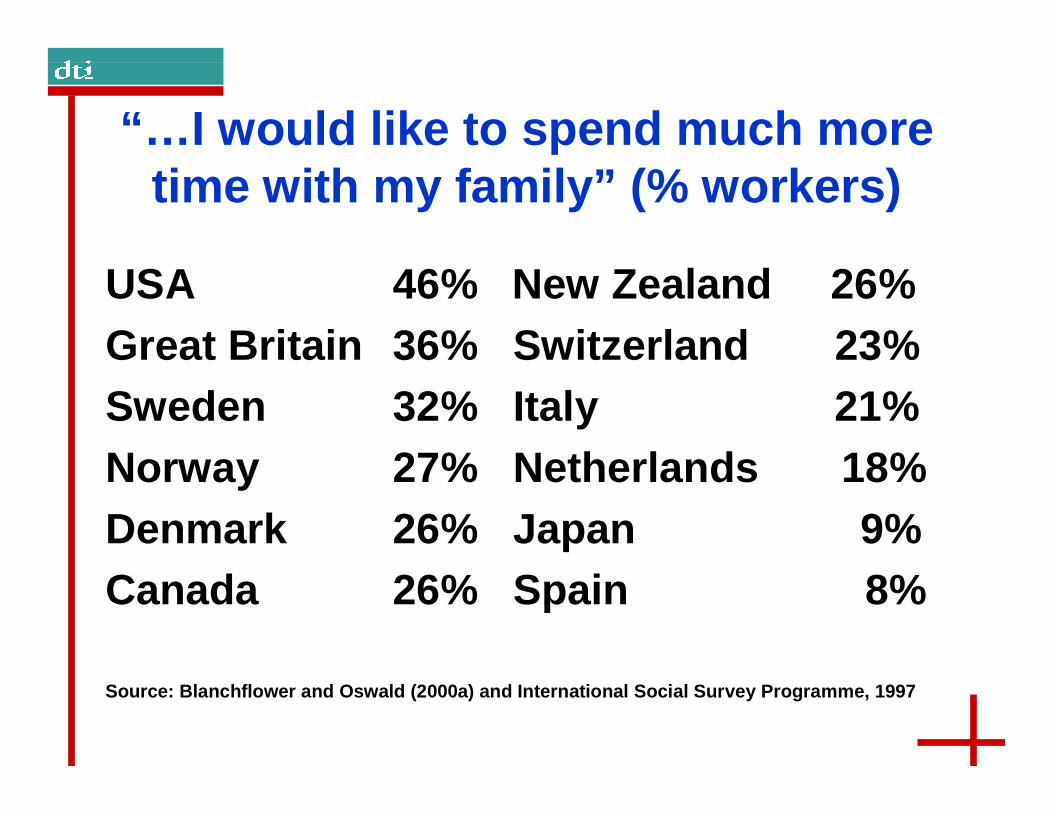
“… I would like to spend much more time with my family” (% workers)
USA 46% New Zealand 26%Great Britain 36% Switzerland 23%Sweden 32% Italy 21%Norway 27% Netherlands 18%Denmark 26% Japan 9%Canada 26% Spain 8%
Source: Blanchflower and Oswald (2000a) and Interna tional Social Survey Programme, 1997
New Perspectives on Job
This work-life balance problem is greatest among:
• The middle-aged• Those with high
educational qualifications• Men
There is some other evidence that our nation has a problem.
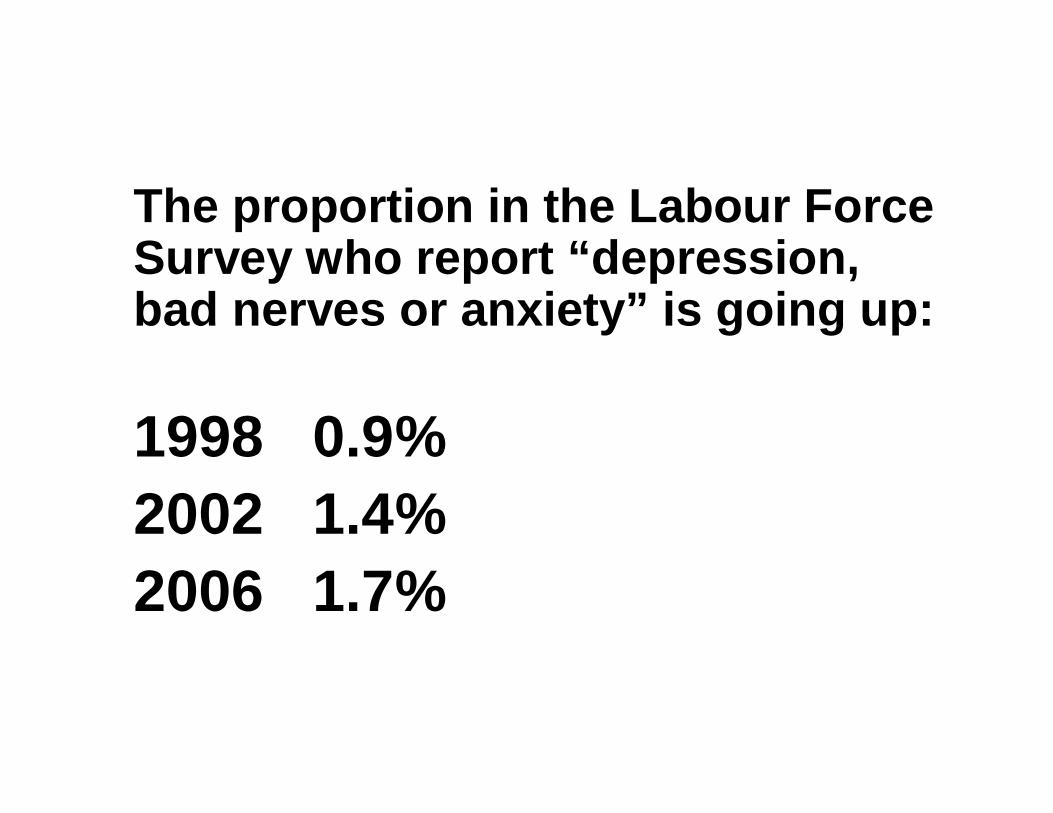
The proportion in the Labour Force Survey who report “depression, bad nerves or anxiety” is going up:
1998 0.9%2002 1.4%2006 1.7%
Prescriptions for anti-depressant drugs trebled between 1991 and 2003.
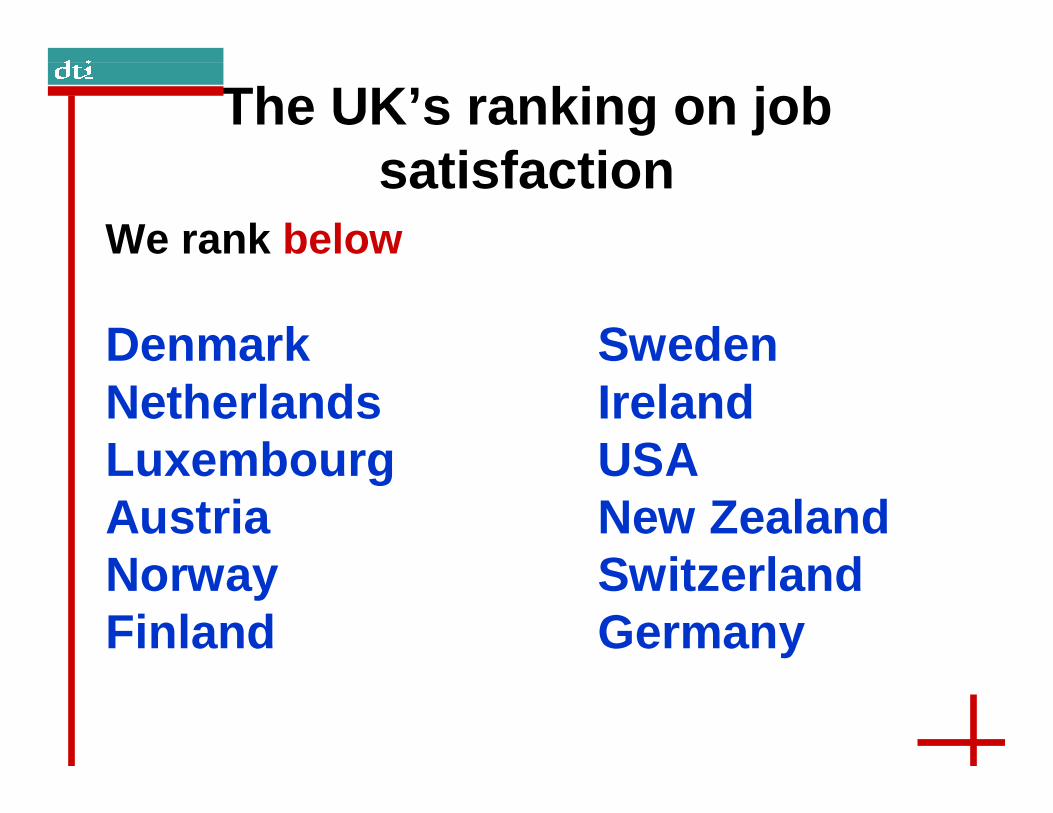
The UK’s ranking on job satisfaction
We rank below
Denmark SwedenNetherlands IrelandLuxembourg USAAustria New ZealandNorway SwitzerlandFinland Germany
New Perspectives on Job
A taste of well-being research (1)
Happiness is high among:
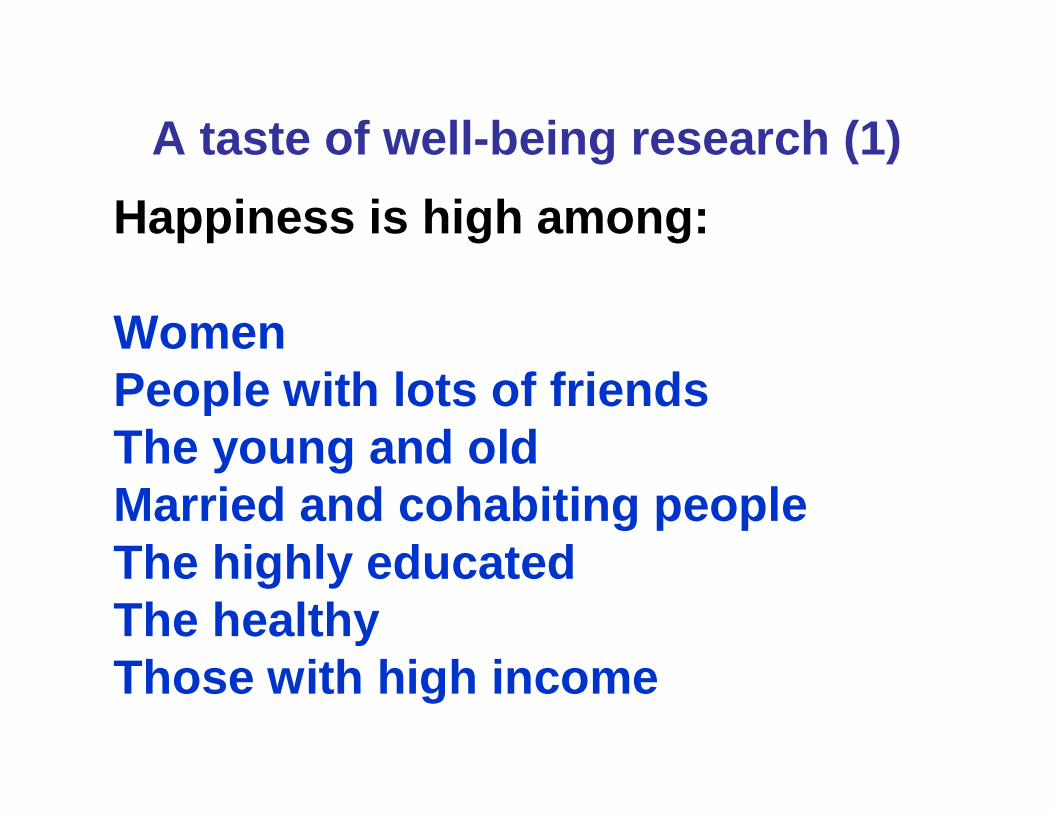
A taste of well-being research (1)
Happiness is high among:
WomenPeople with lots of friendsThe young and oldMarried and cohabiting peopleThe highly educatedThe healthyThose with high income
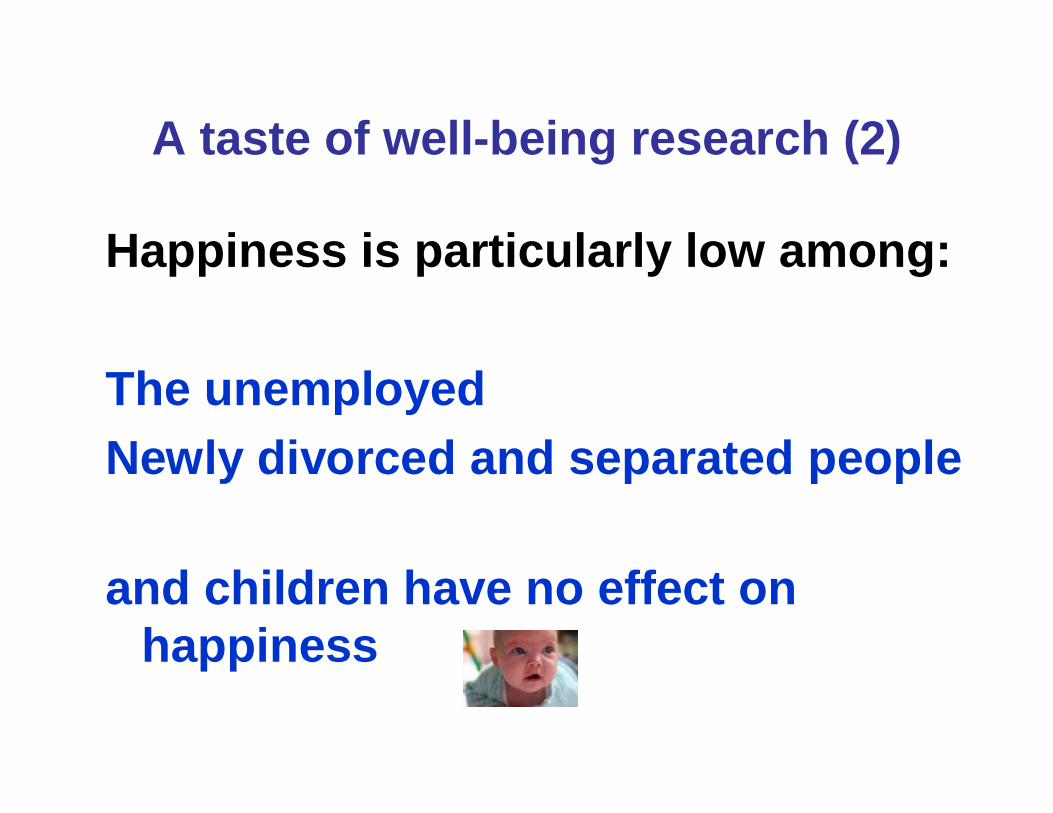
A taste of well-being research (2)
Happiness is particularly low among:
The unemployedNewly divorced and separated people
and children have no effect on happiness
Happiness is U-shaped through the life cycle
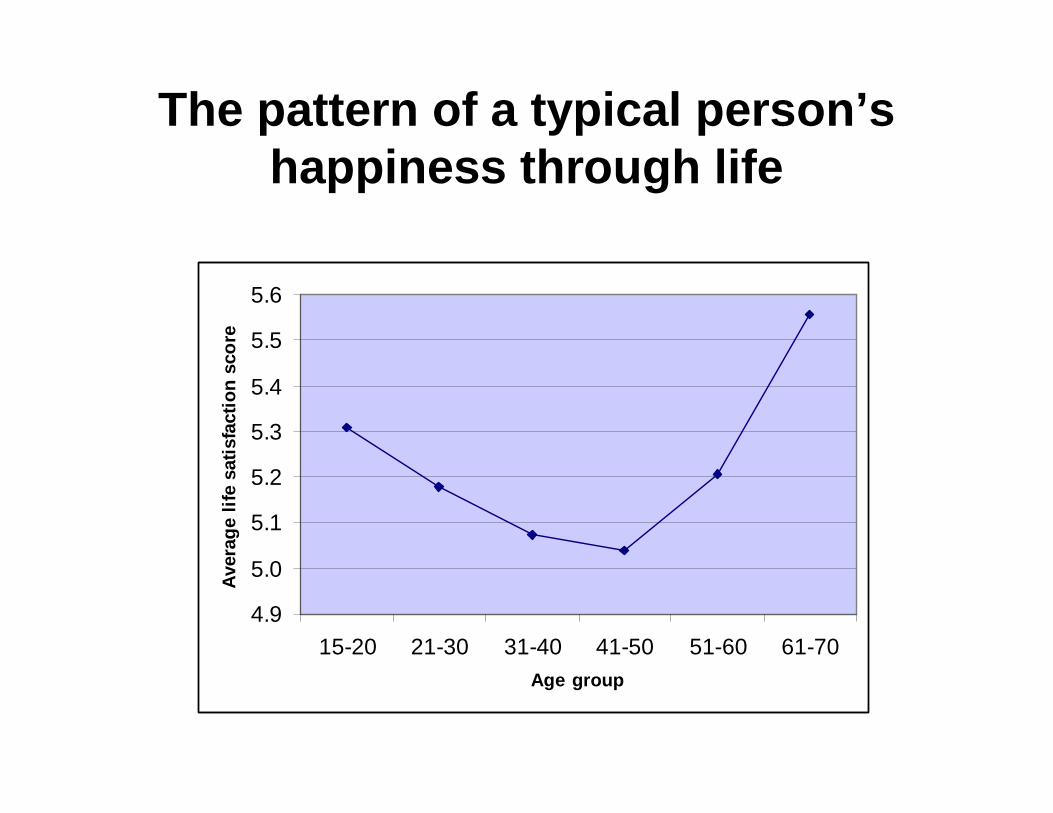
The pattern of a typical person’s happiness through life
4.9
5.0
5.1
5.2
5.3
5.4
5.5
5.6
15-20 21-30 31-40 41-50 51-60 61-70Age group
Ave
rage
life
sat
isfa
ctio
n sc
ore

This holds in many settings
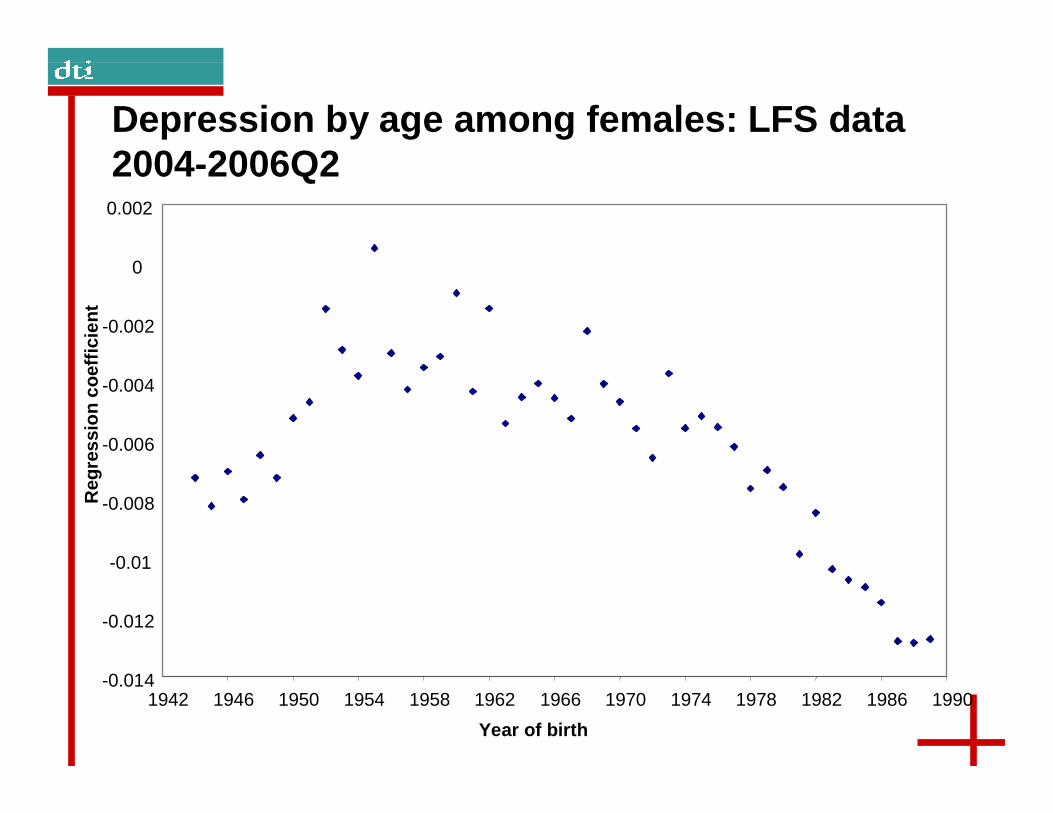
This holds in many settings
For example, we see the same age pattern in the probability of depression among a recent sample of 800,000 UK citizens:
[Blanchflower and Oswald, 2006]
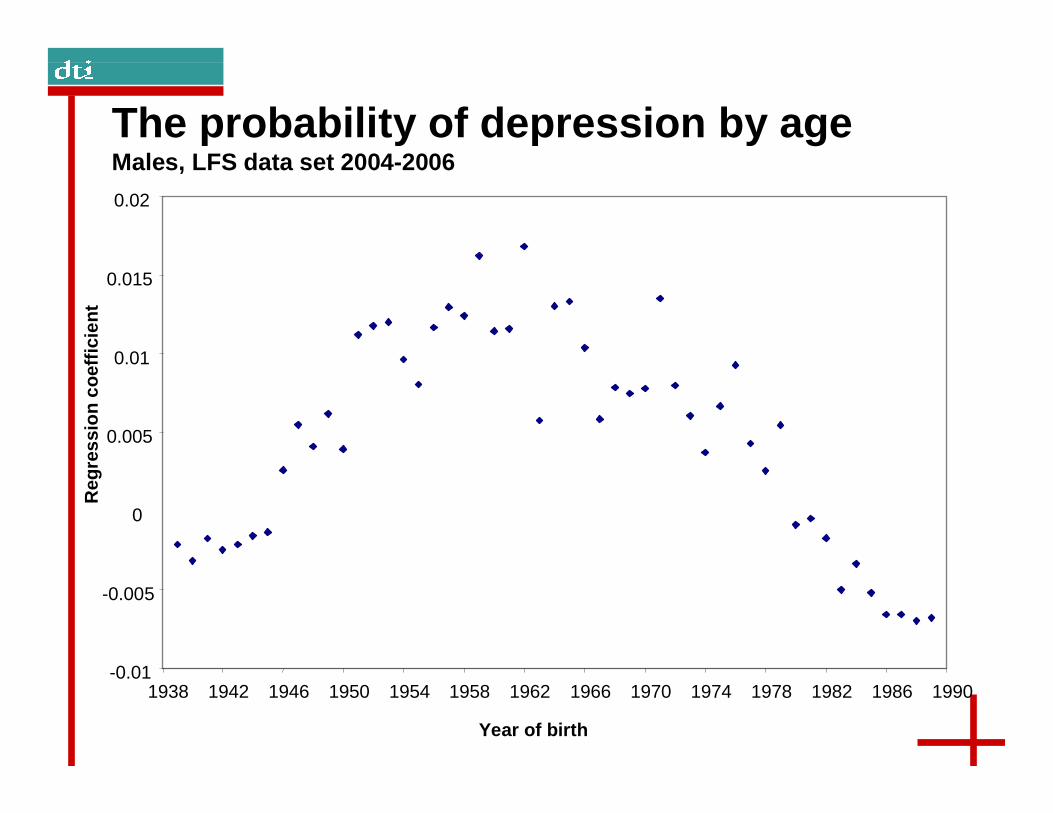
New Perspectives on Job The probability of depression by ageMales, LFS data set 2004-2006
-0.01
-0.005
0
0.005
0.01
0.015
0.02
1938 1942 1946 1950 1954 1958 1962 1966 1970 1974 1978 1982 1986 1990
Year of birth
Reg
ress
ion
coef
ficie
nt
New Perspectives on Job
-0.014
-0.012
-0.01
-0.008
-0.006
-0.004
-0.002
0
0.002
1942 1946 1950 1954 1958 1962 1966 1970 1974 1978 1982 1986 1990
Depression by age among females: LFS data 2004-2006Q2
Year of birth
Reg
ress
ion
coef
ficie
nt
In passing
In this data set, the probability of depression is lower among the better educated.

Now what about money?
Now what about money?
The data show that richer people are happier and healthier.
In the literature, one broad feature is striking:
The state of the mind determines the health of the body
The state of the mind determines the health of the body
Those with high status live longer(being promoted seems more important than a healthy diet and exercise)
Married people are healthier (marriage offsets smoking)

To the gentlemen:

To the gentlemen:
If you must smoke,
To the gentlemen:
If you must smoke,
it is essential to get married.

Another intriguing feature of the data:
Humans are adaptive.
They have amazing resilience: eg. to(i) divorce(ii) disability.
Comparing two years before divorce to two years after, there is marked improvement in psychological health.
We use a GHQ mental strain score.
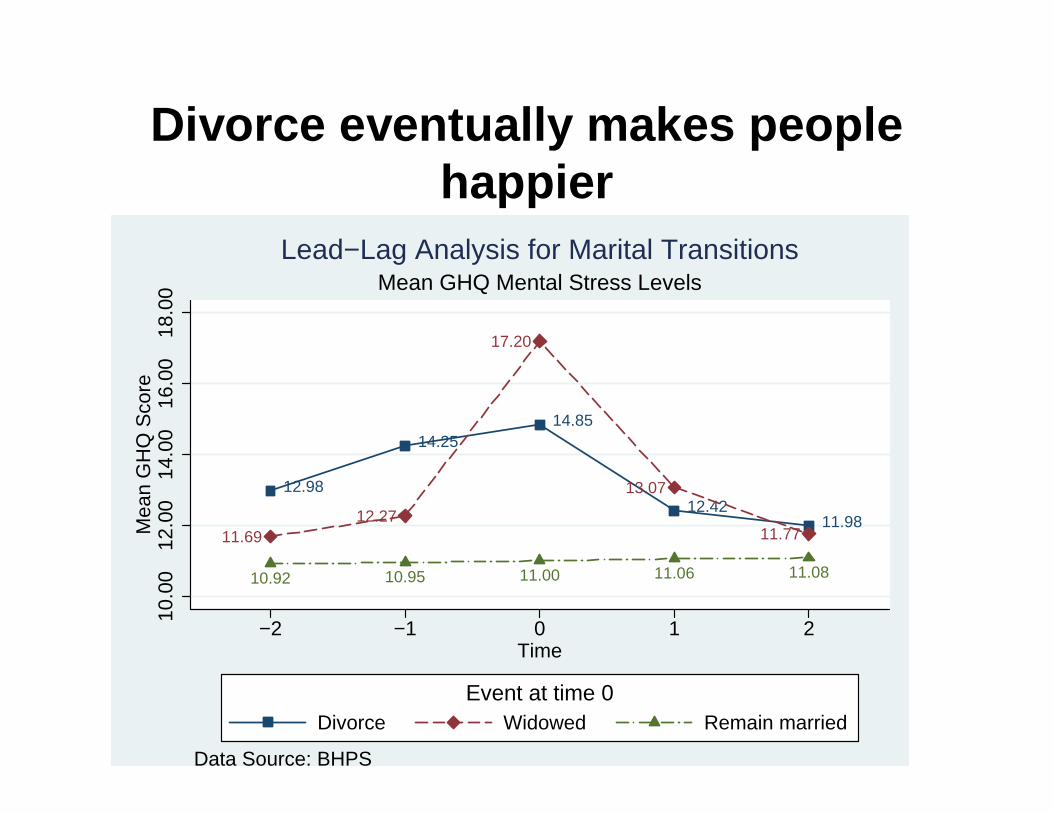
Divorce eventually makes people happier
12.98
14.2514.85
12.4211.98
11.6912.27
17.20
13.07
11.77
10.92 10.95 11.00 11.06 11.08
10.0
012
.00
14.0
016
.00
18.0
0M
ean
GH
Q S
core
−2 −1 0 1 2Time
Divorce Widowed Remain marriedEvent at time 0
Data Source: BHPS
Mean GHQ Mental Stress LevelsLead−Lag Analysis for Marital Transitions
Human beings also bounce back remarkably from, say, disability.
However, there is also a downside to that emotional adaptability
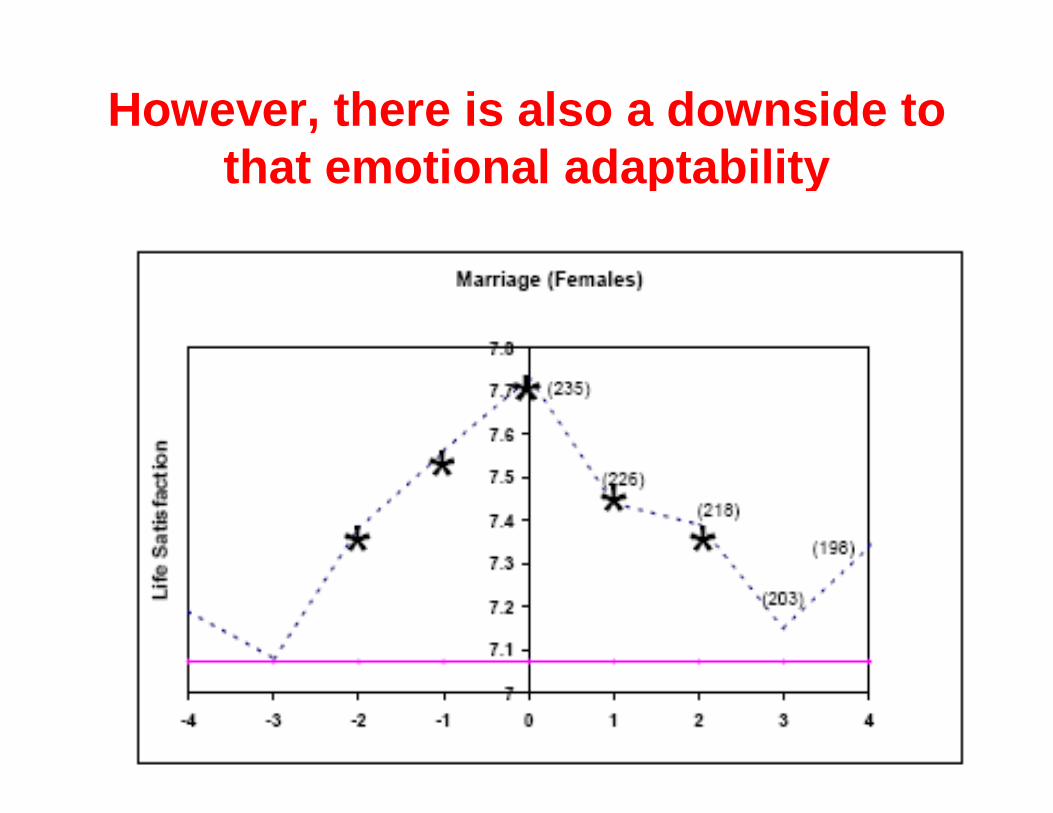
However, there is also a downside to that emotional adaptability
What about happiness in whole countries?
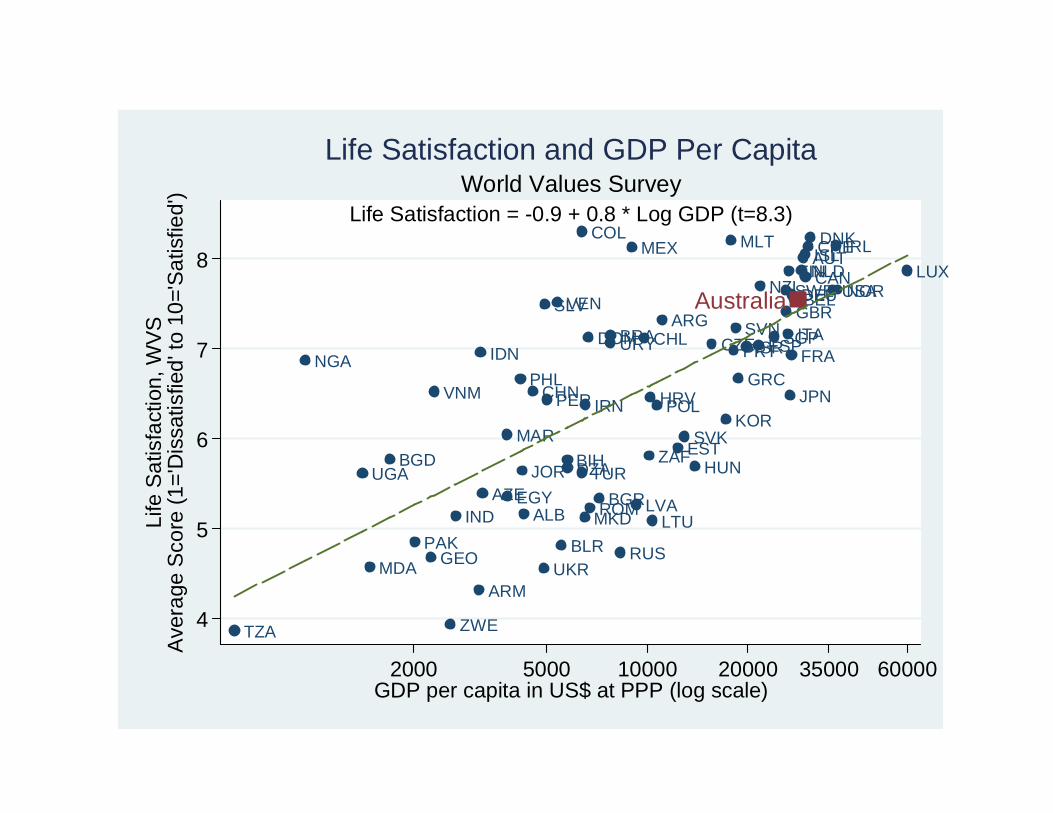
When a nation is poor, extra riches will raise happiness.
When a nation is poor, extra riches will raise happiness.
Say we look at a scatter plot across many countries:
TZA
NGA
UGA
MDA
BGD
PAKGEO
VNM
ZWE
IND
ARM
IDN
AZE
MAR
EGY
PHL
JOR
ALB
CHN
UKR
SLV
PER
VEN
BLR
BIHDZA
COL
TUR
MKD
IRN
DOM
ROMBGR
URYBRA
RUS
MEX
LVA
CHL
ZAF
HRV
LTU
POL
ARG
ESTSVK
HUN
CZE
KOR
MLT
PRTSVN
GRC
ISRESP
NZL
SGP
SWEGBRITA
FIN
JPN
FRA
DEUBEL
NLDAUTISLCAN
CHEDNK
USA
IRL
NORLUX
Australia
4
5
6
7
8
Life
Sat
isfa
ctio
n, W
VS
Ave
rage
Sco
re (
1='D
issa
tisfie
d' to
10=
'Sat
isfie
d')
2000 5000 10000 20000 35000 60000GDP per capita in US$ at PPP (log scale)
Life Satisfaction = -0.9 + 0.8 * Log GDP (t=8.3)World Values Survey
Life Satisfaction and GDP Per Capita
Yet
• Growth in income is now not correlated with growth in happiness
• This is the “Easterlin paradox”
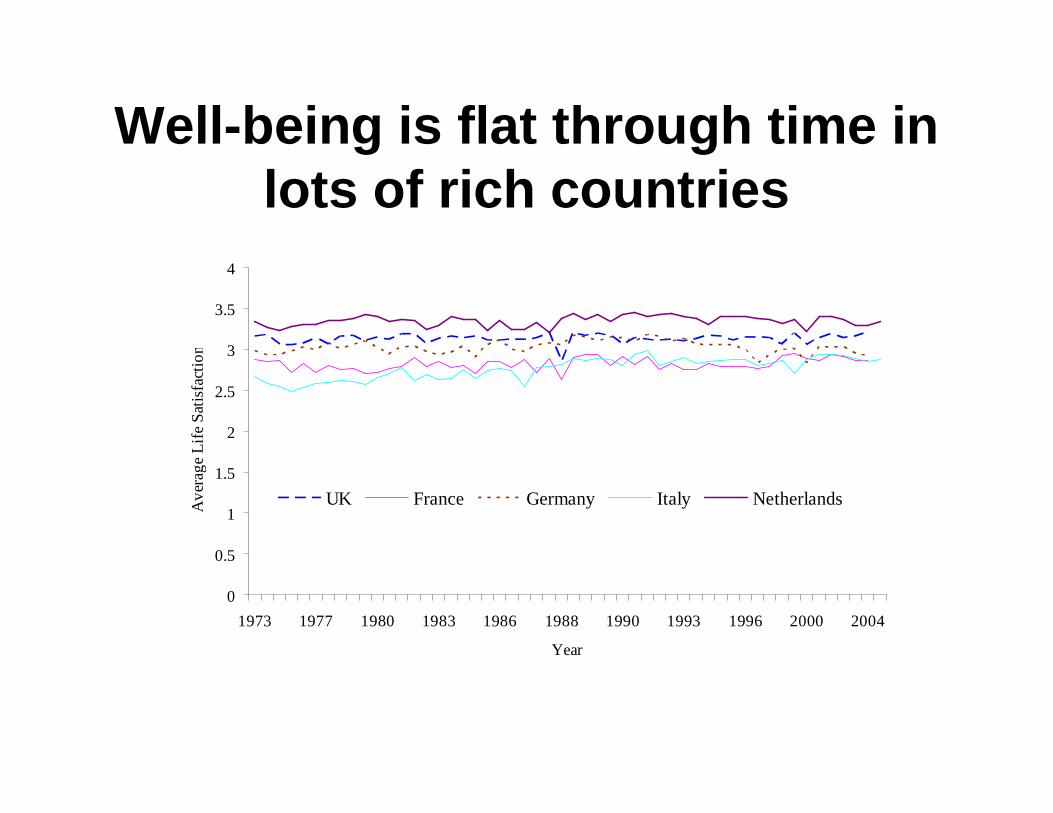
Well-being is flat through time in lots of rich countries
0
0.5
1
1.5
2
2.5
3
3.5
4
1973 1977 1980 1983 1986 1988 1990 1993 1996 2000 2004
Year
Ave
rag
e Li
fe S
atis
fact
ion
UK France Germany Italy Netherlands
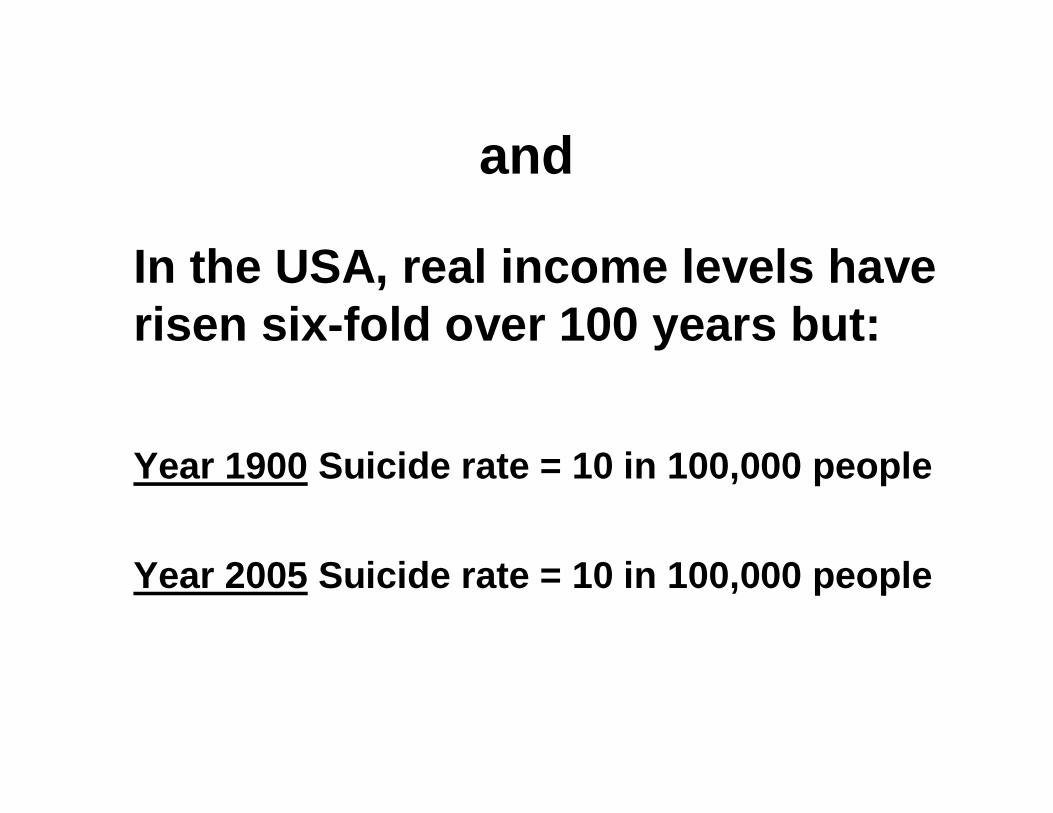
and
In the USA, real income levels have risen six-fold over 100 years but:
Year 1900 Suicide rate = 10 in 100,000 people
Year 2005 Suicide rate = 10 in 100,000 people
In the USA, both job satisfaction (scale 1-4) and happiness (scale 1-3) have been flat since 1972
New Perspectives on Job
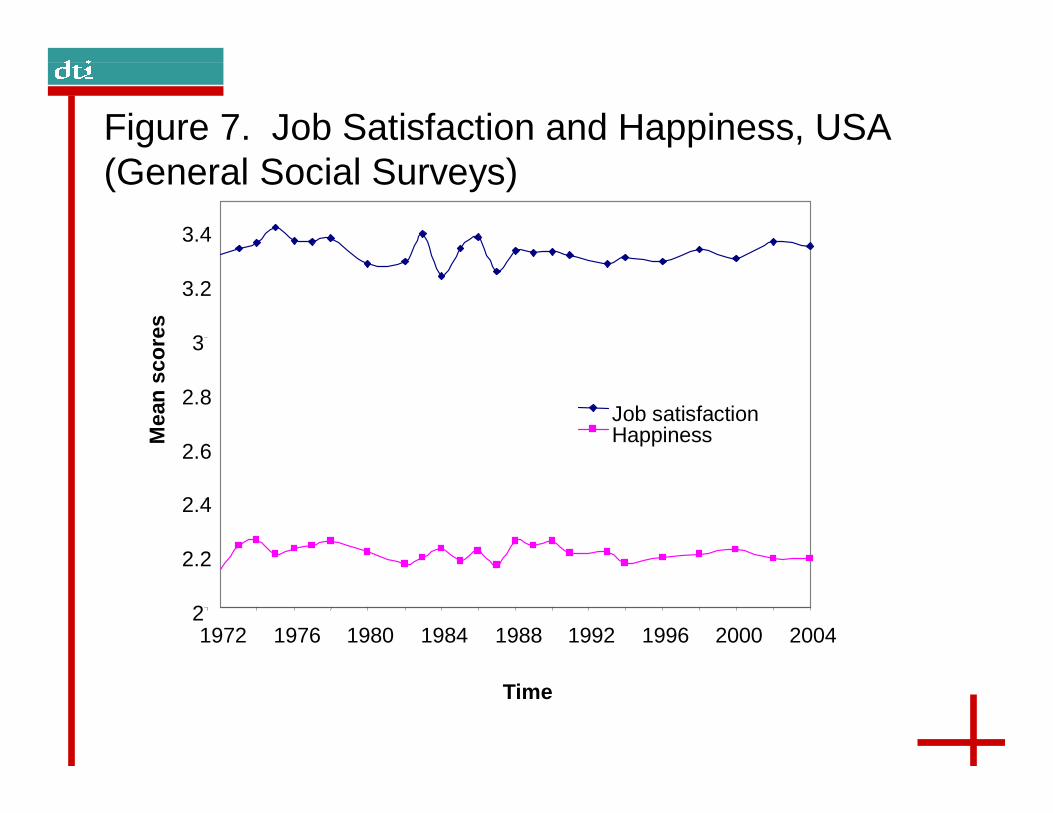
New Perspectives on Job Figure 7. Job Satisfaction and Happiness, USA (General Social Surveys)
2
2.2
2.4
2.6
2.8
3
3.2
3.4
1972 1976 1980 1984 1988 1992 1996 2000 2004
Time
Mea
n sc
ores
Job satisfactionHappiness
Are there diminishing returns to real income?
Very probably yes.
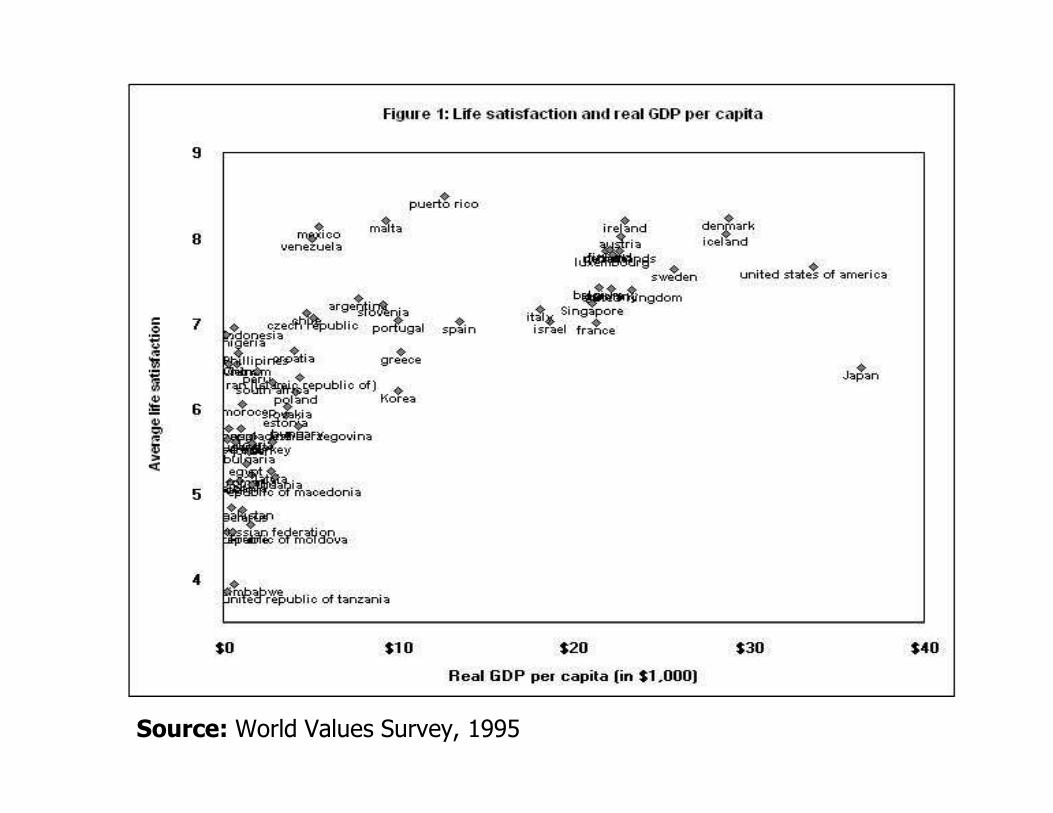
Source: World Values Survey, 1995
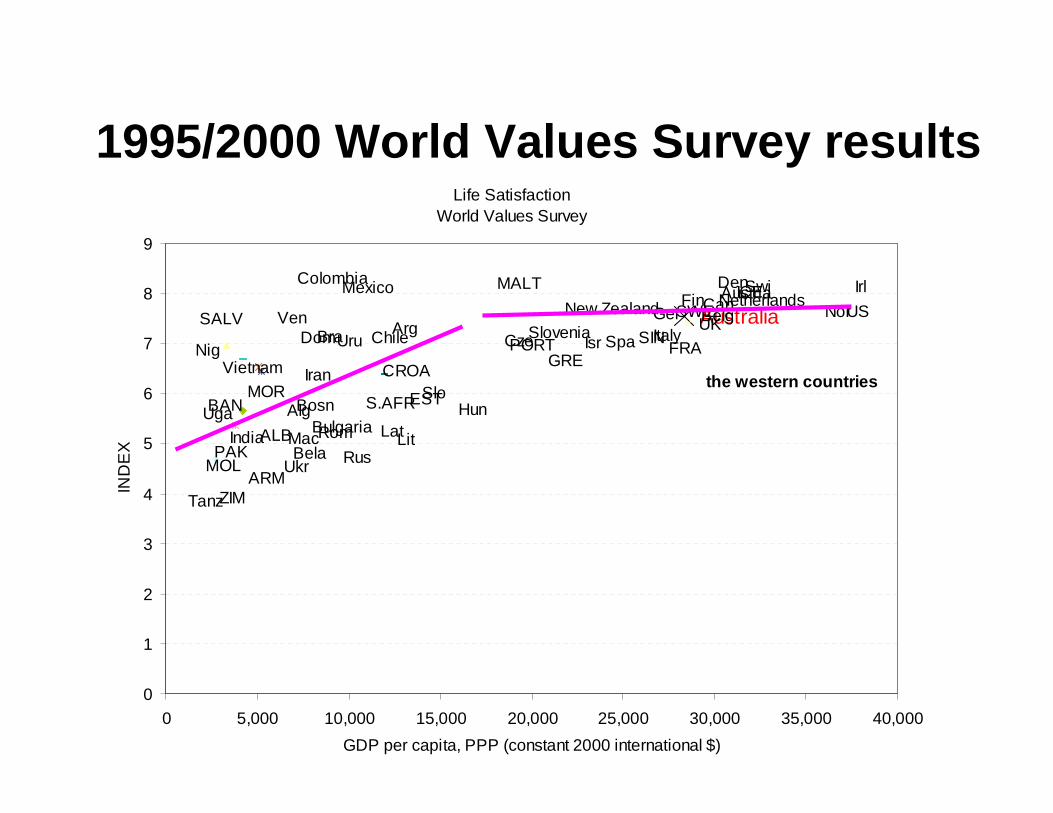
1995/2000 World Values Survey resultsLife Satisfaction
World Values Survey
Tanz
Nig
Uga
MOL
BAN
PAK
ZIM
Vietnam
India
MOR
ARM
ALB
SALV Ven
Ukr
Alg
MacBela
Bosn
Colombia
Dom
Iran
Bulgaria
Bra
Rom
Uru
Mexico
Rus
S.AFR
Chile
Lat
CROA
Arg
Lit
ESTSloHun
MALT
CzePORTSlovenia
GRE
New Zealand
Isr Spa SINGerItaly
FRA
SWEFin
Australia UKBelgCan
DenNetherlands Austria ICESwi
NorUS
Irl
0
1
2
3
4
5
6
7
8
9
0 5,000 10,000 15,000 20,000 25,000 30,000 35,000 40,000
GDP per capita, PPP (constant 2000 international $)
IND
EX
the western countries
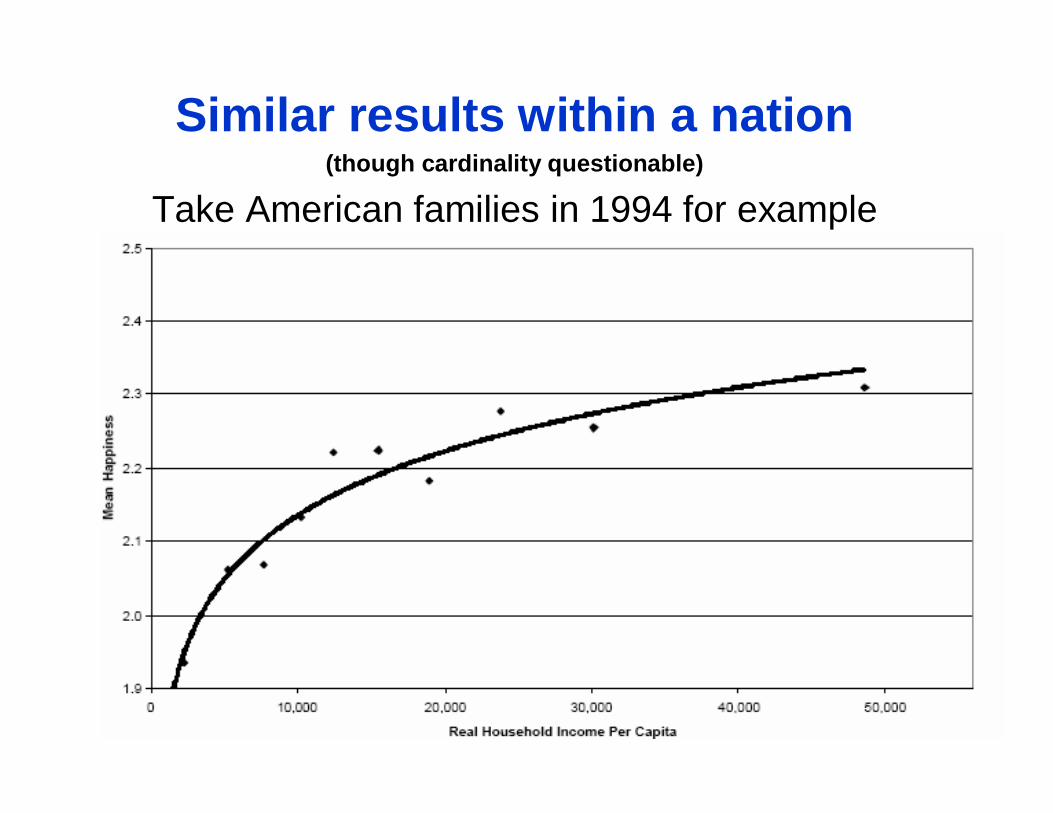
Similar results within a nation(though cardinality questionable)
Take American families in 1994 for example

So what exactly goes wrong when a wealthy country gets richer?
We are not certain, but..
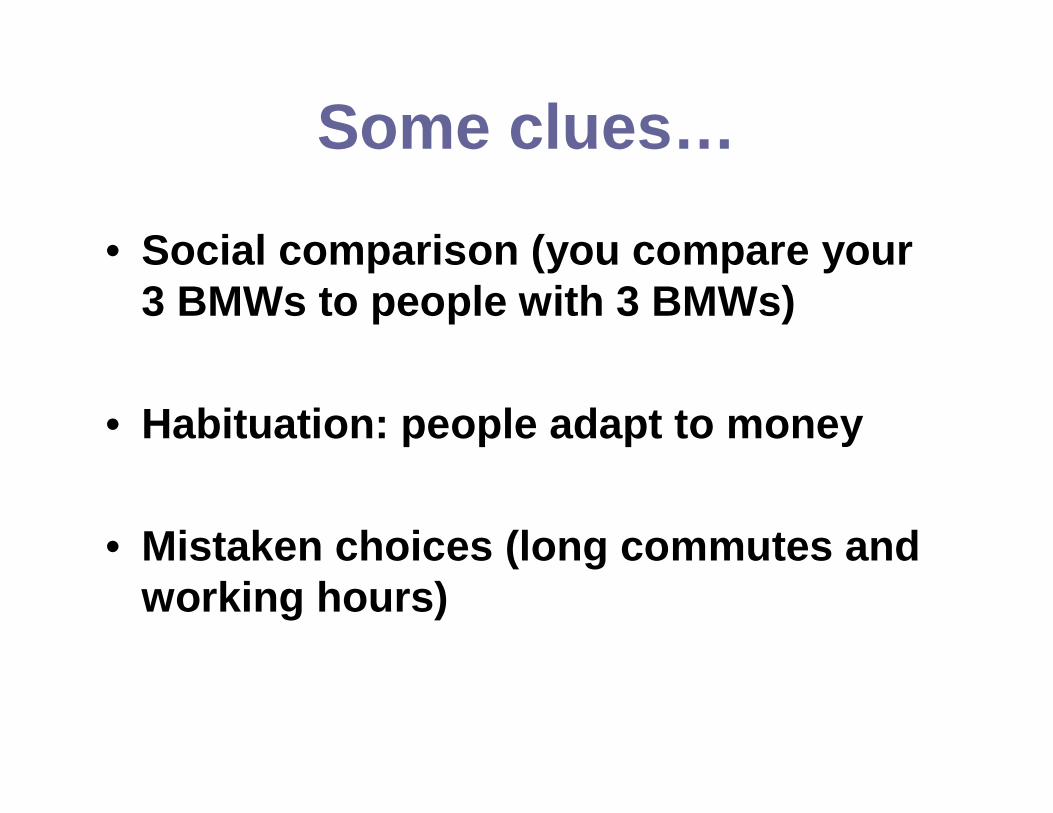
Some clues…
• Social comparison (you compare your 3 BMWs to people with 3 BMWs)
• Habituation: people adapt to money
• Mistaken choices (long commutes and working hours)
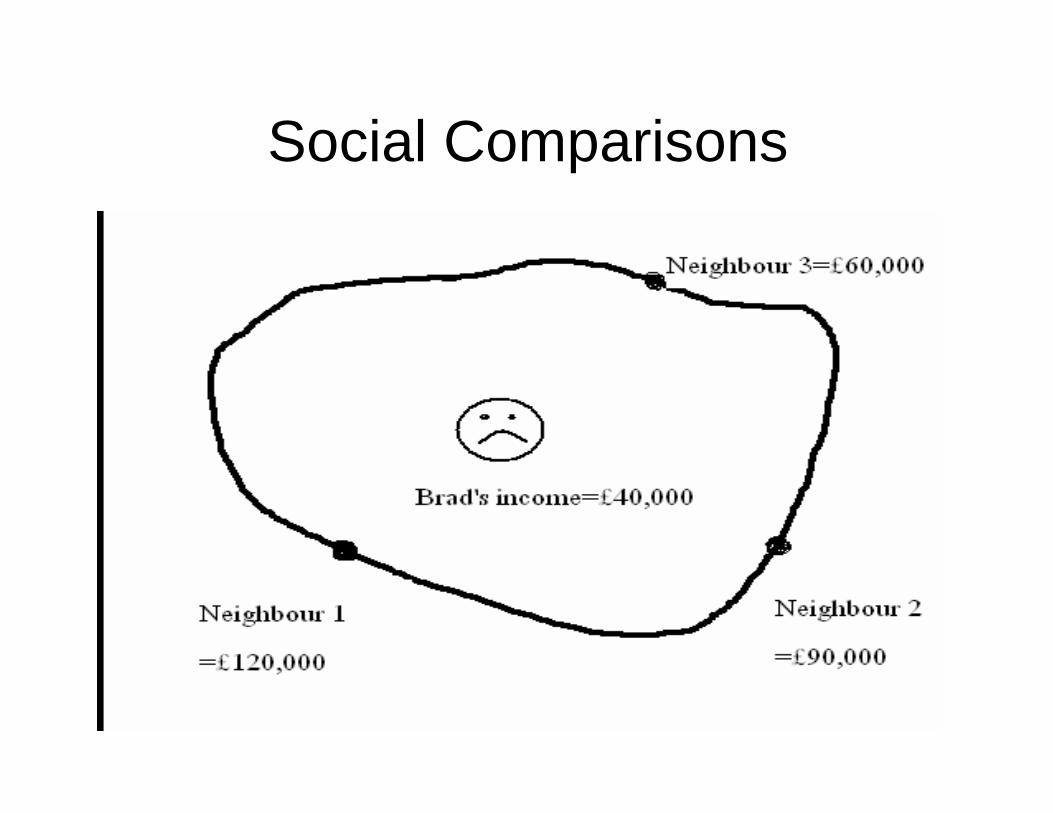
Social Comparisons
Producing a happier society?
Possible ideas
• Envy and social comparisons are counter-productive at the aggregate level
• Some argue for a ‘ corrective tax ’ system –one that reduces work effort to a level where the fruitless incentive to raise your relative income has been fully offset (Frank and Layard)
• In terms of positional goods, e.g. luxury cars – could be taxed much more
119
12
77
19
24 25
33
28
0%
5%
10%
15%
20%
25%
30%
35%
Sweden
Germany
France
UK EU15
Women
Men
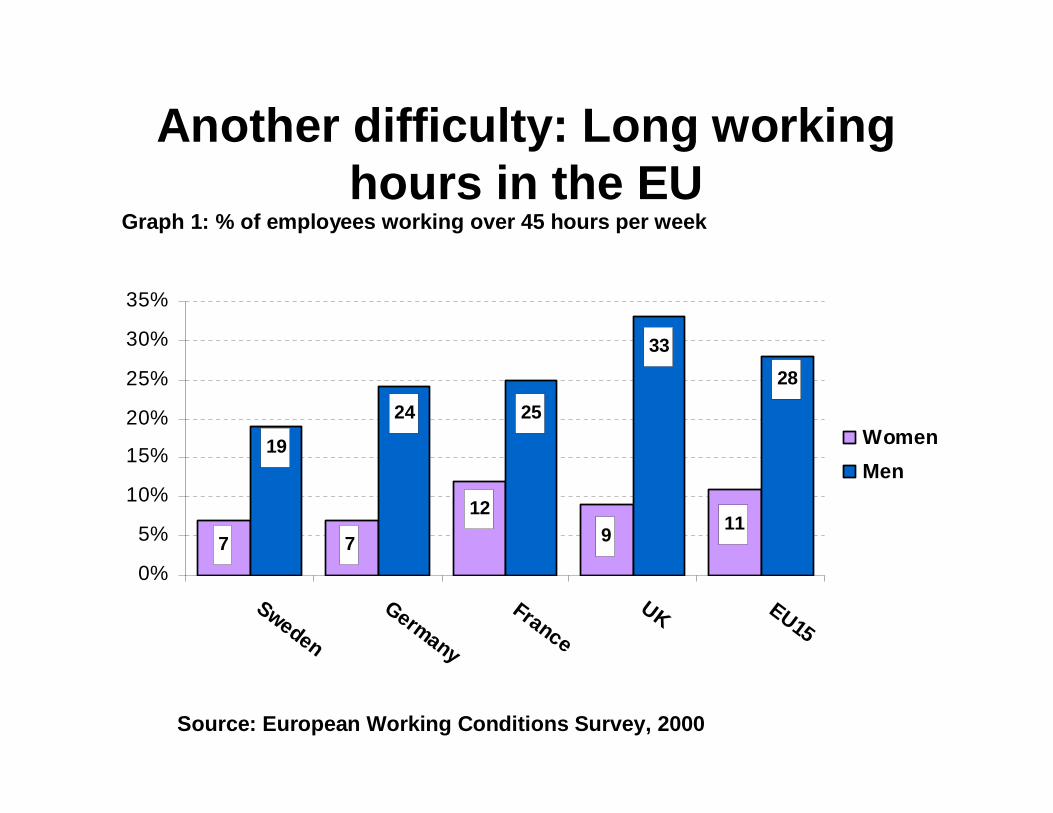
Another difficulty: Long working hours in the EU
Graph 1: % of employees working over 45 hours per w eek
Source: European Working Conditions Survey, 2000
Practical points
• Commuting takes a severe toll on people.
• A coordinated slowing-down would be valuable.
• Giving employees as much autonomy as possible is beneficial.
Summing up
Given our current real income levels:
Summing up
Given our current real income levels:
Growth is not making the industrialized nations happier.
There does seem evidence of a genuine work-life balance problem in modern society.
One natural conclusion
Policy in the coming century will need to concentrate on non-materialistic goals.
One natural conclusion
Policy in the coming century will need to concentrate on non-materialistic goals.
GNH not GNP.

Thank you for coming
Work-Life Balance and Happiness
Papers downloadable at www.andrewoswald.com
I here owe a great debt to the work of David G Blanchflower, Paul Frijters, Nick Powdthavee, and Justin Wolfers