Embed Size (px)
Citation preview
DI
SC
US
SI
ON
P
AP
ER
S
ER
IE
S
Forschungsinstitut zur Zukunft der ArbeitInstitute for the Study of Labor
Work and Money:Payoffs by Ethnic Identity and Gender
IZA DP No. 4275
July 2009
Amelie F. ConstantKlaus F. Zimmermann
Work and Money:
Payoffs by Ethnic Identity and Gender
Amelie F. Constant DIW DC, George Washington University and IZA
Klaus F. Zimmermann
IZA, DIW Berlin and Bonn University
Discussion Paper No. 4275 July 2009
IZA
P.O. Box 7240 53072 Bonn
Germany
Phone: +49-228-3894-0 Fax: +49-228-3894-180
E-mail: [email protected]
Any opinions expressed here are those of the author(s) and not those of IZA. Research published in this series may include views on policy, but the institute itself takes no institutional policy positions. The Institute for the Study of Labor (IZA) in Bonn is a local and virtual international research center and a place of communication between science, politics and business. IZA is an independent nonprofit organization supported by Deutsche Post Foundation. The center is associated with the University of Bonn and offers a stimulating research environment through its international network, workshops and conferences, data service, project support, research visits and doctoral program. IZA engages in (i) original and internationally competitive research in all fields of labor economics, (ii) development of policy concepts, and (iii) dissemination of research results and concepts to the interested public. IZA Discussion Papers often represent preliminary work and are circulated to encourage discussion. Citation of such a paper should account for its provisional character. A revised version may be available directly from the author.

IZA Discussion Paper No. 4275 July 2009
ABSTRACT
Work and Money: Payoffs by Ethnic Identity and Gender*
Upon arrival in the host country, immigrants undergo a fundamental identity crisis. Their ethnic identity being questioned, they can be classified into four states – assimilation, integration, separation and marginalization. This is suggested by the ethnosizer, a newly established measure to parameterize a person’s ethnic identity, using individual information on language, culture, societal interaction, history of migration, and ethnic self-identification. In what state individuals end up varies among immigrants even from the same country. Moreover, the quest for ethnic identity affects women and men differentially. This paper contends that ethnic identity can significantly affect the attachment to and performance of immigrants in the host country labor market, beyond human capital and ethnic origin characteristics. Empirical estimates for immigrants in Germany show that ethnic identity is important for the decision to work and significantly and differentially affects the labor force participation of men and women. Women who exhibit the integrated identity are more likely to work than women who are German assimilated; this does not hold for men. However, once we control for selection in the labor market and a slew of individual and labor market characteristics, ethnic identity does not significantly affect the earnings of men or women immigrant workers. JEL Classification: F22, J15, J16, Z10 Keywords: ethnosizer, ethnicity, ethnic identity, immigrant assimilation, integration,
ethnic earnings Corresponding author: Klaus F. Zimmermann IZA P.O. Box 7240 D-53072 Bonn Germany E-mail: [email protected]
* Financial support from Volkswagen Foundation for the IZA project on “The Economics and Persistence of Migrant Ethnicity” is gratefully acknowledged. We thank all participants of the Annual Migration Meeting 2007, especially Steve Trejo, Barry Chiswick, Carmel Chiswick, and Willie Jasso for useful comments on previous versions of the paper.
3
“As someone married to an immigrant, I am reminded every day by my wife of how you can love your roots and love your heritage; even as you fulfill the full measure of your love of this country, and your loyalty as a United States citizen.” Senator John Kerry
1. Introduction
It is undisputed that immigrants today experience high unemployment, low employment rates,
and earn less than natives in many countries, but there are also substantial differences between
ethnic groups. While differences in the labor market attachment and performance of
immigrants can be partially explained by human capital, time spent in the host country and
other demographics, there is still a native-immigrant gap and ethnic differences that remain to
be explained. While the country of origin or ethnicity can often explain some of the
differentials, the question remains: can economists do better in the estimation of work
participation and immigrant wages and the explanation of disparities? Could there be another
characteristic that affects how immigrants fare in the labor market of the host country? In this
paper, we propose to utilize the concept of ethnic identity, a complex multidimensional concept
that keeps evolving. We conjecture that the intensity of the ethnic attachments to the host and
home cultures is able to capture some more of the observed differences in economic
performance between ethnic groups.
Immigrants are bound to experience a severe cultural shock upon arrival in the host
country, either consciously or subconsciously. Usually, immigrants come from countries where
they are the majority or “mainstream” society and they de facto become the minority group in
the host country. Their struggle centers upon the following contemplations: (i) do we keep our
ethnic identity, remain true to our heritage and continue practice our own culture, (ii) do we
completely abandon our ethnicity and culture and become identical to natives, (iii) do we give
up on having any identity since we cannot keep our own in a foreign country but we cannot
assimilate either, or (iv) can we find a happy medium to “fit” into the new society without
“betraying” our own? Following our earlier research, we call these four states separation,
assimilation, marginalization and integration, respectively. These multidimensional identity
4
states are quantified and classified as the two-dimensional ethnosizer.1 The state individuals
end up varies among immigrants who come from the same country (Constant, Gataullina and
Zimmermann, 2009). The ethnosizer is a two-dimensional measure of the intensity of an
immigrant’s ethnic identity. We define the word ethnosize as containing a higher quantity of
commitment to, devotion to, or self-identification with one’s own ethnicity.
Akerlof and Kranton (2000) argue that because identity is fundamental to behavior,
choice of identity may be the most important “economic” decision people make. So individuals
may - more or less consciously - choose who they want to be. Also people belonging to poor,
socially excluded groups will choose their identity.
The few previous economic studies that look at ethnic identity find that the ethnosizer
mainly depends on pre-migration characteristics, is de facto independent of measured
economic activity and significantly affects economic outcomes (Constant and Zimmermann,
2008). Related literature studying the evolution of culture and ethnic identity and its role on
economic outcomes includes Ottaviano and Peri (2006) and Guiso, Sapienza, and Zingales
(2006), who deal with the mixed impact of culture; theories of ethnic identity (Kuran, 1998;
Fearon and Laitin, 2000; Darity, Mason, and Stewart, 2006; Austen-Smith and Fryer, 2005;
Chiswick, 2009; Battu, McDonald and Zenou, 2007); and empirical studies (Montgomery,
1991; Mason, 2004; Aguilera and Massey, 2003; Bisin, Patacchini, Verdier, and Zenou, 2006,
2008) provide a better understanding of societal and economic behavior.
Using the ethnosizer and data from the German Socio-Economic Panel (GSOEP),
studies have found that its impact on homeownership is statistically significant and
economically strong, namely, assimilated and integrated immigrants move up to
homeownership (Constant, Roberts, and Zimmermann, 2009). The clash of religions in the
ethnosizing process is not supported, as there are not any significant differences between
Muslims and Christians in their integration, assimilation, or separation although there is a
marginal significance in marginalization (Constant, Zimmermann, and Zimmermann, 2009).
Zimmermann (2007a, 2007b) and a special issue of the Journal of Population Economics
(volume 20, issue 3, 2007) document the rising interest of economists into the field of ethnicity
and identity.
In this paper we extend previous research on the earnings of immigrants by arguing that
the evolution of ethnic identity after immigration may affect the labor market behavior of
1 Constant and Zimmermann (2008) accommodate more possibilities that the ethnosizer can have, including negative dimensions such as subversion.

5
immigrants and their earnings. The effect of ethnic identity on labor market performance may
also differ by gender. We perceive and define the ethnic identity of immigrants as the balance
between the commitment to or self-identification with the culture and society of the origin and
the commitment to or self-identification with the host culture and society. While all individuals
have an ethnic identity before they migrate, our definition becomes relevant after immigration
in the host country.
Our empirical analysis employs data from the GSOEP that contains all necessary
questions about the ethnic identity of immigrants. To estimate the effect of the two-
dimensional ethnosizer on the earnings of immigrant men and women we employ Heckman
selection models separately for men and women.
We proceed by introducing the essence and construction of the ethnosizer and outlining
our hypotheses. In the section after we describe the data and variables. We continue with
summary statistics on our subsamples, which are followed by the presentation and discussion
of the empirical results. At the end, we summarize our study and draw conclusions.
2. The Ethnosizer
2.1. Essence and Construction2
We define ethnicity to be the same as ethnic origin, or country of origin or nationality. This
definition is closely related to the one used by the 2006 Conference of European Statisticians
for the United Nations Economic Commission for Europe (UNECE): “Ethnicity is based on a
shared understanding of the history and territorial origins (regional, national) of an ethnic
group or community as well as on particular cultural characteristics: language and/or religion
and/or specific customs and ways of life” (UNECE 2006: 100). As such, ethnicity is more
related to the roots of peoples, their ancestry, the actual territory and physical boundaries of a
country. The key here is the group, a shared sense of peoplehood and not the individual.3
Ethnicity is therefore a demographic and permanent characteristic and a static concept. While
ethnicity denotes some general characteristics that all individuals who come from the same
2 For more information on the ethnosizer see Constant, Gataullina and Zimmermann (2009). 3 The word “Ethnicity,” derived from the Greek word ethnos, denotes the ethnic origin of peoples, that is, the country they were born in, while it often also indicates the nationality of peoples; it can refer to a group of people that lives inside a host country (enclave) as well.
6
country share, it also captures a variety of important macro factors of the country of origin and
other institutional and political conditions, as well as diplomatic relations with the host
country. In stark distinction, “identity” attempts to measure how people perceive themselves
rather than their ancestors. Our definition of ethnic identity pertains to the individual. We
perceive the ethnic identity of an immigrant as an achieved balance between attachment and
affinity to the culture and society of the country of origin and to the culture and society of the
host country (Constant, Gataullina and Zimmermann, 2009; Berry, 1980). Ethnic identity is
therefore a complex concept that is, in principle, evolving over time. When quantified,
individuals from the same country could have an equal, stronger or looser ethnic identity than
other co-ethnics. At the same time, it is possible that individuals from different ethnicities have
the same intensity of ethnic identity. On top of that, ethnic identity could vary between men
and women.
To measure such a complex concept, we borrow established findings from earlier
research in psychology and sociology. We choose five essential elements of cultural and
societal commitment that compose the ethnic identity. These elements pertain to both the
country of origin and the host country and give us a multidimensional view. They are: (i)
language; (ii) visible cultural elements; iii) ethnic self-identification; (iv) ethnic interactions
with natives; and (v) future citizenship and locational plans (Constant, Gataullina and
Zimmermann, 2009).
Further, we use individual data on each of the selected five aspects or indicators of
ethnic identity to classify a person as integrated, assimilated, separated or marginalized within
a given sphere of social and cultural commitment. In some cases, individuals may be classified
clearly with one concept, in other cases not at all. In most cases, people will fall in several
different regimes at the same time. This is real life: These observations proxy the uncertainty
we have to classify at this level of a two-dimensional ethnicity.
For example, with respect to the element language, we sort individuals into four states
or regimes of identity: (i) linguistically integrated, if they speak both the host country language
and the language of origin well or very well; (ii) linguistically assimilated, if their command of
the host country language is far more superior to the command of the native language; (iii)
linguistically separated, if they are fluent in the mother tongue but have not been very
successful in learning or improving their host country language skills; and (iv) linguistically
marginalized when their communication skills are hindered by the lack of fluency in either of
7
the two languages.4 A similar classification into four states is conducted for each of the
remaining four elements of social and cultural commitments.
Using the GSOEP, we then pair selected questions that convey information on each of
these five aspects of commitment to both the German culture and society and the culture of the
home country. For instance, we are able to evaluate each respondent’s fluency in German and
in the language of origin, strength of self-identification with Germany and with the home
country, the origin of the preferred food, music and mass media, and also one’s plans on
acquiring German citizenship or returning back to the home country.
Classifying immigrants into four states of ethnic identity within each of the five
elements of ethnic identity, we find that it is practically impossible to clear cut individuals’
cultural and social commitments. For example, an immigrant may be linguistically integrated
and at the same time be separated in the cultural elements. Or, while an immigrant may be
linguistically separated, he or she may be assimilated with respect to future plans; that is, plan
to stay in the host country forever, rather than returning to the home country.
To proceed further with our analysis of the effects of ethnic identity on immigrants’
earnings and to be able to generalize our findings, we sum up the number of times each
individual respondent has been classified into one of the four types of ethnic identity across the
five elements and generate four scores of ethnic identity for each possible category of cultural
and social commitments. Accordingly, integration is the number of times a person is assigned
to be integrated; Assimilation is the number of times a person is classified as assimilated;
Separation is the number of times an immigrant is categorized as separated; And finally,
marginalization is how many times a respondent is assigned to be marginalized in all five
aspects of social and cultural commitments.
To make it more understandable, assume an imaginary immigrant in Germany who i)
speaks German and the mother tongue very well; ii) listens to German music and eats food
specific to the country of origin; iii) identifies strongly only with the home country; iv) has
both German friends and friends of the same ethnic origin; and v) plans to stay in Germany
forever. Accordingly, this imaginary immigrant would score two in integration, two in
separation, one in assimilation and zero in marginalization. In general, the value of each of the
four scores varies between zero and five, and the values across the four scores per each
4 Note also, that immigrants from different countries of origin can be classified as linguistically assimilated if they all speak German fluently, albeit they have different mother tongues.

8
individual observation add up to five. This implies that we have to suppress one of the four
scores or regimes in the regression if a constant is included.
2.2. Hypotheses and Importance of the Ethnosizer
It is important to measure the strength of ethnic identity. Nowadays, economists recognize
more often that the beliefs people value and invest in may have important economic
implications (Becker, 1996). To the extent that culture, self-perception and self-identification
influence views and behaviors and especially the decision-making of economic agents, we
contend that the ethnic identity of immigrants plays a significant role on the labor market
attachment and payoffs of both men and women immigrants, albeit with significant differences
between men and women. That is, if people have the “right” personality or the “right” identity
they may get ahead of others in life.5
The fact that many migrants possess distinct culture-specific human capital that can be
of high value in increasingly globalized societies and economies is backed by research that
emphasizes the indisputable value of ethnic diversity (Ottaviano and Peri, 2006). Immigrants,
independent of their country of origin, indisputably possess skills specific to their culture of
origin, something unique and different that natives do not have. If diversity reflects talent and
ethnic characteristics are relatively scarce, in a functioning labor market migrants are needed
because they are different. In the case of a homogeneous population, there is always the risk of
lost creativity. In fact, a pluralistic society’s goal of assimilation is not to erode all ethnic
distinctions, but rather to increase the common culture and economic opportunities shared by
all groups. There are costs and benefits associated with this cultural capital embodied in
immigrants. In the production process, when immigrants and natives are complements to each
other, we can have a win-win situation; immigrants and natives can profit and the economy and
society can benefit from greater prosperity.
In ethnic-specialized market sectors, immigrants exhibit a potential advantage over
natives as they fit in and have the best match for their human capital. Accordingly, ethnic
diversity appears to raise the growth of an economy overall, even when considering any
5 We know, for example, that preferences affecting earnings, efficacy and other psychological aspects of individuals are significant influencers of earnings (Bowles, Gintis and Osborne, 2001). Moreover, cultural hypotheses are economically important for fundamental economic issues like national rates of saving (Guiso, Sapienza and Zingales, 2006). Beliefs that people value and invest in have important economic implications (Bénabou and Tirole, 2007).
9
negative consequences that may arise. Diversity has more potential to produce and increase
output than harm the economy. This is why immigrants may seem to have a potential
advantage over natives in a market sector specializing in ethnic-specific goods and services.
Policies that welcome ethnic diversity within the larger society without encouraging separation
would be desirable. A genuinely inclusive policy of multiculturalism would also be beneficial
(Chiswick, 2009). The process of assimilation and integration as immigrants experience it is
therefore of key importance for their socioeconomic success.
We conjecture that immigrants who score highly in the integration state have the
greatest potential for being employed in the labor market of the host country and are rewarded
the highest. These individuals possess the broadest set of knowledge and skills, they peacefully
and harmoniously combine both cultures, and are open to all possibilities; they can work in the
“national” market but also in the “enclave” market. Using the metaphor of the well-known
Venn diagram, integration is the entire area within the two circles - the union of the two. While
assimilated immigrants have a significant potential for employment in the host country with
high monetary awards, this potential is not as large as that of integrated immigrants, because
the human capital of assimilated individuals is restricted to skills and knowledge specific to the
host society only. By being similar or identical to natives, these individuals are confined to the
local “national” market, heavily compete with natives and have no access to the job
opportunities in the enclave. In terms of the Venn diagram this will be the overlapping area or
the intersection of the two sets.
Separation hinders the immigrants’ entrance to the mainstream job market in the host
country, but offers opportunities for employment in the ethnic-specific job market with limited
monetary rewards. By definition, the enclave market should be much smaller than the
mainstream national market. Individuals who are confined to work and live in enclaves will
suffer from direct competition from other co-ethnics, resulting in lower employment
probabilities and earnings.6 Individuals who find themselves in the state of marginalization
lack the necessary human capital to work in the host country. This state impedes access to both
the general and ethnic-specific job market, since marginalized immigrants are detached from
both societies with severe detrimental impact on their labor market attachment and earnings.
Within these hypotheses, we expect to find differences specific to the gender of
immigrants. For example, it could be that assimilation is the best state for men to succeed, but 6 Exceptions include the successful entrepreneur who flourishes while being isolated from the “mainstream” labor market, such as a Chinese restaurant owner in Chinatown. Another exception to the negative impact that separation and enclave living have on economic success is the Amish in the US.

10
not for women. Or, it could be that for women, integration is a better state than assimilation.
For instance, Lewin (2001) finds that the identity crisis among Iranian women in Sweden is
less grave and deep than it is among men; Iranian women have a positive stance towards the
Swedish society and an increased desire for integration in the new country.
3. Data, Model, and Sample Characteristics
3.1. Dataset
The empirical estimation is based on the German Socio-Economic Panel, an ongoing survey of
nationally representative samples of native Germans and immigrants collected since 1984. The
largest compilation of questions addressing the issues of ethnic identity that are vital to our
analysis was asked in the 2001 wave. If some particular piece of information was not available
in 2001, we retrieve that piece of information from the 2000 or 2002 waves. We limit our
sample to male and female respondents who are 18 to 64 years old and who are not in school or
training. We also exclude the self-employed, as they have different payoffs.
Deleting missing values in all relevant variables, we end up with 1,101 immigrants, out
of whom 543 are men and 558 are women. The immigrant subsample consists of non German-
born individuals, the majority of whom arrived in Germany under the guestworker regime. By
ethnicity, our sample is composed as follows: 404 (37 percent) are from Turkey, 207 (19
percent) are from the former Yugoslavia, 82 (7 percent) are from Greece, 152 (14 percent) are
from Italy, 43 (4 percent) are from Spain, and 213 (19 percent) are from other countries.
3.2. Model
We study the data in two steps. First, we analyze the determinants of the probability to work
using the probit model depending on regressors including and not including the ethnosizer, our
set of indicators measuring ethnic identity, separated by gender. In a second step, and based on
the respective probit selection equation, we estimate Heckman corrected OLS earnings
regressions again using regressors including and not including the ethnosizer. Comparing
regression results with and without the ethnosizer allows us to identify at which stage and with
11
which pattern ethnic identity matters for the economic behavior of both sexes.7 The standard
errors of all estimates are corrected for heteroscedasticity. Identification results from functional
form and various exclusion restrictions explained below.
The dependent variable in the work participation or selection estimation is a dummy
variable that denotes the respondent’s labor force participation status. The independent
variables here are assumed to have differential impacts on the decision to work. They are
classified in the following categories: pre-migration characteristics (ethnicity - measured by
country of origin - religion, and schooling in the home country); post-migration characteristics
(age, marital status, children, health status, schooling in Germany, and exposure to Germany);
macroeconomic indicators (live in a large city); labor force participation identifiers (non-labor
income); and the ethnosizer (integration, assimilation, separation, and marginalization). Note
that while the ethnosizer measures the intensity of ethnic identity, country of origin is a proxy
of ethnic origin.
In the ethnicity (ethnic origin or country of origin) variables, we consider the five
guestworker countries separately and group all others in one category. Italian is the reference
group. Note that Greeks, Italians and Spaniards are members of the European Union, but Turks
and peoples from the former country of Yugoslavia are not. The dummy variables measuring
religion are Muslim, Catholic (the reference group), other Christians, other religions, and non
religious. Obtaining a degree or just attending school in the home country should have a
differential impact than schooling obtained in Germany. We thus control for both.
An important variable in the literature is the time immigrants spend in the home
country or years-since-migration. We expect a higher labor force participation rate and
additional rewards to accrue with additional years in Germany. Our key hypothesis - that the
intensity of the ethnic identity can strongly determine the decision to work or not - is tested
with the inclusion of the ethnosizer variables in the model.8 Assimilation is the reference
category.
7 The selection probit equation corresponding to the earnings regression will contain or not contain the ethnosizer in correspondence with the earnings regression specification. 8 Ethnic identity could be endogenous. However, we have carefully studied the endogeneity issue before, see Constant and Zimmermann (2008), among other papers, and endogeneity with labor attachment was found to be not a problem. This can be made understandable by the fact provided by our other research with the data (e.g. Constant, Gataullina and Zimmermann, 2009, and Constant, Zimmermann and Zimmermann, 2009) that ethnic identity is affected mainly by pre-migration characteristics and factors like time since migration, not by education acquired in the host country or attachment to the labor force. We also did find similar results for immigrant homeownership, see Constant, Roberts and Zimmermann, 2009).
12
To study variations in earnings regressions according to individuals’ ethnic identity
among other determinants, we use the natural logarithm of gross monthly labor earnings (in
Euros) as the dependent variable. The list of exogenous variables in the earnings models
includes most of the characteristics in the labor force participation equation9 and other
characteristics that identify earnings only. We control for pre-migration characteristics
(ethnicity, religion, and schooling in the home country); post-migration characteristics (age,
marital status, children, schooling in Germany, and exposure to Germany); macroeconomic
indicators (live in a large city); work/company related characteristics (length of time with firm
and size of company); industry dummies; the ethnosizers (integration, assimilation, separation,
and marginalization); and the Mills ratio to adjust for selection.10
3.3. Sample Characteristics
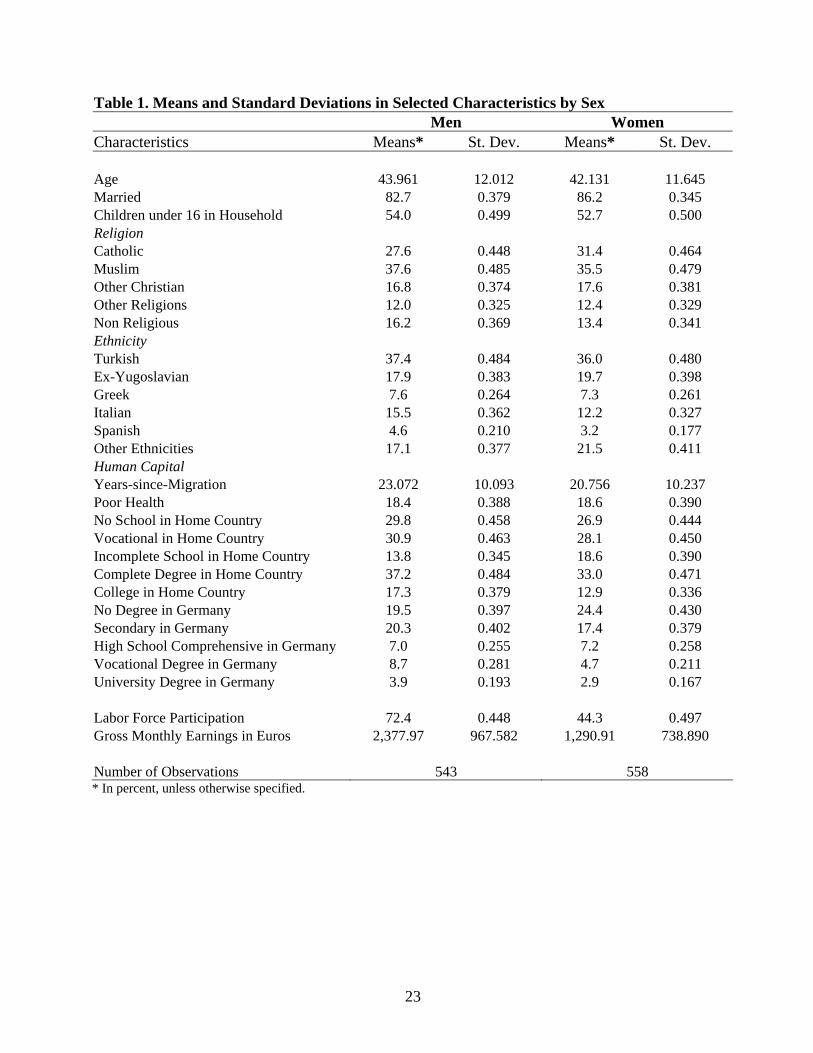
The descriptive statistics presented in Table 1 demonstrate some differences between men and
women. On average, sampled men and women are in their early forties, and men are about 2
years older than women. Around 83 percent of men and 86 percent of women are married and
about 54 percent of them have at least one child under the age of 16 in the household. Among
both men and women, the majority religion is Muslim and the majority ethnic origin is from
Turkey.
About 30 percent of men and 27 percent of women have no schooling from their home
country. Among the rest, a larger percentage of men than women have vocational training or
other degrees form the home country. As for their German schooling, more men have
schooling than women, whether it is vocational, secondary or university. Still, about 20 percent
of the average immigrant men in our sample and 24 percent of the average women have no
schooling or degree from Germany. An average male immigrant has been living in Germany
for about 23 years, while an average female immigrant has spent two fewer years (21 years) in
Germany.
Note also the big gender disparity in the labor force participation and earnings among
immigrants. The average gross monthly labor earnings of men are 2,378 Euros, while the
9 Excluded are dummies for “poor health” and “non-labor income.” This ensures identification, but both variables are also truly relevant for the participation decision and not for earnings. 10 Note that industry dummies and work/company related characteristics are not contained in the selection equation.

13
average gross monthly labor earnings of women are 1,291 Euros. But fewer women work; only
44 percent of women work versus 72 percent of men.
In Table 2 we present the number immigrants score in the index of the four states of
ethnic identity by sex, ethnicity and religion. The index for each state goes from zero to five
(for the five elements). Zero denotes that an immigrant is not in this state. Five shows that an
immigrant is the most integrated, assimilated, separated or marginalized. Women are less
integrated and assimilated and more separated and marginalized compared to men. Both men
and women score the highest in the separation state. The next highest state for both sexes is
integration and women are more integrated than men. In the following state, assimilation, it is
men who score higher than women. The scores of ethnic identity are the lowest in the
marginalization state, and women score higher than men here.
With respect to the ethnosizer variables, Table 2 demonstrates that, on average, male
and female immigrants score similarly in integration, assimilation and separation, but females
demonstrate slightly higher scores in marginalization than males. A similar pattern emerges
from the ethnicity and religion scores. The highest scores are in the separation state and the
lowest in the marginalization state. Assimilation and integration scores vary by ethnicity and
religion. All five guestworker immigrant groups score higher in the integration state than in
assimilation. The most integrated appear to be the Spaniards, followed by the peoples from the
former Yugoslavia. They also rank the lowest in separation and marginalization. In contrast,
Turks are the least integrated. These results are echoed in the assimilation state. That is,
Turkish immigrants exhibit the strongest identification with the culture from the country of
origin and the weakest affinity to Germany. The other ethnic groups are positioned somewhere
in between.
Looking at the ethnic identity scores in each state by religion, we see a similar trend.
All immigrants with a religion and those that are non-religious exhibit the highest scores in the
separation state and the lowest in the marginalization state. Likewise, they all score higher in
the integration state than the assimilation state. Immigrants in other religions and the non-
religious are the most integrated, followed by Catholics and other Christians. Muslims rank the
lowest in the integration state of the ethnosizer. In the assimilation state, it is the Catholics who
score the highest. The non-religious immigrants are next in the assimilation scores, followed by
the other Christians and other religions; Muslims score the lowest with 0.856.
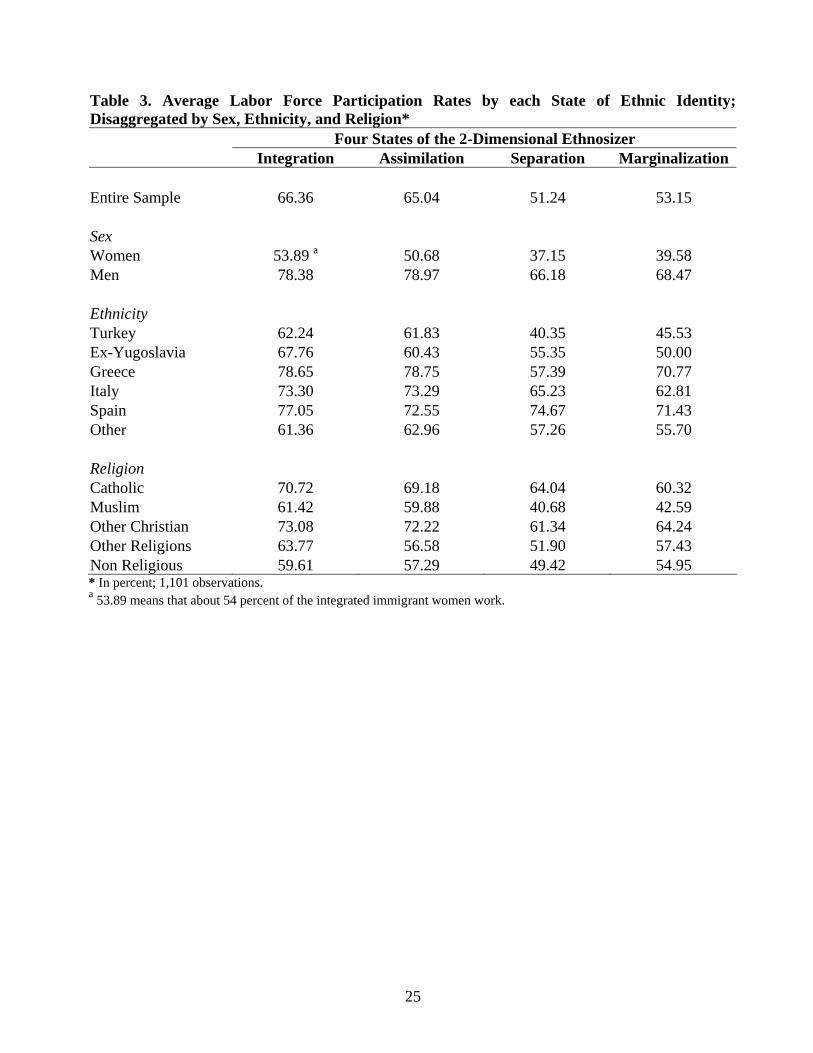
In Table 3 we present the labor force participation rates for sex, ethnicity and religion
for each of the four states of the ethnosizer. Overall, labor force participation is higher in the
14
integration and assimilation states and much lower in the separation and marginalization states.
Women are less likely to work than men in any state of their ethnic identity. Except for the
integration state where the gap is the smallest, women have a 29 percentage points difference
from men. Integrated women have the highest working rate (56 percent). Next rank the
assimilated women and far behind come the marginalized and separated. Only 37 percent of
the separated women work. Among men, assimilated men have the highest working rates with
about 79 percent, followed by integrated men with 78 percent. Next are marginalized and
separated men with 68 and 66 percent respectively.
The labor force participation rates vary among the five ethnic groups from the
guestworker generation. Greeks have the highest working rates when they are integrated and
assimilated. Turks are in the antipode with the lowest working rates and a difference of about
17 percentage points. In between are the Spaniards, Italians, and ex-Yugoslavs. While there are
not big differences between integrated and assimilated ethnic groups, integrated immigrants
have slightly higher working rates. Among those immigrants with a separated identity, Turks
have the lowest labor force participation with 40 percent and Spaniards the highest with 75
percent. Except the Greeks and the Turks, the other ethnicities have higher working rates when
they are separated than marginalized.
Non-Catholic Christians have the highest labor force participation rates among those
who are in the integration state. For example, 73 percent of integrated Christians work, as
opposed to only 60 percent of the nonreligious working. Among the integrated immigrants, in
descending order we find Catholics with 71 percent, other religions with 64 percent and
Muslims with 61 percent. In the assimilated state other Christians also have the highest rate
with 72 percent, closely followed by Catholics (69 percent), and by Muslims with a 12
percentage points difference. The nonreligious and other religions have the lowest working
rates. Undoubtedly, those in the separated and marginalized states have the lowest working
rates. With the exception of Catholics, however, all religions exhibit the lowest working rates
when they are separated rather than when they are marginalized.
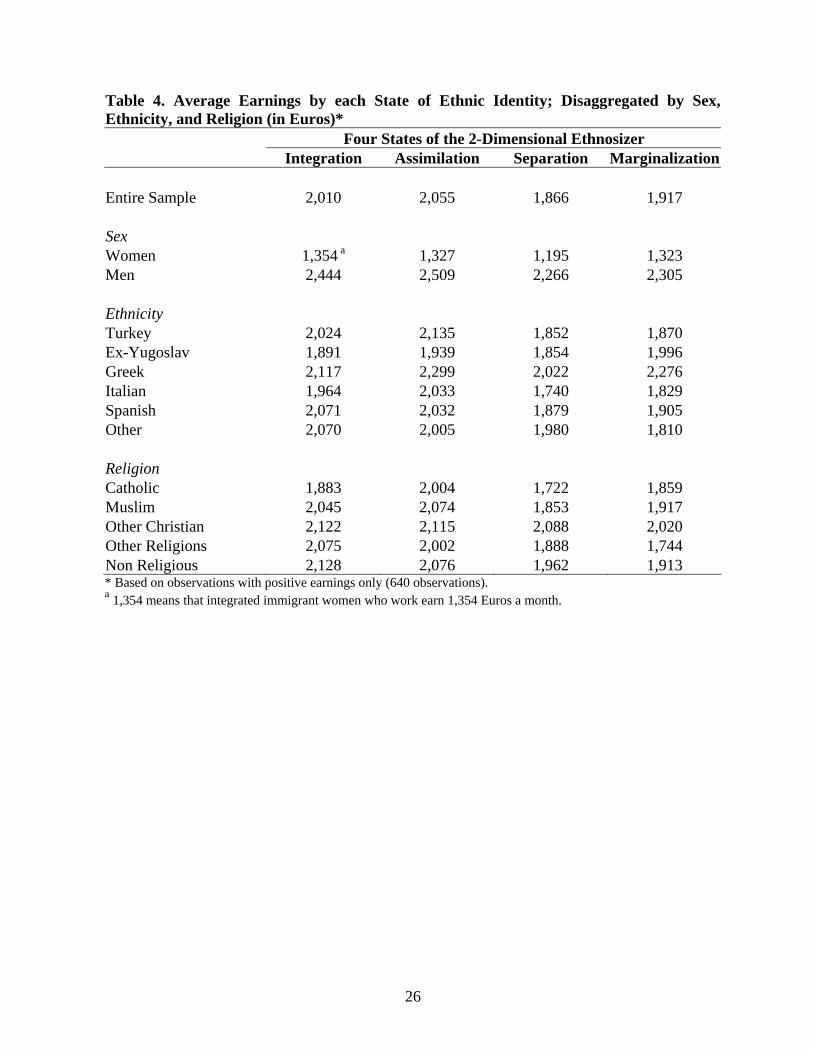
Looking at the average earnings of immigrants within each state of their ethnic identity
we find similar results to the labor force participation rates. Table 4 shows again that people in
the integration and assimilation states earn much more than those in the separation or
marginalization states. There are also tremendous differences between men and women. While
men earn on average more than women, the difference between them is the largest when they
are in the assimilation state. Note that women earn the highest wages when they are in the
15
integration state, but men earn the highest when they are in the assimilation state. Both earn the
lowest when they are separated. This could indicate that they have lower working rates (that is
they cannot find a job easily) and/or that working in enclaves creates friction with other co-
ethnics that brings wages down.
When we look at the ethnic origin, integrated Greeks earn the most; more than
integrated Spaniards, Turks, Italians and ex-Yugoslavs. Greeks also earn more when they are
assimilated, followed closely by Turks. Based on these raw statistics, the earnings differences
between integration and assimilation are not so important. Comparing earnings between the
separation and marginalization states, we see that earnings are lower in the separation state for
all ethnicities.
Immigrants in any religion earn more when they are integrated or assimilated and less
when they are separated or marginalized. Besides this general pattern, there are not clear
differences among identity states and/or religions. Catholics and Muslims resemble each other
in that they earn the highest when they are assimilated and the lowest when separated. Non-
Catholic Christians, other religions, and the nonreligious have the highest wages when they are
integrated and the lowest when marginalized. Among the integrated, the nonreligious earn the
most (2,128 Euros a month) and Catholics the least (1,883 Euros a month). In the assimilation
state the other Christians rank the highest and other religions the lowest. The other Christians
earn also the highest in the separation and marginalization states. Catholics earn the least
among the separated and the other religions earn the least among the marginalized.
4. Empirical Results
4.1. Labor Force Participation
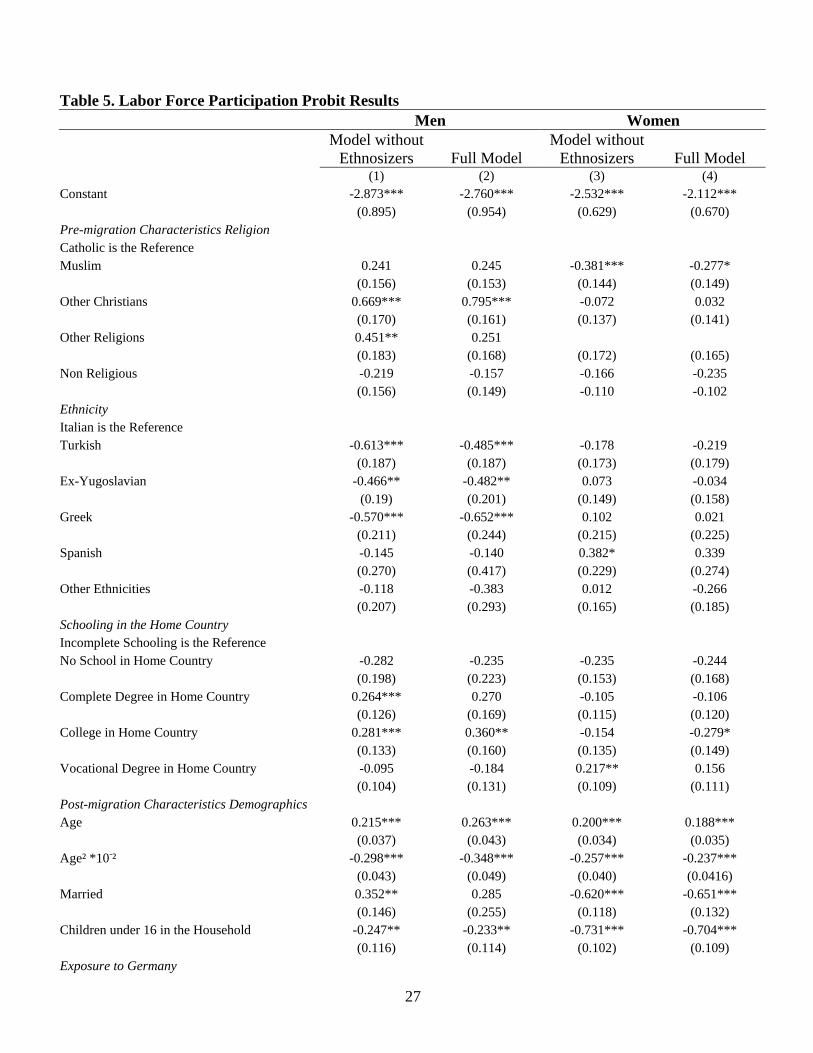
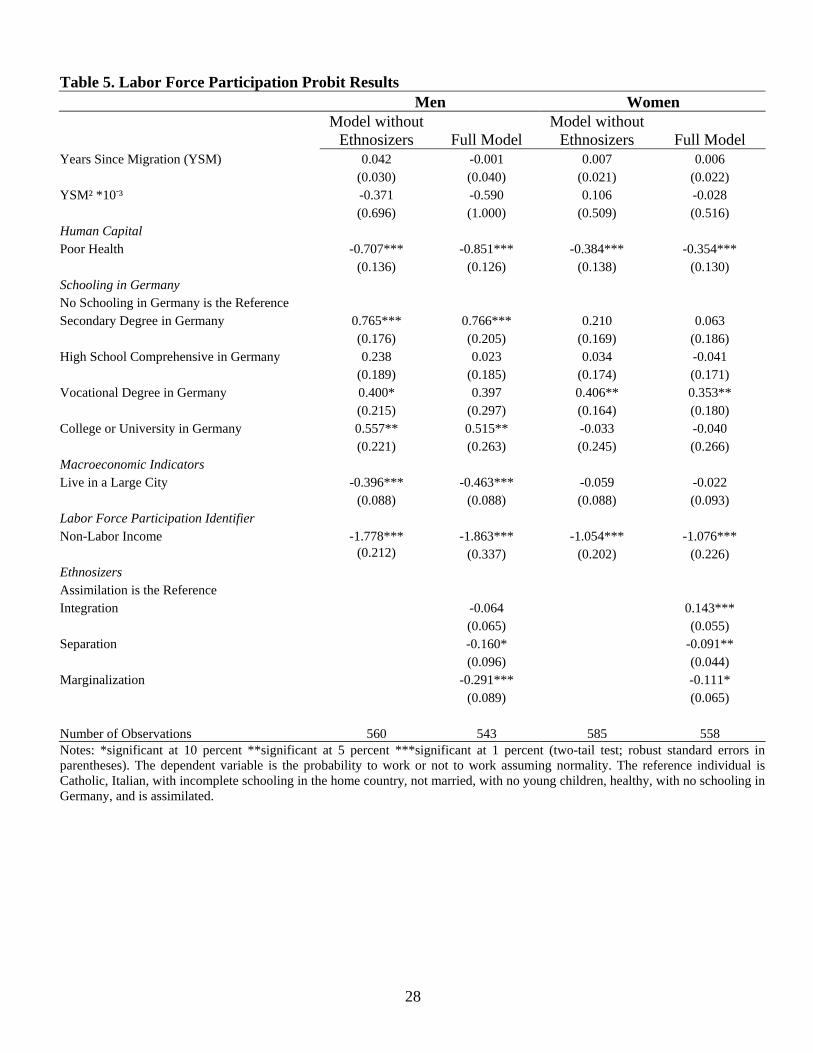
Table 5 presents the results of the labor force participation selection estimation assuming
normality, separately for men and women. For reference, the first and third columns show the
estimates of the basic labor supply model without any of the ethnic identity indexes.11 In
columns two and four we add the ethnosizers. Overall, the results do not change much in this
exercise. For men (column three), we find that other Christians are more likely to work than
Catholics, but all other religions are no different than Catholics. With respect to ethnic origin, 11 These are the coefficients and standard errors from the probit.
16
Turks, ex-Yugoslavs and Greeks are all less likely to work than Italians. There are no
significant differences between Italians and Spaniards or other ethnicities.
Those immigrant men who have a college degree before they arrived to Germany are
more likely to work than those who have an incomplete degree. The age pattern is as expected;
labor force participation increases with age, albeit at a decreasing rate. While marital status is
not a significant determinant of men’s working decision, children are. Those who have young
children are less likely to work.
Surprisingly, the key variable in the earnings assimilation literature in economics, years
since migration (YSM), is not significant. However, poor health definitely decreases the
probability to work. Education acquired in Germany is also important to boost men’s working
probabilities. Compared to men who have no schooling degree in Germany, those who
acquired a secondary degree and those with a university degree are much more likely to work.
This is an interesting result showing a bimodal pattern. It is either low schooling or college that
make a difference.
Results on the test about the effect of living in a large city show that immigrant men in
large cities are less likely to work. This could reflect the higher unemployment rates in large
cities and/or that while there may be more jobs in large cities, there are also more people and
more competition for a job. The non-labor income hypothesis holds for immigrant men. That
is, those men who have other income are less likely to work because their reservation wages
are higher.
Compared to the state of assimilation or complete subordination to the German
language, culture and mores, immigrant men are less likely to work when they are separated
and marginalized. However, when they are integrated there is no significant difference in their
labor force participation decision.
Columns three and four show a different picture for the labor force participation of
immigrant women. Starting with religion, Muslim women are less likely to work than
Catholics ceteris paribus. However, ethnic origin is not significant in joining the labor market
or not. Contrary to men, women are less likely to work when they have a college degree from
the county of origin compared to those with incomplete schooling.
Age is a good predictor of labor force participation; women work more as they age but
at a discounted rate. Married women are less likely to work and so are those with young
children at home. Similar to men, the years-since-migration variable is not significant. Poor
health, as expected, impedes women from working.
17
When it comes to schooling in Germany, women have a different pattern than men.
Now it is the women with vocational training who are more likely to work compared to women
with no degree in Germany. According to theory, women with non-labor income are less likely
to work.
It is interesting that, for women, the assimilation and integration states are distinctly
different. Namely, women who are integrated and keep both the host and home country
cultures are more likely to work compared to those who are assimilated to the German culture.
On the other hand, both those who are separated and marginalized are less likely to work than
those who are assimilated. Overall, we find that the ethnic identity of immigrants significantly
affects their labor force decision.
4.2. Selection Adjusted Earnings
Table 6 reports the results of the econometric analysis of how labor earnings vary with ethnic
identity and other characteristics and adjusted for selection. This table records coefficients and
standard errors from estimated separately for men and women. Columns one and three refer to
the earnings model that does not include our measures of ethnic identity. Columns two and
four augment the basic model with the ethnosizer.
Results show clear gender differences in the determinants of earnings. Religion and
ethnicity are not significant predictors of the earnings of male immigrants. Male immigrants
who have a college degree earn 15 percent more than those with incomplete schooling in the
home country. Surprisingly, those with vocational training earn 10 percent less than those with
incomplete schooling in the home country. As for schooling acquired in Germany, both a high
school and a college degree give men a premium of 29 and 23 percent respectively, compared
to those with no schooling in Germany.
Labor market structures affect the earnings of immigrant men. Seniority or tenure on
the job - measured by the length of time with the company - increases earnings by 0.5 percent.
The industry type is also important; men in retail, wholesale or trade earn 16 percent less than
those in manufacturing, the reference industry.
We are surprised not to find any significant effects of ethnic identity on the earnings of
immigrant men. In addition, all three coefficients on integration, separation, and
marginalization are negative and rather small compared to assimilation. Also, the coefficient
on lambda does not show any selection issues for men workers.
18
Unlike men, the earnings of women are affected by their ethnic origin. Women from
the former Yugoslavia earn 21 percent more than Italian women. Likewise, women from all
other ethnicities earn 41 percent more than Italian women. But there is no significant difference
in the earnings of Turkish, Greeks, Spanish, and Italian women.
Also in contrast to men, human capital is not a significant determinant of the earnings
of women, ceteris paribus. Being married is like a penalty on the earnings of women, who earn
24 percent less than those not married. Women’s earnings are also more affected by labor
market and urban characteristics. Living in a large city increases their earnings by 28 percent.
For every additional year they stay with the company, women are also rewarded by 2 percent.
But working in a small company is quite detrimental, as women earn 37 percent less than in a
large company. The industry where women work is quite strong for their earnings.12 Compared
to the manufacturing sector, women in the service sector and those in retail, wholesale, trade
earn 38 and 29 percent respectively. It is also interesting than women in the financial sector
also earn 63 percent less than those in the manufacturing sector. Similar to men, we cannot find
any significant effects of ethnic identity on the earnings of women.13 It is noteworthy that after
men and women have been selected into the labor market, their ethnic identity is not relevant
for their remuneration. For women in particular, it is also interesting that their selection
coefficient is negative and significant, indicating that these women workers are not a random
sample of women and that they rather come from the lower end of the distribution.
5. Conclusions
Ethnic diversity generates economic advantages which can be utilized by both immigrants and
the host country, ultimately increasing the creativity and dynamism of society. The skills and
social or cultural capital that immigrants bring with them should not be dismissed, and forcing
immigrants to assimilate to natives is not always the best scenario. The fact is that immigrants
are needed because they are different and complement natives. Competing directly with natives
and no longer having any culture-specific human capital as an additional qualification is not
12 We have the position that the reference group needs to be a meaningful group, otherwise any comparisons are corrupted. So we disagree with the standard practice to put all “other” groups into the reference category. One should then either cluster small groups together or do not interpret groups with small sample sizes. We have chosen to do the latter. 13 Although the sample sizes are not too small, they might be responsible for the small levels of significance.
19
advantageous. Preserving one’s ethnic identity with dignity and pride is important, and
integration (as we define it) can be enriching and rewarding for immigrants.
This study employs an index of ethnic identity, the ethnosizer, to try and explain the
earnings of men and women immigrants in Germany. The ethnosizer is a two-dimensional
degree of attachment to or identification with the receiving and sending countries that could
determine the economic success of the immigrants. The ethnosizer has four states of
identification with the natives and or co-ethnics. Namely, assimilation (a strong identification
with the receiving country’s culture and society and weak identification with the country of
origin), integration (a strong bond with the country of origin with a simultaneous strong
connection with the receiving country), separation (total identification with the ethnic origin
and culture, even years after emigration), and marginalization (no sense of belonging, neither
to the receiving country’s culture nor to that of the country of origin).
Our results reveal interesting gender dynamics with respect to ethnic identity and in
relation to labor market attachment and rewards. Earnings denote the degree of success in the
labor market. But this requires that people join the labor market first. In this crucial decision,
our results show that the ethnic identity of immigrants is a strong determinant. For men, we
find that those identified as separated or marginalized have a much lower probability to work
when compared to immigrants who totally identify with natives and demonstrate a strong
commitment to the German society. In this case, assimilation is clearly a better state than being
isolated in an enclave or withdrawn from society. However, it is also interesting that being
assimilated does not offer a particular advantage to the labor market compared to the identity
state of being integrated.
In contrast, we find that for women immigrants assimilation and integration produce
significantly different working probabilities. Women who identify with both cultures, speak
both languages and in general feel comfortable with both societies have a much higher
probability to work than women who only identify with natives (are assimilated). Thus,
integration is clearly the preferred state for women. However, as expected, the separation and
marginalization states are inferior to the assimilation state. Separated or marginalized women
have lower chances of joining the labor force than those who are assimilated.
This paper reveals that in multiethnic societies it pays to be integrated - meaning
preserving one’s ethnic identity and being proud of it while embracing and respecting the
ethnicity and culture of others - but only for women. While the ethnic identity is important for
selection into the labor market, once immigrants start working ethnic identity does not affect

20
their earnings in a significant way. This is consistent with other studies on the effect of identity
and personality on occupations and earnings.
21
REFERENCES Aguilera, M.B., & Massey, D.S. (2003). Social Capital and Wages of Mexican Migrants: New
Hypotheses and Tests. Social Forces, 82(2), 671-701. Akerlof, G.A., & Kranton, R.E. (2000). Economics and Identity. Quarterly Journal of
Economics, 115(3), 715-53. Austen-Smith, D., & Fryer, R.G. Jr. (2005). An Economic Analysis of ‘Acting White’.
Quarterly Journal of Economics, 120(2), 551-83. Battu, H., McDonald M., & Zenou, Y. (2007). Oppositional Identities and the Labor Market.
Journal of Population Economics, 20(3), 643-67. Becker, G.S. (1996). Preferences and Values In: G.S. Becker (ed.), Accounting for Tastes,
Cambridge: Harvard University Press. Bénabou, R., & Tirole, J. (2007). Identity, Dignity and Taboos: Beliefs as Assets. IZA
Discussion Paper no. 2583. Berry, J. (1980). Acculturation as Varieties of Adaptation. In: A. M. Padilla (ed.),
Acculturation: Theory, Models and Some New Findings. Boulder, CO: Westview. Bisin, A., Patacchini, E., Verdier, T., & Zenou, Y. (2006). ‘Bend it like Beckham’: Identity,
Socialization and Assimilation. CEPR Discussion Paper no. 5662. Bisin, A., Patacchini, E., Verdier, T., & Zenou, Y. (2008). Are Muslim Immigrants Different in
Terms of Cultural Integration? Journal of the European Economic Association. 6(2-3), 445-56.
Bowles, S., Gintis, H., & Osborne, M. (2001). Incentive-Enhancing Preferences: Personality,
Behavior, and Earnings. American Economic Review, 91(2), 155-58. Chiswick, C.U. (2009). The Economic Determinants of Ethnic Assimilation. Journal of
Population Economics, forthcoming. Constant, A.F., & Zimmermann, K.F. (2008). Measuring Ethnic Identity and Its Impact on
Economic Behavior. Journal of the European Economic Association, 6(2-3), 424-33. Constant, A.F., Gataullina, L., & Zimmermann, K.F. (2009). Ethnosizing Immigrants. Journal
of Economic Behavior and Organization, 69(3), 274–87. Constant, A.F., Roberts, R., & Zimmermann, K.F. (2009). Ethnic Identity and Immigrant
Homeownership. Urban Studies, 46(9), 1879-98. Constant, A.F., Zimmermann, L., & Zimmermann, K.F. (2009). The Myth of Clash of
Cultures: Muslims and Christians in the Ethnosizing Process. Mimeo, forthcoming.
22
Darity, W. Jr., Mason, P.L., & Stewart, J.B. (2006). The Economics of Identity: The Origin and Persistence of Racial Identity Norms. Journal of Economic Behavior and Organization, 60(3), 283-305.
Fearon, J.D., & Laitin, D.D. (2000). Violence and the Social Construction of Ethnic Identity.
International Organization, 54(4), 845-77. Guiso, L., Sapienza, P., & Zingales, L. (2006). Does Culture Affect Economic Outcomes?
NBER Working Paper no.11999. Kuran, T. (1998). Ethnic Norms and their Transformation through Reputational Cascades.
Journal of Legal Studies, 27(2): 623-59. Lewin, F.A. (2001). Identity Crisis and Integration: The Divergent Attitudes of Iranian
Immigrant Men and Women towards Integration into Swedish Society. International Migration, 39(3), 121-133.
Mason, P.L. (2004). Annual Income, Hourly Wages, and Identity among Mexican-Americans
and other Latinos. Industrial Relations, 43(4), 817-34. Montgomery, J.D. (1991). Social Networks and Labor-Market Outcomes: Toward an
Economic Analysis. American Economic Review, 81(5), 1407-18. Ottaviano, G.I.P., & Peri, G. (2006). The Economic Value of Cultural Diversity: Evidence
from US Cities. Journal of Economic Geography, 6(1), 9-44. UNECE (2006). Conference of European Statisticians Recommendations for the 2010
Censuses of Population and Housing. New York: United Nations. Zimmermann, K.F. (2007a). The Economics of Migrant Ethnicity. Journal of Population
Economics, 20(3), 487-94. Zimmermann, K.F. (2007b). Migrant Ethnic Identity: Concept and Policy Implications.
Ekonomia, 10 (1), 1-17.
23
* In percent, unless otherwise specified.
Table 1. Means and Standard Deviations in Selected Characteristics by Sex Men Women
Characteristics Means* St. Dev. Means* St. Dev. Age 43.961 12.012 42.131 11.645 Married 82.7 0.379 86.2 0.345 Children under 16 in Household 54.0 0.499 52.7 0.500 Religion Catholic 27.6 0.448 31.4 0.464 Muslim 37.6 0.485 35.5 0.479 Other Christian 16.8 0.374 17.6 0.381 Other Religions 12.0 0.325 12.4 0.329 Non Religious 16.2 0.369 13.4 0.341 Ethnicity Turkish 37.4 0.484 36.0 0.480 Ex-Yugoslavian 17.9 0.383 19.7 0.398 Greek 7.6 0.264 7.3 0.261 Italian 15.5 0.362 12.2 0.327 Spanish 4.6 0.210 3.2 0.177 Other Ethnicities 17.1 0.377 21.5 0.411 Human Capital Years-since-Migration 23.072 10.093 20.756 10.237 Poor Health 18.4 0.388 18.6 0.390 No School in Home Country 29.8 0.458 26.9 0.444 Vocational in Home Country 30.9 0.463 28.1 0.450 Incomplete School in Home Country 13.8 0.345 18.6 0.390 Complete Degree in Home Country 37.2 0.484 33.0 0.471 College in Home Country 17.3 0.379 12.9 0.336 No Degree in Germany 19.5 0.397 24.4 0.430 Secondary in Germany 20.3 0.402 17.4 0.379 High School Comprehensive in Germany 7.0 0.255 7.2 0.258 Vocational Degree in Germany 8.7 0.281 4.7 0.211 University Degree in Germany 3.9 0.193 2.9 0.167 Labor Force Participation 72.4 0.448 44.3 0.497 Gross Monthly Earnings in Euros 2,377.97 967.582 1,290.91 738.890 Number of Observations 543 558

24
* Each state of the ethnosizer scores from zero to five. Zero means an immigrant is not in this state, one means an immigrant has low score and five means an immigrant in totally integrated, assimilated, separated or marginalized; Standard errors in parentheses; Number of observations is 1,101.
Table 2. Average Scores of Ethnic Identity within each State; Disaggregated by Sex, Ethnicity and Religion* Four States of the 2-Dimensional Ethnosizer
Integration Assimilation Separation Marginalization Entire Sample 1.188 1.081 1.909 0.822 (0.030) (0.032) (0.042) (0.026) Sex Women 1.151 1.050 1.939 0.860 (0.042) (0.044) (0.060) (0.038) Men 1.227 1.112 1.878 0.783 (0.043) (0.046) (0.059) (0.036) Ethnicity Turkey 1.062 0.785 2.295 0.859 (0.050) (0.048) (0.069) (0.044) Ex-Yugoslavia 1.184 1.111 1.807 0.899 (0.067) (0.071) (0.092) (0.064) Greece 1.085 0.976 2.146 0.793 (0.109) (0.097) (0.155) (0.095) Italy 1.158 1.059 1.987 0.796 (0.074) (0.089) (0.114) (0.070) Spain 1.419 1.186 1.744 0.651 (0.170) (0.160) (0.231) (0.115) Other 1.446 1.648 1.164 0.742 (0.067) (0.075) (0.079) (0.055) Religion Catholic 1.240 1.308 1.677 0.775 (0.052) (0.064) (0.078) (0.047) Muslim 0.948 0.856 2.256 0.940 (0.048) (0.049) (0.069) (0.045) Other Christian 1.238 1.143 1.820 0.799 (0.074) (0.075) (0.098) (0.060) Other Religions 1.545 1.134 1.567 0.754 (0.090) (0.089) (0.110) (0.073) Non Religious 1.564 1.178 1.577 0.681
(0.084) (0.080) (0.105) (0.064)
25
Table 3. Average Labor Force Participation Rates by each State of Ethnic Identity;Disaggregated by Sex, Ethnicity, and Religion* Four States of the 2-Dimensional Ethnosizer
Integration Assimilation Separation Marginalization Entire Sample 66.36 65.04 51.24 53.15 Sex Women 53.89 a 50.68 37.15 39.58 Men 78.38 78.97 66.18 68.47 Ethnicity Turkey 62.24 61.83 40.35 45.53 Ex-Yugoslavia 67.76 60.43 55.35 50.00 Greece 78.65 78.75 57.39 70.77 Italy 73.30 73.29 65.23 62.81 Spain 77.05 72.55 74.67 71.43 Other 61.36 62.96 57.26 55.70 Religion Catholic 70.72 69.18 64.04 60.32 Muslim 61.42 59.88 40.68 42.59 Other Christian 73.08 72.22 61.34 64.24 Other Religions 63.77 56.58 51.90 57.43 Non Religious 59.61 57.29 49.42 54.95 * In percent; 1,101 observations. a 53.89 means that about 54 percent of the integrated immigrant women work.
26
Table 4. Average Earnings by each State of Ethnic Identity; Disaggregated by Sex, Ethnicity, and Religion (in Euros)* Four States of the 2-Dimensional Ethnosizer Integration Assimilation Separation Marginalization Entire Sample 2,010 2,055 1,866 1,917 Sex Women 1,354 a 1,327 1,195 1,323 Men 2,444 2,509 2,266 2,305 Ethnicity Turkey 2,024 2,135 1,852 1,870 Ex-Yugoslav 1,891 1,939 1,854 1,996 Greek 2,117 2,299 2,022 2,276 Italian 1,964 2,033 1,740 1,829 Spanish 2,071 2,032 1,879 1,905 Other 2,070 2,005 1,980 1,810 Religion Catholic 1,883 2,004 1,722 1,859 Muslim 2,045 2,074 1,853 1,917 Other Christian 2,122 2,115 2,088 2,020 Other Religions 2,075 2,002 1,888 1,744 Non Religious 2,128 2,076 1,962 1,913 * Based on observations with positive earnings only (640 observations). a 1,354 means that integrated immigrant women who work earn 1,354 Euros a month.
27
Table 5. Labor Force Participation Probit Results Men Women
Model without
Ethnosizers Full Model Model without
Ethnosizers Full Model (1) (2) (3) (4) Constant -2.873*** -2.760*** -2.532*** -2.112*** (0.895) (0.954) (0.629) (0.670) Pre-migration Characteristics Religion Catholic is the Reference Muslim 0.241 0.245 -0.381*** -0.277* (0.156) (0.153) (0.144) (0.149) Other Christians 0.669*** 0.795*** -0.072 0.032 (0.170) (0.161) (0.137) (0.141) Other Religions 0.451** 0.251 (0.183) (0.168) (0.172) (0.165) Non Religious -0.219 -0.157 -0.166 -0.235 (0.156) (0.149) -0.110 -0.102 Ethnicity Italian is the Reference Turkish -0.613*** -0.485*** -0.178 -0.219 (0.187) (0.187) (0.173) (0.179) Ex-Yugoslavian -0.466** -0.482** 0.073 -0.034 (0.19) (0.201) (0.149) (0.158) Greek -0.570*** -0.652*** 0.102 0.021 (0.211) (0.244) (0.215) (0.225) Spanish -0.145 -0.140 0.382* 0.339 (0.270) (0.417) (0.229) (0.274) Other Ethnicities -0.118 -0.383 0.012 -0.266 (0.207) (0.293) (0.165) (0.185) Schooling in the Home Country Incomplete Schooling is the Reference No School in Home Country -0.282 -0.235 -0.235 -0.244 (0.198) (0.223) (0.153) (0.168) Complete Degree in Home Country 0.264*** 0.270 -0.105 -0.106 (0.126) (0.169) (0.115) (0.120) College in Home Country 0.281*** 0.360** -0.154 -0.279* (0.133) (0.160) (0.135) (0.149) Vocational Degree in Home Country -0.095 -0.184 0.217** 0.156 (0.104) (0.131) (0.109) (0.111) Post-migration Characteristics Demographics Age 0.215*** 0.263*** 0.200*** 0.188*** (0.037) (0.043) (0.034) (0.035) Age² *10-² -0.298*** -0.348*** -0.257*** -0.237*** (0.043) (0.049) (0.040) (0.0416) Married 0.352** 0.285 -0.620*** -0.651*** (0.146) (0.255) (0.118) (0.132) Children under 16 in the Household -0.247** -0.233** -0.731*** -0.704*** (0.116) (0.114) (0.102) (0.109) Exposure to Germany
28
Table 5. Labor Force Participation Probit Results Men Women
Model without
Ethnosizers Full Model Model without
Ethnosizers Full Model Years Since Migration (YSM) 0.042 -0.001 0.007 0.006 (0.030) (0.040) (0.021) (0.022) YSM² *10-³ -0.371 -0.590 0.106 -0.028 (0.696) (1.000) (0.509) (0.516) Human Capital Poor Health -0.707*** -0.851*** -0.384*** -0.354*** (0.136) (0.126) (0.138) (0.130) Schooling in Germany No Schooling in Germany is the Reference Secondary Degree in Germany 0.765*** 0.766*** 0.210 0.063 (0.176) (0.205) (0.169) (0.186) High School Comprehensive in Germany 0.238 0.023 0.034 -0.041 (0.189) (0.185) (0.174) (0.171) Vocational Degree in Germany 0.400* 0.397 0.406** 0.353** (0.215) (0.297) (0.164) (0.180) College or University in Germany 0.557** 0.515** -0.033 -0.040 (0.221) (0.263) (0.245) (0.266) Macroeconomic Indicators Live in a Large City -0.396*** -0.463*** -0.059 -0.022 (0.088) (0.088) (0.088) (0.093) Labor Force Participation Identifier Non-Labor Income -1.778*** -1.863*** -1.054*** -1.076*** (0.212) (0.337) (0.202) (0.226) Ethnosizers Assimilation is the Reference Integration -0.064 0.143*** (0.065) (0.055) Separation -0.160* -0.091** (0.096) (0.044) Marginalization -0.291*** -0.111* (0.089) (0.065) Number of Observations 560 543 585 558 Notes: *significant at 10 percent **significant at 5 percent ***significant at 1 percent (two-tail test; robust standard errors in parentheses). The dependent variable is the probability to work or not to work assuming normality. The reference individual is Catholic, Italian, with incomplete schooling in the home country, not married, with no young children, healthy, with no schooling in Germany, and is assimilated.
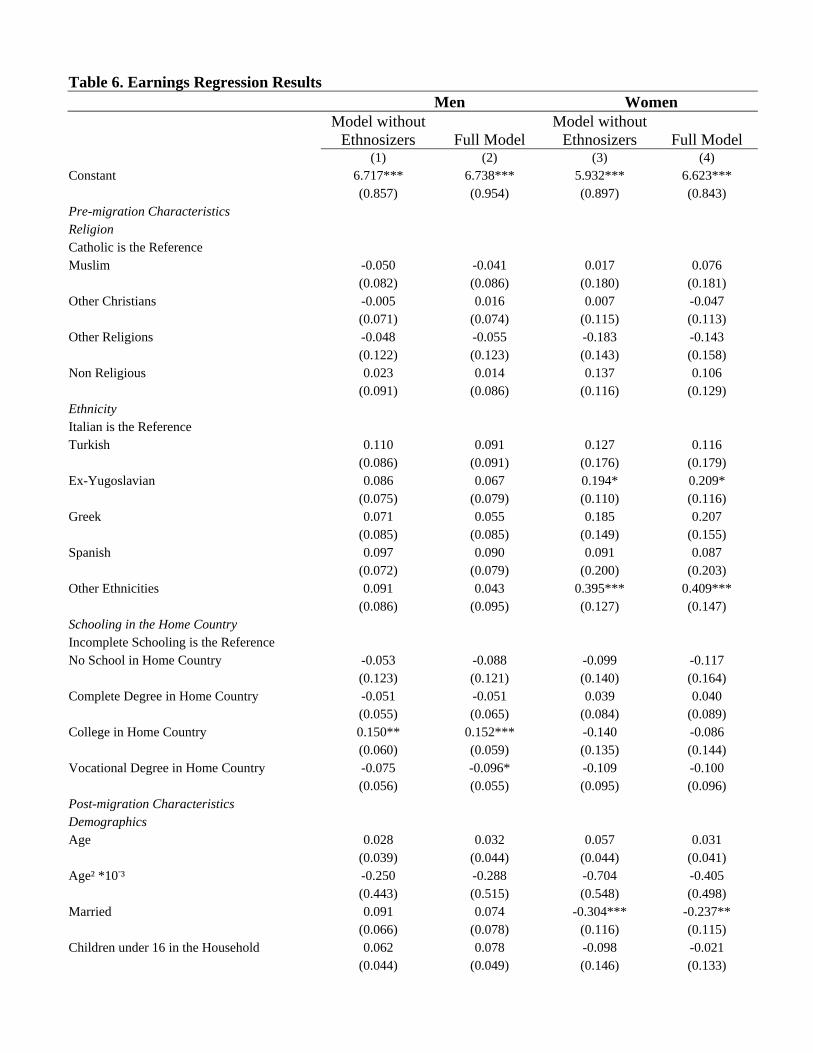
Table 6. Earnings Regression Results Men Women
Model without Ethnosizers Full Model
Model without Ethnosizers Full Model
(1) (2) (3) (4) Constant 6.717*** 6.738*** 5.932*** 6.623*** (0.857) (0.954) (0.897) (0.843) Pre-migration Characteristics Religion Catholic is the Reference Muslim -0.050 -0.041 0.017 0.076 (0.082) (0.086) (0.180) (0.181) Other Christians -0.005 0.016 0.007 -0.047 (0.071) (0.074) (0.115) (0.113) Other Religions -0.048 -0.055 -0.183 -0.143 (0.122) (0.123) (0.143) (0.158) Non Religious 0.023 0.014 0.137 0.106 (0.091) (0.086) (0.116) (0.129) Ethnicity Italian is the Reference Turkish 0.110 0.091 0.127 0.116 (0.086) (0.091) (0.176) (0.179) Ex-Yugoslavian 0.086 0.067 0.194* 0.209* (0.075) (0.079) (0.110) (0.116) Greek 0.071 0.055 0.185 0.207 (0.085) (0.085) (0.149) (0.155) Spanish 0.097 0.090 0.091 0.087 (0.072) (0.079) (0.200) (0.203) Other Ethnicities 0.091 0.043 0.395*** 0.409*** (0.086) (0.095) (0.127) (0.147) Schooling in the Home Country Incomplete Schooling is the Reference No School in Home Country -0.053 -0.088 -0.099 -0.117 (0.123) (0.121) (0.140) (0.164) Complete Degree in Home Country -0.051 -0.051 0.039 0.040 (0.055) (0.065) (0.084) (0.089) College in Home Country 0.150** 0.152*** -0.140 -0.086 (0.060) (0.059) (0.135) (0.144) Vocational Degree in Home Country -0.075 -0.096* -0.109 -0.100 (0.056) (0.055) (0.095) (0.096) Post-migration Characteristics Demographics Age 0.028 0.032 0.057 0.031 (0.039) (0.044) (0.044) (0.041) Age² *10-³ -0.250 -0.288 -0.704 -0.405 (0.443) (0.515) (0.548) (0.498) Married 0.091 0.074 -0.304*** -0.237** (0.066) (0.078) (0.116) (0.115) Children under 16 in the Household 0.062 0.078 -0.098 -0.021 (0.044) (0.049) (0.146) (0.133)

30
Table 6. Earnings Regression Results Men Women
Model without Ethnosizers Full Model
Model without Ethnosizers Full Model
Exposure to Germany Years Since Migration (YSM) 0.016 0.015 0.009 -0.003 (0.011) (0.012) (0.019) (0.02) YSM² *10-³ -0.342 -0.365 0.048 0.349 (0.264) (0.279) (0.461) (0.487) Schooling in Germany No Schooling in Germany is the Reference Secondary Degree in Germany 0.020 0.040 0.107 0.113 (0.117) (0.130) (0.146) (0.161) High School Comprehensive in Germany 0.300** 0.288** 0.188 0.252 (0.128) (0.131) (0.182) (0.184) Vocational Degree in Germany -0.061 -0.071 -0.041 0.012 (0.056) (0.070) (0.190) (0.208) College or University in Germany 0.196** 0.226** 0.281 0.290 (0.095) (0.099) (0.260) (0.289) Macroeconomic Indicators Live in a Large City 0.027 0.020 0.273*** 0.278*** (0.045) (0.046) (0.083) (0.086) Work/Company Related Characteristics Length of Time with Firm 0.004 0.005* 0.019*** 0.017*** (0.003) (0.003) (0.005) (0.006) Large Company is the Reference Work in a Small Size Company -0.107 -0.108 -0.345*** -0.368*** (0.072) (0.075) (0.114) (0.117) Work in an Average Size Company -0.063 -0.06 0.040 0.043 (0.046) (0.047) (0.083) (0.091) Industry Dummies Manufacturing is the Reference Service Sector (Hotels, Transport, Post, etc.) -0.105 -0.112 -0.347*** -0.378*** (0.078) (0.078) (0.120) (0.126) Retail, Wholesale, Trade -0.157* -0.158* -0.193 -0.286** (0.082) (0.082) (0.133) (0.133) Government (Education, Defense, Health) 0.148 0.141 -0.080 -0.066 (0.099) (0.101) (0.105) (0.106) Agriculture, Fishing, Mining -0.162* -0.146 -0.134 -0.213 (0.089) (0.101) (0.185) (0.201) Construction 0.044 0.045 0.897*** 0.890*** (0.057) (0.054) (0.243) (0.244) Financial, Banking, Real Estate, Other Business, R&D
0.195 (0.134)
0.208 (0.133)
-0.521*** (0.145)
-0.628*** (0.144)
Ethnosizers Assimilation is the Reference Integration -0.004 -0.046 (0.025) (0.056) Separation -0.022 0.004

31
Table 6. Earnings Regression Results Men Women
Model without Ethnosizers Full Model
Model without Ethnosizers Full Model
(0.027) (0.047) Marginalization -0.013 0.039 (0.036) (0.059) Lambda (inverse Mills ratio) -0.266** -0.267 -0.232 -0.416** (0.139) (0.230) (0.270) (0.217) Log Pseudolikelihood Rho -0.685 -0.697 -0.411 -0.681 (0.292) (0.510) (0.433) (0.261) Sigma 0.388 0.383 0.565 0.611 (0.049) (0.059) (0.066) (0.087) Dependent Variable: Log of Monthly Gross Earnings in Euros (St. Dev)
7.697 (0.425)
6.949 (0.721)
Number of Observations 402 393 263 247 Notes: *significant at 10 percent **significant at 5 percent ***significant at 1 percent (two-tail test; robust standard errors in parentheses). The dependent variable is the natural log of gross monthly earnings. The reference individual is Catholic, Italian, with incomplete schooling in the home country, not married, with no young children, with no schooling in Germany, who works in a large size firm, in the manufacturing sector, and is assimilated.