Embed Size (px)
Citation preview

Two Thousand Five Annual Report
WordsTo Live By
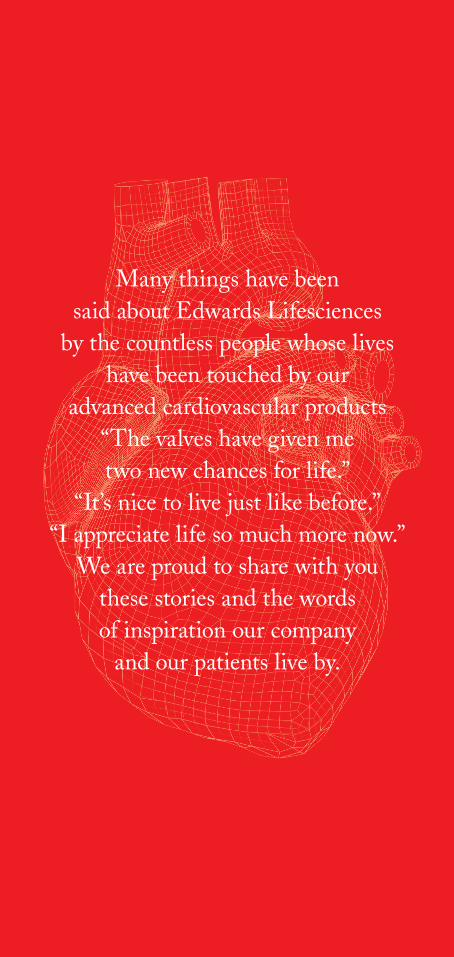
Many things have beensaid about Edwards Lifesciences
by the countless people whose liveshave been touched by our
advanced cardiovascular products“The valves have given metwo new chances for life.”
“It’s nice to live just like before.”“I appreciate life so much more now.”
We are proud to share with youthese stories and the wordsof inspiration our company
and our patients live by.
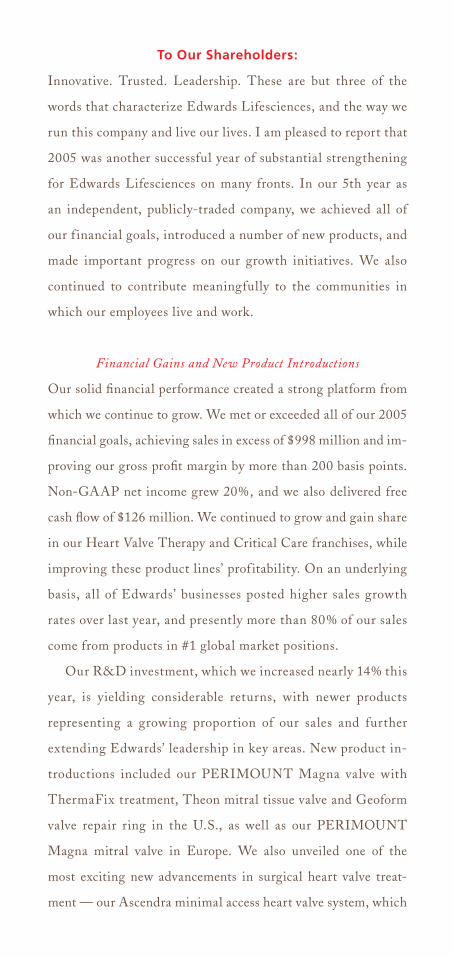
To Our Shareholders:
Innovative. Trusted. Leadership. These are but three of the
words that characterize Edwards Lifesciences, and the way we
run this company and live our lives. I am pleased to report that
2005 was another successful year of substantial strengthening
for Edwards Lifesciences on many fronts. In our 5th year as
an independent, publicly-traded company, we achieved all of
our f inancial goals, introduced a number of new products, and
made important progress on our growth initiatives. We also
continued to contribute meaningfully to the communities in
which our employees live and work.
Financial Gains and New Product Introductions
Our solid financial performance created a strong platform from
which we continue to grow. We met or exceeded all of our 2005
financial goals, achieving sales in excess of $998 million and im-
proving our gross profit margin by more than 200 basis points.
Non-GAAP net income grew 20%, and we also delivered free
cash flow of $126 million. We continued to grow and gain share
in our Heart Valve Therapy and Critical Care franchises, while
improving these product lines’ prof itability. On an underlying
basis, all of Edwards’ businesses posted higher sales growth
rates over last year, and presently more than 80% of our sales
come from products in #1 global market positions.
Our R&D investment, which we increased nearly 14% this
year, is yielding considerable returns, with newer products
representing a growing proportion of our sales and further
extending Edwards’ leadership in key areas. New product in-
troductions included our PERIMOUNT Magna valve with
ThermaFix treatment, Theon mitral tissue valve and Geoform
valve repair ring in the U.S., as well as our PERIMOUNT
Magna mitral valve in Europe. We also unveiled one of the
most exciting new advancements in surgical heart valve treat-
ment — our Ascendra minimal access heart valve system, which
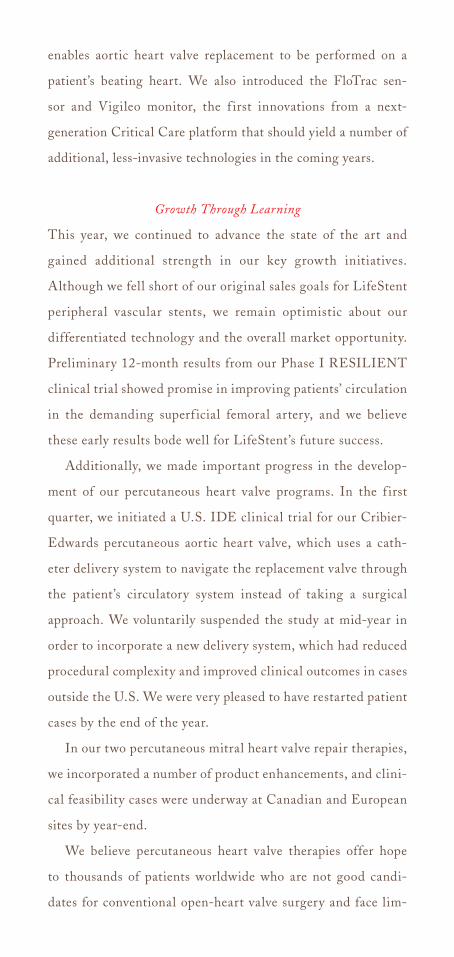
enables aortic heart valve replacement to be performed on a
patient’s beating heart. We also introduced the FloTrac sen-
sor and Vigileo monitor, the f irst innovations from a next-
generation Critical Care platform that should yield a number of
additional, less-invasive technologies in the coming years.
Growth Through Learning
This year, we continued to advance the state of the art and
gained additional strength in our key growth initiatives.
Although we fell short of our original sales goals for LifeStent
peripheral vascular stents, we remain optimistic about our
differentiated technology and the overall market opportunity.
Preliminary 12-month results from our Phase I RESILIENT
clinical trial showed promise in improving patients’ circulation
in the demanding superf icial femoral artery, and we believe
these early results bode well for LifeStent’s future success.
Additionally, we made important progress in the develop-
ment of our percutaneous heart valve programs. In the f irst
quarter, we initiated a U.S. IDE clinical trial for our Cribier-
Edwards percutaneous aortic heart valve, which uses a cath-
eter delivery system to navigate the replacement valve through
the patient’s circulatory system instead of taking a surgical
approach. We voluntarily suspended the study at mid-year in
order to incorporate a new delivery system, which had reduced
procedural complexity and improved clinical outcomes in cases
outside the U.S. We were very pleased to have restarted patient
cases by the end of the year.
In our two percutaneous mitral heart valve repair therapies,
we incorporated a number of product enhancements, and clini-
cal feasibility cases were underway at Canadian and European
sites by year-end.
We believe percutaneous heart valve therapies offer hope
to thousands of patients worldwide who are not good candi-
dates for conventional open-heart valve surgery and face lim-
ited therapeutic options. With the experience gained this year,
we are well-positioned for clinical progress in all of our percu-
taneous valve programs in 2006.
Strengthening Our Communities
With more than 5,400 employees now working in Edwards’
operations globally, we continue extending our connections and
contributions throughout the world. Fueled by the continued
increasing demand for our innovative PERIMOUNT tissue
heart valves, in June we opened a new heart valve manufactur-
ing plant in Singapore to serve growing numbers of customers
and patients.
Additionally, we announced the creation of The Edwards
Lifesciences Fund, a $20 million charitable fund intended
to support advancements in knowledge and improvements in
quality of life, focusing primarily on cardiovascular disease
and the communities where our employees live and work. The
17 organizations that received funds from our f irst grant cycle
will help realize the Fund’s mission by assisting underserved
individuals around the world.
Looking Ahead: Continued Leadership and Innovation
Going forward, Edwards will seek to further extend growth and
leadership in our chosen areas of emphasis: heart valve disease,
critical care technologies and peripheral vascular disease. We
will continue emphasizing differentiated, physician-preference
products with leadership potential, further building upon the
contributions we have been fortunate to make. We also expect
to continue investing aggressively in innovative technologies —
balancing disciplined growth with new platforms that will enable
us to treat even more patients whose conditions are under-
diagnosed or untreated.
For 2006, we are confident in our ability to achieve our finan-
cial goals, generating total sales between $1.02 and $1.06 billion
(equating to an underlying growth rate of 8-10%); increasing
gross profit margin by 150 to 200 basis points; delivering non-
GAAP net income growth of 12-15% excluding the impact of
special items and stock option expensing, and generating free
cash flow of $140 to $150 million.
Over the decades since Miles Lowell Edwards first started
his laboratory, Edwards has pledged to serve as a trusted partner
in the community fighting cardiovascular disease. We remain
a proud member of the medical technology community, which
through its innovations, has contributed to extending patient
longevity, increasing productivity and reducing hospitalizations
around the world.
We expect the demand for Edwards’ technologies to continue
growing, as more patients require treatment for their advanced
cardiovascular conditions, amplified by the increasing aging pop-
ulation and the progressive nature of this disease. While we are
proud of our accomplishments to date, helping patients is our
life’s work, and there is much yet to do. We thank you for your in-
terest and support as we continue to pursue our aspirations while
serving our customers, patients, employees and shareholders.
Sincerely,
Michael A. Mussallem
Chairman & Chief Executive Officer
This letter to shareholders contains f igures that are not prepared in conformity
with Generally Accepted Accounting Principles ( “GA AP”). Management has
determined that inclusion of these non-GA AP f igures provides a more mean-
ing ful comparison of the company’s ongoing operations. For a reconciliation
of GA AP to non-GA AP f igures, see the inside back cover of the accompanying
Annual Report and SEC Form 10-K.

I amnow a better
person, father and husband.Thank you for giving me backeverything that
I was on the verge of losing.
““

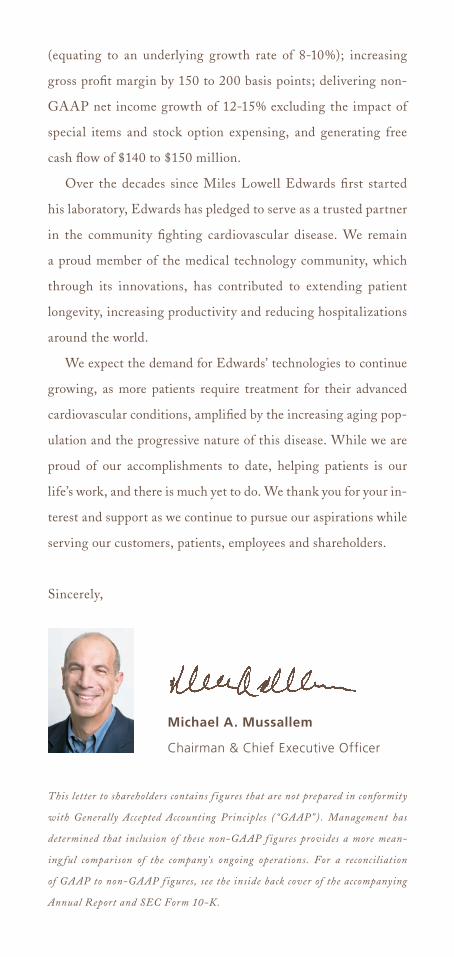
Godefroy
For f ive years, Godefroy B., a 38 year-old father
of two, had been experiencing increasing fatigue,
irritability and impatience, but never considered
the possibility that his symptoms could be related
to a heart condition. It was only after he suffered two
fainting incidents, including one while pulling his
young son on a sled one wintry morning, that doctors
diagnosed a congenitally malformed and severely calcif ied
aortic heart valve that required immediate replacement.
After consulting with his surgeon, Godefroy chose to
receive the Carpentier-Edwards Magna pericardial
heart valve. “The heart valve procedure changed
my life,” he says. “I am now a better person, father
and husband. Thank you for giving me back
everything that I was on the verge of losing.”
Carpentier-Edwards PERIMOUNT Magna Heart Valve
Designed specif ically to optimize patient blood
f low and facilitate placement above the patient’s
native valve opening, Edwards’ PERIMOUNT
Magna aortic valve is the leading heart valve in
the U.S. and the f irst and only therapy of its kind
to combine more than two decades of clinical
experience and innovation with Edwards’
advanced tissue treatment technologies.

I am sograteful to
everyone, thedoctors andthe Edwardsemployees,
for thiswonderful
valve.
““

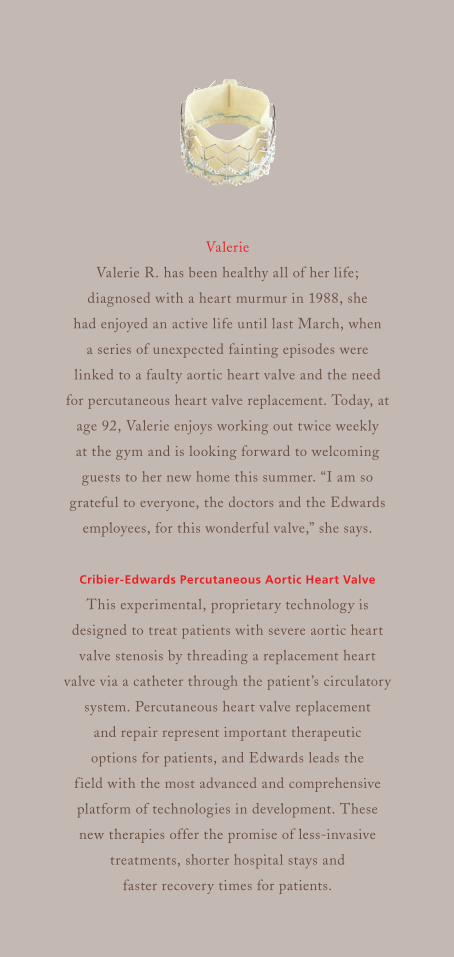
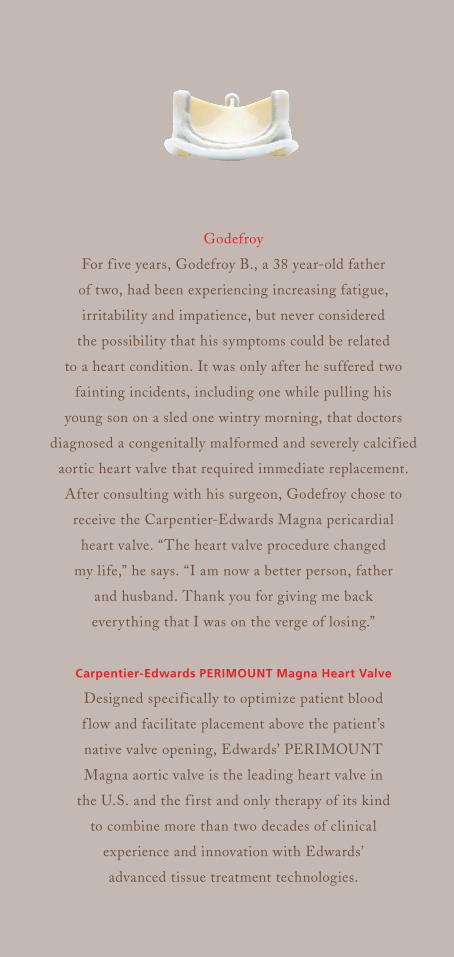
Valerie
Valerie R. has been healthy all of her life;
diagnosed with a heart murmur in 1988, she
had enjoyed an active life until last March, when
a series of unexpected fainting episodes were
linked to a faulty aortic heart valve and the need
for percutaneous heart valve replacement. Today, at
age 92, Valerie enjoys working out twice weekly
at the gym and is looking forward to welcoming
guests to her new home this summer. “I am so
grateful to everyone, the doctors and the Edwards
employees, for this wonderful valve,” she says.
Cribier-Edwards Percutaneous Aortic Heart Valve
This experimental, proprietary technology is
designed to treat patients with severe aortic heart
valve stenosis by threading a replacement heart
valve via a catheter through the patient’s circulatory
system. Percutaneous heart valve replacement
and repair represent important therapeutic
options for patients, and Edwards leads the
f ield with the most advanced and comprehensive
platform of technologies in development. These
new therapies offer the promise of less-invasive
treatments, shorter hospital stays and
faster recovery times for patients.
This is arevolutionaryproduct thatallows nursesto intercede
earlier, leadingto improvedoutcomes for
many patients.
““
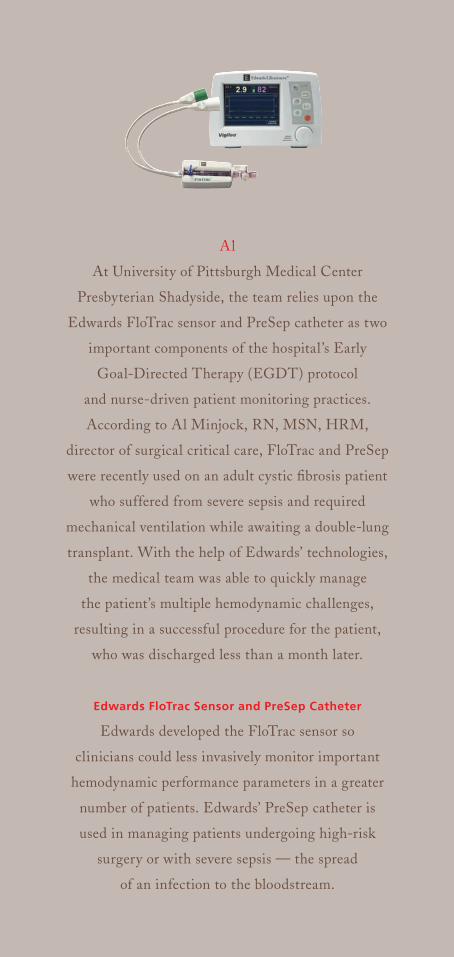
Al
At University of Pittsburgh Medical Center
Presbyterian Shadyside, the team relies upon the
Edwards FloTrac sensor and PreSep catheter as two
important components of the hospital’s Early
Goal-Directed Therapy (EGDT) protocol
and nurse-driven patient monitoring practices.
According to Al Minjock, RN, MSN, HRM,
director of surgical critical care, FloTrac and PreSep
were recently used on an adult cystic fibrosis patient
who suffered from severe sepsis and required
mechanical ventilation while awaiting a double-lung
transplant. With the help of Edwards’ technologies,
the medical team was able to quickly manage
the patient’s multiple hemodynamic challenges,
resulting in a successful procedure for the patient,
who was discharged less than a month later.
Edwards FloTrac Sensor and PreSep Catheter
Edwards developed the FloTrac sensor so
clinicians could less invasively monitor important
hemodynamic performance parameters in a greater
number of patients. Edwards’ PreSep catheter is
used in managing patients undergoing high-risk
surgery or with severe sepsis — the spread
of an infection to the bloodstream.

E D W A R D S L I F E S C I E N C E S C O R P O R A T I O N
One Edwards Way, Irvine, California 92614
(800) 4-A-HEART or (949) 250-2500
www.edwards.com
Two Thousand FiveAnnual Report & SEC Form 10-K
NumbersTo Grow By
E D W A R D S L I F E S C I E N C E S
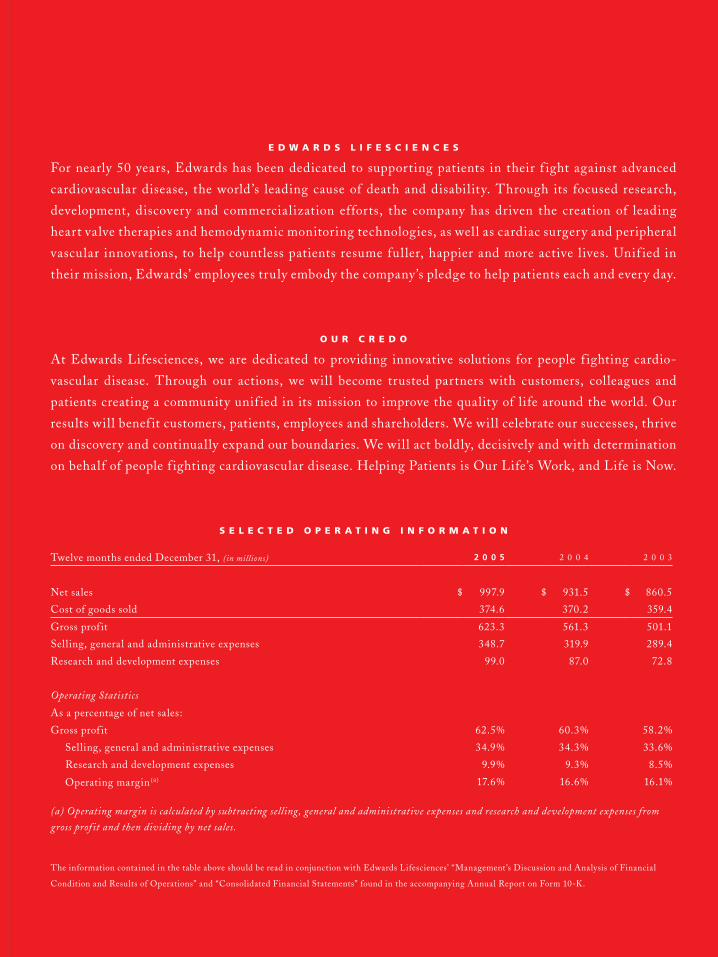
For nearly 50 years, Edwards has been dedicated to supporting patients in their f ight against advanced
cardiovascular disease, the world ’s leading cause of death and disability. Through its focused research,
development, discovery and commercialization efforts, the company has driven the creation of leading
heart valve therapies and hemodynamic monitoring technologies, as well as cardiac surgery and peripheral
vascular innovations, to help countless patients resume fuller, happier and more active lives. Unif ied in
their mission, Edwards’ employees truly embody the company’s pledge to help patients each and every day.
O U R C R E D O
At Edwards Lifesciences, we are dedicated to providing innovative solutions for people f ighting cardio-
vascular disease. Through our actions, we will become trusted partners with customers, colleagues and
patients creating a community unif ied in its mission to improve the quality of life around the world. Our
results will benef it customers, patients, employees and shareholders. We will celebrate our successes, thrive
on discovery and continually expand our boundaries. We will act boldly, decisively and with determination
on behalf of people f ighting cardiovascular disease. Helping Patients is Our Life’s Work, and Life is Now.
S E L E C T E D O P E R A T I N G I N F O R M A T I O N
Twelve months ended December 31, (in millions) 2 0 0 5 2 0 0 4 2 0 0 3
Net sales $ 997.9 $ 931.5 $ 860.5
Cost of goods sold 374.6 370.2 359.4
Gross prof it 623.3 561.3 501.1
Selling, general and administrative expenses 348.7 319.9 289.4
Research and development expenses 99.0 87.0 72.8
Operating Statistics
As a percentage of net sales:
Gross prof it 62.5% 60.3% 58.2%
Selling, general and administrative expenses 34.9% 34.3% 33.6%
Research and development expenses 9.9% 9.3% 8.5%
Operating margin(a) 17.6% 16.6% 16.1%
(a) Operating margin is calculated by subtracting selling, general and administrative expenses and research and development expenses from
gross profit and then dividing by net sales.
The information contained in the table above should be read in conjunction with Edwards Lifesciences’ “Management’s Discussion and Analysis of Financial
Condition and Results of Operations” and “Consolidated Financial Statements” found in the accompanying Annual Report on Form 10-K.
Corporate Headquarters
Edwards Lifesciences Corporation
One Edwards Way, Irvine, CA 92614
(800) 4-A-HEART or (949) 250-2500
www.edwards.com
Annual Meeting
The Annual Meeting of Shareholders
will be held on May 11, 2006 at
10:00 a.m. (Pacific) at the offices of
Edwards Lifesciences Corporation,
One Edwards Way, Irvine, CA 92614.
SEC Form 10-K
A copy of Edwards Lifesciences’
annual report to the Securities and
Exchange Commission on Form 10-K
is available on the company’s web
site at www.edwards.com or upon
request to the Investor Relations
department at (949) 250-2806.
Stock Symbol
Edwards Lifesciences’
stock is traded on
The New York Stock Exchange
(NYSE) under the symbol EW.
Information on the Internet
Edwards Lifesciences’ web site at
www.edwards.com provides a wide
range of information for customers,
patients and shareholders. Persons
interested in investing in Edwards
Lifesciences are invited to visit the
“Investor Relations” section of the
web site to access press releases, SEC
filings and other company information.
Corporate Public Relations
Members of the news media
should call (949) 250-5070.
Investor Information
Shareholders, securities analysts and
investors seeking additional information
about Edwards Lifesciences should contact:
David K. Erickson
Vice President, Investor Relations
(949) 250-2806 Phone
(949) 250-2248 Fax
Analyst Coverage
For a list of research firms and
analysts who cover Edwards
Lifesciences, please visit the Investor
Relations section of the company’s
web site at www.edwards.com.
Transfer Agent
Correspondence about share ownership,
account status, the transfer or exchange
of shares, lost stock certificates, duplicate
mailings or change of address may be
directed to:
Computershare Investor Services
P.O. Box 43069,
Providence, RI 02940-3069
(800) 756-8200
Hearing impaired # TDD: (800) 952-9245
hwww.computershare.com
Independent Registered
Public Accounting Firm
PricewaterhouseCoopers LLP
Orange County, CA
Board of Directors
Michael A. Mussallem
Chairman & Chief Executive Officer,
Edwards Lifesciences Corporation
Mike R. Bowlin
Former Chairman &
Chief Executive Officer,
Atlantic Richfield Company
John T. Cardis
Former Partner
Deloitte & Touche
Robert Ingram
Vice Chairman, Pharmaceuticals,
GlaxoSmithKline
Vernon R. Loucks Jr.
Chairman,
The Aethena Group, LLC
Barbara J. McNeil, M.D., Ph.D.
Professor and Chair,
Department of Health Care Policy,
Harvard Medical School
Philip M. Neal
Former Chairman &
Chief Executive Officer,
Avery Dennison Corporation
David E.I. Pyott
Chairman & Chief Executive Officer,
Allergan, Inc.
Edwards Lifesciences is an affirmative
action, equal opportunity employer.
C O R P O R A T E I N F O R M A T I O N
E D W A R D S L I F E S C I E N C E S C O R P O R A T I O N
One Edwards Way, Irvine, California 92614
(800) 4-A-HEART or (949) 250-2500
www.edwards.com
E D W A R D S L I F E S C I E N C E S
For nearly 50 years, Edwards has been dedicated to supporting patients in their f ight against advanced
cardiovascular disease, the world ’s leading cause of death and disability. Through its focused research,
development, discovery and commercialization efforts, the company has driven the creation of leading
heart valve therapies and hemodynamic monitoring technologies, as well as cardiac surgery and peripheral
vascular innovations, to help countless patients resume fuller, happier and more active lives. Unif ied in
their mission, Edwards’ employees truly embody the company’s pledge to help patients each and every day.
O U R C R E D O
At Edwards Lifesciences, we are dedicated to providing innovative solutions for people f ighting cardio-
vascular disease. Through our actions, we will become trusted partners with customers, colleagues and
patients creating a community unif ied in its mission to improve the quality of life around the world. Our
results will benef it customers, patients, employees and shareholders. We will celebrate our successes, thrive
on discovery and continually expand our boundaries. We will act boldly, decisively and with determination
on behalf of people f ighting cardiovascular disease. Helping Patients is Our Life’s Work, and Life is Now.
S E L E C T E D O P E R A T I N G I N F O R M A T I O N
Twelve months ended December 31, (in millions) 2 0 0 5 2 0 0 4 2 0 0 3
Net sales $ 997.9 $ 931.5 $ 860.5
Cost of goods sold 374.6 370.2 359.4
Gross prof it 623.3 561.3 501.1
Selling, general and administrative expenses 348.7 319.9 289.4
Research and development expenses 99.0 87.0 72.8
Operating Statistics
As a percentage of net sales:
Gross prof it 62.5% 60.3% 58.2%
Selling, general and administrative expenses 34.9% 34.3% 33.6%
Research and development expenses 9.9% 9.3% 8.5%
Operating margin(a) 17.6% 16.6% 16.1%
(a) Operating margin is calculated by subtracting selling, general and administrative expenses and research and development expenses from
gross profit and then dividing by net sales.
The information contained in the table above should be read in conjunction with Edwards Lifesciences’ “Management’s Discussion and Analysis of Financial
Condition and Results of Operations” and “Consolidated Financial Statements” found in the accompanying Annual Report on Form 10-K.
To supplement the consolidated f inancial results prepared in accordance with Generally Accepted Accounting Principles (“GAAP”), the
Company uses non-GAAP f inancial measures that exclude certain items, such as in-process research and development expenses, special
charges and credits, and results of discontinued businesses. Management does not consider the excluded items part of day-to-day business
or ref lective of the core operational activities of the Company as they result from transactions outside the ordinary course of business.
Management uses non-GAAP f inancial measures internally for strategic decision making, forecasting future results and evaluating current
performance. Guidance is provided only on a non-GAAP basis due to the inherent diff iculty in forecasting such items. By disclosing non-
GAAP f inancial measures, management intends to provide investors with a more meaningful, consistent comparison of the Company’s core
operating results and trends for the periods presented.
Non-GAAP f inancial measures are not prepared in accordance with GAAP; therefore, the information is not necessarily comparable to
other companies and should be considered as a supplement to, not a substitute for, or superior to, the corresponding measures calculated in
accordance with GAAP. See “Management’s Discussion and Analysis of Financial Condition and Results of Operations” and “Notes to the
Consolidated Financial Statements.”
R E C O N C I L I A T I O N O F G A A P T O N O N - G A A P F I G U R E S
Non-GAAP Net Income 2001-2005
Twelve months ended December 31, (in millions, except per share data) 2 0 0 5 2 0 0 4 2 0 0 3 2 0 0 2 2 0 0 1
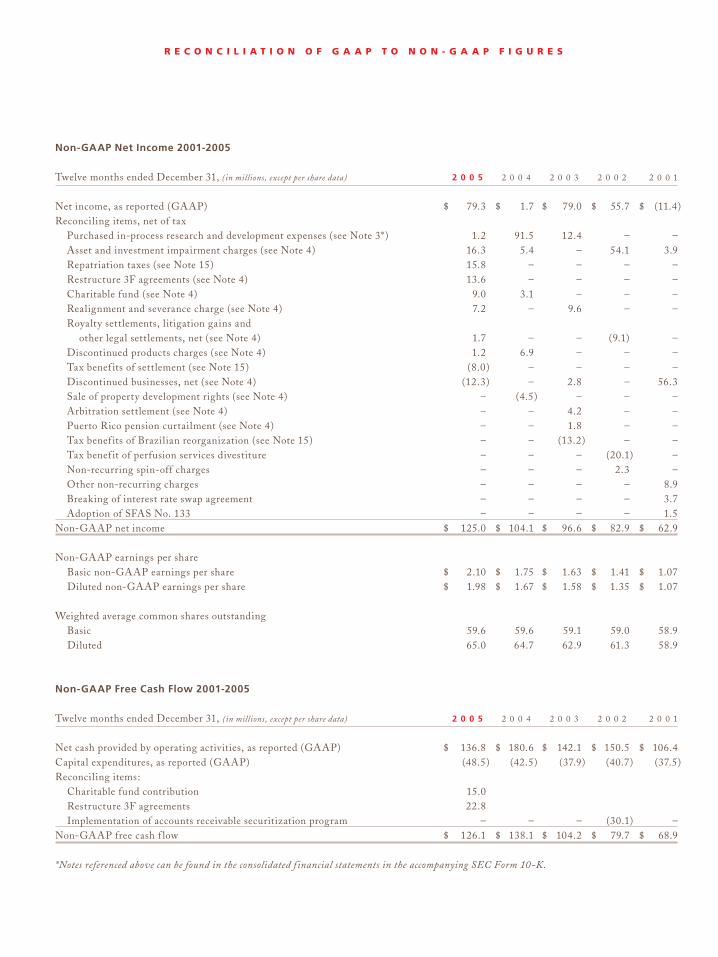
Net income, as reported (GAAP) $ 79.3 $ 1.7 $ 79.0 $ 55.7 $ (11.4)Reconciling items, net of tax Purchased in-process research and development expenses (see Note 3*) 1.2 91.5 12.4 – – Asset and investment impairment charges (see Note 4) 16.3 5.4 – 54.1 3.9 Repatriation taxes (see Note 15) 15.8 – – – – Restructure 3F agreements (see Note 4) 13.6 – – – – Charitable fund (see Note 4) 9.0 3.1 – – – Realignment and severance charge (see Note 4) 7.2 – 9.6 – – Royalty settlements, litigation gains and other legal settlements, net (see Note 4) 1.7 – – (9.1) – Discontinued products charges (see Note 4) 1.2 6.9 – – – Tax benef its of settlement (see Note 15) (8.0) – – – – Discontinued businesses, net (see Note 4) (12.3) – 2.8 – 56.3 Sale of property development rights (see Note 4) – (4.5) – – – Arbitration settlement (see Note 4) – – 4.2 – – Puerto Rico pension curtailment (see Note 4) – – 1.8 – – Tax benef its of Brazilian reorganization (see Note 15) – – (13.2) – – Tax benef it of perfusion services divestiture – – – (20.1) – Non-recurring spin-off charges – – – 2.3 – Other non-recurring charges – – – – 8.9 Breaking of interest rate swap agreement – – – – 3.7 Adoption of SFAS No. 133 – – – – 1.5 Non-GAAP net income $ 125.0 $ 104.1 $ 96.6 $ 82.9 $ 62.9
Non-GAAP earnings per share Basic non-GAAP earnings per share $ 2.10 $ 1.75 $ 1.63 $ 1.41 $ 1.07 Diluted non-GAAP earnings per share $ 1.98 $ 1.67 $ 1.58 $ 1.35 $ 1.07
Weighted average common shares outstanding Basic 59.6 59.6 59.1 59.0 58.9 Diluted 65.0 64.7 62.9 61.3 58.9 Non-GAAP Free Cash Flow 2001-2005 Twelve months ended December 31, (in millions, except per share data) 2 0 0 5 2 0 0 4 2 0 0 3 2 0 0 2 2 0 0 1
Net cash provided by operating activities, as reported (GAAP) $ 136.8 $ 180.6 $ 142.1 $ 150.5 $ 106.4 Capital expenditures, as reported (GAAP) (48.5) (42.5) (37.9) (40.7) (37.5)Reconciling items: Charitable fund contribution 15.0 Restructure 3F agreements 22.8 Implementation of accounts receivable securitization program – – – (30.1) – Non-GAAP free cash f low $ 126.1 $ 138.1 $ 104.2 $ 79.7 $ 68.9
*Notes referenced above can be found in the consolidated f inancial statements in the accompanying SEC Form 10-K.
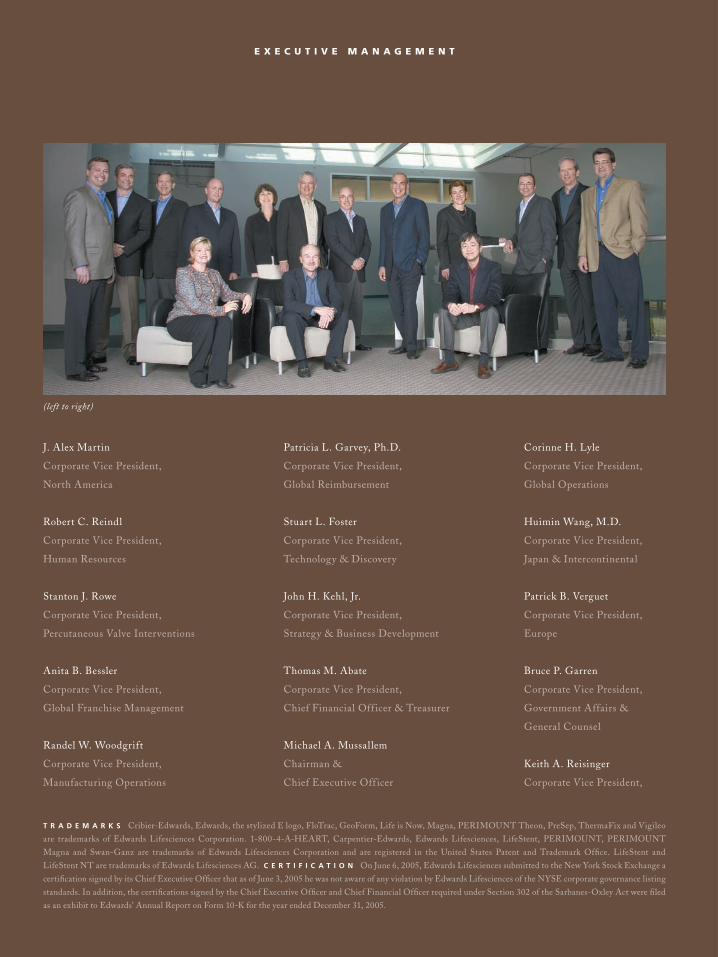
R E C O N C I L I A T I O N O F G A A P T O N O N - G A A P F I G U R E SE X E C U T I V E M A N A G E M E N T
J. Alex Martin
Corporate Vice President,
North America
Robert C. Reindl
Corporate Vice President,
Human Resources
Stanton J. Rowe
Corporate Vice President,
Percutaneous Valve Interventions
Anita B. Bessler
Corporate Vice President,
Global Franchise Management
Randel W. Woodgrift
Corporate Vice President,
Manufacturing Operations
Patricia L. Garvey, Ph.D.
Corporate Vice President,
Global Reimbursement
Stuart L. Foster
Corporate Vice President,
Technology & Discovery
John H. Kehl, Jr.
Corporate Vice President,
Strategy & Business Development
Thomas M. Abate
Corporate Vice President,
Chief Financial Off icer & Treasurer
Michael A. Mussallem
Chairman &
Chief Executive Off icer
Corinne H. Lyle
Corporate Vice President,
Global Operations
Huimin Wang, M.D.
Corporate Vice President,
Japan & Intercontinental
Patrick B. Verguet
Corporate Vice President,
Europe
Bruce P. Garren
Corporate Vice President,
Government Affairs &
General Counsel
Keith A. Reisinger
Corporate Vice President,
(left to right)
T R A D E M A R K S Cribier-Edwards, Edwards, the stylized E logo, FloTrac, GeoForm, Life is Now, Magna, PERIMOUNT Theon, PreSep, ThermaFix and Vigileo
are trademarks of Edwards Lifesciences Corporation. 1-800-4-A-HEART, Carpentier-Edwards, Edwards Lifesciences, LifeStent, PERIMOUNT, PERIMOUNT
Magna and Swan-Ganz are trademarks of Edwards Lifesciences Corporation and are registered in the United States Patent and Trademark Office. LifeStent and
LifeStent NT are trademarks of Edwards Lifesciences AG. C E R T I F I C A T I O N On June 6, 2005, Edwards Lifesciences submitted to the New York Stock Exchange a
certification signed by its Chief Executive Officer that as of June 3, 2005 he was not aware of any violation by Edwards Lifesciences of the NYSE corporate governance listing
standards. In addition, the certifications signed by the Chief Executive Officer and Chief Financial Officer required under Section 302 of the Sarbanes-Oxley Act were filed
as an exhibit to Edwards’ Annual Report on Form 10-K for the year ended December 31, 2005.
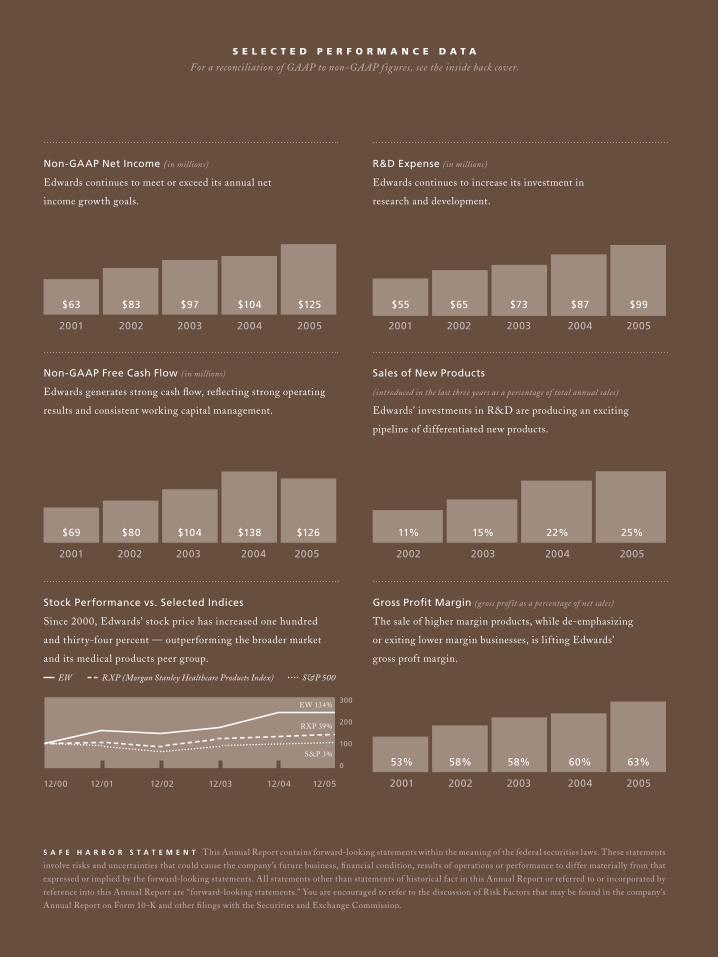
Stock Performance vs. Selected Indices
Since 2000, Edwards’ stock price has increased one hundred
and thirty-four percent — outperforming the broader market
and its medical products peer group.
EW RXP (Morgan Stanley Healthcare Products Index) S&P 500
12/00 12/01 12/02 12/03 12/04 12/05
S A F E H A R B O R S T A T E M E N T This Annual Report contains forward-looking statements within the meaning of the federal securities laws. These statements
involve risks and uncertainties that could cause the company’s future business, financial condition, results of operations or performance to differ materially from that
expressed or implied by the forward-looking statements. All statements other than statements of historical fact in this Annual Report or referred to or incorporated by
reference into this Annual Report are “forward-looking statements.” You are encouraged to refer to the discussion of Risk Factors that may be found in the company’s
Annual Report on Form 10-K and other filings with the Securities and Exchange Commission.
300
200
100
0
EW 134%
RXP 39%
S&P 3%
S E L E C T E D P E R F O R M A N C E D A T A
For a reconciliation of GAAP to non-GAAP figures, see the inside back cover.
Gross Profit Margin (gross profit as a percentage of net sales)
The sale of higher margin products, while de-emphasizing
or exiting lower margin businesses, is lifting Edwards’
gross proft margin.
53% 58% 58% 60% 63%
2001 2002 2003 2004 2005
Sales of New Products
(introduced in the last three years as a percentage of total annual sales)
Edwards’ investments in R&D are producing an exciting
pipeline of differentiated new products.
11% 15% 22% 25%
2002 2003 2004 2005
R&D Expense (in millions)
Edwards continues to increase its investment in
research and development.
$55 $65 $73 $87 $99
2001 2002 2003 2004 2005
Non-GAAP Net Income (in millions)
Edwards continues to meet or exceed its annual net
income growth goals.
$63 $83 $97 $104 $125
2001 2002 2003 2004 2005
Non-GAAP Free Cash Flow (in millions)
Edwards generates strong cash flow, reflecting strong operating
results and consistent working capital management.
$69 $80 $104 $138 $126
2001 2002 2003 2004 2005
To supplement the consolidated f inancial results prepared in accordance with Generally Accepted Accounting Principles (“GAAP”), the
Company uses non-GAAP f inancial measures that exclude certain items, such as in-process research and development expenses, special
charges and credits, and results of discontinued businesses. Management does not consider the excluded items part of day-to-day business
or ref lective of the core operational activities of the Company as they result from transactions outside the ordinary course of business.
Management uses non-GAAP f inancial measures internally for strategic decision making, forecasting future results and evaluating current
performance. Guidance is provided only on a non-GAAP basis due to the inherent diff iculty in forecasting such items. By disclosing non-
GAAP f inancial measures, management intends to provide investors with a more meaningful, consistent comparison of the Company’s core
operating results and trends for the periods presented.
Non-GAAP f inancial measures are not prepared in accordance with GAAP; therefore, the information is not necessarily comparable to
other companies and should be considered as a supplement to, not a substitute for, or superior to, the corresponding measures calculated in
accordance with GAAP. See “Management’s Discussion and Analysis of Financial Condition and Results of Operations” and “Notes to the
Consolidated Financial Statements.”
R E C O N C I L I A T I O N O F G A A P T O N O N - G A A P F I G U R E S
Non-GAAP Net Income 2001-2005
Twelve months ended December 31, (in millions, except per share data) 2 0 0 5 2 0 0 4 2 0 0 3 2 0 0 2 2 0 0 1
Net income, as reported (GAAP) $ 79.3 $ 1.7 $ 79.0 $ 55.7 $ (11.4)Reconciling items, net of tax Purchased in-process research and development expenses (see Note 3*) 1.2 91.5 12.4 – – Asset and investment impairment charges (see Note 4) 16.3 5.4 – 54.1 3.9 Repatriation taxes (see Note 15) 15.8 – – – – Restructure 3F agreements (see Note 4) 13.6 – – – – Charitable fund (see Note 4) 9.0 3.1 – – – Realignment and severance charge (see Note 4) 7.2 – 9.6 – – Royalty settlements, litigation gains and other legal settlements, net (see Note 4) 1.7 – – (9.1) – Discontinued products charges (see Note 4) 1.2 6.9 – – – Tax benef its of settlement (see Note 15) (8.0) – – – – Discontinued businesses, net (see Note 4) (12.3) – 2.8 – 56.3 Sale of property development rights (see Note 4) – (4.5) – – – Arbitration settlement (see Note 4) – – 4.2 – – Puerto Rico pension curtailment (see Note 4) – – 1.8 – – Tax benef its of Brazilian reorganization (see Note 15) – – (13.2) – – Tax benef it of perfusion services divestiture – – – (20.1) – Non-recurring spin-off charges – – – 2.3 – Other non-recurring charges – – – – 8.9 Breaking of interest rate swap agreement – – – – 3.7 Adoption of SFAS No. 133 – – – – 1.5 Non-GAAP net income $ 125.0 $ 104.1 $ 96.6 $ 82.9 $ 62.9
Non-GAAP earnings per share Basic non-GAAP earnings per share $ 2.10 $ 1.75 $ 1.63 $ 1.41 $ 1.07 Diluted non-GAAP earnings per share $ 1.98 $ 1.67 $ 1.58 $ 1.35 $ 1.07
Weighted average common shares outstanding Basic 59.6 59.6 59.1 59.0 58.9 Diluted 65.0 64.7 62.9 61.3 58.9 Non-GAAP Free Cash Flow 2001-2005 Twelve months ended December 31, (in millions, except per share data) 2 0 0 5 2 0 0 4 2 0 0 3 2 0 0 2 2 0 0 1
Net cash provided by operating activities, as reported (GAAP) $ 136.8 $ 180.6 $ 142.1 $ 150.5 $ 106.4 Capital expenditures, as reported (GAAP) (48.5) (42.5) (37.9) (40.7) (37.5)Reconciling items: Charitable fund contribution 15.0 Restructure 3F agreements 22.8 Implementation of accounts receivable securitization program – – – (30.1) – Non-GAAP free cash f low $ 126.1 $ 138.1 $ 104.2 $ 79.7 $ 68.9
*Notes referenced above can be found in the consolidated f inancial statements in the accompanying SEC Form 10-K.
R E C O N C I L I A T I O N O F G A A P T O N O N - G A A P F I G U R E SE X E C U T I V E M A N A G E M E N T
J. Alex Martin
Corporate Vice President,
North America
Robert C. Reindl
Corporate Vice President,
Human Resources
Stanton J. Rowe
Corporate Vice President,
Percutaneous Valve Interventions
Anita B. Bessler
Corporate Vice President,
Global Franchise Management
Randel W. Woodgrift
Corporate Vice President,
Manufacturing Operations
Patricia L. Garvey, Ph.D.
Corporate Vice President,
Global Reimbursement
Stuart L. Foster
Corporate Vice President,
Technology & Discovery
John H. Kehl, Jr.
Corporate Vice President,
Strategy & Business Development
Thomas M. Abate
Corporate Vice President,
Chief Financial Off icer & Treasurer
Michael A. Mussallem
Chairman &
Chief Executive Off icer
Corinne H. Lyle
Corporate Vice President,
Global Operations
Huimin Wang, M.D.
Corporate Vice President,
Japan & Intercontinental
Patrick B. Verguet
Corporate Vice President,
Europe
Bruce P. Garren
Corporate Vice President,
Government Affairs &
General Counsel
Keith A. Reisinger
Corporate Vice President,
(left to right)
T R A D E M A R K S Cribier-Edwards, Edwards, the stylized E logo, FloTrac, GeoForm, Life is Now, Magna, PERIMOUNT Theon, PreSep, ThermaFix and Vigileo
are trademarks of Edwards Lifesciences Corporation. 1-800-4-A-HEART, Carpentier-Edwards, Edwards Lifesciences, LifeStent, PERIMOUNT, PERIMOUNT
Magna and Swan-Ganz are trademarks of Edwards Lifesciences Corporation and are registered in the United States Patent and Trademark Office. LifeStent and
LifeStent NT are trademarks of Edwards Lifesciences AG. C E R T I F I C A T I O N On June 6, 2005, Edwards Lifesciences submitted to the New York Stock Exchange a
certification signed by its Chief Executive Officer that as of June 3, 2005 he was not aware of any violation by Edwards Lifesciences of the NYSE corporate governance listing
standards. In addition, the certifications signed by the Chief Executive Officer and Chief Financial Officer required under Section 302 of the Sarbanes-Oxley Act were filed
as an exhibit to Edwards’ Annual Report on Form 10-K for the year ended December 31, 2005.
Stock Performance vs. Selected Indices
Since 2000, Edwards’ stock price has increased one hundred
and thirty-four percent — outperforming the broader market
and its medical products peer group.
EW RXP (Morgan Stanley Healthcare Products Index) S&P 500
12/00 12/01 12/02 12/03 12/04 12/05
S A F E H A R B O R S T A T E M E N T This Annual Report contains forward-looking statements within the meaning of the federal securities laws. These statements
involve risks and uncertainties that could cause the company’s future business, financial condition, results of operations or performance to differ materially from that
expressed or implied by the forward-looking statements. All statements other than statements of historical fact in this Annual Report or referred to or incorporated by
reference into this Annual Report are “forward-looking statements.” You are encouraged to refer to the discussion of Risk Factors that may be found in the company’s
Annual Report on Form 10-K and other filings with the Securities and Exchange Commission.
300
200
100
0
EW 134%
RXP 39%
S&P 3%
S E L E C T E D P E R F O R M A N C E D A T A
For a reconciliation of GAAP to non-GAAP figures, see the inside back cover.
Gross Profit Margin (gross profit as a percentage of net sales)
The sale of higher margin products, while de-emphasizing
or exiting lower margin businesses, is lifting Edwards’
gross proft margin.
53% 58% 58% 60% 63%
2001 2002 2003 2004 2005
Sales of New Products
(introduced in the last three years as a percentage of total annual sales)
Edwards’ investments in R&D are producing an exciting
pipeline of differentiated new products.
11% 15% 22% 25%
2002 2003 2004 2005
R&D Expense (in millions)
Edwards continues to increase its investment in
research and development.
$55 $65 $73 $87 $99
2001 2002 2003 2004 2005
Non-GAAP Net Income (in millions)
Edwards continues to meet or exceed its annual net
income growth goals.
$63 $83 $97 $104 $125
2001 2002 2003 2004 2005
Non-GAAP Free Cash Flow (in millions)
Edwards generates strong cash flow, reflecting strong operating
results and consistent working capital management.
$69 $80 $104 $138 $126
2001 2002 2003 2004 2005
Two Thousand FiveAnnual Report & SEC Form 10-K
NumbersTo Grow By
E D W A R D S L I F E S C I E N C E S
For nearly 50 years, Edwards has been dedicated to supporting patients in their f ight against advanced
cardiovascular disease, the world ’s leading cause of death and disability. Through its focused research,
development, discovery and commercialization efforts, the company has driven the creation of leading
heart valve therapies and hemodynamic monitoring technologies, as well as cardiac surgery and peripheral
vascular innovations, to help countless patients resume fuller, happier and more active lives. Unif ied in
their mission, Edwards’ employees truly embody the company’s pledge to help patients each and every day.
O U R C R E D O
At Edwards Lifesciences, we are dedicated to providing innovative solutions for people f ighting cardio-
vascular disease. Through our actions, we will become trusted partners with customers, colleagues and
patients creating a community unif ied in its mission to improve the quality of life around the world. Our
results will benef it customers, patients, employees and shareholders. We will celebrate our successes, thrive
on discovery and continually expand our boundaries. We will act boldly, decisively and with determination
on behalf of people f ighting cardiovascular disease. Helping Patients is Our Life’s Work, and Life is Now.
S E L E C T E D O P E R A T I N G I N F O R M A T I O N
Twelve months ended December 31, (in millions) 2 0 0 5 2 0 0 4 2 0 0 3
Net sales $ 997.9 $ 931.5 $ 860.5
Cost of goods sold 374.6 370.2 359.4
Gross prof it 623.3 561.3 501.1
Selling, general and administrative expenses 348.7 319.9 289.4
Research and development expenses 99.0 87.0 72.8
Operating Statistics
As a percentage of net sales:
Gross prof it 62.5% 60.3% 58.2%
Selling, general and administrative expenses 34.9% 34.3% 33.6%
Research and development expenses 9.9% 9.3% 8.5%
Operating margin(a) 17.6% 16.6% 16.1%
(a) Operating margin is calculated by subtracting selling, general and administrative expenses and research and development expenses from
gross profit and then dividing by net sales.
The information contained in the table above should be read in conjunction with Edwards Lifesciences’ “Management’s Discussion and Analysis of Financial
Condition and Results of Operations” and “Consolidated Financial Statements” found in the accompanying Annual Report on Form 10-K.
Corporate Headquarters
Edwards Lifesciences Corporation
One Edwards Way, Irvine, CA 92614
(800) 4-A-HEART or (949) 250-2500
www.edwards.com
Annual Meeting
The Annual Meeting of Shareholders
will be held on May 11, 2006 at
10:00 a.m. (Pacific) at the offices of
Edwards Lifesciences Corporation,
One Edwards Way, Irvine, CA 92614.
SEC Form 10-K
A copy of Edwards Lifesciences’
annual report to the Securities and
Exchange Commission on Form 10-K
is available on the company’s web
site at www.edwards.com or upon
request to the Investor Relations
department at (949) 250-2806.
Stock Symbol
Edwards Lifesciences’
stock is traded on
The New York Stock Exchange
(NYSE) under the symbol EW.
Information on the Internet
Edwards Lifesciences’ web site at
www.edwards.com provides a wide
range of information for customers,
patients and shareholders. Persons
interested in investing in Edwards
Lifesciences are invited to visit the
“Investor Relations” section of the
web site to access press releases, SEC
filings and other company information.
Corporate Public Relations
Members of the news media
should call (949) 250-5070.
Investor Information
Shareholders, securities analysts and
investors seeking additional information
about Edwards Lifesciences should contact:
David K. Erickson
Vice President, Investor Relations
(949) 250-2806 Phone
(949) 250-2248 Fax
Analyst Coverage
For a list of research firms and
analysts who cover Edwards
Lifesciences, please visit the Investor
Relations section of the company’s
web site at www.edwards.com.
Transfer Agent
Correspondence about share ownership,
account status, the transfer or exchange
of shares, lost stock certificates, duplicate
mailings or change of address may be
directed to:
Computershare Investor Services
P.O. Box 43069,
Providence, RI 02940-3069
(800) 756-8200
Hearing impaired # TDD: (800) 952-9245
hwww.computershare.com
Independent Registered
Public Accounting Firm
PricewaterhouseCoopers LLP
Orange County, CA
Board of Directors
Michael A. Mussallem
Chairman & Chief Executive Officer,
Edwards Lifesciences Corporation
Mike R. Bowlin
Former Chairman &
Chief Executive Officer,
Atlantic Richfield Company
John T. Cardis
Former Partner
Deloitte & Touche
Robert Ingram
Vice Chairman, Pharmaceuticals,
GlaxoSmithKline
Vernon R. Loucks Jr.
Chairman,
The Aethena Group, LLC
Barbara J. McNeil, M.D., Ph.D.
Professor and Chair,
Department of Health Care Policy,
Harvard Medical School
Philip M. Neal
Former Chairman &
Chief Executive Officer,
Avery Dennison Corporation
David E.I. Pyott
Chairman & Chief Executive Officer,
Allergan, Inc.
Edwards Lifesciences is an affirmative
action, equal opportunity employer.
C O R P O R A T E I N F O R M A T I O N
To supplement the consolidated f inancial results prepared in accordance with Generally Accepted Accounting Principles (“GAAP”), the
Company uses non-GAAP f inancial measures that exclude certain items, such as in-process research and development expenses, special
charges and credits, and results of discontinued businesses. Management does not consider the excluded items part of day-to-day business
or ref lective of the core operational activities of the Company as they result from transactions outside the ordinary course of business.
Management uses non-GAAP f inancial measures internally for strategic decision making, forecasting future results and evaluating current
performance. Guidance is provided only on a non-GAAP basis due to the inherent diff iculty in forecasting such items. By disclosing non-
GAAP f inancial measures, management intends to provide investors with a more meaningful, consistent comparison of the Company’s core
operating results and trends for the periods presented.
Non-GAAP f inancial measures are not prepared in accordance with GAAP; therefore, the information is not necessarily comparable to
other companies and should be considered as a supplement to, not a substitute for, or superior to, the corresponding measures calculated in
accordance with GAAP. See “Management’s Discussion and Analysis of Financial Condition and Results of Operations” and “Notes to the
Consolidated Financial Statements.”
R E C O N C I L I A T I O N O F G A A P T O N O N - G A A P F I G U R E S
Non-GAAP Net Income 2001-2005
Twelve months ended December 31, (in millions, except per share data) 2 0 0 5 2 0 0 4 2 0 0 3 2 0 0 2 2 0 0 1
Net income, as reported (GAAP) $ 79.3 $ 1.7 $ 79.0 $ 55.7 $ (11.4)Reconciling items, net of tax Purchased in-process research and development expenses (see Note 3*) 1.2 91.5 12.4 – – Asset and investment impairment charges (see Note 4) 16.3 5.4 – 54.1 3.9 Repatriation taxes (see Note 15) 15.8 – – – – Restructure 3F agreements (see Note 4) 13.6 – – – – Charitable fund (see Note 4) 9.0 3.1 – – – Realignment and severance charge (see Note 4) 7.2 – 9.6 – – Royalty settlements, litigation gains and other legal settlements, net (see Note 4) 1.7 – – (9.1) – Discontinued products charges (see Note 4) 1.2 6.9 – – – Tax benef its of settlement (see Note 15) (8.0) – – – – Discontinued businesses, net (see Note 4) (12.3) – 2.8 – 56.3 Sale of property development rights (see Note 4) – (4.5) – – – Arbitration settlement (see Note 4) – – 4.2 – – Puerto Rico pension curtailment (see Note 4) – – 1.8 – – Tax benef its of Brazilian reorganization (see Note 15) – – (13.2) – – Tax benef it of perfusion services divestiture – – – (20.1) – Non-recurring spin-off charges – – – 2.3 – Other non-recurring charges – – – – 8.9 Breaking of interest rate swap agreement – – – – 3.7 Adoption of SFAS No. 133 – – – – 1.5 Non-GAAP net income $ 125.0 $ 104.1 $ 96.6 $ 82.9 $ 62.9
Non-GAAP earnings per share Basic non-GAAP earnings per share $ 2.10 $ 1.75 $ 1.63 $ 1.41 $ 1.07 Diluted non-GAAP earnings per share $ 1.98 $ 1.67 $ 1.58 $ 1.35 $ 1.07
Weighted average common shares outstanding Basic 59.6 59.6 59.1 59.0 58.9 Diluted 65.0 64.7 62.9 61.3 58.9 Non-GAAP Free Cash Flow 2001-2005 Twelve months ended December 31, (in millions, except per share data) 2 0 0 5 2 0 0 4 2 0 0 3 2 0 0 2 2 0 0 1
Net cash provided by operating activities, as reported (GAAP) $ 136.8 $ 180.6 $ 142.1 $ 150.5 $ 106.4 Capital expenditures, as reported (GAAP) (48.5) (42.5) (37.9) (40.7) (37.5)Reconciling items: Charitable fund contribution 15.0 Restructure 3F agreements 22.8 Implementation of accounts receivable securitization program – – – (30.1) – Non-GAAP free cash f low $ 126.1 $ 138.1 $ 104.2 $ 79.7 $ 68.9
*Notes referenced above can be found in the consolidated f inancial statements in the accompanying SEC Form 10-K.
R E C O N C I L I A T I O N O F G A A P T O N O N - G A A P F I G U R E SE X E C U T I V E M A N A G E M E N T
J. Alex Martin
Corporate Vice President,
North America
Robert C. Reindl
Corporate Vice President,
Human Resources
Stanton J. Rowe
Corporate Vice President,
Percutaneous Valve Interventions
Anita B. Bessler
Corporate Vice President,
Global Franchise Management
Randel W. Woodgrift
Corporate Vice President,
Manufacturing Operations
Patricia L. Garvey, Ph.D.
Corporate Vice President,
Global Reimbursement
Stuart L. Foster
Corporate Vice President,
Technology & Discovery
John H. Kehl, Jr.
Corporate Vice President,
Strategy & Business Development
Thomas M. Abate
Corporate Vice President,
Chief Financial Off icer & Treasurer
Michael A. Mussallem
Chairman &
Chief Executive Off icer
Corinne H. Lyle
Corporate Vice President,
Global Operations
Huimin Wang, M.D.
Corporate Vice President,
Japan & Intercontinental
Patrick B. Verguet
Corporate Vice President,
Europe
Bruce P. Garren
Corporate Vice President,
Government Affairs &
General Counsel
Keith A. Reisinger
Corporate Vice President,
(left to right)
T R A D E M A R K S Cribier-Edwards, Edwards, the stylized E logo, FloTrac, GeoForm, Life is Now, Magna, PERIMOUNT Theon, PreSep, ThermaFix and Vigileo
are trademarks of Edwards Lifesciences Corporation. 1-800-4-A-HEART, Carpentier-Edwards, Edwards Lifesciences, LifeStent, PERIMOUNT, PERIMOUNT
Magna and Swan-Ganz are trademarks of Edwards Lifesciences Corporation and are registered in the United States Patent and Trademark Office. LifeStent and
LifeStent NT are trademarks of Edwards Lifesciences AG. C E R T I F I C A T I O N On June 6, 2005, Edwards Lifesciences submitted to the New York Stock Exchange a
certification signed by its Chief Executive Officer that as of June 3, 2005 he was not aware of any violation by Edwards Lifesciences of the NYSE corporate governance listing
standards. In addition, the certifications signed by the Chief Executive Officer and Chief Financial Officer required under Section 302 of the Sarbanes-Oxley Act were filed
as an exhibit to Edwards’ Annual Report on Form 10-K for the year ended December 31, 2005.
Stock Performance vs. Selected Indices
Since 2000, Edwards’ stock price has increased one hundred
and thirty-four percent — outperforming the broader market
and its medical products peer group.
EW RXP (Morgan Stanley Healthcare Products Index) S&P 500
12/00 12/01 12/02 12/03 12/04 12/05
S A F E H A R B O R S T A T E M E N T This Annual Report contains forward-looking statements within the meaning of the federal securities laws. These statements
involve risks and uncertainties that could cause the company’s future business, financial condition, results of operations or performance to differ materially from that
expressed or implied by the forward-looking statements. All statements other than statements of historical fact in this Annual Report or referred to or incorporated by
reference into this Annual Report are “forward-looking statements.” You are encouraged to refer to the discussion of Risk Factors that may be found in the company’s
Annual Report on Form 10-K and other filings with the Securities and Exchange Commission.
300
200
100
0
EW 134%
RXP 39%
S&P 3%
S E L E C T E D P E R F O R M A N C E D A T A
For a reconciliation of GAAP to non-GAAP figures, see the inside back cover.
Gross Profit Margin (gross profit as a percentage of net sales)
The sale of higher margin products, while de-emphasizing
or exiting lower margin businesses, is lifting Edwards’
gross proft margin.
53% 58% 58% 60% 63%
2001 2002 2003 2004 2005
Sales of New Products
(introduced in the last three years as a percentage of total annual sales)
Edwards’ investments in R&D are producing an exciting
pipeline of differentiated new products.
11% 15% 22% 25%
2002 2003 2004 2005
R&D Expense (in millions)
Edwards continues to increase its investment in
research and development.
$55 $65 $73 $87 $99
2001 2002 2003 2004 2005
Non-GAAP Net Income (in millions)
Edwards continues to meet or exceed its annual net
income growth goals.
$63 $83 $97 $104 $125
2001 2002 2003 2004 2005
Non-GAAP Free Cash Flow (in millions)
Edwards generates strong cash flow, reflecting strong operating
results and consistent working capital management.
$69 $80 $104 $138 $126
2001 2002 2003 2004 2005

Two Thousand FiveAnnual Report & SEC Form 10-K
NumbersTo Grow By
E D W A R D S L I F E S C I E N C E S
For nearly 50 years, Edwards has been dedicated to supporting patients in their f ight against advanced
cardiovascular disease, the world ’s leading cause of death and disability. Through its focused research,
development, discovery and commercialization efforts, the company has driven the creation of leading
heart valve therapies and hemodynamic monitoring technologies, as well as cardiac surgery and peripheral
vascular innovations, to help countless patients resume fuller, happier and more active lives. Unif ied in
their mission, Edwards’ employees truly embody the company’s pledge to help patients each and every day.
O U R C R E D O
At Edwards Lifesciences, we are dedicated to providing innovative solutions for people f ighting cardio-
vascular disease. Through our actions, we will become trusted partners with customers, colleagues and
patients creating a community unif ied in its mission to improve the quality of life around the world. Our
results will benef it customers, patients, employees and shareholders. We will celebrate our successes, thrive
on discovery and continually expand our boundaries. We will act boldly, decisively and with determination
on behalf of people f ighting cardiovascular disease. Helping Patients is Our Life’s Work, and Life is Now.
S E L E C T E D O P E R A T I N G I N F O R M A T I O N
Twelve months ended December 31, (in millions) 2 0 0 5 2 0 0 4 2 0 0 3
Net sales $ 997.9 $ 931.5 $ 860.5
Cost of goods sold 374.6 370.2 359.4
Gross prof it 623.3 561.3 501.1
Selling, general and administrative expenses 348.7 319.9 289.4
Research and development expenses 99.0 87.0 72.8
Operating Statistics
As a percentage of net sales:
Gross prof it 62.5% 60.3% 58.2%
Selling, general and administrative expenses 34.9% 34.3% 33.6%
Research and development expenses 9.9% 9.3% 8.5%
Operating margin(a) 17.6% 16.6% 16.1%
(a) Operating margin is calculated by subtracting selling, general and administrative expenses and research and development expenses from
gross profit and then dividing by net sales.
The information contained in the table above should be read in conjunction with Edwards Lifesciences’ “Management’s Discussion and Analysis of Financial
Condition and Results of Operations” and “Consolidated Financial Statements” found in the accompanying Annual Report on Form 10-K.
Corporate Headquarters
Edwards Lifesciences Corporation
One Edwards Way, Irvine, CA 92614
(800) 4-A-HEART or (949) 250-2500
www.edwards.com
Annual Meeting
The Annual Meeting of Shareholders
will be held on May 11, 2006 at
10:00 a.m. (Pacific) at the offices of
Edwards Lifesciences Corporation,
One Edwards Way, Irvine, CA 92614.
SEC Form 10-K
A copy of Edwards Lifesciences’
annual report to the Securities and
Exchange Commission on Form 10-K
is available on the company’s web
site at www.edwards.com or upon
request to the Investor Relations
department at (949) 250-2806.
Stock Symbol
Edwards Lifesciences’
stock is traded on
The New York Stock Exchange
(NYSE) under the symbol EW.
Information on the Internet
Edwards Lifesciences’ web site at
www.edwards.com provides a wide
range of information for customers,
patients and shareholders. Persons
interested in investing in Edwards
Lifesciences are invited to visit the
“Investor Relations” section of the
web site to access press releases, SEC
filings and other company information.
Corporate Public Relations
Members of the news media
should call (949) 250-5070.
Investor Information
Shareholders, securities analysts and
investors seeking additional information
about Edwards Lifesciences should contact:
David K. Erickson
Vice President, Investor Relations
(949) 250-2806 Phone
(949) 250-2248 Fax
Analyst Coverage
For a list of research firms and
analysts who cover Edwards
Lifesciences, please visit the Investor
Relations section of the company’s
web site at www.edwards.com.
Transfer Agent
Correspondence about share ownership,
account status, the transfer or exchange
of shares, lost stock certificates, duplicate
mailings or change of address may be
directed to:
Computershare Investor Services
P.O. Box 43069,
Providence, RI 02940-3069
(800) 756-8200
Hearing impaired # TDD: (800) 952-9245
hwww.computershare.com
Independent Registered
Public Accounting Firm
PricewaterhouseCoopers LLP
Orange County, CA
Board of Directors
Michael A. Mussallem
Chairman & Chief Executive Officer,
Edwards Lifesciences Corporation
Mike R. Bowlin
Former Chairman &
Chief Executive Officer,
Atlantic Richfield Company
John T. Cardis
Former Partner
Deloitte & Touche
Robert Ingram
Vice Chairman, Pharmaceuticals,
GlaxoSmithKline
Vernon R. Loucks Jr.
Chairman,
The Aethena Group, LLC
Barbara J. McNeil, M.D., Ph.D.
Professor and Chair,
Department of Health Care Policy,
Harvard Medical School
Philip M. Neal
Former Chairman &
Chief Executive Officer,
Avery Dennison Corporation
David E.I. Pyott
Chairman & Chief Executive Officer,
Allergan, Inc.
Edwards Lifesciences is an affirmative
action, equal opportunity employer.
C O R P O R A T E I N F O R M A T I O N
E D W A R D S L I F E S C I E N C E S C O R P O R A T I O N
One Edwards Way, Irvine, California 92614
(800) 4-A-HEART or (949) 250-2500
www.edwards.com