Embed Size (px)
Citation preview
Worcester Regional Transit Authority
Key Performance IndicatorsElectric Bus Deployment Project
December 18, 2013
Introduction
• Project Goals– Achieve performance levels that meet or exceed existing fleet– Reduce fuel costs– Reduce emissions– Enhance transit service Cleaner, Greener
• Purpose of KPI Reporting– Assess performance of electric buses as compared to existing
fleet– Assess impact on WRTA’s agency-wide fuel costs– Assess impact on WRTA’s agency wide GHG emissions
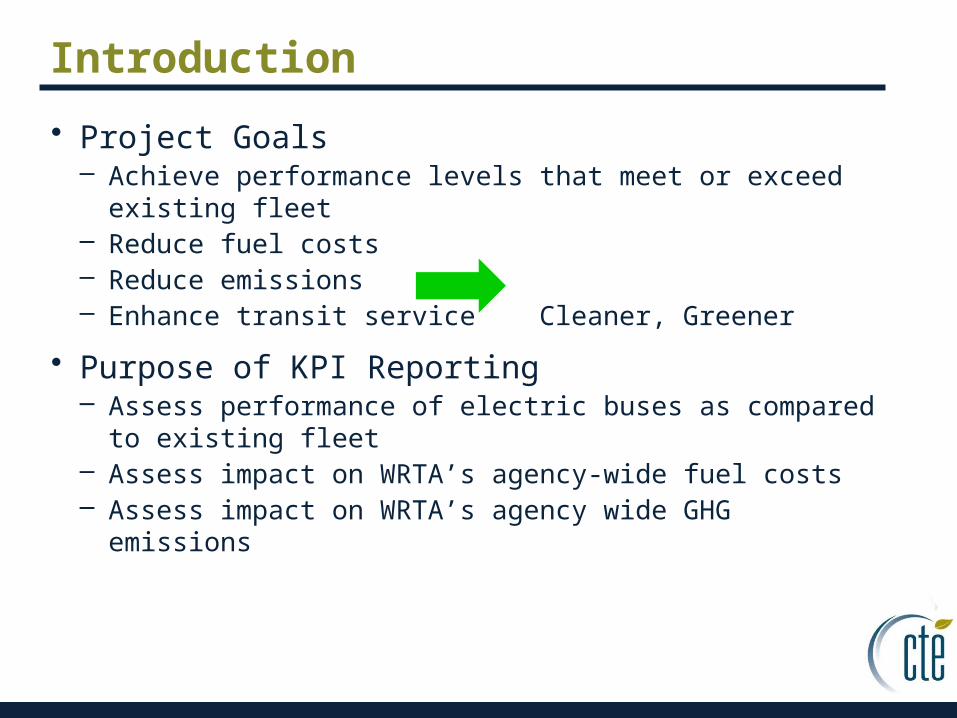
The Fleet
Bus Type Quantity % of Fleet
29 GILLIG 5 10%29 GILLIG HYB 2 4%35 GILLIG 9 17%35 GILLIG HYB 6 12%40 GILLIG 15 29%40 GILLIG HYB 9 17%35' Electric 6 12%
Total Fleet 52 100%
The Routes
• Route 4
• Route 18
• Downtown “Green” Circulator (Route 80)
• Alternate: Route 8
• Alternate: Route 25
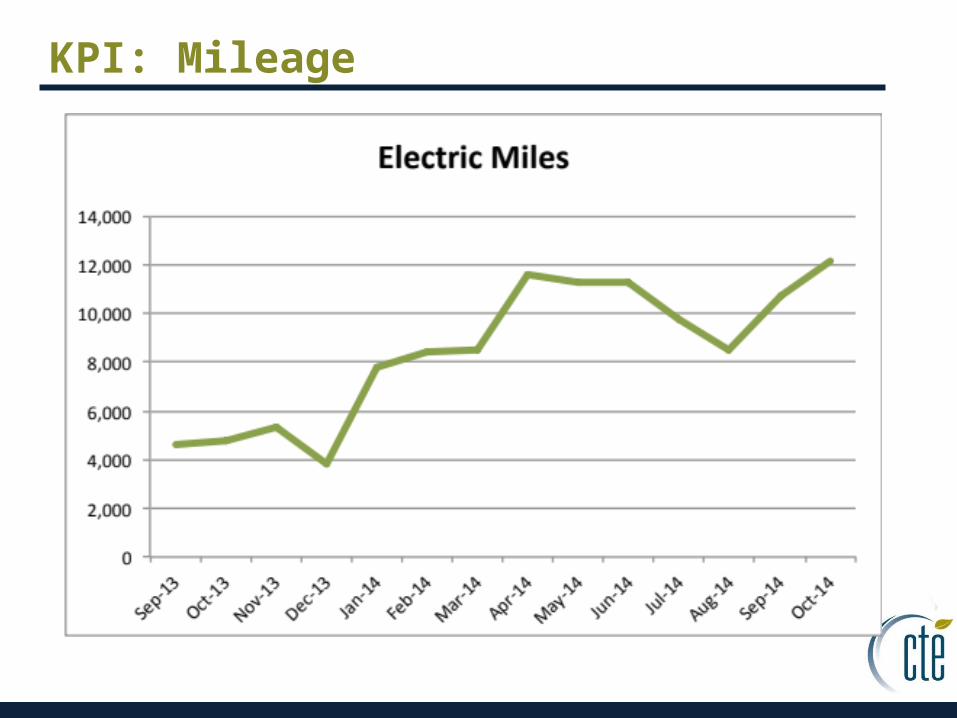
KPI: Mileage
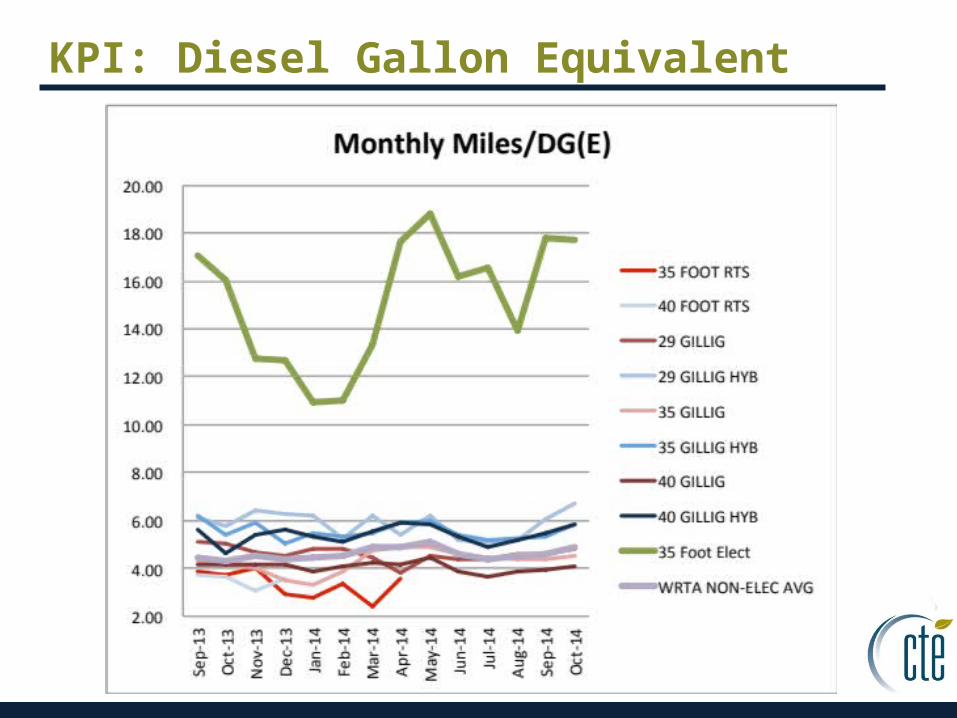
KPI: Diesel Gallon Equivalent
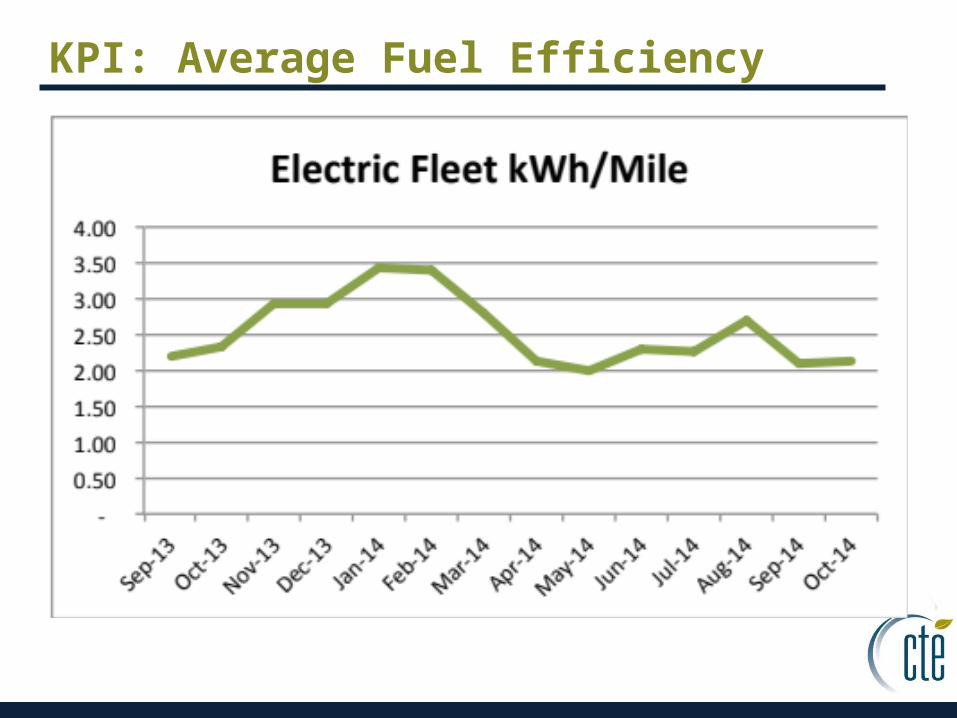
KPI: Average Fuel Efficiency
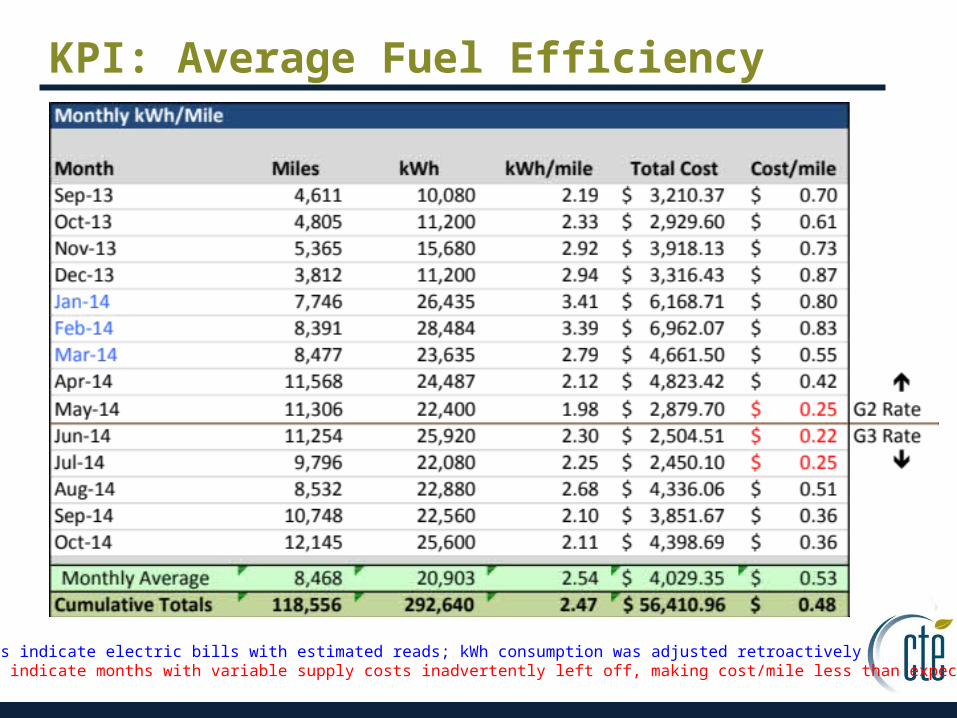
KPI: Average Fuel Efficiency
Blue months indicate electric bills with estimated reads; kWh consumption was adjusted retroactivelyRed months indicate months with variable supply costs inadvertently left off, making cost/mile less than expected
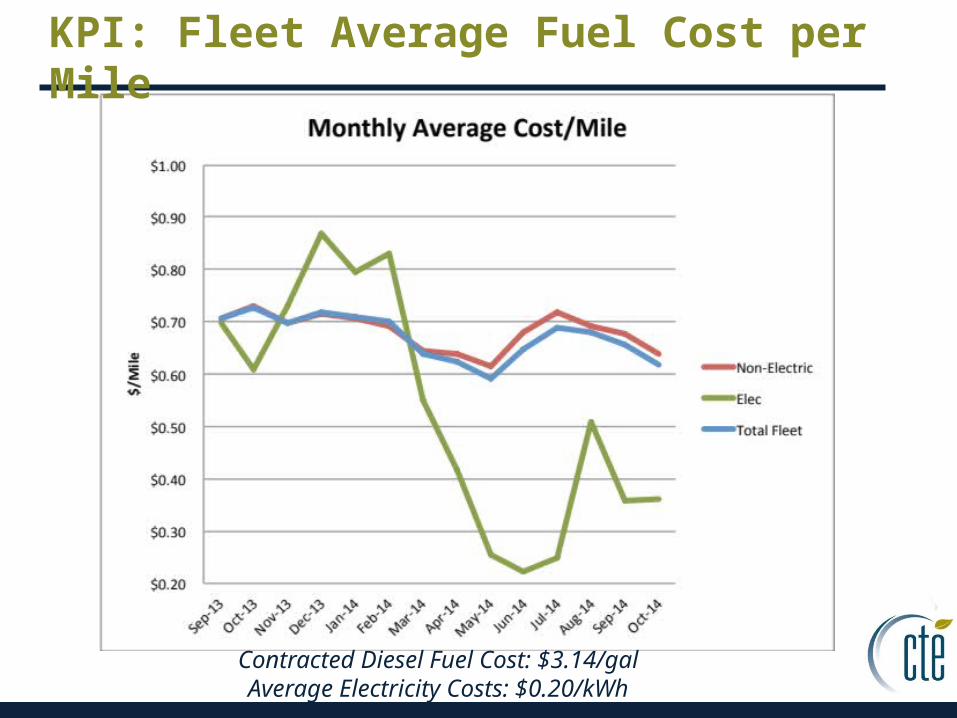
KPI: Fleet Average Fuel Cost per Mile
Contracted Diesel Fuel Cost: $3.14/galAverage Electricity Costs: $0.20/kWh
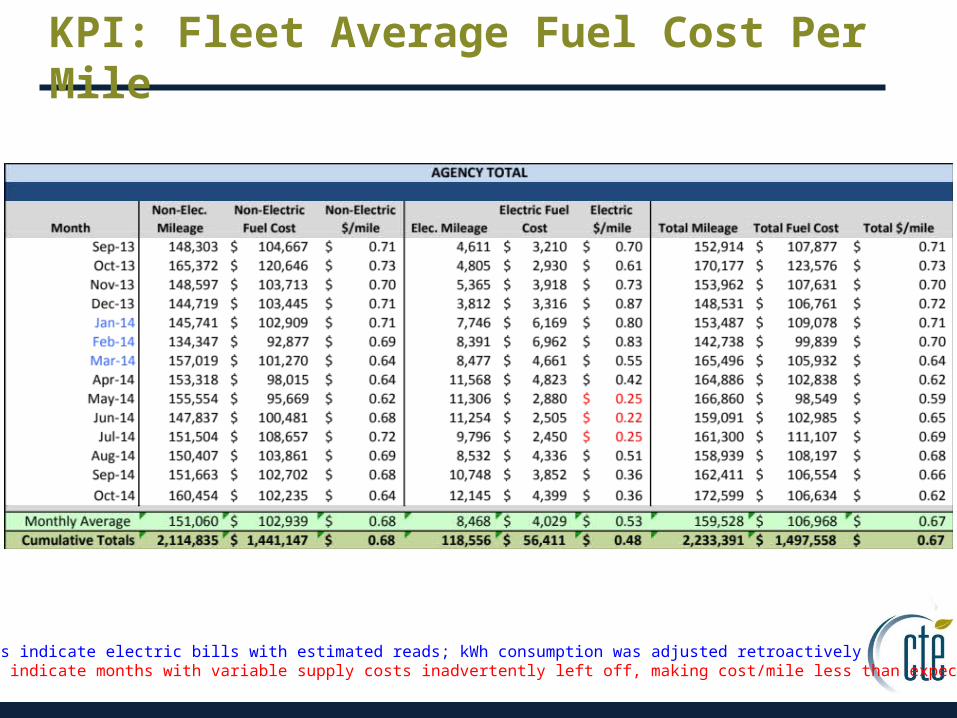
KPI: Fleet Average Fuel Cost Per Mile
Blue months indicate electric bills with estimated reads; kWh consumption was adjusted retroactivelyRed months indicate months with variable supply costs inadvertently left off, making cost/mile less than expected
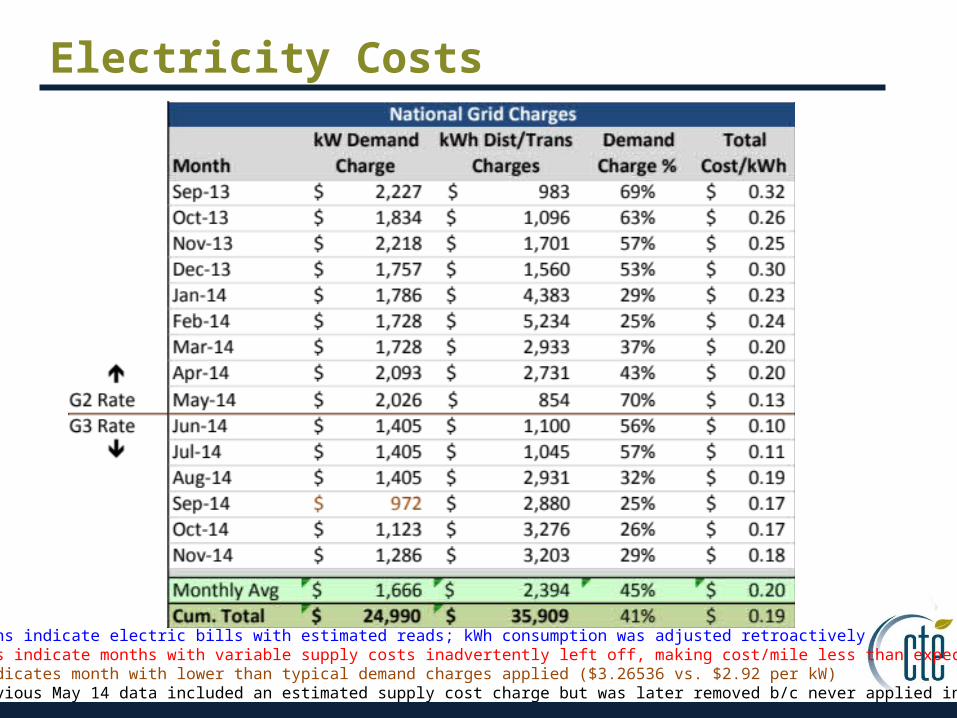
Electricity Costs
Blue months indicate electric bills with estimated reads; kWh consumption was adjusted retroactivelyRed months indicate months with variable supply costs inadvertently left off, making cost/mile less than expectedOrange indicates month with lower than typical demand charges applied ($3.26536 vs. $2.92 per kW)Note: Previous May 14 data included an estimated supply cost charge but was later removed b/c never applied in bill
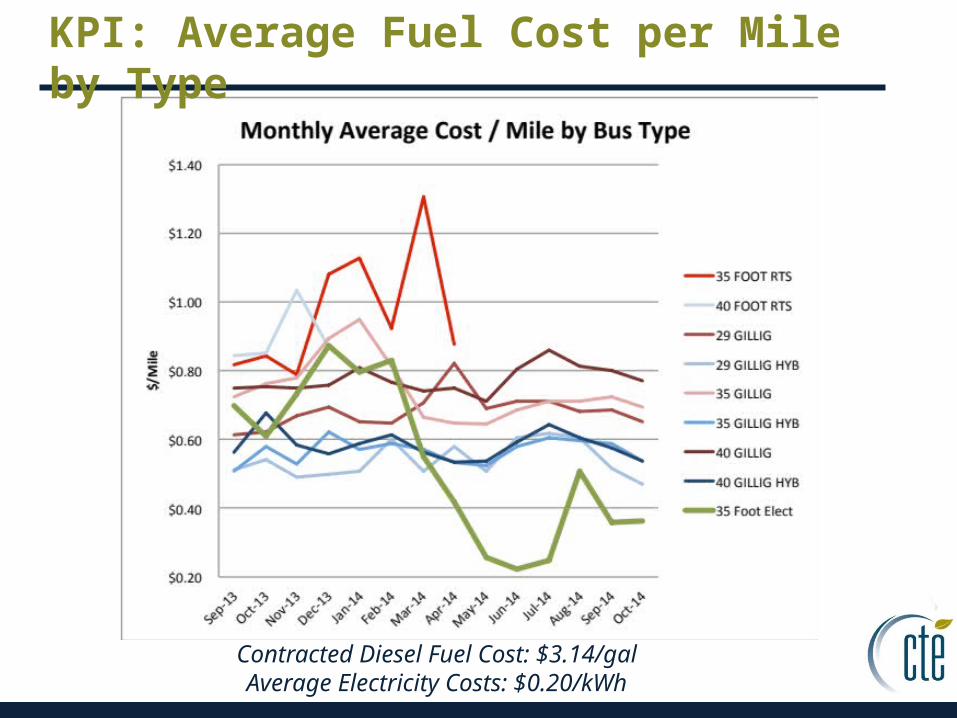
KPI: Average Fuel Cost per Mile by Type
Contracted Diesel Fuel Cost: $3.14/galAverage Electricity Costs: $0.20/kWh
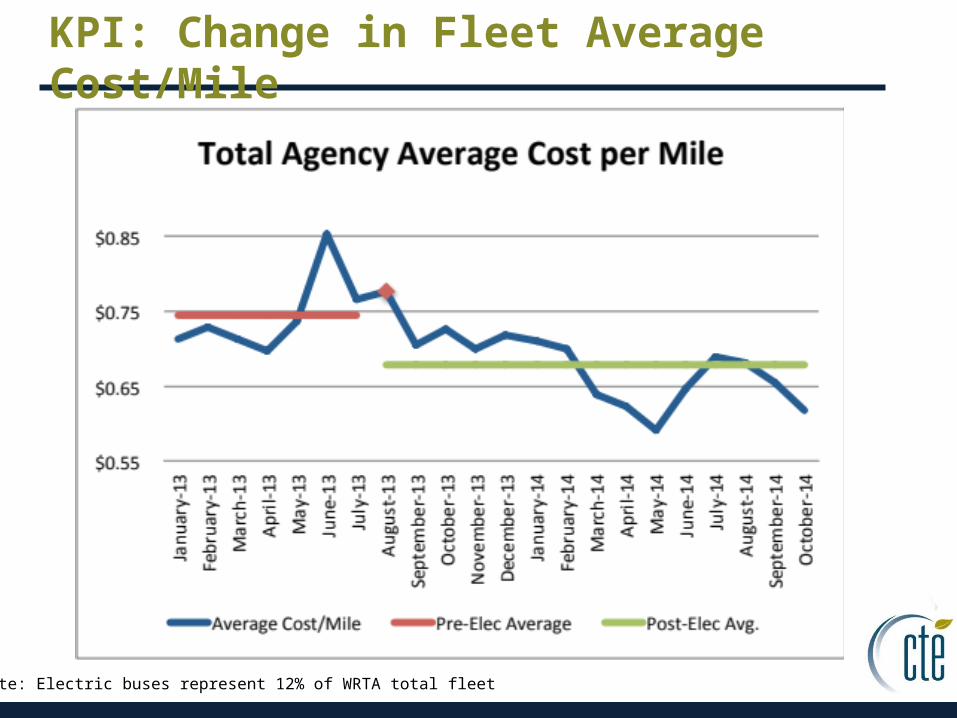
KPI: Change in Fleet Average Cost/Mile
Note: Electric buses represent 12% of WRTA total fleet
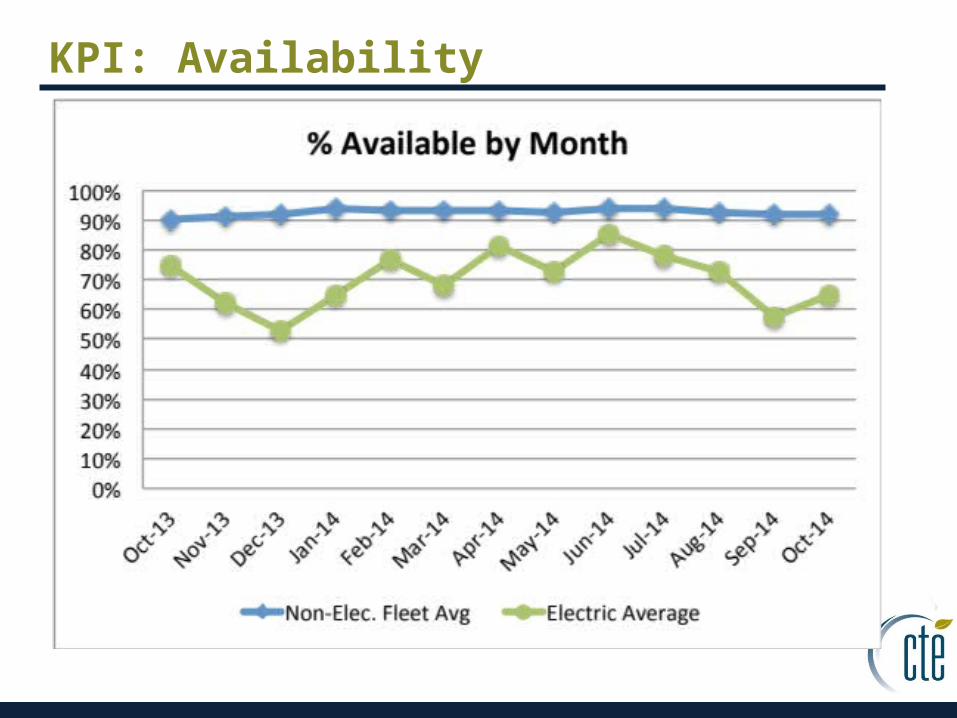
KPI: Availability
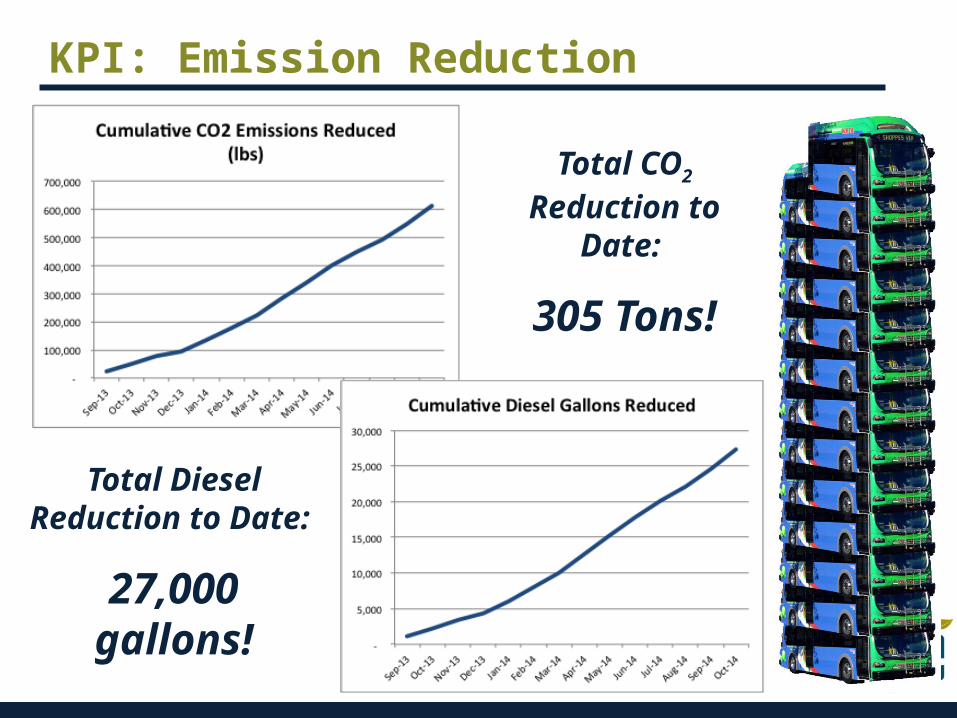
KPI: Emission Reduction
Total CO2 Reduction to
Date:
305 Tons!
Total Diesel Reduction to Date:
27,000 gallons!
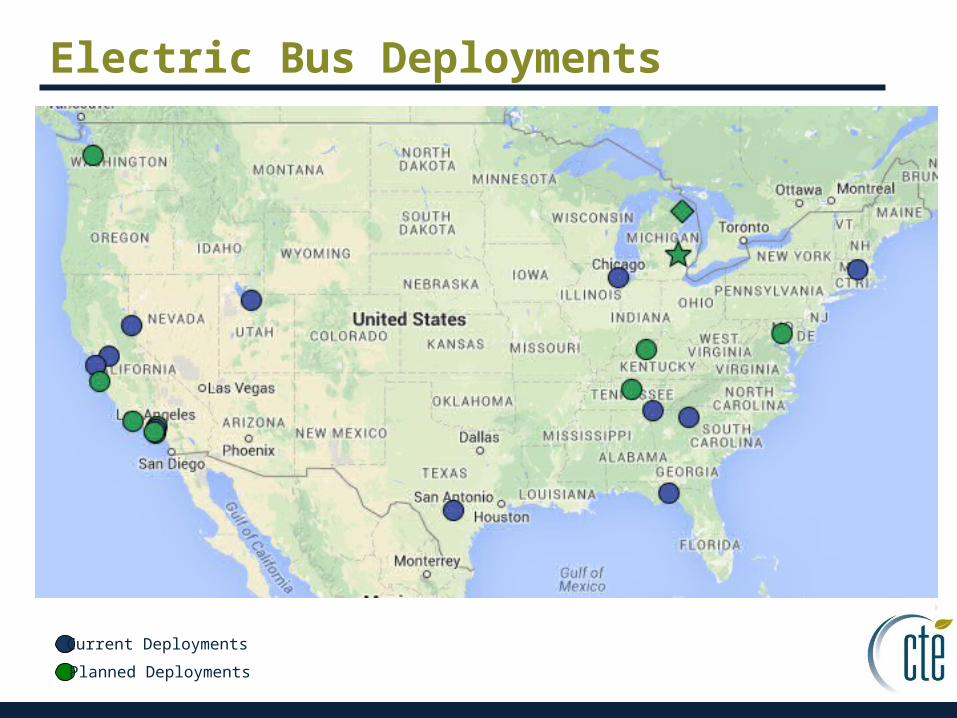
Electric Bus Deployments
Current Deployments
Planned Deployments
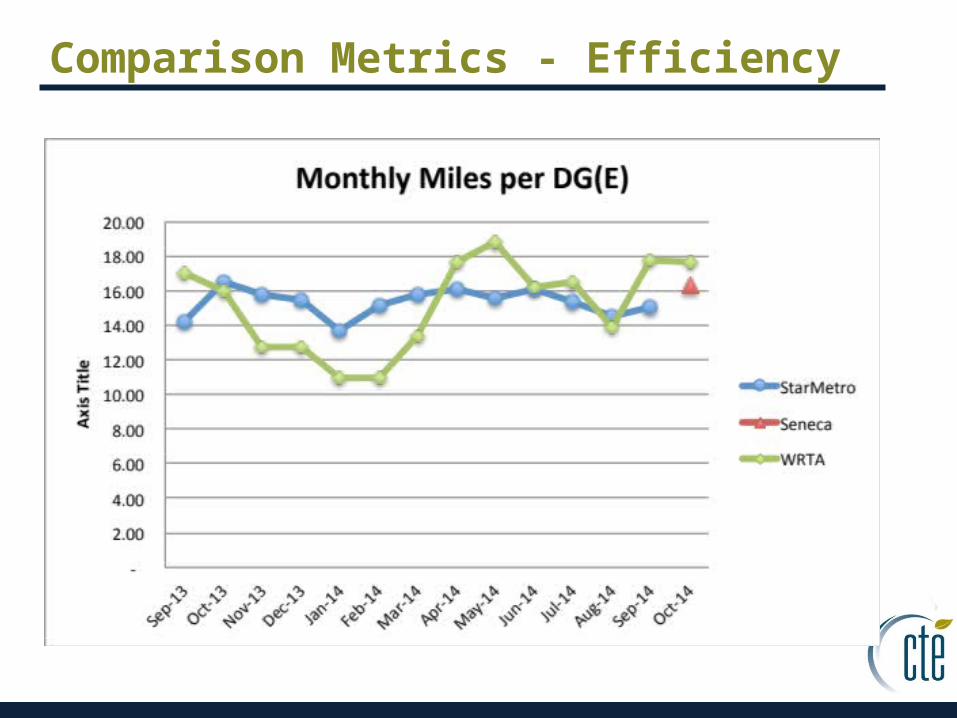
Comparison Metrics - Efficiency
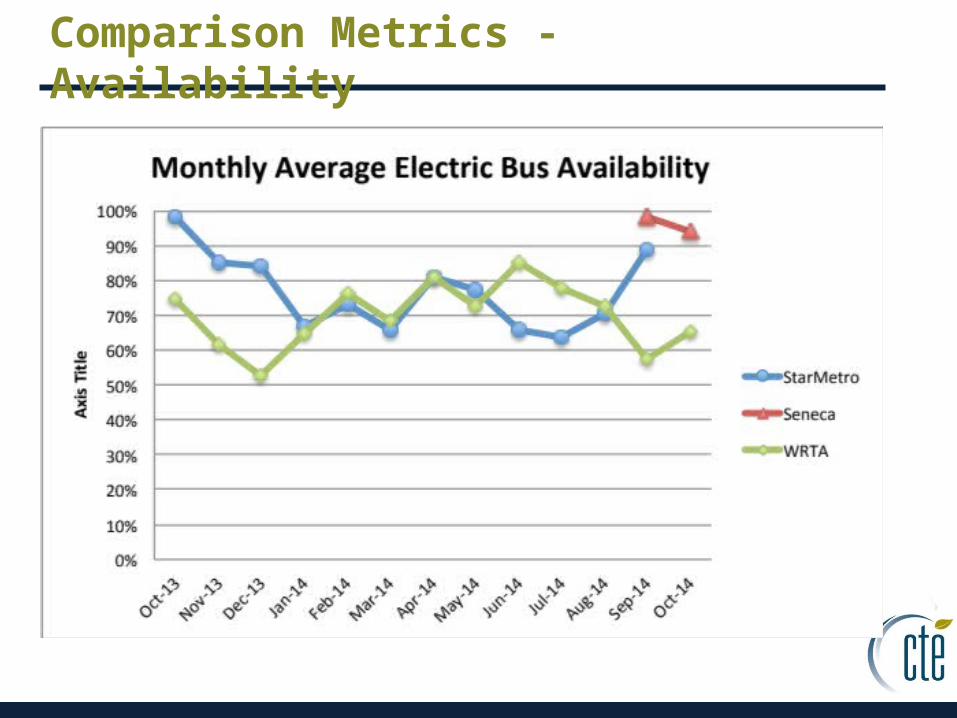
Comparison Metrics - Availability
Conclusions
• Greater utilization and the G-3 utility rate switch has lowered the electric cost per mile to below all other buses in WRTA fleets for April – October
• Availability issues continue to limit the potential of the electric bus fleet
• Cost per mile is seasonal– Expect higher cost/mile in the winter months