Embed Size (px)
Citation preview

Worcester Polytechnic Institute
Worcester Polytechnic Institute
Presentation to the Advisory BoardsOctober 13, 2006

Worcester Polytechnic Institute
New Management Team

Worcester Polytechnic Institute
Vision 2015
Students and Student Life Undergraduate enrollment of 3,400
Graduate enrollment of 1,600
Increase percentage of undergraduates living on campus to 70%
New and renovated residence facilities
Newly-constructed sports and recreation center
Indoor garage with parking for 600 cars

Worcester Polytechnic Institute
Vision 2015
Academic Research funding of $40 million Stronger core competencies in engineering, science,
technology, and management, with special strengths and leadership in such areas as: Life sciences and bioengineering Entrepreneurship and business development Media, technology, and communication Environmental engineering and science
BA programs in selected fields within the humanities, arts, and social sciences
School of Management with a full-time, one-year, MBA Program and separate building
Worcester Polytechnic Institute
Vision 2015Academic (continued) WPI Gateway Park, a life-science and technology-based
development with: WPI life science (whole) departments Bioengineering Institute offices and programs Bioengineering-related corporate tenants WPI corporate & professional education division WPI graduate housing WPI-based programs in education, training, technology
commercialization, and business incubation
An industry leader in corporate and professional education
Renovation and expansion of several academic buildings
Top 50 national research university
Worcester Polytechnic Institute
Vision 2015
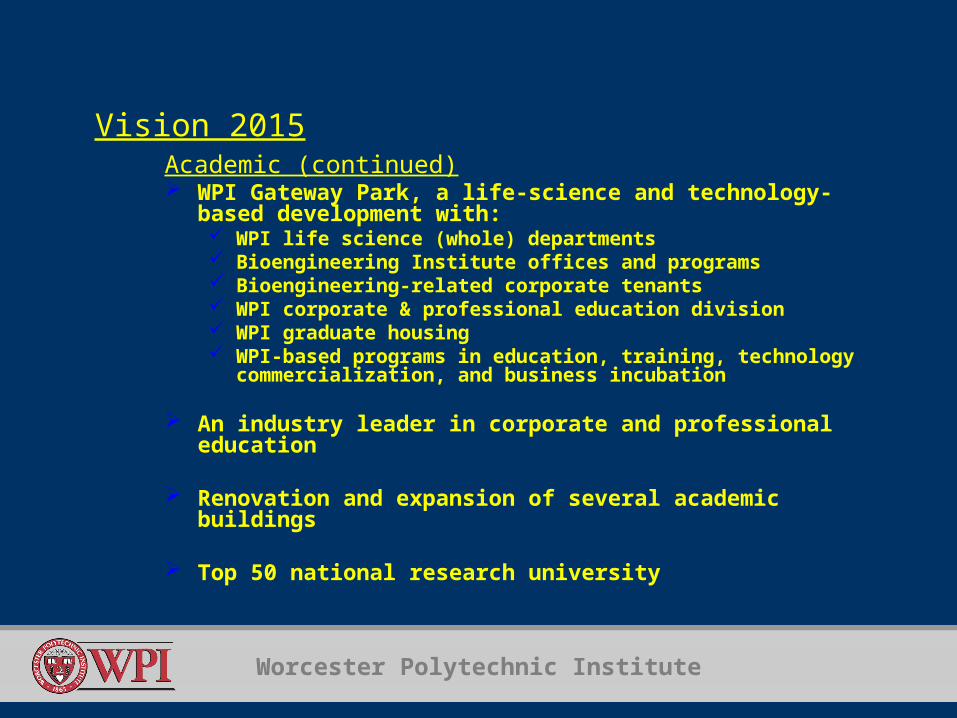
Financial Completion of major comprehensive campaign Endowment of $750 million Tuition discount factor of 35%
Worcester Polytechnic Institute
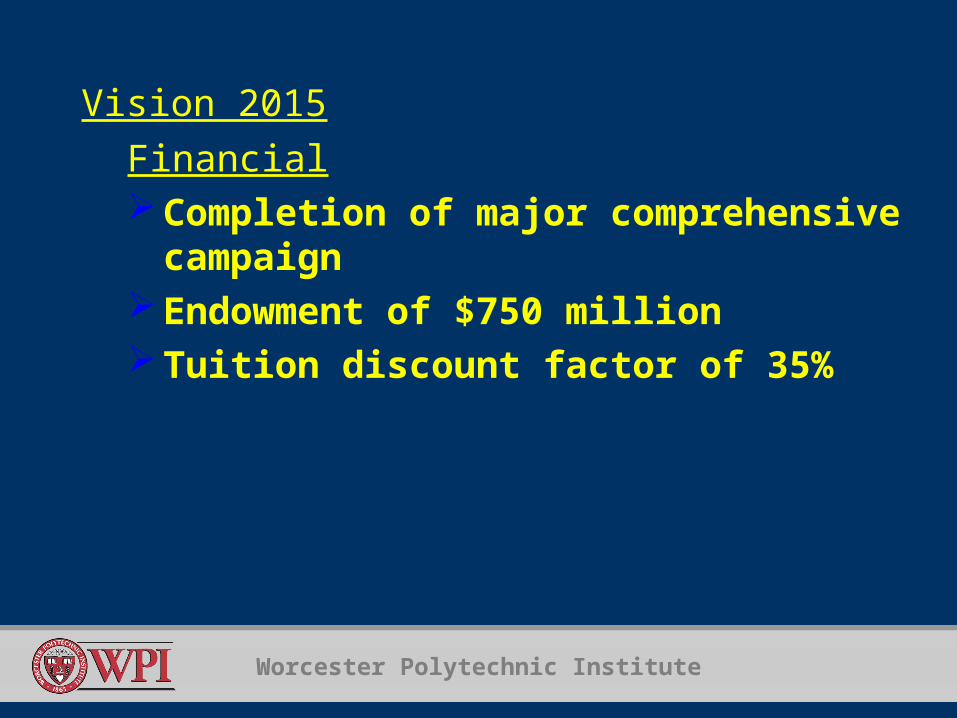
FY07 Expenditure Budget
• Salaries & benefits $61.7 M 58.8%
• Equipment, supplies, etc. 22.9 M 21.9%
• Debt service & depreciation 11.8 M 11.2%
• Utilities 5.6 M 5.3%
• Contingency 1.5 M 1.4%
• Gateway Park 1.4 M 1.4%
Total expense $104.9 M 100%

Worcester Polytechnic Institute
FY07 Revenue Budget• Net tuition & fees $72.9 M 69.6%
• Auxiliary operations 12.5 M 11.9%
• Endowment draw 9.8 M 9.3%
& investment income• Extended education 3.4 M 3.2%
• Indirect cost recovery 3.0 M 2.9%
• Unrestricted gifts 2.2 M 2.1%
• Other revenue 1.1 M 1.0%
Total revenue $104.9 M 100%

Worcester Polytechnic Institute
FY2006 SOURCES OF REVENUE
Other Operating Revenue
15%
Auxiliary Operations
12%
Net Tuition & Fees69%
Other Educational Programs
4%

Worcester Polytechnic Institute
Budgeted Expense by Area
Utilities5%
Advancement2%
Academic Affairs50%
Student Affairs9%
Debt Service & Depreciation
11%
Information Technology
9%
General Administration
6%
Plant Operations6%
Marketing & Communications
2%

Worcester Polytechnic Institute
Vision 2015Reputation Project-enriched, world-class education preparing students for
achievement, leadership, and fulfillment
Excellent research focused on important problems and innovative technologies and science
Driver of technology commercialization
Culture supportive of women faculty and students
Ethical, diverse, principled, stimulating community
Emphasis on civic responsibility and leadership

Worcester Polytechnic Institute
Key Performance Indicators

Worcester Polytechnic Institute
Student Demand
Number of applications reached an all-time high for Fall 2006.
4,924
3,316
3,708
3,5763,1913,136
0
1,000
2,000
3,000
4,000
5,000
6,000
Fall 2001 Fall 2002 Fall 2003 Fall 2004 Fall 2005 Fall 2006

Worcester Polytechnic Institute
Student Quality
1262
1281
1294
1284
1290
1250
1260
1270
1280
1290
1300
Fall 2002 Fall 2003 Fall 2004 Fall 2005 Fall 2006
Strong average combined SAT scores maintained during enrollment growth.

Worcester Polytechnic Institute
Student Quality
79%
68%
79%76%
72%
50%
60%
70%
80%
90%
100%
Fall 2002 Fall 2003 Fall 2004 Fall 2005 Fall 2006
High class rank (% in top 5th of class) maintained during enrollment growth.

Worcester Polytechnic Institute
Tuition Discount
41.6%41.6%
47.7%
45.8%
46.5%
43.1%
39.1%39.1%40.3%39.9%
37.5%
36.1%
30%
32%
34%
36%
38%
40%
42%
44%
46%
48%
50%
FY2002 FY2003 FY2004 FY2005 FY2006 FY2007
Freshmen All Students
Impact of new enrollment management strategies driving decline in tuition discounting while growing enrollment.

Worcester Polytechnic Institute
Fundraising Results (In Millions)
$15.9
$13.8
$12.1$12.0
$13.8
$0
$2
$4
$6
$8
$10
$12
$14
$16
$18
FY2002 FY2003 FY2004 FY2005 FY2006
Consistent fundraising history.
Worcester Polytechnic Institute
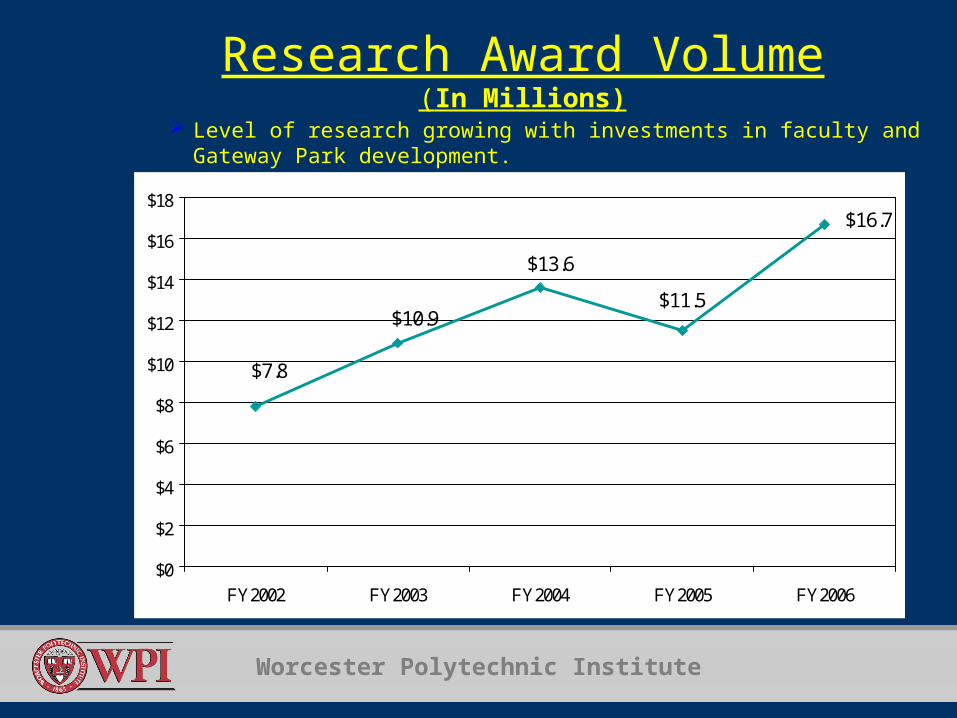
Research Award Volume(In Millions)
$16.7
$11.5
$13.6
$10.9
$7.8
$0
$2
$4
$6
$8
$10
$12
$14
$16
$18
FY2002 FY2003 FY2004 FY2005 FY2006
Level of research growing with investments in faculty and Gateway Park development.

Worcester Polytechnic Institute
Change in Net Assets from Operating Activities(In Thousands)
$68
$(3,437)$(3,809)
$(2,797)
$(976)
-$4,000
-$3,500
-$3,000
-$2,500
-$2,000
-$1,500
-$1,000
-$500
$0
$500
Operations have returned to positive results.
FY2002
FY2003
FY2005
FY2006
FY2004

Worcester Polytechnic Institute
Expendable Resources(In Millions)
$294
$276$281
$254
$263
$200
$210
$220
$230
$240
$250
$260
$270
$280
$290
$300
FY2002 FY2003 FY2004 FY2005 FY2006
Balance sheet continues to strengthen.
Worcester Polytechnic Institute
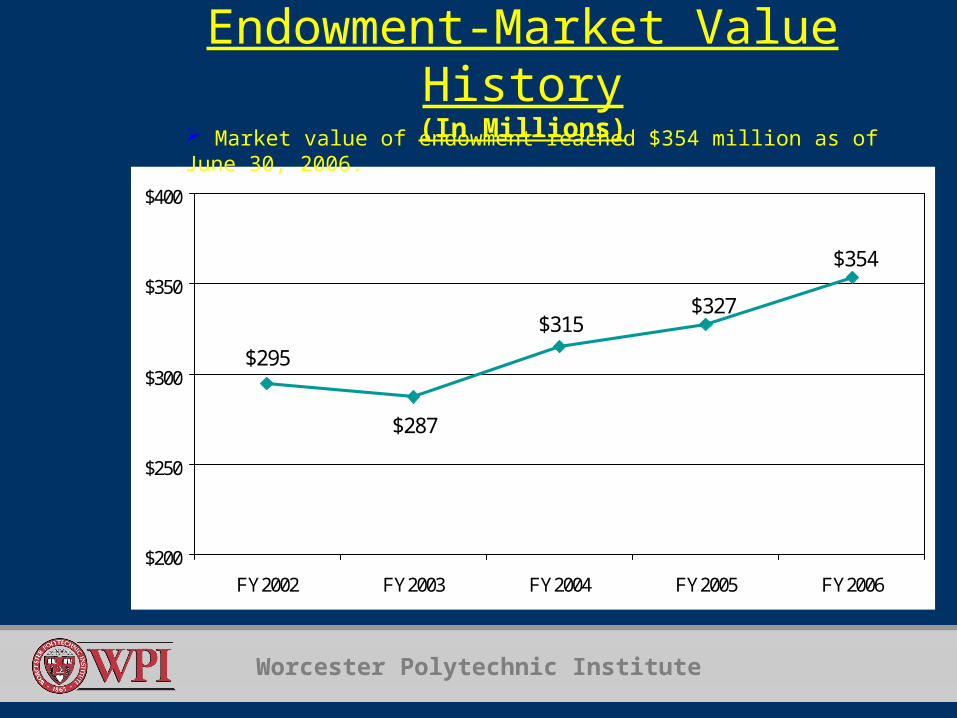
Endowment-Market Value History(In Millions)
$354
$327$315
$287
$295
$200
$250
$300
$350
$400
FY2002 FY2003 FY2004 FY2005 FY2006
Market value of endowment reached $354 million as of June 30, 2006.

Worcester Polytechnic Institute
EndowmentTen-Year Return History
FY06, 12.0%
FY02, -7.4%
FY99, 12.4%
FY97, 22.9%
FY05, 8.6%
FY03, 2.6%FY01,
-10.0%
FY98, 16.6%
FY00, 40.0%
FY04, 16.0%
-10%
-5%
0%
5%
10%
15%
20%
25%
30%
35%
40%