Embed Size (px)
Citation preview
8/3/2019 Worcester Academy Wind Turbine IQP Report FINAL
http://slidepdf.com/reader/full/worcester-academy-wind-turbine-iqp-report-final 1/78
PROJECT NUMBER: PPM-0893
Worcester Academy Wind Turbine Feasibility Study
An Interactive Qualifying Project Reportsubmitted to the Faculty of
WORCESTER POLYTECHNIC INSTITUTEin partial fulfillment of the requirements for theDegree of Bachelor of Science
by
Dominic M. DeChiara
________________________
Evan Demers-Peel
________________________
Seth Brewster
________________________
Date: October 28, 2009
Advisor: Professor Paul Mathisen
__________________________
8/3/2019 Worcester Academy Wind Turbine IQP Report FINAL
http://slidepdf.com/reader/full/worcester-academy-wind-turbine-iqp-report-final 2/78
2
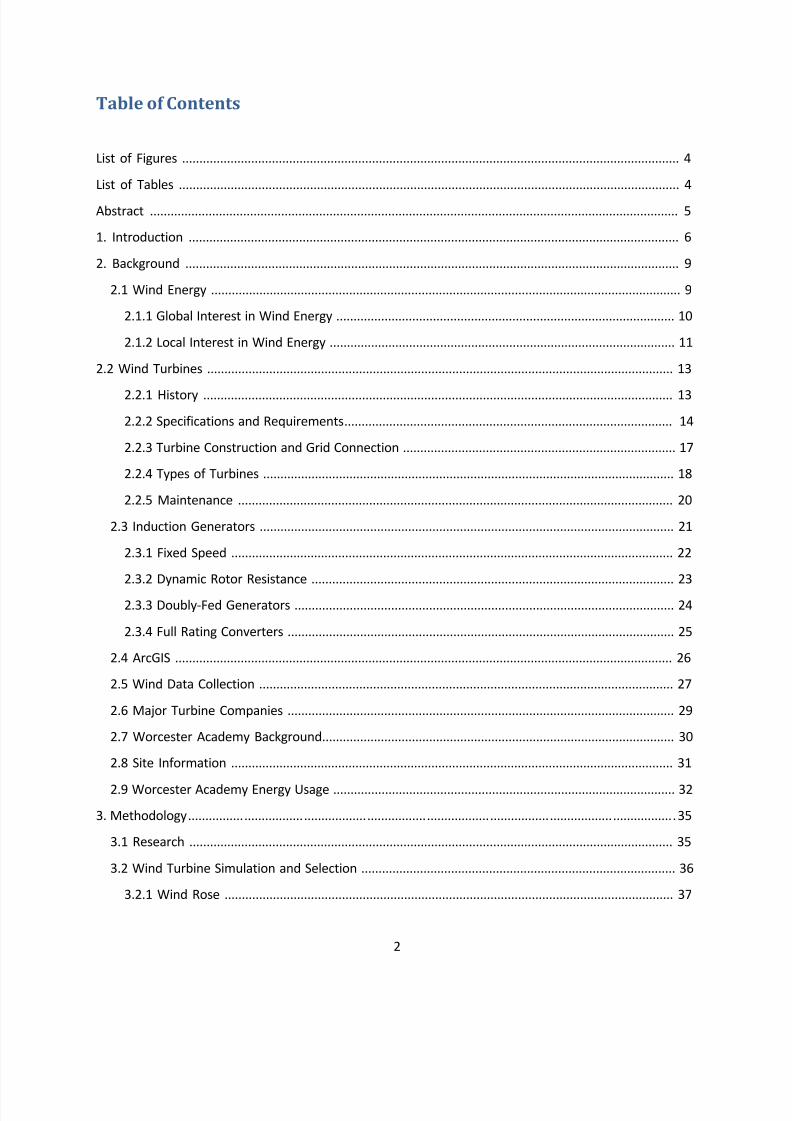
Table of Contents
List of Figures ................................................................................................................................................ 4
List of Tables ................................................................................................................................................. 4
Abstract ......................................................................................................................................................... 5
1. Introduction .............................................................................................................................................. 6
2. Background ............................................................................................................................................... 9
2.1 Wind Energy ........................................................................................................................................ 9
2.1.1 Global Interest in Wind Energy .................................................................................................. 10
2.1.2 Local Interest in Wind Energy .................................................................................................... 11
2.2 Wind Turbines ....................................................................................................................................... 13
2.2.1 History ........................................................................................................................................ 13
2.2.2 Specifications and Requirements............................................................................................... 14
2.2.3 Turbine Construction and Grid Connection ............................................................................... 17
2.2.4 Types of Turbines ....................................................................................................................... 18
2.2.5 Maintenance .............................................................................................................................. 20
2.3 Induction Generators ........................................................................................................................ 21
2.3.1 Fixed Speed ................................................................................................................................ 22
2.3.2 Dynamic Rotor Resistance ......................................................................................................... 23
2.3.3 Doubly-Fed Generators .............................................................................................................. 24
2.3.4 Full Rating Converters ................................................................................................................ 25
2.4 ArcGIS ................................................................................................................................................ 26
2.5 Wind Data Collection ........................................................................................................................ 27
2.6 Major Turbine Companies ................................................................................................................ 29
2.7 Worcester Academy Background...................................................................................................... 30
2.8 Site Information ................................................................................................................................ 31
2.9 Worcester Academy Energy Usage ................................................................................................... 32
3. Methodology ........................................................................................................................................... 35
3.1 Research ............................................................................................................................................ 35
3.2 Wind Turbine Simulation and Selection ........................................................................................... 36
3.2.1 Wind Rose .................................................................................................................................. 37
8/3/2019 Worcester Academy Wind Turbine IQP Report FINAL
http://slidepdf.com/reader/full/worcester-academy-wind-turbine-iqp-report-final 3/78
3
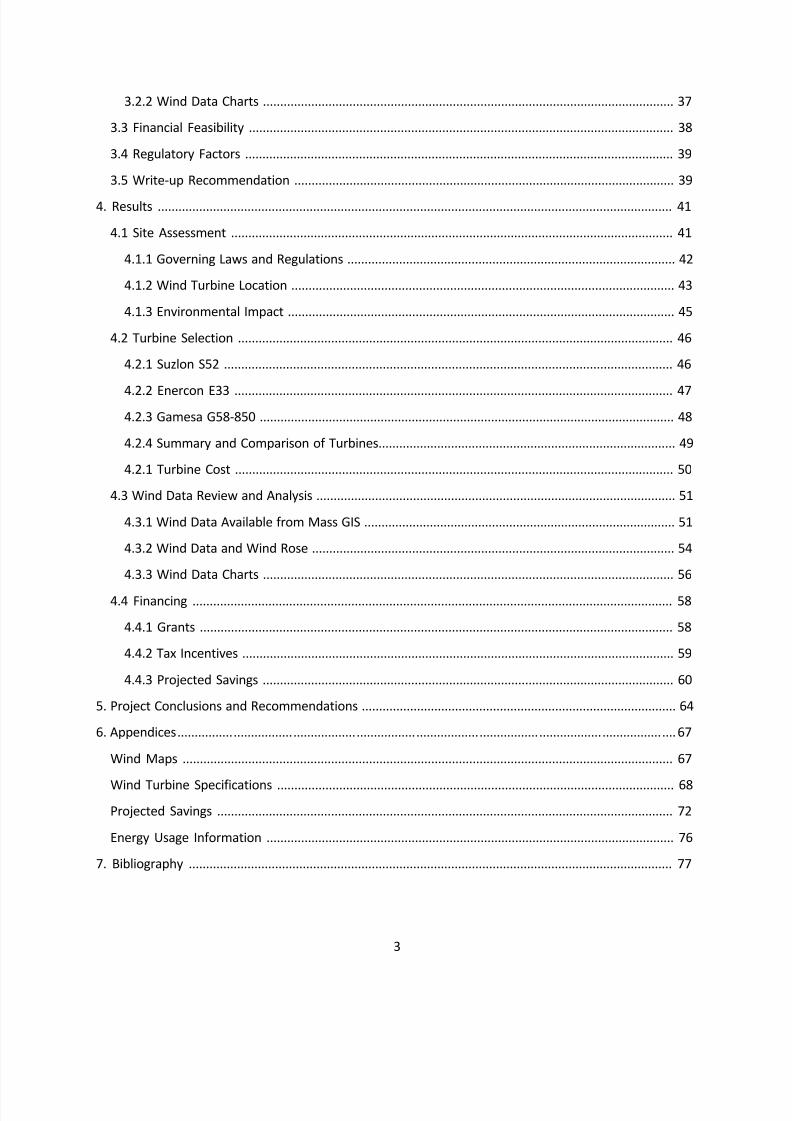
3.2.2 Wind Data Charts ....................................................................................................................... 37
3.3 Financial Feasibility ........................................................................................................................... 38
3.4 Regulatory Factors ............................................................................................................................ 39
3.5 Write-up Recommendation .............................................................................................................. 39
4. Results ..................................................................................................................................................... 41
4.1 Site Assessment ................................................................................................................................ 41
4.1.1 Governing Laws and Regulations ............................................................................................... 42
4.1.2 Wind Turbine Location ............................................................................................................... 43
4.1.3 Environmental Impact ................................................................................................................ 45
4.2 Turbine Selection .............................................................................................................................. 46
4.2.1 Suzlon S52 .................................................................................................................................. 46
4.2.2 Enercon E33 ............................................................................................................................... 47
4.2.3 Gamesa G58-850 ........................................................................................................................ 48
4.2.4 Summary and Comparison of Turbines...................................................................................... 49
4.2.1 Turbine Cost ............................................................................................................................... 50
4.3 Wind Data Review and Analysis ........................................................................................................ 51
4.3.1 Wind Data Available from Mass GIS .......................................................................................... 51
4.3.2 Wind Data and Wind Rose ......................................................................................................... 54
4.3.3 Wind Data Charts ....................................................................................................................... 56
4.4 Financing ........................................................................................................................................... 58
4.4.1 Grants ......................................................................................................................................... 58
4.4.2 Tax Incentives ............................................................................................................................. 59
4.4.3 Projected Savings ....................................................................................................................... 60
5. Project Conclusions and Recommendations ........................................................................................... 64
6. Appendices .............................................................................................................................................. 67
Wind Maps .............................................................................................................................................. 67
Wind Turbine Specifications ................................................................................................................... 68
Projected Savings .................................................................................................................................... 72
Energy Usage Information ...................................................................................................................... 76
7. Bibliography ............................................................................................................................................ 77
8/3/2019 Worcester Academy Wind Turbine IQP Report FINAL
http://slidepdf.com/reader/full/worcester-academy-wind-turbine-iqp-report-final 4/78
4
List of Figures
Figure 1: Proposed Site Indicated by Red Dot .............................................................................................. 7
Figure 2: Sites Investigated for Viable Wind Energy in Worcester ............................................................. 13
Figure 3: Dutch Windmill circa 1880 ........................................................................................................... 14
Figure 4: U. S. Annual Wind Power ............................................................................................................. 16
Figure 5: Wind Turbine Configuration (Darling 2008) ................................................................................ 19
Figure 6: Different Types of Induction Generators ..................................................................................... 22
Figure 7: Spinning Cup Anemometer .......................................................................................................... 27
Figure 8: Sonic Anemometer ...................................................................................................................... 28
Figure 9: Site Layout - Shaded Area Shows 6 acre Site Currently Owned by Worcester Academy ............ 32
Figure 10: Worcester Academy Electrical Usage per Month ...................................................................... 34
Figure 11: Wind Turbine Cost Trends ......................................................................................................... 38
Figure 12: Allowable Location of Turbine Shaded in Green ....................................................................... 43
Figure 13: Proposed Turbine Location and Fall Zone ................................................................................. 44
Figure 14: Suzlon S52 in Germany .............................................................................................................. 46
Figure 15:Enercon E33 in Use ..................................................................................................................... 47
Figure 16: Gamesa G58-850 Wind Farm ..................................................................................................... 49
Figure 17: Wind speeds at a Height of 100m .............................................................................................. 53
Figure 18: Wind speeds at a Height of 70m ................................................................................................ 53
Figure 19: Wind speeds at a Height of 30m ................................................................................................ 53
Figure 20: Wind speeds at a Height of 50m ................................................................................................ 53
Figure 21: Wind Rose for Proposed Site ..................................................................................................... 55
Figure 22: Average Wind Speed per Day .................................................................................................... 56
Figure 23: Average Wind Speed per Month ............................................................................................... 57
List of Tables
Table 1: Countries Contributions to Wind Power from 2005 and Future Estimates (Ankhmatov 2008) ... 10
Table 2: Largest Wind Turbine Manufacturers and Their Main Products .................................................. 30
Table 3: Worcester Academy Electrical Usage............................................................................................ 33
Table 4: Turbine Model Comparison .......................................................................................................... 49
Table 5: Average kWh Produced ................................................................................................................. 50
Table 6: Frequency and Velocity of Wind in a Given Direction .................................................................. 54
Table 7: Average Wind Speed Values per Month43..................................................................................... 57
8/3/2019 Worcester Academy Wind Turbine IQP Report FINAL
http://slidepdf.com/reader/full/worcester-academy-wind-turbine-iqp-report-final 5/78
5
Abstract
The goal of the project was to perform a feasibility study to assess the potential for installing a
wind power at a potential site at Worcester Academy. The methodology included a feasibility study of
three wind turbines. This feasibility study included a series of investigations addressing wind data and
energy, wind turbine selection, and financial feasibility. The wind study included estimation of amount
of wind energy that could be generated, and the determination of the ideal site placement for the wind
turbine. A financial projection was performed with consideration to a twenty year span in order to
determine potential savings provided by a wind turbine. The overall conclusion was that there is
potential for installation of a wind turbine to at Worcester Academy.
8/3/2019 Worcester Academy Wind Turbine IQP Report FINAL
http://slidepdf.com/reader/full/worcester-academy-wind-turbine-iqp-report-final 6/78
6
1. Introduction
The energy needs that are required in today’s society are continuously growing and our reliance
on energy is unavoidable. Nonrenewable energies such as the combustion and burning of fossil fuels
have been the main source of energy worldwide since energy was first harnessed. Nuclear plants have
also been able to provide another source of energy across the world and have proved to be viable
sources of energy in less populated areas and areas with low amounts of fossil fuels.1
It is becoming evident however that fossil fuels and nuclear plants are not the only forms of
energy that we should be using to get us through day to day life. Research into renewable energies
began decades ago and the availability of it today is the highest ever.2 Also, the fact that energy costs
are reaching prices never recorded before and the expense of installing renewable energy concepts are
decreasing gives reason for an increased effort to move towards renewable energy sources.3
One school that is planning to start using renewable energy as a way to power its campus is
Worcester Academy. Worcester Academy is a boarding college-preparatory school that boards 140 high
school students and has another 640 day students in grades 6-12. The school, located in Worcester,
Massachusetts has created a list of standards that they plan on being able to set in place by 2014. One
of these standards is to “assess, support, and sustain its community and educational programs through
exemplary institutional systems and practices” which they hope to complete in part by “developing and
adopting a school-wide plan for environmental responsibility and civic management”.4 This plan has
created the need to expand from addressing day to day sustainability issues to a larger scale project.
1(AWEA, 2007)
2 (Why Clean Energy is Important: Overview)
3 (Swift-Hook, 1989) , pg. 3
4 (Worcester Academy: Strategy)
8/3/2019 Worcester Academy Wind Turbine IQP Report FINAL
http://slidepdf.com/reader/full/worcester-academy-wind-turbine-iqp-report-final 7/78
7
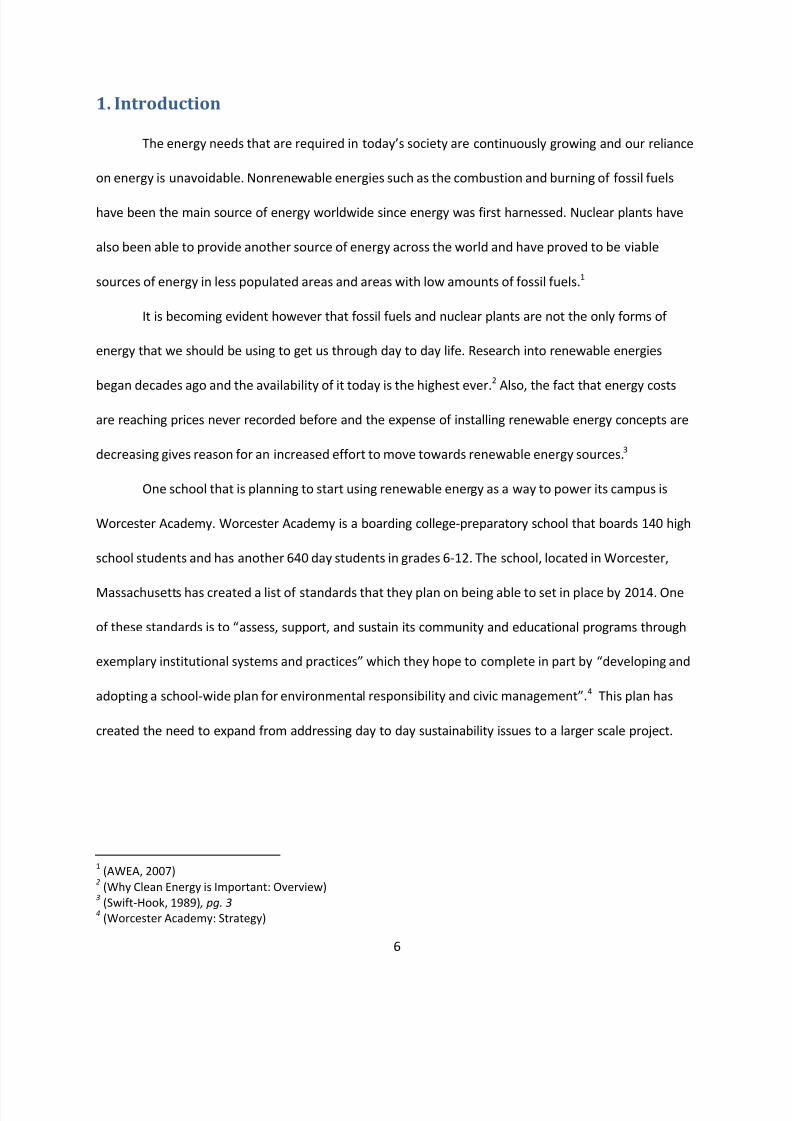
Accordingly the objective of this project to assess the feasibility of adding a wind turbine to the
Worcester Academy campus in order to cut power costs and continue the academies efforts to turn its
campus into a more sustainable entity. To determine the feasibility, social and regulatory implications as
well as the financial feasibility in the process in installing the wind turbine on the campus of Worcester
Academy must be considered. The proposed location of the wind turbine is on a six-acre plot of land
owned by Worcester Academy to the South of their main campus. The goal for the project is to devise a
three pronged financial approach to the construction of a wind turbine on this part campus to serve
Worcester Academy’s energy sustainability needs. In reaching our goal we will provide our sponsor
necessary steps in regards to regulatory conditions, Massachusetts sustainability laws, and local laws
that need to be followed.
In order to come up with a proposal for a suggested wind turbine research into wind turbines
and wind energy had to be completed. This began with the usage of general available text on
background information and recently completed projects in the area. With understanding of what it
would take to complete such a project as we would be proposing, the feasibility of the project being
Figure 1: Proposed Site Indicated by Red Dot

8/3/2019 Worcester Academy Wind Turbine IQP Report FINAL
http://slidepdf.com/reader/full/worcester-academy-wind-turbine-iqp-report-final 8/78
8
successfully completed was determined. The look into the feasibility included the location of the site,
available funding and grants, passing or local regulations, and projected savings.
8/3/2019 Worcester Academy Wind Turbine IQP Report FINAL
http://slidepdf.com/reader/full/worcester-academy-wind-turbine-iqp-report-final 9/78
9
2. Background
In order to complete a successful report it is necessary to have a strong understanding of the
material you are discussing. The research that was conducted to provide the background included
information on wind energy, wind turbines, generators. Research was done to look into Worcester
Academy, the proposed site, and wind data collection including the mapping software, ArcGIS.
2.1 Wind Energy
Renewable resources are the wave of the future. With depleting fossil fuels in the world, nations
need to start to turn to renewable and alternative resources in order to fulfill the increasing need for
electricity and power. Various different types of renewable energies include wind power, wave power,
tidal power, solar power, hydro power, geothermal, biomass, and biofuels. Each of these forms of
renewable energy helps to save on the use of fossil fuels, and other nonrenewable resources such as
coal, oil, and natural gas. The uses of these renewable resources also help to cut down on pollution of
the atmosphere, depletion of the ozone layer, lower greenhouse gas emissions, and reduce the growing
global warming crisis.5
There were many uses since the beginning of time involving wind energy. These original uses
were to propel sailing ships across the water and also to use the energy and convert this into mechanical
energy in order to pump water or to grind grain. In the present time, the primary objective for wind
power is to generate electricity, using what is known as a wind turbine. For large energy generation
these turbines are arranged in large quantities called wind farms. These wind farms can be as small as a
few dozen turbines, or have as many as 100 turbines.
Over time the overall design of wind turbines have changed dramatically. The older turbines, or
windmills, used to consist of four blades, which were made of wood, each of the sails on the blades
5 (Diversifying Sources of Electricity )
8/3/2019 Worcester Academy Wind Turbine IQP Report FINAL
http://slidepdf.com/reader/full/worcester-academy-wind-turbine-iqp-report-final 10/78
10
were made of some type of strong fabric. These turbines used to be used for two main reasons; one
was to crush up stone, corn, and other things, into a fine powder in order to crush them using a big
wheel inside of the turbine. The newer turbines are typically three bladed, metal structures. These
turbines are very high in efficiency, have a fairly low amount of torque, have tip speeds, speed of the tip
of the blade, of up to six times the wind speed, and are also extremely reliable.6
2.1.1 Global Interest in Wind Energy
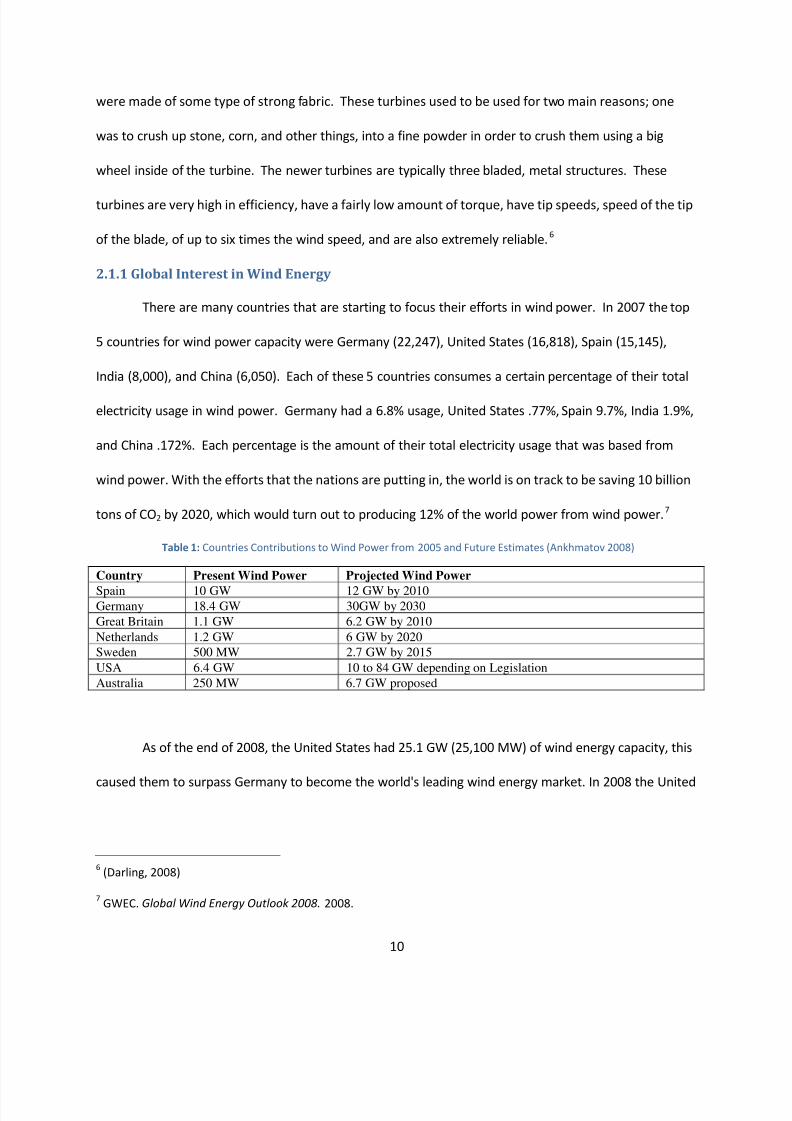
There are many countries that are starting to focus their efforts in wind power. In 2007 the top
5 countries for wind power capacity were Germany (22,247), United States (16,818), Spain (15,145),
India (8,000), and China (6,050). Each of these 5 countries consumes a certain percentage of their total
electricity usage in wind power. Germany had a 6.8% usage, United States .77%, Spain 9.7%, India 1.9%,
and China .172%. Each percentage is the amount of their total electricity usage that was based from
wind power. With the efforts that the nations are putting in, the world is on track to be saving 10 billion
tons of CO2 by 2020, which would turn out to producing 12% of the world power from wind power.7
Table 1: Countries Contributions to Wind Power from 2005 and Future Estimates (Ankhmatov 2008)
Country Present Wind Power Projected Wind Power
Spain 10 GW 12 GW by 2010Germany 18.4 GW 30GW by 2030
Great Britain 1.1 GW 6.2 GW by 2010
Netherlands 1.2 GW 6 GW by 2020
Sweden 500 MW 2.7 GW by 2015
USA 6.4 GW 10 to 84 GW depending on Legislation
Australia 250 MW 6.7 GW proposed
As of the end of 2008, the United States had 25.1 GW (25,100 MW) of wind energy capacity, this
caused them to surpass Germany to become the world's leading wind energy market. In 2008 the United
6(Darling, 2008)
7GWEC. Global Wind Energy Outlook 2008. 2008.
8/3/2019 Worcester Academy Wind Turbine IQP Report FINAL
http://slidepdf.com/reader/full/worcester-academy-wind-turbine-iqp-report-final 11/78
11
States wind capacity increased a total of 50%, which is vastly higher compared to the average growth of
the world’s capacity at 28.8%8
2.1.2 Local Interest in Wind Energy
On a state level, the amount of funding for research and development of wind energy is
increasing at a consistent rate. To ensure that the Commonwealth of Massachusetts was doing the most
it can to develop and use renewable energy the state government created Massachusetts Technology
Collaborative (MTC) in 1982. The MTC’s purpose since its beginning has been to create “a cleaner
environment for Massachusetts” and “improve the quality of life throughout the state”.9 MTC now
offers the largest grant program for renewable energy projects in Massachusetts including the Large
Onsite Renewables Initiative (LORI) grant that award up to $400,000 per project.
In the last couple of years the amount of wind turbines being constructed and proposals created
for more in Massachusetts has been on the rise. One project that was funded in part by the MTC was
the Holy Name Jr/Sr High School wind turbine constructed in Worcester. The construction of this turbine
was completed in 2007 and included a 600 kW wind turbine. MTC contributed $575,000 to the
completion of the project which covered partial costs of a feasibility study as well as the turbine and its
construction.10
A second project that received the LORI grant from MTC is the wind turbine constructed at
Massachusetts Maritime Academy in Bourne. This project completed in 2006 is similar to the Holy Name
project and included the installation of a 660 kW turbine on MMA’s campus. This project cost MMA
$1,344,500, $520,808 of which came from MTC in the form of grants. 11
8(Energy Sector Research)
9(MTC History (2005))
10(Holy Name Central Catholic Jr/Sr High School, 2007)
11(Massachusetts Maritime Academy, 2006)
8/3/2019 Worcester Academy Wind Turbine IQP Report FINAL
http://slidepdf.com/reader/full/worcester-academy-wind-turbine-iqp-report-final 12/78
12
A third wind turbine project that received the LORI Grant is a 10kW turbine located on the
location of Upper Cape Cod Regional Technical School also in Bourne. This turbine is the smallest
allowable to still apply for a LORI grant. To help aid in the financing of the turbine and the feasibility
study that went along with the construction the school received $428,000 in grants from MTC. As noted
in the project overview, Upper Cape Technical has also received other grants from MTC for their
renewable energy curriculum and photovoltaic cells.12
One site in Worcester that has also received the LORI Grant is the location of The Christopher
House. The Christopher House is a nursing and rehabilitation center that is located to the north of
Worcester Academy. So far, The Christopher House has received $37,782 from MTC for a wind power
feasibility study that was given out in May 2008. With the study finishing in the next few months The
Christopher House will become eligible for up to $400,000 more from MTC is their site is found a viable
wind energy source.13 If a wind turbine is added to the site it will be the second wind turbine installed
south and east of Route 290 in Worcester, the first being at Holy Name High School. This leaves an
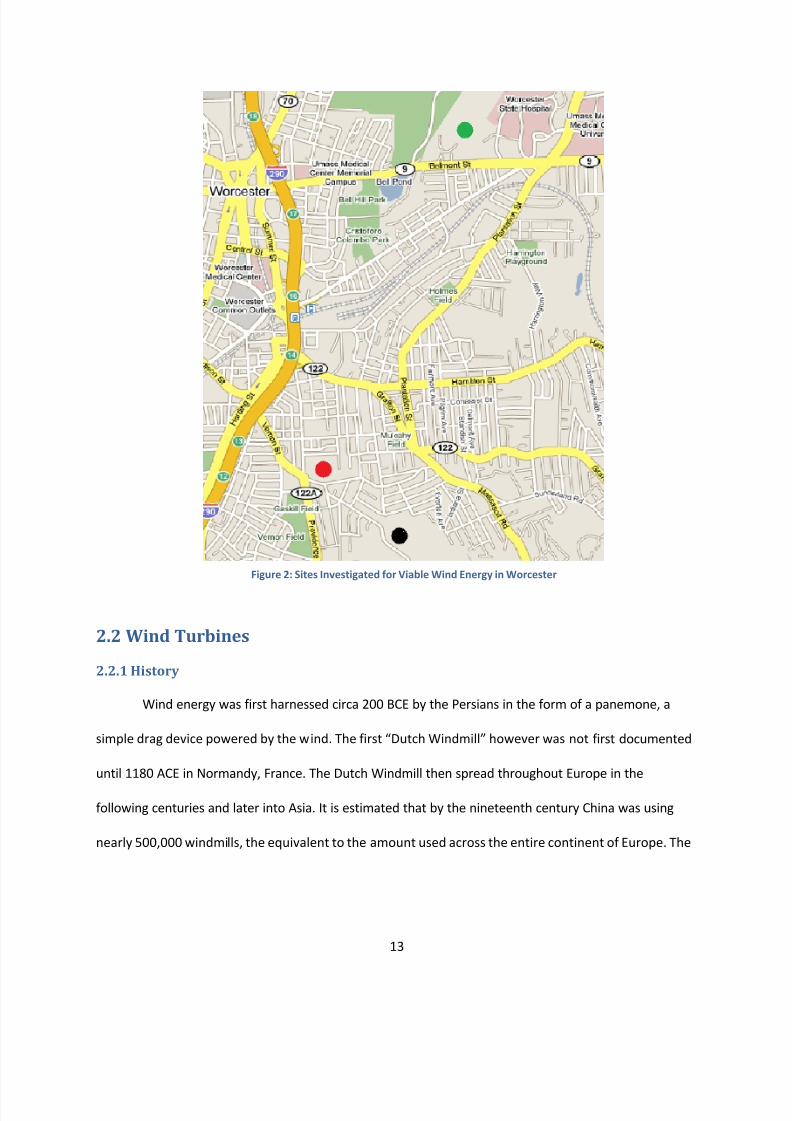
opportunity for Worcester Academy to install the third turbine in the area. Figure 2 below shows the
location of Holy Name High School’s turbine site as a black circle at the bottom of the figure, The
Christopher House’s proposed site as a green circle at the top of the figure, and Worcester Academy’s
proposed site in red on the left side of Figure 2.
12(Upper Cape Cod Regional Tech School - Wind Feasibility Study, 2007)
13(Christopher House Feasibility Study, 2008)
8/3/2019 Worcester Academy Wind Turbine IQP Report FINAL
http://slidepdf.com/reader/full/worcester-academy-wind-turbine-iqp-report-final 13/78
13
2.2 Wind Turbines
2.2.1 History
Wind energy was first harnessed circa 200 BCE by the Persians in the form of a panemone, a
simple drag device powered by the wind. The first “Dutch Windmill” however was not first documented
until 1180 ACE in Normandy, France. The Dutch Windmill then spread throughout Europe in the
following centuries and later into Asia. It is estimated that by the nineteenth century China was using
nearly 500,000 windmills, the equivalent to the amount used across the entire continent of Europe. The
Figure 2: Sites Investigated for Viable Wind Energy in Worcester
8/3/2019 Worcester Academy Wind Turbine IQP Report FINAL
http://slidepdf.com/reader/full/worcester-academy-wind-turbine-iqp-report-final 14/78
14
first windmills started to cross the Atlantic Ocean into the United States around 1850. 14 According to
historian Walter Prescott Webb, the windmill was one of the most important inventions in allowing the
spread of farms across the Great Plains as it allowed farmers access to water for herds that was
otherwise unattainable.15
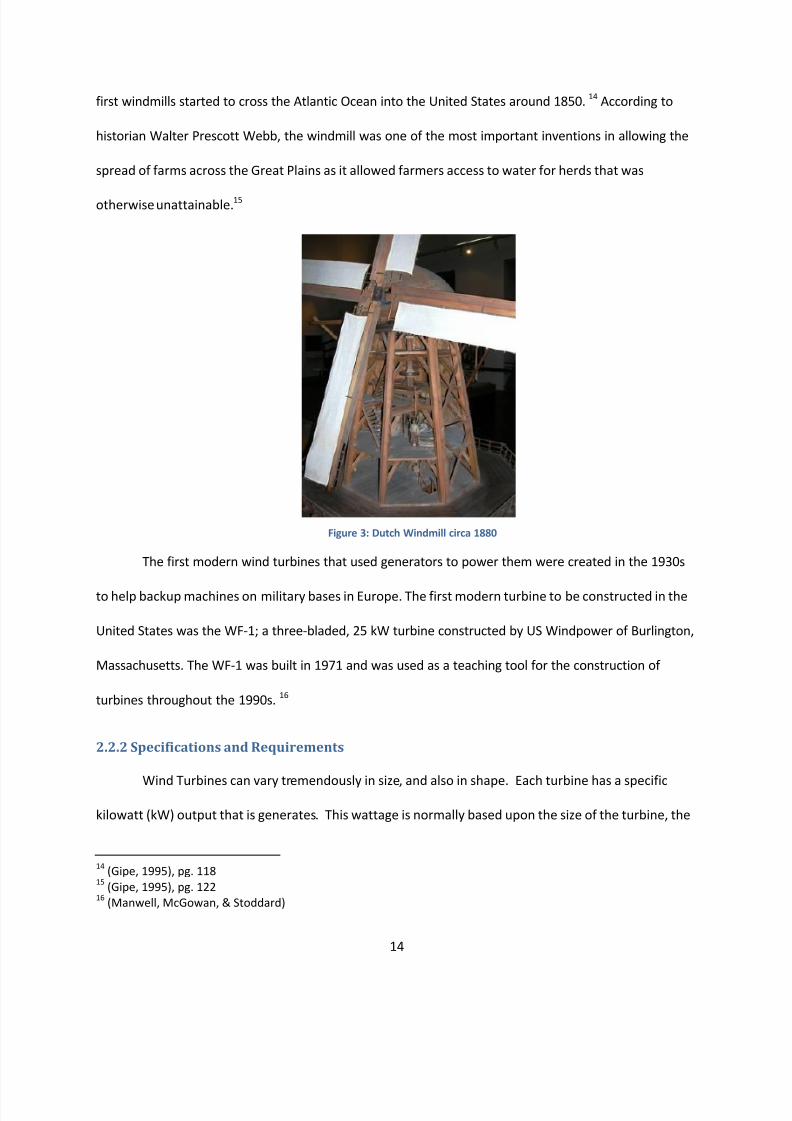
The first modern wind turbines that used generators to power them were created in the 1930s
to help backup machines on military bases in Europe. The first modern turbine to be constructed in the
United States was the WF-1; a three-bladed, 25 kW turbine constructed by US Windpower of Burlington,
Massachusetts. The WF-1 was built in 1971 and was used as a teaching tool for the construction of
turbines throughout the 1990s. 16
2.2.2 Specifications and Requirements
Wind Turbines can vary tremendously in size, and also in shape. Each turbine has a specific
kilowatt (kW) output that is generates. This wattage is normally based upon the size of the turbine, the
14(Gipe, 1995), pg. 118
15(Gipe, 1995), pg. 122
16(Manwell, McGowan, & Stoddard)
Figure 3: Dutch Windmill circa 1880
8/3/2019 Worcester Academy Wind Turbine IQP Report FINAL
http://slidepdf.com/reader/full/worcester-academy-wind-turbine-iqp-report-final 15/78
15
smaller the turbine the smaller the wattage output, the bigger the turbine, the larger the wattage
output. There is an equation that states how the power of a turbine is determined, this shows how the
power transferred to the turbine itself is directly proportional to the density of the air, to the area that
rotors turn, and to the cube of the wind speed.
P=1/2 αρπr2v
3.
P is the power in watts, α is an efficiency factor that is determined by the design of the turbine
itself, ρ is the density of the air in kilograms per meters squared, r is the radius of the turbine in meters,
and v is the velocity of the air in meters per second.17
In order to place a wind turbine, there are multiple factors that need to be considered. First of
the necessities is determining what size of a turbine that is to be used. The size could vary anywhere
from a 100 kW turbine to a 1 MW turbine. The determination of size depends on the power demand
that must be met. Second, and probably most important, finance must be considered. One option to
seek funds is through grants that are given by the state and federal governments. Also the elevation
plays a part in deciding where to put a turbine. Higher elevations are associated with faster wind
speeds, and lower elevations imply lower wind speeds. Turbines can be place at various elevations and
can be placed in water or on land. When placing a turbine, it is often helpful to take advantage of the
funnel effect associated with the landscape in the area. This effect essentially concentrates the wind in
one specific area, which results in higher wind speeds in a given area. Other factors that come into
account are the temperature. Areas that have extremely low temperatures (e.g. below -20°C) open up
the possibility of ice accumulation on the rotor, or motor. The accumulation of ice can cause high loads
on certain areas and possible damage to areas of the turbine. The ice problem can be fixed with
17(American Wind Energy Association)
8/3/2019 Worcester Academy Wind Turbine IQP Report FINAL
http://slidepdf.com/reader/full/worcester-academy-wind-turbine-iqp-report-final 16/78
16
different lubricants, different alloys that the turbine is made out of, and even including internal heaters
inside of the turbine.18
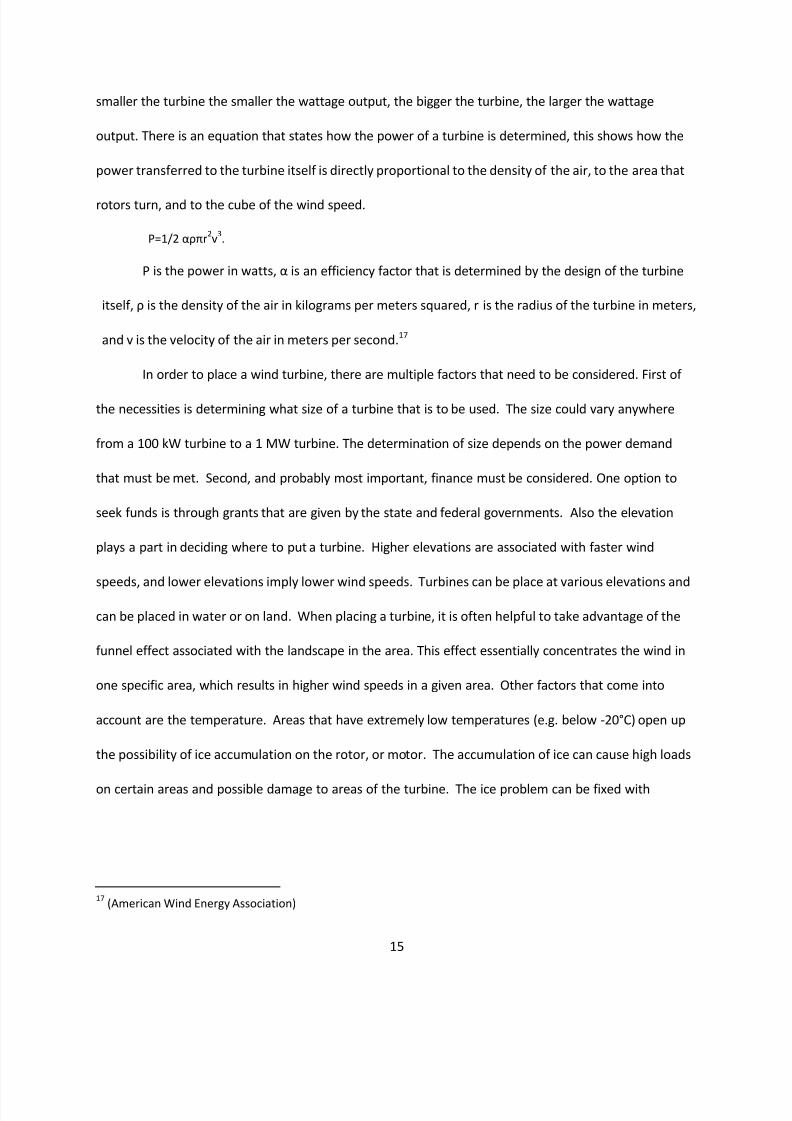
Finally there are also requirements associated with the turbines that must be addressed in order
for the turbine to be built. The minimum wind speed needed in order to power a turbine is typically 10
mph, or 4.5m/s. The ideal conditions for a spot to install a turbine include in an area with a relatively
constant wind flow, and relatively few turbulent gusts of wind. This is because turbulent winds can
damage or even knock over a wind turbine. Figure 2 shows the average wind speeds in the nation.19
This is determined by various different shading of blue. The darker that the area is the higher the
average wind speeds are for that given area.
18(American Wind Energy Association)
19(Massachusetts Technology Collaborative)
Figure 4: U. S. Annual Wind Power
8/3/2019 Worcester Academy Wind Turbine IQP Report FINAL
http://slidepdf.com/reader/full/worcester-academy-wind-turbine-iqp-report-final 17/78
17
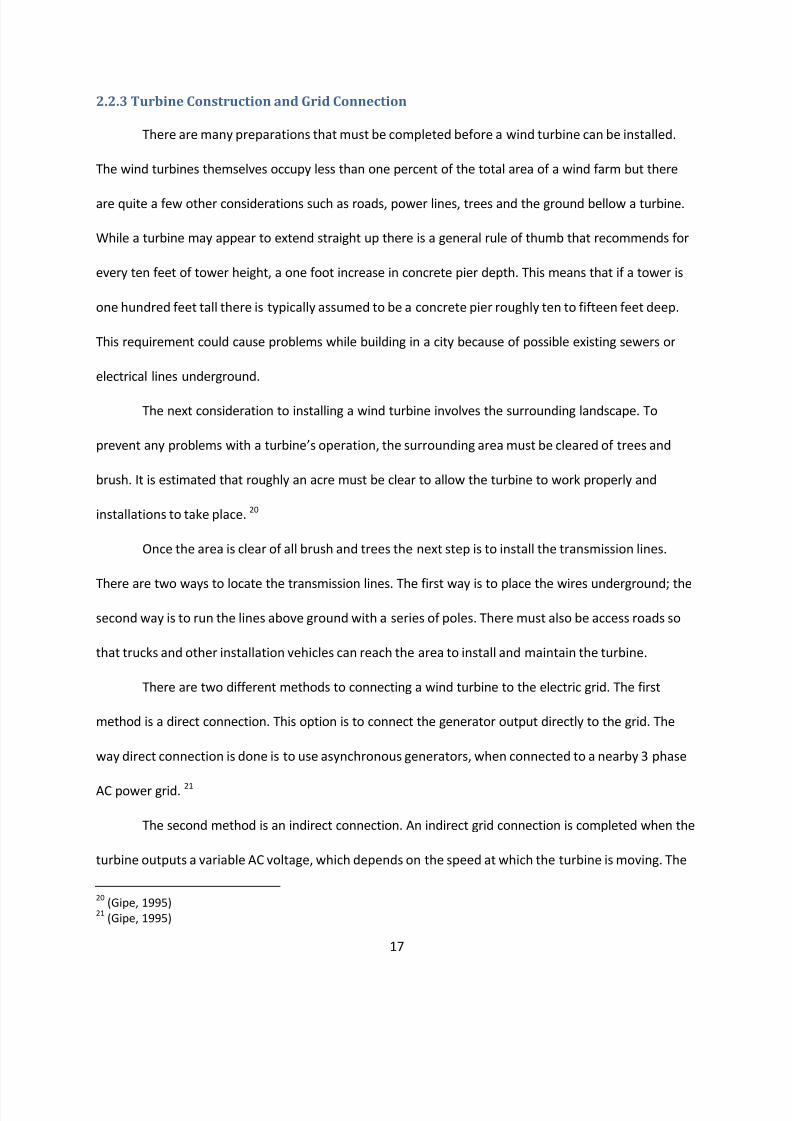
2.2.3 Turbine Construction and Grid Connection
There are many preparations that must be completed before a wind turbine can be installed.
The wind turbines themselves occupy less than one percent of the total area of a wind farm but there
are quite a few other considerations such as roads, power lines, trees and the ground bellow a turbine.
While a turbine may appear to extend straight up there is a general rule of thumb that recommends for
every ten feet of tower height, a one foot increase in concrete pier depth. This means that if a tower is
one hundred feet tall there is typically assumed to be a concrete pier roughly ten to fifteen feet deep.
This requirement could cause problems while building in a city because of possible existing sewers or
electrical lines underground.
The next consideration to installing a wind turbine involves the surrounding landscape. To
prevent any problems with a turbine’s operation, the surrounding area must be cleared of trees and
brush. It is estimated that roughly an acre must be clear to allow the turbine to work properly and
installations to take place. 20
Once the area is clear of all brush and trees the next step is to install the transmission lines.
There are two ways to locate the transmission lines. The first way is to place the wires underground; the
second way is to run the lines above ground with a series of poles. There must also be access roads so
that trucks and other installation vehicles can reach the area to install and maintain the turbine.
There are two different methods to connecting a wind turbine to the electric grid. The first
method is a direct connection. This option is to connect the generator output directly to the grid. The
way direct connection is done is to use asynchronous generators, when connected to a nearby 3 phase
AC power grid. 21
The second method is an indirect connection. An indirect grid connection is completed when the
turbine outputs a variable AC voltage, which depends on the speed at which the turbine is moving. The
20(Gipe, 1995)
21(Gipe, 1995)
8/3/2019 Worcester Academy Wind Turbine IQP Report FINAL
http://slidepdf.com/reader/full/worcester-academy-wind-turbine-iqp-report-final 18/78
18
AC is output from the turbine and then converted to a fluctuating DC. The conversion is done using a
large power transistor. The next step is to convert the DC back to usable fixed frequency AC. This
process is also done using the same transistor. Once the voltage is in the form of fixed frequency AC
voltage, the fixed AC voltage needs to be pissed through filters to reduce of the spikes and sags. The
filters shape the wave into exact form the utility companies use.
There are many advantages to using the indirect method for grid connection. The first
advantage of indirect method is that it allows the turbine to harness more possible power because the
turbine is now allowed to use the full power of a gust of wind. This method also helps reduce the wear
and tear of the turbine because it relieves the stress, allowing the tower and rotor to operate peak
torque. The biggest advantage is that modern power electronics facilitates the use of voltage phase
shifting and the reactive power can be controlled much easier. This technique helps improve the quality
of power being put into the grid. The main disadvantage that associated with the indirect grid
connection is the energy loss and the power and high cost of electronics systems. The conversion from
AC to DC back to AC also reduces the overall efficiency.
While in some cases the indirect grid connection might be more expensive, it gives the best
overall power output.
2.2.4 Types of Turbines
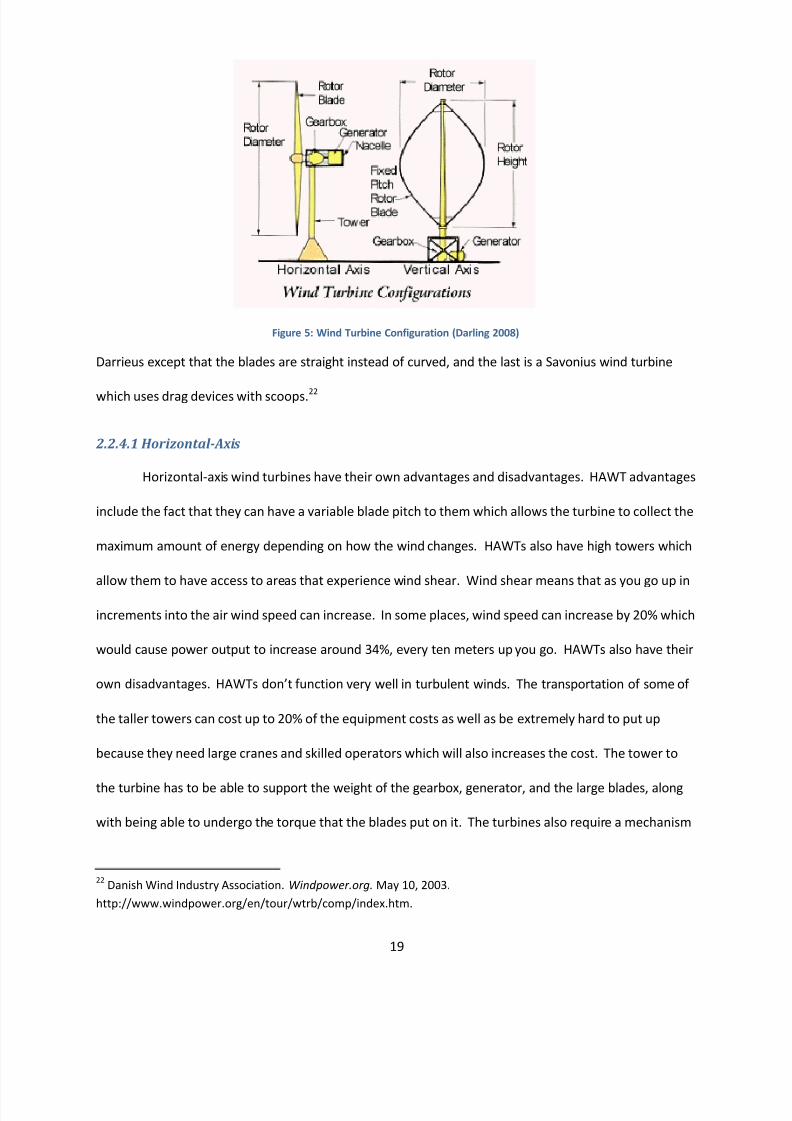
The new modern turbines are generally grouped into two types of categories; Horizontal-axis
wind turbines (HAWT) and Vertical-axis wind turbines (VAWT). There are advantages and disadvantages
to both of these types. HAWTs are what people typically think of when they think of a wind turbine.
These names refer to the main rotor shaft and the direction in which it is arranged. HAWTs have their
motors/electrical generators at the top of the tower, whereas the VAWTs have theirs at the base of the
tower. HAWTs generally fall into one look of the turbine itself, whereas VAWTs have three main types;
Darrieus wind turbine, which looks similar to a very large egg beater, the Giromill is a similar to the
8/3/2019 Worcester Academy Wind Turbine IQP Report FINAL
http://slidepdf.com/reader/full/worcester-academy-wind-turbine-iqp-report-final 19/78
19
Darrieus except that the blades are straight instead of curved, and the last is a Savonius wind turbine
which uses drag devices with scoops.22
2.2.4.1 Horizontal-Axis
Horizontal-axis wind turbines have their own advantages and disadvantages. HAWT advantages
include the fact that they can have a variable blade pitch to them which allows the turbine to collect the
maximum amount of energy depending on how the wind changes. HAWTs also have high towers which
allow them to have access to areas that experience wind shear. Wind shear means that as you go up in
increments into the air wind speed can increase. In some places, wind speed can increase by 20% which
would cause power output to increase around 34%, every ten meters up you go. HAWTs also have their
own disadvantages. HAWTs don’t function very well in turbulent winds. The transportation of some of
the taller towers can cost up to 20% of the equipment costs as well as be extremely hard to put up
because they need large cranes and skilled operators which will also increases the cost. The tower to
the turbine has to be able to support the weight of the gearbox, generator, and the large blades, along
with being able to undergo the torque that the blades put on it. The turbines also require a mechanism
22Danish Wind Industry Association. Windpower.org. May 10, 2003.
http://www.windpower.org/en/tour/wtrb/comp/index.htm.
Figure 5: Wind Turbine Configuration (Darling 2008)
8/3/2019 Worcester Academy Wind Turbine IQP Report FINAL
http://slidepdf.com/reader/full/worcester-academy-wind-turbine-iqp-report-final 20/78
20
called a yaw which is used to keep the rotor facing the wind to ensure that the maximum amount of
energy is being absorbed. The large structures tend to be very obtrusive and stick out in the landscape
which can cause local people to get aggravated with looking at it. The larger turbines can also be very
hard to repair if something happens to break on or in them.23
2.2.4.2 Vertical-Axis
Vertical-axis wind turbines also have their own advantages and disadvantages. Some of the
advantages include but are not limited to the following items. First, there is no yaw since the blades are
vertical, and therefore do not need to turn to face the wind. VAWTs are not required to be high in the
air; they can be located close to the ground if needed. This makes it so that there is no massive
structure that is needed. VAWTs have a lower start up speed starting at 6 mph, as well as having a
lower tip speed ratio so turbulent winds are less likely to break them. The structures can be built in
areas where height might be a limiting factor. Vertical-axis wind turbines also have disadvantages as
well. They are 50% less efficient as HAWTs because, in order to catch the wind, the blades rotate in a
manner that creates additional drag in the air. Some VAWTs use guy-wires in order to hold the structure
in place, this puts all the weight of the rotor on the bottom bearing. Also since VAWTs are located on
the ground they have the entire structure on top of the motor, this causes it to be very hard to repair if
something happens to break.24
2.2.5 Maintenance
A wind turbine usually is given an estimated life span of 20-30 years. It is estimated that a
maintenance cost for a turbine should be roughly 2% of its total turbine cost. To keep a turbine running
23 Danish Wind Industry Association. Windpower.org. May 10, 2003.
http://www.windpower.org/en/tour/wtrb/comp/index.htm.
24Danish Wind Industry Association. Windpower.org. May 10, 2003.
http://www.windpower.org/en/tour/wtrb/comp/index.htm.
8/3/2019 Worcester Academy Wind Turbine IQP Report FINAL
http://slidepdf.com/reader/full/worcester-academy-wind-turbine-iqp-report-final 21/78
21
at the peak of its potential it is suggested that the entire turbine be checked annually. There are some
general specific tasks that are asked to be done such as greasing bearings, changing transmission oil,
braking systems, checking rotor blades and testing the wiring and connections. The turbine must also
have all its mechanical parts checked and all of the supporting structures around the turbine as well as
the wiring between the output of the turbine and wherever the energy is being routed to. The tower
must also be checked for any signs of damage that may have occurred over the year. All of these
precautions done at least once a year will keep the turbine running at optimal efficiency and keeps it
running for its full lifespan.
2.3 Induction Generators
Induction generators are what a typical turbine uses in order to generate power. This induction
generator is used to convert the mechanical power of the rotor into the electrical power that is then put
into the grid. There are multiple different types of induction generators; these include fixed-speed
generators, dynamic rotor resistance generators, doubly-fed generators, full-rating converter generator.
Each of these types of inductors have a different way in which the generate power, and is converted into
electrical power. Each of these inductors are used to supply the grid with the converted electrical
power, but at the same time the generators also absorb some power from the grid. This power is used
to excite the generator in order to get it going. 25
25(Ankhmatov, 2005)
8/3/2019 Worcester Academy Wind Turbine IQP Report FINAL
http://slidepdf.com/reader/full/worcester-academy-wind-turbine-iqp-report-final 22/78
22
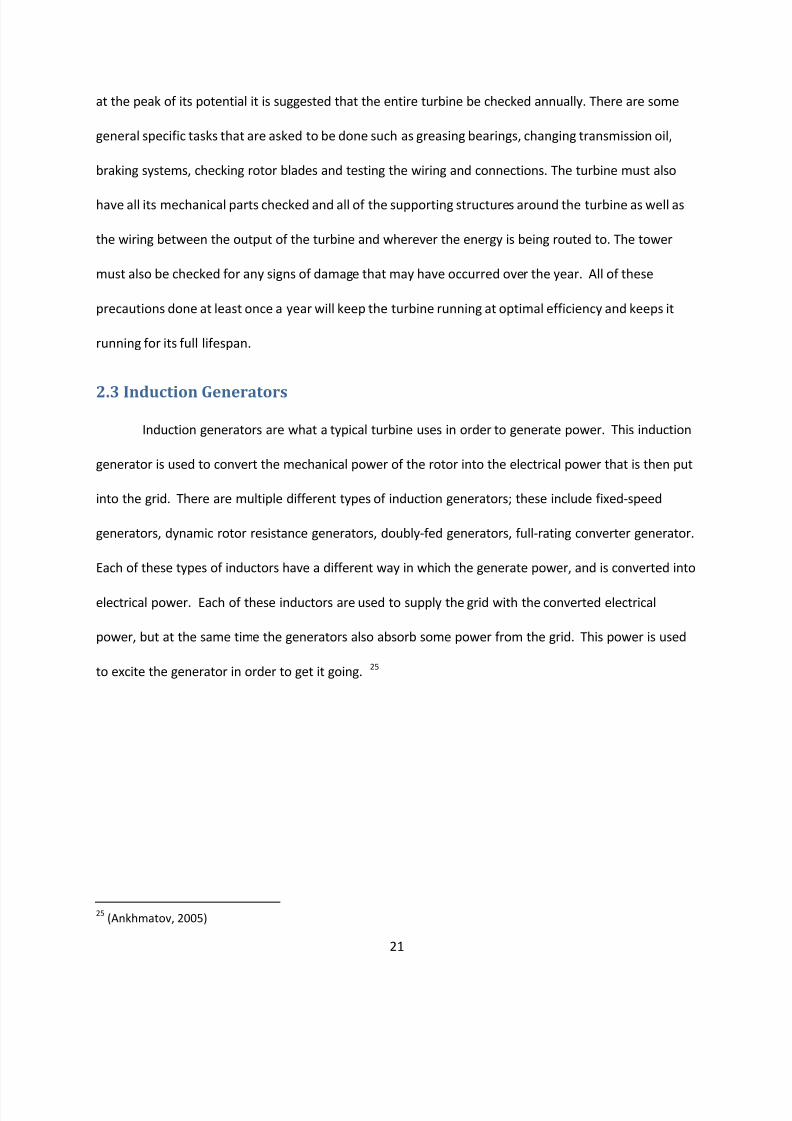
Figure 6: Different Types of Induction Generators
2.3.1 Fixed Speed
The first and oldest commercial wind turbines were equipped with a short-circuited rotor circuit.
This means that the wind turbine rotor is connected to the generator rotor through a shift type system.
This is known as a fixed-speed generator, because the range of variation in the speed of normal
operation only varies by up to 2%. In this concept the generators have no way of controlling the
reactive power that is taken from the grid, which requires the grid voltage to be kept at around the
rated voltage of the generator. This also means that the generators usually have to be fully
compensated with the use of a set of capacitor banks, this controls and reduces the overall reactive
power that is taken from the grid, which thus improves the overall power generator by the generator
itself. 26
26(Ankhmatov, 2005)
8/3/2019 Worcester Academy Wind Turbine IQP Report FINAL
http://slidepdf.com/reader/full/worcester-academy-wind-turbine-iqp-report-final 23/78
23
The shaft system is comprised of a low-speed shaft that is connected to a three bladed rotor,
and a high-speed shaft that is connected to the generator rotor and the gearbox. The purpose of the
gearbox is to allow transformation between the slow and fast rotating generator rotors. The normal
range of the turbine rotor speed is anywhere from 15 to 20 rev./min. Along with that the speed of the
generator is normally 1500 rev./min for two-pole pairs and 1000 rev./min. for three-pole setups. This
also means that the mechanical gear ratio of these turbines is around 100.
In this concept, the turbines are either fixed-pitch or they are blade-angle controlled. Another
name for the fixed-pitch is called stall-controlled, this is because the mechanical power of the system is
controlled and limited to the rated power which occurs during rated wind conditions. This means that
the blades are simply secured to the rotor hub at a given fixed pitch angle. With this at higher wind
speeds it can cause the rotor system to stall. The purpose of this design is simply for a very robust, and
cheap solution.
With blade-angle controlled turbines the blades can be adjusted at a given angle. The purpose
of this is in order to improve the low rated speeds which can cause the turbine to stall and also to keep
the power up at high rated wind speeds. When the speed of the turbine gets high, the angle of the
blades become steeper creating a lower speed at which the high stall point would hit. When the speed
of the turbine gets low, the angle of the blade gets shallower in order to prevent the low stall point.
This active-stall control provides a reduction of flickering emission from the turbines themselves and is
characterized by limitation of the turbines power, when the wind exceeds the rated wind speed. 27
2.3.2 Dynamic Rotor Resistance
The concept of dynamic rotor resistance is based upon having the rotor circuit connected to a
power electronics converter. This power electronics converter is controlled using the Insulated Gate
Bipolar Transistor (IGBT) switches, which also ads an external resistance in series with the rotor circuit.
27(Ankhmatov, 2005)
8/3/2019 Worcester Academy Wind Turbine IQP Report FINAL
http://slidepdf.com/reader/full/worcester-academy-wind-turbine-iqp-report-final 24/78
24
This external rotor resistance allows continuous operation of the generator rotor slip because you have
dynamic control of it. 2% is the normal slip range of a short- circuited rotor circuit. Instead this allows
up to 10% because this allows for operation at partly variable speeds. The benefit of this control is to
reduce flicker emission that is put into the grid; this is similar to the fixed speed concept as well.
The partly variable speed wind turbines that are equipped with this type of induction generation
use a pitch control. This pitch control is used in order to optimize the power output of the rotor at
speeds below the rated wind, and to keep the rated power steady in situations of high wind speeds. The
pitch works as follows; when it is applied, the blades are turned away from the wind when the output
becomes excessive. This reduces the angle and limits the mechanical power. The opposite also applies
for when the output is too low, the angle is increased in order to improve mechanical power. The use of
this pitch control also helps to compensate for the variations that can occur in maximum steady-state
power that are caused by changes in air density.
The use of the power electronics converter does not influence the induction generator
excitation. The generator absorbs power from the grid, reactive power. This is then compensated the
same way as the fixed-speed concept. The use of a capacitor bank is used to improve the power of the
turbine. 28
2.3.3 Doubly-Fed Generators
The concept of the use of doubly-fed generators is a very popular concept among many
manufacturers. The turbines that use these are usually variable speed, pitch controlled. The way this
works starts with a slow rotating rotor that is connected to a fast rotating generator. This is done
through a geared shaft system, which has a gear ratio of up to 100. The generator stator is AC
connected to the power grid. The generator rotor however, is connected through an AC/DC/AC
frequency converter back to the grid. This frequency converter is comprised of two back to back voltage
28(Ankhmatov, 2005)
8/3/2019 Worcester Academy Wind Turbine IQP Report FINAL
http://slidepdf.com/reader/full/worcester-academy-wind-turbine-iqp-report-final 25/78
25
sourced converters (VSC) that are connected through a DC link. The grid side VSC uses a smoothing
inductor and transformer to feed the power into the grid, and the rotor side VSC is connected to the
rotor circuit through slip-rings. These two VSCs are controlled by IGBT-switches.
The generator rotor along with the wind turbine rotor, do not require that there be a fixed
speed in order to operate. However the rotor speed can be adjusted via the dynamic control of the
rotor VSC. This provides a much wider speed range at which the turbine can operate, which is why they
are known as variable speed. These variable speed turbines typically are able to operate within the
speed range of -40% to 15% (dynamically up to 30%) of the synchronous speed. This can have the
possibility to increase energy production anywhere from 5% to 10% depending on the overall power and
functioning speed.
The VSC also allows for power fluctuations, caused by wind fluctuations and gusts, to be
converted into kinetic energy of the rotor and smoothly converted to electrical energy that is supplied to
the grid. 29
2.3.4 Full Rating Converters
The concept of full-rating converters starts with the following block setup; Dynamic wind,
Aerodynamic rotor, shaft system, induction generator operating at full-variable frequency that is set by
the generator VSC, generator VSC including control and interfacing the simulation tool, grid-side VSC
including control and interfacing the simulation tool, DC link, protective system, and pitch control. The
frequency converter uses IGBT- switches; these must be protected against over-voltage, over-current,
and thermal impact. The converter protection model with restart and converter blocking has to be
maintained in the dynamic wind turbine model, so this control can be arranged in a couple different
ways. The first is b completely blocking voltage in the DC link, this interrupts the power supply to DC link
from the generator VSC. This allows the voltage to stabilize to within the acceptable range, then the
29(Ankhmatov, 2005)
8/3/2019 Worcester Academy Wind Turbine IQP Report FINAL
http://slidepdf.com/reader/full/worcester-academy-wind-turbine-iqp-report-final 26/78
26
converter starts again with normal operations. The second way is to apply an immediate frequency
change at excessive over-voltages. In this the power of the generator VSC is reduced, or even set to
negative, which results in an immediate frequency change at the generator terminals and this interrupts
the active power supply. Another piece that can be present is a “chopper”, this acts like an electronic
crow bar. This chopper short circuits the DC link capacitor through a resistance at an excessive DC
voltage. The grid side VSC is designed with this in mind, and has to withstand the impact of the grid
during short circuit faults that may cause blocking of the generator VSC. The means that grid side VSC
control should be at full-rating capability, to control the reactive power of the grid and to supports the
grids voltage during short circuiting. An important note is that if the grid side VSC has to block, the
turbine must not stop so this causes the VSC to have to restart very quickly after the grid fault is
removed. 30
2.4 ArcGIS
GIS stands for geographic information system. GIS is a way to capture, store, analyze, manage,
and present data that has a way to be linked to a specified location. ArcGIS is a computer program that
uses GIS data maps in different given layers. These layers can be placed on top of each other to achieve
the look of any given map that you want. These maps can be made for anything from street maps, to
river maps, to topography maps, to contour maps, or anything that one can find in data layer form that
they want to make a map of. The possibilities for the program are endless. In this map design the layer
images that were used were raster images. These are images that are in a series of bits of information
that are translated into pixels in the image itself. For the maps for Worcester Academy, the data for
these layers were derived mainly from data that were collected by Massachusetts Technology
Collaborative, in combination with numerous other companies.
30(Ankhmatov, 2005)
8/3/2019 Worcester Academy Wind Turbine IQP Report FINAL
http://slidepdf.com/reader/full/worcester-academy-wind-turbine-iqp-report-final 27/78
27
2.5 Wind Data Collection
The power of wind sources varies with the time of day, season, height above the ground and
type of terrain. All of these things must be looked at and considered before a wind turbine can be
established. The best way to consider these factors and estimate monthly wind speeds and direction is
with an anemometer. An anemometer is a weather instrument used to measure the speed of the wind.
There are a few different types of anemometers ranging in complexities.
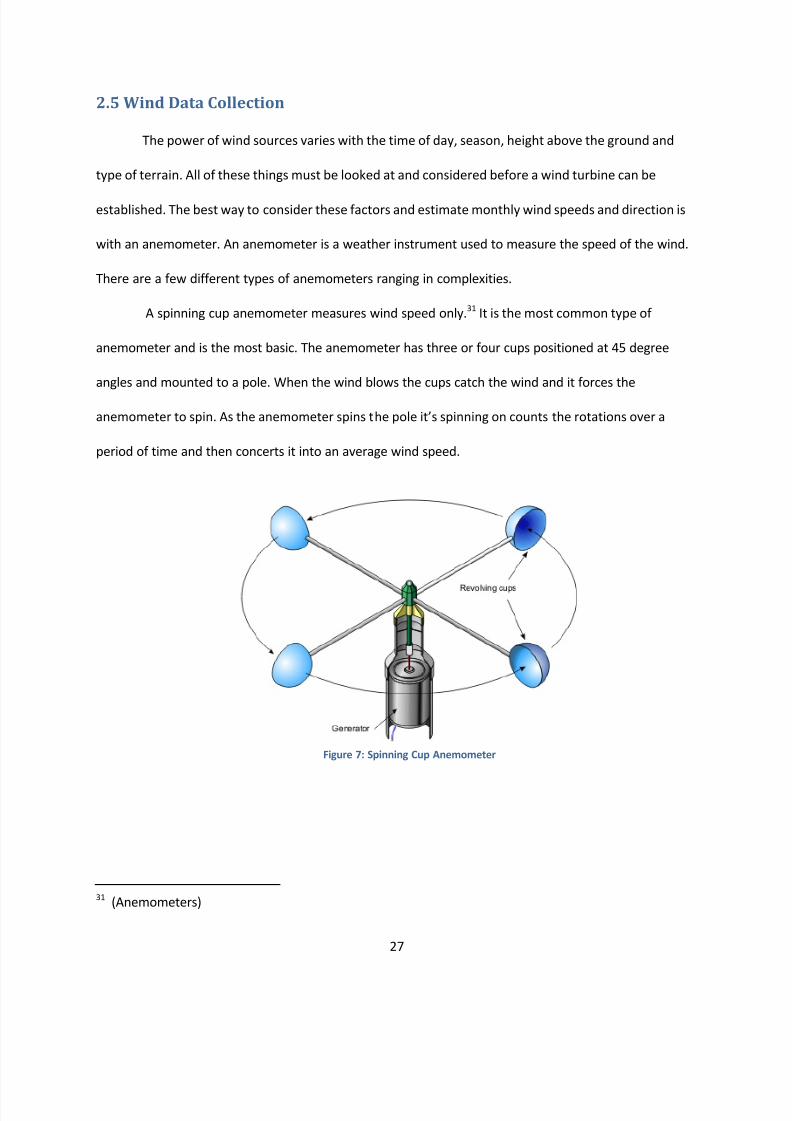
A spinning cup anemometer measures wind speed only.31 It is the most common type of
anemometer and is the most basic. The anemometer has three or four cups positioned at 45 degree
angles and mounted to a pole. When the wind blows the cups catch the wind and it forces the
anemometer to spin. As the anemometer spins the pole it’s spinning on counts the rotations over a
period of time and then concerts it into an average wind speed.
31 (Anemometers)
Figure 7: Spinning Cup Anemometer
8/3/2019 Worcester Academy Wind Turbine IQP Report FINAL
http://slidepdf.com/reader/full/worcester-academy-wind-turbine-iqp-report-final 28/78
28
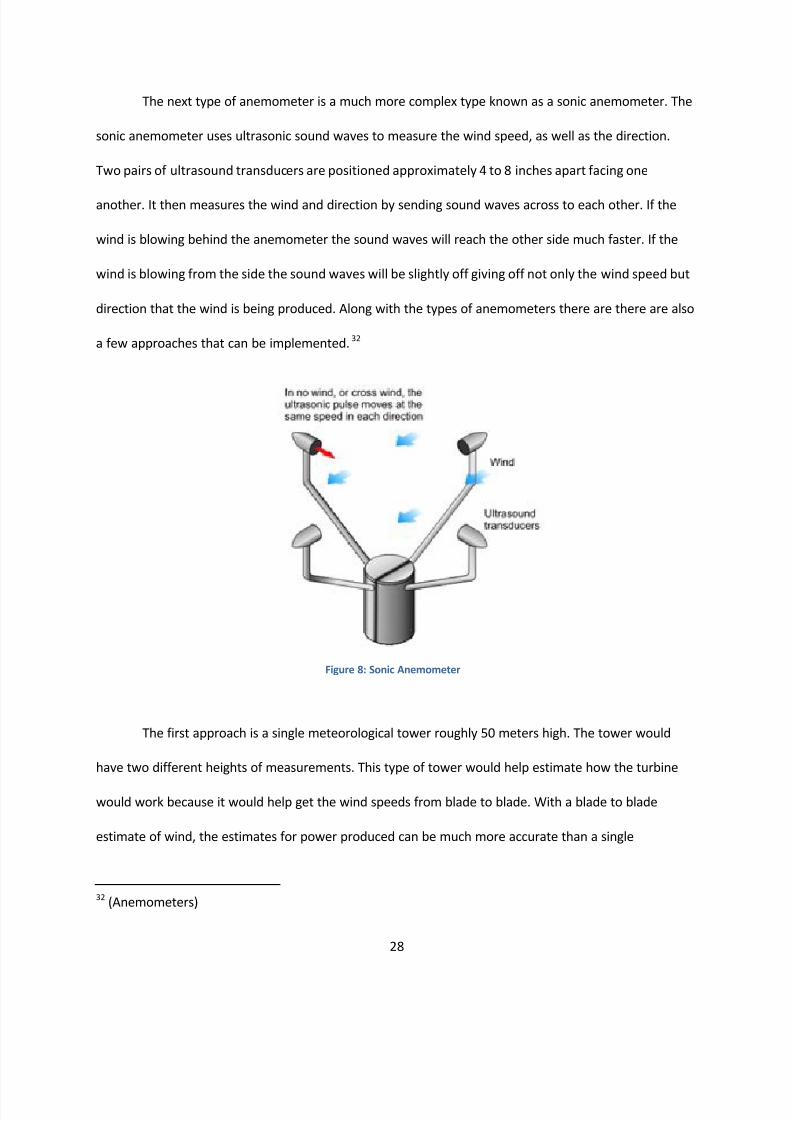
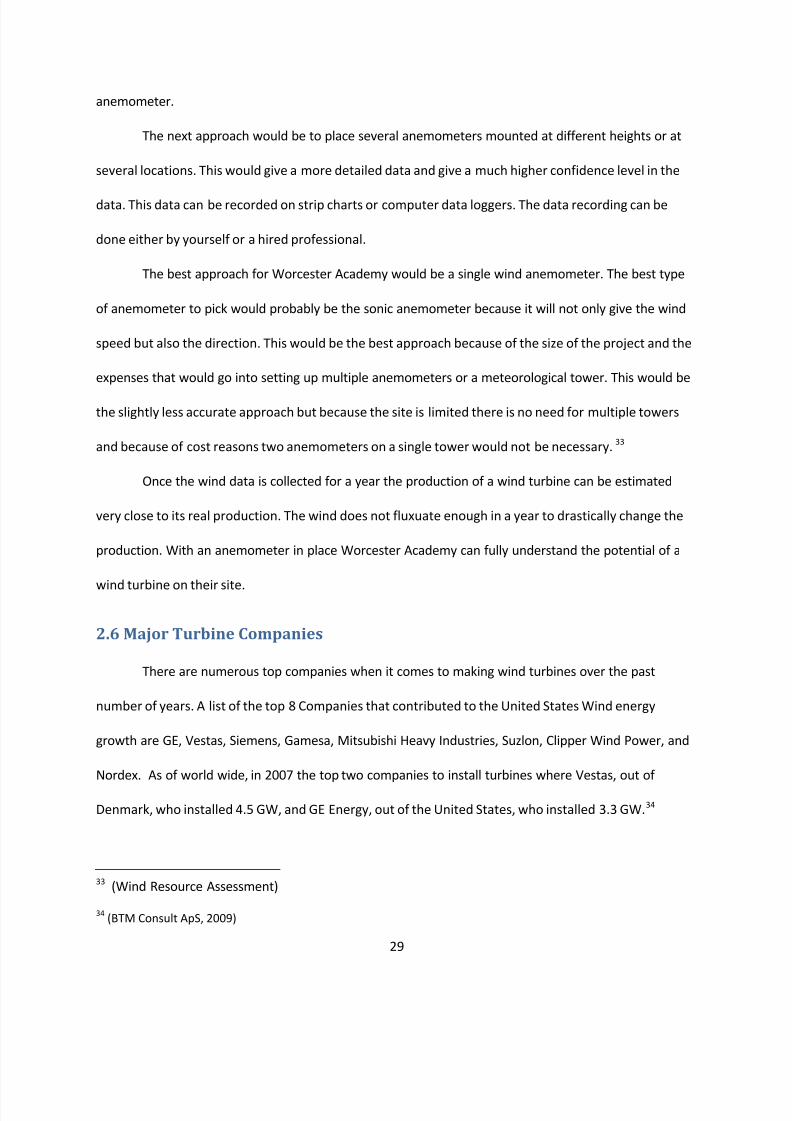
The next type of anemometer is a much more complex type known as a sonic anemometer. The
sonic anemometer uses ultrasonic sound waves to measure the wind speed, as well as the direction.
Two pairs of ultrasound transducers are positioned approximately 4 to 8 inches apart facing one
another. It then measures the wind and direction by sending sound waves across to each other. If the
wind is blowing behind the anemometer the sound waves will reach the other side much faster. If the
wind is blowing from the side the sound waves will be slightly off giving off not only the wind speed but
direction that the wind is being produced. Along with the types of anemometers there are there are also
a few approaches that can be implemented. 32
The first approach is a single meteorological tower roughly 50 meters high. The tower would
have two different heights of measurements. This type of tower would help estimate how the turbine
would work because it would help get the wind speeds from blade to blade. With a blade to blade
estimate of wind, the estimates for power produced can be much more accurate than a single
32 (Anemometers)
Figure 8: Sonic Anemometer
8/3/2019 Worcester Academy Wind Turbine IQP Report FINAL
http://slidepdf.com/reader/full/worcester-academy-wind-turbine-iqp-report-final 29/78
29
anemometer.
The next approach would be to place several anemometers mounted at different heights or at
several locations. This would give a more detailed data and give a much higher confidence level in the
data. This data can be recorded on strip charts or computer data loggers. The data recording can be
done either by yourself or a hired professional.
The best approach for Worcester Academy would be a single wind anemometer. The best type
of anemometer to pick would probably be the sonic anemometer because it will not only give the wind
speed but also the direction. This would be the best approach because of the size of the project and the
expenses that would go into setting up multiple anemometers or a meteorological tower. This would be
the slightly less accurate approach but because the site is limited there is no need for multiple towers
and because of cost reasons two anemometers on a single tower would not be necessary. 33
Once the wind data is collected for a year the production of a wind turbine can be estimated
very close to its real production. The wind does not fluxuate enough in a year to drastically change the
production. With an anemometer in place Worcester Academy can fully understand the potential of a
wind turbine on their site.
2.6 Major Turbine Companies
There are numerous top companies when it comes to making wind turbines over the past
number of years. A list of the top 8 Companies that contributed to the United States Wind energy
growth are GE, Vestas, Siemens, Gamesa, Mitsubishi Heavy Industries, Suzlon, Clipper Wind Power, and
Nordex. As of world wide, in 2007 the top two companies to install turbines where Vestas, out of
Denmark, who installed 4.5 GW, and GE Energy, out of the United States, who installed 3.3 GW.34
33 (Wind Resource Assessment)
34(BTM Consult ApS, 2009)
8/3/2019 Worcester Academy Wind Turbine IQP Report FINAL
http://slidepdf.com/reader/full/worcester-academy-wind-turbine-iqp-report-final 30/78
30
Each of these companies has different types of turbines that they seem to design and each of
these companies has different combinations of turbines and generators to make their product. The
following table lists some of the larger companies in the world and the type of turbines that they design
and put together.
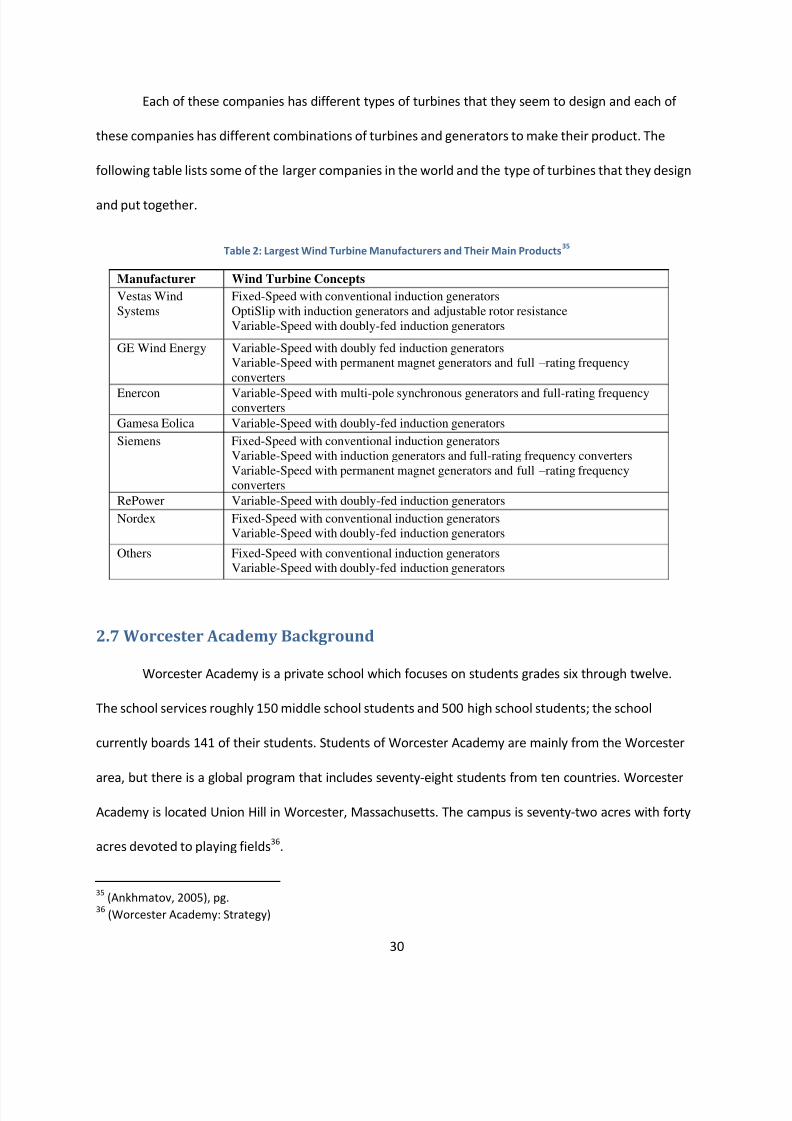
Table 2: Largest Wind Turbine Manufacturers and Their Main Products35
Manufacturer Wind Turbine Concepts
Vestas Wind
Systems
Fixed-Speed with conventional induction generators
OptiSlip with induction generators and adjustable rotor resistance
Variable-Speed with doubly-fed induction generators
GE Wind Energy Variable-Speed with doubly fed induction generators
Variable-Speed with permanent magnet generators and full – rating frequency
converters
Enercon Variable-Speed with multi-pole synchronous generators and full-rating frequencyconverters
Gamesa Eolica Variable-Speed with doubly-fed induction generators
Siemens Fixed-Speed with conventional induction generators
Variable-Speed with induction generators and full-rating frequency converters
Variable-Speed with permanent magnet generators and full – rating frequency
converters
RePower Variable-Speed with doubly-fed induction generators
Nordex Fixed-Speed with conventional induction generators
Variable-Speed with doubly-fed induction generators
Others Fixed-Speed with conventional induction generators
Variable-Speed with doubly-fed induction generators
2.7 Worcester Academy Background
Worcester Academy is a private school which focuses on students grades six through twelve.
The school services roughly 150 middle school students and 500 high school students; the school
currently boards 141 of their students. Students of Worcester Academy are mainly from the Worcester
area, but there is a global program that includes seventy-eight students from ten countries. Worcester
Academy is located Union Hill in Worcester, Massachusetts. The campus is seventy-two acres with forty
acres devoted to playing fields36.
35(Ankhmatov, 2005), pg.
36(Worcester Academy: Strategy)
8/3/2019 Worcester Academy Wind Turbine IQP Report FINAL
http://slidepdf.com/reader/full/worcester-academy-wind-turbine-iqp-report-final 31/78
31
In these tough economical times Worcester Academy has been actively looking for ways to save
money but stay environmentally conscious. One of the schools goals is “developing and adopt a school-
wide plan for environmental responsibility and civic engagement.”37 While the school has been reducing
its energy consumption for the past few years by implementing simple things such as turning off lights
when they are not needed and using energy saving light bulbs it still continues to look for ways to
reduce the energy usage and total costs. Their current school electricity bill is roughly $175,000 a year.
With their proactive approach to reduce electricity consumption this bill should follow their recent trend
in reducing the cost of their bill.
Worcester Academy is also part of a pact that vows they will not increase their energy
consumption at any time. This means if they look to expand the school they need to find ways to offset
any potential energy production. One of the best ways to create an excess in energy would be to create
a wind turbine. The wind turbine would create energy in an environmentally safe way while also giving
Worcester Academy the ability to expand their school.
2.8 Site Information
The planned site of the wind turbine is located to the south of Worcester Academy’s main
campus. This site is approximately six acres in area and is a Brownfield site that has been cleaned with
the hopes of expanding the campus. The fact that this site was once contaminated creates a unique
scenario that may cause issues with permitting through the city of Worcester. Since the site is only going
to be used for the wind turbine and no regular traffic will be passing through the issues will be less,
however it will be a topic that is discussed by the permitting committees. On the same lot of land as the
proposed site is another six acres of land that is not owned by Worcester Academy. On this part of the
site there is a building that is partially occupied and currently under construction.
37(Worcester Academy: Strategy)
8/3/2019 Worcester Academy Wind Turbine IQP Report FINAL
http://slidepdf.com/reader/full/worcester-academy-wind-turbine-iqp-report-final 32/78
32
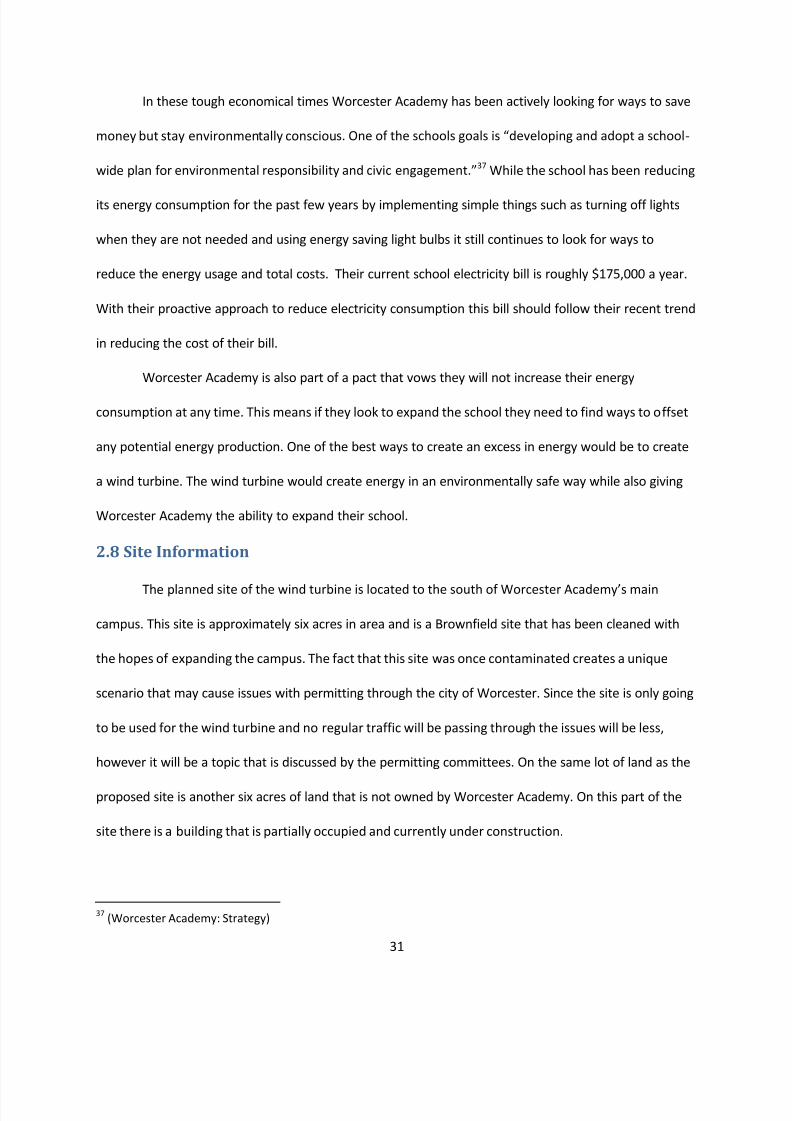
The site is surrounded by Winthrop St. to the south, Providence St. to the west, and Shannon St.
to the east. Other than the before mentioned building on the site there is a parking lot owned by
Worcester Academy on the north side of the site. Although no official plans are in place, Worcester
Academy does plan on buying the remaining land on the site eventually at which time the existing
building will be removed. Based on topography maps that we have gathered the site is fairly level with
the height of the area just below the parking lot being the tallest point as approximately ten meters
taller than the area bordering Winthrop Street, the lowest part of the site.
2.9 Worcester Academy Energy Usage
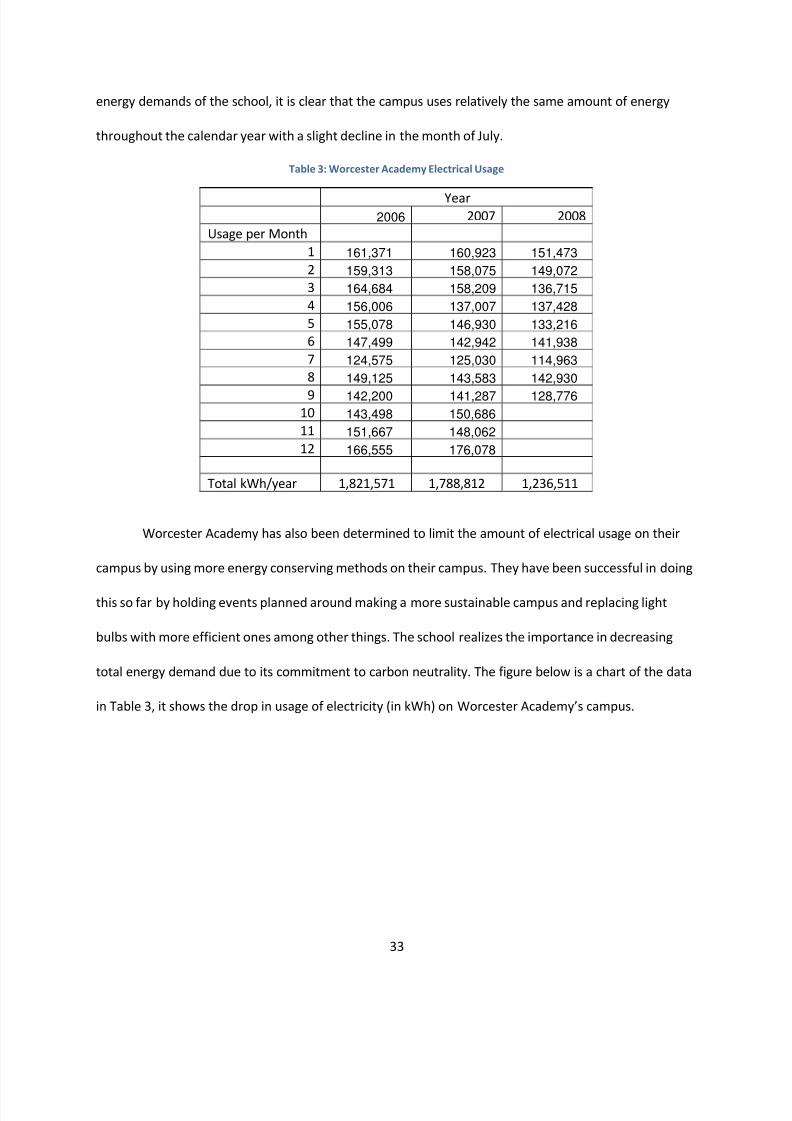
Worcester Academy has high energy demands based on the usages of their buildings. Many
would assume that the school would have significantly higher energy demands during school months,
September through June, than in the summer months. However by looking at the table below of the
Figure 9: Site Layout - Shaded Area Shows 6 acre Site Currently Owned by Worcester Academy
8/3/2019 Worcester Academy Wind Turbine IQP Report FINAL
http://slidepdf.com/reader/full/worcester-academy-wind-turbine-iqp-report-final 33/78
33
energy demands of the school, it is clear that the campus uses relatively the same amount of energy
throughout the calendar year with a slight decline in the month of July.
Table 3: Worcester Academy Electrical Usage
Year2006 2007 2008
Usage per Month
1 161,371 160,923 151,473
2 159,313 158,075 149,072
3 164,684 158,209 136,715
4 156,006 137,007 137,428
5 155,078 146,930 133,216
6 147,499 142,942 141,938
7 124,575 125,030 114,963
8 149,125 143,583 142,930
9 142,200 141,287 128,77610 143,498 150,686
11 151,667 148,062
12 166,555 176,078
Total kWh/year 1,821,571 1,788,812 1,236,511
Worcester Academy has also been determined to limit the amount of electrical usage on their
campus by using more energy conserving methods on their campus. They have been successful in doing
this so far by holding events planned around making a more sustainable campus and replacing light
bulbs with more efficient ones among other things. The school realizes the importance in decreasing
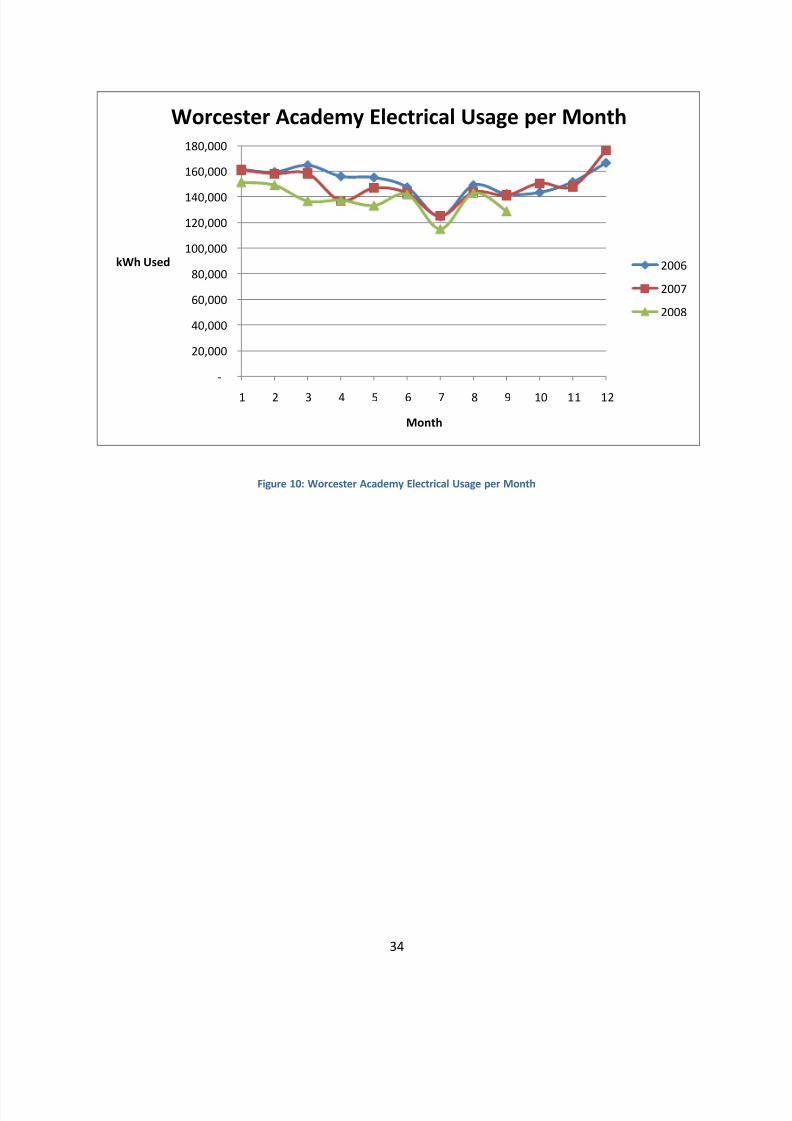
total energy demand due to its commitment to carbon neutrality. The figure below is a chart of the data
in Table 3, it shows the drop in usage of electricity (in kWh) on Worcester Academy’s campus.
8/3/2019 Worcester Academy Wind Turbine IQP Report FINAL
http://slidepdf.com/reader/full/worcester-academy-wind-turbine-iqp-report-final 34/78
34
Figure 10: Worcester Academy Electrical Usage per Month
-
20,000
40,000
60,000
80,000
100,000
120,000
140,000
160,000
180,000
1 2 3 4 5 6 7 8 9 10 11 12
kWh Used
Month
Worcester Academy Electrical Usage per Month
2006
2007
2008
8/3/2019 Worcester Academy Wind Turbine IQP Report FINAL
http://slidepdf.com/reader/full/worcester-academy-wind-turbine-iqp-report-final 35/78
35
3. Methodology
Wind turbines are complicated systems with many factors. Regulatory, financial, and social
factors all equally effect the construction of a wind turbine. In the case of Worcester Academy these
three factors must all be carefully looked at to come up with the proper wind turbine recommendation
that will not only help financially, but will also be within the social and regulatory limits that are set. The
major tasks in our methodology include the following:
Research
Wind Turbine Simulation and Selection
Energy Demand Characterization
Financial Feasibility
Regulatory Factors Impact
Write-up recommendation
3.1 Research
To ensure Worcester Academy will get the proper recommendation started the process by
researching windmills and all the laws and regulations that might affect the building process. The
research started using books and journals on the basics of wind turbines as well as the effects and use of
wind power in today’s society. During this research period we also looked at previous projects in the
state of Massachusetts and the process those wind turbines had to go through to be successful. One
project that we will follow more closely than others will be a previously completed IQP at Holy Name
High School. This project closely followed the steps that we will have to take as each had a similar goal in
mind in their beginnings. One MQP that we used for our research is a project on the study of wind
energy possibilities in New Hampshire. This project gave us a strong base on what needed to be
researched to thoroughly understand the effects of wind and gave us some important sources that we
8/3/2019 Worcester Academy Wind Turbine IQP Report FINAL
http://slidepdf.com/reader/full/worcester-academy-wind-turbine-iqp-report-final 36/78
36
can use to further expand our knowledge of wind power. Another benefit we found with this project is
there was a good amount of simulation software used throughout which we used to try and get our own
simulations started.
Outside of completed WPI projects we also researched a considerable amount on two separate
renewable energy organizations. The first organization is the American Wind Energy Association
(AWEA). The AWEA is a national organization that researches the capabilities of wind power by region
and sets guidelines that are based on previous projects and professional research. The second
organization we will research is the Massachusetts Technological Collaborative (MTC). This organization
is similar to the AWEA except that it operates on a state level rather than a national. Through the MTC
we have been able to acquire wind data charts and other local information of wind capabilities. We will
also be proposing to Worcester Academy to apply for grant that is offered from the MTC which we have
found through our research that could give them upwards of $400,000 in grants.
3.2 Wind Turbine Simulation and Selection
Once an idea of the general process for applying for loans and funding was understood, we
looked into the technical aspects behind a windmill. This started by looking at wind and topographical
maps of the Worcester area from the MTC. These maps gave us a general idea of the technical feasibility
behind a wind turbine in Worcester and in particular the Worcester Academy proposed site. These maps
gave us a rough estimate of the wind power in the area but to be more precise an anemometer must be
put into place. Since it was not financially practical for us to install an anemometer, nor did we have the
time before our projects end to complete the research we attempted to simulate the effects of wind at
the proposed project site using a wind simulation program called Wind Farm. Wind Farm enables you to
analyze, design and optimize a proposed wind farm.
However, in trying to get Wind Farm to work correctly for our project we ran into many issues.
One issue that we could not overcome was that we could not get a file format that Wind Farm would
8/3/2019 Worcester Academy Wind Turbine IQP Report FINAL
http://slidepdf.com/reader/full/worcester-academy-wind-turbine-iqp-report-final 37/78
37
accept and analyze our site from. This proved to slow our process of estimating the projected power
from a selected wind turbine and be able to fully develop a wind rose to display the wind data
graphically.
We planned on using this collected data to show the projected outputs of certain size wind
turbines at the project site to calculate the amount of energy that can be created. Depending on what
we found for possible energy outputs and comparing it to the energy usage distribution information we
have for Worcester Academy would have allowed for a stronger argument to the selection of a specific
turbine. Using formulas generated for wind power and wind turbine capabilities we were able to come
up with another way to analyze turbine outputs without the program.
3.2.1 Wind Rose
The wind rose that was developed for this site was put together with the collected data from a
wind anemometer that was at the Holy Name High School. This gave us numbers that we could work
with in order to develop the working wind rose we now have. On the wind rose there is every direction
that would be on a compass: north, north-northeast, northeast, east-northeast, east, east-southeast,
southeast, south-southeast, south, south-southwest, southwest, west-southwest, west, west-northwest,
northwest, north-northwest. The minimum time (frequency) and wind energy percentages, for the given
data to matter are 2%. The wind rose shows the percent of the wind energy along with the percent of
time the wind was in one of the previous given directions. This then sets up the normal flow of the wind
on average.
3.2.2 Wind Data Charts
The wind charts were developed using the data that was collected from the wind turbine that
was put up at Holy Name High School. This data was taken over the course of a given year. There were
ten samples per day, for everyday out of the year. These samples per day were then averaged in order
8/3/2019 Worcester Academy Wind Turbine IQP Report FINAL
http://slidepdf.com/reader/full/worcester-academy-wind-turbine-iqp-report-final 38/78
38
to get an average wind speed per given day. This was then developed into the first chart. Then the data
was averaged again in order to achieve an average wind speed per month. This was then put into a
second chart.
3.3 Financial Feasibility
With the proposed turbine simulation completed we then needed to check the financial
feasibility of the project. We looked into the different grants and loans that could be used to build a
wind turbine, most of which will be coming from MTC. Based on the successful acquirement for a Large
Onsite Renewable Grant (LORI Grant) through the MTC, we proposed how much Worcester Academy
will receive and the potential amount of money they will have to put into the project themselves.
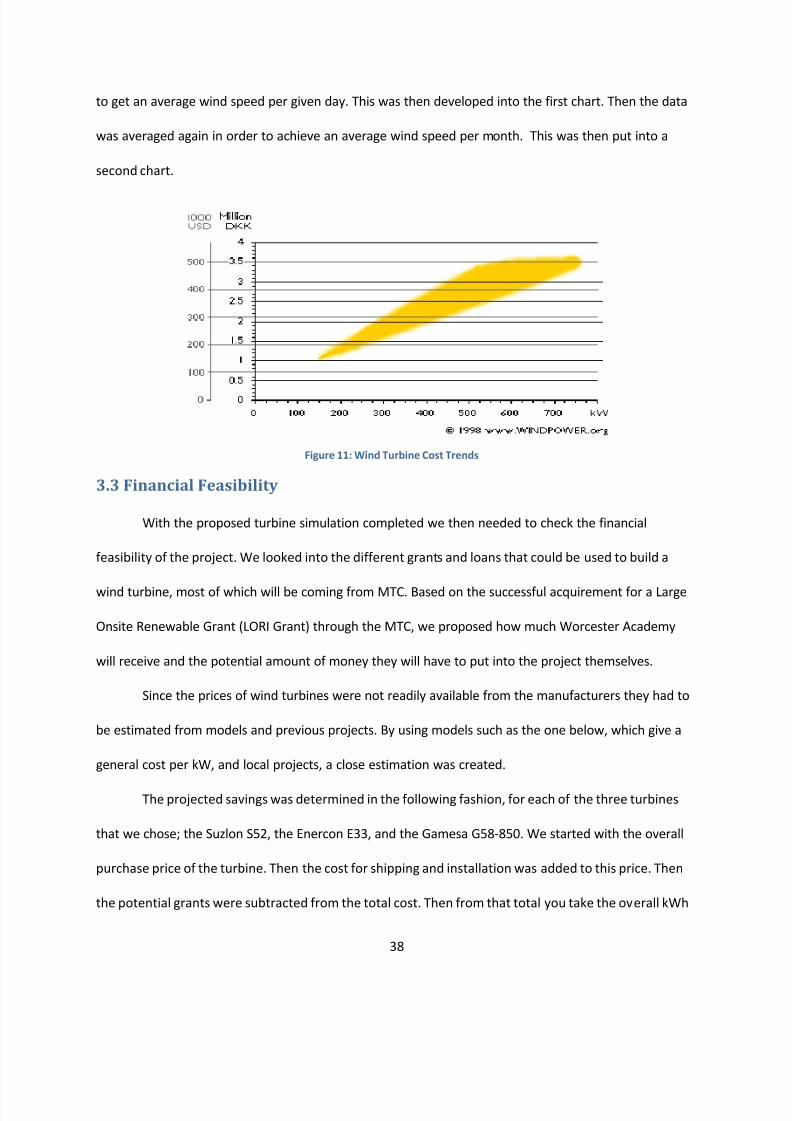
Since the prices of wind turbines were not readily available from the manufacturers they had to
be estimated from models and previous projects. By using models such as the one below, which give a
general cost per kW, and local projects, a close estimation was created.
The projected savings was determined in the following fashion, for each of the three turbines
that we chose; the Suzlon S52, the Enercon E33, and the Gamesa G58-850. We started with the overall
purchase price of the turbine. Then the cost for shipping and installation was added to this price. Then
the potential grants were subtracted from the total cost. Then from that total you take the overall kWh
Figure 11: Wind Turbine Cost Trends
8/3/2019 Worcester Academy Wind Turbine IQP Report FINAL
http://slidepdf.com/reader/full/worcester-academy-wind-turbine-iqp-report-final 39/78
39
per year of each of the given turbines and you multiply it by the cents per kWh that you receive from
rebates. This number is then multiplied by twenty, because it is a prediction over twenty years, and
subtracted from the total cost after potential grants. Then you factor in the loan payment for the rest of
the turbine, along with the interest that is accrued over the twenty year prediction span. This loan
payment and interest payment are then added to the total. This then gives the overall savings, or deficit
that you would receive over a twenty year span.
3.4 Regulatory Factors
With the completed simulation and financial feasibility checked, the biggest factor behind the
successful proposal of a wind turbine is the passing of local and state regulations. We had to look into
the zoning laws in Worcester and the special zoning laws that go into building a wind turbine. With
those special zoning laws in account we have to look at the given area and find the exact location on the
projected site and make sure it is acceptable.
Research into the regulatory laws of the city of Worcester showed that there are currently no
laws in place that are related specifically to a wind turbine. This will make the guarantee of a proposed
project uncertain. The proposal of the erection of a turbine will be sent to the planning board for the
city first and if it passes as an acceptable project then it will go to the zoning board and regulatory
commissions for the city.
It is expected that the wind turbine will have to meet the current laws set by the city of
Worcester, if not exceed them. These laws that it will have to pass include noise disturbances, height
requirements, and others.
3.5 Write-up Recommendation
The final aspect of the project is writing the project write-up. This was completed after all
research, simulations, and proposals have been completed. In the write-up we include an abstract which
8/3/2019 Worcester Academy Wind Turbine IQP Report FINAL
http://slidepdf.com/reader/full/worcester-academy-wind-turbine-iqp-report-final 40/78
40
will act a short introduction of our project that will outline our goals and a brief description of the steps
it took us to reach them. The next section is an executive summary which will be a short summary of our
results. This is followed by background information pertaining to our project. Topics covered in this
section include wind power and turbine history, information of how turbines work, the funding that has
become available for renewable energy projects, and information of Worcester Academy itself. The first
part of our data section covered any laws and regulations that will need to be abided for the successful
erection of the wind turbine. We then have a section of data results from our wind simulation that will
give us the expected annual output of the turbine. This section will then go on to discuss the financial
needs the project will require from Worcester Academy and projected profits that they can expect. The
next section is a summary of the project’s achievements and conclusions. To finish out our write-up is a
list of sources for our research and an appendix of table and figures to better supplement our proposal
of the best case for the erection of a wind turbine on the Worcester Academy’s campus.
8/3/2019 Worcester Academy Wind Turbine IQP Report FINAL
http://slidepdf.com/reader/full/worcester-academy-wind-turbine-iqp-report-final 41/78
41
4. Results
The results of this project are intended to provide a breakdown on the feasibility of installing a
wind turbine available at the site at Worcester Academy by considering the location, the laws &
regulations, and the costs and financial benefits of a wind turbine. First, the appropriateness and
location of the site is discussed outlining the rules and regulations as well as environmental impact of
installing a wind turbine. Next, three different turbine models are reviewed and evaluated, each with
varying outputs and costs. Also in this section the available wind data for the site are estimated and
analyzed so that the wind output at specific heights is clear. Finally, the financial potions are reviewed
and evaluated. These results are used to provide recommendations for the next steps to install a wind
turbine.
4.1 Site Assessment
When analyzing the site for appropriateness for the installation of a wind turbine many factors
play into the final decision. The current state and use of the site is important as a number of issues could
arise from the existing conditions. Since there are currently no buildings where the proposed location of
the wind turbine will be located, the amount of work that needs to be done will not be expensive as
other locations requiring further site preparation would be more costly.
Also since the site has not been constructed there should be no major utility lines through the
proposed project site. The only building on the same location is not owned by Worcester Academy but it
may have public utilities such as sewer or electricity that run under the site of construction. To
determine if utilities will have to be avoided or moved maps from the city of Worcester outlining public
utilities will have obtained. Also before construction takes place a service such as Dig Safe will have to be
contacted to make sure that no utilities are going to be struck during excavation. Other areas with the
8/3/2019 Worcester Academy Wind Turbine IQP Report FINAL
http://slidepdf.com/reader/full/worcester-academy-wind-turbine-iqp-report-final 42/78
42
site that still need to be addressed is its location in respect to neighboring properties and Worcester
Airport as well as the environmental impact of building on the site.
4.1.1 Governing Laws and Regulations
As often happens with new technologies, the laws or regulations on the state or local level do
not fully clarify the requirements that pertain specifically to wind turbines. Since, at the moment, there
are not any laws in place, all interpretation to the functionality of a wind turbine, is highly dependent on
the planning board and zoning board of the city of Worcester. After allowing a wind turbine to be
installed at Holy Name, the city made a point that all similar cases would be heard on an individual basis.
For a proposed wind turbine to be approved it still must fall within certain regulations and suggestions
set up by the AWEA and MTC.
One of the most common issues with proposed wind turbines is the height of the turbine. Since
the height of an average 600 kW turbine from its base to the top of the tallest point reached by a blade
is 250 feet, it will need special approval from the city for its erection.38 Also, with the Worcester
Regional Airport nearby height restrictions will also have to pass FAA regulations. Since the proposed
site is similar to the site used at Holy Name High School we expect no issues in regards to the height of
the turbine as the one constructed there is 262 feet tall and passed all city boards.
Another issue that needs to be followed closely is the noise generated by the wind turbine.
Although current turbines emit noises much quieter than older turbines, they are still not completely
quiet. The generators that power them as well as noises caused by blades in the wind can prove to be
very noisy if not installed or accounted for properly. It is recommended by the AWEA to keep turbines
approximately two times the distance of their total height from neighboring properties. Since the
proposed site is surrounded by private property not owned by Worcester Academy the location of the
38(Resources, 2009)
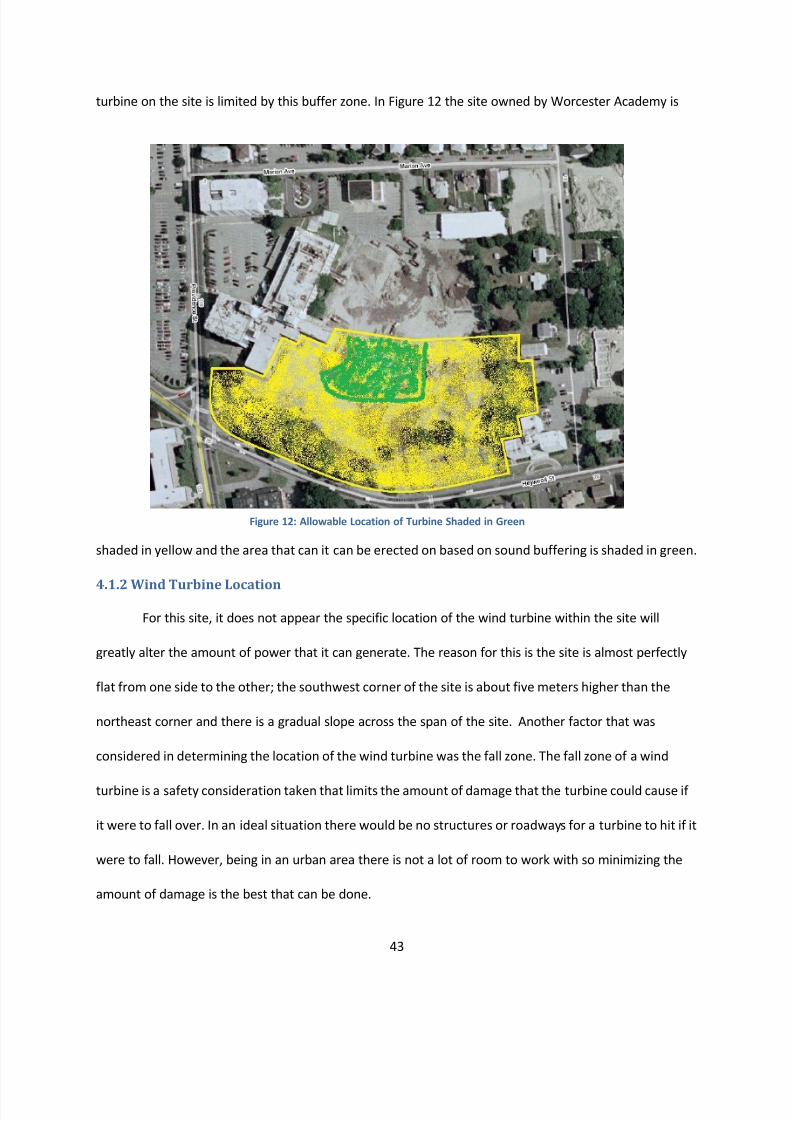
8/3/2019 Worcester Academy Wind Turbine IQP Report FINAL
http://slidepdf.com/reader/full/worcester-academy-wind-turbine-iqp-report-final 43/78
43
turbine on the site is limited by this buffer zone. In Figure 12 the site owned by Worcester Academy is
shaded in yellow and the area that can it can be erected on based on sound buffering is shaded in green.
4.1.2 Wind Turbine Location
For this site, it does not appear the specific location of the wind turbine within the site will
greatly alter the amount of power that it can generate. The reason for this is the site is almost perfectly
flat from one side to the other; the southwest corner of the site is about five meters higher than the
northeast corner and there is a gradual slope across the span of the site. Another factor that was
considered in determining the location of the wind turbine was the fall zone. The fall zone of a wind
turbine is a safety consideration taken that limits the amount of damage that the turbine could cause if
it were to fall over. In an ideal situation there would be no structures or roadways for a turbine to hit if it
were to fall. However, being in an urban area there is not a lot of room to work with so minimizing the
amount of damage is the best that can be done.
Figure 12: Allowable Location of Turbine Shaded in Green
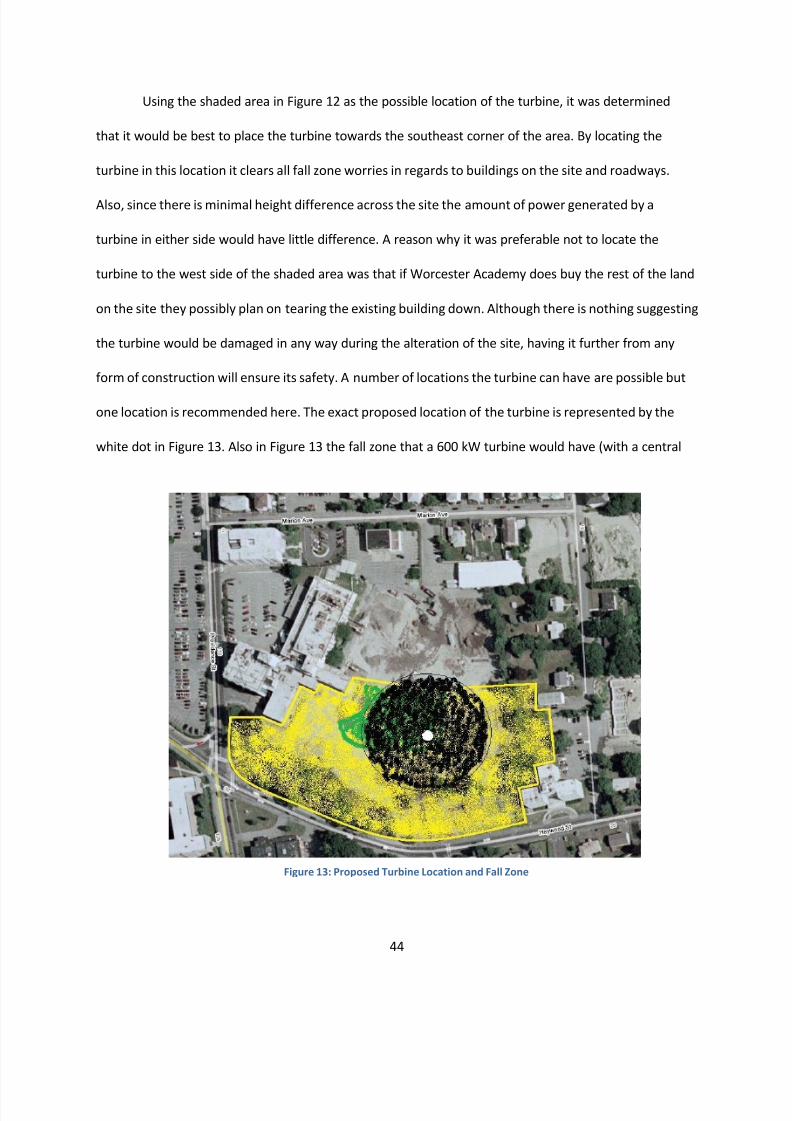
8/3/2019 Worcester Academy Wind Turbine IQP Report FINAL
http://slidepdf.com/reader/full/worcester-academy-wind-turbine-iqp-report-final 44/78
44
Using the shaded area in Figure 12 as the possible location of the turbine, it was determined
that it would be best to place the turbine towards the southeast corner of the area. By locating the
turbine in this location it clears all fall zone worries in regards to buildings on the site and roadways.
Also, since there is minimal height difference across the site the amount of power generated by a
turbine in either side would have little difference. A reason why it was preferable not to locate the
turbine to the west side of the shaded area was that if Worcester Academy does buy the rest of the land
on the site they possibly plan on tearing the existing building down. Although there is nothing suggesting
the turbine would be damaged in any way during the alteration of the site, having it further from any
form of construction will ensure its safety. A number of locations the turbine can have are possible but
one location is recommended here. The exact proposed location of the turbine is represented by the
white dot in Figure 13. Also in Figure 13 the fall zone that a 600 kW turbine would have (with a central
Figure 13: Proposed Turbine Location and Fall Zone
8/3/2019 Worcester Academy Wind Turbine IQP Report FINAL
http://slidepdf.com/reader/full/worcester-academy-wind-turbine-iqp-report-final 45/78
45
location) is denoted by the black shading. This area has a radius of approximately 250 feet.
4.1.3 Environmental Impact
It is unlikely that installation of a wind turbine on the site will have a very large impact on the
environment around it. Being an urban location and a site close to major roadways there is most likely
little wildlife that will be affected by erecting a turbine on the site. One concern with a wind turbine is
birds. Many people believe that the flight paths of birds will be greatly altered by a wind turbine.
However others feel that the turbines take up just as much area in the sky as high rise buildings and
skyscrapers. Issues with birds tend to arise when wind farms of multiple turbines are being installed as
they can take up miles of land. An example of this is the Altamont Pass in northern California that
consists of over 4900 wind turbines. 39 It is expected that since the site is similar to the site used for the
wind turbine installed at Holy Name that there will be no issues with endangering wildlife.
Another issue than wildlife that will be considered is the effects on water runoff from the site.
This is investigated by the EOEA, Executive Office of Environmental Affairs, under the National Pollution
Discharge Elimination System. Since the site under investigation was a contaminated site there is still a
possibility of contamination in the soil even if it is not noticeable at the surface. Since the turbine will be
placed on footings that will be on foundations, the ground in the area will be altered to make the
turbine stable. The footings will most likely be a concrete footing as in other turbine construction and
will alter water runoff. Since the foundations and footings for a wind turbine are not as large as those
for a building there should not be an issue, nevertheless a drainage plan should be put together to show
how the draining of water from the site will happen to make sure it will not be overburdening other
areas causing local flood scenarios.
39(Altamont Pass, California, 2008)
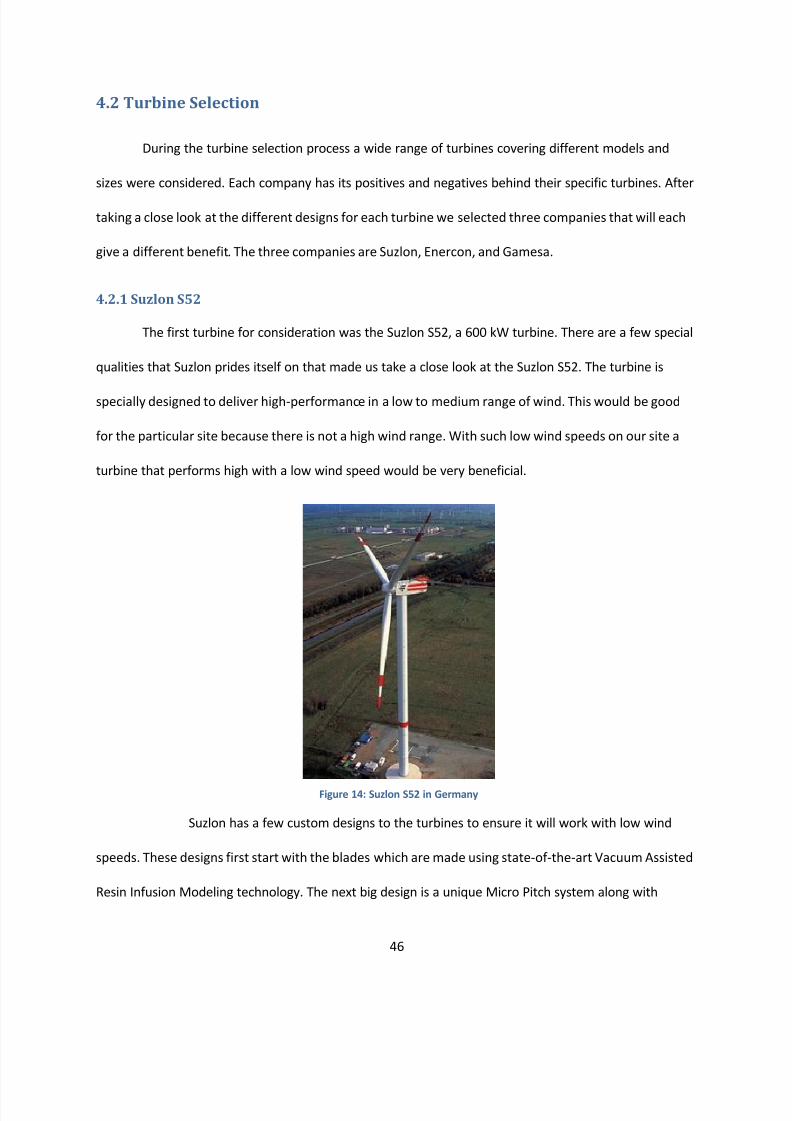
8/3/2019 Worcester Academy Wind Turbine IQP Report FINAL
http://slidepdf.com/reader/full/worcester-academy-wind-turbine-iqp-report-final 46/78
46
4.2 Turbine Selection
During the turbine selection process a wide range of turbines covering different models and
sizes were considered. Each company has its positives and negatives behind their specific turbines. After
taking a close look at the different designs for each turbine we selected three companies that will each
give a different benefit. The three companies are Suzlon, Enercon, and Gamesa.
4.2.1 Suzlon S52
The first turbine for consideration was the Suzlon S52, a 600 kW turbine. There are a few special
qualities that Suzlon prides itself on that made us take a close look at the Suzlon S52. The turbine is
specially designed to deliver high-performance in a low to medium range of wind. This would be good
for the particular site because there is not a high wind range. With such low wind speeds on our site a
turbine that performs high with a low wind speed would be very beneficial.
Suzlon has a few custom designs to the turbines to ensure it will work with low wind
speeds. These designs first start with the blades which are made using state-of-the-art Vacuum Assisted
Resin Infusion Modeling technology. The next big design is a unique Micro Pitch system along with
Figure 14: Suzlon S52 in Germany
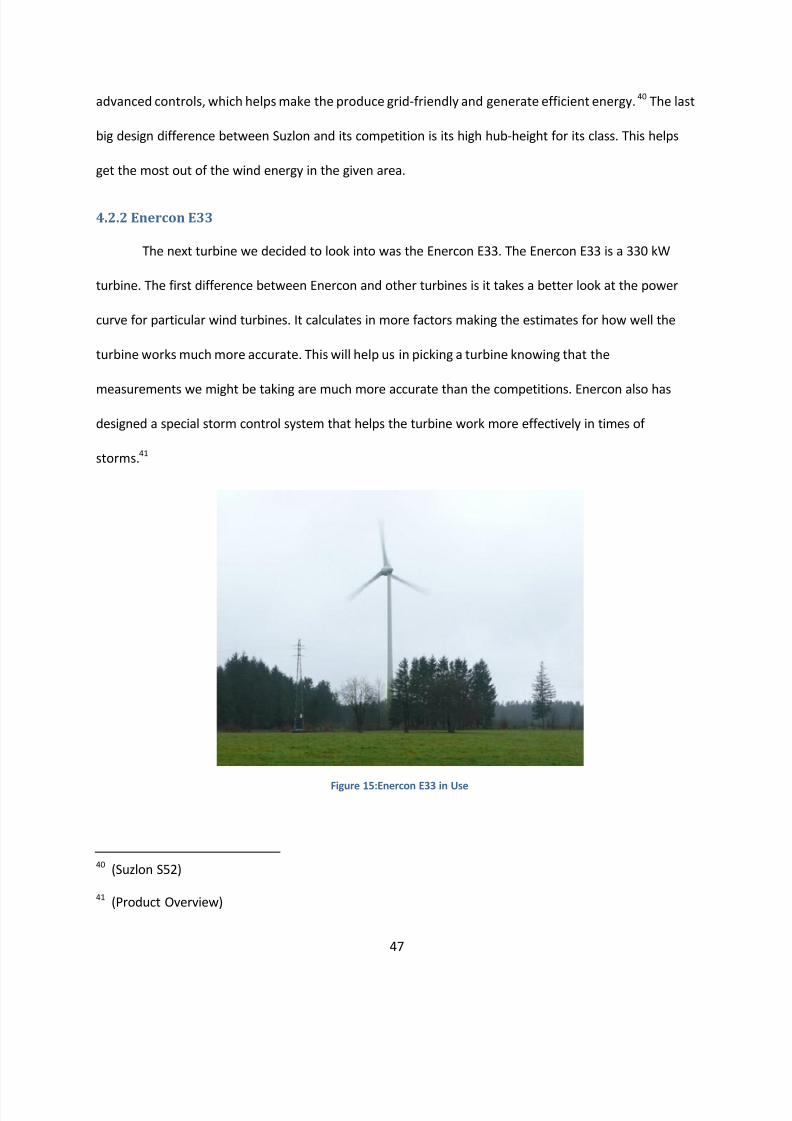
8/3/2019 Worcester Academy Wind Turbine IQP Report FINAL
http://slidepdf.com/reader/full/worcester-academy-wind-turbine-iqp-report-final 47/78
47
advanced controls, which helps make the produce grid-friendly and generate efficient energy. 40 The last
big design difference between Suzlon and its competition is its high hub-height for its class. This helps
get the most out of the wind energy in the given area.
4.2.2 Enercon E33
The next turbine we decided to look into was the Enercon E33. The Enercon E33 is a 330 kW
turbine. The first difference between Enercon and other turbines is it takes a better look at the power
curve for particular wind turbines. It calculates in more factors making the estimates for how well the
turbine works much more accurate. This will help us in picking a turbine knowing that the
measurements we might be taking are much more accurate than the competitions. Enercon also has
designed a special storm control system that helps the turbine work more effectively in times of
storms.41
40 (Suzlon S52)
41 (Product Overview)
Figure 15:Enercon E33 in Use
8/3/2019 Worcester Academy Wind Turbine IQP Report FINAL
http://slidepdf.com/reader/full/worcester-academy-wind-turbine-iqp-report-final 48/78
48
The storm control system helps the turbine become more effective in gusty wind conditions. A
normal turbine will shut down when the maximum wind speed is exceeded and won’t turn back on for a
considerable amount of time if the storm keeps going. With the storm control system the wind turbine
does not shut down automatically but instead it reduces the power output by lowering the rotational
speed. They do this by turning the rotor blades slightly out of the wind. Once the gusty wind stops the
turbine is put back instantly into full power. This feature helps the turbine produce energy during some
of the best times to be collecting energy.
4.2.3 Gamesa G58-850
The final turbine selected for consideration is the Gamesa G58-850. The Gamesa G58-850 is an
850 kW turbine. The features that set Gamesa turbines apart from the competition are its full lightning
protection. This means that if the turbine is struck by turbine the electrical components are protected
from damage. The Gamesa G58-850 also has a SMP predictive maintenance system which helps detect
potential deterioration or malfunctions in the wind turbine. This is a very helpful feature because it will
help keep the turbine running in its best shape for as long as possible. With as much money going into a
wind turbine it is helpful to have a feature that will detect any problems earlier than most other
turbines. The final design feature that Gamesa has is its control system. The doubly fed machine it has
helps increase efficiency and production. It also helps prolong the working life of the turbine, low
harmonic content and minimal losses, and active and reactive power control. All of these things help
separate Gamesa turbines from the competition. 42
42 (G58-850)
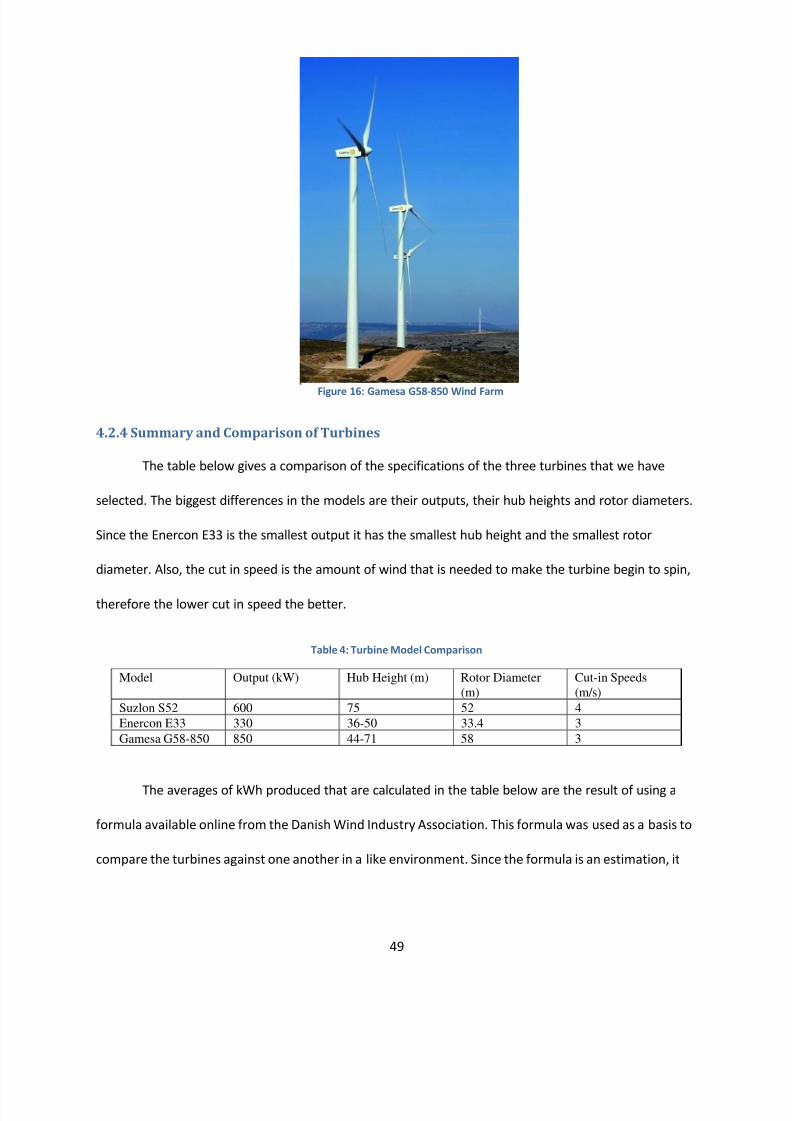
8/3/2019 Worcester Academy Wind Turbine IQP Report FINAL
http://slidepdf.com/reader/full/worcester-academy-wind-turbine-iqp-report-final 49/78
49
4.2.4 Summary and Comparison of Turbines
The table below gives a comparison of the specifications of the three turbines that we have
selected. The biggest differences in the models are their outputs, their hub heights and rotor diameters.
Since the Enercon E33 is the smallest output it has the smallest hub height and the smallest rotor
diameter. Also, the cut in speed is the amount of wind that is needed to make the turbine begin to spin,
therefore the lower cut in speed the better.
Table 4: Turbine Model Comparison
Model Output (kW) Hub Height (m) Rotor Diameter
(m)
Cut-in Speeds
(m/s)
Suzlon S52 600 75 52 4
Enercon E33 330 36-50 33.4 3
Gamesa G58-850 850 44-71 58 3
The averages of kWh produced that are calculated in the table below are the result of using a
formula available online from the Danish Wind Industry Association. This formula was used as a basis to
compare the turbines against one another in a like environment. Since the formula is an estimation, it
Figure 16: Gamesa G58-850 Wind Farm
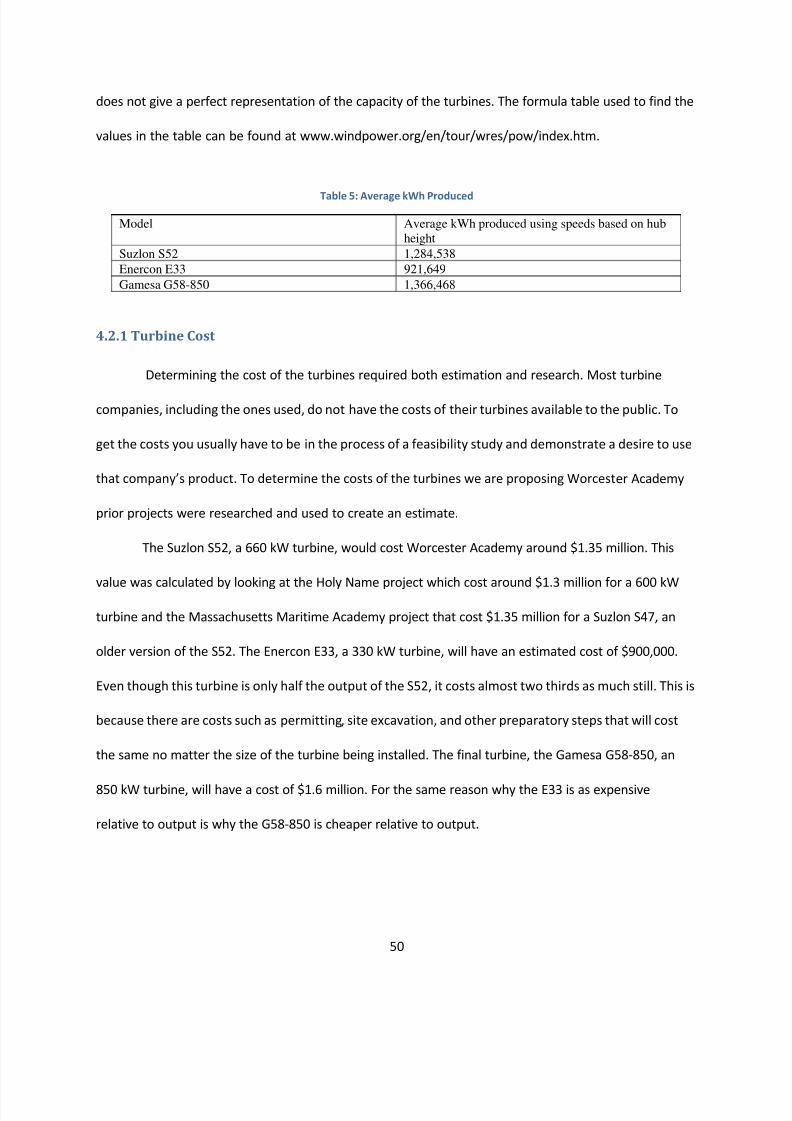
8/3/2019 Worcester Academy Wind Turbine IQP Report FINAL
http://slidepdf.com/reader/full/worcester-academy-wind-turbine-iqp-report-final 50/78
50
does not give a perfect representation of the capacity of the turbines. The formula table used to find the
values in the table can be found at www.windpower.org/en/tour/wres/pow/index.htm.
Table 5: Average kWh Produced
Model Average kWh produced using speeds based on hub
height
Suzlon S52 1,284,538
Enercon E33 921,649
Gamesa G58-850 1,366,468
4.2.1 Turbine Cost
Determining the cost of the turbines required both estimation and research. Most turbine
companies, including the ones used, do not have the costs of their turbines available to the public. To
get the costs you usually have to be in the process of a feasibility study and demonstrate a desire to use
that company’s product. To determine the costs of the turbines we are proposing Worcester Academy
prior projects were researched and used to create an estimate.
The Suzlon S52, a 660 kW turbine, would cost Worcester Academy around $1.35 million. This
value was calculated by looking at the Holy Name project which cost around $1.3 million for a 600 kW
turbine and the Massachusetts Maritime Academy project that cost $1.35 million for a Suzlon S47, an
older version of the S52. The Enercon E33, a 330 kW turbine, will have an estimated cost of $900,000.
Even though this turbine is only half the output of the S52, it costs almost two thirds as much still. This is
because there are costs such as permitting, site excavation, and other preparatory steps that will cost
the same no matter the size of the turbine being installed. The final turbine, the Gamesa G58-850, an
850 kW turbine, will have a cost of $1.6 million. For the same reason why the E33 is as expensive
relative to output is why the G58-850 is cheaper relative to output.
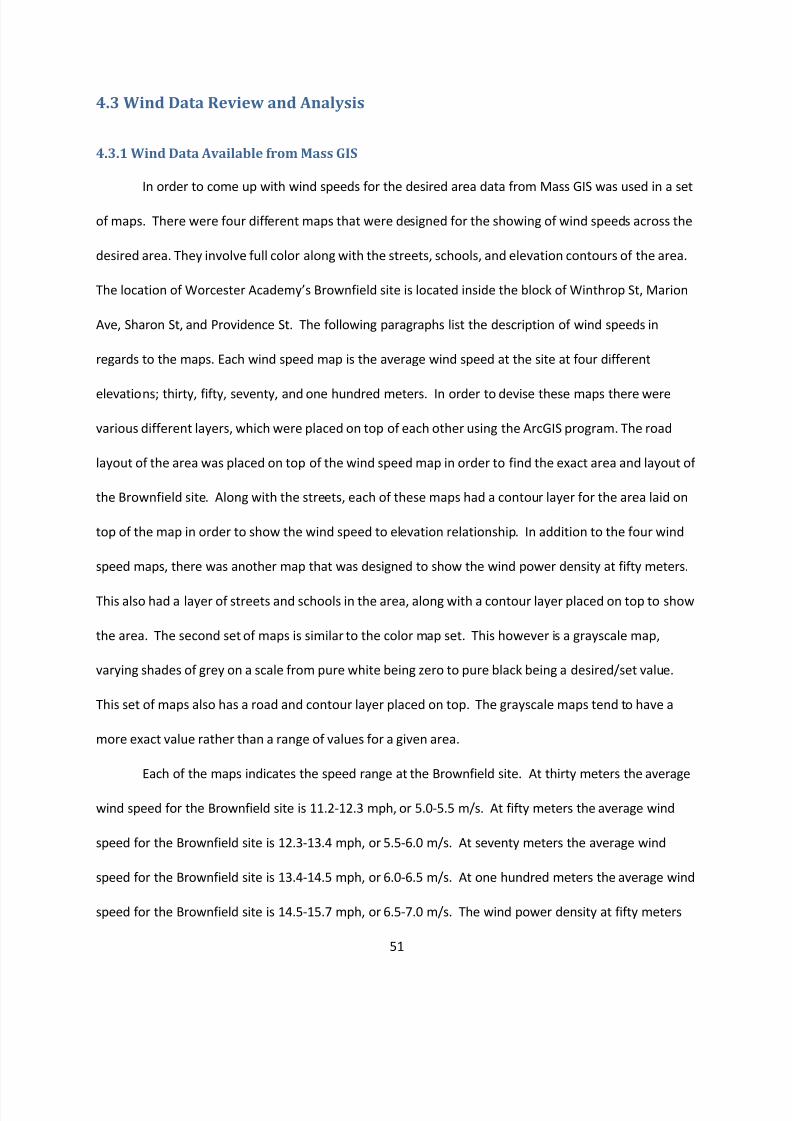
8/3/2019 Worcester Academy Wind Turbine IQP Report FINAL
http://slidepdf.com/reader/full/worcester-academy-wind-turbine-iqp-report-final 51/78
51
4.3 Wind Data Review and Analysis
4.3.1 Wind Data Available from Mass GIS
In order to come up with wind speeds for the desired area data from Mass GIS was used in a set
of maps. There were four different maps that were designed for the showing of wind speeds across the
desired area. They involve full color along with the streets, schools, and elevation contours of the area.
The location of Worcester Academy’s Brownfield site is located inside the block of Winthrop St, Marion
Ave, Sharon St, and Providence St. The following paragraphs list the description of wind speeds in
regards to the maps. Each wind speed map is the average wind speed at the site at four different
elevations; thirty, fifty, seventy, and one hundred meters. In order to devise these maps there were
various different layers, which were placed on top of each other using the ArcGIS program. The road
layout of the area was placed on top of the wind speed map in order to find the exact area and layout of
the Brownfield site. Along with the streets, each of these maps had a contour layer for the area laid on
top of the map in order to show the wind speed to elevation relationship. In addition to the four wind
speed maps, there was another map that was designed to show the wind power density at fifty meters.
This also had a layer of streets and schools in the area, along with a contour layer placed on top to show
the area. The second set of maps is similar to the color map set. This however is a grayscale map,
varying shades of grey on a scale from pure white being zero to pure black being a desired/set value.
This set of maps also has a road and contour layer placed on top. The grayscale maps tend to have a
more exact value rather than a range of values for a given area.
Each of the maps indicates the speed range at the Brownfield site. At thirty meters the average
wind speed for the Brownfield site is 11.2-12.3 mph, or 5.0-5.5 m/s. At fifty meters the average wind
speed for the Brownfield site is 12.3-13.4 mph, or 5.5-6.0 m/s. At seventy meters the average wind
speed for the Brownfield site is 13.4-14.5 mph, or 6.0-6.5 m/s. At one hundred meters the average wind
speed for the Brownfield site is 14.5-15.7 mph, or 6.5-7.0 m/s. The wind power density at fifty meters
8/3/2019 Worcester Academy Wind Turbine IQP Report FINAL
http://slidepdf.com/reader/full/worcester-academy-wind-turbine-iqp-report-final 52/78
52
for the Brownfield site is 300-400 watts/square meters. When looking at the grayscale maps, they have
an exact value for a block rather than a generalized range that the values fall in. 43
The grey scale maps (shown in the appendix) offered a more exact number for the wind speeds,
rather than an average wind speed over the area. At thirty meters (Figure 19), above the ground the
average wind speed for the Brownfield site is 12.341 mph, or 5.52 m/s. At fifty meters (Figure 20),
above the ground the average wind speed for the Brownfield site is 12.81 mph, or 5.73 m/s. At seventy
meters (Figure 18), above the ground the average wind speed for the Brownfield site is 14.42 mph, or
6.45 m/s. Finally, at one hundred meters (Figure 17), above the ground the average wind speed for the
Brownfield site is 15.292 mph, or 6.84 m/s. Averaging these together, for any given height the average
wind speed is 13.716 mph, or 6.135 m/s. 44
43(Holy Name Central Catholic Jr/Sr High School, 2007)
44(Holy Name Central Catholic Jr/Sr High School, 2007)
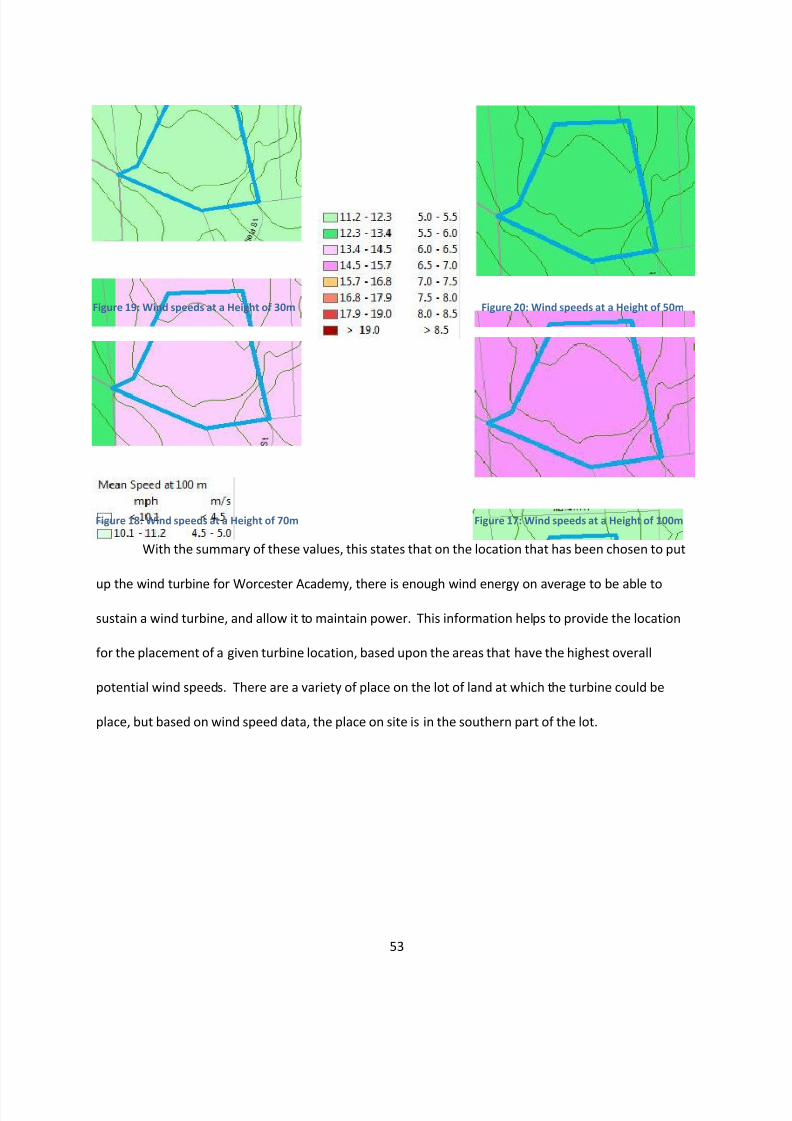
8/3/2019 Worcester Academy Wind Turbine IQP Report FINAL
http://slidepdf.com/reader/full/worcester-academy-wind-turbine-iqp-report-final 53/78
53
With the summary of these values, this states that on the location that has been chosen to put
up the wind turbine for Worcester Academy, there is enough wind energy on average to be able to
sustain a wind turbine, and allow it to maintain power. This information helps to provide the location
for the placement of a given turbine location, based upon the areas that have the highest overall
potential wind speeds. There are a variety of place on the lot of land at which the turbine could be
place, but based on wind speed data, the place on site is in the southern part of the lot.
Figure 19: Wind speeds at a Height of 30m Figure 20: Wind speeds at a Height of 50m
Figure 18: Wind speeds at a Height of 70m Figure 17: Wind speeds at a Height of 100m
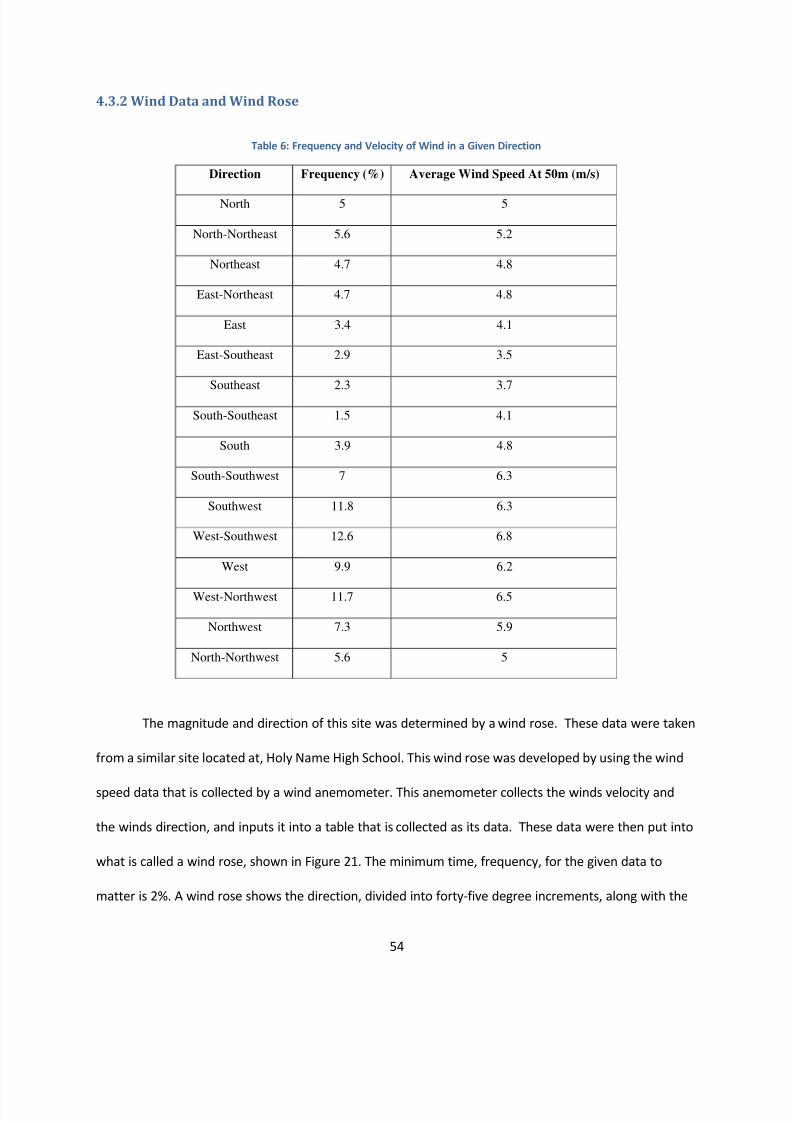
8/3/2019 Worcester Academy Wind Turbine IQP Report FINAL
http://slidepdf.com/reader/full/worcester-academy-wind-turbine-iqp-report-final 54/78
54
4.3.2 Wind Data and Wind Rose
Table 6: Frequency and Velocity of Wind in a Given Direction
Direction Frequency (%) Average Wind Speed At 50m (m/s)
North 5 5
North-Northeast 5.6 5.2
Northeast 4.7 4.8
East-Northeast 4.7 4.8
East 3.4 4.1
East-Southeast 2.9 3.5
Southeast 2.3 3.7
South-Southeast 1.5 4.1
South 3.9 4.8
South-Southwest 7 6.3
Southwest 11.8 6.3
West-Southwest 12.6 6.8
West 9.9 6.2
West-Northwest 11.7 6.5
Northwest 7.3 5.9
North-Northwest 5.6 5
The magnitude and direction of this site was determined by a wind rose. These data were taken
from a similar site located at, Holy Name High School. This wind rose was developed by using the wind
speed data that is collected by a wind anemometer. This anemometer collects the winds velocity and
the winds direction, and inputs it into a table that is collected as its data. These data were then put into
what is called a wind rose, shown in Figure 21. The minimum time, frequency, for the given data to
matter is 2%. A wind rose shows the direction, divided into forty-five degree increments, along with the
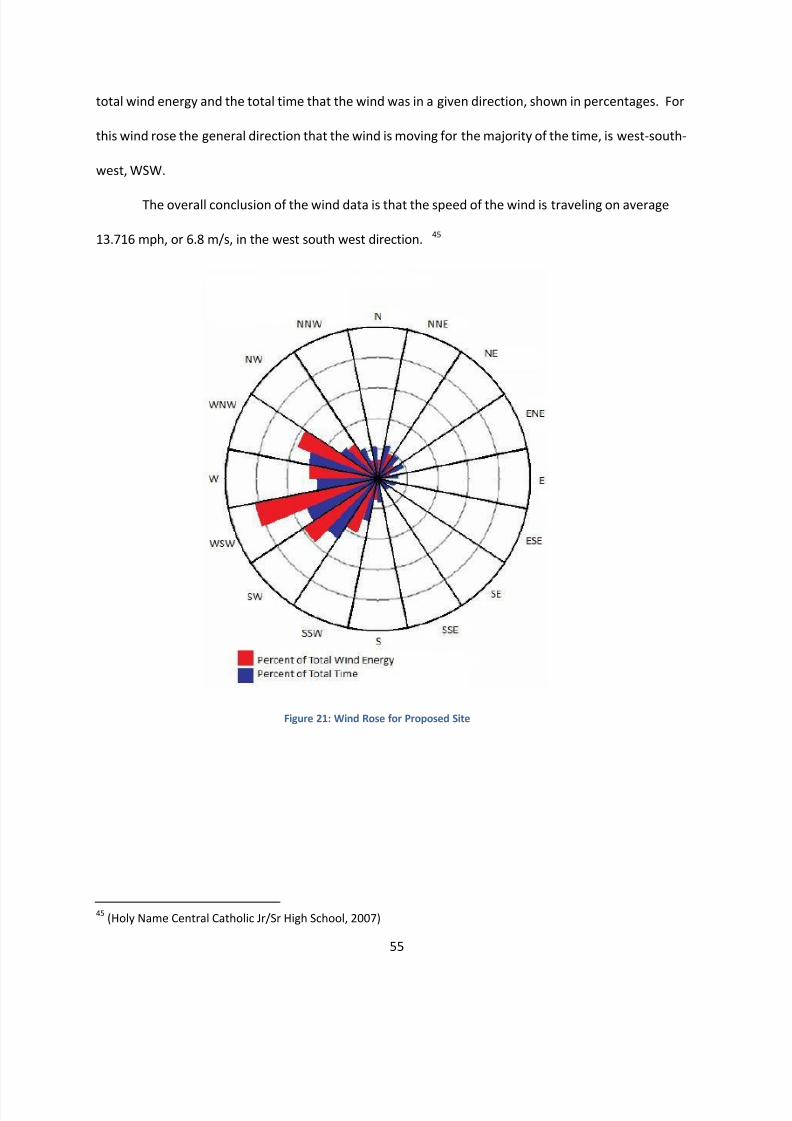
8/3/2019 Worcester Academy Wind Turbine IQP Report FINAL
http://slidepdf.com/reader/full/worcester-academy-wind-turbine-iqp-report-final 55/78
55
total wind energy and the total time that the wind was in a given direction, shown in percentages. For
this wind rose the general direction that the wind is moving for the majority of the time, is west-south-
west, WSW.
The overall conclusion of the wind data is that the speed of the wind is traveling on average
13.716 mph, or 6.8 m/s, in the west south west direction. 45
45(Holy Name Central Catholic Jr/Sr High School, 2007)
Figure 21: Wind Rose for Proposed Site
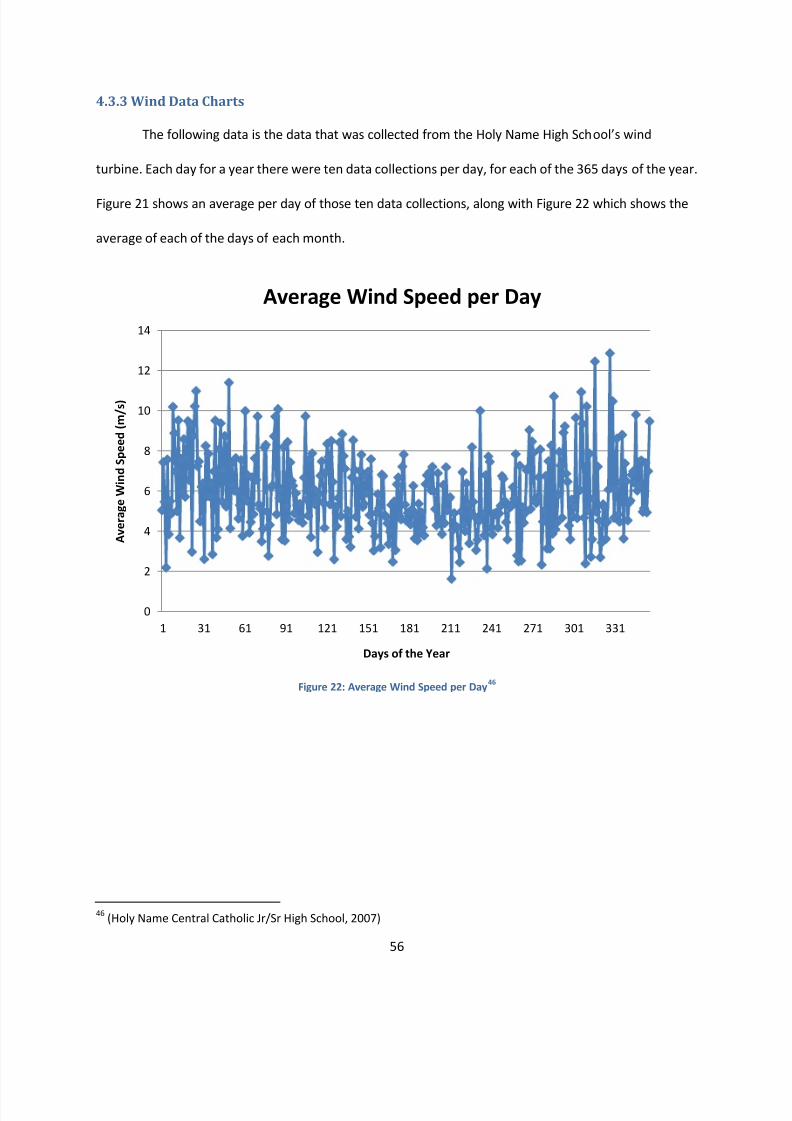
8/3/2019 Worcester Academy Wind Turbine IQP Report FINAL
http://slidepdf.com/reader/full/worcester-academy-wind-turbine-iqp-report-final 56/78
56
4.3.3 Wind Data Charts
The following data is the data that was collected from the Holy Name High School’s wind
turbine. Each day for a year there were ten data collections per day, for each of the 365 days of the year.
Figure 21 shows an average per day of those ten data collections, along with Figure 22 which shows the
average of each of the days of each month.
Figure 22: Average Wind Speed per Day46
46(Holy Name Central Catholic Jr/Sr High School, 2007)
0
2
4
6
8
10
12
14
1 31 61 91 121 151 181 211 241 271 301 331
A v e r a g e W i n d S p e e d ( m / s )
Days of the Year
Average Wind Speed per Day
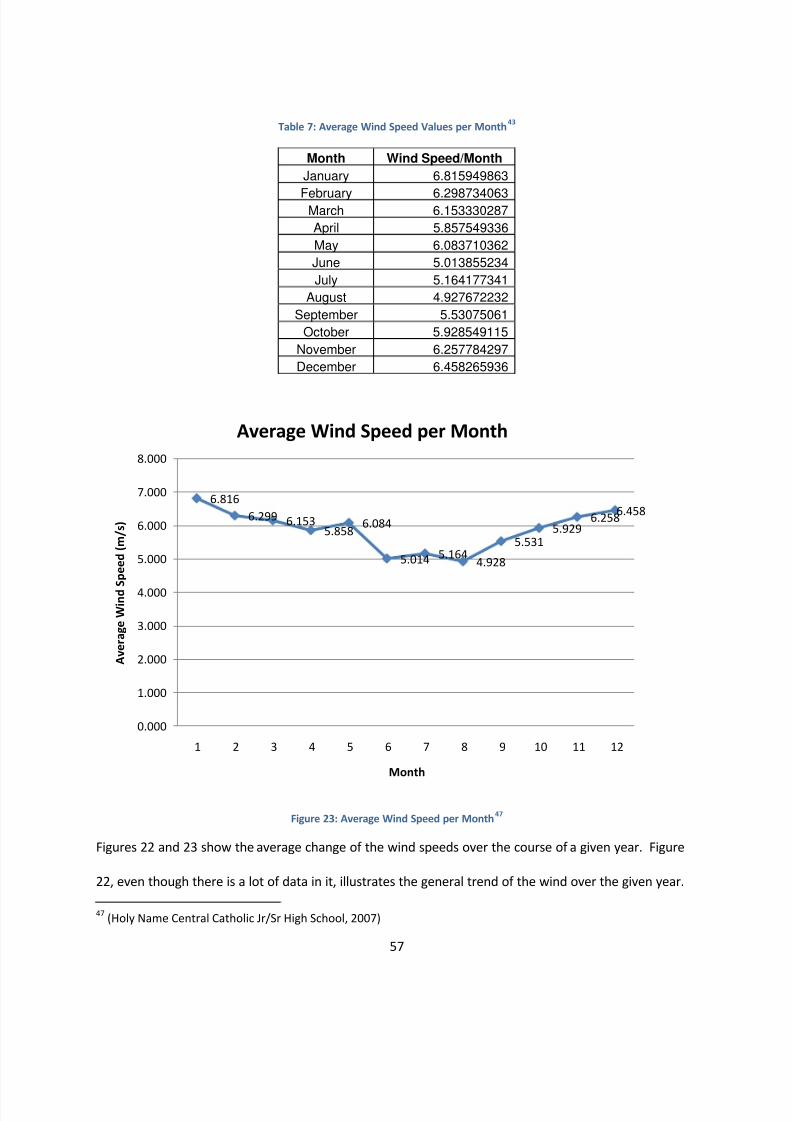
8/3/2019 Worcester Academy Wind Turbine IQP Report FINAL
http://slidepdf.com/reader/full/worcester-academy-wind-turbine-iqp-report-final 57/78
57
Table 7: Average Wind Speed Values per Month43
Figure 23: Average Wind Speed per Month47
Figures 22 and 23 show the average change of the wind speeds over the course of a given year. Figure
22, even though there is a lot of data in it, illustrates the general trend of the wind over the given year.
47(Holy Name Central Catholic Jr/Sr High School, 2007)
6.816
6.299 6.1535.858
6.084
5.014 5.1644.928
5.5315.929
6.2586.458
0.000
1.000
2.000
3.000
4.000
5.000
6.000
7.000
8.000
1 2 3 4 5 6 7 8 9 10 11 12
A v e r a g e W i n d S p e e d ( m / s )
Month
Average Wind Speed per Month
Month Wind Speed/Month
January 6.815949863
February 6.298734063March 6.153330287
April 5.857549336
May 6.083710362
June 5.013855234
July 5.164177341
August 4.927672232
September 5.53075061
October 5.928549115
November 6.257784297
December 6.458265936
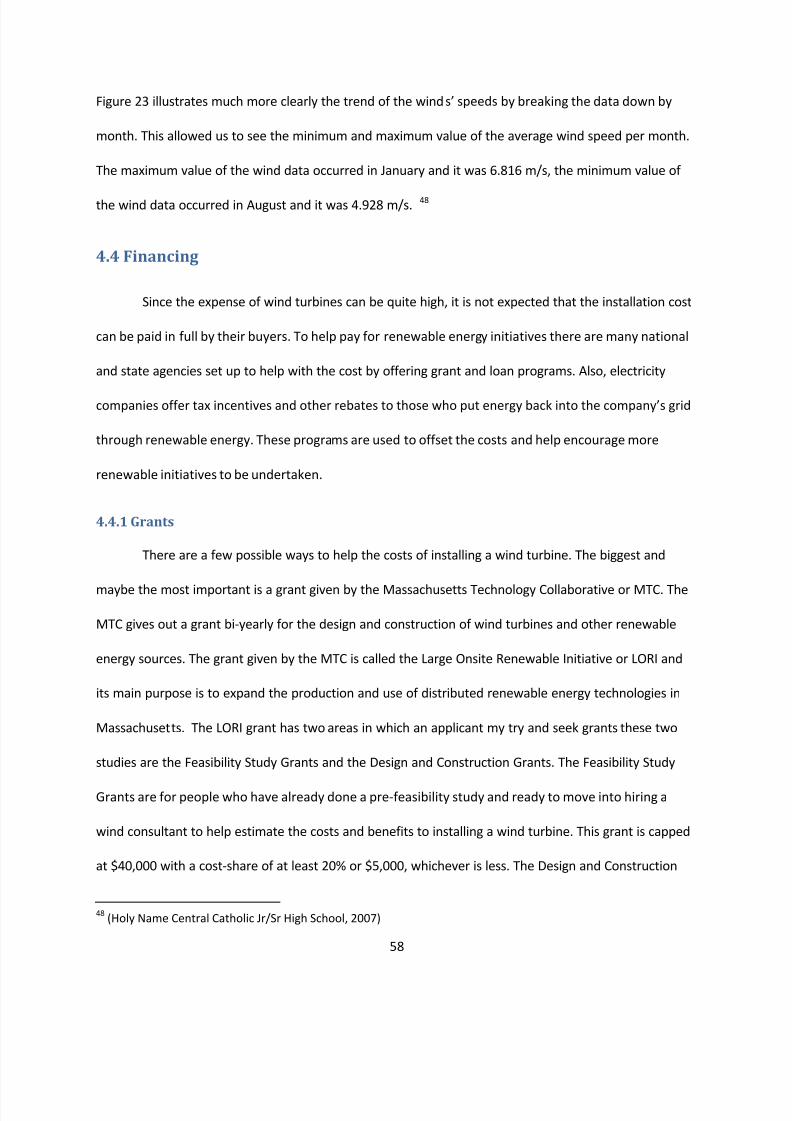
8/3/2019 Worcester Academy Wind Turbine IQP Report FINAL
http://slidepdf.com/reader/full/worcester-academy-wind-turbine-iqp-report-final 58/78
58
Figure 23 illustrates much more clearly the trend of the winds’ speeds by breaking the data down by
month. This allowed us to see the minimum and maximum value of the average wind speed per month.
The maximum value of the wind data occurred in January and it was 6.816 m/s, the minimum value of
the wind data occurred in August and it was 4.928 m/s. 48
4.4 Financing
Since the expense of wind turbines can be quite high, it is not expected that the installation cost
can be paid in full by their buyers. To help pay for renewable energy initiatives there are many national
and state agencies set up to help with the cost by offering grant and loan programs. Also, electricity
companies offer tax incentives and other rebates to those who put energy back into the company’s grid
through renewable energy. These programs are used to offset the costs and help encourage more
renewable initiatives to be undertaken.
4.4.1 Grants
There are a few possible ways to help the costs of installing a wind turbine. The biggest and
maybe the most important is a grant given by the Massachusetts Technology Collaborative or MTC. The
MTC gives out a grant bi-yearly for the design and construction of wind turbines and other renewable
energy sources. The grant given by the MTC is called the Large Onsite Renewable Initiative or LORI and
its main purpose is to expand the production and use of distributed renewable energy technologies in
Massachusetts. The LORI grant has two areas in which an applicant my try and seek grants these two
studies are the Feasibility Study Grants and the Design and Construction Grants. The Feasibility Study
Grants are for people who have already done a pre-feasibility study and ready to move into hiring a
wind consultant to help estimate the costs and benefits to installing a wind turbine. This grant is capped
at $40,000 with a cost-share of at least 20% or $5,000, whichever is less. The Design and Construction
48(Holy Name Central Catholic Jr/Sr High School, 2007)
8/3/2019 Worcester Academy Wind Turbine IQP Report FINAL
http://slidepdf.com/reader/full/worcester-academy-wind-turbine-iqp-report-final 59/78
59
Grants are for people who have already done a feasibility study and are ready to move into design and
construction. Design grants are capped at $75,000 or 75% of actual cost whichever is less, and the
construction grant is capped at $500,000 or 75% whichever is less. Anyone who wishes to apply for the
grant is subjected to a competitive selection process. There are a few requirements that must be met for
the grant to apply. The renewable energy project must have a nameplate capacity of greater than 10
kilowatts and are located on commercial, industrial, institutional, and public facilities that will consume
more than 50% of the renewable energy generated by the project on-site. The next requirement is that
the applicant and project site must be a consumer of a Massachusetts investor-owned electric
distribution utility. 49
4.4.2 Tax Incentives
There are a variety of tax incentives that can help offset costs and even make a wind turbine a
more profitable investment. These incentives range from production of energy incentives to income
and sales tax exemptions for any individuals and organizations in Massachusetts. The two tax incentives
that will effect Worcester Academy the most are the ‘Production Tax Credits’, ‘Renewable Energy
Equipment Sales Tax Exemption’ and the ‘Property Tax Incentive’.
The Production Tax Credits or PTC is one of the most important tax credits to receive. As of
recently the PTC is running and gives 2.1 cents per kilowatt to any wind turbine for a span of 10 years
from its building date. The PTC has yet to get a long term deal and continually goes off for a year then
back on. The current deal is set to end in 2010. This greatly affects the wind turbine market. When the
PTC is on there is a roughly a 40% increase in wind turbine production, when it is off there is a drastic
decrease. Since the PTC is underway until at least 2010 there is plenty of time for Worcester Academy to
get the 2.1 cents/kWh50.
49(Large Onsite Renewables Initiative)
50(Production Tax Credit for Renewable Energy, 2009)
8/3/2019 Worcester Academy Wind Turbine IQP Report FINAL
http://slidepdf.com/reader/full/worcester-academy-wind-turbine-iqp-report-final 60/78
60
A second tax incentive is the Renewable Energy Equipment Sales Tax Exemption. This tax
incentive gives any renewable energy equipment such as wind turbine, solar power, and heat pump
systems the ability to bypass the standard Massachusetts sales taxes51. There is no maximum amount
associated with this incentive and gives Worcester Academy a huge way to save money. It would save
5% of the initial cost which would be thousands because of the excessive amount of money turbines
cost.
The final tax incentive that would give Worcester Academy even more economical relief would
be the Property Tax Incentive or the PTI52. The PTI would give Worcester Academy a property tax
exemption from local property taxes for a 20-year period. The only requirement to get this tax incentive
is that the wind or solar energy system must be used for heating or supplying energy to taxable
properties.
4.4.3 Projected Savings
The projected savings were determined using three different types of turbines. The predicted
total cost consists of the turbine, along with the excavation cost, and the shipping and installation cost.
Then the expected return is determined by per year rebates, two were chosen. The first was a .02 dollar
per watt and the second was a .06 dollar per watt, chosen based upon of the power was returned to the
grid or fed directly, respectively. Along with this the expected return also included the grants, which
only apply with MTCs energy consumption standards, a proposed donation and/or fundraiser, and tax
incentive return. There is no difference for nonprofit organizations such as Worcester Academy, versus
profitable organizations. It seems that there is no major benefit for money spent or not spent up front
other than the fact that the loan that has to be gained will be substantially less and thus there should be
51(Massachusetts Incentives for Renewable Energy, 2009)
52(Renewable Energy Property Tax Exemption, 2008)
8/3/2019 Worcester Academy Wind Turbine IQP Report FINAL
http://slidepdf.com/reader/full/worcester-academy-wind-turbine-iqp-report-final 61/78
61
more benefit and profit over time. Each of these was calculated out for each of the three chosen
turbines; the Suzlon S52, the Enercon E33, and the Gamesa G58-850. All of the data for the following
section is represented in the appendix under the Projected Savings section.
First the Suzlon S52 is a 600 kW turbine. The projected cost of this turbine is $1.35 million.
Along with that is the projected excavation cost which has a total cost of $15,000 and the installation
and shipping with a cost of $5,000. This comes to a total cost of $1.37 million. Then factor in the
expected grants and the proposed donation, which have the potential to come to a total of $1,115,000.
This brings the overall total to $255,000. Along with that are the rebates that they would receive
annually which is $26,975.30 with return to the grid, and when not returned to the grid is $77,072.28.
When you factor in the excess loan that would need to be taken out and the interest of that loan and
the yearly maintenance cost of $27,000, your total cost over twenty years would be $1,053,215. Then
subtract total cost over twenty years from the total rebate cost over twenty years. This gives a deficit of
-$513,709 when the energy is put back into the grid, and the benefit of $488,230 when fed directly to
the site.
Second is the Enercon E33 is a 330 kW turbine. The projected cost of this turbine is $900,000.
Along with that is the projected excavation cost which has a total cost of $15,000 and the installation
and shipping with a cost of $5,000. This comes to a total cost of $920,000. Then factor in the expected
grants and proposed donations, which have the potential to come to a total of $1.115million. This
brings the overall total to -$195,000. Along with that are the rebates that they would receive annually
which is $19,354.63 with energy returned to the grid, and $55,298.94 when not returned to the grid.
When you factor in the excess loan that would need to be taken out and the interest of that loan and
the yearly maintenance cost of $18,000, your total cost over twenty years would be $165,000. Then
subtract total cost over twenty years from the total rebate cost over twenty years. This gives a benefit
8/3/2019 Worcester Academy Wind Turbine IQP Report FINAL
http://slidepdf.com/reader/full/worcester-academy-wind-turbine-iqp-report-final 62/78
62
of $222,092 when the power is returned to the grid and $940,978 when the power is directly fed to the
site.
Third is the Gamesa G58-850 is a 850 kW turbine. The projected cost of this turbine is $1.6
million. Along with that is the projected excavation cost which has a total cost of $15,000 and the
installation and shipping with a cost of $5,000. This comes to a total cost of $1.62 million. Then factor
in the expected grants and proposed donation, which have the potential to come to a total of $1.115
million. This brings the overall total to $505,000. Along with that are the rebates that would be
received annually, which is $28,695.83 when power is returned to the grid, and when power is directly
fed is $81,998.08. When you factor in the excess loan that would need to be taken out and the interest
of that loan and the yearly maintenance cost of $32,000, your total cost over twenty years would be
$1,403,215. Then subtract total cost over twenty years from the total rebate cost over twenty years.
This gives a deficit of -$829,298 when power is returned and $236,546 when the power is directly fed to
the site.
Each of these predictions are based on the fact that there is a need to take out the complete
and total loan after grants are factored in. If this is not the case you would obviously remove whatever
cost is being paid out of pocket from the cost after grants. The expected savings would obviously be
more substantial if payment of the loan wasn’t needed. The significant portion of the overall cost of the
turbine is the yearly maintenance, which is 2% of the turbines original cost.
Another change that could be made to alter the cost and benefits would be if the power didn’t
have to be put back into the grid. If power was taken directly from the turbine to the site then there
would be a much more substantial value of the power they were receiving. Those savings could be
possibly three, four, or five fold.

8/3/2019 Worcester Academy Wind Turbine IQP Report FINAL
http://slidepdf.com/reader/full/worcester-academy-wind-turbine-iqp-report-final 63/78
63
8/3/2019 Worcester Academy Wind Turbine IQP Report FINAL
http://slidepdf.com/reader/full/worcester-academy-wind-turbine-iqp-report-final 64/78
64
5. Project Conclusions and Recommendations
The goal of this project was to investigate a site proposed by Worcester Academy for the
suitability of erecting a wind turbine. With the location considered three different turbines, with three
different outputs and costs were investigated to create a best case scenario for the site. Our assessment
of the site, the turbine costs and projected savings, as well as the wind data collection aided us in our
conclusions.
The proposed site is a suitable site for a wind turbine to be set up. There is enough wind at the
height that a turbine would sit at to operate correctly and the site is large enough so that there will be
no interference with neighboring properties. It cannot be determined if there will be issues with
permitting and zoning regulations, but based on the passing of the Holy Name project no issues are
predicted.
The next step for Worcester Academy to fulfill their vision of erecting a wind turbine on their
campus is to apply to the Massachusetts Technology Collaborative for a feasibility grant under the Large
Onsite Renewable Initiative (LORI). The feasibility grant is capped at $40,000 with cost-share of at least
20% or $5000, whichever is less. This grant would give Worcester Academy the money to set up an
anemometer which is essential to figuring out exactly how well a turbine will fair at the given location.
The money can also be used to hire a wind turbine consultant who can help with the process of figuring
out how well a turbine will do.
Currently the deadline for the LORI is over and a new date has yet to be set. Once a date is set
there are a few documents that must be signed and sent along with information about your site, budget,
technical requirements, and general terms and conditions. These forms can be found on the
Massachusetts Technology Collaborative site under the LORI grant section. Once the information is
8/3/2019 Worcester Academy Wind Turbine IQP Report FINAL
http://slidepdf.com/reader/full/worcester-academy-wind-turbine-iqp-report-final 65/78
65
presented to the advisors they will look it over and on a set date announce who will be receiving the
grants.
Once a feasibility study has been conducted the next step is to apply for a Design and
Construction Grant also under the LORI. The Design and Construction Grant is used to help lower the
financial burden of buying and constructing a turbine. This grant is broken up into two parts. The design
grant is capped at the lesser of $75,000 or 75% of actual cost, and construction grants are capped at the
lesser of $500,000 or 75% of actual cost. The same processes are used to apply for the Design and
Construction Grant that is used for the Feasibility Grant.
Once these grants have been applied for and accepted the turbine should be ready to be placed.
The grants and studies will take roughly a year to complete. It will take at least 6-12 months of
anemometer studies before the turbine can be truly considered by the LORI. Once the studies have been
conducted it should be as simple as getting the grants and building a turbine.
There are two scenarios that were run through. This is based upon the turbines falling under the
Class II net-metering specifications for renewable energy. The first scenario is with the power from the
turbine being returned to the grid because of the fact that there is no direct route to be able to route
power from the turbine to campus. The second scenario is that when or if buildings are built on the
southern campus that the power is returned directly to the southern or main campuses. In the first
scenario the return of dollar per watt is .021 dollars/watt. In the second scenario the return of dollar
per watt is .06 dollars/watt. It seems that there is no major benefit for money spent or not spent up
front other than the fact that the loan that has to be gained will be substantially less and thus there
should be more benefit and profit over time.
The overall cost, for the first scenario, of the installation and maintenance of any of the given
three wind turbines with our conclusions seems to not be beneficial for the installation of a wind
turbine. The turbine that gives the least deficit is the Enercon E33, which gave a deficit of only -$513,709
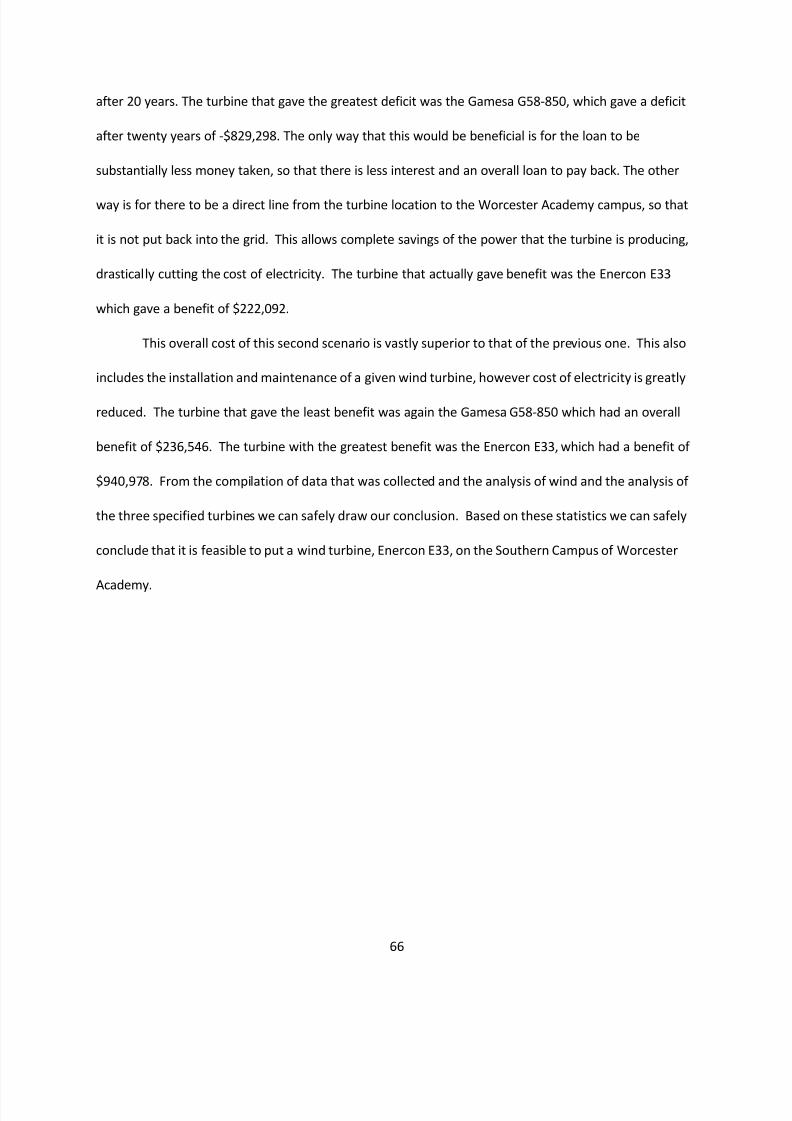
8/3/2019 Worcester Academy Wind Turbine IQP Report FINAL
http://slidepdf.com/reader/full/worcester-academy-wind-turbine-iqp-report-final 66/78
66
after 20 years. The turbine that gave the greatest deficit was the Gamesa G58-850, which gave a deficit
after twenty years of -$829,298. The only way that this would be beneficial is for the loan to be
substantially less money taken, so that there is less interest and an overall loan to pay back. The other
way is for there to be a direct line from the turbine location to the Worcester Academy campus, so that
it is not put back into the grid. This allows complete savings of the power that the turbine is producing,
drastically cutting the cost of electricity. The turbine that actually gave benefit was the Enercon E33
which gave a benefit of $222,092.
This overall cost of this second scenario is vastly superior to that of the previous one. This also
includes the installation and maintenance of a given wind turbine, however cost of electricity is greatly
reduced. The turbine that gave the least benefit was again the Gamesa G58-850 which had an overall
benefit of $236,546. The turbine with the greatest benefit was the Enercon E33, which had a benefit of
$940,978. From the compilation of data that was collected and the analysis of wind and the analysis of
the three specified turbines we can safely draw our conclusion. Based on these statistics we can safely
conclude that it is feasible to put a wind turbine, Enercon E33, on the Southern Campus of Worcester
Academy.
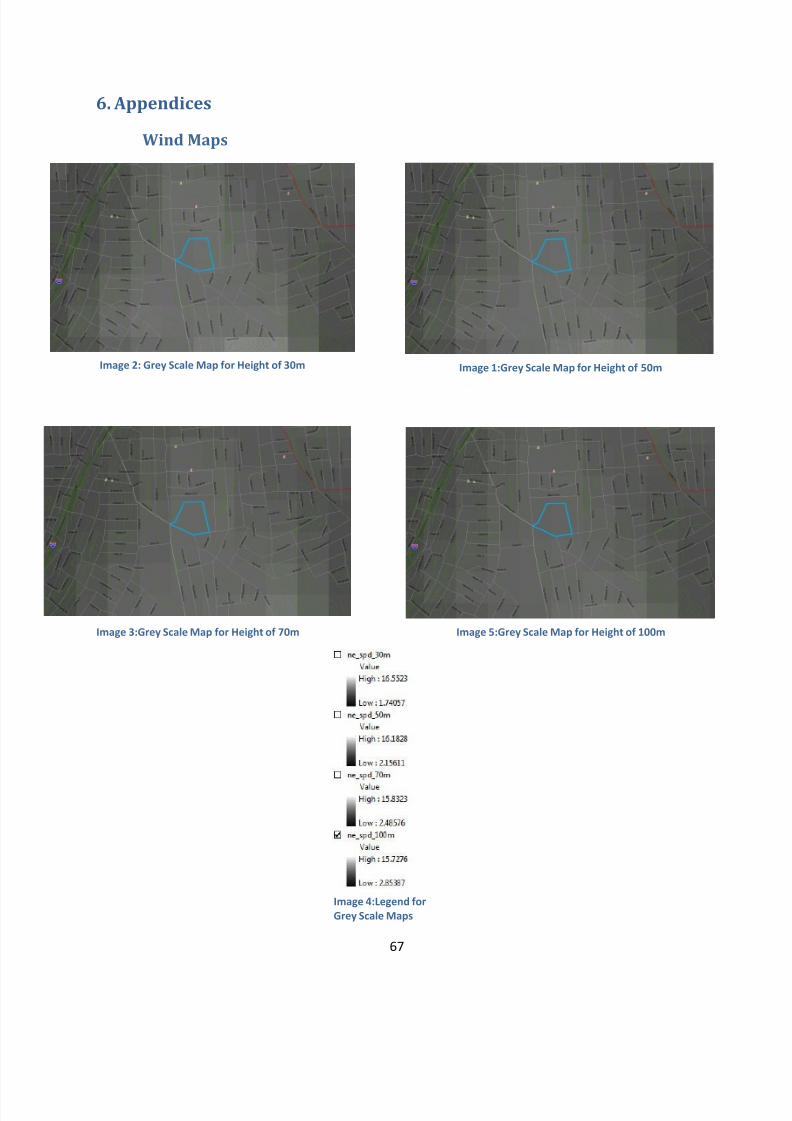
8/3/2019 Worcester Academy Wind Turbine IQP Report FINAL
http://slidepdf.com/reader/full/worcester-academy-wind-turbine-iqp-report-final 67/78
67
6. Appendices
Wind Maps
Image 2: Grey Scale Map for Height of 30m Image 1:Grey Scale Map for Height of 50m
Image 3:Grey Scale Map for Height of 70m Image 5:Grey Scale Map for Height of 100m
Image 4:Legend for
Grey Scale Maps
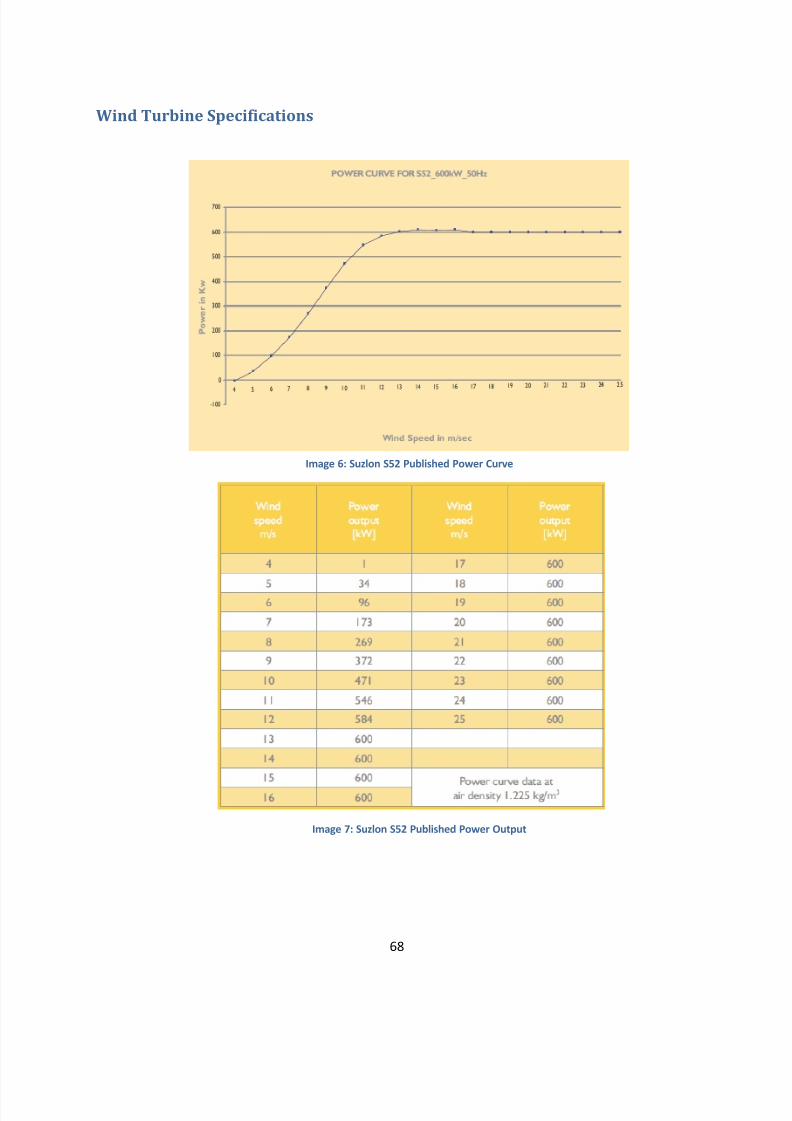
8/3/2019 Worcester Academy Wind Turbine IQP Report FINAL
http://slidepdf.com/reader/full/worcester-academy-wind-turbine-iqp-report-final 68/78
68
Wind Turbine Specifications
Image 6: Suzlon S52 Published Power Curve
Image 7: Suzlon S52 Published Power Output
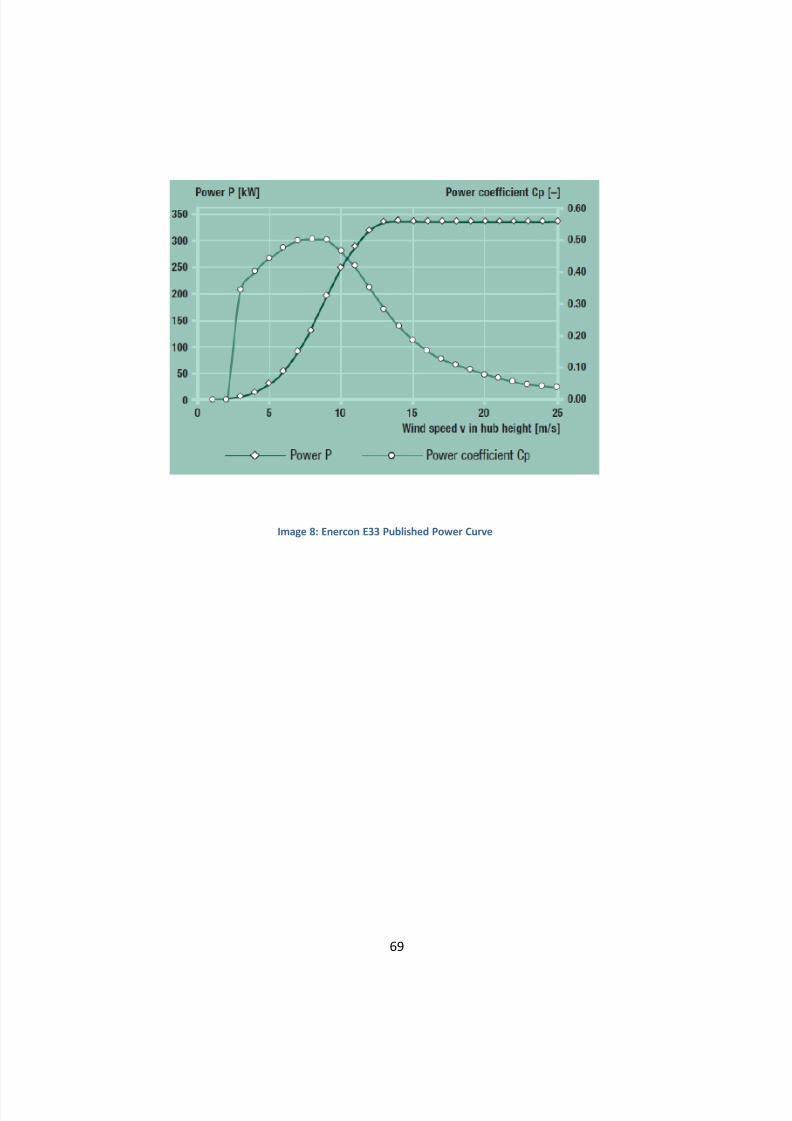
8/3/2019 Worcester Academy Wind Turbine IQP Report FINAL
http://slidepdf.com/reader/full/worcester-academy-wind-turbine-iqp-report-final 69/78
69
Image 8: Enercon E33 Published Power Curve
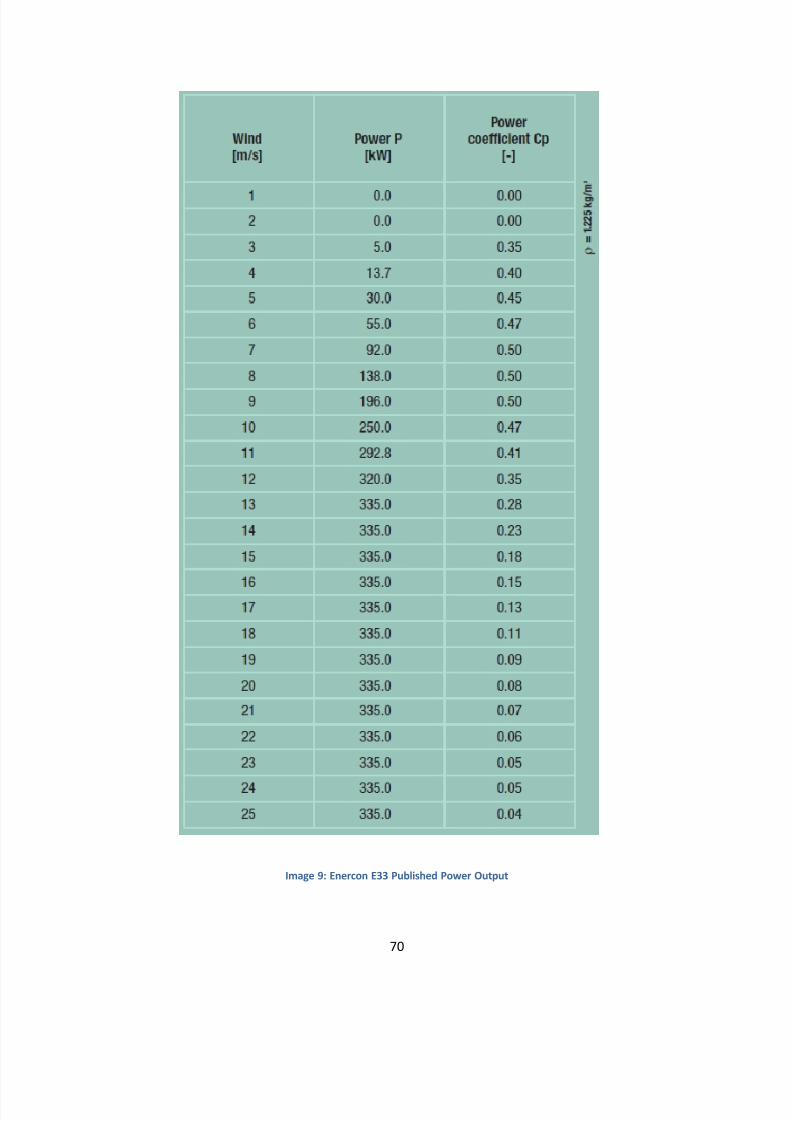
8/3/2019 Worcester Academy Wind Turbine IQP Report FINAL
http://slidepdf.com/reader/full/worcester-academy-wind-turbine-iqp-report-final 70/78
70
Image 9: Enercon E33 Published Power Output
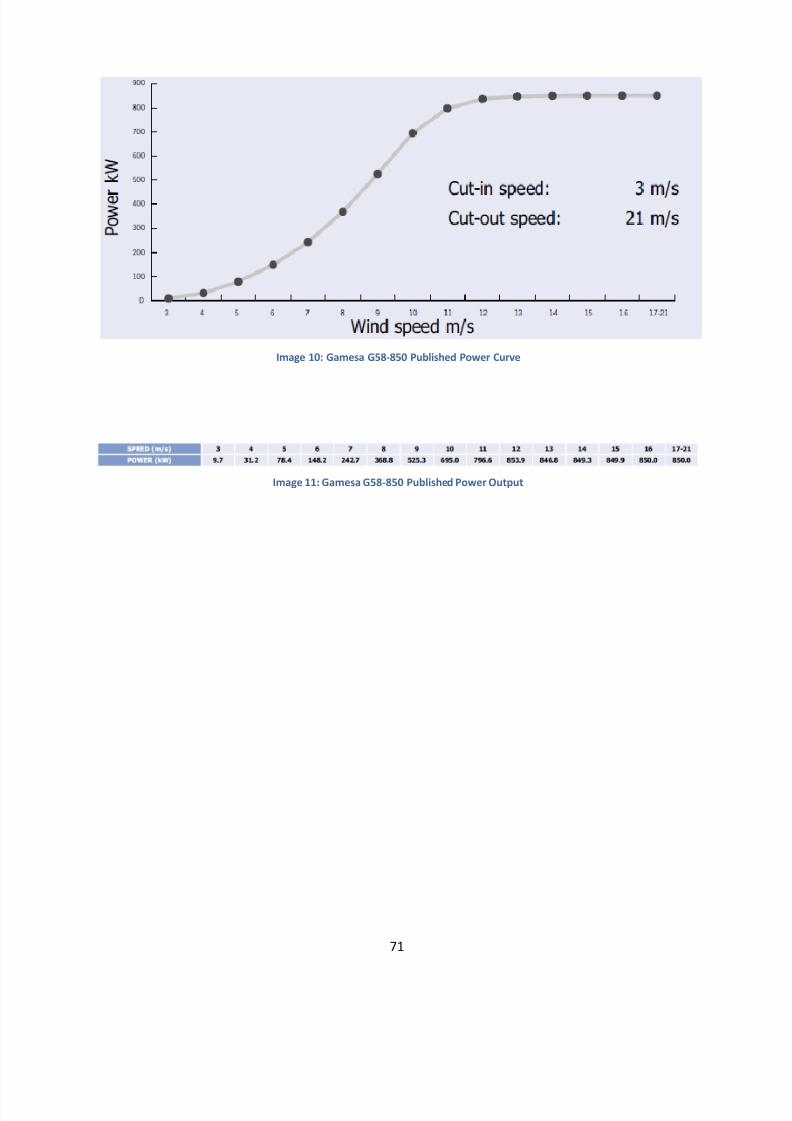
8/3/2019 Worcester Academy Wind Turbine IQP Report FINAL
http://slidepdf.com/reader/full/worcester-academy-wind-turbine-iqp-report-final 71/78
71
Image 10: Gamesa G58-850 Published Power Curve
Image 11: Gamesa G58-850 Published Power Output
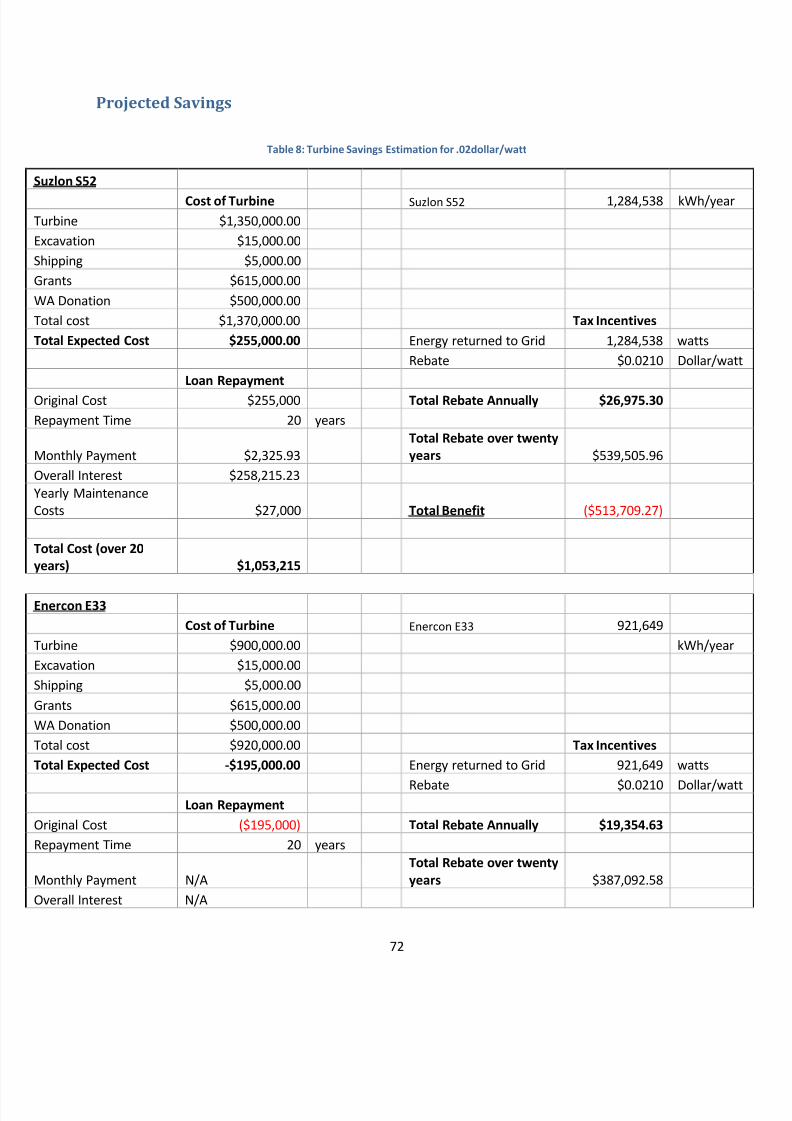
8/3/2019 Worcester Academy Wind Turbine IQP Report FINAL
http://slidepdf.com/reader/full/worcester-academy-wind-turbine-iqp-report-final 72/78
72
Projected Savings
Table 8: Turbine Savings Estimation for .02dollar/watt
Suzlon S52
Cost of Turbine Suzlon S52 1,284,538 kWh/year
Turbine $1,350,000.00
Excavation $15,000.00
Shipping $5,000.00
Grants $615,000.00
WA Donation $500,000.00
Total cost $1,370,000.00 Tax Incentives
Total Expected Cost $255,000.00 Energy returned to Grid 1,284,538 watts
Rebate $0.0210 Dollar/watt
Loan Repayment
Original Cost $255,000 Total Rebate Annually $26,975.30
Repayment Time 20 years
Monthly Payment $2,325.93
Total Rebate over twenty
years $539,505.96
Overall Interest $258,215.23
Yearly Maintenance
Costs $27,000 Total Benefit ($513,709.27)
Total Cost (over 20
years) $1,053,215
Enercon E33
Cost of Turbine Enercon E33 921,649
Turbine $900,000.00 kWh/year
Excavation $15,000.00
Shipping $5,000.00
Grants $615,000.00
WA Donation $500,000.00
Total cost $920,000.00 Tax Incentives
Total Expected Cost -$195,000.00 Energy returned to Grid 921,649 watts
Rebate $0.0210 Dollar/wattLoan Repayment
Original Cost ($195,000) Total Rebate Annually $19,354.63
Repayment Time 20 years
Monthly Payment N/A
Total Rebate over twenty
years $387,092.58
Overall Interest N/A
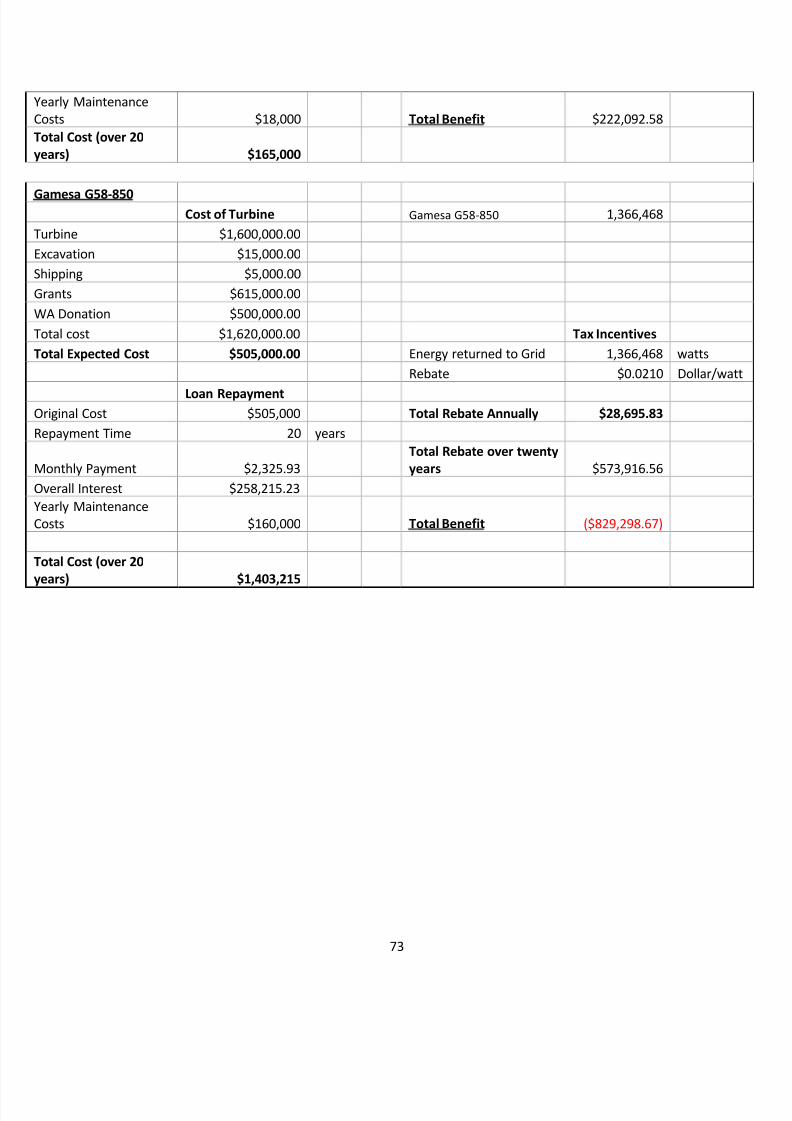
8/3/2019 Worcester Academy Wind Turbine IQP Report FINAL
http://slidepdf.com/reader/full/worcester-academy-wind-turbine-iqp-report-final 73/78
73
Yearly Maintenance
Costs $18,000 Total Benefit $222,092.58
Total Cost (over 20
years) $165,000
Gamesa G58-850Cost of Turbine Gamesa G58-850 1,366,468
Turbine $1,600,000.00
Excavation $15,000.00
Shipping $5,000.00
Grants $615,000.00
WA Donation $500,000.00
Total cost $1,620,000.00 Tax Incentives
Total Expected Cost $505,000.00 Energy returned to Grid 1,366,468 watts
Rebate $0.0210 Dollar/watt
Loan RepaymentOriginal Cost $505,000 Total Rebate Annually $28,695.83
Repayment Time 20 years
Monthly Payment $2,325.93
Total Rebate over twenty
years $573,916.56
Overall Interest $258,215.23
Yearly Maintenance
Costs $160,000 Total Benefit ($829,298.67)
Total Cost (over 20
years) $1,403,215
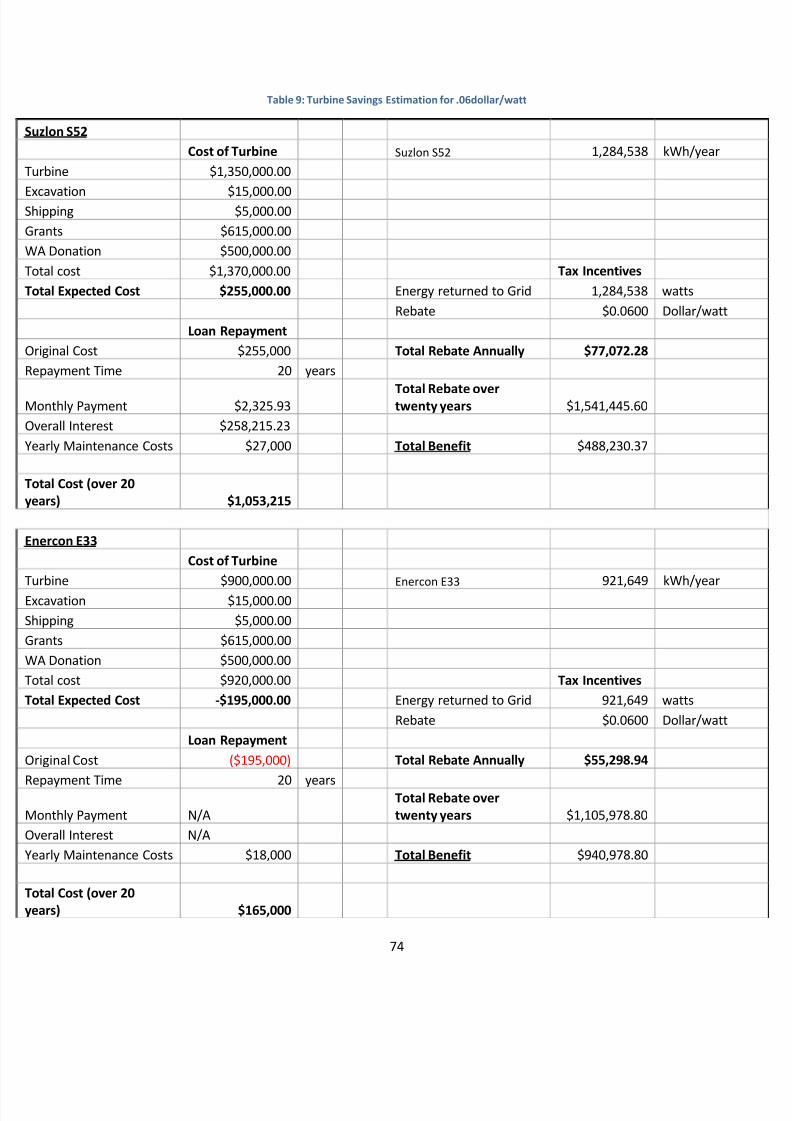
8/3/2019 Worcester Academy Wind Turbine IQP Report FINAL
http://slidepdf.com/reader/full/worcester-academy-wind-turbine-iqp-report-final 74/78
74
Table 9: Turbine Savings Estimation for .06dollar/watt
uzlon S52
Cost of Turbine Suzlon S52 1,284,538 kWh/year
urbine $1,350,000.00
xcavation $15,000.00hipping $5,000.00
rants $615,000.00
WA Donation $500,000.00
otal cost $1,370,000.00 Tax Incentives
otal Expected Cost $255,000.00 Energy returned to Grid 1,284,538 watts
Rebate $0.0600 Dollar/watt
Loan Repayment
Original Cost $255,000 Total Rebate Annually $77,072.28
epayment Time 20 years
Monthly Payment $2,325.93Total Rebate overtwenty years $1,541,445.60
Overall Interest $258,215.23
early Maintenance Costs $27,000 Total Benefit $488,230.37
otal Cost (over 20
ears) $1,053,215
nercon E33
Cost of Turbine
urbine $900,000.00 Enercon E33 921,649 kWh/year
xcavation $15,000.00
hipping $5,000.00
rants $615,000.00
WA Donation $500,000.00
otal cost $920,000.00 Tax Incentives
otal Expected Cost -$195,000.00 Energy returned to Grid 921,649 watts
Rebate $0.0600 Dollar/watt
Loan Repayment
Original Cost ($195,000) Total Rebate Annually $55,298.94
epayment Time 20 years
Monthly Payment N/A
Total Rebate over
twenty years $1,105,978.80
Overall Interest N/A
early Maintenance Costs $18,000 Total Benefit $940,978.80
otal Cost (over 20
ears) $165,000
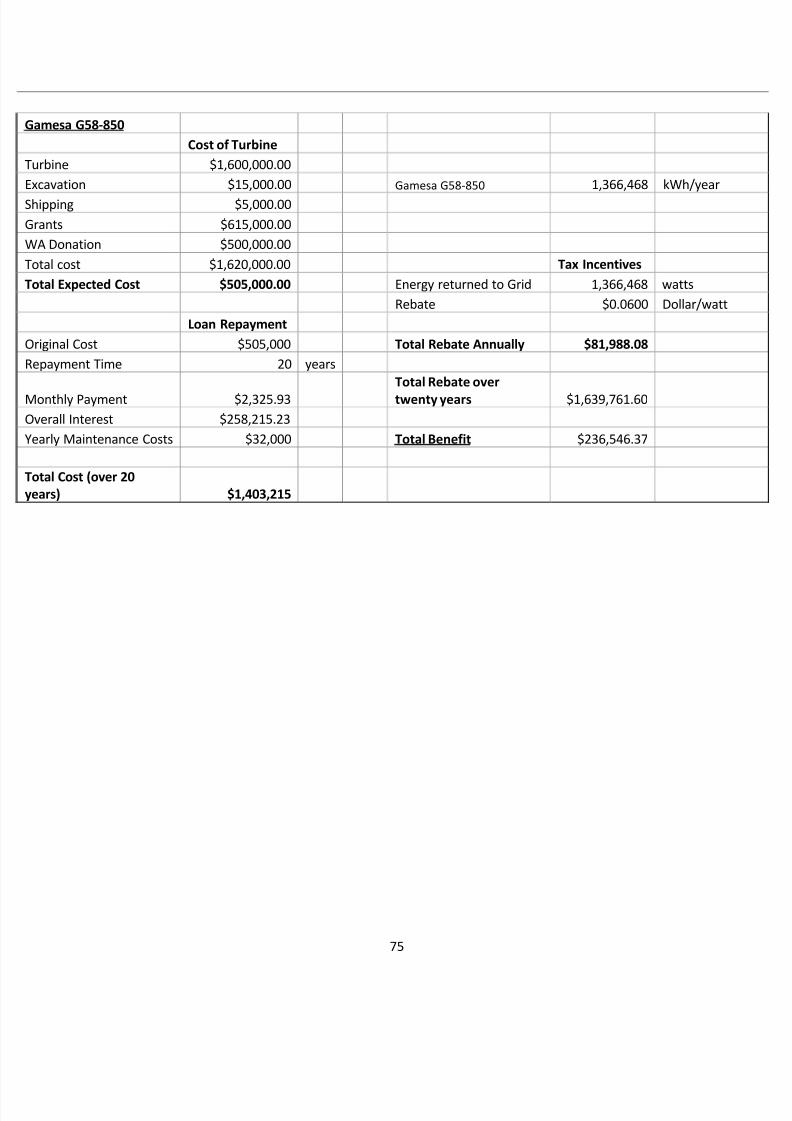
8/3/2019 Worcester Academy Wind Turbine IQP Report FINAL
http://slidepdf.com/reader/full/worcester-academy-wind-turbine-iqp-report-final 75/78
75
amesa G58-850
Cost of Turbine
urbine $1,600,000.00
xcavation $15,000.00 Gamesa G58-850 1,366,468 kWh/year
hipping $5,000.00
rants $615,000.00
WA Donation $500,000.00
otal cost $1,620,000.00 Tax Incentives
otal Expected Cost $505,000.00 Energy returned to Grid 1,366,468 watts
Rebate $0.0600 Dollar/watt
Loan Repayment
Original Cost $505,000 Total Rebate Annually $81,988.08
epayment Time 20 years
Monthly Payment $2,325.93
Total Rebate over
twenty years $1,639,761.60
Overall Interest $258,215.23
early Maintenance Costs $32,000 Total Benefit $236,546.37
otal Cost (over 20
ears) $1,403,215
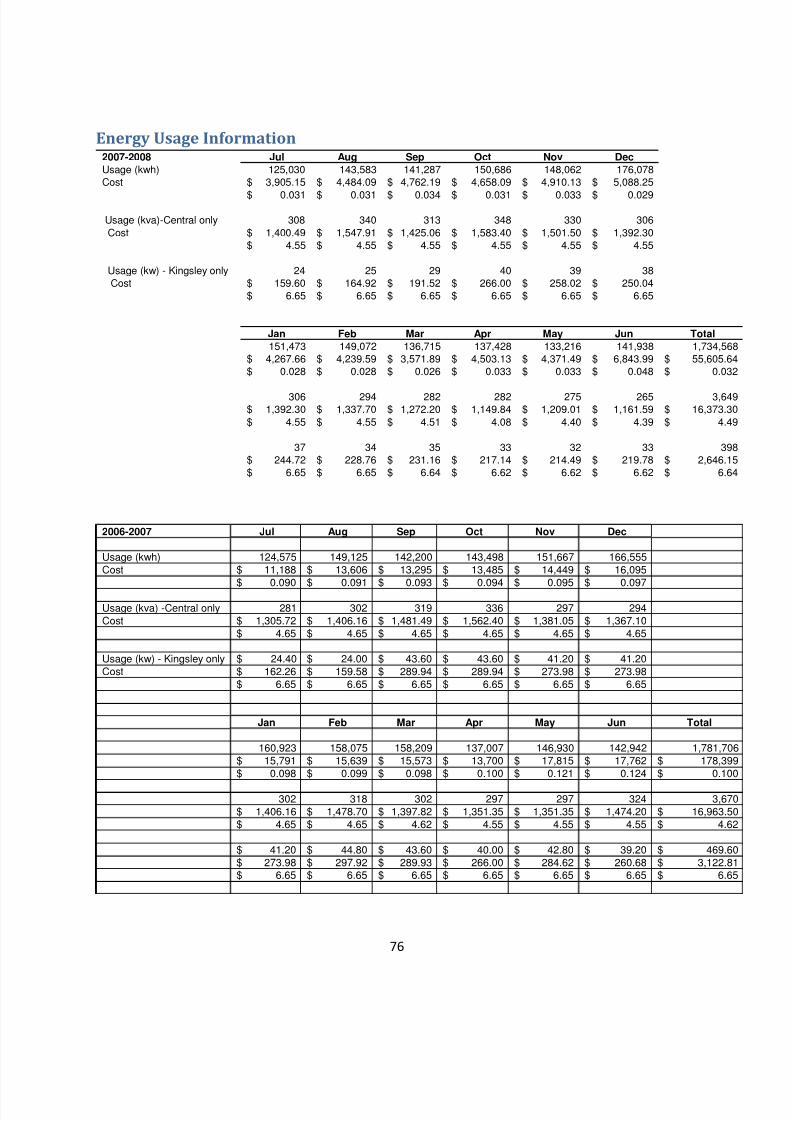
8/3/2019 Worcester Academy Wind Turbine IQP Report FINAL
http://slidepdf.com/reader/full/worcester-academy-wind-turbine-iqp-report-final 76/78
76
Energy Usage Information2007-2008 Jul Aug Sep Oct Nov Dec
Usage (kwh) 125,030 143,583 141,287 150,686 148,062 176,078 Cost 3,905.15$ 4,484.09$ 4,762.19$ 4,658.09$ 4,910.13$ 5,088.25$
0.031$ 0.031$ 0.034$ 0.031$ 0.033$ 0.029$
Usage (kva)-Central only 308 340 313 348 330 306
Cost 1,400.49$ 1,547.91$ 1,425.06$ 1,583.40$ 1,501.50$ 1,392.30$4.55$ 4.55$ 4.55$ 4.55$ 4.55$ 4.55$
Usage (kw) - Kingsley only 24 25 29 40 39 38 Cost 159.60$ 164.92$ 191.52$ 266.00$ 258.02$ 250.04$
6.65$ 6.65$ 6.65$ 6.65$ 6.65$ 6.65$
Jan Feb Mar Apr May Jun Total
151,473 149,072 136,715 137,428 133,216 141,938 1,734,568 4,267.66$ 4,239.59$ 3,571.89$ 4,503.13$ 4,371.49$ 6,843.99$ 55,605.64$
0.028$ 0.028$ 0.026$ 0.033$ 0.033$ 0.048$ 0.032$
306 294 282 282 275 265 3,649 1,392.30$ 1,337.70$ 1,272.20$ 1,149.84$ 1,209.01$ 1,161.59$ 16,373.30$
4.55$ 4.55$ 4.51$ 4.08$ 4.40$ 4.39$ 4.49$
37 34 35 33 32 33 398 244.72$ 228.76$ 231.16$ 217.14$ 214.49$ 219.78$ 2,646.15$
6.65$ 6.65$ 6.64$ 6.62$ 6.62$ 6.62$ 6.64$
2006-2007 Jul Aug Sep Oct Nov Dec
Usage (kwh) 124,575 149,125 142,200 143,498 151,667 166,555 Cost 11,188$ 13,606$ 13,295$ 13,485$ 14,449$ 16,095$
0.090$ 0.091$ 0.093$ 0.094$ 0.095$ 0.097$
Usage (kva) -Central only 281 302 319 336 297 294 Cost 1,305.72$ 1,406.16$ 1,481.49$ 1,562.40$ 1,381.05$ 1,367.10$
4.65$ 4.65$ 4.65$ 4.65$ 4.65$ 4.65$
Usage (kw) - Kingsley only 24.40$ 24.00$ 43.60$ 43.60$ 41.20$ 41.20$Cost 162.26$ 159.58$ 289.94$ 289.94$ 273.98$ 273.98$
6.65$ 6.65$ 6.65$ 6.65$ 6.65$ 6.65$
Jan Feb Mar Apr May Jun Total
160,923 158,075 158,209 137,007 146,930 142,942 1,781,706 15,791$ 15,639$ 15,573$ 13,700$ 17,815$ 17,762$ 178,399$0.098$ 0.099$ 0.098$ 0.100$ 0.121$ 0.124$ 0.100$
302 318 302 297 297 324 3,670 1,406.16$ 1,478.70$ 1,397.82$ 1,351.35$ 1,351.35$ 1,474.20$ 16,963.50$
4.65$ 4.65$ 4.62$ 4.55$ 4.55$ 4.55$ 4.62$
41.20$ 44.80$ 43.60$ 40.00$ 42.80$ 39.20$ 469.60$273.98$ 297.92$ 289.93$ 266.00$ 284.62$ 260.68$ 3,122.81$
6.65$ 6.65$ 6.65$ 6.65$ 6.65$ 6.65$ 6.65$
8/3/2019 Worcester Academy Wind Turbine IQP Report FINAL
http://slidepdf.com/reader/full/worcester-academy-wind-turbine-iqp-report-final 77/78
77
7. Bibliography Altamont Pass, California. (2008, March 25). Retrieved March 10, 2009, from The Encyclopedia of the
Earth: http://www.eoearth.org/article/Altamont_Pass,_California
American Wind Energy Association. (n.d.). Retrieved December 14, 2008, from American Wind Energy
Association: www.awea.org
Anemometers. (n.d.). Retrieved March 5, 2009, from The Weather Hut:
http://www.weatherhut.com/site/1298901/LearningCenter/Anemometer.html
Ankhmatov, V. (2005). Induction Generators for Wind Power. Multi Science Publishing Company.
AWEA. (2007). Wind Power Today 2007. Retrieved 12 2, 2008, from American Wind Energy Association:
http://awea.org/pubs/factsheets/WindPowerToday_2007.pdf
BTM Consult ApS. (2009, March 25). International Wind Energy Development, World Market Update
2009, Forecast 2009-2013.
Christopher House Feasibility Study. (2008, May 5). Retrieved April 10, 2009, from Mass. Tech.
Collaborative: http://masstech.org/project_detail.cfm?ProjSeq=1003
Darling, D. (2008). The Encyclopedia of Alternative Energy and Sustainable Living.
Diversifying Sources of Electricity . (n.d.). Retrieved 5 2008, 12, from Mass. Tech. Collaborative:
http://masstech.org/cleanenergy/important/fueldiversify.htm
Energy Sector Research. (n.d.). Retrieved 16 2008, 11, from Yahoo News:
http://news.yahoo.com/s/afp/20090202/ts_alt_afp/usenergysectorwind_20090202193046
G58-850. (n.d.). Retrieved April 3, 2009, from Gamesa Corp.:
http://www.gamesacorp.com/en/products/wind-turbines/catalogue/gamesa-g58-850-kw
Gipe, P. (1995). Wind Energy Comes of Age. USA: John Wiley & Sons Inc.
Holy Name Central Catholic Jr/Sr High School. (2007, February 6). Retrieved January 18, 2009, from
Mass. Tech. Collaborative: http://masstech.org/project_detail.cfm?ProjSeq=721
Large Onsite Renewables Initiative. (n.d.). Retrieved December 4, 2008, from Mass. Tech. Collaborative:
http://www.masstech.org/renewableenergy/large_renewables.htm
Manwell, J., McGowan, J., & Stoddard, F. (n.d.). The UMass Wind Turbine WF-1: A Retrospective.
Retrieved February 26, 2009, from Center for Efficiency and Renewable Energy:
http://www.ceere.org/rerl/WF1/
Massachusetts Incentives for Renewable Energy. (2009, April 21). Retrieved April 24, 2009, from
Database of State Incentives for Renewables & Effieiency:
8/3/2019 Worcester Academy Wind Turbine IQP Report FINAL
http://slidepdf.com/reader/full/worcester-academy-wind-turbine-iqp-report-final 78/78
http://www.dsireusa.org/library/includes/incentive2.cfm?Incentive_Code=MA05F&state=MA&CurrentP
ageID=1
Massachusetts Maritime Academy. (2006, December 31). Retrieved April 14, 2009, from Mass. Tech.
Collaborative: http://masstech.org/project_detail.cfm?ProjSeq=260
Massachusetts Technology Collaborative. (n.d.). Retrieved 11 10, 2008, from Massachusetts Technology
Collaborative: www.masstech.org
MTC History (2005). (n.d.). Retrieved 2 16, 2009, from Mass. Tech. Collaborative:
http://masstech.org/AgencyOverview/history11-05.pdf
Product Overview. (n.d.). Enercon Wind Turbines . Bremen, Germany: Enercon GmbH.
Production Tax Credit for Renewable Energy. (2009, April 22). Retrieved April 22, 2009, from Union of
Concerned Scientists:
http://www.ucsusa.org/clean_energy/solutions/big_picture_solutions/production-tax-credit-for.html
Renewable Energy Property Tax Exemption. (2008, November 11). Retrieved April 24, 2009, from
Database for :
http://www.dsireusa.org/library/includes/tabsrch.cfm?state=MA&type=Property&back=fintab&Sector=
S&CurrentPageID=7&EE=0&RE=1
Resources, D. o. (2009). Allowing Use of Wind Turbine Facilities. Boston: Massachusetts Executive Office
of Environmental Affairs.
Suzlon S52. (n.d.). Retrieved April 2, 2009, from Suzlon Wind Turbines:
http://www.suzlon.com/WindTurbines.html
Swift-Hook, D. T. (1989). Wind Energy and the Environment. London: Peter Peregrinus, Ltd.
Upper Cape Cod Regional Tech School - Wind Feasibility Study. (2007, May 1). Retrieved April 14, 2009,
from Mass. Tech. Collaborative: http://masstech.org/project_detail.cfm?ProjSeq=754
Why Clean Energy is Important: Overview. (n.d.). Retrieved 11 24, 2008, from Mass. Tech. collaborative:
http://masstech.org/cleanenergy/important/overview.htm
Wind Resource Assessment. (n.d.). Retrieved April 2, 2009, from Oregon.gov:
http://www oregon gov/ENERGY/RENEW/Wind/Assessment shtml


![CD103 PURE IQP-111P s IQP-111P50 s FITC IQP-111F s [REF] s R … · 2016-08-29 · Les anticorps monoclonaux doivent être protégés d’une exposition prolongée à la lumière](https://img.pdfslide.us/doc/110x75/5f3f85fbe425191a4c2cb7c1/cd103-pure-iqp-111p-s-iqp-111p50-s-fitc-iqp-111f-s-ref-s-r-2016-08-29-les-anticorps.jpg)