Embed Size (px)
Citation preview

Water Resources of the Inner Basin of SanFrancisco Volcano, Coconino County, Arizona
Item Type text; Proceedings
Authors Montgomery, E. L.; DeWitt, R. H.
Publisher Arizona-Nevada Academy of Science
Journal Hydrology and Water Resources in Arizona and the Southwest
Rights Copyright ©, where appropriate, is held by the author.
Download date 13/06/2018 21:05:32
Link to Item http://hdl.handle.net/10150/300367

WATER RESOURCES OF THE INNER BASIN OFSAN FRANCISCO VOLCANO, COCONINO COUNTY, ARIZONA
E. L. MontgomeryNorthern Arizona University
R. H. DeWittCity of Flagstaff Water Department
GENERAL
The highest peak of San Francisco Mountain rises to an altitudeof 12,633 feet, approximately 6,000 feet above the surrounding plateau.The several high peaks are arranged in a horseshoe pattern which isopen to the northeast and forms the periphery of the Inner Basin. Thelocation of the Inner Basin is shown on Figure 1.
One of the earliest sources of municipal water for Flagstaff wasfrom springs located in the Inner Basin which were first used by theCity in 1899. From that date to the present the springs have beendeveloped to supply significant amounts of water in the spring andsummer of most years. Beginning in 1967, the groundwater supplyfrom the Inner Basin was further developed with a drilling programwhich, by 1970, resulted in five producing wells. Figure 2 showsquantities consumed and sources of all municipal water for Flagstafffrom 1949 through 1973.
HYDROGEOLOGIC FEATURES
The Inner Basin is a collapse and erosional feature in San FranciscoMountain,an extinct volcano of Late Cenozoic age, which lies approximatelyeight miles north of Flagstaff. The outcrop patterns of geologic unitsin the Inner Basin are shown in Figure 3.
The oldest rocks exposed in the Inner Basin are a sequence ofandesitic pyroclastics, breccias, and lava flow rocks which are assignedto stage 1 of Robinson's (1913) second general period of eruption in theSan Francisco Volcanic Field. The stage 1 rocks are believed to bemoderately permeable, particularly where they have been fractured bystructural movements. The younger volcanic rocks of stages 2, 3, 4,
and 5 contain less pyroclastics and breccias and are believed to havea lower permeability. Intrusive igneous rocks are well exposed in theCore Ridge, which is believed to be the principal vent area for thevolcano. Other intrusive rocks occur as dikes which crop out in thewalls of the Inner Basin. Intrusive igneous rocks and stage 2, 3, 4,and 5 lava flow rocks are believed to be aquitards and provide perchingconditions for local perched groundwater reservoirs which occur in thewalls of the Inner Basin.
183

L,,,_.<<,.,..,,..
r`,,_-'_,Sì>.'<:,; ;
VG Figure 1
LOCATION OF SOURCES
v /J
L ì+i.ér....+ .. ,- t V.A 3' 1
FLA.GSTAFF I)`:.(Q ;: ..á ..-.i!ANU"r Stat(i / ( \ t
\(/f
y<rj r
Z
"
-
i -JWOODY MTN. - r'1 ?
3Gi<
, ., `, ,:,.:,. \i -Zf'-___.-;.,;;LAKE MARY -W
ORaàjj/
184

_6000
Figure
2
AMOUNTS AND SOURCES
OF WATER CO^!SUME©
IN. FLAGSTAFF
49
50
51
52
53
54
55
56
57
58
59
60
61
62
63
64
65
66
67
68
69
70
71
72
73
YEAR
INNER BASIN SPRINGS
INNER BASIN WELLS
I;LAKE MARY
NO
S
WOODY MOUNTAIN WELLS
® LAKE MARY WELLS

5a..,
..e,
l5-
2
Ar-
,,Ac.
,pA
..aeO
,Ace
dS
e, -
-e .n
rea
.aA
.e u
s
Aoc
adon
Of ,
yaoe
e.A
d: A
ndm
Sea
on
fon
Figu
re3
INN
ER
BA
SIN
HY
DR
OG
EO
LO
GI
CA
L F
EA
TIì
PES
EX
PLA
NA
TIO
N
SE
DIM
EN
TA
RY
RO
CK
S
P:71
-77-
1o
1-77
-1s.
eo ,e
e,.,
.. ..,
. eee
,v,e
IGN
EO
US
RO
CK
S
oOj
Ell=
nSk
eeA
>.a
.e.n
y.:,,
Mac
.n...
oeeW
gun
s, b
e_ca
Slap
sI...
.,...
e
Cae
ee
co, e
...e
e. ,,
,.,sl
a,.e
-- a
. --
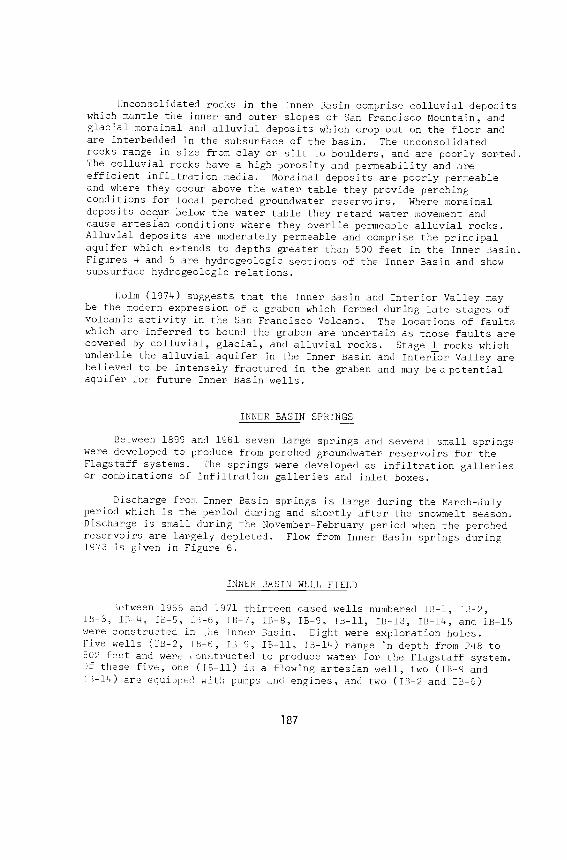
Unconsolidated rocks in the Inner Basin comprise colluvial depositswhich mantle the inner and outer slopes of San Francisco Mountain, andglacial morainal and alluvial deposits which crop out on the floor andare interbedded in the subsurface of the basin. The unconsolidatedrocks range in size from clay or silt to boulders, and are poorly sorted.The colluvial rocks have a high porosity and permeability and areefficient infiltration media. Morainal deposits are poorly permeableand where they occur above the water table they provide perchingconditions for local perched groundwater reservoirs. Where morainaldeposits occur below the water table they retard water movement andcause artesian conditions where they overlie permeable alluvial rocks.Alluvial deposits are moderately permeable and comprise the principalaquifer which extends to depths greater than 500 feet in the Inner Basin.Figures 4 and 5 are hydrogeologic sections of the Inner Basin and showsubsurface hydrogeologic relations.
Holm (1974) suggests that the Inner Basin and Interior Valley maybe the modern expression of a graben which formed during late stages ofvolcanic activity in the San Francisco Volcano. The locations of faultswhich are inferred to bound the graben are uncertain as those faults arecovered by colluvial, glacial, and alluvial rocks. Stage 1 rocks whichunderlie the alluvial aquifer in the Inner Basin and Interior Valley arebelieved to be intensely fractured in the graben and may be a potentialaquifer for future Inner Basin wells.
INNER BASIN SPRINGS
Between 1899 and 1961 seven large springs and several small springswere developed to produce from perched groundwater reservoirs for theFlagstaff systems. The springs were developed as infiltration galleriesor combinations of infiltration galleries and inlet boxes.
Discharge from Inner Basin springs is large during the March -Julyperiod which is the period during and shortly after the snowmelt season.Discharge is small during the November - February period when the perchedreservoirs are largely depleted. Flow from Inner Basin springs during1973 is given in Figure 6.
INNER BASIN WELL FIELD
Between 1966 and 1971 thirteen cased wells numbered IB -1, IB -2,IB -3, IB -4, IB -5, IB -6, IB -7, IB -8, IB -9, IB -11, IB -13, IB -14, and IB -15were constructed in the Inner Basin. Eight were exploration holes.Five wells (19 -2, IB -6, IB -9, IB -li, IB -14) range in depth from 248 to502 feet and were constructed to produce water for the Flagstaff system.Of these five, one (IB -11) is a flowing artesian well, two (TB-9 and
IB -14) are equipped with pumps and engines, and two (IB -2 and IB -6)
187
..oe
Naeo
,ouv
A
f.-
I
I..
11!!,
wan
11111lÍ111111111,111::,;11
SEMI. ft £RT ROCA,
r7'17;--1
188
TIBure
NTOROOLOLOGICAL AND GEOMAGNETICSECTIONS r,riÑisrft BASIN

1150
0D
'D
ora
-110
00_
f,y C
are
Rid
ge
--- -
i0.y
y
._--
-_--
(gm
x
m Ia
_
IOO
C4
-̀ ' ---'
v!.
I6-1
4I Q
- - - s3
' t̀o ,
-
90?'
J
=V
.(1
6b\
`O
mr
___
KO
OU
)a
' H``
I1iii
Sug
arlo
af_ -9
006
=_v
=T
'Iir
(III
Ì M
il
ó0O
0 t:.:4
,.,
MC
I
EX
PLA
NA
TIO
N
SE
DIM
EN
TA
RY
RO
CK
S
Co.
qi a
ga g
lac
4 t o
n m
ar a
i lw
ld.pasib
Sno
ona.
Spr
ing
glac
iatio
n m
orai
nal d
epos
it.
UM
ltt.n
ntld
nd a
loci
al -
flux
l and
411
,51,
1 to
il., t
onda
,aM
gra
vels
, did
acia
l mor
aina
l dep
osita
, and
old
ercW
lagi
am
Gol
ogic
con
tact
ldco
l d r
aire
iMel
InlI.
I
Sta
ticso
le. 1
.41,
Sep
t 197
3
Inne
r !lo
gin
wel
l
ME
EE
i/A--
1SK
I=
I
IGN
EO
US
RO
CK
S
Sug
arlo
af a
sh
Sug
arlo
af r
llyol
ita
Sla
gs 5
ana
gert
., tty
odac
ite, a
nd m
ltor
bass
o..
Sta
g. 2
. 3, e
nd 4
ntty
olif.
, rky
N.g
lt,, d
och,
, and
min
or b
ruta
l.
Cor
e R
idge
com
plex
; ved
iffer
.ntia
tul
Intr
usiv
e ra
ck.,
bris
tle, a
nd fl
op
Sta
g.I
pde5
lt., p
yroc
lo.ti
c., o
d br
istle
o,d
_
..'r
010
0020
0030
00 4
000
5000
1ut1
11u1
11g1
111u
1111
111
SC
ALE
IN F
EE
T
rig-1
-7.4
5
NY
OR
OG
EO
LOG
IC S
EC
TIO
N 0
-0'
INN
ER
BA
SIN
AN
D IN
TE
RIO
R V
ALL
EY

2800
2300
2400
w 2
200
I- ZT
OC
O
crIBx
w a N E
fAz 0 -
13A
J (D Z 1
200
0 W 1
0} K
4C
w
c:c
300
200
"Nev
iS
L15
202
+`2
U5
10M
R52
025
0E 5 20
25
510
AUGUST
SEPTE
OCTOB
uM
BE
R5v
20 2
55
1015
20
255
IC15
20 25
10
15
NO
VE
MB
ER
050(
0004
,r
r,R
uI
'
I
UC
TIC
N
. INN
EIM
INII
IME
NN
EE
nggnq
Iu nWqq
ILI
;
1 , i_
I
T. IN
IIIII
RlNi
l ifiRO
DQ
Tf
I
.
ug1
III
.
linN
AT
ER
PR
OF
RO
M IB
-9 N
DIB
-14'
1
qI
III.In
I.I.
IIIIII
=I=
I.
IIIIII,
71r-
Rno
I.= II
IA
NE
W,
' '.'4
3`°
!.nu
iqu
:14I
..arg
AIN
®I
m11
:111
1.11
1111
1:11
1111
1117
8III
IIIR
II..ti
4:I: n
qIS
i'úI
I:::e
uql: I
!II
II..
n°q0
,111
11=
:IE
MI
I..l
.1III
IIIW
A
HN
RR
ME
EII:
.1IM
EL
I:II
IIII
III
I=ci
ILII
I:::I
ttia
Rm
`LI
I
1-r,
4N
WA
I!-,
J ú"I
iñiii
üilii
íiiiii
iiiiii
íiiiii
iuii i''
IIII
IiII
IIII
IIII
MO
IIII
IIII
I:II
IIII
:IIM
IRI:
.:..
FE
SR
UA
Rv
MA
RC
N10
10 2
0 25
5 0
15 2
0 25
510
15 2
0 25
510
15 2
0 25
510
15 2
0 25
S10
1520
25
S10
IS 2
0 25
S10
15 2
0 25
S10
I5 2
0 2
AP
RIL
MA
YJU
NE
JULY
AU
GU
ST
SE
PT
EM
BE
RO
CT
OB
ER
NO
VE
MB
ER
DE
CE
MB
ER
1973
Figure 6
25.
2800
2.00
2200
2000
000
400
200
1000
800
300
400
200
HY
DR
OG
RA
PH
OF
PR
OD
UC
TIO
N F
RO
MIN
NE
R B
AS
IN S
PR
ING
S A
ND
WE
LLS
are not presently (1974) equipped. The locations of Inner Basin wellsare shown on Figure 3.
Inner Basin wells have been used in all summers of the past eightyears when municipal water demand was high and when flow from InnerBasin springs was low. The season in which water can be produced fromInner Basin wells is limited due to difficult access. Roads to theInner Basin are usually closed by snow in October or November and re-main closed until mid May or early June. Discharge from Inner Basinwells during 1973 is shown in Figure 6.
LONG -TERM PUMP TEST
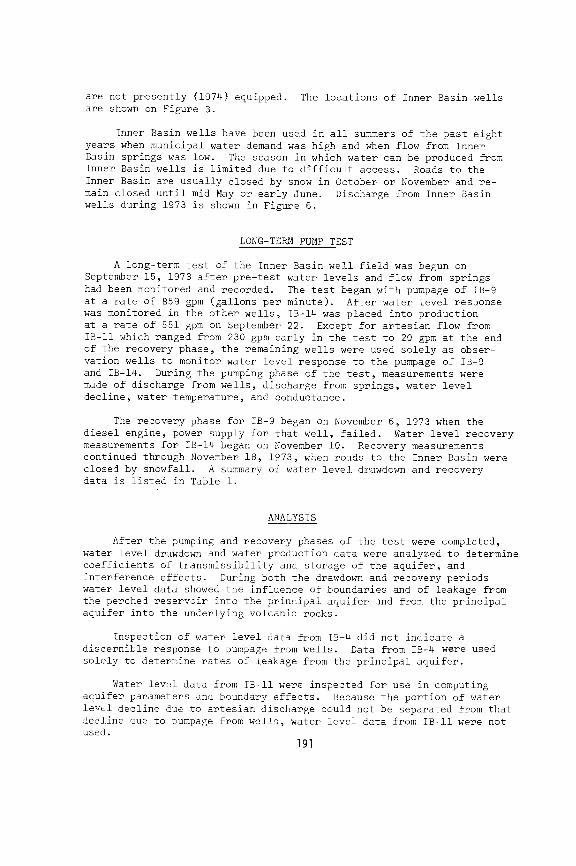
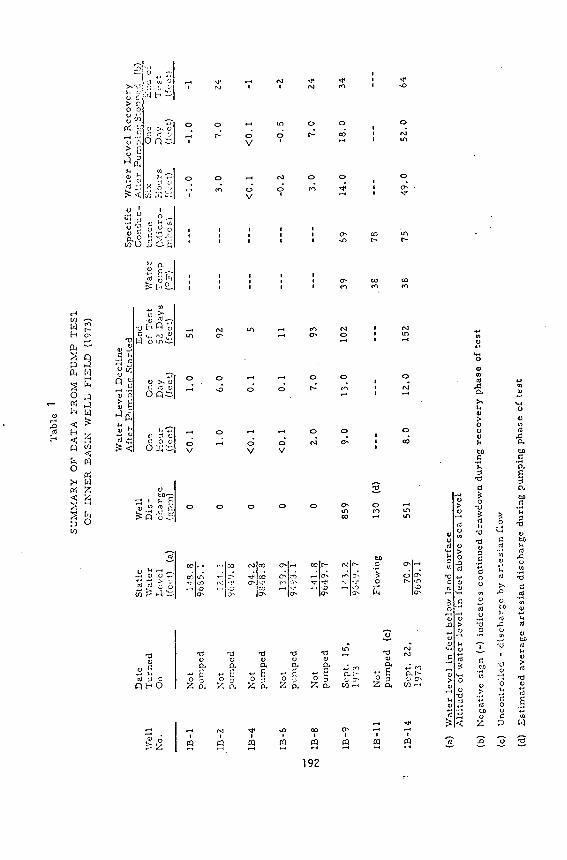
A long -term test of the Inner Basin well field was begun onSeptember 15, 1973 after pre -test water levels and flow from springshad been monitored and recorded. The test began with pumpage of IB -9at a rate of 859 gpm (gallons per minute). After water level responsewas monitored in the other wells, IB -14 was placed into productionat a rate of 551 gpm on September 22. Except for artesian flow fromIB -11 which ranged from 230 gpm early in the test to 20 gpm at the endof the recovery phase, the remaining wells were used solely as obser-vation wells to monitor water level response to the pumpage of IB -9and IB -14. During the pumping phase of the test, measurements weremade of discharge from wells, discharge from springs, water leveldecline, water temperature, and conductance.
The recovery phase for IB -9 began on November 6, 1973 when thediesel engine, power supply for that well, failed. Water level recoverymeasurements for IB -14 began on November 10. Recovery measurementscontinued through November 18, 1973, when roads to the Inner Basin wereclosed by snowfall. A summary of water level drawdown and recoverydata is listed in Table 1.
ANALYSIS
After the pumping and recovery phases of the test were completed,water level drawdown and water production data were analyzed to determinecoefficients of transmissibility and storage of the aquifer, andinterference effects. During both the drawdown and recovery periodswater level data showed the influence of boundaries and of leakage fromthe perched reservoir into the principal aquifer and from the principalaquifer into the underlying volcanic rocks.
Inspection of water level data from IB -4 did not indicate adiscernible response to pumpage from wells. Data from IB -4 were usedsolely to determine rates of leakage from the principal aquifer.
Water level data from IB -11 were inspected for use in computingaquifer parameters and boundary effects. Because the portion of waterlevel decline due to artesian discharge could not be separated from thatdecline due to pumpage from wells, water level data from IB -11 were notused.
191
Tab
le 1
SUM
MA
RY
OF
DA
TA
FR
OM
PU
MP
TE
S1O
F IN
NE
R B
ASI
N W
EL
L F
IEL
D (
1973
)
Wat
er L
evel
Dec
line
Aft
er P
impi
ng S
tart
edSp
ecif
icW
ater
Lev
el R
ecov
ery
Dat
eSt
atic
Wel
lE
ndC
ondu
c-A
fter
Pum
nint
Sto
nned
(b)
Wel
lT
urne
dW
ater
Dis
-O
neO
neof
Tes
tW
ater
tanc
eSi
xO
neE
nd o
fN
o.O
nL
evel
char
geH
our
Day
52 D
ays
Tem
p(M
icro
-H
ours
Day
Tes
t(f
eet)
(a)
(g m
)(f
eet)
(fee
t)(f
eet)
( °F
)m
hos)
(fee
t)(feet)
(feet)
IB -
1N
otpu
mpe
d14
3.8
0<
0.1
1.0
51-1
.0-1
.0-1
9635
.1
IB -
2N
otpu
mpe
d13
.1.1
01.
06.
092
3.0
7.0
24
9649
.8
113-
4N
otpu
mpe
d94
.20
<0.
10.
15
<0.
1<
0.1
-i98
48.8
IB -
6N
otpu
mpe
d13
9.9
0<
0.1
0.1
11-0
.2-0
.5-2
9=19
3.1
Ñ I
B -
8N
otpu
mpe
d14
1.8
02.
07.
093
3.0
7.0
24
9649
.7
1B -
9Se
pt. 1
5,19
7314
3.2
859
9.0
13.0
102
3969
14.0
18.0
3496
49.7
IB -
11N
otpu
mpe
d(c
)Fl
owin
g13
0(d
)38
78
IB -
14Se
pt. 2
2,19
7370
.955
18.
012
.015
238
7549
.052
.064
9659
.1
(a)
Wat
er le
vel i
n fe
et b
elow
land
sur
face
Alti
tude
of
wat
er le
vel i
n fe
et a
bove
sea
leve
l
(b)
Neg
ativ
e si
gn (
-)
indi
cate
s co
ntin
ued
draw
dow
n du
ring
rec
over
y ph
ase
of te
st
(c)
Unc
ontr
olle
d -
disc
harg
e by
art
esia
n fl
ow
(d)
Est
imat
ed a
vera
ge a
rtes
ian
disc
harg
e du
ring
pum
ping
pha
se o
f te
st
COEFFICIENT OF TRANSMISSIBILITY
Drawdown and recovery data were used to compute transmissibilityusing the methods of Theis (1935)and Jacob (1950). The graphic plotsof drawdown and recovery data indicated a series of line segments,each of which was used to compute transmissibility. The computedvalues ranged from 2,900 to 328,000 gpd /ft (gallons per day per foot).The early drawdown and recovery data indicated transmissibility valueswhich are larger than those indicated by later data. The largestvalues are attributed to the influence of high permeability pathsprovided by interbeds of alluvial deposits between wells. The smallestvalues are attributed to the influence of boundaries.
The most reliable transmissibility values are believed to be thosedetermined using the latest drawdown and recovery data collected priorto the time when the influence of boundaries became significant.
COEFFICIENT OF STORAGE
Coefficient of storage of the principal aquifer in the Inner Basinwas computed from drawdown and recovery data using both the Theis andJacob methods of analysis. Only data from observation wells were usedin computations for coefficient of storage. The computed values rangedfrom 0.2 to 22 percent using data from IB -1, IB -2, IB -6, IB -8, andIB -14.
Early drawdown and recovery data, which indicated large trans-missibility values, usually indicated the smallest coefficient ofstorage values. Late data, which were influenced by boundaries, alsoindicated small coefficient of storage values. Drawdown data which werejudged most reliable for computing transmissibility were also believedto be most reliable for use in computing coefficient of storage.
DISCUSSION AND SUMMARY
The areal distribution of aquifer parameters indicates that averagevalues of coefficient of transmissibility and storage are greatest inthe southwestern part of the aquifer in the vicinity of wells IB -1,IB -2, IB -8, and IB -9 and are less in the central part in the vicinityof IB -6 and IB -14. Average transmissibility and coefficient of storagein the northwestern part of the aquifer are not known; however, no waterlevel decline in IB -4 in response to pumpage of IB -9 and IB -14 indicatesthat the transmissibility of the aquifer near IB -4 is small. Theseareal variations of aquifer parameters are interpreted to indicate thatthe abundance of interbeds of glacial morainal deposits is less in thesoutheastern part and is greater in the central and northwestern partof the aquifer.
193
Average coefficients of transmissibility and storage of theprincipal aquifer are estimated to be 14,000 gpd /ft and 0.08 respectively.
INFLUENCE OF BOUNDARIES
The response of water levels to pumpage from wells in the InnerBasin aquifer is influenced by aquifer boundaries where the alluvialrocks abut less permeable volcanic rocks. Projected locations of the
Inner Basin aquifer boundaries are shown on Figure 7.
In the analysis of drawdown for the principal aquifer, image wells
for IB -9 and IB -14 were located across the southeast, southwest, andnorthwest boundaries. Analysis using the theory of images indicated:
1) The influence of the southeast boundary was an increasedrate of drawdown in the southeastern part of the aquifer and increasedrates of drawdown in wells IB -1, IB -2, IB -8, IB -9, and IB -14.
2) The duration of the Inner Basin aquifer test was not sufficientfor the southwest aquifer boundary to influence rates of drawdown. With
longer periods of pumping this boundary would cause rates of drawdownin the southwestern part of the aquifer to increase.
3) The northwest boundary caused an increased rate of drawdown inthe northwestern margin of the aquifer but did not influence water levels
in wells. With longer periods of pumping the influence of this boundarywould cause increased rates of drawdown in IB -4, IB -6, and IB -14.
OCCURRENCE AND FLOW PATTERN
The average quantity of water which enters the Inner Basin aquifereach year as recharge is equal to the average amount of water whichleaves the Inner Basin as discharge from springs and wells, fromevapotranspiration and sublimation, and from leakage.
INFLOW
The amount of water available for recharge to the Inner Basin aquifersystem is equal to the average annual precipitation in the watershed area.The area of the Inner Basin watershed is 2,420 acres and is shown onFigure 7. Average annual precipitation for the Inner Basin watershedis estimated to be 36.4 inches, based on the 1957 -1973 average; halfof this precipitation occurs as winter snowfall. Potential recharge isapproximately 7,350 acre -feet per year. Recharge is believed to occur
chiefly from infiltration from snowmelt.
194

SeE
Sec
3.1
EX
PLA
NA
TIO
N
Gro
undw
ater
con
tour
, Das
hed
Wne
.e-e
5oo_
__
Inde
o,ne
. (N
SL)
, Sep
tem
ber
1913
Inne
r B
asin
Wel
l, S
ho.m
ç A
ptitu
de O
f98
50W
ater
Lev
el
Inne
r B
onn
Spr
tna,
Sho
..na
App
oat.g
fe07
0A
ltitu
de O
f Gro
und
Sur
face
Bou
ndar
y O
f Allu
vial
Aqu
ifer
Bou
ndar
y O
f Inn
er B
asin
Wat
ersh
ed
Fig
ure
7
GR
OU
ND
WA
TE
R E
LEV
AT
ION
IN A
LLU
VIA
L A
QU
IFE
R
CIRCULATION AND STORAGE
Groundwater contours of the static water level conditions in theprincipal aquifer are shown on Figure 7. The general pattern ofgroundwater flow is from recharge areas at the margins of the aquifertoward natural discharge areas below and northeast of the well field.
Groundwater storage in the principal aquifer is restricted becausethe areal extent and the depth of the aquifer are limited,because theaquifer media are poorly sorted, and because the interbedded morainaldeposits yield only meager amounts of water. The average quantity ofrecoverable water in the principal aquifer was estimated using computedspecific yield and estimated aquifer volume to be 8,000 acre -feet.Additional quantities of recoverable water may occur in fracturedstage 1 volcanic rocks below the Inner Basin and Interior Valley.
DISCHARGE
Outflow from the Inner Basin comprises evaporation, transpiration,sublimation from the winter snowpack,discharge from springs and wells,and leakage from the principal aquifer to the underlying volcanics.Discharge from evaporation has not been estimated but is believed tobe large. Outflow via transpiration and sublimation is estimatedfrom analysis of data in an unpublished report by the U. S. Bureau
of Reclamation to be 3,200 acre -feet per year. Average discharge from
springs from 1951 through 1973 was 445 acre -feet per year. Averagedischarge from wells from 1969 through 1973 was 440 acre -feet per year.Leakage from the principal aquifer into the underlying fracturedvolcanic rocks was estimated from average rate of water level declinein wells which are not influenced by pumpage of other Inner Basin wells,and from estimates of aquifer volume and specific yield and is approxi-mately 1,150 acre -feet. Estimated inflow and outflow are summarized
below:
Average Annual Inflow from Precipitation = 7,350 acre -feet
Average Annual Outflow
From Wells = 440 acre -feet
From Springs = 445 acre -feet
From Transpiration and Sublimation = 3,200 acre -feet
Leakage from Principal Aquifer = 1,150 acre -feet
Evaporation = Unknown
Average Annual Outflow (incomplete) = 5,235 acre -feet
196

The difference between the inflow and outflow values given aboveis 2,115 acre -feet and is approximately equal to evaporation.
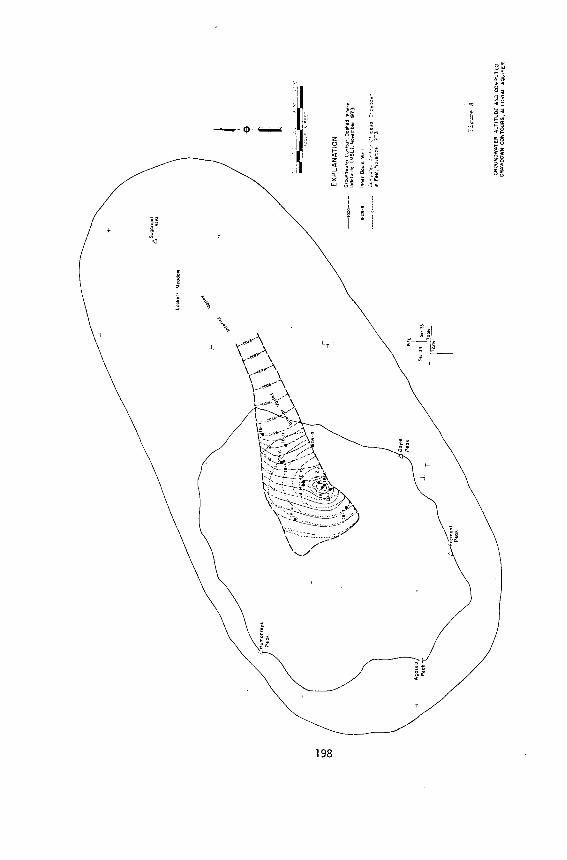
WATER LEVEL CONTOURS
Figure 8 shows the composite effect of the pumping wells and ofboundaries on water levels in the principal aquifer at the conclusionof the pumping phase of the test. The positions of the drawdown lineswere computed using estimated average aquifer parameters of 14,000gpd /ft and 0.08 for coefficients of transmissibility and storage.
INFLUENCE OF POMPAGE FROM WELLS ON DISCHARGE FROM SPRINGS
Analysis of the aquifer systems in the Inner Basin indicates thatsprings issue from perched reservoirs which occur in the walls of theInner Basin, beyond the margins of the principal aquifer, or issuefrom perched reservoirs which lie above the water table in the principalaquifer; hence, rates of leakage are not increased by a lowering ofwater levels in the principal aquifer. This conclusion is supportedby records of discharge from springs in years prior to development ofwells and in years when Inner Basin wells were pumped. Inspection ofFigure 6 indicates that the decline in rate of discharge from springswas not accelerated through the period in which the Inner Basin wellswere pumped.
CONCLUSIONS
The salient conclusions from the Inner Basin water resourcesstudy are:
1) The average coefficients of transmissibility and of storageof the principal aquifer are approximately 14,000 gpd /ft and 0.08respectively.
2) The influence of aquifer boundaries increased rates of draw -down of water levels in the Inner Basin well field.
3) Inner Basin springs issue from perched reservoirs. Pumpageof Inner Basin wells does not influence discharge from Inner Basinsprings.
4) The quantity of recharge water to the Inner Basin aquifersystem is greater than the average yield from springs and wells. Theaverage quantity of water in storage in the principal aquifer is8,000 acre -feet.
5) A large amount of water is lost from the Inner Basin aquifersystem via leakage into underlying fractured volcanic rocks. A part ofthe water lost via leakage could be intercepted by pumpage from a wellconstructed in the Interior Valley.
197
-
198

REFERENCES CITED
Holm, R. F., 1974, Volcanic Geology of the Inner Basin, San FranciscoPeaks Volcano, Arizona (abs.), in Abstracts with Programs, RockyMountain Section 27th Annual Meeting, Geol. Soc. Amer., p. 448.
Jacob, C. E., 1950, Flow of Groundwater, in Rouse, Hunter (ed.),Engineering Hydraulics, Chap. 5: New York, John Wiley & Sons,p. 321 -386.
Robinson, H. H., 1913, The San Franciscan Volcanic Field, Arizona:U. S. Geol. Survey Prof, Paper 76, 213 p.
Theis, C. V., 1935, The Relation Between the Lowering of the PiezometricSurface and the Rate and Duration of Discharge of a Well UsingGroundwater Storage: Am. Geophys. Union Trans., p. 519 -524.
199