Embed Size (px)
Citation preview
8/6/2019 Woodland Bio Index
http://slidepdf.com/reader/full/woodland-bio-index 1/24
Woodland biodiversity:Expanding our hor izons
8/6/2019 Woodland Bio Index
http://slidepdf.com/reader/full/woodland-bio-index 2/24
Introduction 3
Key features of woodland biodiversity 4
Ancient woodland 5
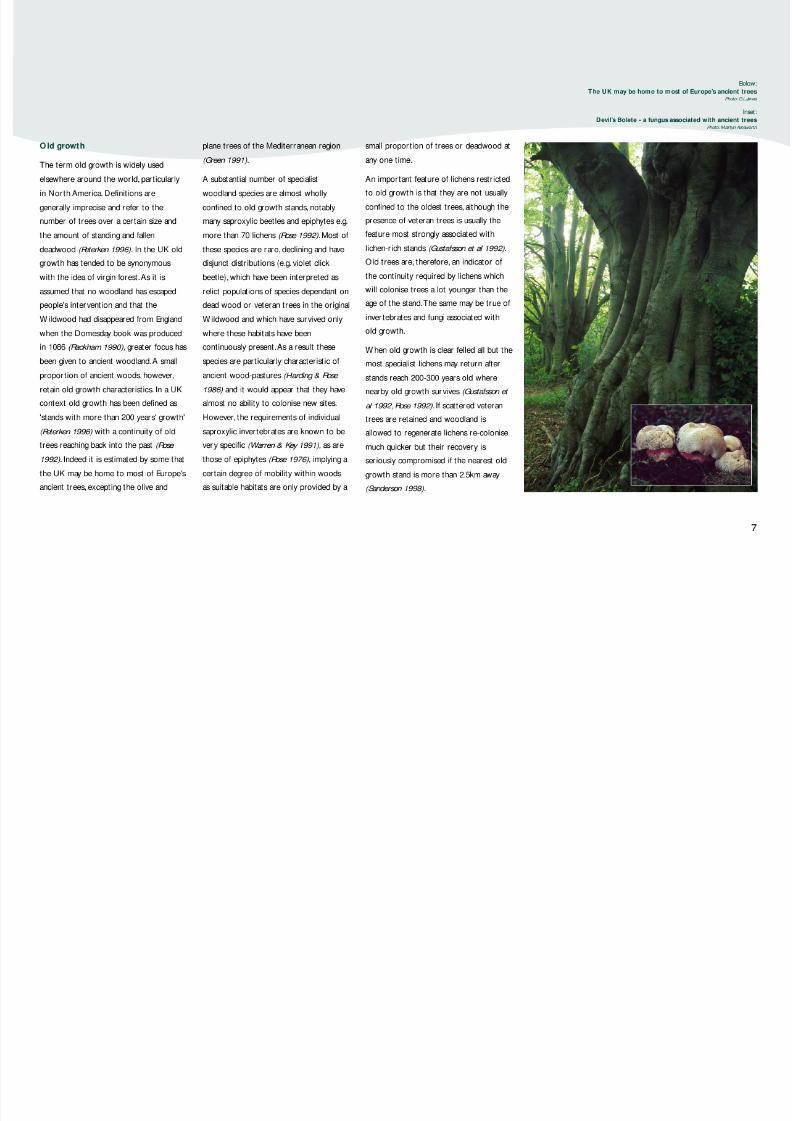
Old growth 7
Size 8
Core Area 10
Woodland adjacent to semi-natural habitats 12
Density of semi-natural habitats 13
Linkage of open ground habitats 14
Measures of woodland biodiversity potential 16
Corresponding strategies for improving biodiversity 17
Developing our plans and focusing our action 19
References 21
Contents
2
Photo: Richard Smithers
8/6/2019 Woodland Bio Index
http://slidepdf.com/reader/full/woodland-bio-index 3/24
In Keeping woodland alive - the Woodland Trust's
Plan for Action , we set out the contemporary
challenges facing woodland in the UK and
identify priorities to guide our work over thecoming years, including our wish to see the
biodiversity of woods improved and restored.
But what does this mean and how are we
going to measure success?
In Seeing the woods for the trees - the Woodland
Trust's approach to conservation , we state that
we value all forms of life yet acknowledge that
with so many species alive today our
knowledge of the natural world will always be
limited.We also recognise that species evolve
in response to change. Monitor ing total
species abundance as a means of assessing
improvements in woodland biodiversity is,therefore, impractical and to focus on any one
species or group of species as a measure of
overall biodiversity is likely to be misleading
(Simberloff 1998, Harvey 1999).
What is needed is a cost-effective means
of measuring improvements in woodland
biodiversity and the relative merits of possible
future activities relevant to:
I All habitats and species.
I Existing habitats and habitatcreation.
I Landscapes and individual sites.
We are not alone in seeking a pragmatic
solution.For example, the Joint Nature
Conservation Committee is co-ordinating
development of condition monitoring for SSSIs
(for woodlands,see Kirby 1999).
As a first step we have identified those site
features which are major determinants of value
to woodland biodiversity.We have then sought
to encompass them in the development of
what we believe to be a series of simple yet
meaningful measures.These are intended to
direct broad action, they are not designed to
answer all questions and there will still be a
need to consider specifics and practicalities
in reaching decisions,particularly at
a site level.
Introduction
3
8/6/2019 Woodland Bio Index
http://slidepdf.com/reader/full/woodland-bio-index 4/24
Key features for woodland biodiversity
4
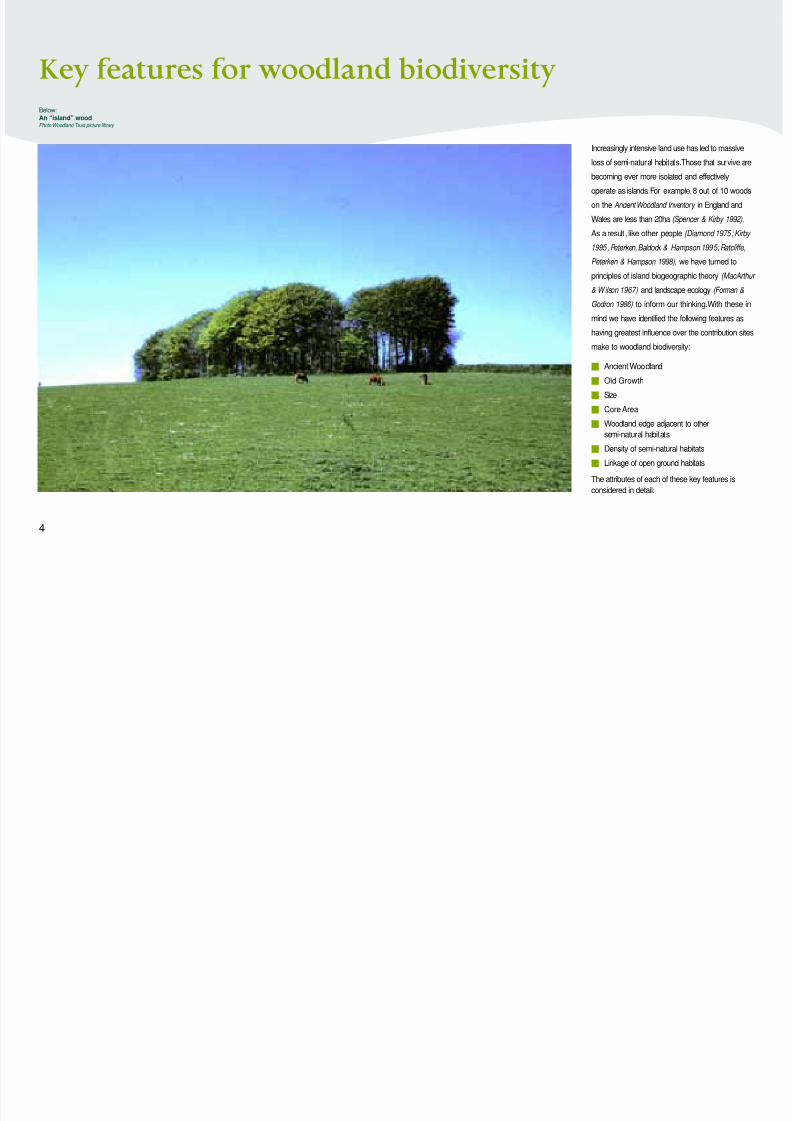
Below:An “island” woodPhoto:Woodland Trust picture library
Increasingly intensive land use has led to massive
loss of semi-natural habitats.Those that survive are
becoming ever more isolated and effectively
operate as islands.For example,8 out of 10 woods
on the Ancient Woodland Inventory in England and
Wales are less than 20ha (Spencer & Kirby 1992).
As a result, like other people (Diamond 1975; Kirby
1995, Peterken,Baldock & Hampson 1995; Ratcliffe,
Peterken & Hampson 1998), we have turned to
principles of island biogeographic theory (MacArthur
& Wilson 1967) and landscape ecology (Forman &Godron 1986) to inform our thinking.With these in
mind we have identified the following features as
having greatest influence over the contribution sites
make to woodland biodiversity:
I Ancient Woodland
I Old Growth
I Size
I Core Area
I Woodland edge adjacent to other
semi-natural habitats
I Density of semi-natural habitats
I Linkage of open ground habitats
The attributes of each of these key features is
considered in detail:
8/6/2019 Woodland Bio Index
http://slidepdf.com/reader/full/woodland-bio-index 5/24
8/6/2019 Woodland Bio Index
http://slidepdf.com/reader/full/woodland-bio-index 6/24
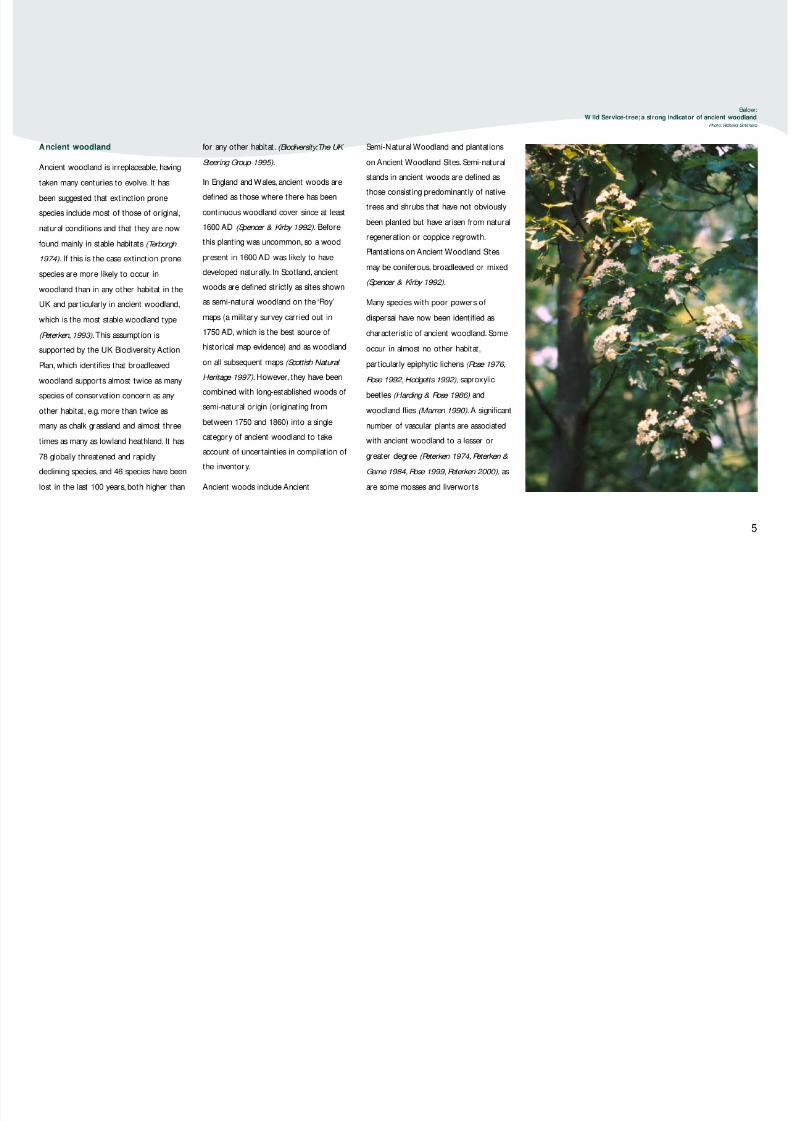
(Ratcliffe 1968, Hodgetts 1992), slugs and
snails (Boycott 1934), spiders, larger moths
and butterflies (Marren 1990).The
presence of various other species,
including the dormouse (Bright 1996), can
also be correlated more weakly with
ancient woodland.In addition there are
suggestions that some fungi may be
specific to ancient woodland (Peterken,
Baldock & Hampson 1995, Hodgetts 1996).
While plantations on Ancient Woodland
Sites include stands planted so closely
that any semi-natural understorey is
suppressed, these woods often continue
to support some species characteristic of
ancient woodland,particularly along rides,
ride margins and in glades as well as
dormant within the seed bank (Radford
1998).
It has been suggested that many
woodland species have a wider ecological
amplitude in the uplands (Peterken 1996)
and that the concept of ancient woodland
has less bearing on the value of woods to
biodiversity as one travels north and
west. It is undoubtedly true that some
vascular plants indicative of ancient
woodland in lowland England are not so
restr icted in the uplands. However, in
other parts of the European north
temperate zone as much as a third of the
flora has been shown to have limited
powers of dispersal and tends to be found
mainly in ancient woods.Despite a lack of
detailed studies, it therefore seems
improbable that upland Britain will be
wholly different and likely that a significant
minority of vascular plants will be
restricted to ancient woodland (Peterken,
Baldock & Hampson 1995). Study of the
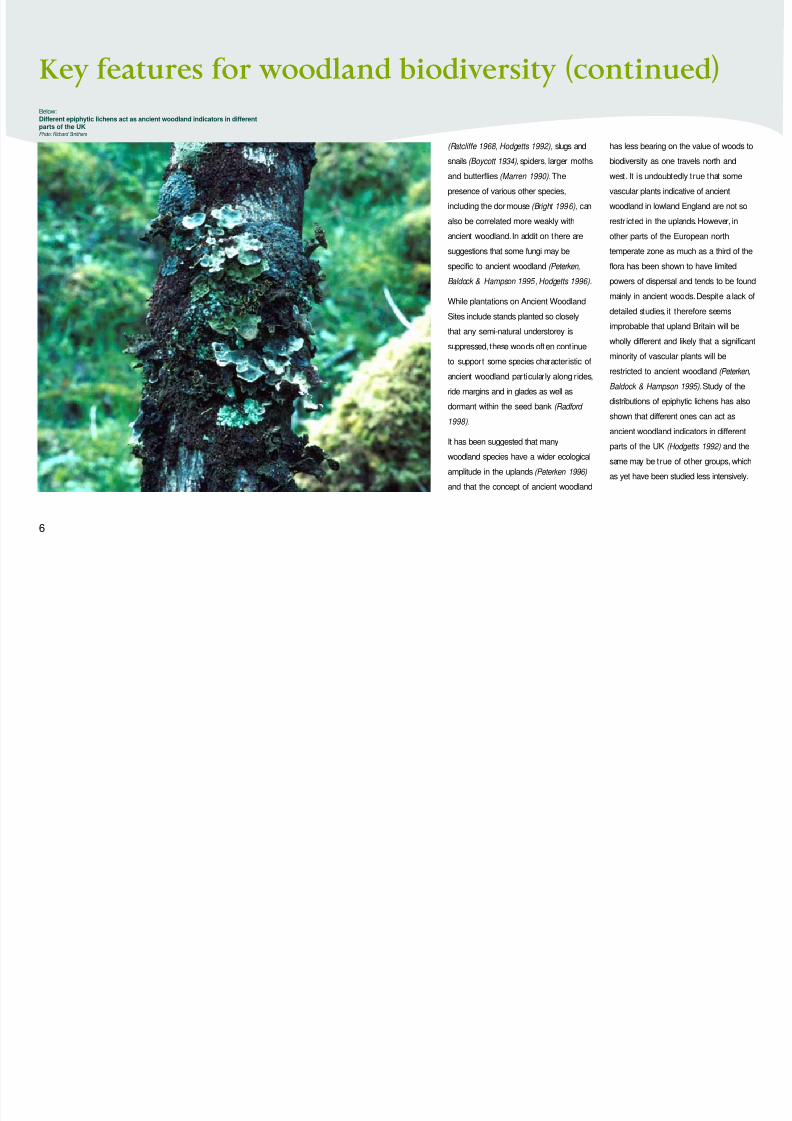
distributions of epiphytic lichens has also
shown that different ones can act as
ancient woodland indicators in different
parts of the UK (Hodgetts 1992) and the
same may be true of other groups,which
as yet have been studied less intensively.
Key features for woodland biodiversity (continued)
6
Below:Different epiphytic lichens act as ancient woodland indicators in differentparts of the UKPhoto: Richard Smithers
8/6/2019 Woodland Bio Index
http://slidepdf.com/reader/full/woodland-bio-index 7/24
8/6/2019 Woodland Bio Index
http://slidepdf.com/reader/full/woodland-bio-index 8/24
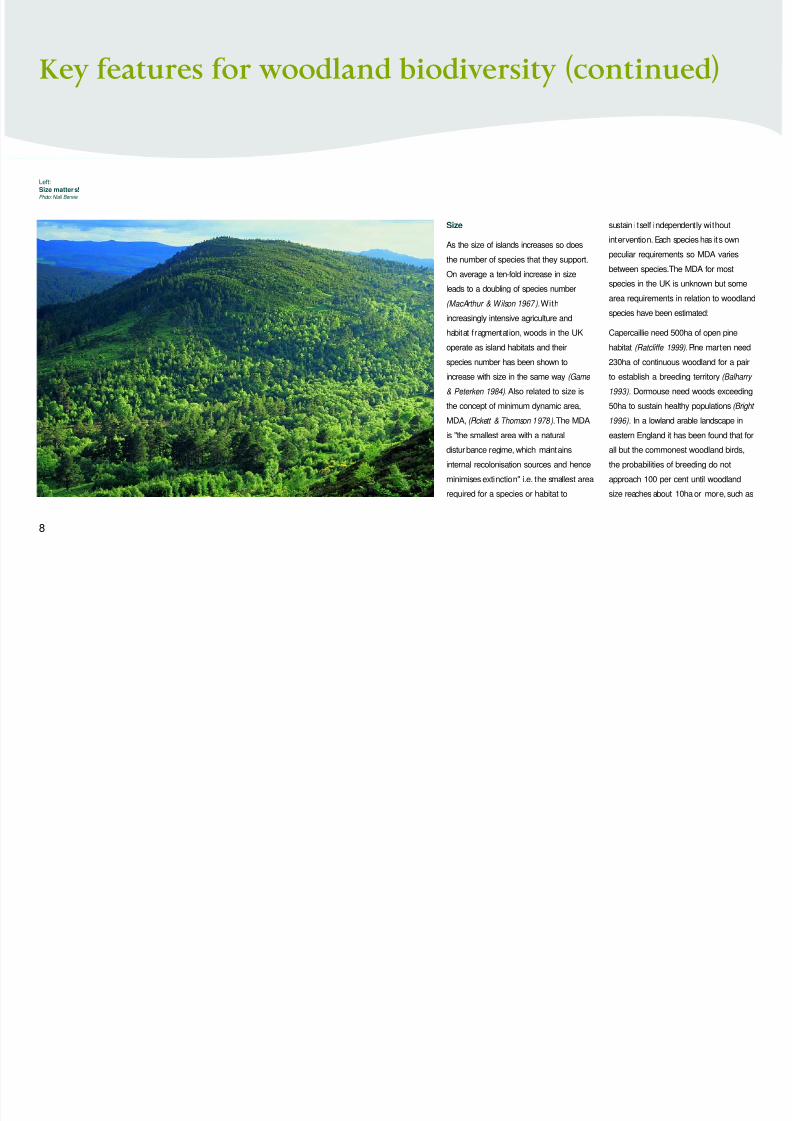
Size
As the size of islands increases so does
the number of species that they support.
On average a ten-fold increase in size
leads to a doubling of species number
(MacArthur & Wilson 1967).With
increasingly intensive agriculture and
habitat fragmentation, woods in the UK
operate as island habitats and their
species number has been shown to
increase with size in the same way (Game
& Peterken 1984). Also related to size is
the concept of minimum dynamic area,
MDA, (Pickett & Thomson 1978).The MDA
is "the smallest area with a natural
disturbance regime, which maintains
internal recolonisation sources and hence
minimises extinction" i.e. the smallest area
required for a species or habitat to
sustain itself independently without
intervention. Each species has its own
peculiar requirements so MDA varies
between species.The MDA for most
species in the UK is unknown but some
area requirements in relation to woodland
species have been estimated:
Capercaillie need 500ha of open pine
habitat (Ratcliffe 1999). Pine marten need
230ha of continuous woodland for a pair
to establish a breeding territory (Balharry
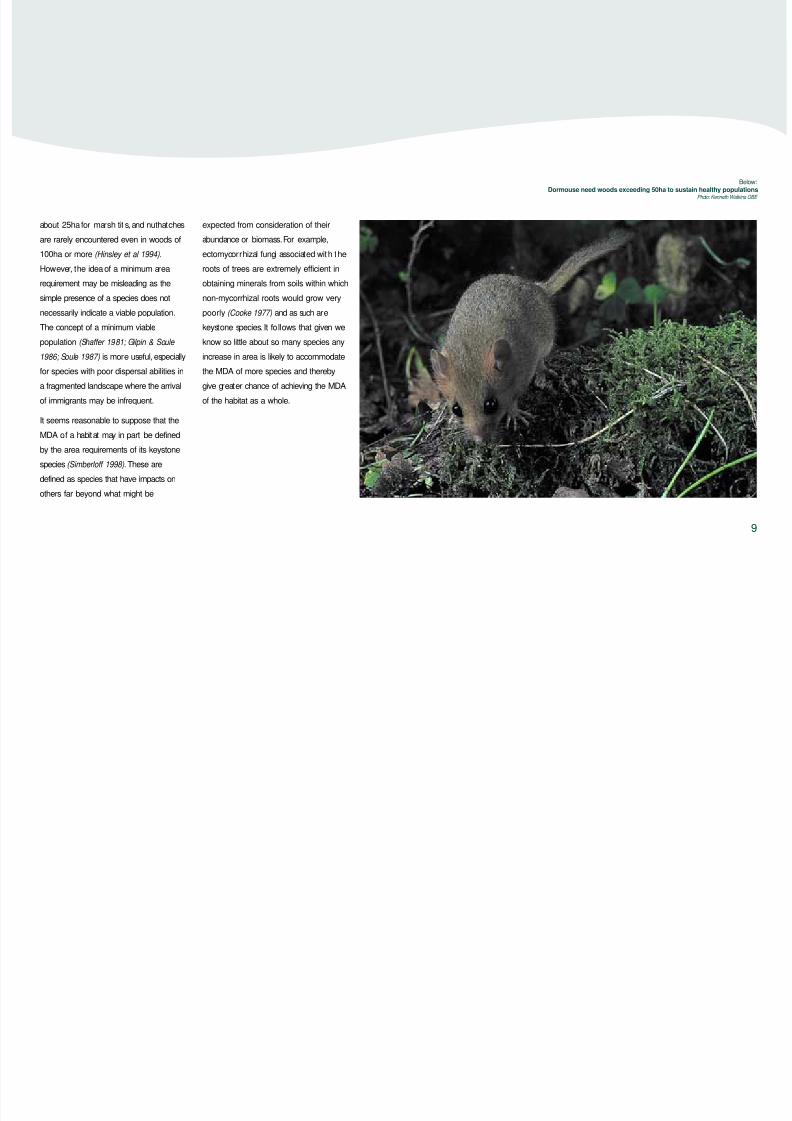
1993). Dormouse need woods exceeding
50ha to sustain healthy populations (Bright
1996). In a lowland arable landscape in
eastern England it has been found that for
all but the commonest woodland birds,
the probabilities of breeding do not
approach 100 per cent until woodland
size reaches about 10ha or more,such as
Key features for woodland biodiversity (continued)
8
Left:Size matters!
Photo: Niall Benvie
8/6/2019 Woodland Bio Index
http://slidepdf.com/reader/full/woodland-bio-index 9/24
about 25ha for marsh tits, and nuthatches
are rarely encountered even in woods of
100ha or more (Hinsley et al 1994).
However, the idea of a minimum area
requirement may be misleading as the
simple presence of a species does not
necessarily indicate a viable population.
The concept of a minimum viable
population (Shaffer 1981; Gilpin & Soule
1986; Soule 1987) is more useful, especially
for species with poor dispersal abilities in
a fragmented landscape where the arrival
of immigrants may be infrequent.
It seems reasonable to suppose that the
MDA of a habitat may in part be defined
by the area requirements of its keystone
species (Simberloff 1998). These are
defined as species that have impacts on
others far beyond what might be
expected from consideration of their
abundance or biomass.For example,
ectomycorrhizal fungi associated with the
roots of trees are extremely efficient in
obtaining minerals from soils within which
non-mycorrhizal roots would grow very
poorly (Cooke 1977) and as such are
keystone species. It follows that given we
know so little about so many species any
increase in area is likely to accommodate
the MDA of more species and thereby
give greater chance of achieving the MDA
of the habitat as a whole.
9
Below:Dormouse need woods exceeding 50ha to sustain healthy populations
Photo: Kenneth Watkins OBE
8/6/2019 Woodland Bio Index
http://slidepdf.com/reader/full/woodland-bio-index 10/24
Core Area
Although size is important, potential
confusion arises because it has also been
shown that given the same total area the
species abundance of woodland herbs
increases with the number of separate
individual woods (Game & Peterken 1984,
Peterken & Francis 1999). This is due to
the probability of different sites having
different soils suppor ting different plant
communities. Nevertheless, larger areas
contribute more to biodiversity, as this
finding does not take account of the
needs of other groups of organisms
which rely on larger areas of woodland,
or the potential for future extinction.
The concept of Core Area (Laurance &
Yensen 1991 & Laurance 1991) is
particularly helpful to understanding the
latter point. Habitat fragmentation leads
to an increase in the habitat edge to area
ratio. Consequently,plant and animal
populations are not only sub-divided,
they are increasingly exposed to
environmental impacts from outside the
site.These may take many forms.
Increasing wind speed,air temperature
and loss of humidity (McCollin 1998)
typify microclimate gradients. In the UK
environmental impacts associated with
intensive land use are undoubtedly of
greatest concern e.g. pollut ion and
pesticide drift.There is no significant
reduction in drift of pesticides into
woodland as compared with open arable
landscapes (Davis et al 1993). Serious
acute effects on plants,fungi and
invertebrates occur at least 10 metres
away and can occur at a distance of
more than 100 metres dependant on the
chemical being used and the method of
application (Cooke 1993).
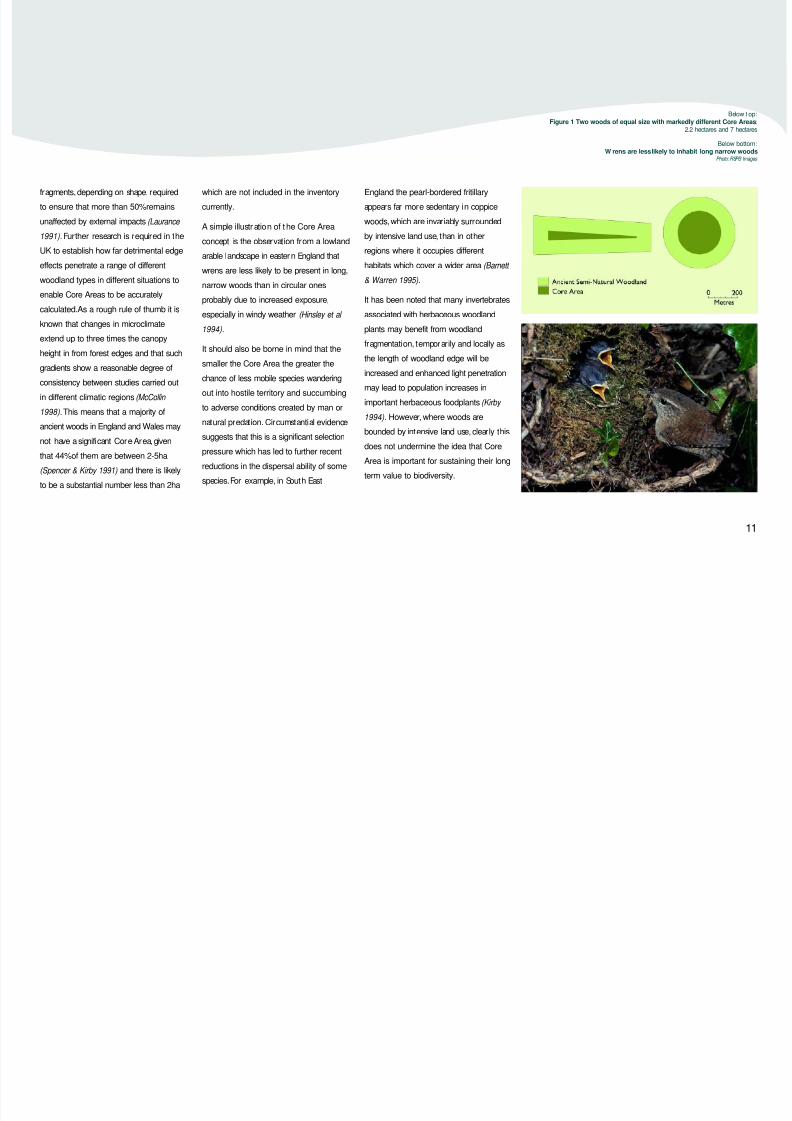
The Core Area of a woodland cannot
simply be defined by its woodland edge
to area ratio. It is also a product of its
shape,size,and distance to which edge
effects penetrate. If a wood's total area
and length of woodland edge are known
then a shape index (Paton 1975) can be
calculated,describing its deviation from a
circle, and together with an estimate of
the distance to which edge effects
penetrate can be used to determine the
Core Area (Laurance & Yensen 1991).
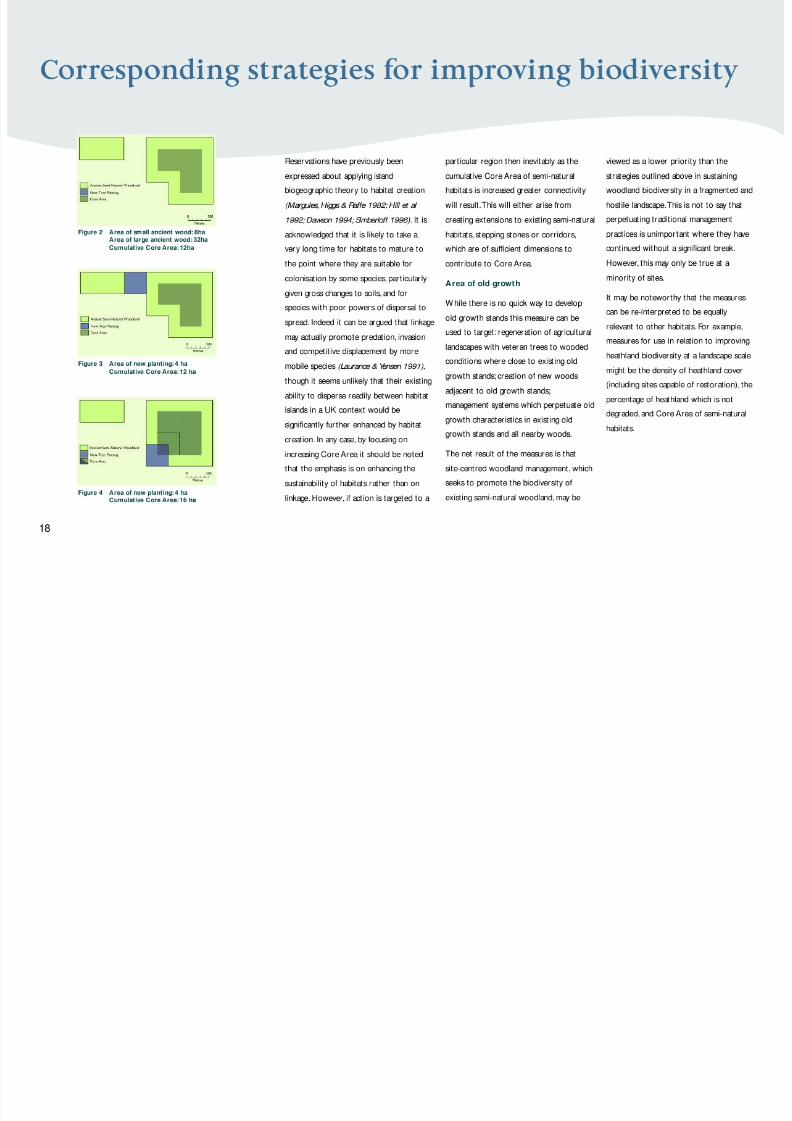
Figure 1 shows two woods of equal size
with markedly different Core Areas.
Use of the Core Area model has focused
on tropical forest fragments.For
example, it has been used in
northeastern Queensland to
demonstrate the minimum size of forest
Key features for woodland biodiversity (continued)
10
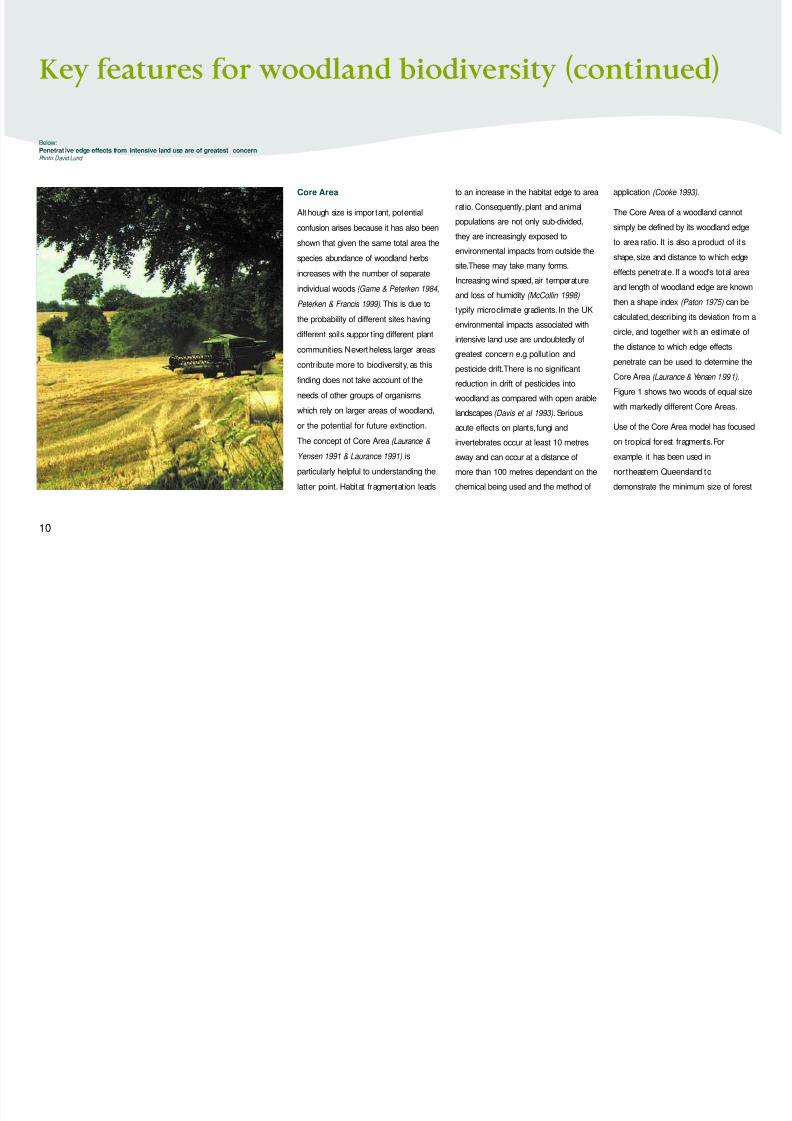
Below:Penetrat ive edge effects from intensive land use are of greatest concernPhoto:David Lund
8/6/2019 Woodland Bio Index
http://slidepdf.com/reader/full/woodland-bio-index 11/24
fragments,depending on shape, required
to ensure that more than 50%remains
unaffected by external impacts (Laurance
1991). Further research is required in the
UK to establish how far detrimental edge
effects penetrate a range of different
woodland types in different situations to
enable Core Areas to be accurately
calculated.As a rough rule of thumb it is
known that changes in microclimate
extend up to three times the canopy
height in from forest edges and that such
gradients show a reasonable degree of
consistency between studies carried out
in different climatic regions (McCollin
1998). This means that a majority of
ancient woods in England and Wales may
not have a significant Core Area, given
that 44%of them are between 2-5ha
(Spencer & Kirby 1991) and there is likely
to be a substantial number less than 2ha
which are not included in the inventory
currently.
A simple illustration of t he Core Area
concept is the observation from a lowland
arable landscape in eastern England that
wrens are less likely to be present in long,
narrow woods than in circular ones
probably due to increased exposure,
especially in windy weather (Hinsley et al
1994).
It should also be borne in mind that the
smaller the Core Area the greater the
chance of less mobile species wandering
out into hostile territory and succumbing
to adverse conditions created by man or
natural predation. Circumstantial evidence
suggests that this is a significant selection
pressure which has led to further recent
reductions in the dispersal ability of some
species.For example, in South East
England the pearl-bordered fritillary
appears far more sedentary in coppice
woods,which are invariably surrounded
by intensive land use, than in other
regions where it occupies different
habitats which cover a wider area (Barnett
& Warren 1995).
It has been noted that many invertebrates
associated with herbaceous woodland
plants may benefit from woodland
fragmentation, temporarily and locally as
the length of woodland edge will be
increased and enhanced light penetration
may lead to population increases in
important herbaceous foodplants (Kirby
1994). However,where woods are
bounded by intensive land use, clearly this
does not undermine the idea that Core
Area is important for sustaining their long
term value to biodiversity.
11
Below t op:Figure 1 Two woods of equal size with markedly different Core Areas;
2.2 hectares and 7 hectares
Below bottom:W rens are less likely to inhabit long narrow woods
Photo: RSPB Images
8/6/2019 Woodland Bio Index
http://slidepdf.com/reader/full/woodland-bio-index 12/24
Key features for woodland biodiversity (continued)
12
Woodland edge adjacent to other
semi-natural habitats
Intensive land use has increasingly led to
the establishment of abrupt woodland
boundaries.Transitional habitats, which
survived at least t o some degree until only
20-30 years ago, from woodland through
scrub to other semi-natural habitats,
including flower-rich grassland or
heathland,are now rare, especially in the
lowlands. Even hedges, which in many cases
provide the only link between semi-natural
habitats, continue to be destroyed or lost
through mismanagement at an alarming
rate.Over 110,000km of hedgerows were
lost between 1984-1993 with over 61 per
cent of this loss taking place after 1990
(CPRE 1999).
Where other semi-natural habitats do
occur adjacent to woodland they have a
valuable role to play in fulfilling the needs
of many species which require different
habitats in close proximity.This may
reduce the need to manage open ground
habitats within woods.Saproxylic
invertebrates are a good example, as theyneed the juxtaposition of old trees and
deadwood to breed and open habitats in
which to nectar (Key & Ball 1993). For
other woodland species with less specific
requirements,e.g. badgers (Neal 1986),
other semi-natural habitats adjacent to
woodland may also play a valuable role in
increasing the area of suitable available
habitat and thereby sustaining viable
populations which the woodland alone
could not otherwise support. Depending
on their size and shape,adjoining
semi-natural habitats may also increase the
Core Area of woodland unaffected by
detr imental impacts from intensive land
use and link woods enabling species to
migrate and operate over still larger areas.
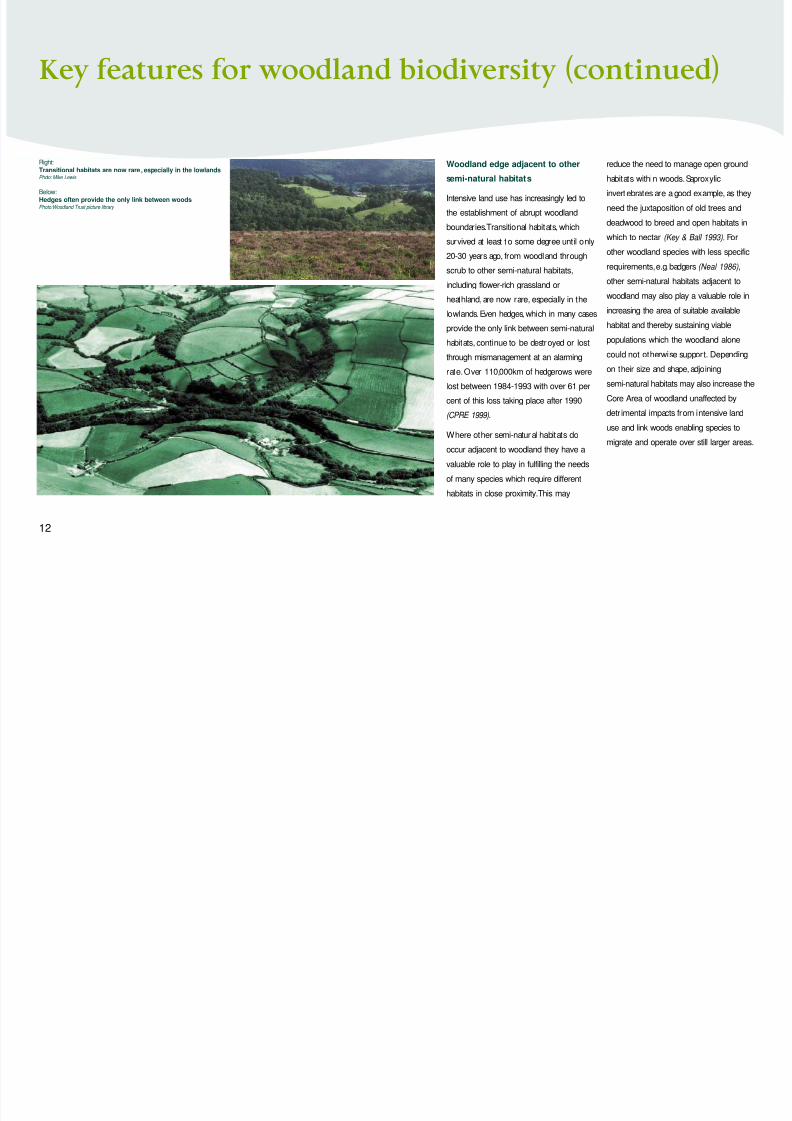
Right:
Transitional habitats are now rare, especially in the lowlandsPhoto: Mike Lewis
Below:
Hedges often provide the only link between woodsPhoto:Woodland Trust picture library
8/6/2019 Woodland Bio Index
http://slidepdf.com/reader/full/woodland-bio-index 13/24
8/6/2019 Woodland Bio Index
http://slidepdf.com/reader/full/woodland-bio-index 14/24
Key features for woodland biodiversity (continued)
14
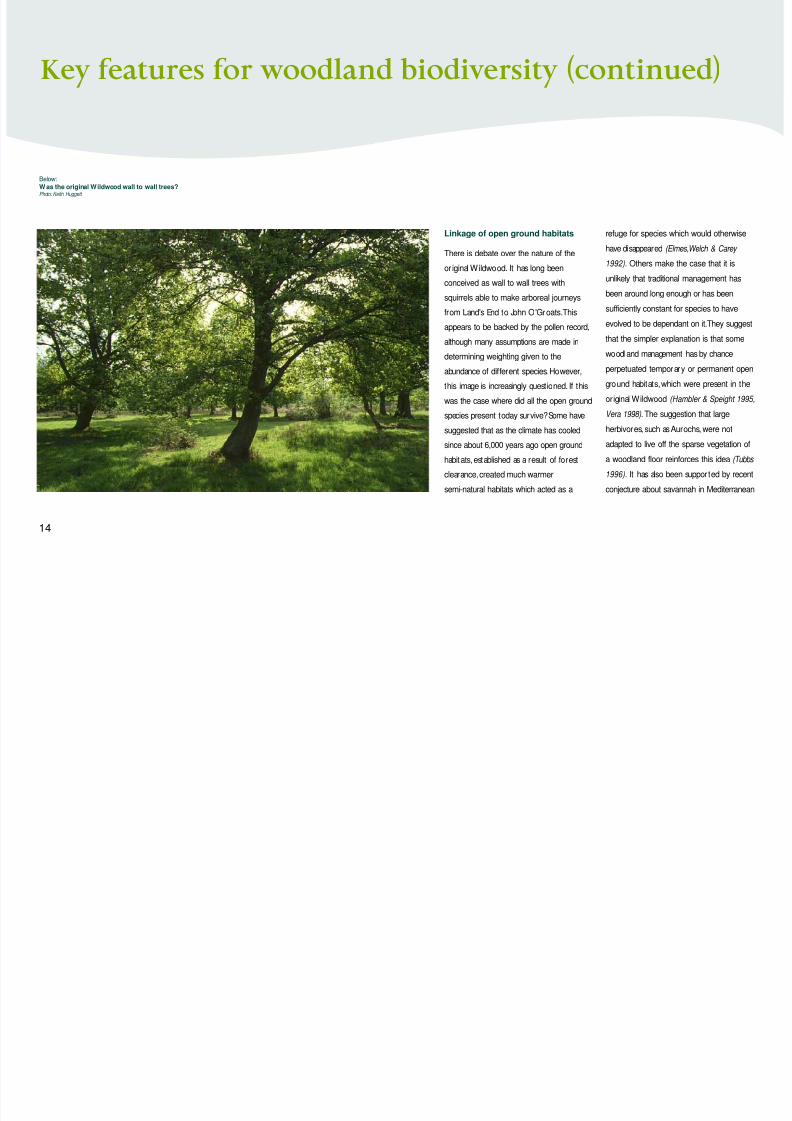
Below:
Was the original Wildwood wall to wall trees?Photo: Keith Huggett
Linkage of open ground habitats
There is debate over the nature of the
or iginal Wildwood. It has long been
conceived as wall to wall trees with
squirrels able to make arboreal journeys
from Land's End to John O'Groats.This
appears to be backed by the pollen record,
although many assumptions are made in
determining weighting given to the
abundance of different species. However,
this image is increasingly questioned. If this
was the case where did all the open ground
species present today survive?Some have
suggested that as the climate has cooled
since about 6,000 years ago open ground
habitats,established as a result of forest
clearance,created much warmer
semi-natural habitats which acted as a
refuge for species which would otherwise
have disappeared (Elmes,Welch & Carey
1992). Others make the case that it is
unlikely that traditional management has
been around long enough or has beensufficiently constant for species to have
evolved to be dependant on it.They suggest
that the simpler explanation is that some
woodland management has by chance
perpetuated temporary or permanent open
ground habitats,which were present in the
original Wildwood (Hambler & Speight 1995,
Vera 1998). The suggestion that large
herbivores, such as Aurochs, were not
adapted to live off the sparse vegetation of
a woodland floor reinforces this idea (Tubbs
1996). It has also been supported by recent
conjecture about savannah in Mediterranean
8/6/2019 Woodland Bio Index
http://slidepdf.com/reader/full/woodland-bio-index 15/24
15
Europe and the observation that there is a
thin but continuous pollen record of insect-
pollinated plants typical of open ground
habitats.Such plants produce relatively litt le
pollen compared with wind-pollinatedspecies and the fact that their pollen has
been recorded at all leads one naturally to
the conclusion that there was more to the
Wildwood than just forest (Rackham 1998).
Whatever the truth it is undeniable that
over the millennia open space habitats
flourished at the expense of woodland and
that traditional woodland management (i.e.
coppice,coppice-wit h-standards and wood-
pasture) sustained temporary or permanent
open ground habitats within woods.
Perhaps it is not surpr ising, therefore, that
the majority of species with very specific
habitat requirements not associated with
old growth are instead reliant on temporary
and permanent semi-natural open ground
(Peterken 1996). It is debatable whether
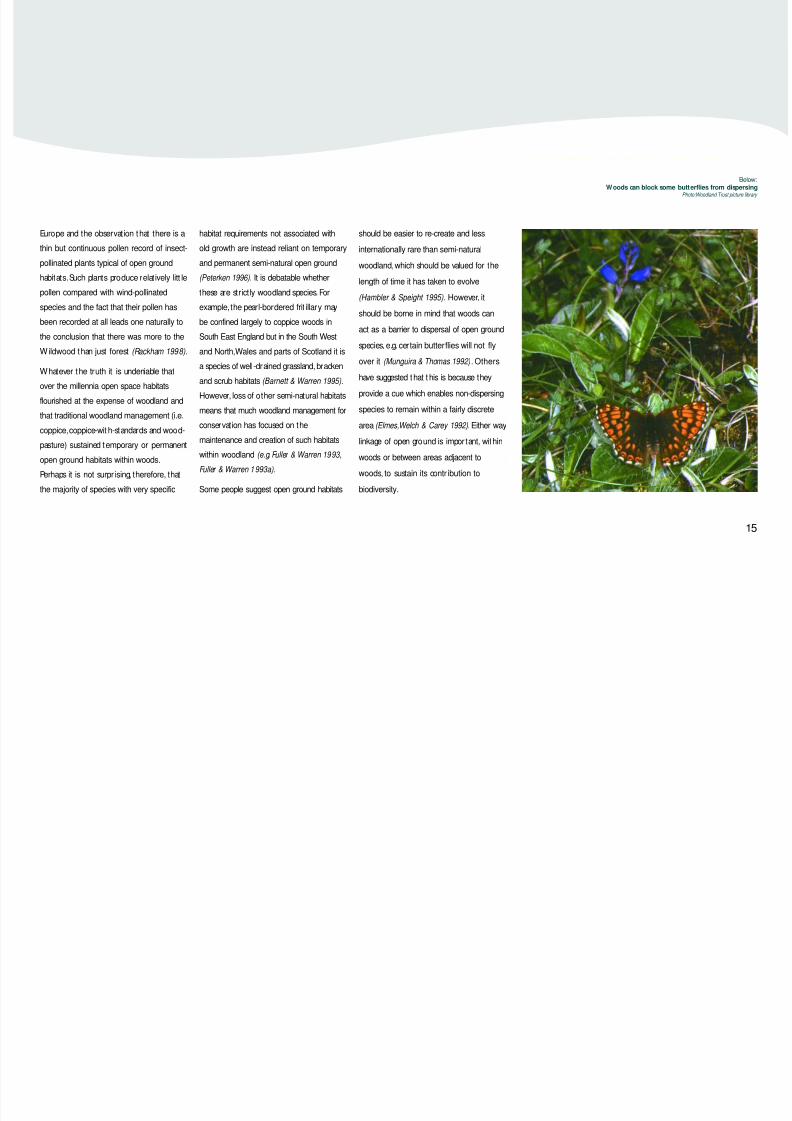
these are strictly woodland species. Forexample,the pearl-bordered frit illary may
be confined largely to coppice woods in
South East England but in the South West
and North,Wales and parts of Scotland it is
a species of well-drained grassland,bracken
and scrub habitats (Barnett & Warren 1995).
However, loss of other semi-natural habitats
means that much woodland management for
conservation has focused on the
maintenance and creation of such habitats
within woodland (e.g. Fuller & Warren 1993,
Fuller & Warren 1993a).
Some people suggest open ground habitats
should be easier to re-create and less
internationally rare than semi-natural
woodland,which should be valued for the
length of time it has taken to evolve
(Hambler & Speight 1995). However, it
should be borne in mind that woods can
act as a barrier to dispersal of open ground
species, e.g. certain butterflies will not fly
over it (Munguira & Thomas 1992) .Others
have suggested that t his is because they
provide a cue which enables non-dispersing
species to remain within a fairly discrete
area (Elmes,Welch & Carey 1992).Either way
linkage of open ground is important, within
woods or between areas adjacent to
woods, to sustain its contr ibution to
biodiversity.
Below:Woods can block some butterflies from dispersing
Photo:Woodland Trust picture library
8/6/2019 Woodland Bio Index
http://slidepdf.com/reader/full/woodland-bio-index 16/24
8/6/2019 Woodland Bio Index
http://slidepdf.com/reader/full/woodland-bio-index 17/24
8/6/2019 Woodland Bio Index
http://slidepdf.com/reader/full/woodland-bio-index 18/24
8/6/2019 Woodland Bio Index
http://slidepdf.com/reader/full/woodland-bio-index 19/24
Developing our plans and focusing our action
19
In the context of Keeping woodland alive
and Seeing the woods for the trees ,the
Woodland Trust will use these measures
to monitor progress in improving
woodland biodiversity potential and to
help inform the development of policies,
strategies and implementation.
Baseline profile of the Woodland
Trust's sites
At a site scale it will be possible to
determine numerical values for each of the
measures but there is no intent to
produce a cumulative score for individual
sites, as there is insufficient scientific
evidence to adequately weight the
importance of these attributes one against
another.This profile will provide a baseline
against which any increment in the value of
our sites to biodiversity can be monitored.
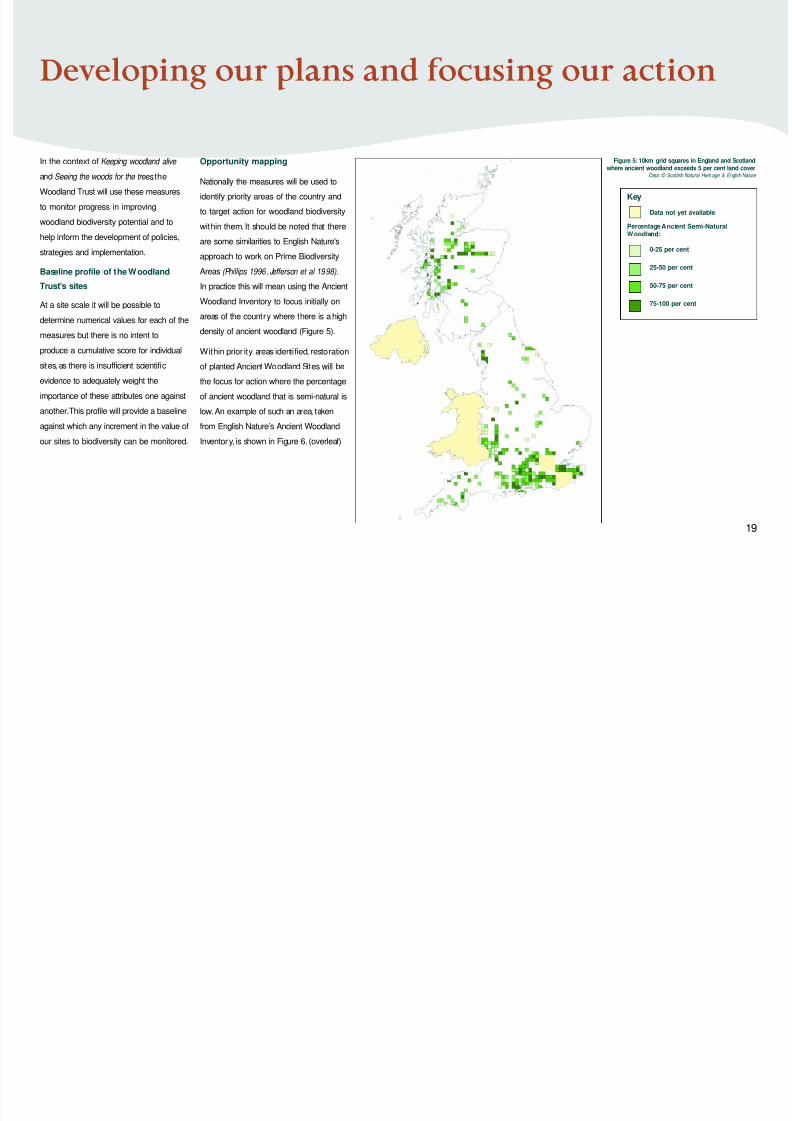
Opportunity mapping
Nationally the measures will be used to
identify priority areas of the country andto target action for woodland biodiversity
within them. It should be noted that there
are some similarities to English Nature's
approach to work on Prime Biodiversity
Areas (Phillips 1996, Jefferson et al 1998).
In practice this will mean using the Ancient
Woodland Inventory to focus initially on
areas of the country where there is a high
density of ancient woodland (Figure 5).
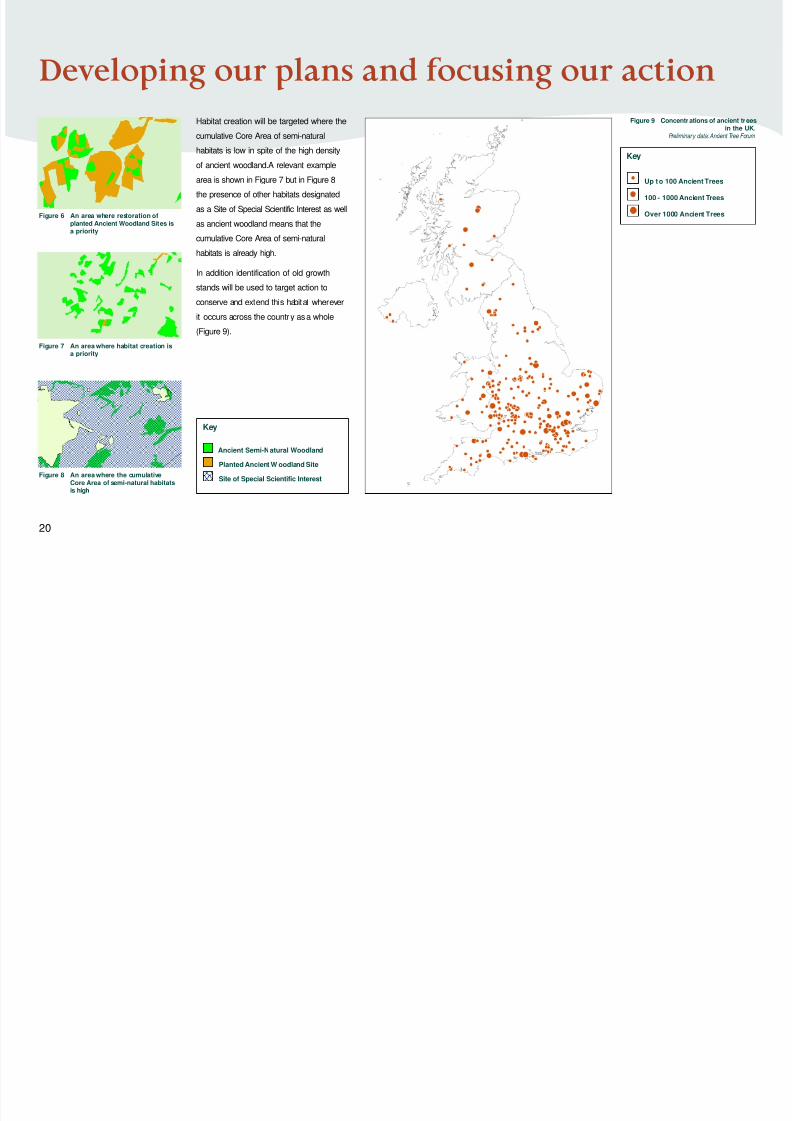
Within prior ity areas identified, restoration
of planted Ancient Woodland Sites will be
the focus for action where the percentage
of ancient woodland that is semi-natural is
low.An example of such an area, taken
from English Nature’s Ancient Woodland
Inventory, is shown in Figure 6. (overleaf)
Figure 5: 10km grid squares in England and Scotlandwhere ancient woodland exceeds 5 per cent land cover
Data: © Scottish Natural Herit age & English Nature
KeyData not yet available
Percentage Ancient Semi-NaturalWoodland:
0-25 per cent
25-50 per cent
50-75 per cent
75-100 per cent
8/6/2019 Woodland Bio Index
http://slidepdf.com/reader/full/woodland-bio-index 20/24
20
Habitat creation will be targeted where the
cumulative Core Area of semi-natural
habitats is low in spite of the high density
of ancient woodland.A relevant example
area is shown in Figure 7 but in Figure 8
the presence of other habitats designated
as a Site of Special Scientific Interest as well
as ancient woodland means that the
cumulative Core Area of semi-natural
habitats is already high.
In addition identification of old growth
stands will be used to target action to
conserve and extend this habitat wherever
it occurs across the country as a whole
(Figure 9).
Developing our plans and focusing our action
Figure 6 An area where restoration ofplanted Ancient Woodland Sites isa priority
Figure 9 Concentr ations of ancient treesin the UK.
Preliminary data:Ancient Tree Forum
Figure 7 An area where habitat creation isa priority
Figure 8 An area where the cumulativeCore Area of semi-natural habitats
is high
Key
Ancient Semi-Natural Woodland
Planted Ancient W oodland Site
Site of Special Scientific Interest
Key
Up t o 100 Ancient Trees
100 - 1000 Ancient Trees
Over 1000 Ancient Trees
8/6/2019 Woodland Bio Index
http://slidepdf.com/reader/full/woodland-bio-index 21/24
8/6/2019 Woodland Bio Index
http://slidepdf.com/reader/full/woodland-bio-index 22/24
8/6/2019 Woodland Bio Index
http://slidepdf.com/reader/full/woodland-bio-index 23/24
8/6/2019 Woodland Bio Index
http://slidepdf.com/reader/full/woodland-bio-index 24/24
Woodland biodiversity:Expanding our hor izons
The Woodland Trust
Autumn Park, Grantham
Lincolnshire NG31 6LL
Telephone: 01476 581111 Fax: 01476 590808
Website:www.woodland-tr ust.org.uk
E-mail: [email protected] g.uk
Registered charity number 294344
Registered in England number 1982873
Registered Office:Autumn Park,Grantham,Lincolnshire NG31 6LL
Copyright © 2000 The Woodland Trust
The Woodland Trust logo is a trademark of the Woodland Trust
Printed on recycled paper✃¤1471 06/00
The Woodland Trust Scotland
Glenruthven Mill,Abbey Road
Auchterarder,Perthshire PH3 1DPTelephone: 01764 662554 Fax: 01764 662553
The Woodland Trust Nor thern Ireland
1,May Avenue, Bangor, County Down BT20 4JT
Telephone: 02891 275787 Fax: 02891 275942
Coed Cadw
The Woodland Trust Wales
Pantyronnen,Pencarreg,Llanybydder
Carmarthenshire SA40 9QQ
Tel/Fax: 01570 480888
The Woodland Trust was founded in 1972 and is the
UK’s leading conservation organisation dedicated solely
to the protection of native woodland.The Trust achieves
its aims through a combination of acquiring woodland
and sites for planting and through advocacy of the
importance of protecting ancient woodland,enhancing
its biodiversity, expanding native woodland cover and
increasing public enjoyment of woodland.
The Trust relies on the generosity of the public,
industry,commerce and agencies to carry out it s work.
To find out how you can help,and about membership
details,please contact one of the addresses opposite.