Embed Size (px)
Citation preview
1
Wood Smoke Screening Study Update:
RTF Staff & Abt Associates
May 13th, 2014
Presentation Objectives
• Brief the RTF on subcommittee investigation of a methodology to quantify and monetize healthcare benefits from reducing wood smoke
• An opportunity to ask the experts about the fundamental underpinnings of the methodology
• Obtain RTF feedback.
2
3
More Context
• Further analysis required to generate usable NEB values.
• Today’s presentation will not address policy implications of analysis.
• Reminder: The Council is the ultimate decider on whether or not health impacts are quantifiable as NEB for the work products of the Council
• Results of the RTF investigation into the quantifiability and monetizability of health impacts will go to RTF Policy Advisory Committee and the Council
4
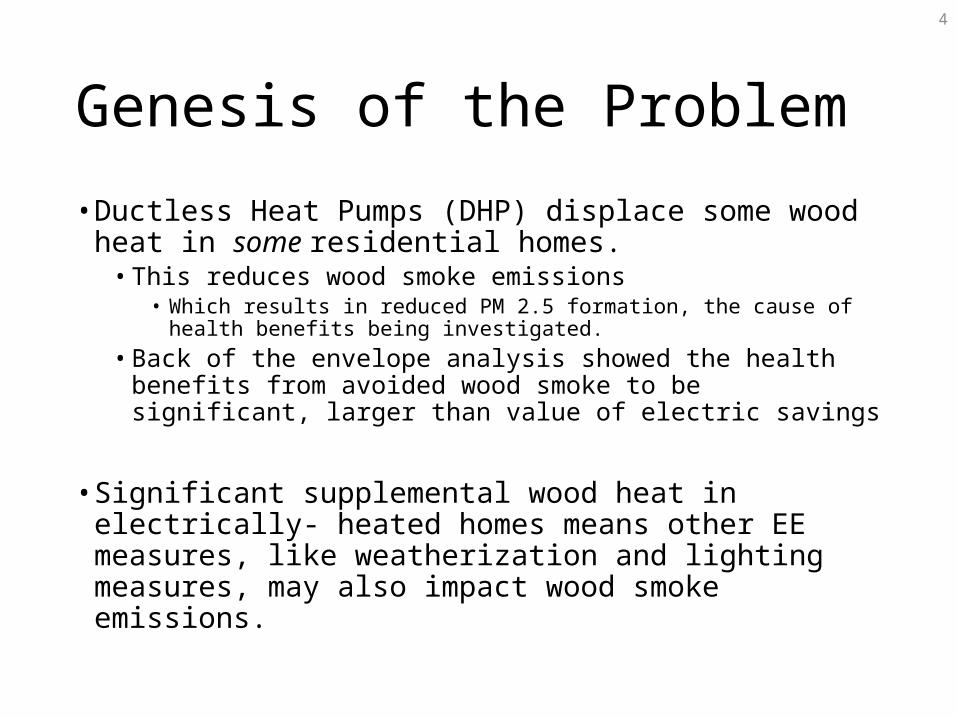
Genesis of the Problem
• Ductless Heat Pumps (DHP) displace some wood heat in some residential homes.
• This reduces wood smoke emissions• Which results in reduced PM 2.5 formation, the cause of health
benefits being investigated.• Back of the envelope analysis showed the health benefits from
avoided wood smoke to be significant, larger than value of electric savings
• Significant supplemental wood heat in electrically- heated homes means other EE measures, like weatherization and lighting measures, may also impact wood smoke emissions.
5
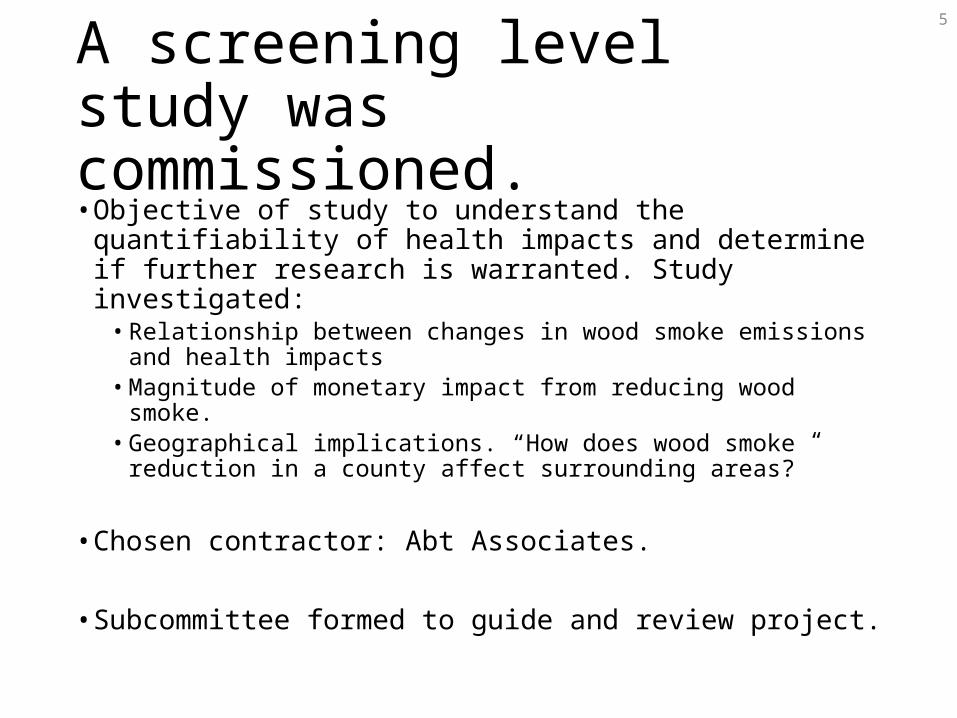
A screening level study was commissioned.• Objective of study to understand the quantifiability of
health impacts and determine if further research is warranted. Study investigated:
• Relationship between changes in wood smoke emissions and health impacts
• Magnitude of monetary impact from reducing wood smoke.• Geographical implications. “How does wood smoke reduction
in a county affect surrounding areas?”
• Chosen contractor: Abt Associates.
• Subcommittee formed to guide and review project.
6
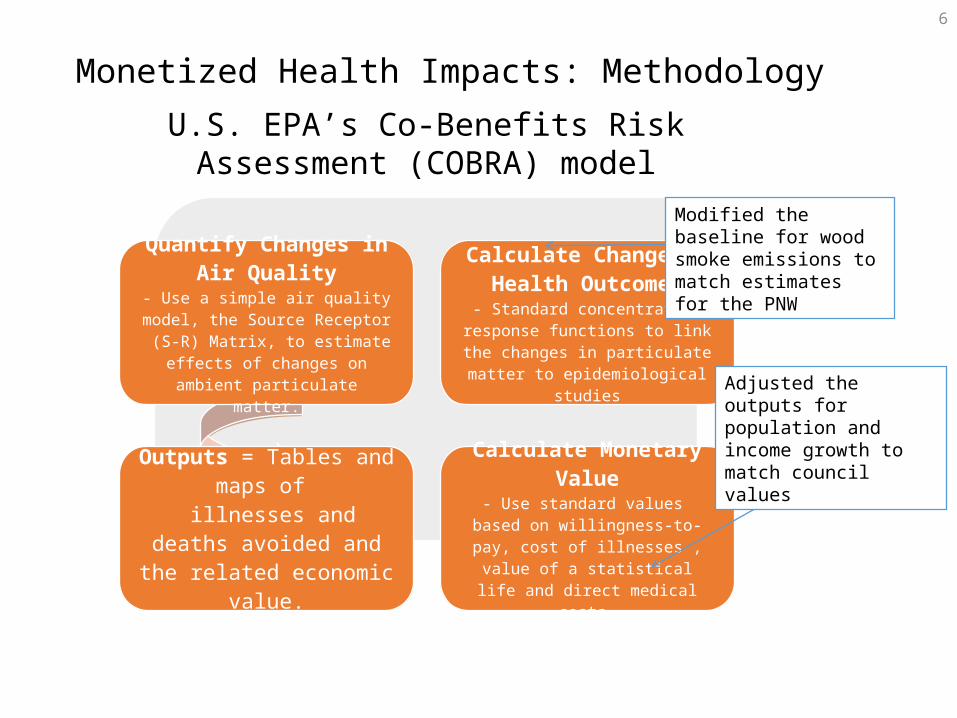
Monetized Health Impacts: MethodologyU.S. EPA’s Co-Benefits Risk Assessment (COBRA) model
Quantify Changes in Air Quality
- Use a simple air quality model, the Source Receptor (S-R) Matrix, to
estimate effects of changes on ambient particulate matter.
Calculate Change in Health Outcomes
- Standard concentration response functions to link the changes in
particulate matter to epidemiological studies
Outputs = Tables and maps of
illnesses and deaths avoided and the related economic
value.
Calculate Monetary Value- Use standard values based on
willingness-to-pay, cost of illnesses , value of a statistical life and direct
medical costs.
Modified the baseline for wood smoke emissions to match estimates for the PNW
Adjusted the outputs for population and income growth to match council values
7
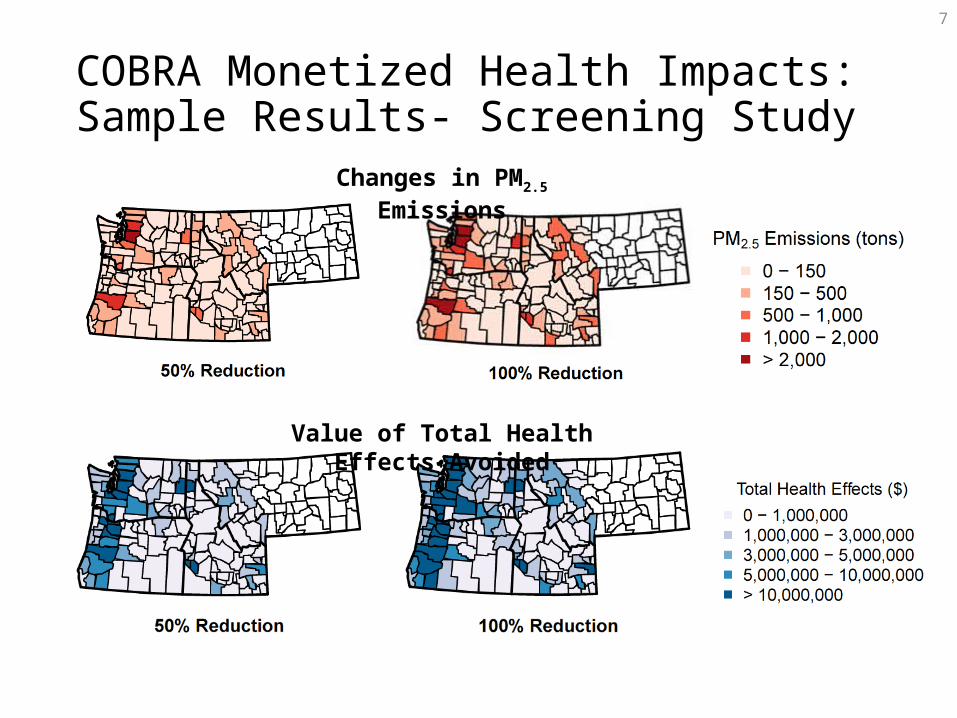
COBRA Monetized Health Impacts: Sample Results- Screening Study
Changes in PM2.5 Emissions
Value of Total Health Effects Avoided
8
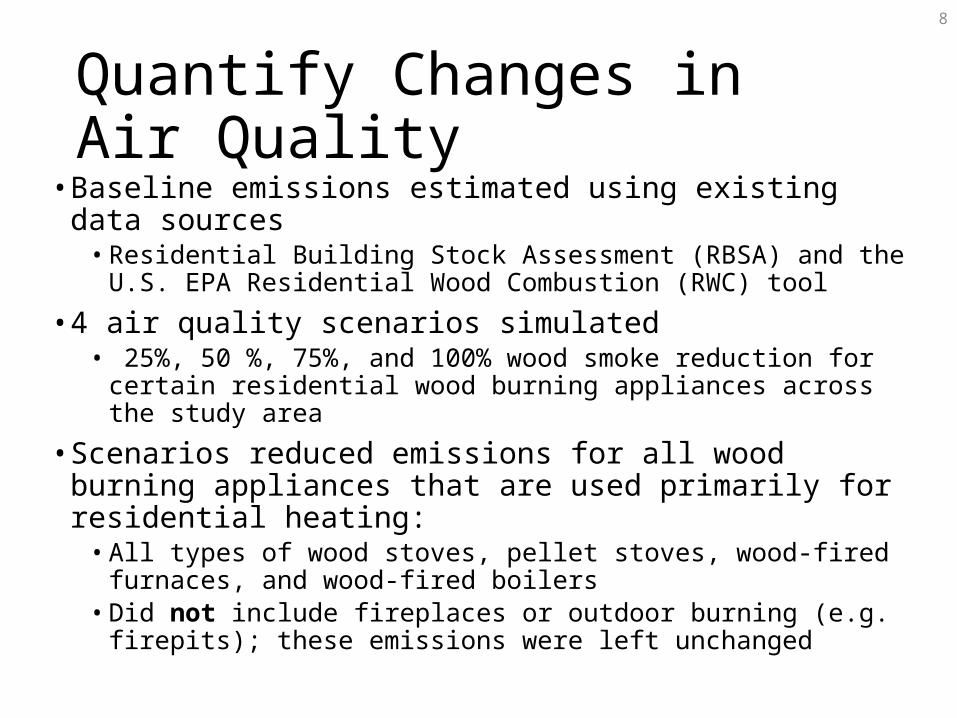
Quantify Changes in Air Quality
• Baseline emissions estimated using existing data sources• Residential Building Stock Assessment (RBSA) and the U.S. EPA
Residential Wood Combustion (RWC) tool
• 4 air quality scenarios simulated• 25%, 50 %, 75%, and 100% wood smoke reduction for certain
residential wood burning appliances across the study area
• Scenarios reduced emissions for all wood burning appliances that are used primarily for residential heating:
• All types of wood stoves, pellet stoves, wood-fired furnaces, and wood-fired boilers
• Did not include fireplaces or outdoor burning (e.g. firepits); these emissions were left unchanged
9
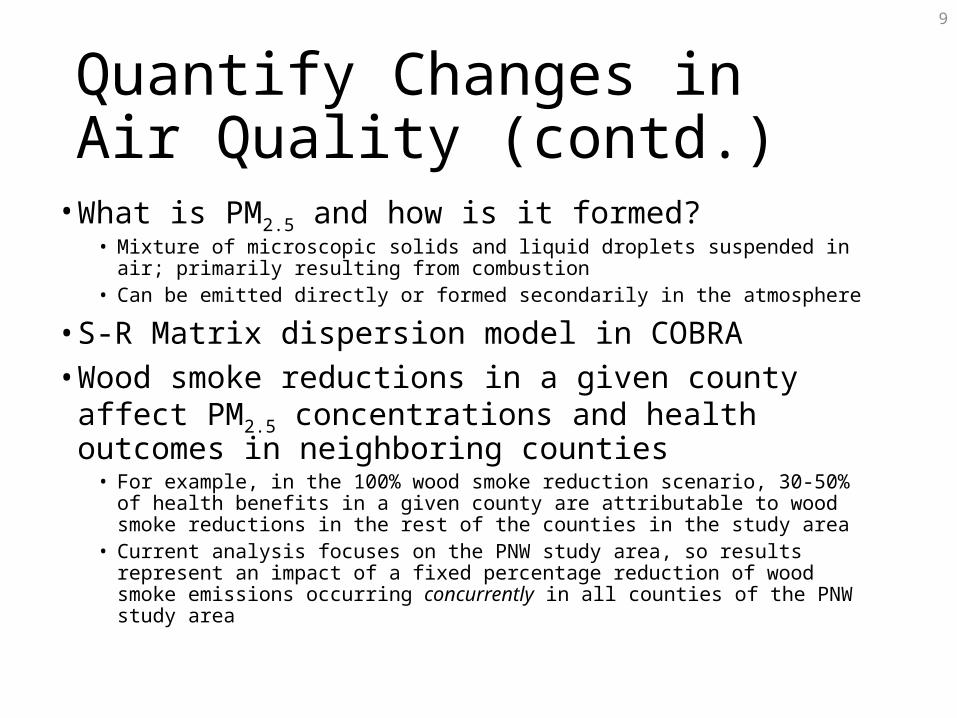
Quantify Changes in Air Quality (contd.)
• What is PM2.5 and how is it formed?• Mixture of microscopic solids and liquid droplets suspended in air; primarily
resulting from combustion• Can be emitted directly or formed secondarily in the atmosphere
• S-R Matrix dispersion model in COBRA• Wood smoke reductions in a given county affect PM2.5
concentrations and health outcomes in neighboring counties
• For example, in the 100% wood smoke reduction scenario, 30-50% of health benefits in a given county are attributable to wood smoke reductions in the rest of the counties in the study area
• Current analysis focuses on the PNW study area, so results represent an impact of a fixed percentage reduction of wood smoke emissions occurring concurrently in all counties of the PNW study area
10
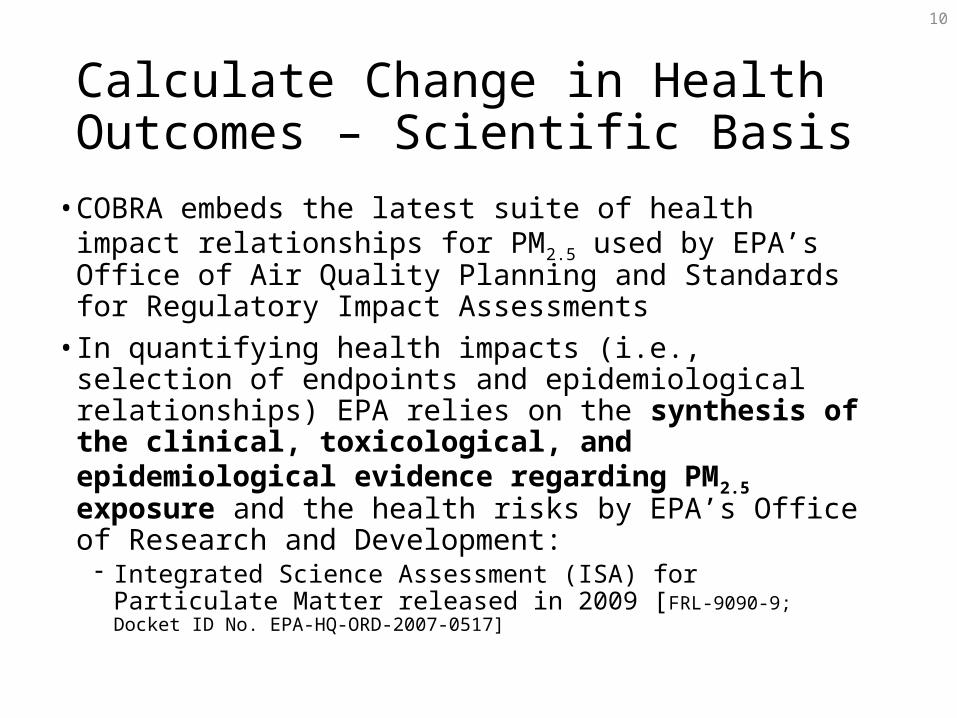
Calculate Change in Health Outcomes – Scientific Basis
• COBRA embeds the latest suite of health impact relationships for PM2.5 used by EPA’s Office of Air Quality Planning and Standards for Regulatory Impact Assessments
• In quantifying health impacts (i.e., selection of endpoints and epidemiological relationships) EPA relies on the synthesis of the clinical, toxicological, and epidemiological evidence regarding PM2.5 exposure and the health risks by EPA’s Office of Research and Development:
- Integrated Science Assessment (ISA) for Particulate Matter released in 2009 [FRL-9090-9; Docket ID No. EPA-HQ-ORD-2007-0517]
11
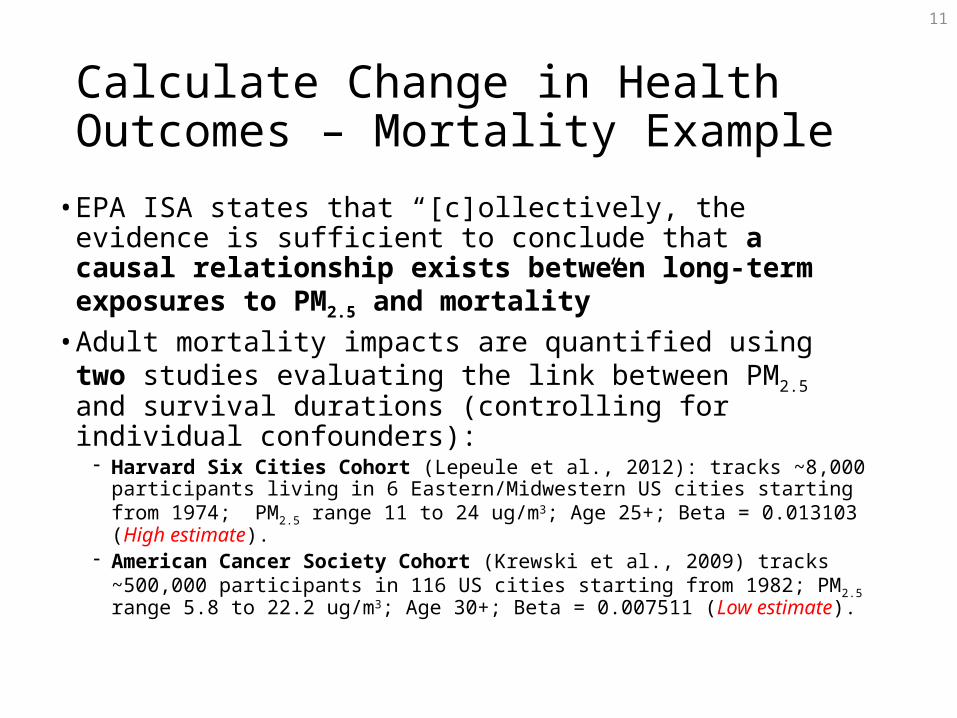
Calculate Change in Health Outcomes – Mortality Example
• EPA ISA states that “[c]ollectively, the evidence is sufficient to conclude that a causal relationship exists between long-term exposures to PM2.5 and mortality”
• Adult mortality impacts are quantified using two studies evaluating the link between PM2.5 and survival durations (controlling for individual confounders):
Harvard Six Cities Cohort (Lepeule et al., 2012): tracks ~8,000 participants living in 6 Eastern/Midwestern US cities starting from 1974; PM2.5 range 11 to 24 ug/m3; Age 25+; Beta = 0.013103 (High estimate).
American Cancer Society Cohort (Krewski et al., 2009) tracks ~500,000 participants in 116 US cities starting from 1982; PM2.5 range 5.8 to 22.2 ug/m3; Age 30+; Beta = 0.007511 (Low estimate).
12
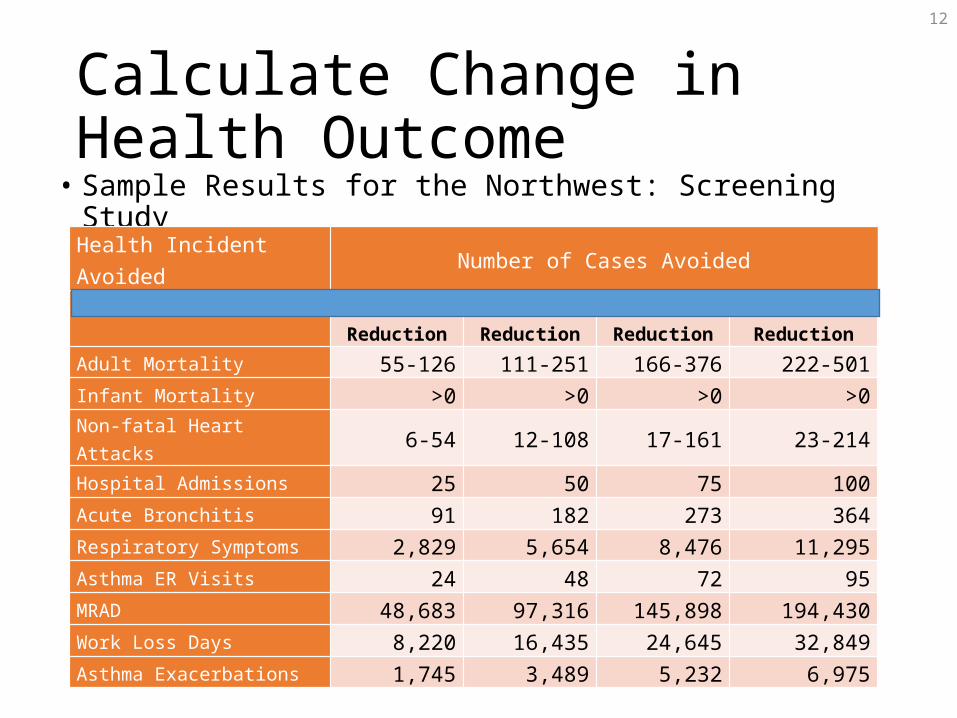
Calculate Change in Health Outcome
• Sample Results for the Northwest: Screening Study
Health Incident Avoided Number of Cases Avoided 25% Reduction 50% Reduction 75% Reduction 100% Reduction
Adult Mortality 55-126 111-251 166-376 222-501Infant Mortality >0 >0 >0 >0Non-fatal Heart Attacks 6-54 12-108 17-161 23-214Hospital Admissions 25 50 75 100Acute Bronchitis 91 182 273 364Respiratory Symptoms 2,829 5,654 8,476 11,295Asthma ER Visits 24 48 72 95MRAD 48,683 97,316 145,898 194,430Work Loss Days 8,220 16,435 24,645 32,849Asthma Exacerbations 1,745 3,489 5,232 6,975
13
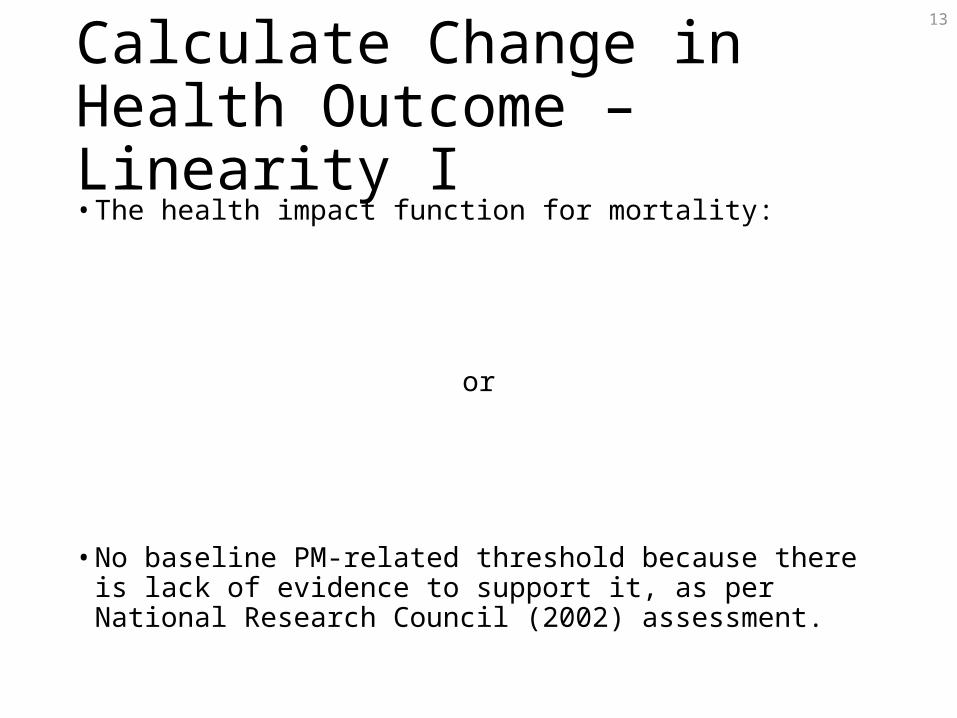
Calculate Change in Health Outcome – Linearity I• The health impact function for mortality:
or
• No baseline PM-related threshold because there is lack of evidence to support it, as per National Research Council (2002) assessment.
14
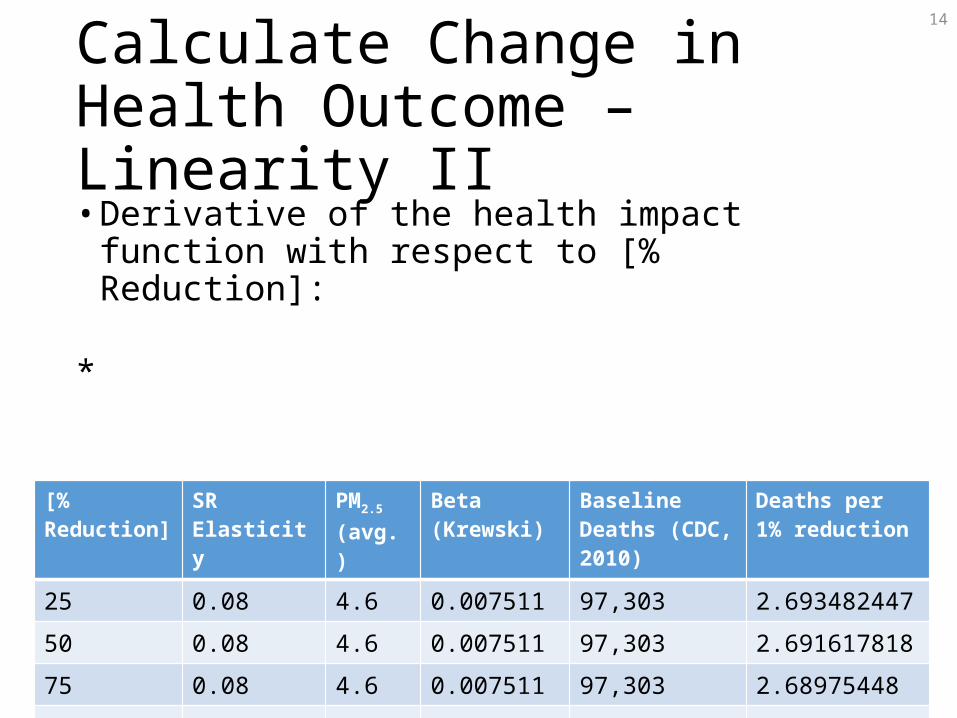
Calculate Change in Health Outcome – Linearity II• Derivative of the health impact function with respect to
[% Reduction]:
*[% Reduction] SR Elasticity PM2.5
(avg.)Beta (Krewski) Baseline Deaths
(CDC, 2010)Deaths per 1% reduction
25 0.08 4.6 0.007511 97,303 2.693482447
50 0.08 4.6 0.007511 97,303 2.691617818
75 0.08 4.6 0.007511 97,303 2.68975448
100 0.08 4.6 0.007511 97,303 2.687892431
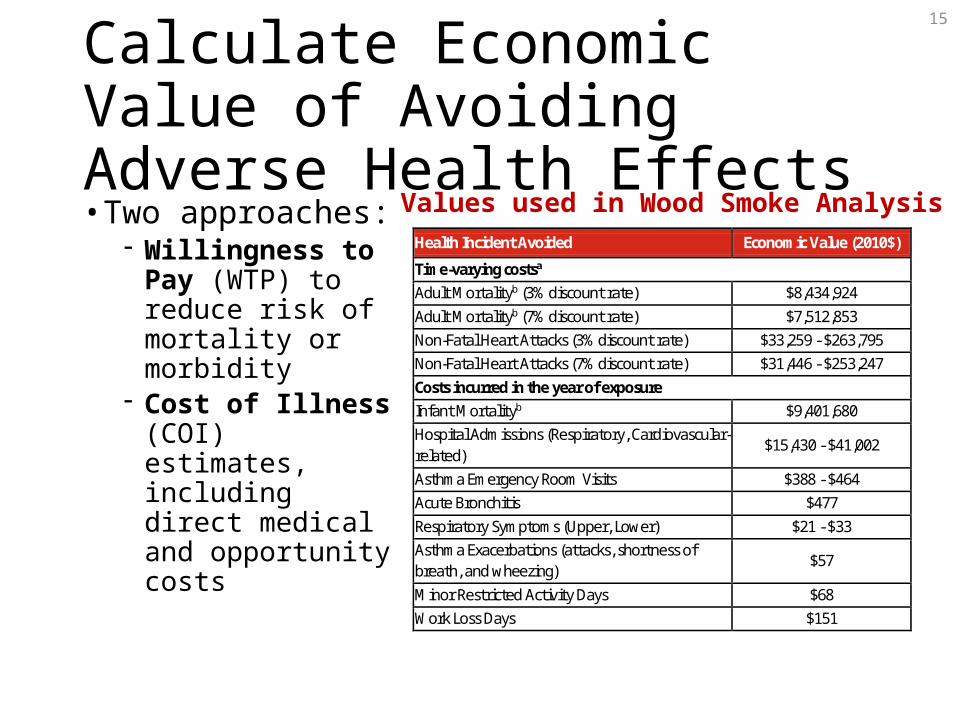
Calculate Economic Value of Avoiding Adverse Health Effects• Two approaches:
- Willingness to Pay (WTP) to reduce risk of mortality or morbidity
- Cost of Illness (COI) estimates, including direct medical and opportunity costs
15
Health Incident Avoided Economic Value (2010$)
Time-varying costsa Adult Mortalityb (3% discount rate) $8,434,924 Adult Mortalityb (7% discount rate) $7,512,853 Non-Fatal Heart Attacks (3% discount rate) $33,259 - $263,795 Non-Fatal Heart Attacks (7% discount rate) $31,446 - $253,247 Costs incurred in the year of exposure Infant Mortalityb $9,401,680 Hospital Admissions (Respiratory, Cardiovascular-related)
$15,430 - $41,002
Asthma Emergency Room Visits $388 - $464 Acute Bronchitis $477 Respiratory Symptoms (Upper, Lower) $21 - $33 Asthma Exacerbations (attacks, shortness of breath, and wheezing)
$57
Minor Restricted Activity Days $68 Work Loss Days $151
Values used in Wood Smoke Analysis
16
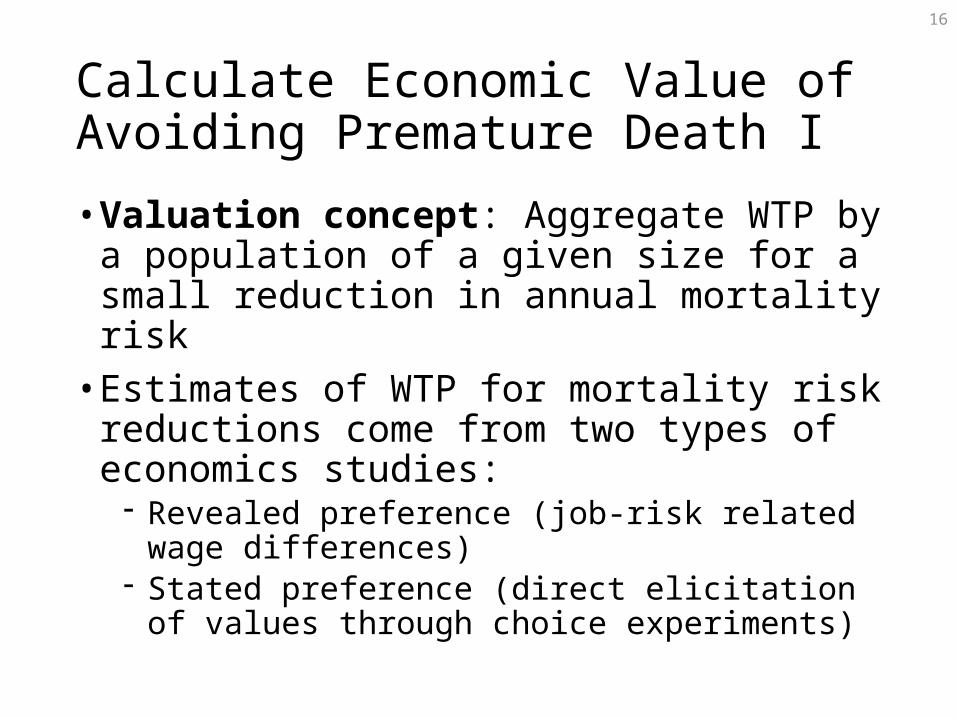
Calculate Economic Value of Avoiding Premature Death I• Valuation concept: Aggregate WTP by a population
of a given size for a small reduction in annual mortality risk
• Estimates of WTP for mortality risk reductions come from two types of economics studies:
- Revealed preference (job-risk related wage differences) - Stated preference (direct elicitation of values through
choice experiments)
17
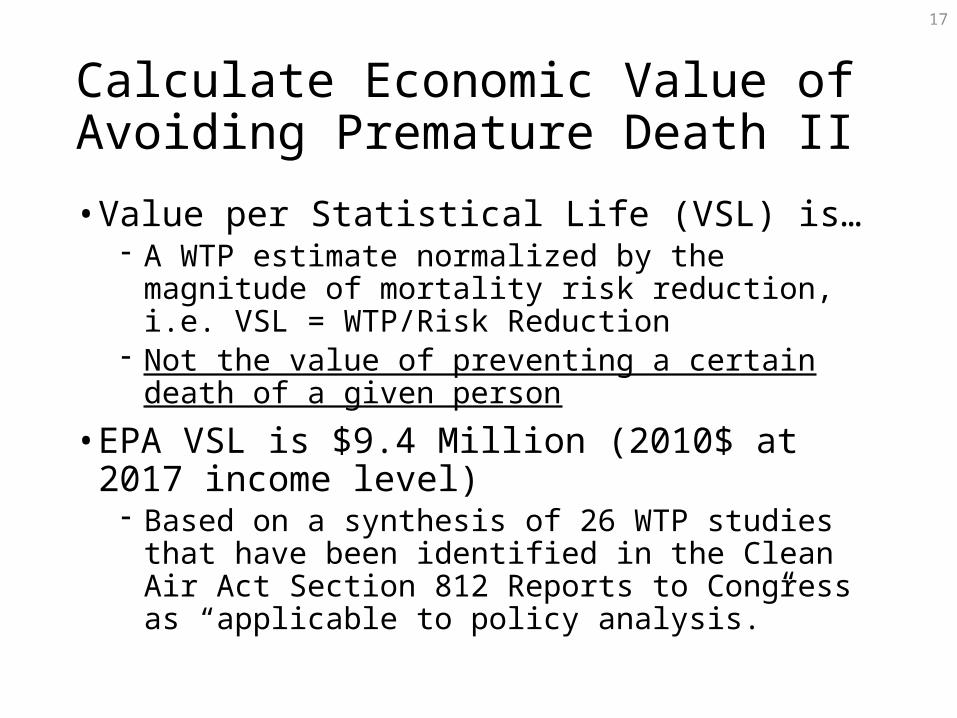
Calculate Economic Value of Avoiding Premature Death II• Value per Statistical Life (VSL) is…
- A WTP estimate normalized by the magnitude of mortality risk reduction, i.e. VSL = WTP/Risk Reduction
- Not the value of preventing a certain death of a given person
• EPA VSL is $9.4 Million (2010$ at 2017 income level)
- Based on a synthesis of 26 WTP studies that have been identified in the Clean Air Act Section 812 Reports to Congress as “applicable to policy analysis.”
18
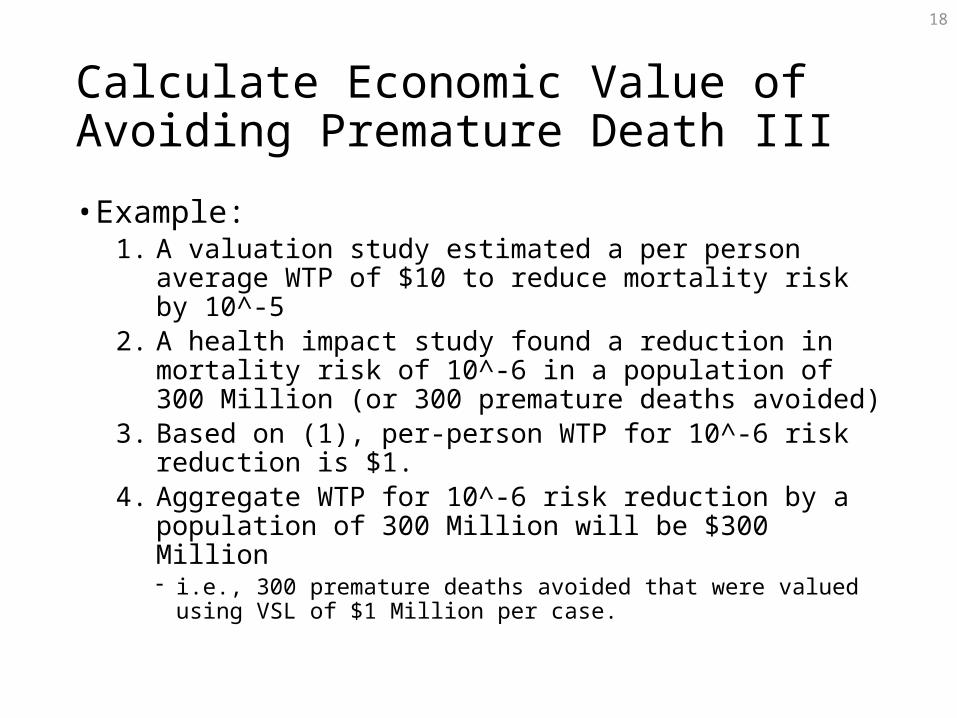
Calculate Economic Value of Avoiding Premature Death III• Example:
1. A valuation study estimated a per person average WTP of $10 to reduce mortality risk by 10^-5
2. A health impact study found a reduction in mortality risk of 10^-6 in a population of 300 Million (or 300 premature deaths avoided)
3. Based on (1), per-person WTP for 10^-6 risk reduction is $1.
4. Aggregate WTP for 10^-6 risk reduction by a population of 300 Million will be $300 Million- i.e., 300 premature deaths avoided that were valued using VSL
of $1 Million per case.
19
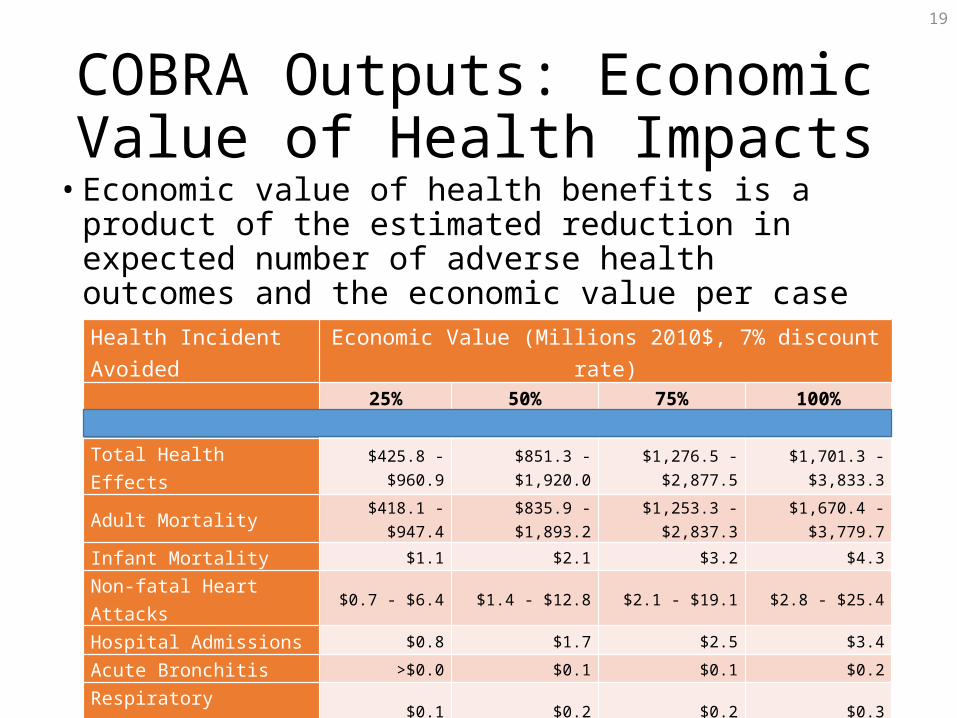
COBRA Outputs: Economic Value of Health Impacts
• Economic value of health benefits is a product of the estimated reduction in expected number of adverse health outcomes and the economic value per case
Health Incidence Results for Study AreaHealth Incident Avoided Economic Value (Millions 2010$, 7% discount rate) 25% Reduction 50% Reduction 75% Reduction 100% Reduction
Total Health Effects $425.8 - $960.9 $851.3 - $1,920.0 $1,276.5 - $2,877.5 $1,701.3 - $3,833.3
Adult Mortality $418.1 - $947.4 $835.9 - $1,893.2 $1,253.3 - $2,837.3 $1,670.4 - $3,779.7
Infant Mortality $1.1 $2.1 $3.2 $4.3
Non-fatal Heart Attacks $0.7 - $6.4 $1.4 - $12.8 $2.1 - $19.1 $2.8 - $25.4
Hospital Admissions $0.8 $1.7 $2.5 $3.4
Acute Bronchitis >$0.0 $0.1 $0.1 $0.2
Respiratory Symptoms $0.1 $0.2 $0.2 $0.3
Asthma ER Visits >$0.0 >$0.0 >$0.0 >$0.0
MRAD $3.3 $6.6 $9.9 $13.2
Work Loss Days $1.6 $3.2 $4.8 $6.4
Asthma Exacerbations $0.1 $0.2 $0.3 $0.4
20
Abt Recommendations for Study Refinement• County-level COBRA modeling to generate a spatial matrix• Development of an Access-based tool that uses the spatial
matrix to enable customized and predefined county-groupings; user-defined county-level wood smoke reductions; user-defined efficiencies
• Customizing health functions and values to the PNW study area
• Accounting for re-dispatching of electricity• Employing a more sophisticated dispersion model, such as
CMAQ• Accounting for additional benefits, such as reduced materials
deterioration
21
Next Steps & Future Analyses• Staff is researching the following:
• Additional model runs• Isolate geographic and volumetric effect• Study effects of lower levels of wood smoke reduction
• Limitations of study (scaling, baseline, re-dispatch)• Monetization assumptions used and approved by the EPA
• Following said research, staff will draft a report on quantifiability and monetizability of wood smoke for the Policy Advisory Committee and the Council
• Staff will seek approval from the RTF before submitting report.

![[MS-OXRTFCP]: Rich Text Format (RTF) Compression Algorithm · The Rich Text Format (RTF) Compression Algorithm is used to compress and decompress RTF data, as described in [MSFT-RTF],](https://img.pdfslide.us/doc/110x75/5e9e1be31138b067ae753825/ms-oxrtfcp-rich-text-format-rtf-compression-algorithm-the-rich-text-format.jpg)