Embed Size (px)
Citation preview
7–1
Chapter 7FasteningsLawrence A . Soltis
ContentsNails 7–2
Withdrawal Resistance 7–2Lateral Resistance 7–5
Spikes 7–8Staples 7–8Drift Bolts 7–9Wood Screws 7–9
Withdrawal Resistance 7–9Lateral Resistance 7–10
Lag Screws 7–11Withdrawal Resistance 7–11Lateral Resistance 7–12
Bolts 7–14Bearing Stress of Wood Under Bolts 7–14Loads at an Angle to the Grain 7–14Steel Side Plates 7–15Bolt Quality 7–15Effect of Member Thickness 7–15Two-Member, Multiple-Member Joints 7–15Spacing, Edge, and End Distance 7–16Effect of Bolt Holes 7–16Pre-1991 Allowable Loads 7–17Post-1991 Yield Model 7–18
Connector Joints 7–18Parallel-to-Grain Loading 7–18Perpendicular-to-Grain Loading 7–18Design Loads 7–20Modifications 7–21Net Section 7–23End Distance and Spacing 7–23Placement of Multiple Connectors 7–23Cross Bolts 7–24
Multiple-Fastener Joints 7–24Metal Plate Connectors 7–25Fastener Head Embedment 7–26References 7–27
he strength and stability of any structure dependheavily on the fastenings that hold its partstogether. One prime advantage of wood as a
structural material is the ease with which wood structuralparts can be joined together with a wide variety of fasten-ings—nails, spikes, screws, bolts, lag screws, drift pins,staples, and metal connectors of various types. For utmostrigidity, strength, and service, each type of fastening requiresjoint designs adapted to the strength properties of woodalong and across the grain and to dimensional changes thatmay occur with changes in moisture content.
Maximum lateral resistance and safe design load values forsmall-diameter (nails, spikes, and wood screws) and large-diameter dowel-type fasteners (bolts, lag screws, and driftpins) were based on an empirical method prior to 1991.Research conducted during the 1980s resulted in lateralresistance values that are currently based on a yield modeltheory. This theoretical method was adapted for the 1991edition of the National Design Specification for WoodConstruction (NDS). Because literature and design proce-dures exist that are related to both the empirical and theoreti-cal methods, we refer to the empirical method as pre-1991and the theoretical method as post-1991 throughout thischapter. Withdrawal resistance methods have not changed,so the pre- and post-1991 refer only to lateral resistance.
The information in this chapter represents primarily ForestProducts Laboratory research results. A more comprehensivediscussion of fastenings is given in the American Society ofCivil Engineers Manuals and Reports on EngineeringPractice No. 84, Mechanical Connections in Wood Struc-tures. The research results of this chapter are often modifiedfor structural safety, based on judgment or experience, andthus information presented in design documents may differfrom information presented in this chapter. Additionally,research by others serves as a basis for some current designcriteria. Allowable stress design criteria are presented in theNational Design Specification for Wood Construction pub-lished by the American Forest and Paper Association; limitstates design criteria are presented in the Standard for Loadand Resistance Factor Design (LRFD) for Engineered WoodConstruction published by the American Society ofCivil Engineers.
7–2
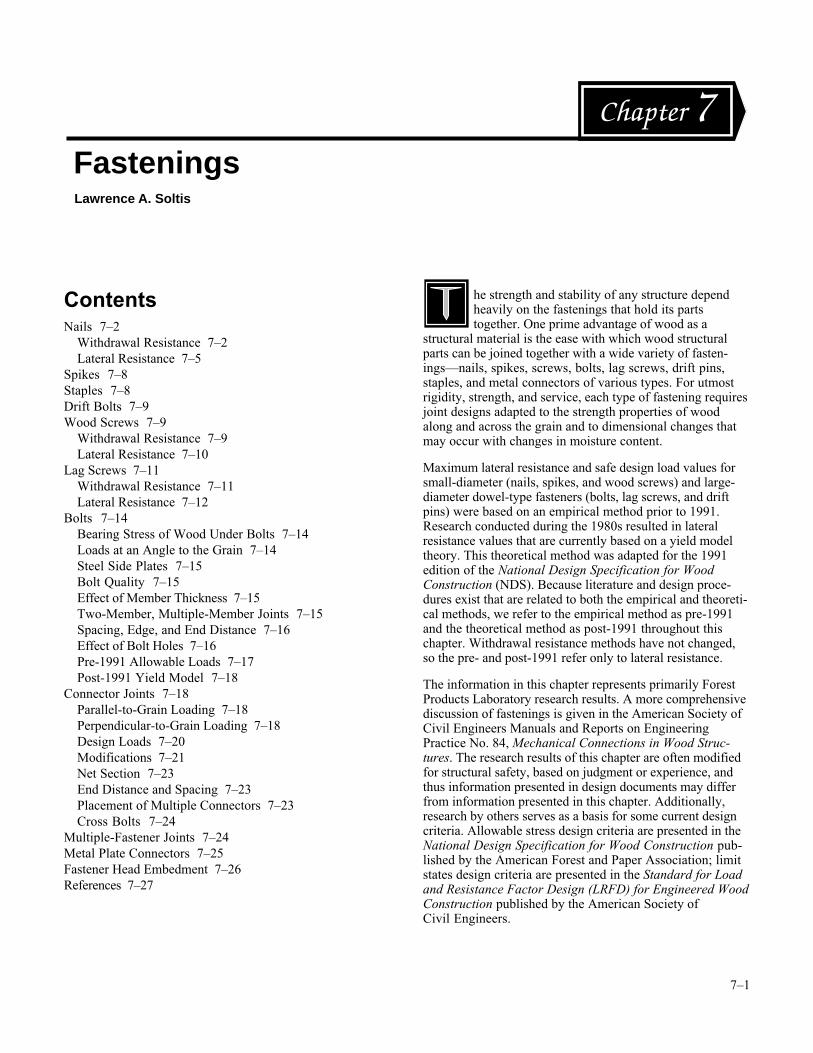
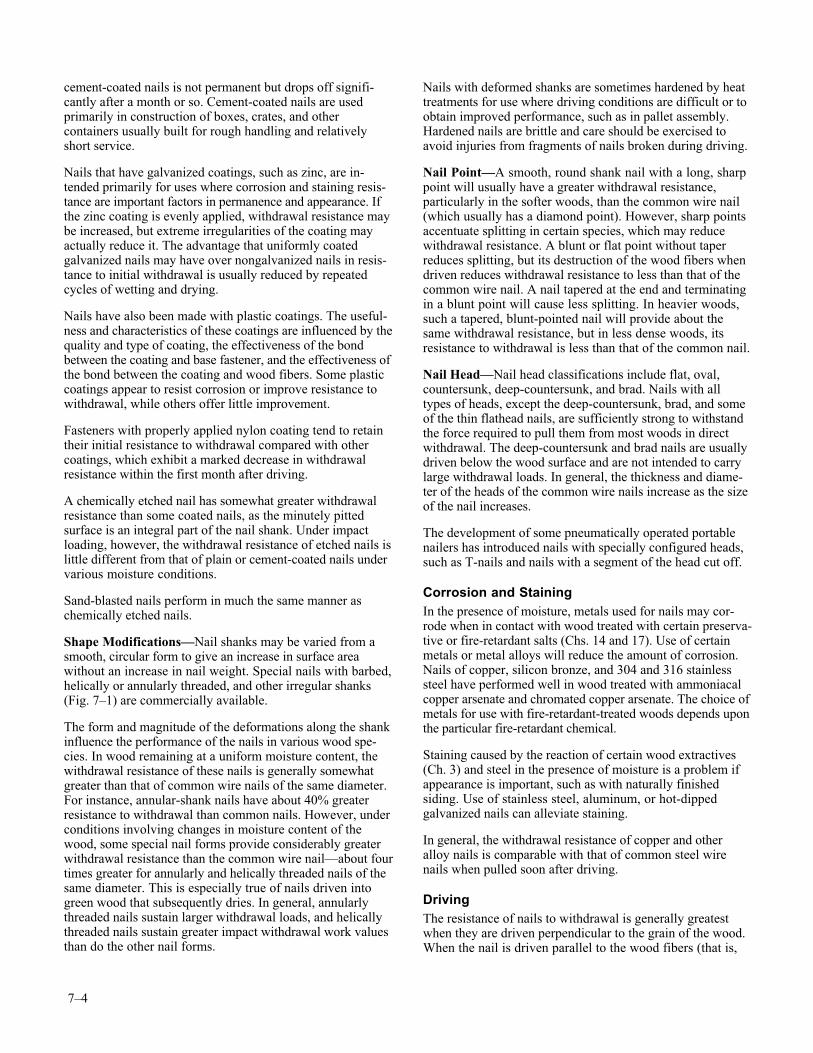
NailsNails are the most common mechanical fastenings used inwood construction. There are many types, sizes, and forms ofnails (Fig. 7–1). The load equations presented in this chapterapply for bright, smooth, common steel wire nails driveninto wood when there is no visible splitting. For nails otherthan common wire nails, the loads can be adjusted by factorsgiven later in the chapter.
Nails in use resist withdrawal loads, lateral loads, or a com-bination of the two. Both withdrawal and lateral resistanceare affected by the wood, the nail, and the condition of use.In general, however, any variation in these factors has a morepronounced effect on withdrawal resistance than on lateralresistance. The serviceability of joints with nails laterallyloaded does not depend greatly on withdrawal resistanceunless large joint distortion is tolerable.
The diameters of various penny or gauge sizes of brightcommon nails are given in Table 7–1. The penny size des-ignation should be used cautiously. International nail pro-ducers sometimes do not adhere to the dimensions ofTable 7–1. Thus penny sizes, although still widely used, areobsolete. Specifying nail sizes by length and diameter di-mensions is recommended. Bright box nails are generally ofthe same length but slightly smaller diameter (Table 7–2),while cement-coated nails such as coolers, sinkers, andcoated box nails are slightly shorter (3.2 mm (1/8 in.)) andof smaller diameter than common nails of the same pennysize. Helically and annularly threaded nails generally havesmaller diameters than common nails for the same penny size(Table 7–3).
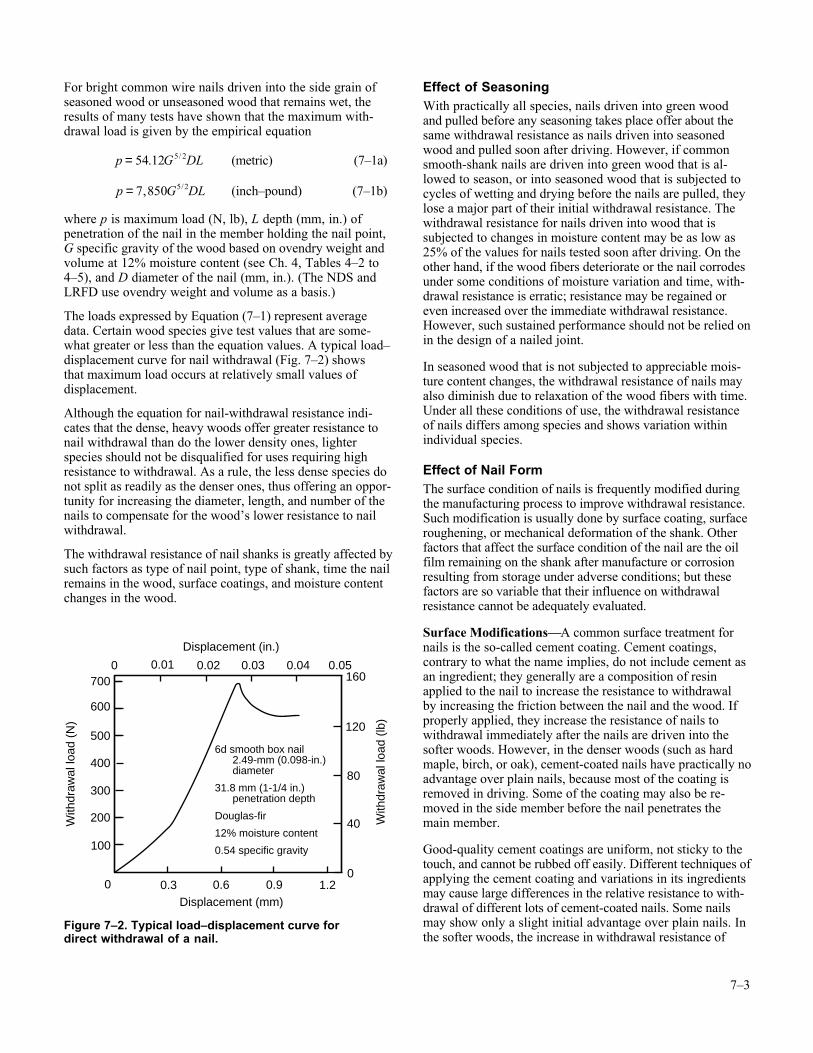
Withdrawal ResistanceThe resistance of a nail shank to direct withdrawal from apiece of wood depends on the density of the wood, thediameter of the nail, and the depth of penetration. The surfacecondition of the nail at the time of driving also influences theinitial withdrawal resistance.
Figure 7–1. Various types of nails: (left to right) brightsmooth wire nail, cement coated, zinc-coated, annularlythreaded, helically threaded, helically threaded andbarbed, and barbed.
Table 7–1. Sizes of bright common wire nails
Size GaugeLength
(mm (in.))Diameter(mm (in.))
6d 11-1/2 50.8 (2) 2.87 (0.113)
8d 10-1/4 63.5 (2-1/2) 3.33 (0.131)
10d 9 76.2 (3) 3.76 (0.148)
12d 9 82.6 (3-1/4) 3.76 (0.148)
16d 8 88.9 (3-1/2) 4.11 (0.162)
20d 6 101.6 (4) 4.88 (0.192)
30d 5 114.3 (4-1/2) 5.26 (0.207)
40d 4 127.0 (5) 5.72 (0.225)
50d 3 139.7 (5-1/2) 6.20 (0.244)
60d 2 152.4 (6) 6.65 (0.262)
Table 7–2. Sizes of smooth box nails
Size GaugeLength
(mm (in.))Diameter(mm (in.))
3d 14-1/2 31.8 (1-1/4) 1.93 (0.076)
4d 14 38.1 (1-1/2) 2.03 (0.080)
5d 14 44.5 (1-3/4) 2.03 (0.080)
6d 12-1/2 50.8 (2) 2.49 (0.098)
7d 12-1/2 57.2 (2-1/4) 2.49 (0.098)
8d 11-1/2 63.5 (2-1/2) 2.87 (0.113)
10d 10-1/2 76.2 (3) 3.25 (0.128)
16d 10 88.9 (3-1/2) 3.43 (0.135)
20d 9 101.6 (4) 3.76 (0.148)
Table 7–3. Sizes of helically and annularlythreaded nails
Size Length (mm (in.))
Diameter(mm (in.))
6d 50.8 (2) 3.05 (0.120)
8d 63.5 (2-1/2) 3.05 (0.120)
10d 76.2 (3) 3.43 (0.135)
12d 82.6 (3-1/4) 3.43 (0.135)
16d 88.9 (3-1/2) 3.76 (0.148)
20d 101.6 (4) 4.50 (0.177)
30d 114.3 (4-1/2) 4.50 (0.177)
40d 127.0 (5) 4.50 (0.177)
50d 139.7 (5-1/2) 4.50 (0.177)
60d 152.4 (6) 4.50 (0.177)
70d 177.8 (7) 5.26 (0.207)
80d 203.2 (8) 5.26 (0.207)
90d 228.6 (9) 5.26 (0.207)
7–3
For bright common wire nails driven into the side grain ofseasoned wood or unseasoned wood that remains wet, theresults of many tests have shown that the maximum with-drawal load is given by the empirical equation
p G DL= 54 12 5 2. / (metric) (7–1a)
p G DL= 7 850 5 2, / (inch–pound) (7–1b)
where p is maximum load (N, lb), L depth (mm, in.) ofpenetration of the nail in the member holding the nail point,G specific gravity of the wood based on ovendry weight andvolume at 12% moisture content (see Ch. 4, Tables 4–2 to4–5), and D diameter of the nail (mm, in.). (The NDS andLRFD use ovendry weight and volume as a basis.)
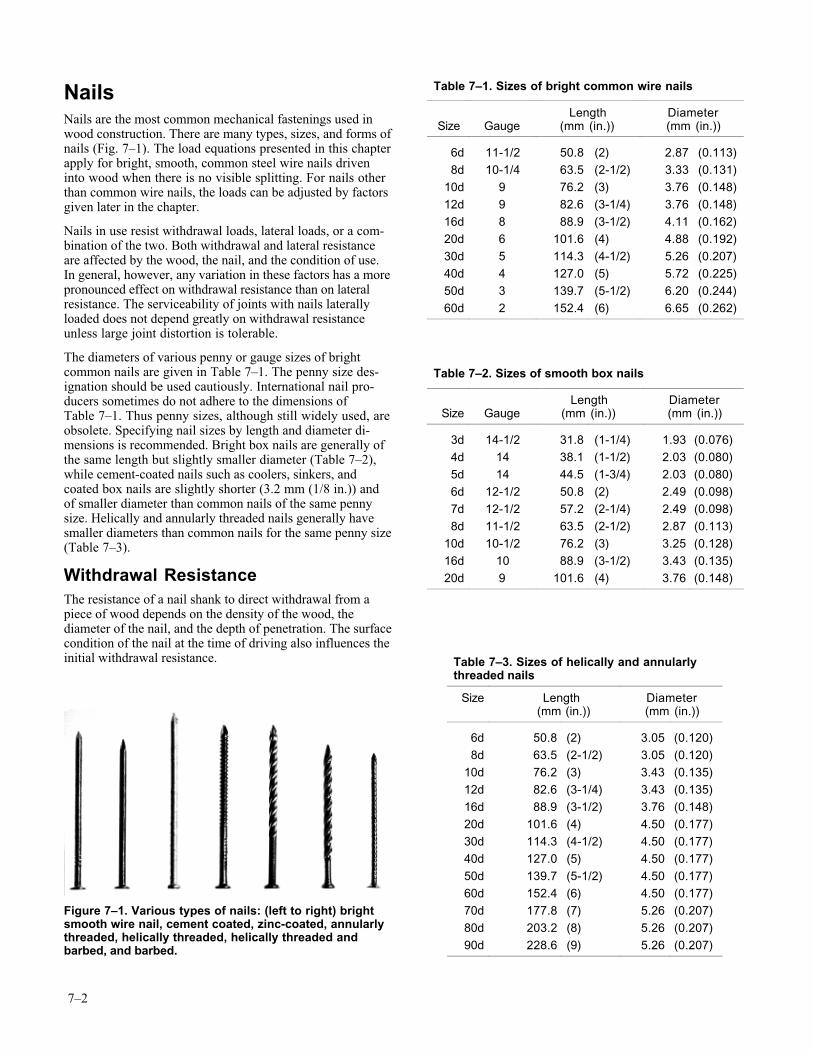
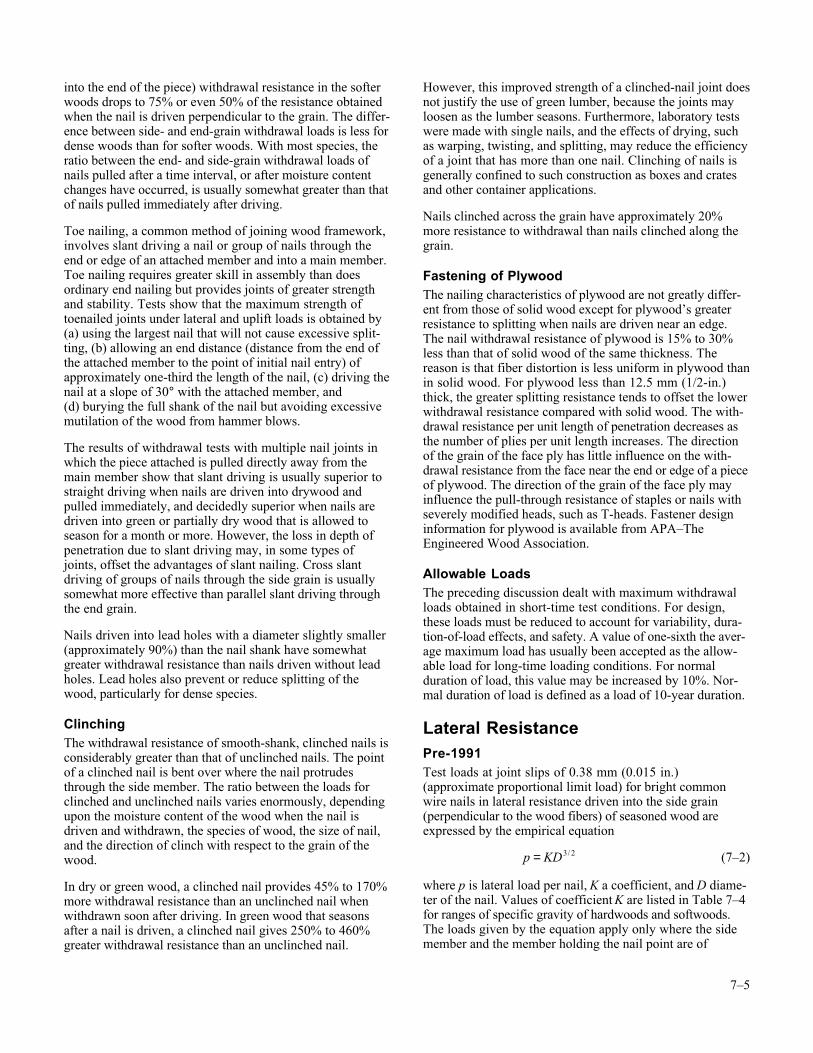
The loads expressed by Equation (7–1) represent averagedata. Certain wood species give test values that are some-what greater or less than the equation values. A typical load–displacement curve for nail withdrawal (Fig. 7–2) showsthat maximum load occurs at relatively small values ofdisplacement.
Although the equation for nail-withdrawal resistance indi-cates that the dense, heavy woods offer greater resistance tonail withdrawal than do the lower density ones, lighterspecies should not be disqualified for uses requiring highresistance to withdrawal. As a rule, the less dense species donot split as readily as the denser ones, thus offering an oppor-tunity for increasing the diameter, length, and number of thenails to compensate for the wood’s lower resistance to nailwithdrawal.
The withdrawal resistance of nail shanks is greatly affected bysuch factors as type of nail point, type of shank, time the nailremains in the wood, surface coatings, and moisture contentchanges in the wood.
Effect of SeasoningWith practically all species, nails driven into green woodand pulled before any seasoning takes place offer about thesame withdrawal resistance as nails driven into seasonedwood and pulled soon after driving. However, if commonsmooth-shank nails are driven into green wood that is al-lowed to season, or into seasoned wood that is subjected tocycles of wetting and drying before the nails are pulled, theylose a major part of their initial withdrawal resistance. Thewithdrawal resistance for nails driven into wood that issubjected to changes in moisture content may be as low as25% of the values for nails tested soon after driving. On theother hand, if the wood fibers deteriorate or the nail corrodesunder some conditions of moisture variation and time, with-drawal resistance is erratic; resistance may be regained oreven increased over the immediate withdrawal resistance.However, such sustained performance should not be relied onin the design of a nailed joint.
In seasoned wood that is not subjected to appreciable mois-ture content changes, the withdrawal resistance of nails mayalso diminish due to relaxation of the wood fibers with time.Under all these conditions of use, the withdrawal resistanceof nails differs among species and shows variation withinindividual species.
Effect of Nail FormThe surface condition of nails is frequently modified duringthe manufacturing process to improve withdrawal resistance.Such modification is usually done by surface coating, surfaceroughening, or mechanical deformation of the shank. Otherfactors that affect the surface condition of the nail are the oilfilm remaining on the shank after manufacture or corrosionresulting from storage under adverse conditions; but thesefactors are so variable that their influence on withdrawalresistance cannot be adequately evaluated.
Surface Modifications—A common surface treatment fornails is the so-called cement coating. Cement coatings,contrary to what the name implies, do not include cement asan ingredient; they generally are a composition of resinapplied to the nail to increase the resistance to withdrawalby increasing the friction between the nail and the wood. Ifproperly applied, they increase the resistance of nails towithdrawal immediately after the nails are driven into thesofter woods. However, in the denser woods (such as hardmaple, birch, or oak), cement-coated nails have practically noadvantage over plain nails, because most of the coating isremoved in driving. Some of the coating may also be re-moved in the side member before the nail penetrates themain member.
Good-quality cement coatings are uniform, not sticky to thetouch, and cannot be rubbed off easily. Different techniques ofapplying the cement coating and variations in its ingredientsmay cause large differences in the relative resistance to with-drawal of different lots of cement-coated nails. Some nailsmay show only a slight initial advantage over plain nails. Inthe softer woods, the increase in withdrawal resistance of
700
With
draw
al lo
ad (
lb)
With
draw
al lo
ad (
N)
6d smooth box nail 2.49-mm (0.098-in.) diameter
31.8 mm (1-1/4 in.) penetration depth
Douglas-fir
12% moisture content
0.54 specific gravity
600
500
400
300
200
100
0.3
0 0.01 0.02 0.03 0.04 0.05160
120
80
40
00.6 0.9 1.2
Displacement (mm)
Displacement (in.)
0
Figure 7–2. Typical load–displacement curve fordirect withdrawal of a nail.
7–4
cement-coated nails is not permanent but drops off signifi-cantly after a month or so. Cement-coated nails are usedprimarily in construction of boxes, crates, and othercontainers usually built for rough handling and relativelyshort service.
Nails that have galvanized coatings, such as zinc, are in-tended primarily for uses where corrosion and staining resis-tance are important factors in permanence and appearance. Ifthe zinc coating is evenly applied, withdrawal resistance maybe increased, but extreme irregularities of the coating mayactually reduce it. The advantage that uniformly coatedgalvanized nails may have over nongalvanized nails in resis-tance to initial withdrawal is usually reduced by repeatedcycles of wetting and drying.
Nails have also been made with plastic coatings. The useful-ness and characteristics of these coatings are influenced by thequality and type of coating, the effectiveness of the bondbetween the coating and base fastener, and the effectiveness ofthe bond between the coating and wood fibers. Some plasticcoatings appear to resist corrosion or improve resistance towithdrawal, while others offer little improvement.
Fasteners with properly applied nylon coating tend to retaintheir initial resistance to withdrawal compared with othercoatings, which exhibit a marked decrease in withdrawalresistance within the first month after driving.
A chemically etched nail has somewhat greater withdrawalresistance than some coated nails, as the minutely pittedsurface is an integral part of the nail shank. Under impactloading, however, the withdrawal resistance of etched nails islittle different from that of plain or cement-coated nails undervarious moisture conditions.
Sand-blasted nails perform in much the same manner aschemically etched nails.
Shape Modifications—Nail shanks may be varied from asmooth, circular form to give an increase in surface areawithout an increase in nail weight. Special nails with barbed,helically or annularly threaded, and other irregular shanks(Fig. 7–1) are commercially available.
The form and magnitude of the deformations along the shankinfluence the performance of the nails in various wood spe-cies. In wood remaining at a uniform moisture content, thewithdrawal resistance of these nails is generally somewhatgreater than that of common wire nails of the same diameter.For instance, annular-shank nails have about 40% greaterresistance to withdrawal than common nails. However, underconditions involving changes in moisture content of thewood, some special nail forms provide considerably greaterwithdrawal resistance than the common wire nail—about fourtimes greater for annularly and helically threaded nails of thesame diameter. This is especially true of nails driven intogreen wood that subsequently dries. In general, annularlythreaded nails sustain larger withdrawal loads, and helicallythreaded nails sustain greater impact withdrawal work valuesthan do the other nail forms.
Nails with deformed shanks are sometimes hardened by heattreatments for use where driving conditions are difficult or toobtain improved performance, such as in pallet assembly.Hardened nails are brittle and care should be exercised toavoid injuries from fragments of nails broken during driving.
Nail Point—A smooth, round shank nail with a long, sharppoint will usually have a greater withdrawal resistance,particularly in the softer woods, than the common wire nail(which usually has a diamond point). However, sharp pointsaccentuate splitting in certain species, which may reducewithdrawal resistance. A blunt or flat point without taperreduces splitting, but its destruction of the wood fibers whendriven reduces withdrawal resistance to less than that of thecommon wire nail. A nail tapered at the end and terminatingin a blunt point will cause less splitting. In heavier woods,such a tapered, blunt-pointed nail will provide about thesame withdrawal resistance, but in less dense woods, itsresistance to withdrawal is less than that of the common nail.
Nail Head—Nail head classifications include flat, oval,countersunk, deep-countersunk, and brad. Nails with alltypes of heads, except the deep-countersunk, brad, and someof the thin flathead nails, are sufficiently strong to withstandthe force required to pull them from most woods in directwithdrawal. The deep-countersunk and brad nails are usuallydriven below the wood surface and are not intended to carrylarge withdrawal loads. In general, the thickness and diame-ter of the heads of the common wire nails increase as the sizeof the nail increases.
The development of some pneumatically operated portablenailers has introduced nails with specially configured heads,such as T-nails and nails with a segment of the head cut off.
Corrosion and StainingIn the presence of moisture, metals used for nails may cor-rode when in contact with wood treated with certain preserva-tive or fire-retardant salts (Chs. 14 and 17). Use of certainmetals or metal alloys will reduce the amount of corrosion.Nails of copper, silicon bronze, and 304 and 316 stainlesssteel have performed well in wood treated with ammoniacalcopper arsenate and chromated copper arsenate. The choice ofmetals for use with fire-retardant-treated woods depends uponthe particular fire-retardant chemical.
Staining caused by the reaction of certain wood extractives(Ch. 3) and steel in the presence of moisture is a problem ifappearance is important, such as with naturally finishedsiding. Use of stainless steel, aluminum, or hot-dippedgalvanized nails can alleviate staining.
In general, the withdrawal resistance of copper and otheralloy nails is comparable with that of common steel wirenails when pulled soon after driving.
DrivingThe resistance of nails to withdrawal is generally greatestwhen they are driven perpendicular to the grain of the wood.When the nail is driven parallel to the wood fibers (that is,
7–5
into the end of the piece) withdrawal resistance in the softerwoods drops to 75% or even 50% of the resistance obtainedwhen the nail is driven perpendicular to the grain. The differ-ence between side- and end-grain withdrawal loads is less fordense woods than for softer woods. With most species, theratio between the end- and side-grain withdrawal loads ofnails pulled after a time interval, or after moisture contentchanges have occurred, is usually somewhat greater than thatof nails pulled immediately after driving.
Toe nailing, a common method of joining wood framework,involves slant driving a nail or group of nails through theend or edge of an attached member and into a main member.Toe nailing requires greater skill in assembly than doesordinary end nailing but provides joints of greater strengthand stability. Tests show that the maximum strength oftoenailed joints under lateral and uplift loads is obtained by(a) using the largest nail that will not cause excessive split-ting, (b) allowing an end distance (distance from the end ofthe attached member to the point of initial nail entry) ofapproximately one-third the length of the nail, (c) driving thenail at a slope of 30° with the attached member, and(d) burying the full shank of the nail but avoiding excessivemutilation of the wood from hammer blows.
The results of withdrawal tests with multiple nail joints inwhich the piece attached is pulled directly away from themain member show that slant driving is usually superior tostraight driving when nails are driven into drywood andpulled immediately, and decidedly superior when nails aredriven into green or partially dry wood that is allowed toseason for a month or more. However, the loss in depth ofpenetration due to slant driving may, in some types ofjoints, offset the advantages of slant nailing. Cross slantdriving of groups of nails through the side grain is usuallysomewhat more effective than parallel slant driving throughthe end grain.
Nails driven into lead holes with a diameter slightly smaller(approximately 90%) than the nail shank have somewhatgreater withdrawal resistance than nails driven without leadholes. Lead holes also prevent or reduce splitting of thewood, particularly for dense species.
ClinchingThe withdrawal resistance of smooth-shank, clinched nails isconsiderably greater than that of unclinched nails. The pointof a clinched nail is bent over where the nail protrudesthrough the side member. The ratio between the loads forclinched and unclinched nails varies enormously, dependingupon the moisture content of the wood when the nail isdriven and withdrawn, the species of wood, the size of nail,and the direction of clinch with respect to the grain of thewood.
In dry or green wood, a clinched nail provides 45% to 170%more withdrawal resistance than an unclinched nail whenwithdrawn soon after driving. In green wood that seasonsafter a nail is driven, a clinched nail gives 250% to 460%greater withdrawal resistance than an unclinched nail.
However, this improved strength of a clinched-nail joint doesnot justify the use of green lumber, because the joints mayloosen as the lumber seasons. Furthermore, laboratory testswere made with single nails, and the effects of drying, suchas warping, twisting, and splitting, may reduce the efficiencyof a joint that has more than one nail. Clinching of nails isgenerally confined to such construction as boxes and cratesand other container applications.
Nails clinched across the grain have approximately 20%more resistance to withdrawal than nails clinched along thegrain.
Fastening of PlywoodThe nailing characteristics of plywood are not greatly differ-ent from those of solid wood except for plywood’s greaterresistance to splitting when nails are driven near an edge.The nail withdrawal resistance of plywood is 15% to 30%less than that of solid wood of the same thickness. Thereason is that fiber distortion is less uniform in plywood thanin solid wood. For plywood less than 12.5 mm (1/2-in.)thick, the greater splitting resistance tends to offset the lowerwithdrawal resistance compared with solid wood. The with-drawal resistance per unit length of penetration decreases asthe number of plies per unit length increases. The directionof the grain of the face ply has little influence on the with-drawal resistance from the face near the end or edge of a pieceof plywood. The direction of the grain of the face ply mayinfluence the pull-through resistance of staples or nails withseverely modified heads, such as T-heads. Fastener designinformation for plywood is available from APA–TheEngineered Wood Association.
Allowable LoadsThe preceding discussion dealt with maximum withdrawalloads obtained in short-time test conditions. For design,these loads must be reduced to account for variability, dura-tion-of-load effects, and safety. A value of one-sixth the aver-age maximum load has usually been accepted as the allow-able load for long-time loading conditions. For normalduration of load, this value may be increased by 10%. Nor-mal duration of load is defined as a load of 10-year duration.
Lateral ResistancePre-1991Test loads at joint slips of 0.38 mm (0.015 in.)(approximate proportional limit load) for bright commonwire nails in lateral resistance driven into the side grain(perpendicular to the wood fibers) of seasoned wood areexpressed by the empirical equation
p KD= 3 2/ (7–2)
where p is lateral load per nail, K a coefficient, and D diame-ter of the nail. Values of coefficient K are listed in Table 7–4for ranges of specific gravity of hardwoods and softwoods.The loads given by the equation apply only where the sidemember and the member holding the nail point are of
7–6
approximately the same density. The thickness of the sidemember should be about one-half the depth of penetration ofthe nail in the member holding the point.
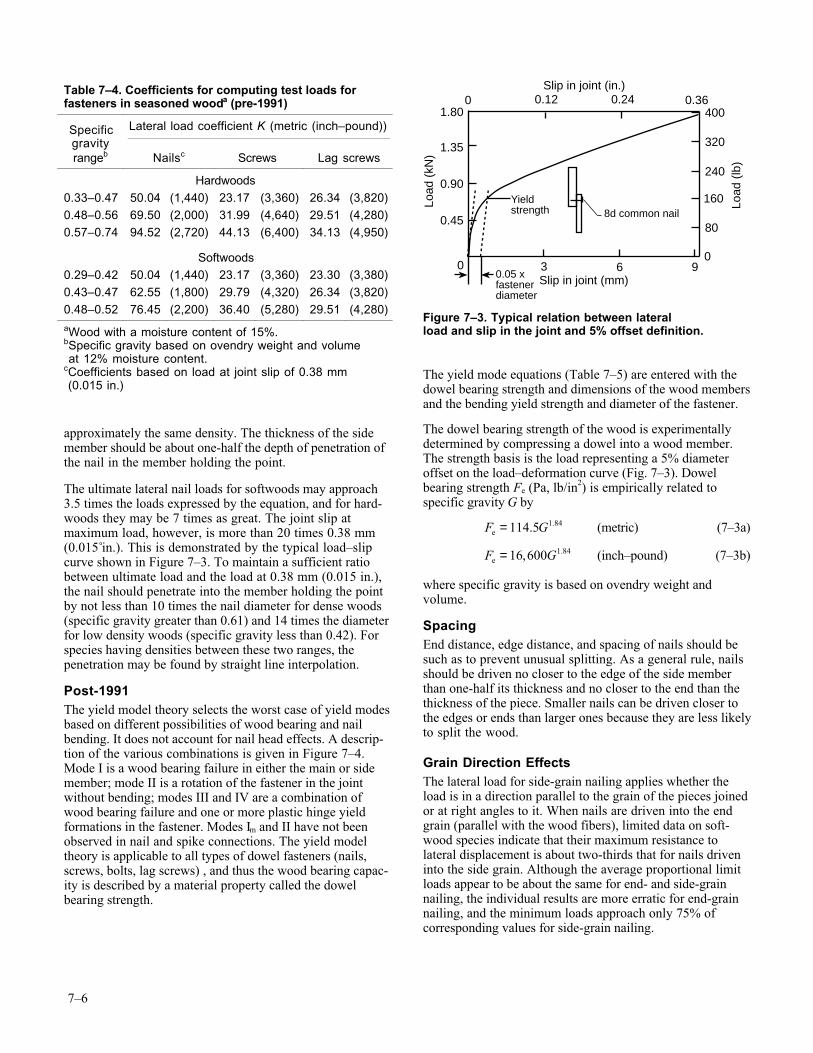
The ultimate lateral nail loads for softwoods may approach3.5 times the loads expressed by the equation, and for hard-woods they may be 7 times as great. The joint slip atmaximum load, however, is more than 20 times 0.38 mm(0.015 in.). This is demonstrated by the typical load–slipcurve shown in Figure 7–3. To maintain a sufficient ratiobetween ultimate load and the load at 0.38 mm (0.015 in.),the nail should penetrate into the member holding the pointby not less than 10 times the nail diameter for dense woods(specific gravity greater than 0.61) and 14 times the diameterfor low density woods (specific gravity less than 0.42). Forspecies having densities between these two ranges, thepenetration may be found by straight line interpolation.
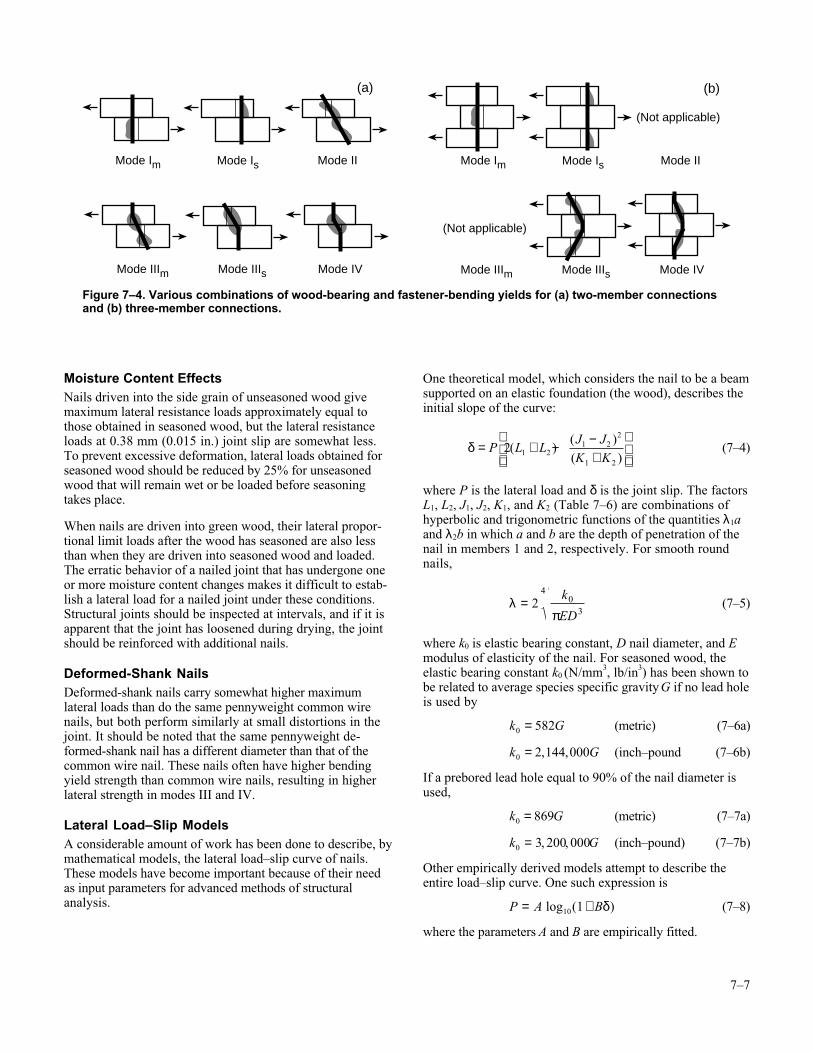
Post-1991The yield model theory selects the worst case of yield modesbased on different possibilities of wood bearing and nailbending. It does not account for nail head effects. A descrip-tion of the various combinations is given in Figure 7–4.Mode I is a wood bearing failure in either the main or sidemember; mode II is a rotation of the fastener in the jointwithout bending; modes III and IV are a combination ofwood bearing failure and one or more plastic hinge yieldformations in the fastener. Modes Im and II have not beenobserved in nail and spike connections. The yield modeltheory is applicable to all types of dowel fasteners (nails,screws, bolts, lag screws) , and thus the wood bearing capac-ity is described by a material property called the dowelbearing strength.
The yield mode equations (Table 7–5) are entered with thedowel bearing strength and dimensions of the wood membersand the bending yield strength and diameter of the fastener.
The dowel bearing strength of the wood is experimentallydetermined by compressing a dowel into a wood member.The strength basis is the load representing a 5% diameteroffset on the load–deformation curve (Fig. 7–3). Dowelbearing strength Fe (Pa, lb/in2) is empirically related tospecific gravity G by
F Ge = 114 5 1 84. . (metric) (7–3a)
F Ge = 16 600 1 84, . (inch–pound) (7–3b)
where specific gravity is based on ovendry weight andvolume.
SpacingEnd distance, edge distance, and spacing of nails should besuch as to prevent unusual splitting. As a general rule, nailsshould be driven no closer to the edge of the side memberthan one-half its thickness and no closer to the end than thethickness of the piece. Smaller nails can be driven closer tothe edges or ends than larger ones because they are less likelyto split the wood.
Grain Direction EffectsThe lateral load for side-grain nailing applies whether theload is in a direction parallel to the grain of the pieces joinedor at right angles to it. When nails are driven into the endgrain (parallel with the wood fibers), limited data on soft-wood species indicate that their maximum resistance tolateral displacement is about two-thirds that for nails driveninto the side grain. Although the average proportional limitloads appear to be about the same for end- and side-grainnailing, the individual results are more erratic for end-grainnailing, and the minimum loads approach only 75% ofcorresponding values for side-grain nailing.
Table 7–4. Coefficients for computing test loads forfasteners in seasoned wooda (pre-1991)
Specificgravity
Lateral load coefficient K (metric (inch–pound))
rangeb Nailsc Screws Lag screws
Hardwoods
0.33–0.47 50.04 (1,440) 23.17 (3,360) 26.34 (3,820)
0.48–0.56 69.50 (2,000) 31.99 (4,640) 29.51 (4,280)
0.57–0.74 94.52 (2,720) 44.13 (6,400) 34.13 (4,950)
Softwoods
0.29–0.42 50.04 (1,440) 23.17 (3,360) 23.30 (3,380)
0.43–0.47 62.55 (1,800) 29.79 (4,320) 26.34 (3,820)
0.48–0.52 76.45 (2,200) 36.40 (5,280) 29.51 (4,280)
aWood with a moisture content of 15%.bSpecific gravity based on ovendry weight and volume at 12% moisture content.cCoefficients based on load at joint slip of 0.38 mm (0.015 in.)
3 6 9
0 0.12 0.24 0.36
8d common nail
1.80
1.35
0.90
0.45
Load
(kN
)
Load
(lb
)
400
320
240
160
80
00
Slip in joint (mm)
Slip in joint (in.)
Yieldstrength
0.05 xfastenerdiameter
Figure 7–3. Typical relation between lateralload and slip in the joint and 5% offset definition.
7–7
Moisture Content EffectsNails driven into the side grain of unseasoned wood givemaximum lateral resistance loads approximately equal tothose obtained in seasoned wood, but the lateral resistanceloads at 0.38 mm (0.015 in.) joint slip are somewhat less.To prevent excessive deformation, lateral loads obtained forseasoned wood should be reduced by 25% for unseasonedwood that will remain wet or be loaded before seasoningtakes place.
When nails are driven into green wood, their lateral propor-tional limit loads after the wood has seasoned are also lessthan when they are driven into seasoned wood and loaded.The erratic behavior of a nailed joint that has undergone oneor more moisture content changes makes it difficult to estab-lish a lateral load for a nailed joint under these conditions.Structural joints should be inspected at intervals, and if it isapparent that the joint has loosened during drying, the jointshould be reinforced with additional nails.
Deformed-Shank NailsDeformed-shank nails carry somewhat higher maximumlateral loads than do the same pennyweight common wirenails, but both perform similarly at small distortions in thejoint. It should be noted that the same pennyweight de-formed-shank nail has a different diameter than that of thecommon wire nail. These nails often have higher bendingyield strength than common wire nails, resulting in higherlateral strength in modes III and IV.
Lateral Load–Slip ModelsA considerable amount of work has been done to describe, bymathematical models, the lateral load–slip curve of nails.These models have become important because of their needas input parameters for advanced methods of structuralanalysis.
One theoretical model, which considers the nail to be a beamsupported on an elastic foundation (the wood), describes theinitial slope of the curve:
δ = + − −
+
P L LJ JK K
2 1 21 2
2
1 2
( )( )( )
(7–4)
where P is the lateral load and δ is the joint slip. The factorsL1, L2, J1, J2, K1, and K2 (Table 7–6) are combinations ofhyperbolic and trigonometric functions of the quantities λ1aand λ2b in which a and b are the depth of penetration of thenail in members 1 and 2, respectively. For smooth roundnails,
λ
π= 2 0
3
4 k
ED(7–5)
where k0 is elastic bearing constant, D nail diameter, and Emodulus of elasticity of the nail. For seasoned wood, theelastic bearing constant k0 (N/mm3, lb/in3) has been shown tobe related to average species specific gravity G if no lead holeis used by
k G0 582= (metric) (7–6a)
k G0 2 144 000= , , (inch–pound (7–6b)
If a prebored lead hole equal to 90% of the nail diameter isused,
k G0 869= (metric) (7–7a)
k G0 3 200 000= , , (inch–pound) (7–7b)
Other empirically derived models attempt to describe theentire load–slip curve. One such expression is
P A B= +log10 1( )δ (7–8)
where the parameters A and B are empirically fitted.
Mode Im Mode Is Mode II
(Not applicable)
(b)
Mode Im Mode Is Mode II
(a)
Mode IIIm Mode IIIs Mode IV
(Not applicable)
Mode IIIm Mode IIIs Mode IV
Figure 7–4. Various combinations of wood-bearing and fastener-bending yields for (a) two-member connectionsand (b) three-member connections.
7–8
SpikesCommon wire spikes are manufactured in the same manneras common wire nails. They have either a chisel point or adiamond point and are made in lengths of 76 to 305 mm(3 to 12 in.). For corresponding lengths in the range of 76 to152 (3 to 6 in.), they have larger diameters (Table 7–7) thancommon wire nails, and beyond the 60d size they are usuallydesignated by diameter.
The withdrawal and lateral resistance equations and limita-tions given for common wire nails are also applicable tospikes, except that in calculating the withdrawal load forspikes, the depth of penetration is taken as the length of thespike in the member receiving the point, minus two-thirdsthe length of the point.
StaplesDifferent types of staples have been developed with variousmodifications in points, shank treatment and coatings,gauge, crown width, and length. These fasteners are availablein clips or magazines for use in pneumatically operatedportable staplers. Most factors that affect the withdrawal andlateral loads of nails similarly affect the loads on staples. Thewithdrawal resistance, for example, varies almost directlywith the circumference and depth of penetration when thetype of point and shank are similar to nails. Thus, Equation(7–1) has been used to predict the withdrawal load for oneleg of a staple, but no verification tests have been done.
The load in lateral resistance varies approximately as the 3/2power of the diameter when other factors, such as quality ofmetal, type of shank, and depth of penetration, are similar tonails. The diameter of each leg of a two-legged staple musttherefore be about two-thirds the diameter of a nail to providea comparable load. Equation (7–2) has been used to predictthe lateral resistance of staples. However, yield modeltheory equations have not yet been experimentally verifiedfor staples.
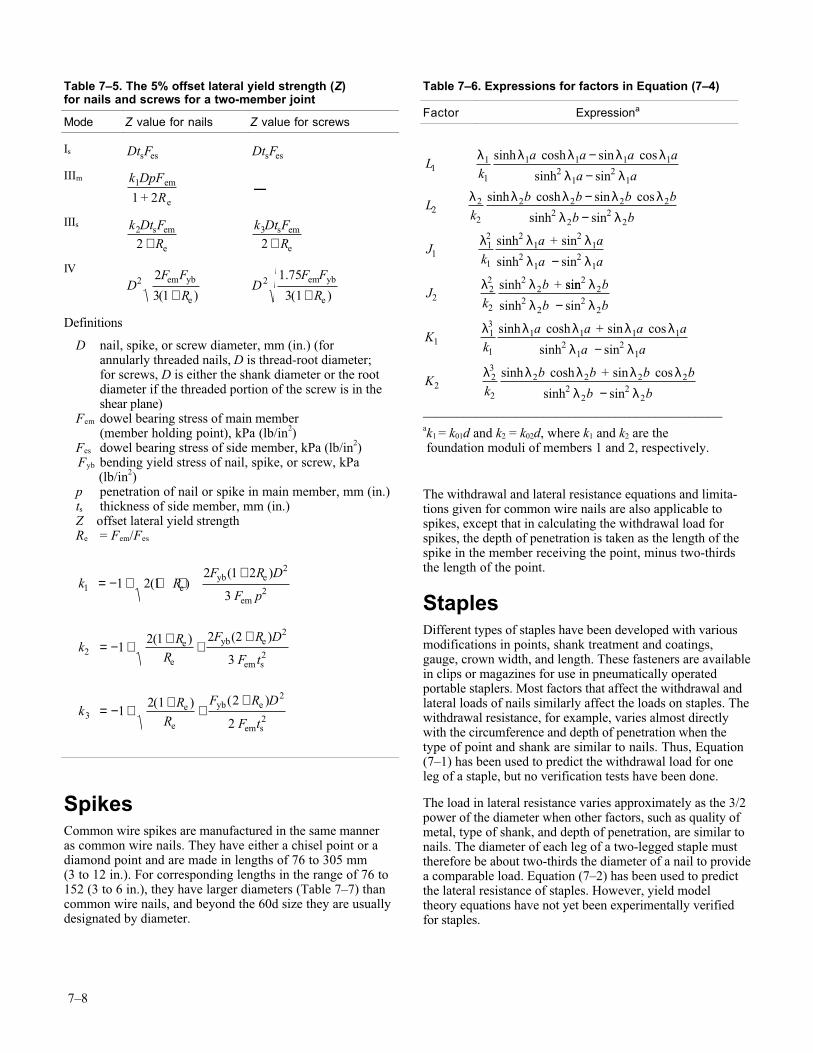
Table 7–5. The 5% offset lateral yield strength (Z)for nails and screws for a two-member joint
Mode Z value for nails Z value for screws
Is Dt Fs es Dt Fs es
IIIm
k DpF
+ R1
1 2em
e
—
IIIs
k Dt F
R2
2s em
e+
k Dt FR
3
2s em
e+
IV
D
F F
R2 2
3 1em yb
e( )+ D
F F
R2 1 75
3 1
.
( )em yb
e+
Definitions
D nail, spike, or screw diameter, mm (in.) (forannularly threaded nails, D is thread-root diameter;for screws, D is either the shank diameter or the rootdiameter if the threaded portion of the screw is in theshear plane)
Fem dowel bearing stress of main member(member holding point), kPa (lb/in2)
Fes dowel bearing stress of side member, kPa (lb/in2) Fyb bending yield stress of nail, spike, or screw, kPa (lb/in2)p penetration of nail or spike in main member, mm (in.)ts thickness of side member, mm (in.)Z offset lateral yield strengthRe = Fem/Fes
k R
F R D
F p1
2
21 2 1
2 1 2
3 ( )
( )= − + + +
+e
yb e
em
k
RR
F R D
F t2
2
21
2 1 2 2
3
( ) ( )= − + + +
+e
e
yb e
sem
kR
R
F R D
F t3
2
21
2 1 2
2
( ) ( )= − + + +
+e
e
yb e
sem
Table 7–6. Expressions for factors in Equation (7–4)
Factor Expressiona
Lk
a a a a
a a
Lk
b b b b
b b
Jk
a + a
a a
Jk
b +
11
1
1 1 1 12
12
1
22
2
2 2 2 22
22
2
112
1
21
21
21
21
222
2
22
sinh cosh sin cos
sinh sin
sinh cosh sin cos
sinh sin
sinh sin
sinh sin
sinh
λ λ λ λ λλ λ
λ λ λ λ λλ λ
λ λ λλ λ
λ λ
−−−−
−
sinsin
sinh sin
sinh cosh sin cos
sinh sin
sinh cosh sin cos
sinh sin
22
22
22
113
1
1 1 1 12
12
1
223
2
2 2 2 22
22
2
λλ λ
λ λ λ λ λλ λ
λ λ λ λ λλ λ
b
b b
Kk
a a + a a
a a
Kk
b b + b b
b b
−
−
−_____________________________________________ak1 = k01d and k2 = k02d, where k1 and k2 are the foundation moduli of members 1 and 2, respectively.
7–9
In addition to the immediate performance capability of sta-ples and nails as determined by test, factors such as corro-sion, sustained performance under service conditions, anddurability in various uses should be considered in evaluatingthe relative usefulness of a stapled connection.
Drift BoltsA drift bolt (or drift pin) is a long pin of iron or steel, withor without head or point. It is driven into a bored holethrough one timber and into an adjacent one, to prevent theseparation of the timbers connected and to transmit lateralload. The hole in the second member is drilled sufficientlydeep to prevent the pin from hitting the bottom.
The ultimate withdrawal load of a round drift bolt or pinfrom the side grain of seasoned wood is given by
p G DL= 45 51 2. (metric) (7–9a)
p G DL= 6 600 2, (inch–pound) (7–9b)
where p is the ultimate withdrawal load (N, lb), G specificgravity based on the ovendry weight and volume at 12%moisture content of the wood, D diameter of the drift bolt(mm, in.), and L length of penetration of the bolt (mm, in.).(The NDS and LRFD use ovendry weight and volume as abasis.)
This equation provides an average relationship for all spe-cies, and the withdrawal load for some species may be aboveor below the equation values. It also presumes that the boltsare driven into prebored holes having a diameter 3.2 mm(1/8 in.) less than the bolt diameter.
Data are not available on lateral resistance of drift bolts. Theyield model should provide lateral strength prediction, butthe model has not been experimentally verified for drift bolts.Designers have used bolt data and design methods based onexperience. This suggests that the load for a drift bolt driveninto the side grain of wood should not exceed, and ordinarily
should be taken as less than, that for a bolt of the samediameter. Bolt design values are based on the thickness ofthe main member in a joint. Thus the depth of penetrationof the drift bolt must be greater than or equal to the main-member thickness on which the bolt design value is based.However, the drift bolt should not fully penetrate its joint.
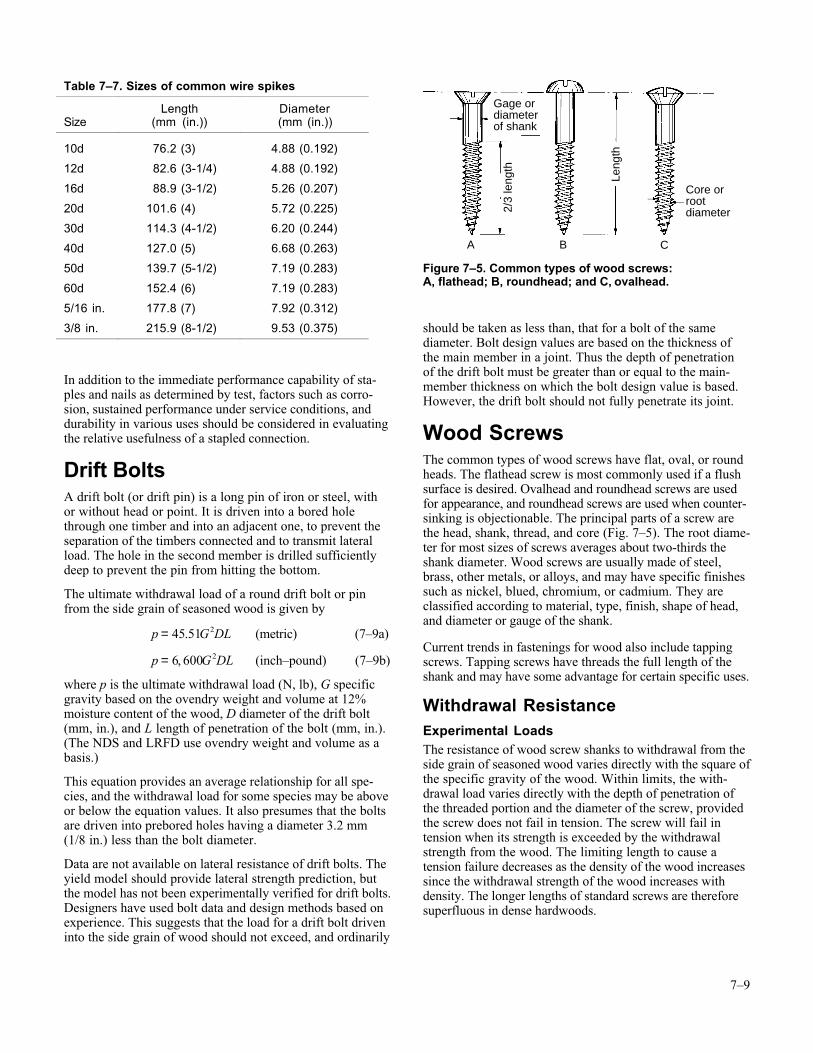
Wood ScrewsThe common types of wood screws have flat, oval, or roundheads. The flathead screw is most commonly used if a flushsurface is desired. Ovalhead and roundhead screws are usedfor appearance, and roundhead screws are used when counter-sinking is objectionable. The principal parts of a screw arethe head, shank, thread, and core (Fig. 7–5). The root diame-ter for most sizes of screws averages about two-thirds theshank diameter. Wood screws are usually made of steel,brass, other metals, or alloys, and may have specific finishessuch as nickel, blued, chromium, or cadmium. They areclassified according to material, type, finish, shape of head,and diameter or gauge of the shank.
Current trends in fastenings for wood also include tappingscrews. Tapping screws have threads the full length of theshank and may have some advantage for certain specific uses.
Withdrawal ResistanceExperimental LoadsThe resistance of wood screw shanks to withdrawal from theside grain of seasoned wood varies directly with the square ofthe specific gravity of the wood. Within limits, the with-drawal load varies directly with the depth of penetration ofthe threaded portion and the diameter of the screw, providedthe screw does not fail in tension. The screw will fail intension when its strength is exceeded by the withdrawalstrength from the wood. The limiting length to cause atension failure decreases as the density of the wood increasessince the withdrawal strength of the wood increases withdensity. The longer lengths of standard screws are thereforesuperfluous in dense hardwoods.
Table 7–7. Sizes of common wire spikes
Length DiameterSize (mm (in.)) (mm (in.))
10d 76.2 (3) 4.88 (0.192)
12d 82.6 (3-1/4) 4.88 (0.192)
16d 88.9 (3-1/2) 5.26 (0.207)
20d 101.6 (4) 5.72 (0.225)
30d 114.3 (4-1/2) 6.20 (0.244)
40d 127.0 (5) 6.68 (0.263)
50d 139.7 (5-1/2) 7.19 (0.283)
60d 152.4 (6) 7.19 (0.283)
5/16 in. 177.8 (7) 7.92 (0.312)
3/8 in. 215.9 (8-1/2) 9.53 (0.375)
Core orrootdiameter
Gage ordiameterof shank
2/3
leng
th
Leng
th
A B C
Figure 7–5. Common types of wood screws:A, flathead; B, roundhead; and C, ovalhead.
7–10
The withdrawal resistance of type A tapping screws, com-monly called sheet metal screws, is in general about 10%greater than that for wood screws of comparable diameter andlength of threaded portion. The ratio between the withdrawalresistance of tapping screws and wood screws varies from1.16 in denser woods, such as oak, to 1.05 in lighter woods,such as redwood.
Ultimate test values for withdrawal loads of wood screwsinserted into the side grain of seasoned wood may beexpressed as
p G DL= 108 25 2. (metric) (7–10a)
p G DL= 15 700 2, (inch–pound) (7–10b)
where p is maximum withdrawal load (N, lb), G specificgravity based on ovendry weight and volume at 12% mois-ture content, D shank diameter of the screw (mm, in.), and Llength of penetration of the threaded part of the screw (mm,in.). (The NDS and LRFD use ovendry weight and volumeas a basis.) These values are based on reaching ultimate loadin 5- to 10-min.
This equation is applicable when screw lead holes have adiameter of about 70% of the root diameter of the threads insoftwoods, and about 90% in hardwoods.
The equation values are applicable to the screw sizes listedin Table 7–8. (Shank diameters are related to screw gauges.)
For lengths and gauges outside these limits, the actualvalues are likely to be less than the equation values.
The withdrawal loads of screws inserted in the end grain ofwood are somewhat erratic, but when splitting is avoided,they should average 75% of the load sustained by screwsinserted in the side grain.
Lubricating the surface of a screw with soap or similar lubri-cant is recommended to facilitate insertion, especially indense woods, and it will have little effect on ultimate with-drawal resistance.
Fastening of ParticleboardTapping screws are commonly used in particleboard wherewithdrawal strength is important. Care must be taken whentightening screws in particleboard to avoid stripping thethreads. The maximum amount of torque that can be appliedto a screw before the threads in the particleboard are strippedis given by
T X= +3 16 0 0096. . (metric) (7–11a)
T X= +27 98 1 36. . (inch–pound) (7–11b)
where T is torque (N–m, in–lb) and X is density of theparticleboard (kg/m3, lb/ft3). Equation (7–11) is for 8-gaugescrews with a depth of penetration of 15.9 mm (5/8 in.). Themaximum torque is fairly constant for lead holes of 0 to 90%of the root diameter of the screw.
Ultimate withdrawal loads P (N, lb) of screws from particle-board can be predicted by
P = KD L D G1 2 5 4 23/ /( )− (7–12)
where D is shank diameter of the screw (mm, in.), L depth ofembedment of the threaded portion of the screw (mm, in.),and G specific gravity of the board based on ovendry weightand volume at current moisture content. For metric meas-urements, K = 41.1 for withdrawal from the face of the boardand K = 31.8 for withdrawal from the edge; for inch–poundmeasurements, K = 2,655 for withdrawal from the face andK = 2,055 for withdrawal from the edge. Equation (7–12)applies when the setting torque is between 60% to 90% of T(Eq. ( 7–11)).
Withdrawal resistance of screws from particleboard is notsignificantly different for lead holes of 50% to 90% of the rootdiameter. A higher setting torque will produce a somewhathigher withdrawal load, but there is only a slight difference(3%) in values between 60% to 90% setting torques(Eq. (7–11)). A modest tightening of screws in many casesprovides an effective compromise between optimizing with-drawal resistance and stripping threads.
Equation (7–12) can also predict the withdrawal of screwsfrom fiberboard with K = 57.3 (metric) or 3,700 (inch–pound) for the face and K = 44.3 (metric) or 2,860 (inch–pound) for the edge of the board.
Lateral ResistancePre-1991The proportional limit loads obtained in tests of lateralresistance for wood screws in the side grain of seasoned woodare given by the empirical equation
p KD= 2 (7–13)
where p is lateral load, D diameter of the screw shank, andK a coefficient depending on the inherent characteristics of thewood species. Values of screw shank diameters for variousscrew gauges are listed in Table 7–9.
Table 7–8. Screw sizesappropriate for Equation (7–10)
Screw length (mm (in.)) Gauge limits
12.7 (1/2) 1 to 6
19.0 (3/4) 2 to 11
25.4 (1) 3 to 12
38.1 (1-1/2) 5 to 14
50.8 (2) 7 to 16
63.5 (2-1/2) 9 to 18
76.2 (3) 12 to 20
7–11
Values of K are based on ranges of specific gravity of hard-woods and softwoods and are given in Table 7–4. Theyapply to wood at about 15% moisture content. Loads com-puted by substituting these constants in the equation areexpected to have a slip of 0.18 to 0.25 mm (0.007 to0.010 in.), depending somewhat on the species and densityof the wood.
Equation (7–13) applies when the depth of penetration of thescrew into the block receiving the point is not less thanseven times the shank diameter and when the side memberand the main member are approximately of the same density.The thickness of the side member should be about one-halfthe depth of penetration of the screw in the member holdingthe point. The end distance should be no less than the sidemember thickness, and the edge distances no less than one-half the side member thickness.
This depth of penetration (seven times shank diameter) givesan ultimate load of about four times the load obtained by theequation. For a depth of penetration of less than seven timesthe shank diameter, the ultimate load is reduced about inproportion to the reduction in penetration, and the load at theproportional limit is reduced somewhat less rapidly. Whenthe depth of penetration of the screw in the holding block isfour times the shank diameter, the maximum load will beless than three times the load expressed by the equation, andthe proportional limit load will be approximately equal tothat given by the equation. When the screw holds metal towood, the load can be increased by about 25%.
For these lateral loads, the part of the lead hole receiving theshank should be the same diameter as the shank or slightlysmaller; that part receiving the threaded portion should bethe same diameter as the root of the thread in dense speciesor slightly smaller than the root in low-density species.
Screws should always be turned in. They should never bestarted or driven with a hammer because this practice tearsthe wood fibers and injures the screw threads, seriouslyreducing the load carrying capacity of the screw.
Post-1991Screw lateral strength is determined by the yield modeltheory (Table 7–5). Modes I, III, and IV failures may occur(Fig. 7–4). The dowel bearing strength values are based onthe same specific gravity equation used to establish values fornails (Eq. (7–3)). Further discussion of screw lateral strengthis found in ASCE Manual No. 84, Mechanical Connectionsin Wood Structures.
Lag ScrewsLag screws are commonly used because of their convenience,particularly where it would be difficult to fasten a bolt orwhere a nut on the surface would be objectionable. Com-monly available lag screws range from about 5.1 to 25.4 mm(0.2 to 1 in.) in diameter and from 25.4 to 406 mm (1 to16 in.) in length. The length of the threaded part varies withthe length of the screw and ranges from 19.0 mm (3/4 in.)with the 25.4- and 31.8-mm (1- and 1-1/4-in.) screws to halfthe length for all lengths greater than 254 mm (10 in.). Lagscrews have a hexagonal-shaped head and are tightened by awrench (as opposed to wood screws, which have a slottedhead and are tightened by a screw driver). The followingequations for withdrawal and lateral loads are based on lagscrews having a base metal average tensile yield strength ofabout 310.3 MPa (45,000 lb/in2) and an average ultimatetensile strength of 530.9 MPa (77,000 lb/in2).
Withdrawal ResistanceThe results of withdrawal tests have shown that the maxi-mum direct withdrawal load of lag screws from the side grainof seasoned wood may be computed as
p G D L= 125 4 3 2 3 4. / / (metric) (7–14a)
p G D L= 8 100 3 2 3 4, / / (inch–pound) (7–14b)
where p is maximum withdrawal load (N, lb), D shankdiameter (mm, in.), G specific gravity of the wood based onovendry weight and volume at 12% moisture content, and Llength (mm, in.) of penetration of the threaded part. (TheNDS and LRFD use ovendry weight and volume as a basis.)Equation (7–14) was developed independently of Equation(7–10) but gives approximately the same results.
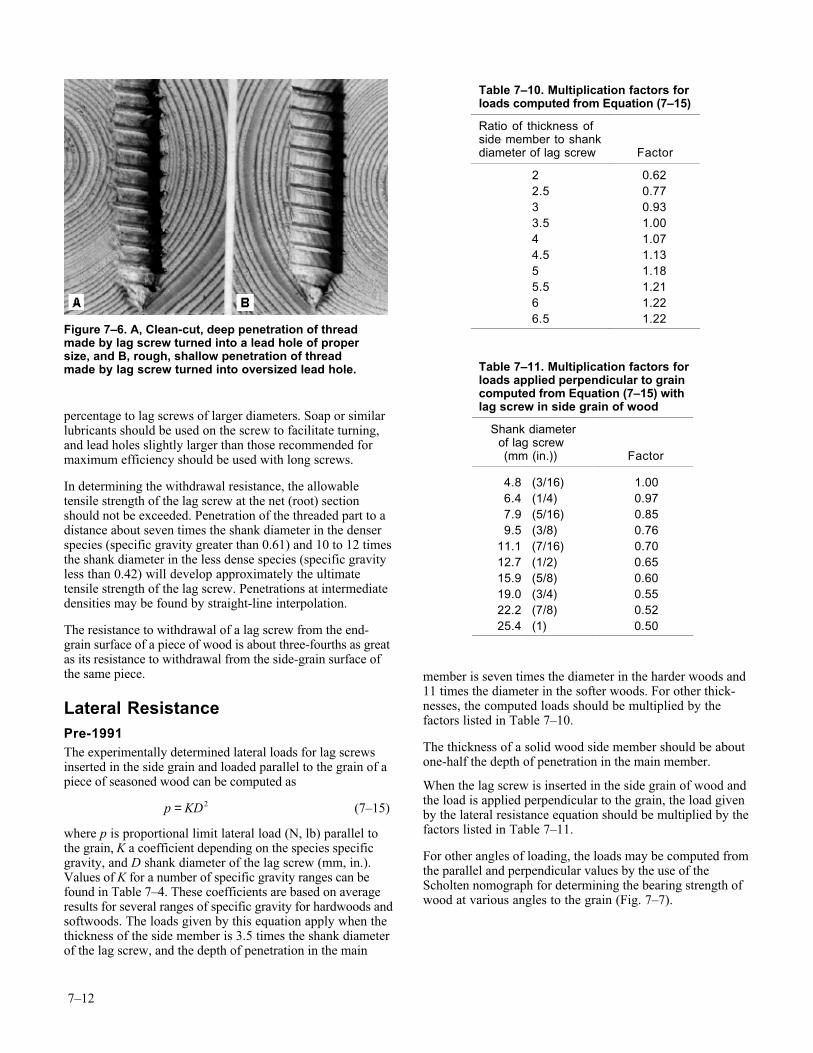
Lag screws, like wood screws, require prebored holes of theproper size (Fig. 7–6). The lead hole for the shank should bethe same diameter as the shank. The diameter of the leadhole for the threaded part varies with the density of the wood:For low-density softwoods, such as the cedars and whitepines, 40% to 70% of the shank diameter; for Douglas-fir andSouthern Pine, 60% to 75%; and for dense hardwoods, suchas oaks, 65% to 85%. The smaller percentage in each rangeapplies to lag screws of the smaller diameters and the larger
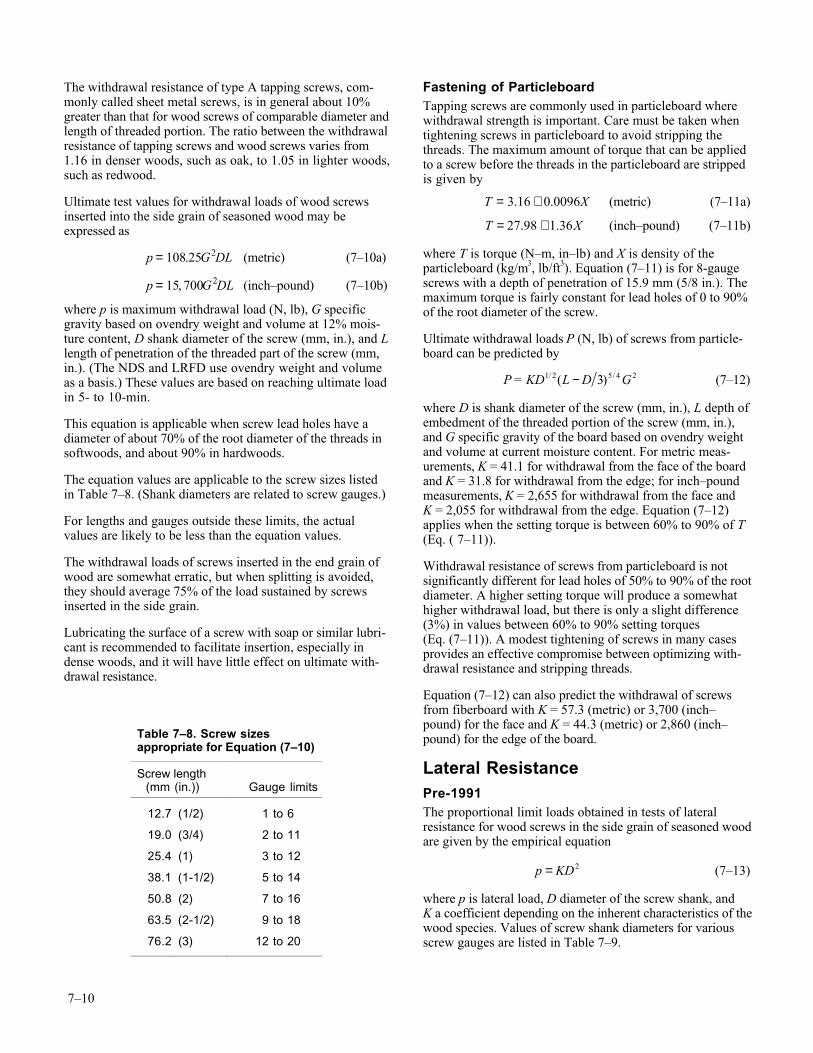
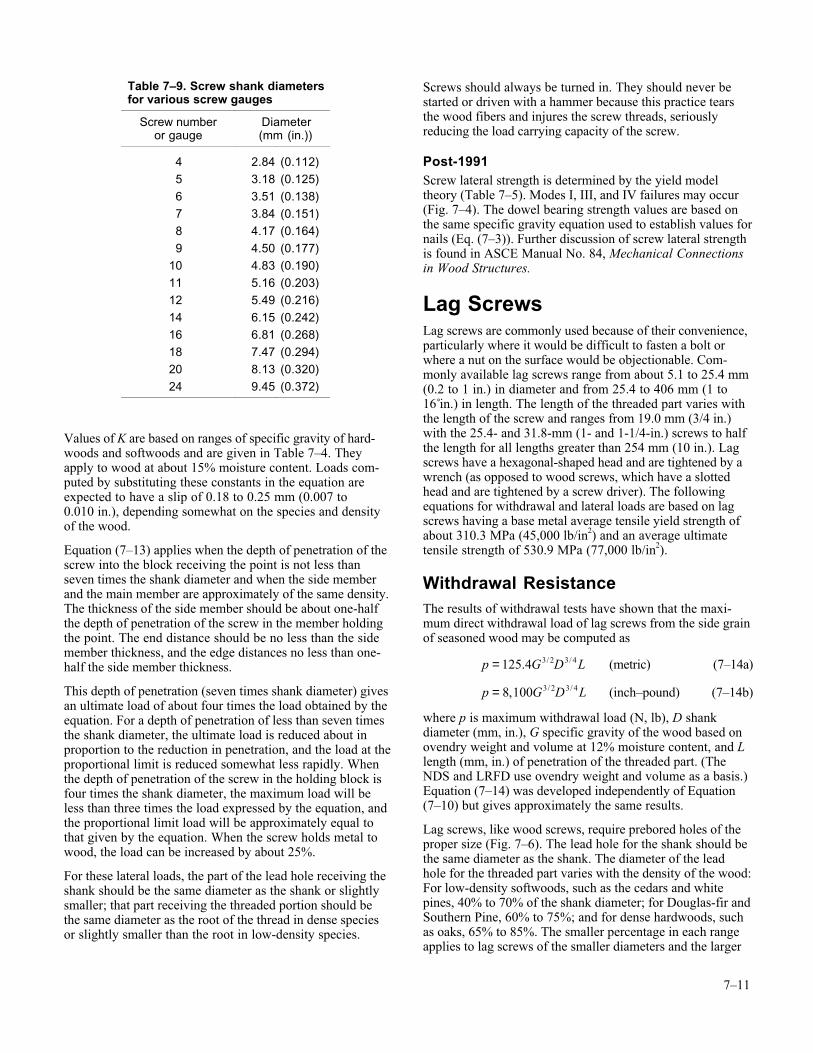
Table 7–9. Screw shank diametersfor various screw gauges
Screw number Diameteror gauge (mm (in.))
4 2.84 (0.112)
5 3.18 (0.125)
6 3.51 (0.138)
7 3.84 (0.151)
8 4.17 (0.164)
9 4.50 (0.177)
10 4.83 (0.190)
11 5.16 (0.203)
12 5.49 (0.216)
14 6.15 (0.242)
16 6.81 (0.268)
18 7.47 (0.294)
20 8.13 (0.320)
24 9.45 (0.372)
7–12
percentage to lag screws of larger diameters. Soap or similarlubricants should be used on the screw to facilitate turning,and lead holes slightly larger than those recommended formaximum efficiency should be used with long screws.
In determining the withdrawal resistance, the allowabletensile strength of the lag screw at the net (root) sectionshould not be exceeded. Penetration of the threaded part to adistance about seven times the shank diameter in the denserspecies (specific gravity greater than 0.61) and 10 to 12 timesthe shank diameter in the less dense species (specific gravityless than 0.42) will develop approximately the ultimatetensile strength of the lag screw. Penetrations at intermediatedensities may be found by straight-line interpolation.
The resistance to withdrawal of a lag screw from the end-grain surface of a piece of wood is about three-fourths as greatas its resistance to withdrawal from the side-grain surface ofthe same piece.
Lateral ResistancePre-1991The experimentally determined lateral loads for lag screwsinserted in the side grain and loaded parallel to the grain of apiece of seasoned wood can be computed as
p KD= 2 (7–15)
where p is proportional limit lateral load (N, lb) parallel tothe grain, K a coefficient depending on the species specificgravity, and D shank diameter of the lag screw (mm, in.).Values of K for a number of specific gravity ranges can befound in Table 7–4. These coefficients are based on averageresults for several ranges of specific gravity for hardwoods andsoftwoods. The loads given by this equation apply when thethickness of the side member is 3.5 times the shank diameterof the lag screw, and the depth of penetration in the main
member is seven times the diameter in the harder woods and11 times the diameter in the softer woods. For other thick-nesses, the computed loads should be multiplied by thefactors listed in Table 7–10.
The thickness of a solid wood side member should be aboutone-half the depth of penetration in the main member.
When the lag screw is inserted in the side grain of wood andthe load is applied perpendicular to the grain, the load givenby the lateral resistance equation should be multiplied by thefactors listed in Table 7–11.
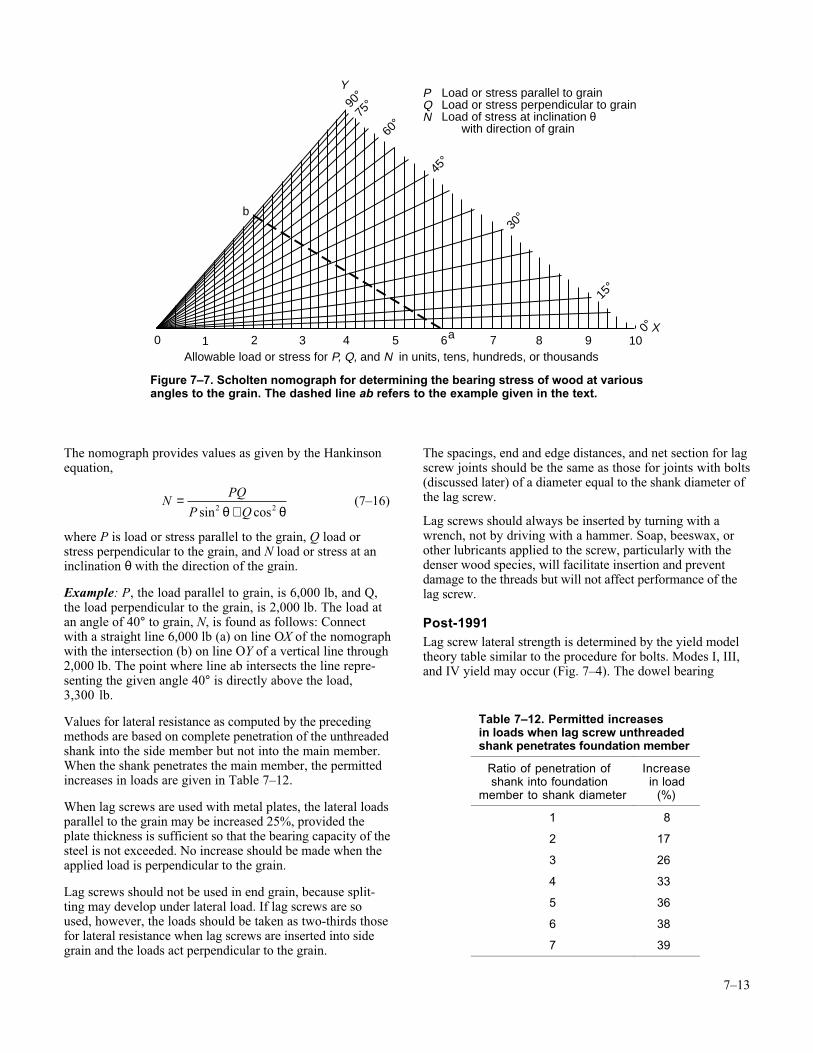
For other angles of loading, the loads may be computed fromthe parallel and perpendicular values by the use of theScholten nomograph for determining the bearing strength ofwood at various angles to the grain (Fig. 7–7).
Figure 7–6. A, Clean-cut, deep penetration of threadmade by lag screw turned into a lead hole of propersize, and B, rough, shallow penetration of threadmade by lag screw turned into oversized lead hole.
Table 7–10. Multiplication factors forloads computed from Equation (7–15)
Ratio of thickness ofside member to shankdiameter of lag screw Factor
2 0.622.5 0.773 0.933.5 1.004 1.074.5 1.135 1.185.5 1.216 1.226.5 1.22
Table 7–11. Multiplication factors forloads applied perpendicular to graincomputed from Equation (7–15) withlag screw in side grain of wood
Shank diameter of lag screw (mm (in.)) Factor
4.8 (3/16) 1.006.4 (1/4) 0.977.9 (5/16) 0.859.5 (3/8) 0.76
11.1 (7/16) 0.7012.7 (1/2) 0.6515.9 (5/8) 0.6019.0 (3/4) 0.5522.2 (7/8) 0.5225.4 (1) 0.50
7–13
The nomograph provides values as given by the Hankinsonequation,
N
PQ
P Q=
+sin cos2 2θ θ (7–16)
where P is load or stress parallel to the grain, Q load orstress perpendicular to the grain, and N load or stress at aninclination θ with the direction of the grain.
Example: P, the load parallel to grain, is 6,000 lb, and Q,the load perpendicular to the grain, is 2,000 lb. The load atan angle of 40° to grain, N, is found as follows: Connectwith a straight line 6,000 lb (a) on line OX of the nomographwith the intersection (b) on line OY of a vertical line through2,000 lb. The point where line ab intersects the line repre-senting the given angle 40° is directly above the load,3,300 lb.
Values for lateral resistance as computed by the precedingmethods are based on complete penetration of the unthreadedshank into the side member but not into the main member.When the shank penetrates the main member, the permittedincreases in loads are given in Table 7–12.
When lag screws are used with metal plates, the lateral loadsparallel to the grain may be increased 25%, provided theplate thickness is sufficient so that the bearing capacity of thesteel is not exceeded. No increase should be made when theapplied load is perpendicular to the grain.
Lag screws should not be used in end grain, because split-ting may develop under lateral load. If lag screws are soused, however, the loads should be taken as two-thirds thosefor lateral resistance when lag screws are inserted into sidegrain and the loads act perpendicular to the grain.
The spacings, end and edge distances, and net section for lagscrew joints should be the same as those for joints with bolts(discussed later) of a diameter equal to the shank diameter ofthe lag screw.
Lag screws should always be inserted by turning with awrench, not by driving with a hammer. Soap, beeswax, orother lubricants applied to the screw, particularly with thedenser wood species, will facilitate insertion and preventdamage to the threads but will not affect performance of thelag screw.
Post-1991Lag screw lateral strength is determined by the yield modeltheory table similar to the procedure for bolts. Modes I, III,and IV yield may occur (Fig. 7–4). The dowel bearing
a
b
1 2 43 5 7 8 9 100Allowable load or stress for P, Q, and N in units, tens, hundreds, or thousands
6
90°75
°
60°
45°
30°
15°
0°
Load or stress parallel to grain Load or stress perpendicular to grain Load of stress at inclination θ with direction of grain
Y
X
PQN
Figure 7–7. Scholten nomograph for determining the bearing stress of wood at variousangles to the grain. The dashed line ab refers to the example given in the text.
Table 7–12. Permitted increasesin loads when lag screw unthreadedshank penetrates foundation member
Ratio of penetration of shank into foundationmember to shank diameter
Increasein load
(%)
1 8
2 17
3 26
4 33
5 36
6 38
7 39
7–14
strength values are based on the same parallel- and perpen-dicular-to-grain specific gravity equations used to establishvalues for bolts.
BoltsBearing Stress of Wood Under BoltsThe bearing stress under a bolt is computed by dividing theload on a bolt by the product LD, where L is the length of abolt in the main member and D is the bolt diameter. Basicparallel-to-grain and perpendicular-to-grain bearing stresseshave been obtained from tests of three-member wood jointswhere each side member is half the thickness of the mainmember. The side members were loaded parallel to grain forboth parallel- and perpendicular-to-grain tests. Prior to 1991,bearing stress was based on test results at the proportionallimit; since 1991, bearing stress is based on test results at ayield limit state, which is defined as the 5% diameter offseton the load–deformation curve (similar to Fig. 7–3).
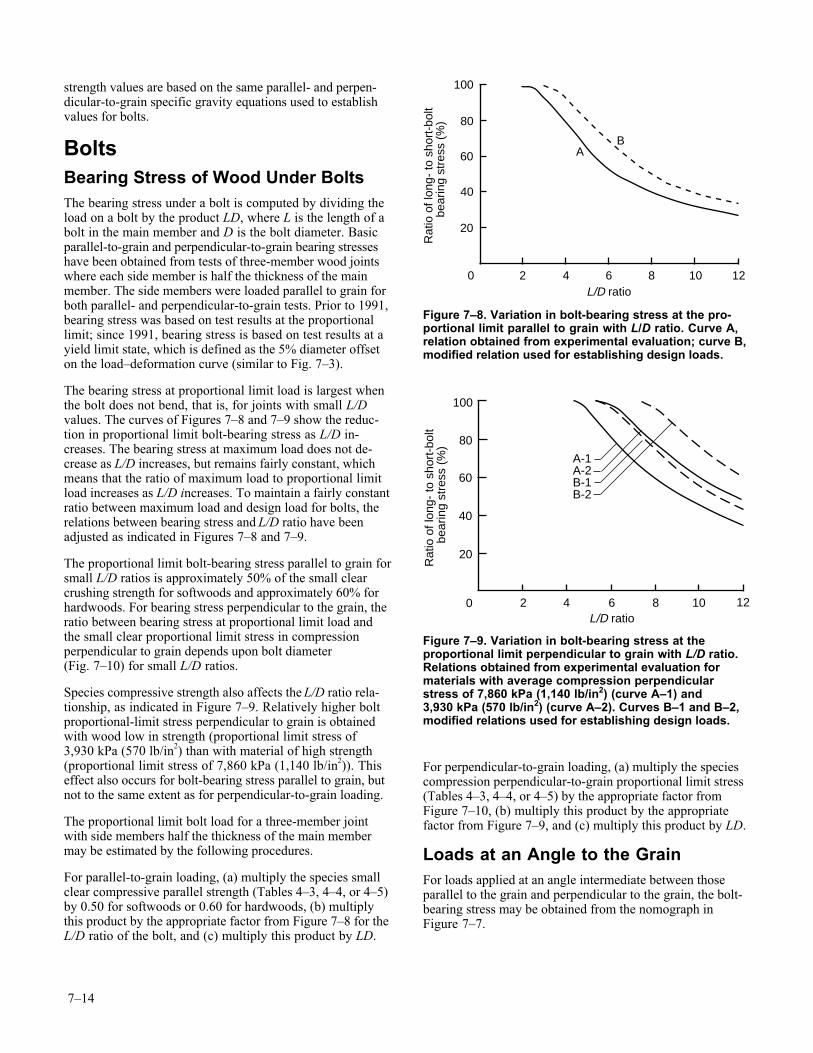
The bearing stress at proportional limit load is largest whenthe bolt does not bend, that is, for joints with small L/Dvalues. The curves of Figures 7–8 and 7–9 show the reduc-tion in proportional limit bolt-bearing stress as L/D in-creases. The bearing stress at maximum load does not de-crease as L/D increases, but remains fairly constant, whichmeans that the ratio of maximum load to proportional limitload increases as L/D increases. To maintain a fairly constantratio between maximum load and design load for bolts, therelations between bearing stress and L/D ratio have beenadjusted as indicated in Figures 7–8 and 7–9.
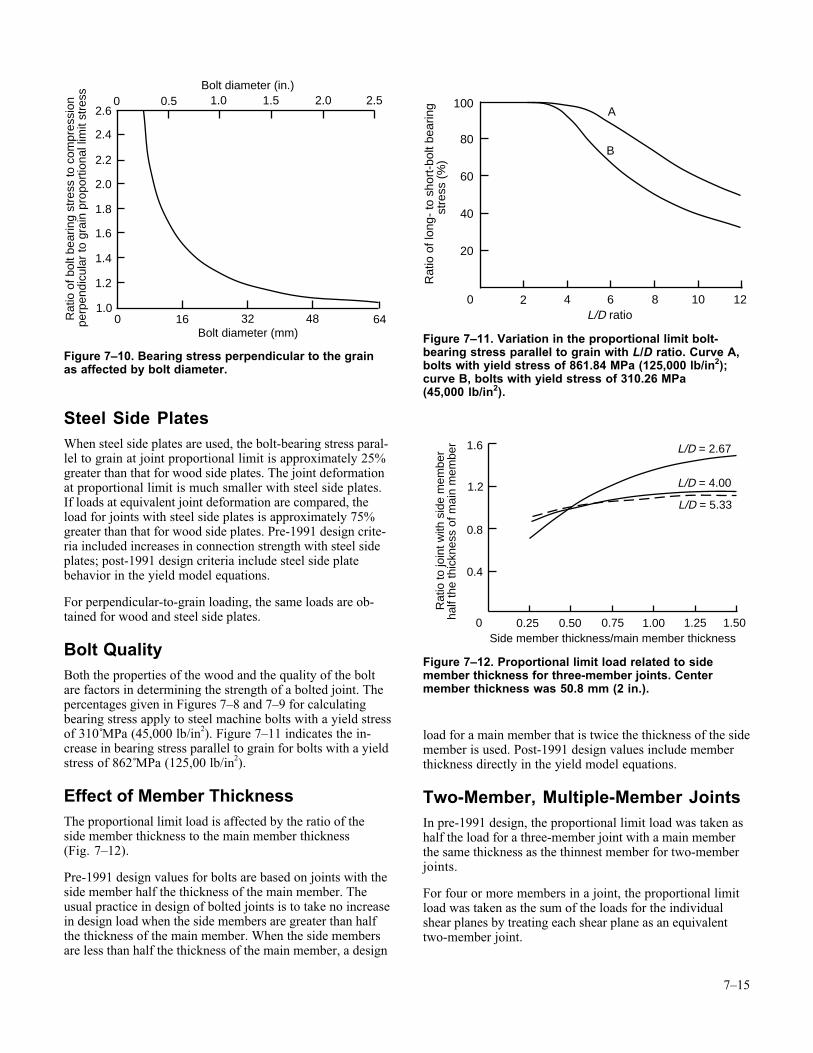
The proportional limit bolt-bearing stress parallel to grain forsmall L/D ratios is approximately 50% of the small clearcrushing strength for softwoods and approximately 60% forhardwoods. For bearing stress perpendicular to the grain, theratio between bearing stress at proportional limit load andthe small clear proportional limit stress in compressionperpendicular to grain depends upon bolt diameter(Fig. 7–10) for small L/D ratios.
Species compressive strength also affects the L/D ratio rela-tionship, as indicated in Figure 7–9. Relatively higher boltproportional-limit stress perpendicular to grain is obtainedwith wood low in strength (proportional limit stress of3,930 kPa (570 lb/in2) than with material of high strength(proportional limit stress of 7,860 kPa (1,140 lb/in2)). Thiseffect also occurs for bolt-bearing stress parallel to grain, butnot to the same extent as for perpendicular-to-grain loading.
The proportional limit bolt load for a three-member jointwith side members half the thickness of the main membermay be estimated by the following procedures.
For parallel-to-grain loading, (a) multiply the species smallclear compressive parallel strength (Tables 4–3, 4–4, or 4–5)by 0.50 for softwoods or 0.60 for hardwoods, (b) multiplythis product by the appropriate factor from Figure 7–8 for theL/D ratio of the bolt, and (c) multiply this product by LD.
For perpendicular-to-grain loading, (a) multiply the speciescompression perpendicular-to-grain proportional limit stress(Tables 4–3, 4–4, or 4–5) by the appropriate factor fromFigure 7–10, (b) multiply this product by the appropriatefactor from Figure 7–9, and (c) multiply this product by LD.
Loads at an Angle to the GrainFor loads applied at an angle intermediate between thoseparallel to the grain and perpendicular to the grain, the bolt-bearing stress may be obtained from the nomograph inFigure 7–7.
Rat
io o
f lon
g- to
sho
rt-b
olt
bea
ring
stre
ss (
%)
100
80
60
40
20
0 2 4 6 8 10 12
AB
L/D ratio
Figure 7–8. Variation in bolt-bearing stress at the pro-portional limit parallel to grain with L/D ratio. Curve A,relation obtained from experimental evaluation; curve B,modified relation used for establishing design loads.
Rat
io o
f lon
g- to
sho
rt-b
olt
bea
ring
stre
ss (
%)
100
80
60
40
20
0 2 4 6 8 10 12L/D ratio
A-1A-2B-1B-2
Figure 7–9. Variation in bolt-bearing stress at theproportional limit perpendicular to grain with L/D ratio.Relations obtained from experimental evaluation formaterials with average compression perpendicularstress of 7,860 kPa (1,140 lb/in2) (curve A–1) and3,930 kPa (570 lb/in2) (curve A–2). Curves B–1 and B–2,modified relations used for establishing design loads.
7–15
Steel Side PlatesWhen steel side plates are used, the bolt-bearing stress paral-lel to grain at joint proportional limit is approximately 25%greater than that for wood side plates. The joint deformationat proportional limit is much smaller with steel side plates.If loads at equivalent joint deformation are compared, theload for joints with steel side plates is approximately 75%greater than that for wood side plates. Pre-1991 design crite-ria included increases in connection strength with steel sideplates; post-1991 design criteria include steel side platebehavior in the yield model equations.
For perpendicular-to-grain loading, the same loads are ob-tained for wood and steel side plates.
Bolt QualityBoth the properties of the wood and the quality of the boltare factors in determining the strength of a bolted joint. Thepercentages given in Figures 7–8 and 7–9 for calculatingbearing stress apply to steel machine bolts with a yield stressof 310 MPa (45,000 lb/in2). Figure 7–11 indicates the in-crease in bearing stress parallel to grain for bolts with a yieldstress of 862 MPa (125,00 lb/in2).
Effect of Member ThicknessThe proportional limit load is affected by the ratio of theside member thickness to the main member thickness(Fig. 7–12).
Pre-1991 design values for bolts are based on joints with theside member half the thickness of the main member. Theusual practice in design of bolted joints is to take no increasein design load when the side members are greater than halfthe thickness of the main member. When the side membersare less than half the thickness of the main member, a design
load for a main member that is twice the thickness of the sidemember is used. Post-1991 design values include memberthickness directly in the yield model equations.
Two-Member, Multiple-Member JointsIn pre-1991 design, the proportional limit load was taken ashalf the load for a three-member joint with a main memberthe same thickness as the thinnest member for two-memberjoints.
For four or more members in a joint, the proportional limitload was taken as the sum of the loads for the individualshear planes by treating each shear plane as an equivalenttwo-member joint.
Rat
io o
f bol
t bea
ring
stre
ss to
com
pres
sion
perp
endi
cula
r to
gra
in p
ropo
rtio
nal l
imit
stre
ss
2.6
Bolt diameter (in.)
Bolt diameter (mm)
2.4
2.2
2.0
1.8
1.6
1.4
1.2
1.00
0.5 1.0 2.0 2.50
16 32 48 64
1.5
Figure 7–10. Bearing stress perpendicular to the grainas affected by bolt diameter.
Rat
io o
f lon
g- to
sho
rt-b
olt b
earin
g
stre
ss (
%)
100
80
60
40
20
0 2 4 6 8 10 12L/D ratio
A
B
Figure 7–11. Variation in the proportional limit bolt-bearing stress parallel to grain with L/D ratio. Curve A,bolts with yield stress of 861.84 MPa (125,000 lb/in2);curve B, bolts with yield stress of 310.26 MPa(45,000 lb/in2).
R
atio
to jo
int w
ith s
ide
mem
ber
half
the
thic
knes
s of
mai
n m
embe
r 1.6
1.2
0.8
0.4
0 0.25 0.50 0.75 1.00 1.25 1.50Side member thickness/main member thickness
L/D = 2.67
L/D = 5.33
L/D = 4.00
Figure 7–12. Proportional limit load related to sidemember thickness for three-member joints. Centermember thickness was 50.8 mm (2 in.).
7–16
Post-1991 design for joints with four or more members alsoresults in values per shear plane. Connection strength for anynumber of members is conservatively found by multiplyingthe value for the weakest shear plane by the number ofshear planes.
Spacing, Edge, and End DistanceThe center-to-center distance along the grain should be atleast four times the bolt diameter for parallel-to-grain load-ing. The minimum center-to-center spacing of bolts in theacross-the-grain direction for loads acting through metal sideplates and parallel to the grain need only be sufficient topermit the tightening of the nuts. For wood side plates, thespacing is controlled by the rules applying to loads actingparallel to grain if the design load approaches the bolt-bearing capacity of the side plates. When the design load isless than the bolt-bearing capacity of the side plates, thespacing may be reduced below that required to develop theirmaximum capacity.
When a joint is in tension, the bolt nearest the end of atimber should be at a distance from the end of at least seventimes the bolt diameter for softwoods and five times forhardwoods. When the joint is in compression, the end mar-gin may be four times the bolt diameter for both softwoodsand hardwoods. Any decrease in these spacings and marginswill decrease the load in about the same ratio.
For bolts bearing parallel to the grain, the distance from theedge of a timber to the center of a bolt should be at least 1.5times the bolt diameter. This margin, however, will usuallybe controlled by (a) the common practice of having an edgemargin equal to one-half the distance between bolt rows and(b) the area requirements at the critical section. (The criticalsection is that section of the member taken at right angles tothe direction of load, which gives the maximum stress in themember based on the net area remaining after reductions aremade for bolt holes at that section.) For parallel-to-grainloading in softwoods, the net area remaining at the criticalsection should be at least 80% of the total area in bearingunder all the bolts in the particular joint under consideration;in hardwoods it should be 100%.
For bolts bearing perpendicular to the grain, the marginbetween the edge toward which the bolt pressure is actingand the center of the bolt or bolts nearest this edge should beat least four times the bolt diameter. The margin at theopposite edge is relatively unimportant.
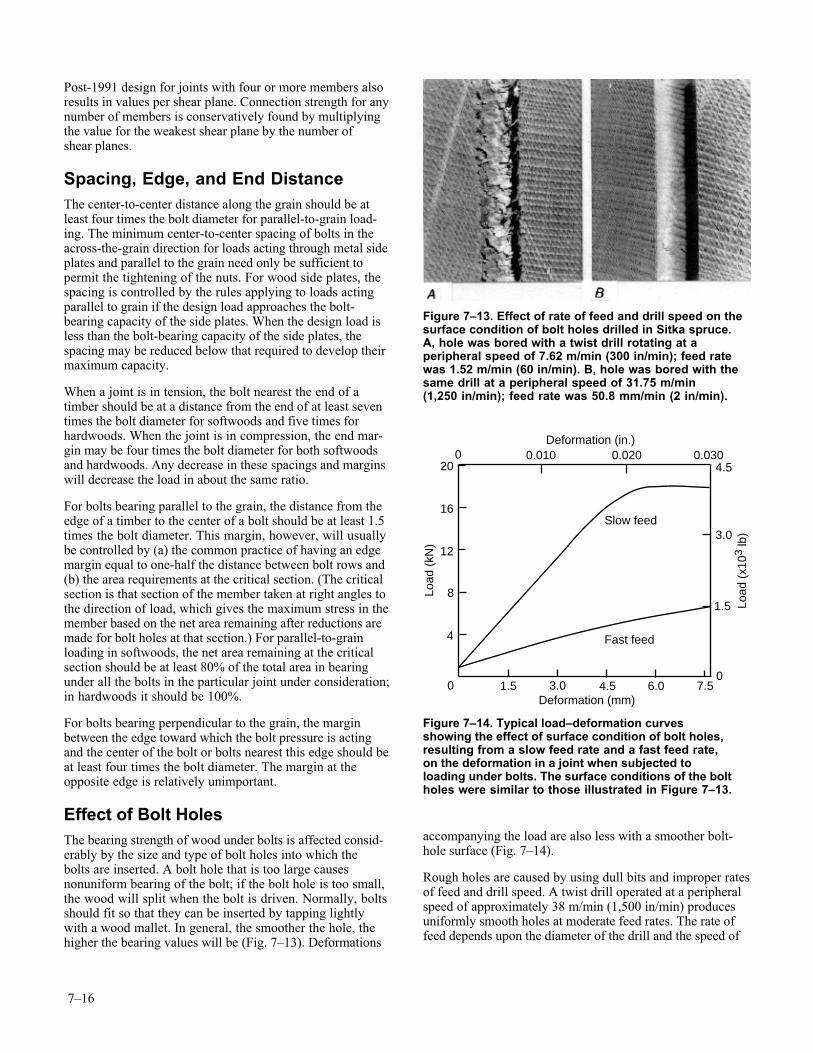
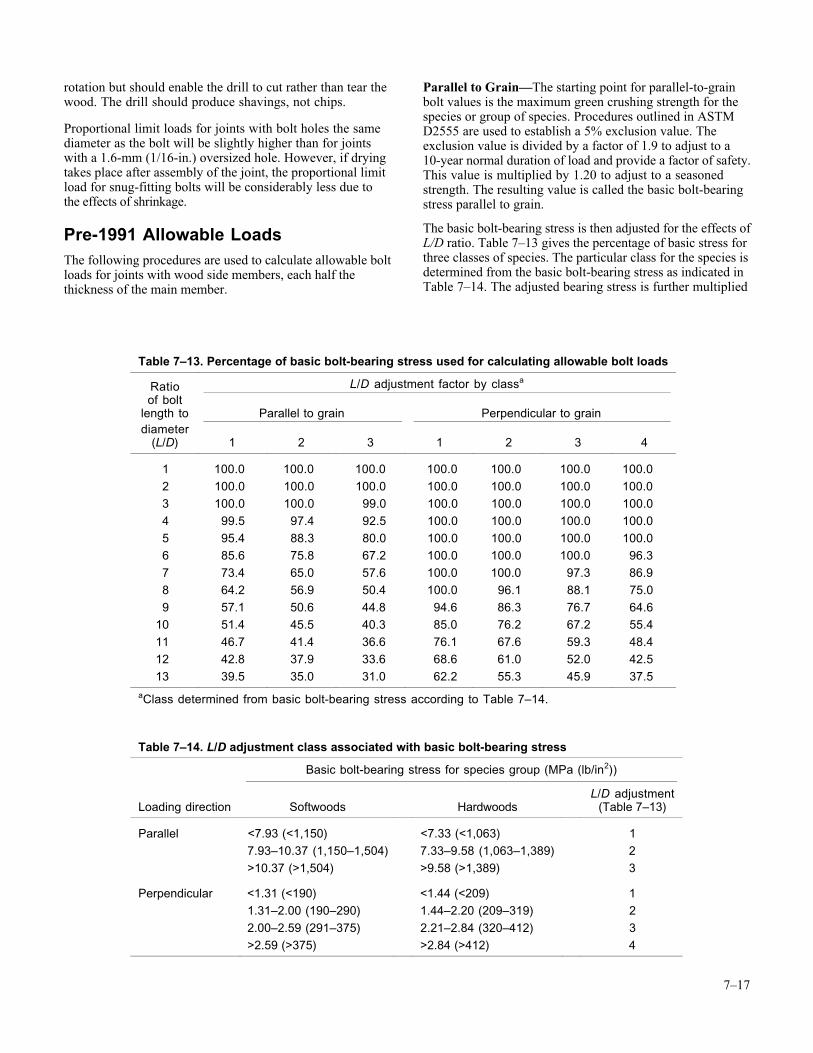
Effect of Bolt HolesThe bearing strength of wood under bolts is affected consid-erably by the size and type of bolt holes into which thebolts are inserted. A bolt hole that is too large causesnonuniform bearing of the bolt; if the bolt hole is too small,the wood will split when the bolt is driven. Normally, boltsshould fit so that they can be inserted by tapping lightlywith a wood mallet. In general, the smoother the hole, thehigher the bearing values will be (Fig. 7–13). Deformations
accompanying the load are also less with a smoother bolt-hole surface (Fig. 7–14).
Rough holes are caused by using dull bits and improper ratesof feed and drill speed. A twist drill operated at a peripheralspeed of approximately 38 m/min (1,500 in/min) producesuniformly smooth holes at moderate feed rates. The rate offeed depends upon the diameter of the drill and the speed of
Figure 7–13. Effect of rate of feed and drill speed on thesurface condition of bolt holes drilled in Sitka spruce.A, hole was bored with a twist drill rotating at aperipheral speed of 7.62 m/min (300 in/min); feed ratewas 1.52 m/min (60 in/min). B, hole was bored with thesame drill at a peripheral speed of 31.75 m/min(1,250 in/min); feed rate was 50.8 mm/min (2 in/min).
4.5
Load
(kN
)
Load
(x1
03 lb
)
20
16
12
8
4
0
3.0
1.5
01.5 3.0 4.5 6.0 7.5
0 0.010 0.020 0.030
Slow feed
Fast feed
Deformation (in.)
Deformation (mm)
Figure 7–14. Typical load–deformation curvesshowing the effect of surface condition of bolt holes,resulting from a slow feed rate and a fast feed rate,on the deformation in a joint when subjected toloading under bolts. The surface conditions of the boltholes were similar to those illustrated in Figure 7–13.
7–17
rotation but should enable the drill to cut rather than tear thewood. The drill should produce shavings, not chips.
Proportional limit loads for joints with bolt holes the samediameter as the bolt will be slightly higher than for jointswith a 1.6-mm (1/16-in.) oversized hole. However, if dryingtakes place after assembly of the joint, the proportional limitload for snug-fitting bolts will be considerably less due tothe effects of shrinkage.
Pre-1991 Allowable LoadsThe following procedures are used to calculate allowable boltloads for joints with wood side members, each half thethickness of the main member.
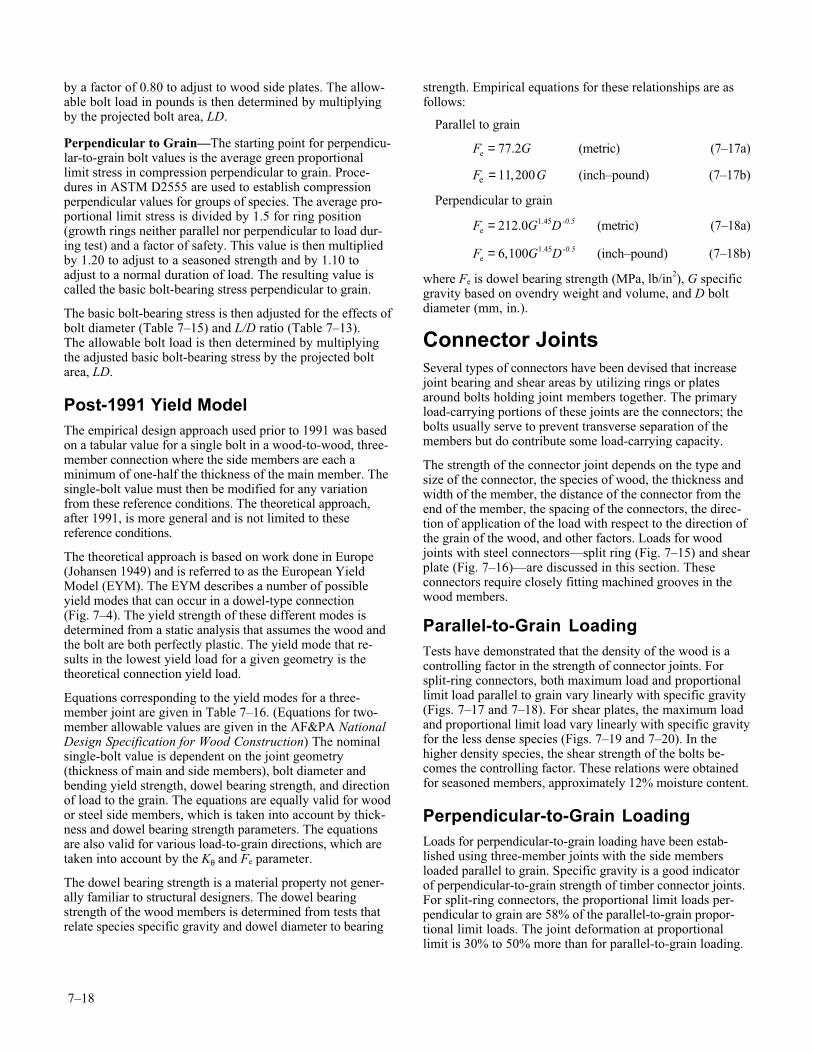
Parallel to Grain—The starting point for parallel-to-grainbolt values is the maximum green crushing strength for thespecies or group of species. Procedures outlined in ASTMD2555 are used to establish a 5% exclusion value. Theexclusion value is divided by a factor of 1.9 to adjust to a10-year normal duration of load and provide a factor of safety.This value is multiplied by 1.20 to adjust to a seasonedstrength. The resulting value is called the basic bolt-bearingstress parallel to grain.
The basic bolt-bearing stress is then adjusted for the effects ofL/D ratio. Table 7–13 gives the percentage of basic stress forthree classes of species. The particular class for the species isdetermined from the basic bolt-bearing stress as indicated inTable 7–14. The adjusted bearing stress is further multiplied
Table 7–13. Percentage of basic bolt-bearing stress used for calculating allowable bolt loads
Ratio L/D adjustment factor by classa
of boltlength to Parallel to grain Perpendicular to graindiameter
(L/D) 1 2 3 1 2 3 4
1 100.0 100.0 100.0 100.0 100.0 100.0 100.0
2 100.0 100.0 100.0 100.0 100.0 100.0 100.0
3 100.0 100.0 99.0 100.0 100.0 100.0 100.0
4 99.5 97.4 92.5 100.0 100.0 100.0 100.0
5 95.4 88.3 80.0 100.0 100.0 100.0 100.0
6 85.6 75.8 67.2 100.0 100.0 100.0 96.3
7 73.4 65.0 57.6 100.0 100.0 97.3 86.9
8 64.2 56.9 50.4 100.0 96.1 88.1 75.0
9 57.1 50.6 44.8 94.6 86.3 76.7 64.6
10 51.4 45.5 40.3 85.0 76.2 67.2 55.4
11 46.7 41.4 36.6 76.1 67.6 59.3 48.4
12 42.8 37.9 33.6 68.6 61.0 52.0 42.5
13 39.5 35.0 31.0 62.2 55.3 45.9 37.5
aClass determined from basic bolt-bearing stress according to Table 7–14.
Table 7–14. L/D adjustment class associated with basic bolt-bearing stress
Basic bolt-bearing stress for species group (MPa (lb/in2))
Loading direction Softwoods HardwoodsL/D adjustment
(Table 7–13)
Parallel <7.93 (<1,150) <7.33 (<1,063) 1
7.93–10.37 (1,150–1,504) 7.33–9.58 (1,063–1,389) 2
>10.37 (>1,504) >9.58 (>1,389) 3
Perpendicular <1.31 (<190) <1.44 (<209) 1
1.31–2.00 (190–290) 1.44–2.20 (209–319) 2
2.00–2.59 (291–375) 2.21–2.84 (320–412) 3
>2.59 (>375) >2.84 (>412) 4
7–18
by a factor of 0.80 to adjust to wood side plates. The allow-able bolt load in pounds is then determined by multiplyingby the projected bolt area, LD.
Perpendicular to Grain—The starting point for perpendicu-lar-to-grain bolt values is the average green proportionallimit stress in compression perpendicular to grain. Proce-dures in ASTM D2555 are used to establish compressionperpendicular values for groups of species. The average pro-portional limit stress is divided by 1.5 for ring position(growth rings neither parallel nor perpendicular to load dur-ing test) and a factor of safety. This value is then multipliedby 1.20 to adjust to a seasoned strength and by 1.10 toadjust to a normal duration of load. The resulting value iscalled the basic bolt-bearing stress perpendicular to grain.
The basic bolt-bearing stress is then adjusted for the effects ofbolt diameter (Table 7–15) and L/D ratio (Table 7–13).The allowable bolt load is then determined by multiplyingthe adjusted basic bolt-bearing stress by the projected boltarea, LD.
Post-1991 Yield ModelThe empirical design approach used prior to 1991 was basedon a tabular value for a single bolt in a wood-to-wood, three-member connection where the side members are each aminimum of one-half the thickness of the main member. Thesingle-bolt value must then be modified for any variationfrom these reference conditions. The theoretical approach,after 1991, is more general and is not limited to thesereference conditions.
The theoretical approach is based on work done in Europe(Johansen 1949) and is referred to as the European YieldModel (EYM). The EYM describes a number of possibleyield modes that can occur in a dowel-type connection(Fig. 7–4). The yield strength of these different modes isdetermined from a static analysis that assumes the wood andthe bolt are both perfectly plastic. The yield mode that re-sults in the lowest yield load for a given geometry is thetheoretical connection yield load.
Equations corresponding to the yield modes for a three-member joint are given in Table 7–16. (Equations for two-member allowable values are given in the AF&PA NationalDesign Specification for Wood Construction) The nominalsingle-bolt value is dependent on the joint geometry(thickness of main and side members), bolt diameter andbending yield strength, dowel bearing strength, and directionof load to the grain. The equations are equally valid for woodor steel side members, which is taken into account by thick-ness and dowel bearing strength parameters. The equationsare also valid for various load-to-grain directions, which aretaken into account by the Kθ and Fe parameter.
The dowel bearing strength is a material property not gener-ally familiar to structural designers. The dowel bearingstrength of the wood members is determined from tests thatrelate species specific gravity and dowel diameter to bearing
strength. Empirical equations for these relationships are asfollows:
Parallel to grain
F Ge = 77 2. (metric) (7–17a)
F Ge = 11 200, (inch–pound) (7–17b)
Perpendicular to grain
F G D-0.5e = 212 0 1 45. . (metric) (7–18a)
F G D-0.5e = 6 100 1 45, . (inch–pound) (7–18b)
where Fe is dowel bearing strength (MPa, lb/in2), G specificgravity based on ovendry weight and volume, and D boltdiameter (mm, in.).
Connector JointsSeveral types of connectors have been devised that increasejoint bearing and shear areas by utilizing rings or platesaround bolts holding joint members together. The primaryload-carrying portions of these joints are the connectors; thebolts usually serve to prevent transverse separation of themembers but do contribute some load-carrying capacity.
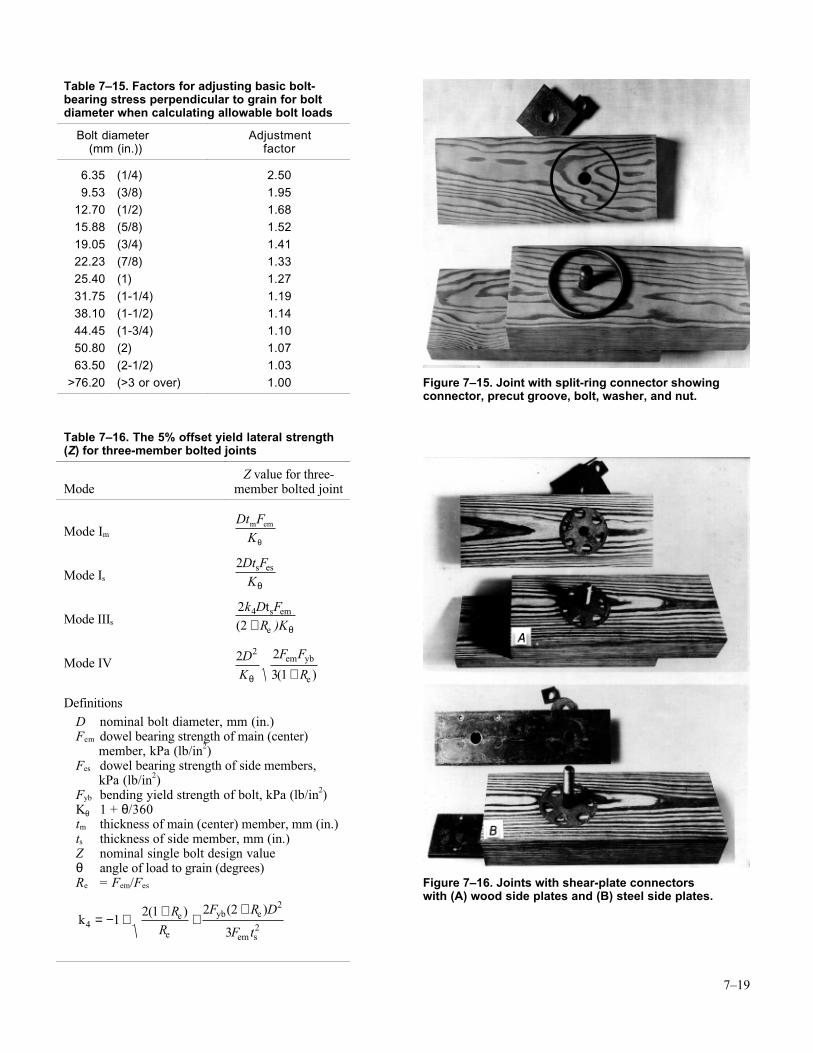
The strength of the connector joint depends on the type andsize of the connector, the species of wood, the thickness andwidth of the member, the distance of the connector from theend of the member, the spacing of the connectors, the direc-tion of application of the load with respect to the direction ofthe grain of the wood, and other factors. Loads for woodjoints with steel connectors—split ring (Fig. 7–15) and shearplate (Fig. 7–16)—are discussed in this section. Theseconnectors require closely fitting machined grooves in thewood members.
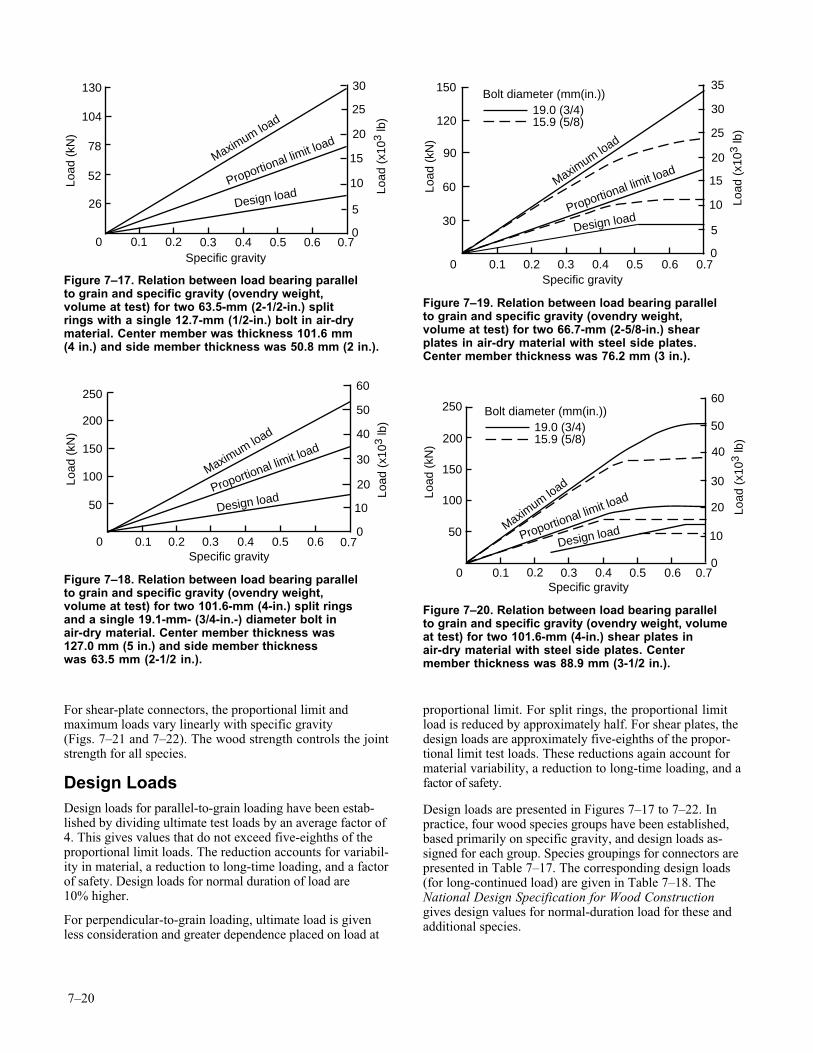
Parallel-to-Grain LoadingTests have demonstrated that the density of the wood is acontrolling factor in the strength of connector joints. Forsplit-ring connectors, both maximum load and proportionallimit load parallel to grain vary linearly with specific gravity(Figs. 7–17 and 7–18). For shear plates, the maximum loadand proportional limit load vary linearly with specific gravityfor the less dense species (Figs. 7–19 and 7–20). In thehigher density species, the shear strength of the bolts be-comes the controlling factor. These relations were obtainedfor seasoned members, approximately 12% moisture content.
Perpendicular-to-Grain LoadingLoads for perpendicular-to-grain loading have been estab-lished using three-member joints with the side membersloaded parallel to grain. Specific gravity is a good indicatorof perpendicular-to-grain strength of timber connector joints.For split-ring connectors, the proportional limit loads per-pendicular to grain are 58% of the parallel-to-grain propor-tional limit loads. The joint deformation at proportionallimit is 30% to 50% more than for parallel-to-grain loading.
7–19
Table 7–15. Factors for adjusting basic bolt-bearing stress perpendicular to grain for boltdiameter when calculating allowable bolt loads
Bolt diameter Adjustment (mm (in.)) factor
6.35 (1/4) 2.50
9.53 (3/8) 1.95
12.70 (1/2) 1.68
15.88 (5/8) 1.52
19.05 (3/4) 1.41
22.23 (7/8) 1.33
25.40 (1) 1.27
31.75 (1-1/4) 1.19
38.10 (1-1/2) 1.14
44.45 (1-3/4) 1.10
50.80 (2) 1.07
63.50 (2-1/2) 1.03
>76.20 (>3 or over) 1.00
Table 7–16. The 5% offset yield lateral strength(Z) for three-member bolted joints
ModeZ value for three-
member bolted joint
Mode Im
Dt FKm em
θ
Mode Is
2Dt FK
s es
θ
Mode IIIs
22
4k D FR )Kts em
( + e θ
Mode IV
2 2
3 1
2DK
F F
Rθ
em yb
e( )+
DefinitionsD nominal bolt diameter, mm (in.)Fem dowel bearing strength of main (center) member, kPa (lb/in2)Fes dowel bearing strength of side members, kPa (lb/in2)Fyb bending yield strength of bolt, kPa (lb/in2)Kθ 1 + θ/360tm thickness of main (center) member, mm (in.)ts thickness of side member, mm (in.)Z nominal single bolt design valueθ angle of load to grain (degrees)Re = Fem/Fes
k e
e
yb e4
2
21
2 1 2 2
3= − + + +
+( ) ( )RR
F R D
F tem s
Figure 7–15. Joint with split-ring connector showingconnector, precut groove, bolt, washer, and nut.
Figure 7–16. Joints with shear-plate connectorswith (A) wood side plates and (B) steel side plates.
7–20
For shear-plate connectors, the proportional limit andmaximum loads vary linearly with specific gravity(Figs. 7–21 and 7–22). The wood strength controls the jointstrength for all species.
Design LoadsDesign loads for parallel-to-grain loading have been estab-lished by dividing ultimate test loads by an average factor of4. This gives values that do not exceed five-eighths of theproportional limit loads. The reduction accounts for variabil-ity in material, a reduction to long-time loading, and a factorof safety. Design loads for normal duration of load are10% higher.
For perpendicular-to-grain loading, ultimate load is givenless consideration and greater dependence placed on load at
proportional limit. For split rings, the proportional limitload is reduced by approximately half. For shear plates, thedesign loads are approximately five-eighths of the propor-tional limit test loads. These reductions again account formaterial variability, a reduction to long-time loading, and afactor of safety.
Design loads are presented in Figures 7–17 to 7–22. Inpractice, four wood species groups have been established,based primarily on specific gravity, and design loads as-signed for each group. Species groupings for connectors arepresented in Table 7–17. The corresponding design loads(for long-continued load) are given in Table 7–18. TheNational Design Specification for Wood Constructiongives design values for normal-duration load for these andadditional species.
130
Load
(kN
)
Maximum load
Proportional limit load
104
78
52
26
30
25
20
15
10
5
00 0.1 0.2 0.3 0.4 0.5 0.6 0.7
Specific gravity
Load
(x1
03 lb
)
Design load
Figure 7–17. Relation between load bearing parallelto grain and specific gravity (ovendry weight,volume at test) for two 63.5-mm (2-1/2-in.) splitrings with a single 12.7-mm (1/2-in.) bolt in air-drymaterial. Center member was thickness 101.6 mm(4 in.) and side member thickness was 50.8 mm (2 in.).
Load
(kN
)
Maximum load
Proportional limit load
30
20
10
0 0.1 0.2 0.3 0.4 0.5 0.6 0.7Specific gravity
Load
(x1
03 lb
)
0
60
50
40
250
200
150
100
50 Design load
Figure 7–18. Relation between load bearing parallelto grain and specific gravity (ovendry weight,volume at test) for two 101.6-mm (4-in.) split ringsand a single 19.1-mm- (3/4-in.-) diameter bolt inair-dry material. Center member thickness was127.0 mm (5 in.) and side member thicknesswas 63.5 mm (2-1/2 in.).
Load
(kN
)
20
15
5
0 0.1 0.2 0.3 0.4 0.5 0.6 0.7Specific gravity
Load
(x1
03 lb
)
0
35
30
25
150
120
90
60
3010
Maximum lo
ad
Proportional limit load
Design load
Bolt diameter (mm(in.))19.0 (3/4)15.9 (5/8)
Figure 7–19. Relation between load bearing parallelto grain and specific gravity (ovendry weight,volume at test) for two 66.7-mm (2-5/8-in.) shearplates in air-dry material with steel side plates.Center member thickness was 76.2 mm (3 in.).
Load
(kN
)
Maximum lo
ad
Proportional limit load
Design load
30
20
10
0.1 0.2 0.3 0.4 0.5 0.6 0.7Specific gravity
Load
(x1
03 lb
)
0
60
50
40
0
250
200
150
100
50
Bolt diameter (mm(in.))19.0 (3/4)15.9 (5/8)
Figure 7–20. Relation between load bearing parallelto grain and specific gravity (ovendry weight, volumeat test) for two 101.6-mm (4-in.) shear plates inair-dry material with steel side plates. Centermember thickness was 88.9 mm (3-1/2 in.).
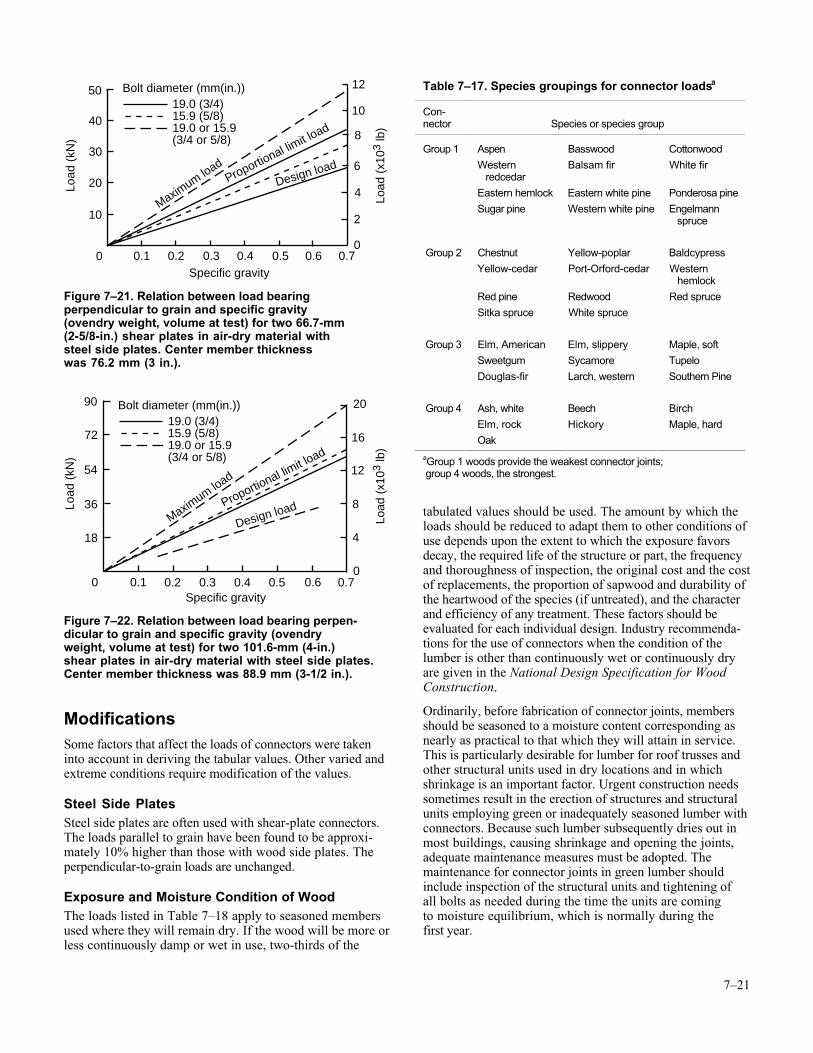
7–21
ModificationsSome factors that affect the loads of connectors were takeninto account in deriving the tabular values. Other varied andextreme conditions require modification of the values.
Steel Side PlatesSteel side plates are often used with shear-plate connectors.The loads parallel to grain have been found to be approxi-mately 10% higher than those with wood side plates. Theperpendicular-to-grain loads are unchanged.
Exposure and Moisture Condition of WoodThe loads listed in Table 7–18 apply to seasoned membersused where they will remain dry. If the wood will be more orless continuously damp or wet in use, two-thirds of the
tabulated values should be used. The amount by which theloads should be reduced to adapt them to other conditions ofuse depends upon the extent to which the exposure favorsdecay, the required life of the structure or part, the frequencyand thoroughness of inspection, the original cost and the costof replacements, the proportion of sapwood and durability ofthe heartwood of the species (if untreated), and the characterand efficiency of any treatment. These factors should beevaluated for each individual design. Industry recommenda-tions for the use of connectors when the condition of thelumber is other than continuously wet or continuously dryare given in the National Design Specification for WoodConstruction.
Ordinarily, before fabrication of connector joints, membersshould be seasoned to a moisture content corresponding asnearly as practical to that which they will attain in service.This is particularly desirable for lumber for roof trusses andother structural units used in dry locations and in whichshrinkage is an important factor. Urgent construction needssometimes result in the erection of structures and structuralunits employing green or inadequately seasoned lumber withconnectors. Because such lumber subsequently dries out inmost buildings, causing shrinkage and opening the joints,adequate maintenance measures must be adopted. Themaintenance for connector joints in green lumber shouldinclude inspection of the structural units and tightening ofall bolts as needed during the time the units are comingto moisture equilibrium, which is normally during thefirst year.
Load
(kN
)
6
4
2
0.1 0.2 0.3 0.4 0.5 0.6 0.7Specific gravity
Load
(x1
03 lb
)
0
12
10
8
0
50
40
30
20
10Maxim
um load
Proportional lim
it load
Design load
Bolt diameter (mm(in.))19.0 (3/4)15.9 (5/8)19.0 or 15.9(3/4 or 5/8)
Figure 7–21. Relation between load bearingperpendicular to grain and specific gravity(ovendry weight, volume at test) for two 66.7-mm(2-5/8-in.) shear plates in air-dry material withsteel side plates. Center member thicknesswas 76.2 mm (3 in.).
Load
(kN
)
0 0.1 0.2 0.3 0.4 0.5 0.6 0.7Specific gravity
Load
(x1
03 lb
)
90
72
54
36
18
8
4
0
20
16
12
Maximum lo
ad
Proportional lim
it load
Design load
Bolt diameter (mm(in.))19.0 (3/4)15.9 (5/8)19.0 or 15.9(3/4 or 5/8)
Figure 7–22. Relation between load bearing perpen-dicular to grain and specific gravity (ovendryweight, volume at test) for two 101.6-mm (4-in.)shear plates in air-dry material with steel side plates.Center member thickness was 88.9 mm (3-1/2 in.).
Table 7–17. Species groupings for connector loadsa
Con-nector Species or species group
Group 1 Aspen Basswood Cottonwood
Western redcedar
Balsam fir White fir
Eastern hemlock Eastern white pine Ponderosa pine
Sugar pine Western white pine Engelmann spruce
Group 2 Chestnut Yellow-poplar Baldcypress
Yellow-cedar Port-Orford-cedar Western hemlock
Red pine Redwood Red spruce
Sitka spruce White spruce
Group 3 Elm, American Elm, slippery Maple, soft
Sweetgum Sycamore Tupelo
Douglas-fir Larch, western Southern Pine
Group 4 Ash, white Beech Birch
Elm, rock Hickory Maple, hard
Oak
aGroup 1 woods provide the weakest connector joints; group 4 woods, the strongest.
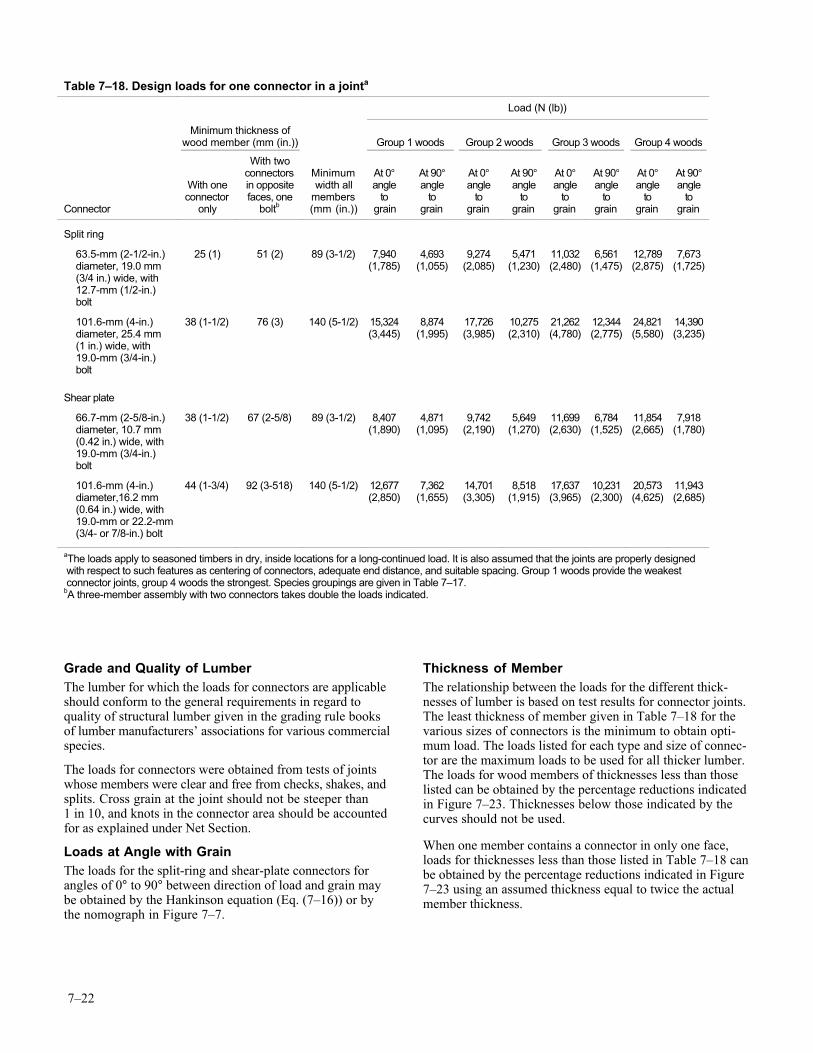
7–22
Grade and Quality of LumberThe lumber for which the loads for connectors are applicableshould conform to the general requirements in regard toquality of structural lumber given in the grading rule booksof lumber manufacturers’ associations for various commercialspecies.
The loads for connectors were obtained from tests of jointswhose members were clear and free from checks, shakes, andsplits. Cross grain at the joint should not be steeper than1 in 10, and knots in the connector area should be accountedfor as explained under Net Section.
Loads at Angle with GrainThe loads for the split-ring and shear-plate connectors forangles of 0° to 90° between direction of load and grain maybe obtained by the Hankinson equation (Eq. (7–16)) or bythe nomograph in Figure 7–7.
Thickness of MemberThe relationship between the loads for the different thick-nesses of lumber is based on test results for connector joints.The least thickness of member given in Table 7–18 for thevarious sizes of connectors is the minimum to obtain opti-mum load. The loads listed for each type and size of connec-tor are the maximum loads to be used for all thicker lumber.The loads for wood members of thicknesses less than thoselisted can be obtained by the percentage reductions indicatedin Figure 7–23. Thicknesses below those indicated by thecurves should not be used.
When one member contains a connector in only one face,loads for thicknesses less than those listed in Table 7–18 canbe obtained by the percentage reductions indicated in Figure7–23 using an assumed thickness equal to twice the actualmember thickness.
Table 7–18. Design loads for one connector in a jointa
Load (N (lb))
Minimum thickness ofwood member (mm (in.)) Group 1 woods Group 2 woods Group 3 woods Group 4 woods
Connector
With oneconnector
only
With twoconnectorsin oppositefaces, one
boltb
Minimumwidth all
members(mm (in.))
At 0°angle
tograin
At 90°angle
tograin
At 0°angle
tograin
At 90°angle
tograin
At 0°angle
tograin
At 90°angle
tograin
At 0°angle
tograin
At 90°angle
tograin
Split ring
63.5-mm (2-1/2-in.)diameter, 19.0 mm(3/4 in.) wide, with12.7-mm (1/2-in.)bolt
25 (1) 51 (2) 89 (3-1/2) 7,940(1,785)
4,693(1,055)
9,274(2,085)
5,471(1,230)
11,032(2,480)
6,561(1,475)
12,789(2,875)
7,673(1,725)
101.6-mm (4-in.)diameter, 25.4 mm(1 in.) wide, with19.0-mm (3/4-in.)bolt
38 (1-1/2) 76 (3) 140 (5-1/2) 15,324(3,445)
8,874(1,995)
17,726(3,985)
10,275(2,310)
21,262(4,780)
12,344(2,775)
24,821(5,580)
14,390(3,235)
Shear plate
66.7-mm (2-5/8-in.)diameter, 10.7 mm(0.42 in.) wide, with19.0-mm (3/4-in.)bolt
38 (1-1/2) 67 (2-5/8) 89 (3-1/2) 8,407(1,890)
4,871(1,095)
9,742(2,190)
5,649(1,270)
11,699(2,630)
6,784(1,525)
11,854(2,665)
7,918(1,780)
101.6-mm (4-in.)diameter,16.2 mm(0.64 in.) wide, with19.0-mm or 22.2-mm(3/4- or 7/8-in.) bolt
44 (1-3/4) 92 (3-518) 140 (5-1/2) 12,677(2,850)
7,362(1,655)
14,701(3,305)
8,518(1,915)
17,637(3,965)
10,231(2,300)
20,573(4,625)
11,943(2,685)
aThe loads apply to seasoned timbers in dry, inside locations for a long-continued load. It is also assumed that the joints are properly designed with respect to such features as centering of connectors, adequate end distance, and suitable spacing. Group 1 woods provide the weakest connector joints, group 4 woods the strongest. Species groupings are given in Table 7–17.bA three-member assembly with two connectors takes double the loads indicated.
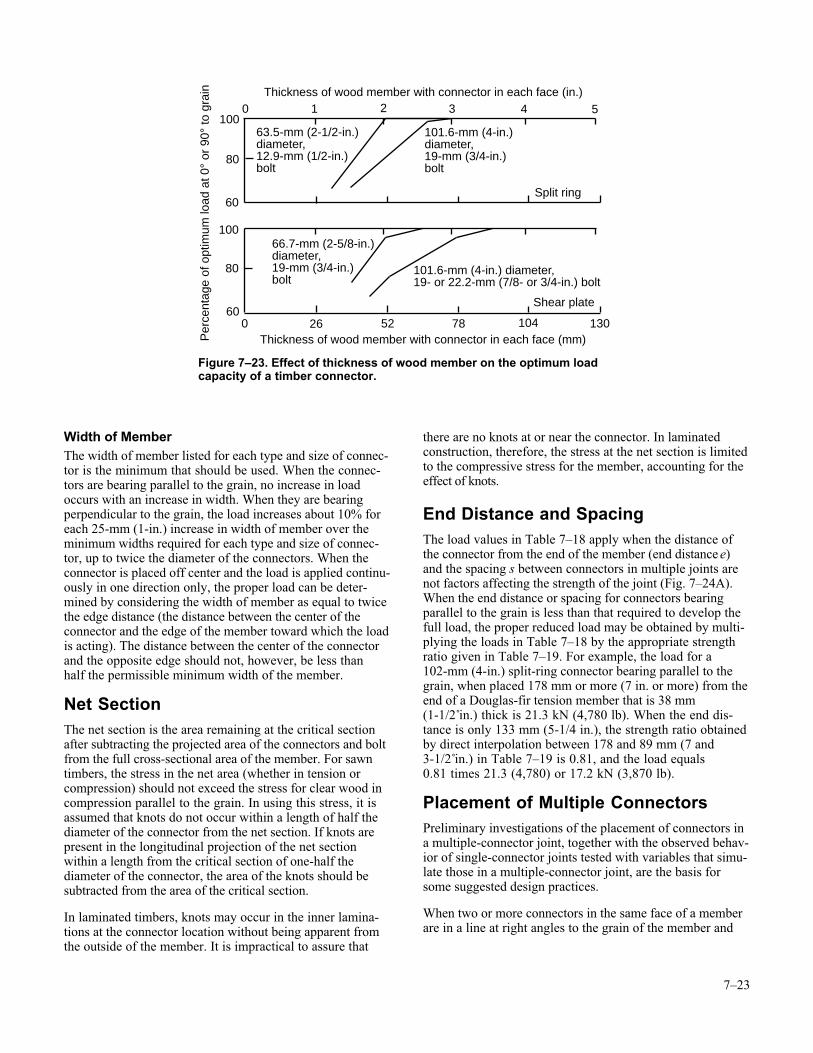
7–23
Width of MemberThe width of member listed for each type and size of connec-tor is the minimum that should be used. When the connec-tors are bearing parallel to the grain, no increase in loadoccurs with an increase in width. When they are bearingperpendicular to the grain, the load increases about 10% foreach 25-mm (1-in.) increase in width of member over theminimum widths required for each type and size of connec-tor, up to twice the diameter of the connectors. When theconnector is placed off center and the load is applied continu-ously in one direction only, the proper load can be deter-mined by considering the width of member as equal to twicethe edge distance (the distance between the center of theconnector and the edge of the member toward which the loadis acting). The distance between the center of the connectorand the opposite edge should not, however, be less thanhalf the permissible minimum width of the member.
Net SectionThe net section is the area remaining at the critical sectionafter subtracting the projected area of the connectors and boltfrom the full cross-sectional area of the member. For sawntimbers, the stress in the net area (whether in tension orcompression) should not exceed the stress for clear wood incompression parallel to the grain. In using this stress, it isassumed that knots do not occur within a length of half thediameter of the connector from the net section. If knots arepresent in the longitudinal projection of the net sectionwithin a length from the critical section of one-half thediameter of the connector, the area of the knots should besubtracted from the area of the critical section.
In laminated timbers, knots may occur in the inner lamina-tions at the connector location without being apparent fromthe outside of the member. It is impractical to assure that
there are no knots at or near the connector. In laminatedconstruction, therefore, the stress at the net section is limitedto the compressive stress for the member, accounting for theeffect of knots.
End Distance and SpacingThe load values in Table 7–18 apply when the distance ofthe connector from the end of the member (end distance e)and the spacing s between connectors in multiple joints arenot factors affecting the strength of the joint (Fig. 7–24A).When the end distance or spacing for connectors bearingparallel to the grain is less than that required to develop thefull load, the proper reduced load may be obtained by multi-plying the loads in Table 7–18 by the appropriate strengthratio given in Table 7–19. For example, the load for a102-mm (4-in.) split-ring connector bearing parallel to thegrain, when placed 178 mm or more (7 in. or more) from theend of a Douglas-fir tension member that is 38 mm(1-1/2 in.) thick is 21.3 kN (4,780 lb). When the end dis-tance is only 133 mm (5-1/4 in.), the strength ratio obtainedby direct interpolation between 178 and 89 mm (7 and3-1/2 in.) in Table 7–19 is 0.81, and the load equals0.81 times 21.3 (4,780) or 17.2 kN (3,870 lb).
Placement of Multiple ConnectorsPreliminary investigations of the placement of connectors ina multiple-connector joint, together with the observed behav-ior of single-connector joints tested with variables that simu-late those in a multiple-connector joint, are the basis forsome suggested design practices.
When two or more connectors in the same face of a memberare in a line at right angles to the grain of the member and
Per
cent
age
of o
ptim
um lo
ad a
t 0°
or 9
0° to
gra
in
Thickness of wood member with connector in each face (mm)
Thickness of wood member with connector in each face (in.)
0 26 52 78 104 130
0 1 2 3 4 5100
80
60
100
80
60
Split ring
Shear plate
101.6-mm (4-in.)diameter,19-mm (3/4-in.)bolt
66.7-mm (2-5/8-in.)diameter,19-mm (3/4-in.)bolt
101.6-mm (4-in.) diameter,19- or 22.2-mm (7/8- or 3/4-in.) bolt
63.5-mm (2-1/2-in.)diameter,12.9-mm (1/2-in.)bolt
Figure 7–23. Effect of thickness of wood member on the optimum loadcapacity of a timber connector.
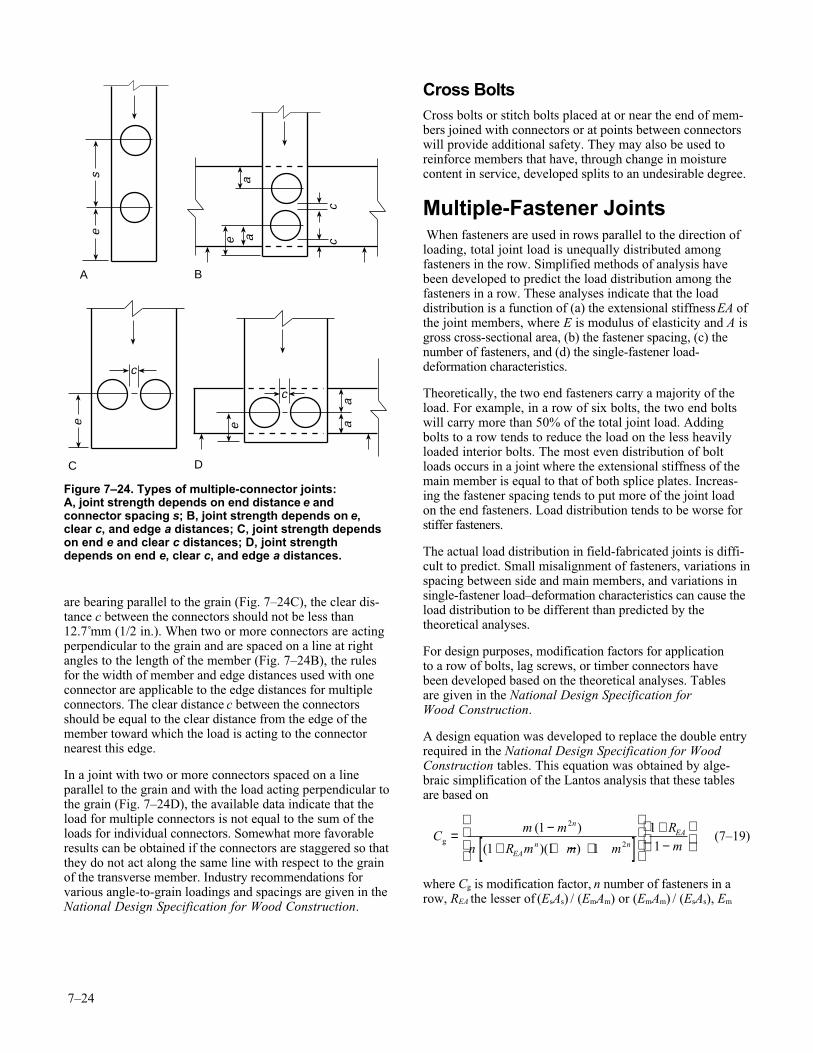
7–24
are bearing parallel to the grain (Fig. 7–24C), the clear dis-tance c between the connectors should not be less than12.7 mm (1/2 in.). When two or more connectors are actingperpendicular to the grain and are spaced on a line at rightangles to the length of the member (Fig. 7–24B), the rulesfor the width of member and edge distances used with oneconnector are applicable to the edge distances for multipleconnectors. The clear distance c between the connectorsshould be equal to the clear distance from the edge of themember toward which the load is acting to the connectornearest this edge.
In a joint with two or more connectors spaced on a lineparallel to the grain and with the load acting perpendicular tothe grain (Fig. 7–24D), the available data indicate that theload for multiple connectors is not equal to the sum of theloads for individual connectors. Somewhat more favorableresults can be obtained if the connectors are staggered so thatthey do not act along the same line with respect to the grainof the transverse member. Industry recommendations forvarious angle-to-grain loadings and spacings are given in theNational Design Specification for Wood Construction.
Cross BoltsCross bolts or stitch bolts placed at or near the end of mem-bers joined with connectors or at points between connectorswill provide additional safety. They may also be used toreinforce members that have, through change in moisturecontent in service, developed splits to an undesirable degree.
Multiple-Fastener Joints When fasteners are used in rows parallel to the direction ofloading, total joint load is unequally distributed amongfasteners in the row. Simplified methods of analysis havebeen developed to predict the load distribution among thefasteners in a row. These analyses indicate that the loaddistribution is a function of (a) the extensional stiffness EA ofthe joint members, where E is modulus of elasticity and A isgross cross-sectional area, (b) the fastener spacing, (c) thenumber of fasteners, and (d) the single-fastener load-deformation characteristics.
Theoretically, the two end fasteners carry a majority of theload. For example, in a row of six bolts, the two end boltswill carry more than 50% of the total joint load. Addingbolts to a row tends to reduce the load on the less heavilyloaded interior bolts. The most even distribution of boltloads occurs in a joint where the extensional stiffness of themain member is equal to that of both splice plates. Increas-ing the fastener spacing tends to put more of the joint loadon the end fasteners. Load distribution tends to be worse forstiffer fasteners.
The actual load distribution in field-fabricated joints is diffi-cult to predict. Small misalignment of fasteners, variations inspacing between side and main members, and variations insingle-fastener load–deformation characteristics can cause theload distribution to be different than predicted by thetheoretical analyses.
For design purposes, modification factors for applicationto a row of bolts, lag screws, or timber connectors havebeen developed based on the theoretical analyses. Tablesare given in the National Design Specification forWood Construction.
A design equation was developed to replace the double entryrequired in the National Design Specification for WoodConstruction tables. This equation was obtained by alge-braic simplification of the Lantos analysis that these tablesare based on
Cm m
n R m m m
Rm
n
EAn n
EAg = −
+ + − +[ ]
+−
( )
( )( )
1
1 1 1
11
2
2 (7–19)
where Cg is modification factor, n number of fasteners in arow, REA the lesser of (EsAs) / (EmAm) or (EmAm) / (EsAs), Em
c
e
c
aa
ee
cc
aae
s
A B
C D
Figure 7–24. Types of multiple-connector joints:A, joint strength depends on end distance e andconnector spacing s; B, joint strength depends on e,clear c, and edge a distances; C, joint strength dependson end e and clear c distances; D, joint strengthdepends on end e, clear c, and edge a distances.
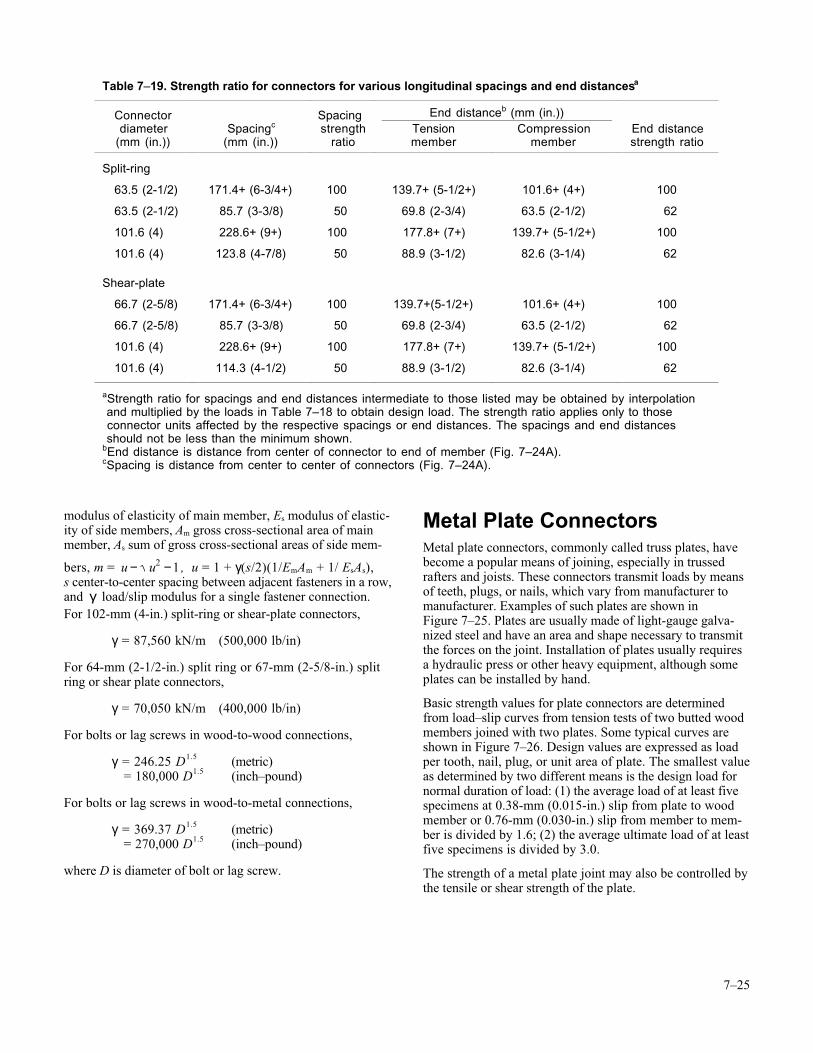
7–25
modulus of elasticity of main member, Es modulus of elastic-ity of side members, Am gross cross-sectional area of mainmember, As sum of gross cross-sectional areas of side mem-
bers, m = u u− −2 1 , u = 1 + γ(s/2)(1/EmAm + 1/ EsAs),s center-to-center spacing between adjacent fasteners in a row,and γ load/slip modulus for a single fastener connection.For 102-mm (4-in.) split-ring or shear-plate connectors,
γ = 87,560 kN/m (500,000 lb/in)
For 64-mm (2-1/2-in.) split ring or 67-mm (2-5/8-in.) splitring or shear plate connectors,
γ = 70,050 kN/m (400,000 lb/in)
For bolts or lag screws in wood-to-wood connections,
γ = 246.25 D1.5 (metric) = 180,000 D1.5 (inch–pound)
For bolts or lag screws in wood-to-metal connections,
γ = 369.37 D1.5 (metric) = 270,000 D1.5 (inch–pound)
where D is diameter of bolt or lag screw.
Metal Plate ConnectorsMetal plate connectors, commonly called truss plates, havebecome a popular means of joining, especially in trussedrafters and joists. These connectors transmit loads by meansof teeth, plugs, or nails, which vary from manufacturer tomanufacturer. Examples of such plates are shown inFigure 7–25. Plates are usually made of light-gauge galva-nized steel and have an area and shape necessary to transmitthe forces on the joint. Installation of plates usually requiresa hydraulic press or other heavy equipment, although someplates can be installed by hand.
Basic strength values for plate connectors are determinedfrom load–slip curves from tension tests of two butted woodmembers joined with two plates. Some typical curves areshown in Figure 7–26. Design values are expressed as loadper tooth, nail, plug, or unit area of plate. The smallest valueas determined by two different means is the design load fornormal duration of load: (1) the average load of at least fivespecimens at 0.38-mm (0.015-in.) slip from plate to woodmember or 0.76-mm (0.030-in.) slip from member to mem-ber is divided by 1.6; (2) the average ultimate load of at leastfive specimens is divided by 3.0.
The strength of a metal plate joint may also be controlled bythe tensile or shear strength of the plate.
Table 7–19. Strength ratio for connectors for various longitudinal spacings and end distancesa
Connector Spacing End distanceb (mm (in.))diameter
(mm (in.))Spacingc
(mm (in.))strength
ratioTensionmember
Compressionmember
End distancestrength ratio
Split-ring
63.5 (2-1/2) 171.4+ (6-3/4+) 100 139.7+ (5-1/2+) 101.6+ (4+) 100
63.5 (2-1/2) 85.7 (3-3/8) 50 69.8 (2-3/4) 63.5 (2-1/2) 62
101.6 (4) 228.6+ (9+) 100 177.8+ (7+) 139.7+ (5-1/2+) 100
101.6 (4) 123.8 (4-7/8) 50 88.9 (3-1/2) 82.6 (3-1/4) 62
Shear-plate
66.7 (2-5/8) 171.4+ (6-3/4+) 100 139.7+(5-1/2+) 101.6+ (4+) 100
66.7 (2-5/8) 85.7 (3-3/8) 50 69.8 (2-3/4) 63.5 (2-1/2) 62
101.6 (4) 228.6+ (9+) 100 177.8+ (7+) 139.7+ (5-1/2+) 100
101.6 (4) 114.3 (4-1/2) 50 88.9 (3-1/2) 82.6 (3-1/4) 62
aStrength ratio for spacings and end distances intermediate to those listed may be obtained by interpolation and multiplied by the loads in Table 7–18 to obtain design load. The strength ratio applies only to those connector units affected by the respective spacings or end distances. The spacings and end distances should not be less than the minimum shown.bEnd distance is distance from center of connector to end of member (Fig. 7–24A).cSpacing is distance from center to center of connectors (Fig. 7–24A).
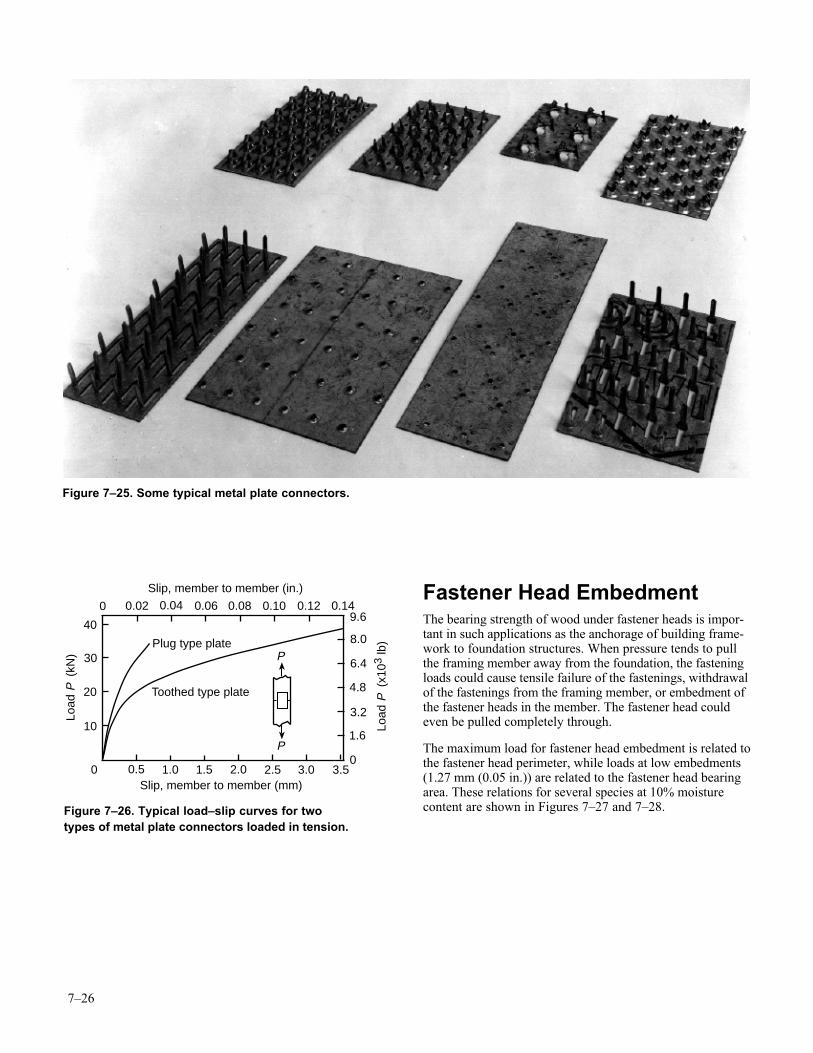
7–26
Fastener Head EmbedmentThe bearing strength of wood under fastener heads is impor-tant in such applications as the anchorage of building frame-work to foundation structures. When pressure tends to pullthe framing member away from the foundation, the fasteningloads could cause tensile failure of the fastenings, withdrawalof the fastenings from the framing member, or embedment ofthe fastener heads in the member. The fastener head couldeven be pulled completely through.
The maximum load for fastener head embedment is related tothe fastener head perimeter, while loads at low embedments(1.27 mm (0.05 in.)) are related to the fastener head bearingarea. These relations for several species at 10% moisturecontent are shown in Figures 7–27 and 7–28.
Figure 7–25. Some typical metal plate connectors.
40
30
20
10
0
9.6
8.0
6.4
4.8
3.2
1.6
0
0
0.5 1.0 1.5 2.0 2.5 3.0 3.5
Slip, member to member (in.)
Slip, member to member (mm)
0.02 0.04 0.06 0.08 0.10 0.12 0.14
Load
P (
kN)
Load
P (
x103
lb)
P
PPlug type plate
Toothed type plate
Figure 7–26. Typical load–slip curves for twotypes of metal plate connectors loaded in tension.

7–27
ReferencesAF&PA. 1997. National design specification for woodconstruction. Washington, DC: American Forest & PaperAssociation.
ASCE. 1995. Standard for load and resistance factor design(LRFD) for engineered wood construction. Washington, DC:American Society of Civil Engineers.
ASCE. 1996. Mechanical connections in wood structures.Washington, DC: American Society of Civil Engineers.
ASTM. (current edition). Philadelphia, PA: AmericanSociety for Testing and Materials.
ASTM F1667. Specification for driven fasteners: nails,spiker, staples.
ASTM D2555–96. Standard methods for establishing clearwood strength values.
ASTM F547. Standard terminology of nails for use withwood and wood-base materials.
ASTM D5652–95. Standard test methods for bolted con-nections in wood and wood-base products.
ASTM D1761–88. Standard test methods for mechanicalfasteners in wood.
Anderson, L.O. 1959. Nailing better wood boxes andcrates. Agric. Handb. 160. Washington, DC: U.S. Depart-ment of Agriculture.
Anderson, L.O. 1970. Wood-frame house construction.Agric. Handb. 73 (rev.). Washington, DC: U.S. Departmentof Agriculture.
Cramer, C.O. 1968. Load distribution in multiple-bolttension joints. Proc. Pap. 5939. Journal of StructuralDivision, American Society of Civil Engineers. 94(ST5):11011117.
Doyle, D.V.; Scholten, J.A. 1963. Performance of boltedjoints in Douglas-fir. Res. Pap. FPL 2. Madison, WI: U.S.Department of Agriculture, Forest Service, Forest ProductsLaboratory.
Eckelman, C.A. 1975. Screw holding performance inhardwoods and particleboard. Forest Products Journal.25(6): 30–35.
Fairchild, I.J. 1926. Holding power of wood screws.Technol. Pap. 319. Washington, DC: U.S. National Bureauof Standards.
Forest Products Laboratory. 1962. General observationson the nailing of wood. FPL Tech. Note 243. Madison, WI:U.S. Department of Agriculture, Forest Service, ForestProducts Laboratory.
Forest Products Laboratory. 1964. Nailing dense hard-woods. Res. Note FPL–037. Madison, WI: U.S. Depart-ment of Agriculture, Forest Service, Forest ProductsLaboratory.
Forest Products Laboratory. 1965. Nail withdrawalresistance of American woods. Res. Note FPL–RN–033.Madison, WI: U.S. Department of Agriculture, ForestService, Forest Products Laboratory.
Goodell, H.R.; Philipps, R.S. 1944. Bolt-bearing strengthof wood and modified wood: effect of different methods ofdrilling bolt holes in wood and plywood. FPL Rep. 1523.Madison, WI: U.S. Department of Agriculture, ForestService, Forest Products Laboratory.
0 30 60 90 120 150
0 1 2 3 4 5 6Fastener perimeter (in.)
Fastener perimeter (mm)
60
45
30
15
Max
imum
em
bedm
ent l
oad
(kN
)
Max
imum
em
bedm
ent l
oad
(x10
3 lb
)
14
12
10
8
6
4
2
0
Red Oak
Southern Pine
Western hemlockWhite fir
Douglas-fir
Figure 7–27. Relation between maximumembedment load and fastener perimeter forseveral species of wood.
0 5 10 15 20
8
7
6
5
4
3
2
1
0
0 2 3
Fastener head bearing area (cm2)
Fastener head bearing area (in2)
35
30
25
20
15
10
5
Load
at 1
.27-
mm
em
bedm
ent (
kN)
Load
at 0
.05-
in. e
mbe
dmen
t (x1
03 lb
)
Red Oak
Southern Pine
Douglas-fir
Western hemlock
White fir
1
Figure 7–28. Relation between load at 1.27-mm(0.05-in.) embedment and fastener bearing areafor several species.
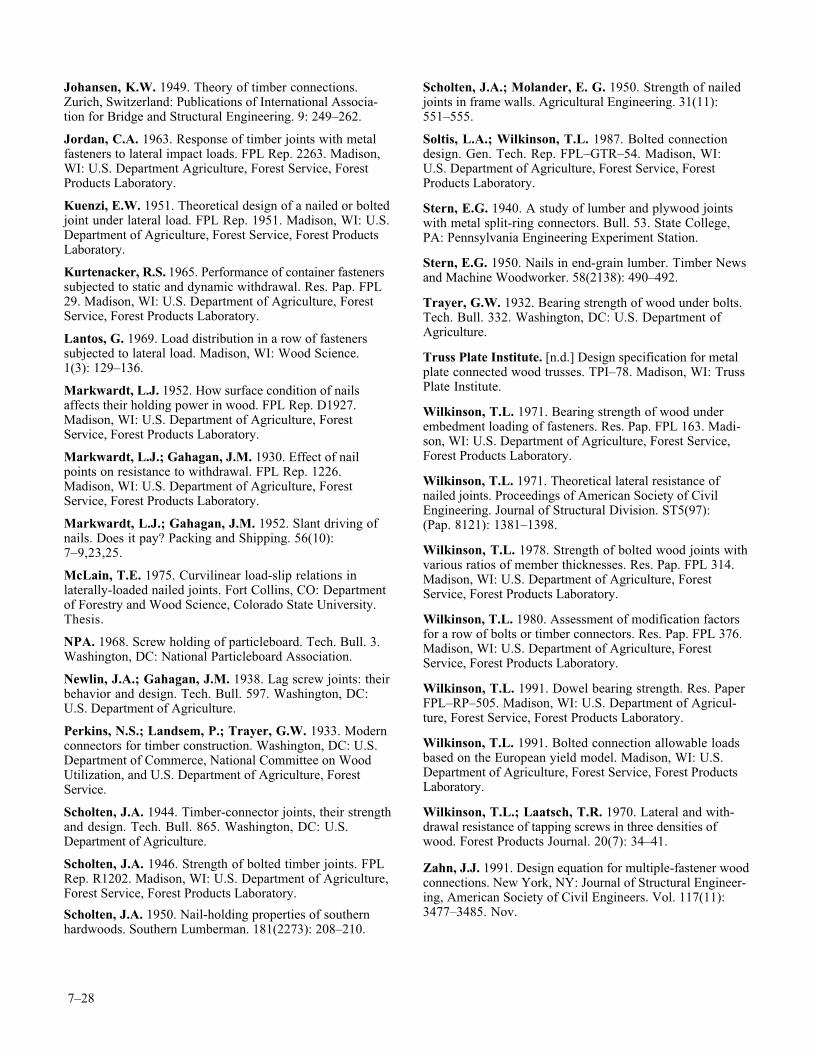
7–28
Johansen, K.W. 1949. Theory of timber connections.Zurich, Switzerland: Publications of International Associa-tion for Bridge and Structural Engineering. 9: 249–262.
Jordan, C.A. 1963. Response of timber joints with metalfasteners to lateral impact loads. FPL Rep. 2263. Madison,WI: U.S. Department Agriculture, Forest Service, ForestProducts Laboratory.
Kuenzi, E.W. 1951. Theoretical design of a nailed or boltedjoint under lateral load. FPL Rep. 1951. Madison, WI: U.S.Department of Agriculture, Forest Service, Forest ProductsLaboratory.
Kurtenacker, R.S. 1965. Performance of container fastenerssubjected to static and dynamic withdrawal. Res. Pap. FPL29. Madison, WI: U.S. Department of Agriculture, ForestService, Forest Products Laboratory.
Lantos, G. 1969. Load distribution in a row of fastenerssubjected to lateral load. Madison, WI: Wood Science.1(3): 129–136.
Markwardt, L.J. 1952. How surface condition of nailsaffects their holding power in wood. FPL Rep. D1927.Madison, WI: U.S. Department of Agriculture, ForestService, Forest Products Laboratory.
Markwardt, L.J.; Gahagan, J.M. 1930. Effect of nailpoints on resistance to withdrawal. FPL Rep. 1226.Madison, WI: U.S. Department of Agriculture, ForestService, Forest Products Laboratory.
Markwardt, L.J.; Gahagan, J.M. 1952. Slant driving ofnails. Does it pay? Packing and Shipping. 56(10):7–9,23,25.
McLain, T.E. 1975. Curvilinear load-slip relations inlaterally-loaded nailed joints. Fort Collins, CO: Departmentof Forestry and Wood Science, Colorado State University.Thesis.
NPA. 1968. Screw holding of particleboard. Tech. Bull. 3.Washington, DC: National Particleboard Association.
Newlin, J.A.; Gahagan, J.M. 1938. Lag screw joints: theirbehavior and design. Tech. Bull. 597. Washington, DC:U.S. Department of Agriculture.
Perkins, N.S.; Landsem, P.; Trayer, G.W. 1933. Modernconnectors for timber construction. Washington, DC: U.S.Department of Commerce, National Committee on WoodUtilization, and U.S. Department of Agriculture, ForestService.
Scholten, J.A. 1944. Timber-connector joints, their strengthand design. Tech. Bull. 865. Washington, DC: U.S.Department of Agriculture.
Scholten, J.A. 1946. Strength of bolted timber joints. FPLRep. R1202. Madison, WI: U.S. Department of Agriculture,Forest Service, Forest Products Laboratory.
Scholten, J.A. 1950. Nail-holding properties of southernhardwoods. Southern Lumberman. 181(2273): 208–210.
Scholten, J.A.; Molander, E. G. 1950. Strength of nailedjoints in frame walls. Agricultural Engineering. 31(11):551–555.
Soltis, L.A.; Wilkinson, T.L. 1987. Bolted connectiondesign. Gen. Tech. Rep. FPL–GTR–54. Madison, WI:U.S. Department of Agriculture, Forest Service, ForestProducts Laboratory.
Stern, E.G. 1940. A study of lumber and plywood jointswith metal split-ring connectors. Bull. 53. State College,PA: Pennsylvania Engineering Experiment Station.
Stern, E.G. 1950. Nails in end-grain lumber. Timber Newsand Machine Woodworker. 58(2138): 490–492.
Trayer, G.W. 1932. Bearing strength of wood under bolts.Tech. Bull. 332. Washington, DC: U.S. Department ofAgriculture.
Truss Plate Institute. [n.d.] Design specification for metalplate connected wood trusses. TPI–78. Madison, WI: TrussPlate Institute.
Wilkinson, T.L. 1971. Bearing strength of wood underembedment loading of fasteners. Res. Pap. FPL 163. Madi-son, WI: U.S. Department of Agriculture, Forest Service,Forest Products Laboratory.
Wilkinson, T.L. 1971. Theoretical lateral resistance ofnailed joints. Proceedings of American Society of CivilEngineering. Journal of Structural Division. ST5(97):(Pap. 8121): 1381–1398.
Wilkinson, T.L. 1978. Strength of bolted wood joints withvarious ratios of member thicknesses. Res. Pap. FPL 314.Madison, WI: U.S. Department of Agriculture, ForestService, Forest Products Laboratory.
Wilkinson, T.L. 1980. Assessment of modification factorsfor a row of bolts or timber connectors. Res. Pap. FPL 376.Madison, WI: U.S. Department of Agriculture, ForestService, Forest Products Laboratory.
Wilkinson, T.L. 1991. Dowel bearing strength. Res. PaperFPL–RP–505. Madison, WI: U.S. Department of Agricul-ture, Forest Service, Forest Products Laboratory.
Wilkinson, T.L. 1991. Bolted connection allowable loadsbased on the European yield model. Madison, WI: U.S.Department of Agriculture, Forest Service, Forest ProductsLaboratory.
Wilkinson, T.L.; Laatsch, T.R. 1970. Lateral and with-drawal resistance of tapping screws in three densities ofwood. Forest Products Journal. 20(7): 34–41.
Zahn, J.J. 1991. Design equation for multiple-fastener woodconnections. New York, NY: Journal of Structural Engineer-ing, American Society of Civil Engineers. Vol. 117(11):3477–3485. Nov.

FromForest Products Laboratory. 1999. Wood handbook—Wood as an engineering material.Gen. Tech. Rep. FPL–GTR–113. Madison, WI: U.S. Department of Agriculture, Forest Service,Forest Products Laboratory. 463 p.