Embed Size (px)
DESCRIPTION
The following PDF shows a series of dashboard examples you can expect from The Work Order Network. This packet contains Budget, Actual, Forecast summaries along with "Spend by Account" reports, "Capital Review" and also includes Corrigo's industry leading "Vendor Scorecard".
Citation preview
powered bypowered by
The Work Order Network
DASHBOARD EXAMPLESPresented by Corrigo
powered by
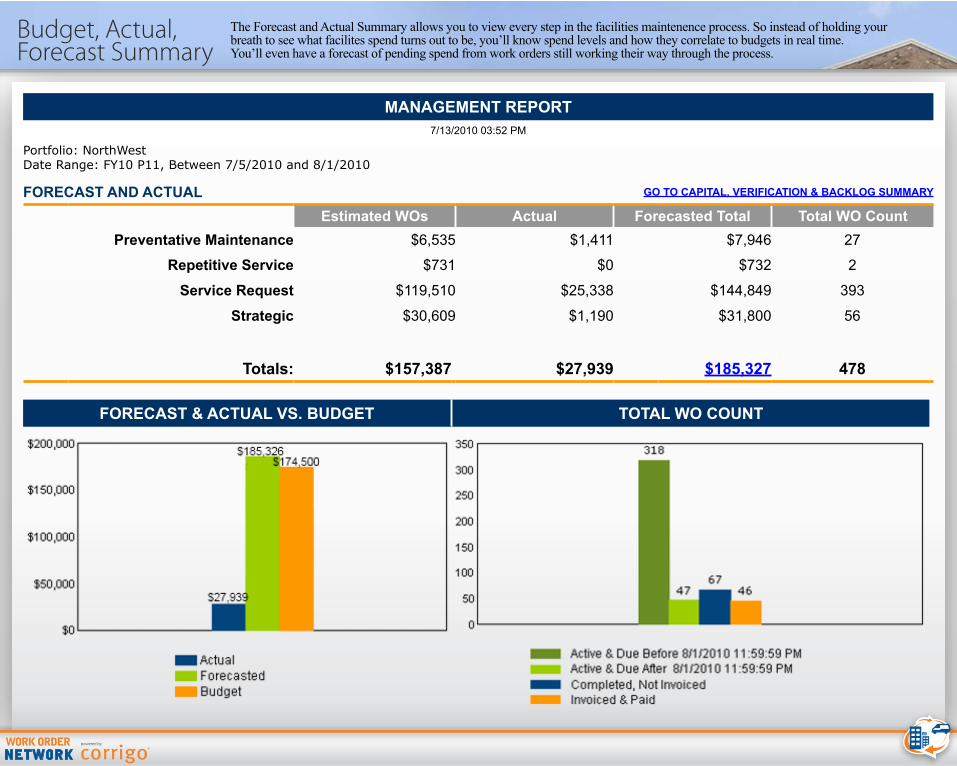
MANAGEMENT REPORT7/13/2010 03:52 PM
Portfolio: NorthWest Date Range: FY10 P11, Between 7/5/2010 and 8/1/2010
FORECAST AND ACTUAL GO TO CAPITAL, VERIFICATION & BACKLOG SUMMARY
Estimated WOs Actual Forecasted Total Total WO CountPreventative Maintenance $6,535 $1,411 $7,946 27
Repetitive Service $731 $0 $732 2
Service Request $119,510 $25,338 $144,849 393
Strategic $30,609 $1,190 $31,800 56
Totals: $157,387 $27,939 $185,327 478
FORECAST & ACTUAL VS. BUDGET TOTAL WO COUNT
Budget, Actual, Forecast Summary
powered by
The Forecast and Actual Summary allows you to view every step in the facilities maintenence process. So instead of holding your breath to see what facilites spend turns out to be, you’ll know spend levels and how they correlate to budgets in real time. You’ll even have a forecast of pending spend from work orders still working their way through the process.
powered by
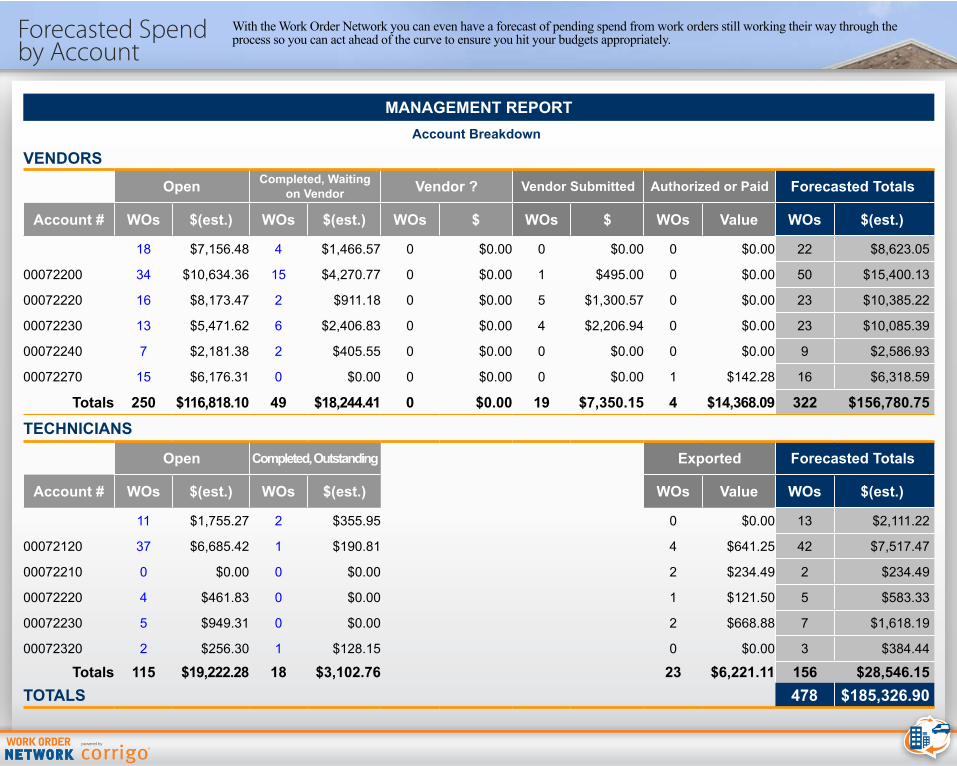
MANAGEMENT REPORTAccount Breakdown
VENDORSOpen Completed, Waiting
on Vendor Vendor ? Vendor Submitted Authorized or Paid Forecasted Totals
Account # WOs $(est.) WOs $(est.) WOs $ WOs $ WOs Value WOs $(est.)
18 $7,156.48 4 $1,466.57 0 $0.00 0 $0.00 0 $0.00 22 $8,623.05
00072200 34 $10,634.36 15 $4,270.77 0 $0.00 1 $495.00 0 $0.00 50 $15,400.13
00072220 16 $8,173.47 2 $911.18 0 $0.00 5 $1,300.57 0 $0.00 23 $10,385.22
00072230 13 $5,471.62 6 $2,406.83 0 $0.00 4 $2,206.94 0 $0.00 23 $10,085.39
00072240 7 $2,181.38 2 $405.55 0 $0.00 0 $0.00 0 $0.00 9 $2,586.93
00072270 15 $6,176.31 0 $0.00 0 $0.00 0 $0.00 1 $142.28 16 $6,318.59
Totals 250 $116,818.10 49 $18,244.41 0 $0.00 19 $7,350.15 4 $14,368.09 322 $156,780.75
TECHNICIANS
Open Completed, Outstanding Exported Forecasted Totals
Account # WOs $(est.) WOs $(est.) WOs Value WOs $(est.)
11 $1,755.27 2 $355.95 0 $0.00 13 $2,111.22
00072120 37 $6,685.42 1 $190.81 4 $641.25 42 $7,517.47
00072210 0 $0.00 0 $0.00 2 $234.49 2 $234.49
00072220 4 $461.83 0 $0.00 1 $121.50 5 $583.33
00072230 5 $949.31 0 $0.00 2 $668.88 7 $1,618.19
00072320 2 $256.30 1 $128.15 0 $0.00 3 $384.44
Totals 115 $19,222.28 18 $3,102.76 23 $6,221.11 156 $28,546.15TOTALS 478 $185,326.90
Forecasted Spendby Account
powered by
With the Work Order Network you can even have a forecast of pending spend from work orders still working their way through the process so you can act ahead of the curve to ensure you hit your budgets appropriately.
powered by
Capital Review, Backlog & Work Verification
powered by
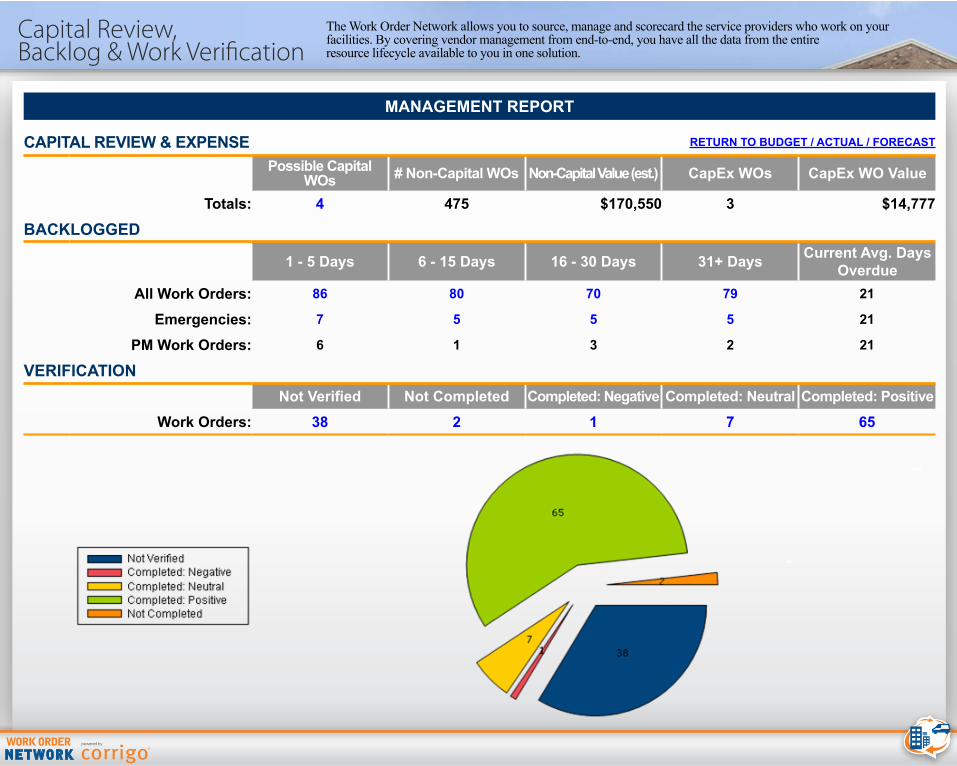
The Work Order Network allows you to source, manage and scorecard the service providers who work on your facilities. By covering vendor management from end-to-end, you have all the data from the entire resource lifecycle available to you in one solution.
MANAGEMENT REPORT
CAPITAL REVIEW & EXPENSE RETURN TO BUDGET / ACTUAL / FORECAST
Possible Capital WOs # Non-Capital WOs Non-Capital Value (est.) CapEx WOs CapEx WO Value
Totals: 4 475 $170,550 3 $14,777
BACKLOGGED
1 - 5 Days 6 - 15 Days 16 - 30 Days 31+ Days Current Avg. Days Overdue
All Work Orders: 86 80 70 79 21
Emergencies: 7 5 5 5 21
PM Work Orders: 6 1 3 2 21
VERIFICATIONNot Verified Not Completed Completed: Negative Completed: Neutral Completed: Positive
Work Orders: 38 2 1 7 65
powered by
Vendor Scorecard
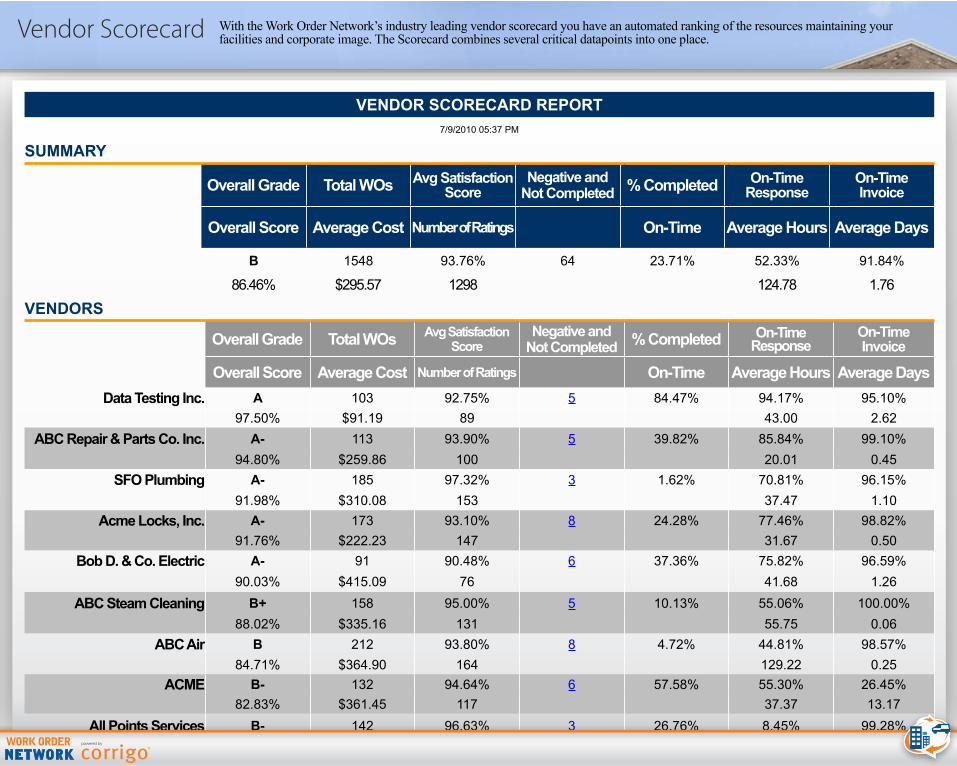
VENDOR SCORECARD REPORT7/9/2010 05:37 PM
SUMMARY
Overall Grade Total WOs Avg Satisfaction Score
Negative and Not Completed % Completed On-Time
ResponseOn-Time Invoice
Overall Score Average Cost Number of Ratings On-Time Average Hours Average Days
B 1548 93.76% 64 23.71% 52.33% 91.84%
86.46% $295.57 1298 124.78 1.76
VENDORS
Overall Grade Total WOs Avg Satisfaction Score
Negative and Not Completed % Completed On-Time
ResponseOn-Time Invoice
Overall Score Average Cost Number of Ratings On-Time Average Hours Average DaysData Testing Inc. A 103 92.75% 5 84.47% 94.17% 95.10%
97.50% $91.19 89 43.00 2.62ABC Repair & Parts Co. Inc. A- 113 93.90% 5 39.82% 85.84% 99.10%
94.80% $259.86 100 20.01 0.45SFO Plumbing A- 185 97.32% 3 1.62% 70.81% 96.15%
91.98% $310.08 153 37.47 1.10Acme Locks, Inc. A- 173 93.10% 8 24.28% 77.46% 98.82%
91.76% $222.23 147 31.67 0.50Bob D. & Co. Electric A- 91 90.48% 6 37.36% 75.82% 96.59%
90.03% $415.09 76 41.68 1.26ABC Steam Cleaning B+ 158 95.00% 5 10.13% 55.06% 100.00%
88.02% $335.16 131 55.75 0.06ABC Air B 212 93.80% 8 4.72% 44.81% 98.57%
84.71% $364.90 164 129.22 0.25ACME B- 132 94.64% 6 57.58% 55.30% 26.45%
82.83% $361.45 117 37.37 13.17All Points Services B- 142 96.63% 3 26.76% 8.45% 99.28%
80.60% $303.08 124 82.63 0.12powered by
With the Work Order Network’s industry leading vendor scorecard you have an automated ranking of the resources maintaining your facilities and corporate image. The Scorecard combines several critical datapoints into one place.
powered by
Tech Metric Report
powered by
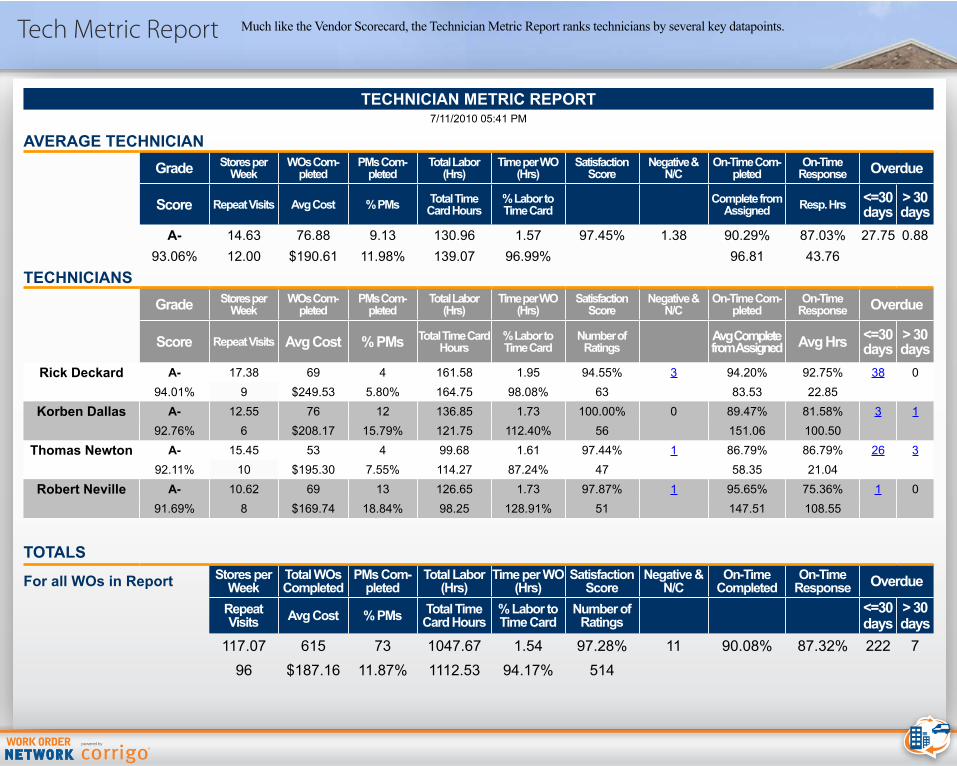
Much like the Vendor Scorecard, the Technician Metric Report ranks technicians by several key datapoints.
TECHNICIAN METRIC REPORT7/11/2010 05:41 PM
AVERAGE TECHNICIANGrade Stores per
WeekWOs Com-
pletedPMs Com-
pletedTotal Labor
(Hrs)Time per WO
(Hrs)Satisfaction
ScoreNegative &
N/COn-Time Com-
pletedOn-Time
Response Overdue
Score Repeat Visits Avg Cost % PMs Total Time Card Hours
% Labor to Time Card
Complete from Assigned Resp. Hrs <=30
days> 30 days
A- 14.63 76.88 9.13 130.96 1.57 97.45% 1.38 90.29% 87.03% 27.75 0.8893.06% 12.00 $190.61 11.98% 139.07 96.99% 96.81 43.76
TECHNICIANSGrade Stores per
WeekWOs Com-
pletedPMs Com-
pletedTotal Labor
(Hrs)Time per WO
(Hrs)Satisfaction
ScoreNegative &
N/COn-Time Com-
pletedOn-Time
Response Overdue
Score Repeat Visits Avg Cost % PMs Total Time Card Hours
% Labor to Time Card
Number of Ratings
Avg Complete from Assigned Avg Hrs <=30
days> 30 days
Rick Deckard A- 17.38 69 4 161.58 1.95 94.55% 3 94.20% 92.75% 38 094.01% 9 $249.53 5.80% 164.75 98.08% 63 83.53 22.85
Korben Dallas A- 12.55 76 12 136.85 1.73 100.00% 0 89.47% 81.58% 3 192.76% 6 $208.17 15.79% 121.75 112.40% 56 151.06 100.50
Thomas Newton A- 15.45 53 4 99.68 1.61 97.44% 1 86.79% 86.79% 26 392.11% 10 $195.30 7.55% 114.27 87.24% 47 58.35 21.04
Robert Neville A- 10.62 69 13 126.65 1.73 97.87% 1 95.65% 75.36% 1 091.69% 8 $169.74 18.84% 98.25 128.91% 51 147.51 108.55
TOTALS
For all WOs in Report Stores per Week
Total WOs Completed
PMs Com-pleted
Total Labor (Hrs)
Time per WO (Hrs)
Satisfaction Score
Negative & N/C
On-Time Completed
On-Time Response Overdue
Repeat Visits Avg Cost % PMs Total Time
Card Hours% Labor to Time Card
Number of Ratings
<=30 days
> 30 days
117.07 615 73 1047.67 1.54 97.28% 11 90.08% 87.32% 222 796 $187.16 11.87% 1112.53 94.17% 514
powered by
Capital Review, Backlog & Work Verification
powered by
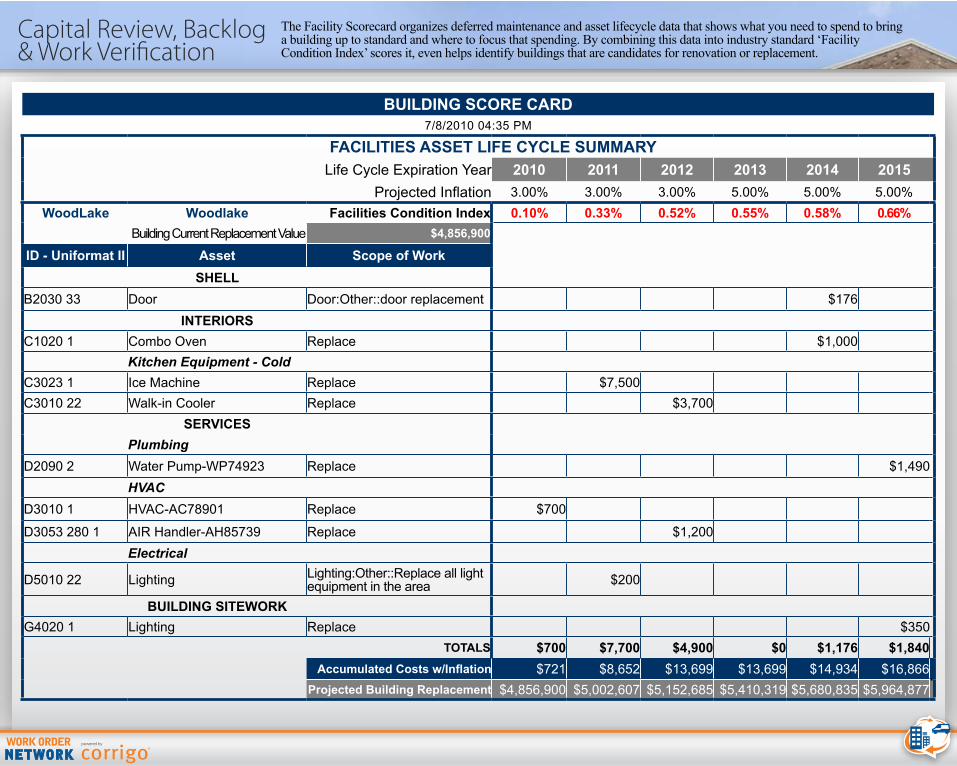
The Facility Scorecard organizes deferred maintenance and asset lifecycle data that shows what you need to spend to bring a building up to standard and where to focus that spending. By combining this data into industry standard ‘Facility Condition Index’ scores it, even helps identify buildings that are candidates for renovation or replacement.
BUILDING SCORE CARD7/8/2010 04:35 PM
FACILITIES ASSET LIFE CYCLE SUMMARYLife Cycle Expiration Year 2010 2011 2012 2013 2014 2015
Projected Inflation 3.00% 3.00% 3.00% 5.00% 5.00% 5.00%WoodLake Woodlake Facilities Condition Index 0.10% 0.33% 0.52% 0.55% 0.58% 0.66% )
Building Current Replacement Value $4,856,900
ID - Uniformat II Asset Scope of WorkSHELL
B2030 33 Door Door:Other::door replacement $176INTERIORS
C1020 1 Combo Oven Replace $1,000Kitchen Equipment - Cold
C3023 1 Ice Machine Replace $7,500C3010 22 Walk-in Cooler Replace $3,700
SERVICESPlumbing
D2090 2 Water Pump-WP74923 Replace $1,490HVAC
D3010 1 HVAC-AC78901 Replace $700
D3053 280 1 AIR Handler-AH85739 Replace $1,200Electrical
D5010 22 Lighting Lighting:Other::Replace all light equipment in the area $200
BUILDING SITEWORKG4020 1 Lighting Replace $350
TOTALS $700 $7,700 $4,900 $0 $1,176 $1,840Accumulated Costs w/Inflation $721 $8,652 $13,699 $13,699 $14,934 $16,866
Projected Building Replacement $4,856,900 $5,002,607 $5,152,685 $5,410,319 $5,680,835 $5,964,877
powered by
Contact Corrigo
Rick MichauxChairman and Chief Strategy Officer(214) 218-4210 direct(650) 670-4026 [email protected] call me directly anytime with questions or comments