Embed Size (px)
Citation preview

Women's Work and Family Profiles over the Lifecourse and their Subsequent Health
Outcomes. Evidence for Europe
Working Paper no 28
Authors: Thomas Leoni (WIFO), Rainer Eppel (WIFO)
July 2013

THEME SSH.2011.1.2-1
Socio-economic Sciences and Humanities Europe moving towards a new path of economic growth and social development - Collaborative project
Women's Work and Family Profiles over the Lifecourse and their Subsequent Health
Outcomes. Evidence for Europe
Work Package 102 MS7 "Research paper on new social risks"
Working Paper no 28
This paper can be downloaded from
Please respect that this report was produced by the named authors within the WWWforEurope project and has to be cited accordingly
www.foreurope.eu
Authors: Thomas Leoni (WIFO), Rainer Eppel (WIFO)
Reviewed by: René Böheim (Johannes Kepler University Linz), Anton Hemerijck (University Amsterdam)

Women's Work and Family Profiles over the Lifecourse and their Subsequent Health Outcomes. Evidence for Europe
Thomas Leoni (WIFO), Rainer Eppel (WIFO)
Contribution to the Project
The aim of this research paper is to contribute to a better understanding of the challenges faced by European countries in the quest to adapt their social protection systems and labour market institutions to long-term economic, demographic and social change.

Women’s Work and Family Profilesover the Lifecourse and theirSubsequent Health Outcomes.
Evidence for Europe∗
Thomas Leoni† Rainer Eppel‡
July 2013
Abstract
The reconciliation of family and work is one of the “new socialrisks” contemporary welfare states are challenged to address. Thispaper contributes to a better understanding of the roles of work andfamily in women’s life trajectories, shedding light on determinantsand welfare outcomes of different combinations of motherhood andemployment. We identify and compare distinctive life-course employ-ment profiles of mothers across 13 European countries. After analyzingselection patterns, we investigate the possible link that exists betweenthese work-family profiles up to the age of 50 and subsequent healthoutcomes. We embed our empirical investigation in a comparativewelfare state framework and differentiate between four geographicalareas that can be associated with different types of European welfarestate regimes.
Keywords: welfare state, gender, family and work, healthJEL classification: I1, J2
∗The authors would like to thank Anton Hemerijck and Rene Boheim as well as theparticipants in two area meetings of the “Welfare, Wealth and Work for Europe” projectin Vienna and Mannheim and in a seminar at WIFO for very valuable comments andsuggestions.†Corresponding author: Austrian Institute of Economic Research (WIFO), Vienna,
email: [email protected].‡Austrian Institute of Economic Research (WIFO), Vienna.

1 Introduction
The strong increase in female labour force participation, fuelled by a big
leap in women’s educational attainment, is the most important trend in
labour markets of the 20th century (Goldin, 2006) and one salient trait of
post-industrialization. It reflects on the one hand an expansion of women’s
opportunities to pursue their individual self-fulfillment, to choose between
different combinations of family and career involvement and to achieve eco-
nomic independence. On the other hand, this momentous shift has created
new tensions and needs, and difficulties with reconciling family and work can
be identified as one of the “new social risks” contemporary welfare states are
challenged to address (Bonoli, 2007).
Since the increase in female employment has neither resulted in an equal
gender division of unpaid work nor an equivalent externalization of household
activities to public or private service providers, it is primarily women who
are exposed to the risk of experiencing some sort of work-family conflict.
A rapidly increasing body of literature is scrutinizing the opportunities and
constraints associated with the multiple exigencies of family and working life
as well as the outcomes that result from different individual strategies and
policy settings (see, e.g., Misra et al., 2011; Del Boca et al., 2009; Janus,
2012).
We contribute to a better understanding of the roles of work and family
in women’s life trajectories, by shedding light on both determinants and
welfare outcomes of different combinations of motherhood and employment.
More specifically, we identify and compare distinctive life-course employment
profiles of European mothers across welfare state groups. After analyzing
selection into these employment patterns, we examine a possible link between
women’s work-family profiles up to the age of 50 and their health outcomes
later in life.
Previous studies provide evidence that stable employment is generally as-
sociated with superior health outcomes. Intuitively, this finding seems plau-
sible as stable and steady employment is conducive to achieve economic secu-
1

rity and is demonstrably one of the most effective protective factors against
poverty. At the same time, however, high workloads, poor working conditions
and difficulties with the reconciliation of dual roles may have detrimental ef-
fects on health and well-being. Moreover outcomes may differ by country
and country group as work and family choices as well as health outcomes are
shaped by different institutional settings.
We construct a comprehensive health index to assess the relationship be-
tween mothers’ life-course employment profiles up to the age of 50 and their
health outcomes at later stages in life. Within this analysis, we draw atten-
tion to the role played by the gender distribution of work and care within
the household as well as to the way in which socio-economic background,
early childhood conditions and the situation in early adulthood shape choice
and pursuit of different employment profiles. In contrast to earlier studies
that investigate the relationship between work pathways and health for single
countries (f.i. Frech and Damaske, 2012), we embed our empirical investiga-
tion in the framework of comparative welfare state analysis and differentiate
between four geographical areas that can be associated with different types
of European welfare state regimes. For this purpose, we use data from the
first three waves of the Survey of Health, Ageing and Retirement in Europe
(SHARE) – a cross-country longitudinal survey with the main aim to under-
stand patterns of ageing across Europe. This dataset provides information
spanning the whole lifetime of a representative sample of persons aged 50
and above in 13 European countries.
Clearly, the choice of employment patterns is not random. We find that
women with favourable initial conditions, such as good childhood health,
high cognitive skills and advantageous socio-economic conditions of parental
home, are more likely to reconcile care for their children with continuous em-
ployment over the life-course. Those who combine motherhood with stable
employment tend to be endowed with above-average health status. Working
only marginally or with interruptions is associated with less favourable health
outcomes. On the contrary, the observed statistical difference in health status
between homecentred and full-career mothers disappears once we control for
2
differences in age, education and income. Southern Europe is an exception
in this respect, where health does not vary significantly by the work-family
profile. Our general finding holds, when we apply a multinomial treatment
model to control for selection into careerpath on both observable and unob-
servable characteristics.
2 Literature review
2.1 Work, multiple roles, and health
Women have long reported worse self-related health than men. However,
women’s health is found to have improved in the past decades and the gender
gap has narrowed over the last two decades. Rising educational attainment
and labour force participation may have contributed to this upward trend.
Even if such benefits may be increasingly threatened by a variety of other
important changes such as growing difficulties with balancing family and
work, some evidence suggests that the increase in education and employment
might even result in a reversed gender gap in self-related health in the near
future (Schnittker, 2007).
Earlier research finds that women and also mothers with steady employ-
ment careers are healthier than their peers who do not work or are employed
intermittently. For example, Frech and Damaske (2012) find for US mothers
that full-time, continuous employment following a first birth is associated
with significantly better physical and mental health at age 40 than part-time
work, paid work repeatedly interrupted by unemployment, and staying at
home without engaging in paid work. Part-time workers with little unem-
ployment report significantly better health at age 40 than mothers experienc-
ing persistent unemployment. These relationships remain after adjusting for
pre-pregnany and at-birth characteristics and accounting for other selection.
The authors find proof of the hypothesis that mothers more advantaged prior
to pregnancy in terms of education and work experience as well as cognitive
abilities select into full-time, continuous employment, whereas those from
3

disadvantaged backgrounds, young mothers or black and Hispanic ones, are
more likely to follow interrupted working careers or staying at home. These
selection results are interpreted as evidence that early life-course disadvan-
tages accumulate over time, as the more disadvantaged women are less likely
to experience the work pathways associated with the greatest health benefits
at age 40. Results obtained by Tubeuf et al. (2012) for Britain seem to sup-
port this claim: Early-life conditions are found to be important predictors
of adult health, accounting for almost 20% of explained health inequality.
Noticeably, the absence of a father at the time of birth and experience of
financial hardships represent the lead factors for direct effects on health.
Thus, there is evidence of a cumulation of disadvantage. However, taking
other studies – such as Elman and Orand (2004), Ferraro and Kelley-Moore
(2003), Hamil-Luker and O’rand (2007), Hayward and Gorman (2004) and
O’rand and Hamil-Luker (2005) – into account, there is not yet a consensus
regarding the extent to which the experience of early disadvantage influences
later health outcomes.
Theory and empirical evidence indicate that paid work is generally benefi-
cial for physical and mental health, and that employed persons enjoy better
health relative to the non-employed or underemployed. Studies by Pavalko
and Smith (1999) and Ross and Mirowsky (1995) show that the positive re-
lationship between paid work and health persists across race, marital status,
and life course stage and is strongest among full-time working women, who
report a lower increase in physical limitations relative to their unemployed or
intermittently employed peers. In a meta-study, Klumb and Lampert (2004)
do not find consistent results across different health outcomes such as psy-
chological distress, subjective health, cardiovascular risks and disease, and
mortality. They do however conclude that “methodologically sound longi-
tudinal studies confirm the findings of cross-sectional research showing that
employment has either beneficial or neutral effects on women’s health” (p.
1016).
Several investigations provide evidence that situations in which the com-
bination of work and care activities results in work overload and work-family
4

conflict represent negative health determinants. For instance, Muffels and
Kemperman (2011) find that women gain in well-being when combining work
and care, but only up to a particular limit or ceiling in terms of hours spent
after which subjective well-being declines strongly due to the time pressure
they face. In line with this finding, Roxburgh (2011) provides evidence for
a significantly positive association between parental time strains and depres-
sion that is largely explained by job demands. Well-off parents are, however,
significantly less depressed by parental time strains than less affluent par-
ents. Moreover, it seems that negative outcomes resulting from work-family
conflict are not necessarily confined to women.
The influence of mothers’ employment on their health may depend on the
gender division of labour within the household. Economic theory argues that
specialization enhances mental health and wellbeing, whereas other, more
psychological theories argue that equity matters most. Kalmijn and Monden
(2012) combine information on the time spent on household and paid labour
in order to study the effect of the division of labour within households on
husbands and wives depressive symptoms, thereby considering separate and
partly independent measures of equity and specialization. They find clear
evidence for the equity hypothesis: When hours spent on paid and household
labour are more equally distributed between husband and wife, both report
fewer depressive symptoms. The authors find only weak and inconsistent
support for a positive effect of specialization.
2.2 Work-family models in a comparative welfare state
perspective
Despite a general increase in Europe, labour force participation of women and
particularly mothers varies markedly across countries. Possible reasons for
these differences are manifold, since labour market behavior is influenced by a
host of factors that include individual and household-related characteristics,
economic and labour market conditions as well as cultural values, traditions
and norms such as the prevailing notions of gender roles. Moreover, empirical
5

studies attribute a significant explanatory power to the design of welfare state
policies that shape women’s engagement in employment and child care as well
as the gender distribution of unpaid work.1
Children in need of care are found to hardly influence the work career of
men, but normally have a significant negative effect on both the probability
of labour force participation of women and their working hours. The lower
the age and the higher the number of children in a household, the higher is
the probability of women being non-employed and the lower are their actual
working hours in a job.2 As shown in the literature, this impact of mother-
hood is mitigated by social policy measures that facilitate the combination
of family and work. The most important policy areas in this respect concern
childcare facilities, parental leave, working-time regulations and other flexi-
ble work arrangements as well as gender equality.3 The extent of women’s
labour market participation is influenced also by other institutional features,
such as the design of the tax system and the organisation of old age care.
It is the particular mix of these institutional arrangements that influences
mothers’ (and women’s) employment over the lifecourse.4
In our analysis we examine a possible heterogeneity in the relationship
between women’s work-family profiles and subsequent health across welfare
state types. The classical distinction in welfare state regimes goes back to the
seminal work by Esping-Andersen (1990) and was later expanded to incor-
porate the principle of de-familization, i.e. the extent to which welfare states
weaken individuals’ reliance on the family and facilitate their economic inde-
pendence (Esping-Andersen, 1999, 2002).5 In both cases, European countries
1Cf. Berninger (2009), Cipollone and D’ippoliti (2011), Del Boca et al. (2009),Stadelmann-Steffen (2008), Steiber and Haas (2009) and Misra et al. (2011).
2See, e.g., Uunk et al. (2005) for 13 EU countries, Del Boca et al. (2009) for 15 Europeancountries, Steiber and Haas (2009) for 26 industrialised countries.
3See, e.g., Del Boca and Locatelli (2007), Jaumotte (2003), Del Boca et al. (2008),Stadelmann-Steffen (2008).
4In general, a neutral, individual taxation regime, leave schemes with job protection,a high wage replacement level, sufficient but moderate length and incentives for fathersto take up leave (or individual-based rights to leave) as well as a demand-meeting supplyof good-quality childcare are found in the literature to be essential ingredients of a policysupportive of women’s employment (cf. Bock-Schappelwein et al., 2009).
5The original regime-typology was based upon the principles of de-commodification,
6

are sorted into three groups: a“Social democratic regime”(Nordic countries),
a “Conservative regime” (Continental European countries), and a “Liberal
welfare regime” (Anglo-Saxon Countries). Following the work of Leibfried
(2000), Ferrera (1996) and others, it has meanwhile become standard prac-
tice to add a separate “Mediterranean” type (Southern European countries)
to this three-fold typology and to include Eastern European countries in the
analysis.
More recent cross-country studies show that welfare states can be clustered
into distinct groups according to the way work-family policies shape men’s
and women’s commitment in paid work and care.6 It is however important to
note that these classifications reflect the current or recent situation and are
not necessarily accurate with respect to earlier periods of time. The youngest
women in our SHARE sample were born in 1957 (see section 3.2) and our
analytical sample consists of respondents who completed their education be-
tween the early 1950s and mid-1970s and started their first work experience
immediately or shortly afterwards. Only very few of the policies that we cur-
rently associate with work-family balance were already in place in those years.
Even in the Scandinavian countries, which in many ways played a pioneering
role, support to parents of young children started to be developed mainly
from the late 1960s onwards. According to Bonoli (2007), the reorientation
of the Nordic welfare states in function of the conciliation of employment
and family life began in the 1970s and did not precede, but rather follow the
expansion of female employment.7 Until the late 1960s and early 1970s, the
life of working mothers in Nordic countries was still dominated by “juggling
and by reliance on informal care” (Bonoli, 2007, p. 505).8
social stratification and the public-private mix. Esping-Andersen (1999) added the di-mension of de-familization after being criticised for neglecting the gender-dimension andespecially the role of women as providers of unpaid care work.
6See, e.g., Bambra (2004), Sainsbury (1999), Leitner (2003), Bettio and Plantenga(2004), Gornick and Meyers (2004), Guo and Gilbert (2007) and Thevenon (2011).
7In Sweden, for instance, the decision of a massive expansion of childcare facilities, withthe aim to provide public child care for all pre-school children, was taken in the mid-1970s.At the beginning of the 1970s there were only 80,000 childcare places available, far lessthan the demand. Between 1970 and 1980 the supply of childcare places grew by some250 percent, from 80,000 to 406,000 (Naumann, 2005).
8Although, at least in Sweden, some elements of policies to combine family and em-
7

For the purposes of our research, we have to take into account this historical
dimension. As we can see from Table 9 in the Appendix (restricted to coun-
tries that are part of our SHARE sample), female labour force participation
rates in Europe differed markedly in the 1960s and early 1970s and – even
more importantly – they experienced different growth rates in subsequent
years. These differences in level and growth rate can not be explained solely
by differences in work-family policies, but have to be related to a broader
socio-economic and institutional context. Taking Esping-Andersen’s original
classification as a reference and focusing particularly on the 1960s and 1970s,
we therefore distinguish between the following country groups, associated to
different welfare state regimes:9
(1) In the Nordic countries (Sweden, Denmark), female participation rates
began to rise considerably in the 1960s and attained very high levels by the
early 1980s. A mix of financial allowances, leave facilities and an extensive
public provision of day care encouraged a work-family household setting close
to the ‘dual-earner/dual-carer’-model (Crompton, 1999). The large increase
in public services directed to child care (besides extensive services related to
care for the elderly and the disabled) implied that women were able to leave
the home and enter the labour market, often employed in the public sector
in care jobs but now for a salary instead of doing unpaid housework.
(2) In Continental Europe, female labour force participation stagnated at
a low to intermediate level throughout the 1960s and 1970s. The expansion
of female employment started much later than in Scandinavia. The main re-
sponsibility for the care of young children was (and partly still is) relegated
to the family. With the notable exception of France, levels of public ex-
penditure on care services were very low compared to the Nordic countries.
Families were supported primarily in the form of (unconditional) financial
transfers and work-family policies conducive to a modified version of the
‘male breadwinner-model’, in which men are working full-time and women
adapt their work efforts to family needs by withdrawing from the labour
ployment date back to the 1950s and 1960s (see Sundstrom and Stafford, 1992).9We omit the Anglo-Saxon countries typically subsumed under the Liberal welfare state
regime, because our data do not include any of those countries.
8

market or switching to part-time work (‘dual-earner/female part-time carer
model’, Crompton (1999)).
(3) Women’s labour force participation in Southern Europe (Spain, Italy,
Greece, Portugal) was and still is markedly lower than in other parts of the
continent. By the early 1980s, participation rates in these countries were at
least 10 percentage points below those in Continental Europe and at least
20 percentage points below those in Northern Europe. The dominant gen-
der ideology was that of a ‘male breadwinner and a female carer’: Women
were not encouraged to engage in paid work, but to care for their children at
home without support by the state. Legislation to support female employ-
ment and work-family flexibility (such as the right to part-time work) did
not develop or developed only slowly. Particularly in those countries that re-
turned to democracy only in the 1970s, gender equality legislation was very
fragmentary.
(4) Under communist rule, Eastern Europe was characterised by a gender
regime that – on the surface – had strong resemblances with the Scandinavian
one, while at the same time traditional gender roles dominated in the private
sphere (Pascall and Lewis, 2004). High female employment rates were a rule
and differences between countries before the fall of communism seemed to
be smaller than they were in the West during that period Van der Lippe
and Van Dijk (2002).10 Having the combination of strong female labour
market participation, legal equalities and persistent gender inequality within
households in common, the countries belonging to the former Communist
block can be regarded as a distinct welfare state typology.
In spite of the usefulness and heuristic relevance of this classification, it
would be wrong to lose sight of the differences that existed and still exist
between countries associated with the same welfare state regime. In this
respect, the cluster of Continental countries is the largest and also most het-
erogeneous one. France, for instance, developed its family policies following
a different path than Germany or Austria, particularly with respect to out-
10At the point of transition, women’s labour market participation rates in CEE werevery high, between 70 and 80% depending on the country.
9

of-family childcare institutions. Also the Netherlands, which had very low
levels of female employment until the 1980s, can be singled out from the
other countries in this group. Differences with respect to female employment
levels and the development of work-family policies can be found also in the
other clusters, for instance by comparing Poland with other Eastern Euro-
pean countries or by opposing Italy to Greece. We will discuss some of these
national specifities in the subsequent sections.
3 Empirical research design
3.1 Research questions and empirical strategy
In this work, we investigate the relationship between women’s work-family
profiles over the lifecourse and their subsequent health outcomes Our analysis
involves three steps:
(1) First, we identify different work-family profiles and describe their dis-
tribution as well as the characteristics of women associated with them. We
focus on women with children and distinguish between mothers with hardly
any paid work experience (homecentred mothers), mothers with limited work
experience (mothers with marginal employment), mothers who crafted their
work careers around their family obligations (mothers with intermittent ca-
reers) and mothers who pursued parallely family and career (full-career moth-
ers). Using longitudinal information on the lifetime careers of women in 13
European countries, we construct indicators for the number of years in paid
employment until the age of 50 as well as for the number of years with both
work and care responsibilities, identified through the presence of young chil-
dren (below the age of 10) in the household.
(2) In a second step, we investigate the selection of women with children
into different work-family profiles, conditional on circumstances in childhood
(‘initial conditions’) and on the situation at time of first childbirth (‘childbirth
situation’). The first set of circumstances comprises indicators for the socio-
economic status (SES) of parents, for living conditions, childhood health,
10

and cognitive abilities. To control for unobserved factors related to the time
and place in which respondents grew up, we include country- and cohort-
dummies in our analysis. The second set of circumstances refers to the time
when women made their first choices with respect to education, labour mar-
ket participation, partnership and child-bearing. It includes information on
the educational level attained by respondents, the age at birth of the first
child, as well as the labour market situation and the partnership situation at
that moment in time. We employ multinomial logit models using the work-
family profiles as dependent variable, and sequentially include information
on initial conditions and childbirth situation as explanatory variables in our
estimations to shed light on the mechanisms that influence the later lifecourse
of women.
(3) The final and most important step is to test whether women who
choose different combinations of work and family committment display sys-
tematic differences in health outcomes at later stages in life. We start with
a multivariate regression analysis to show whether observed differences in
health status between women with different work-family profiles persist after
accounting for compositional effects, such as differences in education and in-
come level. Specific attention is thereby given to indicators for the intensity
of dual committment to family and paid employment.
An identification of the effect of different work-family-combinations on
health is complicated by the potential correlation between the choice of a
specific work-family profile and the outcome of interest. We account for
the endogenous selection of women with different characteristics into work-
family profiles, by employing an econometric model that jointly estimates
two components: a reduced-form profile choice equation and an outcome
equation with endogenous profile categories.11 Following Frech and Damaske
(2012) we estimate this joint model to adjust for the non-random selection
11This multinomial treatment model and the corresponding STATA routine have beendeveloped by Deb and Trivedi (2006) and Deb and Trivedi (2006b). Examples for itsutilisation can be found in Shane and Trivedi (2012) and Frech and Damaske (2012). Thislast study is of particular interest, because the authors use this approach to investigatethe relationship between mothers’ work pathways and health.
11

of women into work-family profiles based on observed ‘initial conditions’ and
‘childbirth situation’. The second stage equation evaluates the relationship
between work-family profiles and health, adjusting for the unequal selec-
tion into profiles. The model allows for correlated unobserved heterogeneity
between its two components.12 The model specification is provided in the
Appendix (section A.1). Further information on the estimation procedure
can be found in Deb and Trivedi (2006) and Deb and Trivedi (2006b).
3.2 Data sources and sample characteristics
We combine data from the first three waves of the Survey of Health, Ageing
and Retirement in Europe (SHARE) for the empirical analysis.13 SHARE is a
multidisciplinary and cross-national panel database of micro-data on health,
socio-economic status and social and family relationships of individuals aged
50 or over.14 Eleven countries contributed to the 2004/5 SHARE baseline
study. Three more European countries joined the survey in the second wave
(2006/7). SHARELIFE, the third wave of the project, was conducted in 2008-
09 over the same population who took part in the two previous waves. This
time, the respondents were interviewed about their life history. Different
fields such as childhood health, education, job career, family life, housing,
etc. were surveyed. The data include information on initial conditions and
lifecourse. For their collection, a life grid or calendar was utilised to help
respondents recall major events of their work and family life.15
12This unobserved selection is handled by introducing latent factors. The values forthese latent factors are drawn using simulation and the model is estimated using maximumsimulated likelihood methods (Shane and Trivedi, 2012).
13We use data from the release 2.5 for waves 1 and 2 of SHARE, and release 1.0 forSHARELIFE.
14For more details on SHARE see the “First Results Books” by Borsch-Supan et al.(2005) and Borsch-Supan et al. (2008), as well as the “Methodology Books” by Borsch-Supan and Jurges (2005) and by Schroder (2011).
15This type of data may be problematic especially if the period of recall spans decades(e.g. Bound, Brown and Mathiowetz, 2001). Studies by Smith (2009) and Haas and Bishop(2010) have validated retrospective data from other studies, the Health and RetirementSurvey (HRS), the Panel Study of Income Dynamics (PSID) and the Wisconsin Longitu-dinal Study (WLS), with objective records for data. Their results are encouraging andpoint to the general validity of this data generation process. Ex post analysis checking
12

The longitudinal dataset comprises 25,678 individuals from 13 European
countries surveyed in SHARELIFE at least once in waves 1 and 2 respon-
dents, 14,391 (56%) of them are women. As a general rule, the target popu-
lation of individuals surveyed by SHARE is aged at least 50. A small part of
the sample consists, however, of younger individuals, because partners of the
target population were interviewed as well, irrespective of their age. Since we
are interested in the lifecourse of women who have already reached mature
age, we eliminate observations from respondents who were younger than 50
when surveyed by SHARELIFE. This leaves us with 14,030 observations.
As SHARE was designed to provide information representative of the Eu-
ropean population aged 50 and above, this full sample is useful to investigate
the work-family profiles of European women and their evolution over time.
The drawback is that it spans a large number of cohorts, comprising women
who reached adulthood before or during World War II. To create a more
homogenous sample that is conducive to explore the lifecourses of Europeans
in the post-war period, we additionally define a restricted sample of younger
women, aged between 50 and 65 years (working age) when first surveyed by
SHARE, in wave 1 or 2. This sub-sample consists of 8,089 women (com-
prising cohorts born between 1938 and 1957) and is our preferred analytical
sample, particularly for the multivariate analysis.
The present work focuses on Europe and aims to shed light on differences
across welfare state types, that differ with respect to the institutions and
policies that affect female fertility and labour market participation decisions.
We group the countries present in the SHARE data in clusters linked to wel-
fare characteristics discussed in section 2.2 and loosely associated with the
typology of Esping-Andersen. Our data do not contain countries associated
with the Anglo-Saxon welfare regime, which leaves us with four broad ge-
ographical areas: Nordic Europe (Sweden, Denmark), Continental Europe
(West Germany, the Netherlands, Belgium, France, Switzerland, Austria),
Southern Europe (Italy, Spain, Greece) and Eastern Europe (Poland, Czech
for internal consistency of SHARELIFE data, as well as comparisons of recall informationwith external cross-country historical information confirm the high data quality providedby SHARELIFE (Mazzonna and Havari, 2011; Lyberaki et al., 2013).
13

Republic, East Germany).16
Table 8 in the Appendix shows how respondents in the working-age sam-
ple are distributed by country and welfare groups, as well as descriptives for
selected variables. These descriptives reveal some substantial heterogeneity
within country groups. This applies particularly to the Eastern and Conti-
nental country groups. Women in the Netherlands, for instance, have worked
on average three years less than their counterparts in Belgium, France and
West Germany.17 French women are characterised by a comparatively high
fertility rate, whereas in both Switzerland and the Netherlands we observe
a part-time share and a number of job changes that are substantially higher
than in the other Continental countries. These differences reflect underlying
differences in the extent but also in the modality of combining family and
employment in these countries. We can find large differences also between
Poland, where women have much shorter worker careers and higher fertility
rates, and the other Eastern European countries. Variation is however more
substantial between groups than within groups.
3.3 Variables of interest
Categorisation of work-family profiles: To reduce the complexity rep-
resented by heterogeneous biographies, we draw a first distinction between
mothers and childless women. The more important and also more difficult
exercise is however to distinguish analytically between mothers with differ-
ent types of work-family profiles. We employ a methodology that combines
two approaches that are present in the literature. Lyberaki et al. (2013) em-
ploy a classification proposed by Hakim (2000), with a distinction between
“home-centred women”, i.e. those for whom family and children are the main
16The SHARE sample contains information on the part of Germany in which respondentslived before 1989. Given that the career of East German older women was affected by GDRinstitutions, for the purpose of examining family and employment patterns it makes senseto include Eastern Germany with the Czech Republic and Poland (Lyberaki et al., 2013).
17For a long time, the Netherlands used to have a low level of female employment, onlyin more recent decades the number of working women increased at a faster rate than inmost other Western countries (Van der Lippe and Van Dijk, 2002).
14

priorities throughout life; “work-centred women”, who are either childless or
mothers who have continued to work and to give much space to paid em-
ployment in their lifetime careers; and “adaptive women”, a diverse group
composed of women who combine work and family relying heavily on mater-
nal leave periods and part-time employment. As key indicator, the authors
use the years of work of each respondent until she reached the age of 50 -
regardless of current age.18 Second, we draw on an approach chosen by Frech
and Damaske (2012), with a stronger focus on the career choices made by
women in presence of children. The authors restrict their analysis to moth-
ers only and classify women’s work pathways into “working”, “intermittently
working”, or “not working”.
In our analysis, we combine elements from both the abovementioned ap-
proaches. First, we divide women in groups with different intensity of labour
market participation using the sum of years spent in paid employment until
the age of 50. This way, we differentiate between mothers who did not work,
those who worked for some years and those who worked throughout most of
their adulthood. As a second indicator we use the number of years with dual
committment in paid employment and child care as a share of all years with
young children in the household. Based on the two measures, visual data
inspection and sensitivity analysis, we distinguish the following categories of
women:
• home-centred mothers who have been active on the labour market for
one year or less;
• mothers with marginal employment biographies, who have been in paid
employment for at least two but no more than 19 years;
• mothers with at least 20 years of work experience, but (longer) spells
of economic inactivity during times in which their children were young
(intermittent employment);
18Using this indicator, the authors distinguish work-centred women (with more than 30years’ work), family-centred women (with no links to the labour market), and two typesof adaptive career women (those who have between 1 and 19 years and those who havebetween 20 and 29 years of work experience).
15
• and full-career mothers, with at least 20 years of work experience and
a high share of dual committment in work and care (defined as working
at least 90% of the time when one or more children in the household
were aged below 10 years).
Health outcome(s): SHARE contains rich information on respondents’
health status and provides a broad range of health measures, including self-
rated health status (SRH), self-reported diagnosed chronic conditions, func-
tional limitations, mental health as measured by two alternative depression
scales (CES-D and Euro-D) as well as physical measurements (hand grip
strength and walking speed). General self-rated health (SRH), which is
usually measured on a five-points scale, is probably the most widely used
health indicator in studies that are based on survey data. In fact, SRH has
proven to be a good measure of an individual’s health and a powerful pre-
dictor of individual mortality (see for instance Idler and Benyamini (1997)).
At the same time, there has been growing concern that the comparability
of self-reported measures across population groups and countries might be
problematic because of group-specific differences in health self-assessment
and country-specific differences in reporting. This is the case because re-
spondents might have different reference levels of health in mind when they
assess their own status and because response categories might have different
connotations across countries and cultures.19
To overcome these limitations, we choose as our main health measure a
computed health index that can be interpreted as a proxy for “true health”.
This “true health” index, scaled between 0 (near dead) and 100 (perfect
health) has been designed following a methodology proposed by Juerges
(2007). It accounts for a large number of (diagnosed) physical and mental
conditions as well as measurements such as grip strength and the body-mass
index. The index is computed using generalised ordered probit models and
19For a discussion of this issue see Juerges (2007). For instance, older respondents tendto have a “milder” view of their health, i.e. they tend to rate their health as better thanotherwise comparable younger respondents (van Doorslaer and Gerdtham, 2003; Juerges,2007). Dowd and Zajacova (2007) find evidence for differences in the relationship betweenSRH and objective health-risks across groups with different SES.
16

it accounts for country-specific differences in reporting style. Further details
on the computation are presented in the Appendix, section A.2.
In the context of our research, the health index has the specific advan-
tage to overcome the potential differences in reporting style of SRH across
countries. It therefore represents our main health outcome variable. To add
further insights and to check the robustness of our results, in most of our
analyses we use additional health indicators, measured at different points in
time (i.e. SHARE waves), namely SRH (expressed as binary variable with
value ‘1’ for less than ‘good’ health) and an indicator for depressive symptoms
based on the twelve items of the EURO-D scale.
Selection variables: For the selection equation of our multinomial treat-
ment model we need variables that are expected to select women into work-
family profiles, but have no direct association with health. Due to the perva-
sivity of health as both a determinant and an outcome of human behaviour,
the demands on such selection variables are high. Ideally, we would want to
observe exogenous factors that push otherwise very similar women randomly
into different work-trajectories. Given the available information, we include
as determinants of the work-family profile variables for age and partnership
status at childbirth as well as a dummy variable for partner loss (due to di-
vorce or death) when the first child was young. In addition, we include two
“macro” indicators, the generosity of maternity leave benefits and the avail-
ability of the contraceptive pill at first childbirth, as explanatory variables.20
These two indicators are exogenous to individual health and to respondents’
choices, but they have the limitation of offering only a small amount of vari-
ation. In light of these limitations, our estimates of the effect of different
work-family profiles on health outcomes have to be interpreted with some
caution.
Covariates: In our analysis, we include personal characteristics such as
age, years of education and marital status. With respect to employment,
we use information on the number of unemployment spells (of at least six
20These variables have been used by Brugiavini et al. (2013) to investigate the impactof maternity benefits on leave taking. We would like to thank the authors and particularlyElisabetta Trevisan for making these data available to us.
17

months), the number of jobs held by the respondents and on the distinction
between part-time and full-time employment. The set of initial conditions
includes an indicator for parental cultural capital and SES (the number of
books in the household)21 and two indicators for the housing quality – the
number of persons per room and an index constructed as sum score of five ac-
comodation amenities such as living in a house with central heating, running
water etc. – which can also be interpreted as proxies for SES. Furthermore,
it contains a dummy indicator for cognitive ability (coded to ‘1’ if the re-
spondent stated to be better or much better at school than other children in
language, maths or both) and a dummy variable set to ‘1’ if the respondent
did not grow up with both biological parents. All this information was asked
with reference to the time when the respondent was 10 years old.22 With
respect to early adulthood and the moment when women started a family,
we construct indicators of the age at (first) childbirth, the number of work
years before childbirth as well as a dummy set to ‘1’ if the woman had no
cohabiting partner when becoming a mother. Another dummy variable indi-
cates whether a woman lost her partner (due to death or separation) before
her first child turned 10 years old.
The individual work-family trajectory might have been influenced by health
problems that have arisen in adulthood and were not related to initial con-
ditions. For instance, women might have followed a intermittent or marginal
employment career because health problems interrupted their work careers.
SHARELIFE asked respondents to provide information on injuries that led to
disability as well as on all illness episodes that lasted for more than one year.
Those individuals who suffered from severe illness periods were additionally
asked if the health problem led to significant consequences, such as limiting
opportunities for paid work. We condense the information on injuries and
illnesses into a dummy variable that takes the value ‘1’ if the respondent had
either an illness that led to limitations for paid work or a disability resulting
21Although this variable is ordinal in scale, Brandt et al. (2012) have carried out a testfor linearity and shown that it can enter regression analysis as continuous variable. Thesame is true of the housing quality index described next.
22Similar variables and indicators have been used in other studies based on SHARE,such as Deindl (2013) and Havari and Peracchi (2011).
18

from an injury, before she turned 50.
We are particularly interested in understanding if the extent of dual com-
mittment in work and childcare has long-term repercussions on women’s
health. SHARE respondents were asked whether they experienced periods
of particular stress in their lives and, if so, to provide start and end year of
these periods. We use this information to prove whether stress periods have a
negative effect on health. Moreover, respondents were asked some questions
about the household division of tasks with respect to household chores and
childcare. We created a dummy indicator, that is coded ‘1’ if the responding
woman was mainly or solely responsible for both household and care, and ‘0’
that her partner shared this tasks at least in equal measure. Unfortunately
the relevant questions are not included in the main SHARE questionnaire,
but are part of a drop-off section that was not completed by all respondents.
Use of the indicator on household division of tasks therefore reduces sample
size substantially.23 Additional indicators that provide proxy information on
the amount of paid and unpaid work carried out by women are the number
of children and the share of part-time work on total employment years.
Figure 1 indicates that in Southern Europe there is a very strong presence
of women who have never been in paid employment. In our weighted sample,
which is representative of women aged 50 and above, we find that 30% of
mothers have never been in paid employment. This is in stark contrast
to the corresponding shares in the other country groups, where less than
7% (Eastern and Continental Europe) and 2% of women (Continental and
Southern Europe) have never entered the labour market. Even if we restrict
the sample to women who were part of the working age population when
entering SHARE for the first time, the share of economically inactive women
still totals 25% in Southern Europe (and at most 4% in the remaining country
groups, see Figure 7 in the Appendix).
The defining trait of Continental European countries lies in the compara-
23To check whether the response rate to this question was biased, we test for deviationsbetween responses and missings in terms of age, educational level, income, and associationwith work-family profile. We do not find any systematic difference between those whocompleted the drop-off section and those who did not.
19

tively high concentration of women with moderate levels of employment. The
employment profiles of Nordic and Eastern European women, where mothers
with long employment careers are the rule rather than the exception, display
greater similarities. As we can see from Figure 2, similar differences emerge
when we look at the share of time women spent in paid employment while
having young children at home. Continental Europe displays a bi-modal pat-
tern, with a comparatively high concentration of women with high and low
degrees of dual work-family committment. In Eastern and Nordic Europe,
the majority of mothers have been employed most of the time when their
children were young. In Southern Europe, not surprisingly, the picture is
exactly the opposite.
4 Results
4.1 Distribution and characteristics of work-family pro-
files
Our first battery of results gives an overview of the distribution of different
work-family combinations across country groups and cohorts, and provides
information on the characteristics of women associated with these profiles.
The following two figures show how European women – grouped by welfare
areas – allocated their time to paid employment up to the age of 50, and to
what extent they continued to work in the presence of young children in the
household.
Based on a classification in work-family profiles, Figures 3 and 4 present
information on the distribution of our two central indicators for numbers
of years worked and the share of years worked with young children in the
household. By definition, home-centred women are those who have no work
experience. Women with marginal employment have worked some years, in
most cases not when their child or children were young. Both women with
intermittent employment and those with steady employment have had at
least 20 years of work experience before reaching age 50. As can be seen in
20

the figures, the distribution of years worked is skewed further to the right
for women with steady employment. However, the main difference between
the two groups comes to the fore when we look at the second indicator: By
definition, full career mothers are those who have worked at least 90% of
the time when their child or children were young. Mothers with intermittent
employment shaped their career around familial committments, with longer
breaks from paid employment in concomitance with child-rearing.
As we would expect, there is a high correlation between welfare areas and
particular work-family profiles. Table 1 presents this information in a disag-
gregation by number of children.24 The distribution of work-family profiles
varies greatly by area and is fairly consistent across families of different size.
Not surprisingly, the share of women with long careers in paid employment
decreases with the number of children in all country groups. Changes in
the profile distribution according to the number of children vary however be-
tween welfare areas. In Southern and Continental Europe, women with more
than two children were much more likely to stay at home and less likely to
be continuously employed than those with only one or two children. Even
in Eastern Europe, the share of home-centred women increases substantially
with the number of children.
By contrast in the Scandinavian countries it is very uncommon to find
women who did never participate in the labour market, even when they
had more than three children. In Nordic Europe, the most substantial shift
across profiles that occurs as the number of children increases, is that between
women with intermittent and those with marginal employment. The share
of full-career mothers decreases with family size, but significantly less than
in the other European areas.25
24In our sample only 17% of mothers have more than 3 children, the number drops to13% if we look only at the sub-sample of younger women.
25It is interesting to note that – compared to differences in the extent of female labourforce participation and of work-family committment – differences in fertility patterns acrosscountry groups are less pronounced. The major difference lies in the share of womenwith four and more children, which is significantly lower in Northern Europe than in theother regions. The share of childless women is highest in Southern Europe, followed byContinental Europe, and lowest in Eastern and Nordic Europe.
21

Figure 1: Distribution of years worked, by welfare area
010
2030
010
2030
0 10 20 30 40 0 10 20 30 40
Nordic Eastern European
Continental Southern
Per
cent
yrs worked to age 50Graphs by welfare state typology
MothersDistribution of years worked to age 50
Note: Weighted. Full sample. The indicator shows the total number of years in paidemployment up to the age of 50.
Figure 2: Time worked in the presence of young children, by welfare area
.51
1.5
22.
5D
ensi
ty
0 .2 .4 .6 .8 1kernel = epanechnikov, bandwidth = 0.0732
Nordic
01
23
Den
sity
0 .2 .4 .6 .8 1kernel = epanechnikov, bandwidth = 0.0673
Eastern
0.5
11.
52
Den
sity
0 .2 .4 .6 .8 1kernel = epanechnikov, bandwidth = 0.0683
Continental
0.5
11.
52
2.5
Den
sity
0 .2 .4 .6 .8 1kernel = epanechnikov, bandwidth = 0.0749
Southern
MothersTime worked in presence of young children
Note: Weighted. Full sample. The indicator expresses the number of years in which awomen was in paid employment and had children aged below 10 in the household, as ashare of all years with young children in the household.
22

Within country groups, we find a very high degree of homogeneity in the
Nordic welfare states and more variation in the other groups. As we would
expect, France has a high share of mothers who pursued continuous employ-
ment (44%), whereas the Netherlands are characterised by a much higher
incidence of marginal employment than the remaining Continental countries.
Among Eastern European countries, Poland stands out with a comparatively
high share of homecentred mothers (6.5%) and of women with only marginal
employment careers (21.2%). In the Southern European group, Greece has
by far the highest share of homecentred mothers (40% against 22% and 23%
in Italy and Spain). In spite of this within-group heterogeneity, we find
that “outliers” within one group would still not fit well into one of the other
clusters, as intra-group differences are less pronounced than inter-group dif-
ferences. As a case in point, the share of full-career mothers in Poland still
lies ten percentage points higher than in France, and the shares of homecen-
tred women in Italy and Spain are higher by a multiple than those in any
Continental, Eastern or Northern European country.
When we plot the profile distribution along the birthyear cohorts available
in SHARE (Figure 5), we observe a similar combination of convergence and
dissimilarity: Younger cohorts display a pronounced tendency of stronger
labour market participation, across all welfare areas. The speed of change
as well as the prevalence of specific profiles do however vary substantially
between country groups. In the Scandinavian countries we observe a strong
and steady trend towards more full-career mothers and less women with
marginal employment careers. The Eastern Europan countries start with
higher levels of female labour force engagement, but experience less change
over time. A look at the development within groups (data not displayed
here) reveals that the distribution of work-family trajectories evolved rapidly
in East Germany (with a strong increase of full-career mothers) and Poland
(with a decline in the share of home-centred mothers), but remained virtually
23
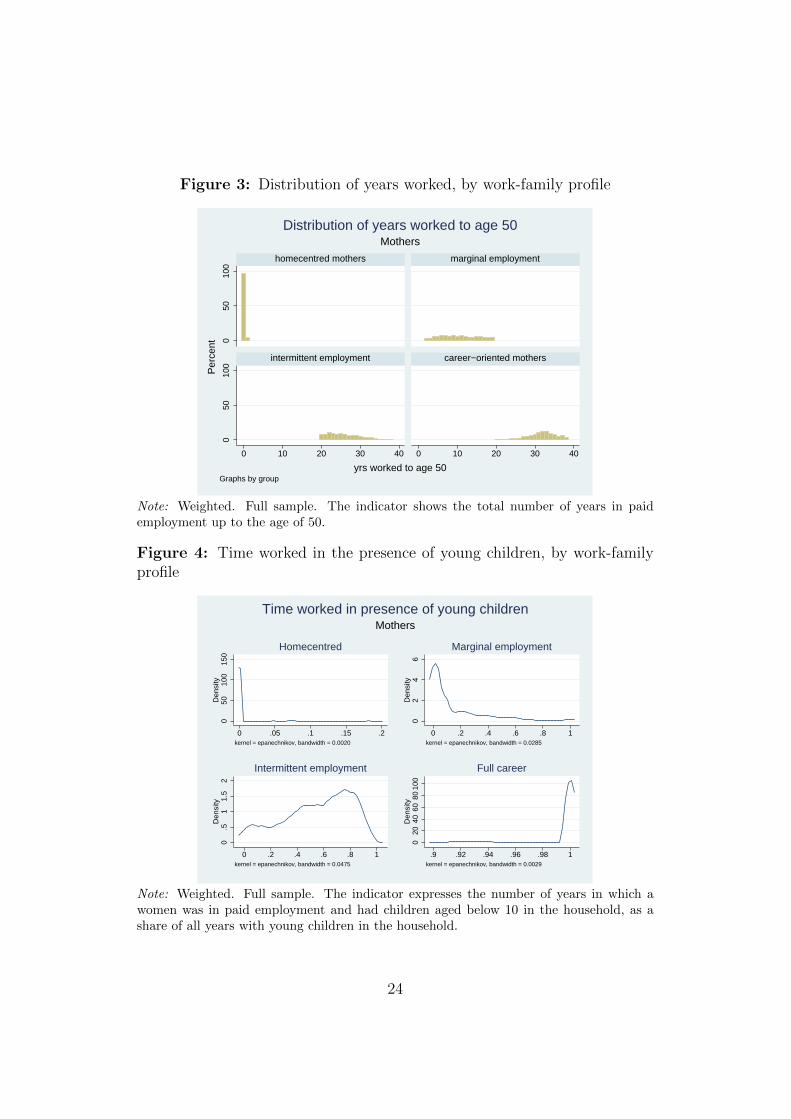
Figure 3: Distribution of years worked, by work-family profile
050
100
050
100
0 10 20 30 40 0 10 20 30 40
homecentred mothers marginal employment
intermittent employment career−oriented mothers
Per
cent
yrs worked to age 50Graphs by group
MothersDistribution of years worked to age 50
Note: Weighted. Full sample. The indicator shows the total number of years in paidemployment up to the age of 50.
Figure 4: Time worked in the presence of young children, by work-familyprofile
050
100
150
Den
sity
0 .05 .1 .15 .2kernel = epanechnikov, bandwidth = 0.0020
Homecentred
02
46
Den
sity
0 .2 .4 .6 .8 1kernel = epanechnikov, bandwidth = 0.0285
Marginal employment
0.5
11.
52
Den
sity
0 .2 .4 .6 .8 1kernel = epanechnikov, bandwidth = 0.0475
Intermittent employment
020
4060
8010
0D
ensi
ty
.9 .92 .94 .96 .98 1kernel = epanechnikov, bandwidth = 0.0029
Full career
MothersTime worked in presence of young children
Note: Weighted. Full sample. The indicator expresses the number of years in which awomen was in paid employment and had children aged below 10 in the household, as ashare of all years with young children in the household.
24

Table 1: Distribution of work-family profile, by welfare area and number ofchildren
Number of children Total1 2 3 >3
Nordic EuropeHome-centred 0.8 0.8 2.3 1.6 1.2Marginal employment 12.3 14.7 26.6 44.6 17.4Intermittent employment 31.3 35.4 28.1 22.6 32.6Career-oriented 55.6 49.1 43.0 31.2 48.8
100 100 100 100 100
Eastern Europehome-centred 2.9 3.3 11.9 10.8 5.5marginal employment 9.9 9.5 18.0 25.6 11.8intermittent employment 15.8 23.6 19.6 22.3 20.9career-oriented 71.4 63.6 50.5 41.4 61.8
100 100 100 100 100
Continental Europehome-centred 3.1 4.2 8.6 18.0 5.2marginal employment 26.3 35.6 45.7 52.0 36.2intermittent employment 26.4 25.5 22.8 16.8 25.0career-oriented 44.2 34.6 22.8 13.3 33.6
100 100 100 100 100
Southern Europehome-centred 23.3 29.6 37.5 37.1 30.6marginal employment 26.5 32.9 34.0 41.1 32.0intermittent employment 15.8 11.1 9.7 8.5 11.6career-oriented 34.4 26.5 18.8 13.3 25.8
100 100 100 100 100
Note: Weighted. Full sample.
25

Figure 5: Distribution of work-family profile, by birth cohort and welfarearea
0 20 40 60 80 100 0 20 40 60 80 100
born 1953-57
born before 1922
born 1953-57
born before 1922
born 1953-57
born before 1922
born 1953-57
born before 1922
Nordic Eastern European
Continental Southern
Childless women Home-centred mothersMarginal employment Intermittent employmentFull-career mothers
In %
Graphs by welfare state typology
Note: Weighted. Full sample.
unchanged in what is today the Czech Republic. In Southern Europe, we
observe only a mild increase in the number of full-career mothers, taking place
among the youngest cohorts which are present in the sample. The reduction
in the share of homecentred mothers is – on the contrary – pronounced, and
can be traced back mainly to developments in Spain and Italy.
Details on the employment trajectories of mothers with different work-
family profiles are presented in Table 10 and Table 11 in the Appendix. The
literature on female labour force participation stresses that the first child
birth is a decisive event for subsequent employment pattern and that cross-
national differences in total participation rates are mirrored in differences in
employment rates after the birth of the first child (Del Boca and Locatelli,
2006). Indeed, our clustering of family and employment patterns reflects sub-
stantial differences in participation behaviour following the birth of the first
child, both in terms of likelihood and length of work interruptions. Further
differences in the characteristics of women associated with different family
and employment profiles come to the fore in the descriptive statistics (mean
26

and coefficient of variation) collected in Tables 12, 13 and 14 in the Appendix.
For convenience, we provide tables only for the more homogeneous sample of
younger women (see average age across work-family profiles).
Home-centred mothers are on average older, less educated and live in
poorer housholds than those who have combined paid work and motherhood.
As we would expect, full-career mothers have on average the highest number
of years in paid employment (31.4 years). They are also more educated than
women associated with the other profiles, have a higher household income
and are more likely to live as single. Women with intermittent careers are
very similar to this group in terms of household income as well as age and
marital status. In spite of having worked on average less (26.2 years), they
did change job more often and experienced more unemployment spells. In
addition, they display the highest share of part-time work among all groups,
a further indication for the fact that these women have adapted their employ-
ment career to their familial needs. When we look at indicators related to
children and to household activities, we find larger differences between moth-
ers with no or limited employment histories on the one hand (home-centred
and marginal employment), and those with more intensive labour market
participation on the other hand (intermittent and full-career). Home-centred
mothers and those with only limited labour market experience have on aver-
age a larger number of children and were more likely to be – mainly or solely –
responsible for household chores and child care. home-centred mothers stand
out as those who are least likely to report retrospectively a stress period in
their lives (48%). Interestingly, the share of women who report stress periods
in concomitance to the time when their children were young does not vary
much between mothers with different degrees of employment intensity.
The descriptives on initial conditions (Table 14) suggest that full-career
mothers have enjoyed more favourable childhood conditions than their peers:
They lived in better accomodations, had parents with more cultural capi-
tal, enjoyed a better health status as children and were more likely to have
above-average cognitive skills. Childless women are those that show the
greatest similarity in terms of initial conditions (with the exception of child-
27

hood health) to those who combined family and steady employment. Of the
other groups, home-centred women can be singled out as those who had the
least favourable environment and starting conditions as children. This find-
ing is not driven by compositional effects due to the uneven distribution of
work-family profiles across countries: Descriptive statistics disaggregated by
welfare area display exactly the same patterns.26
4.2 Determinants of work-family profiles
The next set of results sheds light on the selection of women into different
work-family profiles. To provide evidence on the relevance of specific factors
in a multivariate setting, we estimate multinomial logit models, using full-
career mothers as the base group. The analysis is restricted to women with
children. In a first step, we include in our specification only variables related
to ‘initial conditions’. As we can see from the first, third and fifth columns
in Table 2, factors such as cultural capital of parental household, childhood
health and cognitive abilities at age 10 have some predictive power with re-
spect to the subsequent selection of women into different combinations of
family and employment profiles. This is particularly true for the distinction
between full-career mothers and those who had none or only comparatively
short careers in paid employment. In line with theoretical expectations, we
find that women who combine motherhood with steady employment come
from households with more cultural capital, were healthier and had higher
cognitive skills as children than women who remained at home or were only
marginally employed after starting a family. As indicated by the size of
coefficients, the difference between full-career mothers and those with inter-
mittent employment is less accentuated. In this case too, we observe that
high cognitive skills are associated with a stronger selection in steady em-
ployment, whereas poorer childhood health and housing conditions (which
can be interpreted as proxy for SES) increase the likelihood of selection into
26To save space, these tables are not displayed separately, but they are available fromthe authors upon request.
28

the intermittent employment profile.27
The second specification of our model (columns two, four and six) includes
a set of variables that capture the life circumstances of respondents at the
moment when they became mothers for the first time. At this stage of their
lives, a number of possible outcomes such as the educational level have been
realised. Consequently, the explanatory power of the model increases sub-
stantially. The additional variables on circumstances at first childbirth are
in part substitutive (and not purely complementary) to those on initial con-
ditions: For instance, there exists a positive correlation between SES and
cultural capital in parental home on the one side and respondents’ educa-
tional attainment on the other side. The variable on years of schooling is
therefore bound to capture some of the information previously embodied in
the indicators for housing quality and cultural capital.
The coefficients on age, partnership status and employment at birth of
first child as well as the indicator on years of schooling are all sizeable and
highly significant. They indicate that the moment in which women have
reached adulthood and start a family represents a crossroad with respect to
their future employment career. We observe that the likelihood of staying at
home, and also to have a career with only marginal or intermittent employ-
ment is significantly higher in cases where a woman was not employed before
giving birth to her first child. This finding holds after accounting for the re-
spondents’ educational level which, not surprisingly, is positively correlated
with a higher degree of labour market integration. Full-career mothers are
also more likely to have had their first child later in life than mothers with
marginal or intermittent employment (although not with respect to home-
centred mothers). Motherhood without a cohabiting partner (‘child out of
wedlock’) is also associated with mothers’ continouus employment. This in-
dicates that some women have pursued full-career profiles because they were
the only breadwinner in the household.28
27Tests with additional explanatory variables such as information on main breadwin-ner’s occupation (based on ISCO nomenclature and grouped to proxy SES) and on thegeographical setting (urban vs. rural) yield the same results.
28In fact, the share of lone mothers is higher among full-career women than in the other
29

Table
2:
Wor
k-f
amily
pro
file
det
erm
inan
ts
Mult
inom
ial
logi
tm
odel
,re
f.ca
tego
ry:
Full-c
aree
rm
other
sH
omec
entr
edM
argi
nal
Inte
rmit
tent
(1)
(2)
(1)
(2)
(1)
(2)
Bir
thye
ar-0
.065
***
-0.0
15-0
.047
***
-0.0
35**
*-0
.015
*-0
.006
Hou
sing
index
-0.0
470.
01-0
.044
0.00
5-0
.083
***
-0.0
43B
oth
par
ents
-0.0
38-0
.003
-0.0
65-0
.081
0.01
5-0
.019
Good
atsc
hool
-0.7
97**
*-0
.354
*-0
.463
***
-0.3
19**
*-0
.190
**-0
.072
Poor
childhood
hea
lth
0.41
3*0.
746*
*0.
534*
**0.
513*
**0.
300*
0.26
0*N
um
ber
childhood
illn
.-0
.07
-0.0
96-0
.037
-0.0
50.
020.
014
Num
ber
book
s-0
.223
***
-0.1
21-0
.089
**0
-0.0
340.
046
Yrs
school
ing
-0.1
48**
*-0
.097
***
-0.0
81**
*C
hild
out
ofw
edlo
ck-0
.941
**-0
.659
***
-0.3
97**
*A
gefirs
tbir
th0.
064*
**-0
.032
***
-0.0
52**
*W
orkin
gfirs
tbir
th-7
.403
***
-1.4
90**
*-1
.345
***
Con
stan
t12
5.00
6***
30.6
8991
.572
***
71.0
02**
*29
.096
*14
.699
Cou
ntr
ydum
mie
sY
esY
esY
esY
esY
esY
esC
ohor
tdum
mie
sY
esY
esY
esY
esY
esY
es
N70
0270
0270
0270
0270
0270
02R
-sq
0.14
50.
259
0.14
50.
259
0.14
50.
259
Log
Li
-771
8.1
-670
0.2
-771
8.1
-670
0.2
-771
8.1
-670
0.2
BIC
1596
7.5
1403
7.9
1596
7.5
1403
7.9
1596
7.5
1403
7.9
30

To sum up, our results confirm findings from previous research and ex-
ante expectations: Advantageous initial conditions, such as good childhood
health, above-average cognitive skills and favourable socio-economic back-
ground promote a lifecourse profile that combines motherhood with steady
employment. As the findings for our second set of indicators show, by the
time women have their first child, they have already laid the foundations
of their subsequent employment history. To test for the relevance of these
associations within welfare typologies, we carry out separate regressions by
country group. In a first step, we apply the first specification to the full sam-
ple of respondents (see Table 15 in the Appendix) and then we estimate the
full specification to our baseline sample (Table 16)29. The results confirm
the general picture that emerged from the sample with pooled data. None
of the welfare areas can be singled out with respect to the others. Due to
the reduced sample size, coefficients are in general less statistically significant
than for the full sample but – with a few exceptions – have the expected sign
and magnitude.
This suggests that personal characteristics and life-course circumstances
play a very similar role, irrespective of the welfare state regime in which a
person lives. As we can see, the explanatory power of our model for profile
selection based exclusively on initial conditions is rather low (Table 15). Not
surprisingly, indicators that refer to the situation at the moment of first
childbirth, such as attained educational level, age at childbirth, etc., are
stronger predictors of the subsequent work-family trajectory. Here too, we
find rather similar and homogeneous effects (in terms of coefficient size and
magnitude) across country groups (Table 16). In our view, this does however
not necessarily indicate that these characteristics and circumstances matter
more for the work-family profile choice than institutions and policies related
to the welfare state regime. Factors such as the women’s educational level
and their age and occupational situation at the moment of family formation
are in fact not exogenous, but co-determined by national institutions and
groups, see Table 13.29We omit home-centred mothers from this second step because of the small size of this
group in these areas
31

policies. Although individual characteristics and circumstances have similar
effects on the combination of family and employment across different country
groups, it is plausible to assume that institutions and policies influence the
incidence and distribution of these characteristics and circumstances in the
population.
4.3 Health outcomes
4.3.1 Work-family profiles and health status
This final part of our empirical section is dedicated to an exploration of
the connex between work-family profiles and subsequent health outcomes.
Table 3 shows that in a bivariate setting women associated with the full-
career profile are on average healthier than the other groups: They have
higher “true health” indexes, are less likely to rate their health as poor and
have lower scores on the depression scale.30 Childless women are those which
in terms of health status display the greatest resemblance with full-career
mothers (at least with respect to the “true health” index and SRH, not the
depression index), whereas home-centred mothers and those with marginal
employment careers have on average the lowest health status. As the previous
descriptives have shown, however, mothers with steady employment careers
tend to live in more affluent households, to be younger and to be better
educated than the other groups of women. This raises the question whether
the positive relationship between mothers’ employment intensity and their
health status is in fact capturing the well-documented correlations of health
with age, income and education.
In a next step, we test whether the observed bivariate associations between
lifecourse profiles up to the age of 50 and subsequent health outcomes are
robust to the inclusion of covariates. Table 4 presents an output overview
30Note that the classification into work-family profiles is based on retrospective infor-mation provided by respondents in SHARELIFE, i.e. wave 3. Table 3 includes healthindicators measured at different points in time (waves 1 to 3), but in all cases at a timewhen respondents had already reached age 50 and therefore completed the life period onwhich the profile typology is based.
32

from linear regressions for the same set of health indicators displayed in the
previous table. As after controlling for age, years of schooling, household
income and maritals status (as well as country dummies), we can still find a
systematic positive link between the intensity of labour market integration of
women with children and their subsequent health status.31 All coefficients for
marginal and intermittent employment indicate a negative deviation of these
groups from the health status of full-career mothers. With the exception of
indicators measured in wave 1 (for which less observations are available and
standard errors are large), all coefficients are highly significant. In contrast,
differences between home-centred women and full-career mothers in terms of
health disappear once we control for age and socio-economic status.
To improve our understanding of the characteristics associated with good
health at mature age, we estimate another battery of regressions, including
additional explanatory variables and paying particular attention to indica-
tors that describe the household situation and intensity of work and care
committments of respondents prior to age 50. Due to the inclusion of an
indicator for the intra-household division of tasks (a dummy variable that is
set to 1 for women who were mainly or solely responsible for both household
chores and childcare), our sample size is now considerably reduced.32
After inclusion of this expanded set of covariates, marginal and intermit-
tent employment continue to be associated with inferior health status when
compared to full-career mothers. The strength of this link – which is fairly
robust as long as we look at the sample with data pooled for all countries –
becomes more nuanced once we look at individual welfare types separately.
Tables 17 to 19 indicate that the positive association between the extent of
mothers’ employment and their health status is strongest in the Nordic and
Eastern countries, less robust in Continental Europe and hardly detectable
in Southern Europe. This indicates that in the Southern countries, where
31Coefficients on age, education and income (not displayed in the table for convenience)have the expected sign and are clearly statistically significant.
32The information on which this indicator is based was provided only by a part ofrespondents in a drop-off questionnaire, see section 3. For this reason, coefficient sizes andpost-estimation statistics can not be compared between Table 4 and Table 5.
33

full-career mothers represent a minority, observable characteristics such as
education and income are sufficient to explain the existing difference in health
status between groups.
The evidence on the link between intensity of household committments
and health is mixed. Some of the indicators suggest that – after controlling
for work-family profile – women who faced higher familial committments
(measured by the number of children and responsibility for chores and care)
display a poorer health status than their peers at later stages in life. The
evidence is however not clear-cut. The most robust findings concern the“true
health” indicator, where number of children and intensity of household activ-
ities show sizeable and statistically significant negative effects. It has to be
noted, however, that the negative relationship between the number of chil-
dren and health might be the result of long-term consequences of childbearing
on health.
The existence and duration of stress periods in respondents’ lives is as-
sociated with inferior health status, although the fact that stress periods
coincided with the presence of young children in the household does not
seem to represent an aggravating factor for health outcomes.33 Widowhood
and divorce are consistently associated with inferior health outcomes.
4.3.2 Accounting for selection
To sum up the evidence gathered so far, women who have combined fam-
ily and continuous employment (full-career mothers) display a better health
status in mature age than women with marginal or intermittent careers. It
is however not clear whether this positive association is the consequence of
a selection on (observed and unobserved characteristics) of healthier women
into full-career motherhood, or whether combining family and long, steady
careers in paid employment is by itself conducive to healthy ageing. The
33Quite to the opposite, results suggest that, once we control for the duration of stressperiods, the overlap of stress periods with childcare responsibilities tends to be linked witha positive effect on health. This could be explained by the fact that stress periods that goback to the time when respondents’ children were young belong to the more remote pastand are of less relevance for health than more recent stress periods.
34

Table
3:
Char
acte
rist
ics
ofw
omen
,by
wor
k-f
amily
pro
file
-O
utc
ome
indic
ator
s
Pro
file
Hea
lth
Hea
lth
Poor
Poor
Poor
Dep
ress
Dep
ress
index
index
SR
HSR
HSR
Hsc
ale
scal
ew
ave2
wav
e1w
ave
3w
ave
2w
ave
1w
ave
2w
ave
1
Childle
ssw
omen
mea
n87
.786
.30.
320.
270.
232.
52.
6cv
0.11
50.
125
1.45
01.
645
1.84
50.
916
0.88
7H
ome-
centr
edm
oth
mea
n86
.685
.70.
390.
340.
312.
52.
8cv
0.11
60.
125
1.26
11.
397
1.49
00.
978
0.89
3M
argi
nal
emplo
ym
mea
n86
.785
.20.
390.
340.
292.
72.
7cv
0.12
50.
137
1.25
51.
407
1.58
10.
852
0.83
3In
term
itte
nt
emp
mea
n86
.885
.80.
380.
320.
222.
52.
5cv
0.12
20.
130
1.28
91.
470
1.85
90.
883
0.86
4C
aree
r-or
iente
dm
ean
88.5
87.5
0.31
0.25
0.18
2.3
2.4
cv0.
109
0.11
91.
486
1.72
62.
113
0.90
90.
888
Tot
al mea
n87
.586
.20.
350.
290.
242.
52.
6cv
0.11
70.
128
1.36
11.
550
1.79
50.
899
0.87
1
Note
:Sam
ple
ofw
omen
inw
orkin
gag
eat
SH
AR
Ew
aves
1or
2.
Unw
eighte
d.
Hea
lth
ind
exis
scale
d0-1
00
(wh
ere
100=
per
fect
hea
lth
),SR
His
mea
sure
das
bin
ary
vari
able
(0=
good
,ve
rygood
or
exce
llen
th
ealt
h,
1=
1=
poor
or
fair
hea
lth),
an
dth
ed
epre
ssio
nsc
ale
issc
ale
d0-
12(w
her
eh
igh=
dep
ress
ed).
35

Tab
le4:
Hea
lth
outc
omes
,sp
ecifi
cati
on(1
)
Ref
eren
ceca
tego
ry:
Full-c
aree
rm
other
s
Hea
lth
Poor
SR
HP
oor
SR
HP
oor
SR
HD
epr.
scor
eD
epr.
scor
ein
dex
wav
e3w
ave2
wav
e1w
ave2
wav
e1
Hom
e-ce
ntr
ed-1
.755
0.11
9-0
.411
-0.8
06-0
.846
*-0
.648
-2.2
68-0
.508
-0.5
96-0
.778
-0.4
86-0
.546
Mar
ginal
-1.7
63**
*0.
290*
**0.
337*
**0.
261*
*0.
288*
**0.
145
-0.3
4-0
.077
-0.0
81-0
.108
-0.0
73-0
.092
Inte
rmit
tent
-1.7
10**
*0.
258*
**0.
317*
**0.
165
0.20
6***
0.11
5-0
.33
-0.0
74-0
.078
-0.1
15-0
.071
-0.0
93
Con
stan
t94
.650
***
0.88
9-0
.823
-0.8
43.
707*
**2.
967*
**-2
.602
-0.5
85-0
.608
-0.8
13-0
.56
-0.7
02
R-s
qr
0.08
30.
094
0.06
9B
IC42
978
7115
6576
3487
2493
614
559
N57
8757
7757
8333
7257
4033
54
Note
:*
p<
0.10
,**
p<
0.05
,**
*p<
0.01
.Sam
ple
of
wom
enin
work
ing
age
at
SH
AR
Ew
aves
1or
2.
Res
ult
sfo
rH
ealt
hin
dex
and
Dep
ress
ion
scor
ear
ebas
edon
OL
S,
thos
efo
rP
oor
Sel
f-ra
ted
Hea
lth
on
Logit
regre
ssio
ns.
Oth
erco
vari
ate
s:age,
years
of
schooling,
hou
sehol
din
com
ean
dco
untr
yd
um
mie
s.R
obu
stst
and
ard
erro
rs.
36

Tab
le5:
Hea
lth
outc
omes
,sp
ecifi
cati
on(2
)
Ref
eren
ceca
tego
ry:
Full-c
aree
rm
other
s
Hea
lth
Poor
SR
HP
oor
SR
HP
oor
SR
HD
epr.
scor
eD
epr.
scor
ein
dex
wav
e3w
ave2
wav
e1w
ave2
wav
e1
Hom
e-ce
ntr
ed-1
.639
0.33
8-0
.951
-0.2
82-0
.764
-0.2
38-3
.406
-0.8
31-1
.121
-1.1
54-0
.722
-0.9
27M
argi
nal
-1.2
48**
*0.
223*
*0.
289*
**0.
267*
0.16
0*0.
026
-0.4
4-0
.104
-0.1
07-0
.138
-0.0
93-0
.114
Inte
rmit
tent
-1.3
90**
*0.
215*
*0.
226*
*0.
120.
053
0.05
1-0
.426
-0.1
-0.1
05-0
.149
-0.0
9-0
.116
Poor
childhood
hea
lth
-4.6
33**
*1.
092*
**0.
725*
**0.
821*
**0.
563*
**0.
668*
**-0
.673
-0.1
31-0
.128
-0.1
65-0
.132
-0.1
57Sin
gle
1.29
2**
-0.0
6-0
.360
**0.
123
0.12
0.21
8-0
.623
-0.1
42-0
.142
-0.1
97-0
.128
-0.1
64D
ivor
ced/w
idow
ed-2
.105
***
0.25
2**
0.28
7**
-0.0
570.
331*
**0.
245*
-0.5
07-0
.126
-0.1
22-0
.17
-0.1
07-0
.132
Nr
childre
n-0
.423
***
0.03
60.
01-0
.075
0.01
0.03
1-0
.162
-0.0
38-0
.038
-0.0
52-0
.034
-0.0
43Str
ess
per
iods
-0.1
42**
*0.
029*
**0.
019*
*0.
030*
**0.
039*
**0.
035*
**-0
.033
-0.0
08-0
.008
-0.0
1-0
.007
-0.0
09P
art-
tim
esh
are
0.01
-0.0
010
-0.0
010
0.00
3**
-0.0
06-0
.001
-0.0
01-0
.002
-0.0
01-0
.001
Car
e&
chor
es-0
.712
**-0
.039
0.01
70.
104
0.32
5***
0.21
2**
-0.3
44-0
.081
-0.0
84-0
.115
-0.0
73-0
.092
R-s
qr
0.13
30.
138
0.19
4N
3410
3449
3446
2209
3428
3437
Note
:*
p<
0.10
,**
p<
0.05
,**
*p<
0.01
.Sam
ple
of
wom
enin
work
ing
age
at
SH
AR
Ew
aves
1or
2.
Res
ult
sfo
rH
ealt
hin
dex
and
Dep
ress
ion
scor
ear
ebas
edon
OL
S,
thos
efo
rP
oor
Sel
f-ra
ted
Hea
lth
on
Logit
regre
ssio
ns.
Oth
erco
vari
ate
s:age,
years
of
schooling,
hou
sehol
din
com
e,st
ress
per
iods
wit
hyo
ung
childre
n,
an
dco
untr
yd
um
mie
s.R
obu
stst
and
ard
erro
rs.
37

results presented in Table 6 are based on the estimation of a multinomial
treatment model with the aim to identify the effect of different lifecourse
profiles on health, after accounting for the unequal selection into lifecourse
trajectories.
The first part of the table shows the output for the selection equations,
with a focus on the identifying variables that were not included in the out-
come equation. As previously shown (see section 4.2), age and partnership
status at first birth are good predictors of subsequent lifecourse trajectories.
Their coefficients in the selection equations display the expected signs and
magnitudes. Information on partner loss (due to death or separation) when
the first child was young, which represents a more exogenous determinant of
lifecourse profile selection, is likewise very relevant for identification of the
selection process: As we would expect, partner loss leads to a strong drop in
the likelihood of mothers to stay at home, and a similar but smaller effect on
the probability to pursue only marginal employment. There is no such effect
in the selection between intermittent employment and full-career trajectories.
The indicator on disability, which identifies instances in which women suf-
fered from an illness or injury that led to a disability or limited their occu-
pational opportunities in other ways, is of partial relevance for the selection
process: we find that health problems or disabilities increased substantially
the probability to attain only marginal instead of continuous employment,
but the coefficients for the selection into home-centred and intermittent em-
ployment trajectories are not statistically significant. This indicates that
women with intermittent employment careers chose this path primarily for
familial reasons, whereas marginal employment careers could also be the
consequence of severe health problems that occurred in adulthood. The co-
efficients on the generosity of maternity benefits and on the availability of the
contraceptive pill (at first childbirth) are of less straightforward interpreta-
tion. Maternity benefits do not add to the explanatory power of the selection
equations, whereas the availability of the contraceptive pill is associated with
a positive effect on the selection into marginal employment and a negative
effect on intermittent employment (with respect to the base category, i.e. the
38

full-career profile).
The outcome equation shows a positive link between the full-career profile
and subsequent health, after accounting for selection. The effect is partic-
ularly strong in a comparison between full-career mothers and those who
had intermittent employment careers. Home-centred mothers do not differ
significantly in health from full-career mothers. The effect for mothers with
marginal employment careers is less pronounced than for those with inter-
mittent employment. As indicated by the latent factors (λ1 to λ3) displayed
in the bottom section of the table, there exists some correlated unobserved
heterogeneity between the two components of the model (selection and out-
come equation).34 The selection on unobservables, which concerns primarily
the marginal and intermittent employment profiles, is however of very limited
magnitude. For robustness, we estimate the same model without the ‘macro’
indicators on maternity benefits and contraceptive. This has the additional
advantage to increase sample size (because information on these indicators is
missing for Eastern European countries). Results for the outcome equation
(displayed in Table 20) confirm the positive effect of full-career trajectories
on health.
34The λ’s express factor loadings associated with the unobserved characteristics thatinfluence both work-family profile choice and health outcome.
39

Table 6: Multinomial treatment model: Joint estimation of work-familyprofiles and “true health” index.
Selection equation (Profile)Home-centred Marginal Intermittent
Poor childhood health 0.502 0.528*** 0.160Yrs schooling -0.158*** -0.092*** -0.084***Out of wedlock -0.792* -0.627*** -0.404**Age at first child -0.109*** -0.089*** -0.078***Lost partner young -1.688** -0.657*** -0.011Disability -0.062 -0.537** 0.197Benefit 0.111 -0.044 -0.008Contraceptive -0.070 0.406* -0.456**Country dummies yes yes yes
Outcome equation (Health index)
Treatment: Home-centred -0.009Treatment: Marginal -0.010*Treatment: Intermittent -0.015***
Poor childhood health -0.054***Yrs schooling 0.005***Single -0.014***Nr children -0.006***Stress periods -0.020***Disability -0.085***Country dummies Yes
λ1: Home-centred 0.001λ1: Marginal -0.002*λ1: Intermittent 0.004**
N 5147LogLi -24613.4BIC 50107.0
Note: * p<0.10, ** p<0.05, *** p<0.01. Reduced sample size because no information onbenefit level and contraceptive pill is available for the Eastern European countries. Furthercovariates in selection and outcome equations: age, good at school, housing index, num-ber of books, indicator for injury or illness with occupational repercussions. In outcomeequation only: household income.
40
5 Summary and discussion
In this paper, we identify different work-family profiles of European women in
their life trajectories up to the age of 50 and examine their possible link with
subsequent health outcomes. Based on two indicators - the number of years
in paid employment and the number of years with both engagement in paid
work and care for a child aged below 10 -, we distinguish between childless
women, mothers with hardly any paid work experience (home-centred moth-
ers), mothers with limited work experience (marginal employment), mothers
who crafted their work careers around their family obligations (intermittent
careers), and mothers who pursued simultaneously family and career (full-
career mothers). Home-centred mothers as well as those with marginal work
experience have, on average, more children, are less educated and live in
poorer households than those with more employment. Mothers with inter-
mittent employment profiles exhibit similarly high levels of education and
household income as full-career mothers, but are characterised by a higher
number of job changes and unemployment spells, as well as by a higher inci-
dence of part-time employment.
Clearly, the choice of work-family profile is not random. We find that
women with favourable initial conditions, such as high socio-economic sta-
tus of parental home, good childhood health conditions and high cognitive
skills, are more likely to reconcile care for their children with continuous em-
ployment over the life-course. We estimate multinomial treatment models
to account for this selection when analyzing the influence of the work-family
profile on subsequent health. Once we control for observable and unobserv-
able characteristics, the statistical difference in health status between full-
career mothers and home-centred mothers we observe in a bivariate setting
disappears. However, we find that women who combined motherhood with
continuous employment are healthier at mature age than those who were only
marginally or intermittently employed. The difference is most pronounced
when we compare full-career mothers with those who followed an intermit-
tent career-path. This finding is robust to the inclusion of a large number of
covariates and suggests that among all mothers who opt for participation in
41

the labour market a steady employment pattern favours health.
Our analysis covers 13 European countries. We find strong variation in the
distribution of work-family profiles across welfare state regimes. There is a
general tendency for younger cohorts of European women to combine care for
a dependent child with an increasing amount of labour market participation,
but the speed and form of change in work-family profiles is far from being
homogeneous across country groups. Whereas members of the Southern Eu-
ropen welfare regime (Italy, Spain, Greece) are characterised by a very strong
presence of women who have never been in paid employment, the majority
of women with and without children is continuously employed in the Nordic
(Sweden, Denmark) and Eastern European regime (Poland, Czech Republic,
East Germany). Even in the presence of more than three children, it is very
uncommon in Northern Europe to withdraw from the labour market. The
defining trait of Continental European welfare states (West Germany, the
Netherlands, Belgium, France, Switzerland, and Austria) lies in a compar-
atively high concentration of women with moderate levels of employment.
Among mothers, there is a considerable degree of polarization between a low
and a high level of engagement in employment.
The positive link between the extent of mothers’ employment up to age
50 and subsequent health seems to be strongest in the Nordic and Eastern
European countries. It is weaker in Continental Europe and insignificant
for Southern Europe. This result indicates that in Southern Europe, where
full-career mothers represent a minority, observable characteristics such as ed-
ucation and income are sufficient to explain the existing differences in health
between groups. In the rest of welfare regimes where employment of mothers
is much more common, health effects possibly depend on the opportunities to
reconcile family with paid work. We find the clearest evidence of a positive
nexus between mothers’ employment and health for exactly the Northern
European countries, in which work-family combination is facilitated most by
the institutional context.
Welfare policies and particularly work-family-reconciliation policies have
transformed substantially over the past two decades. More specifically, they
42

have been in a process of being redirected so as to adjust to the needs of
mothers and fathers who struggle with the complex task of combining family
and career (Bonoli and Natali, 2012; Matzke and Ostner, 2010). We have
witnessed the development of a “growing, even if still somewhat haphazard,
infrastructure of supports for women with family responsibilities” (Hegewisch
and Gornick, 2011). Such work-family supports include care-related leaves,
policies that increase the quality or prevalence of flexible work arrangements
and the creation of out-of-home childcare. In particular, we see an increase
in policies and incentives to strengthen take-up of leave periods by men and
to address the imbalanced gender division of care activities and household
tasks. These reforms have not affected (or affected only marginally) the
work-family trajectories of the women surveyed in our study. Our findings
can however represent useful benchmarks to investigate the career choices
and the well-being of younger generations.
Morevoer, in the aftermath of the global financial crisis of 2008, European
welfare states experience a “stress test”. Policy-makers face considerable in-
creases in fiscal deficits and public debt that prompt them to consider cuts
in welfare services (Hemerijck, 2012). Previous research has emphasised the
growth potential of child-centered social investment policies as well as their
importance for social mobility and social inclusion (Esping-Andersen, 2002).
Our findings may be taken as another argument in favour of continuous ef-
forts to expand policies in support of work-family reconciliation even in times
of tight budgets. They suggest that circumstances and choices at the time
of first birth largely predetermine consequent work trajectories. Hence, this
stage of life is crucial for public policy intervention.
We recognise as a limitation of our work the difficulty to fully account for
the endogeneity of the work-family profile and thus to properly identify health
effects. Additionally, we caution that our findings for women aged at least
50 in the first years of the new millennium cannot necessarily be generalised
to younger cohorts. Clearly, more research is needed in this field, also to de-
termine the role played by specific circumstances such as the intra-household
division of tasks and other determinants of family-work reconciliation or con-
43

flict. One possible extension of our work could be an assessment of the role of
working conditions as health determinants for the subsample of women who
worked most of the time during prime age. SHARE contains information that
could be exploited for such research. Furthermore, it would be interesting to
shift the focus of analysis from individual women to couples and to examine
possible spill-over effects between partners.
Acknowledgement: This paper uses data from SHARE wave 1 and 2 re-lease 2.5.0, as of May 24th 2011 and SHARELIFE release 1, as of November24th 2010. The SHARE data collection has been primarily funded by the Eu-ropean Commission through the 5th Framework Programme (project QLK6-CT-2001-00360 in the thematic programme Quality of Life), through the 6thFramework Programme (projects SHARE-I3, RII-CT-2006-062193, COM-PARE, CIT5- CT-2005-028857, and SHARELIFE, CIT4-CT-2006-028812)and through the 7th Framework Programme (SHARE-PREP, N◦ 211909,SHARE-LEAP, N◦ 227822 and SHARE M4, N◦ 261982). Additional fund-ing from the U.S. National Institute on Aging (U01 AG09740-13S2, P01AG005842, P01 AG08291, P30 AG12815, R21 AG025169, Y1-AG-4553-01,IAG BSR06-11 and OGHA 04-064) and the German Ministry of Educationand Research as well as from various national sources is gratefully acknowl-edged (see www.share-project.org for a full list of funding institutions).
References
Bambra, Clare (2004), ‘The worlds of welfare: illusory and gender blind?’,Social Policy and Society 3(3), 201–211.
Berninger, Ina (2009), ‘Welche familienpolitischen Massnahmen fordern dieArbeitsmarktpartizipation von Muttern?’, Kolner Zeitschrift fur Soziologieund Sozialpsychologie 61(3), 355–385.
Bettio, Francesca and Janneke Plantenga (2004), ‘Comparing care regimesin europe’, Feminist Economics 10(1), 85–113.
Bock-Schappelwein, Julia, Rainer Eppel and Ulrike Muhlberger (2009),‘Sozialpolitik als Produktivkraft’, Monatsberichte 82(11), 845–857.
44

Bonoli, Giuliano (2007), ‘Time matters postindustrialization, new socialrisks, and welfare state adaptation in advanced industrial democracies’,Comparative Political Studies 40(5), 495–520.
Bonoli, Giuliano and David Natali, eds (2012), The politics of the New Wel-fare state, 1. ed. edn, Oxford University Press, Oxford.
Brandt, Martina, Christian Deindl and Karsten Hank (2012), ‘Tracing theorigins of successful aging: the role of childhood conditions and socialinequality in explaining later life health’, Social Science & Medicine (1982)74(9), 1418–1425.
Brugiavini, Agar, Giacomo Pasini and Elisabetta Trevisan (2013), ‘The directimpact of maternity benefits on leave taking: Evidence from completefertility histories’, Advances in Life Course Research 18(1), 46–67.
Cipollone, Angela and Carlo D’ippoliti (2011), ‘Women’s employment: Join-ing explanations based on individual characteristics and on contextual fac-tors’, American Journal of Economics and Sociology 70(3), 756–783.
Crompton, Rosemary (ed.) (1999), Restructuring Gender Relations and Em-ployment: The Decline of the Male Breadwinner, Oxford University Press,New York.
Deb, Partha and Pravin K. Trivedi (2006), ‘Specification and simulated like-lihood estimation of a non-normal treatment-outcome model with selec-tion: application to health care utilization’, The Econometrics Journal9(2), 307–331.
Deb, Partha and Pravin K. Trivedi (2006b), ‘Maximum simulated likelihoodestimation of a negative binomial regression model with multinomial en-dogenous treatment’, Stata Journal 6(2), 246–255.
Deindl, Christian (2013), ‘The influence of living conditions in early life on lifesatisfaction in old age’, Advances in Life Course Research 18(1), 107–114.
Del Boca, Daniela and Marilena Locatelli (2006), The determinants of moth-erhood and work status: A survey, IZA Discussion Paper 2414, Institutefor the Study of Labor (IZA).
Del Boca, Daniela and Marilena Locatelli (2007), Motherhood and participa-tion, in D.Del Boca and M.Locatelli, eds, ‘Social policies, labour marketsand motherhood: a comparative analysis of European countries. Cam-bridge: Cambridge Univ. Press’, pp. 155–181.
45

Del Boca, Daniela, Silvia Pasqua and Chiara Pronzato (2009), ‘Motherhoodand market work decisions in institutional context: a european perspec-tive’, Oxford Economic Papers 61(Suppl.1).
Del Boca, Daniela, Silvia Pasqua, Chiara Pronzato and Cecile Wetzels (2008),An empirical analysis of the effects of social policies on fertility, labourmarket participation and hourly wages of european women, in D.Del Bocaand C.Wetzels, eds, ‘Social Policies, Labour Markets and Motherhood’,Cambridge University Press, pp. 271–303.
Dowd, Jennifer Beam and Anna Zajacova (2007), ‘Does the predictive powerof self-rated health for subsequent mortality risk vary by socioeconomicstatus in the US?’, International Journal of Epidemiology 36(6), 1214–1221.
Elman, Cheryl and Angela M. Orand (2004), ‘The race is to the swift: Socioe-conomic origins, adult education, and wage attainment’, American Journalof Sociology 110(1), 123–160.
Esping-Andersen, G(1990), The Three Worlds of Welfare Capitalism, Prince-ton University Press, Cambridge.
Esping-Andersen, G(1999), Social foundations of postindustrial economies,Oxford University Press, Oxford; New York.
Esping-Andersen, G(2002), Why We Need a New Welfare State, Oxford Uni-versity Press, Oxford.
Ferraro, Kenneth F. and Jessica A. Kelley-Moore (2003), ‘Cumulative disad-vantage and health: Long-term consequences of obesity?’, American Soci-ological Review 68(5), 707–729.
Ferrera, Maurizio (1996), ‘The ’Southern model’ of welfare in social europe’,Journal of European Social Policy 6(1), 17–37.
Frech, Adrianne and Sarah Damaske (2012), ‘The relationships betweenmothersa work pathways and physical and mental health’, Journal ofHealth and Social Behavior 53(4), 396–412.
Goldin, Claudia (2006), ‘The quiet revolution that transformed women’s em-ployment, education, and family’, American Economic Review 96(2), 1–21.
Gornick, Janet C. and Marcia K. Meyers (2004), Welfare regimes in relationto paid work and care, in J.Zollinger Giele and E.Holst, eds, ‘ChangingLife Patterns in Western Industrial Societies’, pp. 167–188.
46

Guo, Jing and Neil Gilbert (2007), ‘Welfare state regimes and family policy: alongitudinal analysis’, International Journal of Social Welfare 16(4), 307–313.
Haas, Steven A. and Nicholas J. Bishop (2010), ‘What do retrospective sub-jective reports of childhood health capture? evidence from the wisconsinlongitudinal study’, Research on Aging pp. 698–714.
Hakim, Catherine (2000), Work-Lifestyle Choices in the 21st Century : Pref-erence Theory: Preference Theory, Oxford University Press, Oxford.
Hamil-Luker, Jenifer and Angela M. O’rand (2007), ‘Gender differences inthe link between childhood socioeconomic conditions and heart attack riskin adulthood’, Demography 44(1), 137–158.
Havari, Enkelejda and Franco Peracchi (2011), Childhood circumstances andadult outcomes: Evidence from world war II, EIEF Working Papers Series1115, Einaudi Institute for Economic and Finance (EIEF).
Hayward, Mark D. and Bridget K. Gorman (2004), ‘The long arm of child-hood: The influence of early-life social conditions on menas mortality’,Demography 41(1), 87–107.
Hegewisch, Ariane and Janet Gornick (2011), ‘The impact of work-familypolicies on women’s employment: a review of research from OECD coun-tries’, Community, Work & Family 14(2), 119–138.
Hemerijck, Anton (2012), ‘Retrenchment, redistribution, capacitating welfareprovision, and institutional coherence after the eurozone’s austerityreflex’, Sociologica (1).
Idler, Ellen L. and Yael Benyamini (1997), ‘Self-rated health and mortality:A review of twenty-seven community studies’, Journal of Health and SocialBehavior 38(1), 21.
Janus, Alexander L. (2012), ‘The gap between mothersa WorkaFamily ori-entations and employment trajectories in 18 OECD countries’, EuropeanSociological Review .
Jaumotte, Florence (2003), ‘Labour force participation of women: Empiricalevidence on the role of policy and other determinants in OECD countries’,OECD Economic Studies pp. 51–108.
47

Juerges, Hendrik (2007), ‘True health vs response styles: exploring cross-country differences in self-reported health’, Health Economics 16(2), 163–178.
Kalmijn, Matthijs and Christiaan W. S. Monden (2012), ‘The division oflabor and depressive symptoms at the couple level effects of equity orspecialization?’, Journal of Social and Personal Relationships 29(3), 358–374.
Klumb, Petra L. and Thomas Lampert (2004), ‘Women, work, and well-being 1950-2000: a review and methodological critique’, Social Science &Medicine 58(6), 1007–1024.
Leibfried, Stephan (2000), Towards a european welfare state?, in C.Piersonand F. G.Castles, eds, ‘The Welfare State Reader’, Cambridge, pp. 190–206.
Leitner, Sigrid (2003), ‘Varieties of familialism: The caring function of thefamily in comparative perspective’, European Societies 5(4), 353–375.
Lyberaki, Antigone, Platon Tinios and George Papadoudis (2013), ‘Ret-rospective explanation of older women’s lifetime work involvement: In-dividual paths around social norms’, Advances in Life Course Research18(1), 26–45.
Matzke, Margitta and Ilona Ostner (2010), ‘Introduction: change andcontinuity in recent family policies’, Journal of European Social Policy20(5), 387–398.
Misra, Joya, Michelle J. Budig and Irene Boeckmann (2011), ‘Cross-nationalpatterns in individual and household employment and work hours by gen-der and parenthood’, Research in the Sociology of Work 22(1), 169–207.
Muffels, Ruud and Bauke Kemperman (2011), Does a better job match makewomen happier?, SOEP Papers on Multidisciplinary Panel Data Research361, DIW Berlin.
Naumann, Ingela K. (2005), ‘Child care and feminism in west germanyand sweden in the 1960s and 1970s’, Journal of European Social Policy15(1), 47–63.
O’rand, Angela M. and Jenifer Hamil-Luker (2005), ‘Processes of cumula-tive adversity : Childhood disadvantage and increased risk of heart attackacross the life course’, The Journals of gerontology. Series B, Psychologicalsciences and social sciences 60, 117–124.
48

Pascall, Gillian and Jane Lewis (2004), ‘Emerging gender regimes and policiesfor gender equality in a wider europe’, Journal of Social Policy 33(3), 373–394.
Pavalko, Eliza K. and Brad Smith (1999), ‘The rhythm of work: Healtheffects of women’s work dynamics’, Social Forces 77(3), 1141–1162.
Ross, Catherine E. and J. Mirowsky (1995), ‘Does employment affecthealth?’, Journal of health and social behavior 36(3), 230–243.
Roxburgh, Susan (2011), ‘Parental time pressures and depression among mar-ried dual-earner parents’, Journal of Family Issues .
Sainsbury, Diane (1999), Gender, policy regimes and politics, in D.Sainsbury,ed., ‘Gender and Welfare State Regimes’, Oxford University Press, pp. 245–276.
Schnittker, Jason (2007), ‘Working more and feeling better: Women’s health,employment, and family life, 1974-2004’, American Sociological Review72(2), 221–238.
Shane, Dan and Pravin Trivedi (2012), What drives differences in healthcare demand? the role of health insurance and selection bias, Health,Econometrics and Data Group (HEDG) Working Paper 12/09, Universityof York.
Smith, James P. (2009), Re-constructing childhood health histories, WorkingPaper 666, RAND Corporation Publications Department.
Stadelmann-Steffen, Isabelle (2008), ‘Women, labour, and public policy: Fe-male labour market integration in OECD countries. a comparative per-spective’, Journal of Social Policy 37(3), 383–408.
Steiber, Nadia and Barbara Haas (2009), ‘Ideals or compromises? the at-titudeabehaviour relationship in mothers’ employment’, Socio-EconomicReview 7(4), 639–668.
Sundstrom, Marianne and Frank P. Stafford (1992), ‘Female labour forceparticipation, fertility and public policy in sweden’, European Journal ofPopulation / Revue europenne de Demographie 8(3), 199–215.
Thevenon, Olivier (2011), ‘Family policies in OECD countries: A compara-tive analysis’, Population and Development Review 37(1), 57–87.
49

Tubeuf, Sandy, Florence Jusot and Damien Bricard (2012), ‘Mediating roleof education and lifestyles in the relationship between early-life condi-tions and health: evidence from the 1958 british cohort’, Health economics21(Suppl.1), 129–150.
Uunk, Wilfred, Matthijs Kalmijn and Ruud Muffels (2005), ‘The impact ofyoung children on womenas labour supply a reassessment of institutionaleffects in europe’, Acta Sociologica 48(1), 41–62.
Van der Lippe, Tanja and Liset Van Dijk (2002), ‘Comparative research onwomen’s employment’, Annual Review of Sociology pp. 221–241.
van Doorslaer, Eddy and Ulf G. Gerdtham (2003), ‘Does inequality in self-assessed health predict inequality in survival by income? Evidence fromSwedish data’, Social Science & Medicine 57(9), 1621–1629.
50

A Methodological notes
A.1 Specification of the multinomial treatment model
Each individual i chooses one treatment from a set of different choices j,
implying a multinomial choice model. Let lij be the latent factor that incor-
porates unobserved characteristics common to individual i ′s treatment choice
and outcome and dj be binary variables representing the observed treatment
choice. Then the probability of treatment can be represented as:
Pr(di, |zi, li) = g(z′α1 + δ1li1, z′α2 + δ2li2, ..., z
′αJ + δJ liJ) (1)
where g is an appropriate multinomial probability distribution and where
zi denotes exogenous covariates that are predictors of women’s work-family
profiles. The model first adjusts for the nonrandom selection of women into
profiles:
Pr(di, |zi, li) =exp(z′αj + δjlij)
1 + ΣJk=1exp(z
′αk + δjlik)(2)
This equation produces variables λ, which are added to the second-stage
regression to adjust for mothers likelihood to enter into different profiles
based on observed characteristics. A second stage equation evaluates the
relatioships between profiles and health. The expected outcome equation for
individual i is:
E(yi|di,xi, li) = x′iβ1 +J∑
j=1
γjdij +J∑
j=1
λj lij (3)
The health outcome is affected by unobserved characteristics that also
affect selection into treatment. When λj, the factor-loading parameter, is
positive (negative), treatment and outcome are positively (negatively) cor-
related through unobserved characteristics; i.e., there is positive (negative)
selection(Deb and Trivedi, 2006b).
51

A.2 Computation of the Health index
Juerges (2007) has investigated the reliability of SRH as a “true health” vari-
able in the SHARE dataset, and computed a health measure that is adjusted
for cross-cultural biases. The methodology of this computation is based on
a decomposition of differences in self-assessed health into parts that are ex-
plained by differences in“objective”health indicators and parts not explained
by such differences. We are interested in the explained part, which provides
synthetic information on individual health status while avoiding the possi-
ble biases due to reporting differences between countries, cultural areas and
socio-economic population groups.
Following Juerges (2007), we construct a 0 to 100 health index that de-
scribes as accurately as possible the whole spectrum of health states, from
“near death” to “perfect health”. Health states between near death and per-
fect health are given an index value between 0 and 100. The presence of
a condition reduces the health index by some given amount or percentage,
the so-called disability weight. The disability weight of each condition or
symptom is assumed to be the same for each respondent.
Disability weights are computed from within the sample by estimating gen-
eralised ordered probit regressions of self-reported health (SRH) on a set of
health variables. In SHARE waves 1 and 2 respondents were asked about the
presence of chronic conditions diagnosed by doctors (heart disease, choles-
terol, stroke, diabetes, lung disease, asthma, arthritis, osteoporosis, cancer,
cataracts and fractures) as well as symptoms such as pain, breathlessness and
sleeping problems. These informations, together with information on (medi-
cally treated) depressions and measures for grip strength, walking speed and
the BMI (derived from self-reported height and weight) are used as explana-
tory variables. In the generalised ordered probit model, thresholds are mod-
elled with country dummies to account for country-specific reporting styles.
While thresholds are allowed to vary across countries, disability weights are
constrained to be the same in each country.
The health index is computed as the linear prediction from the ordered
52

probit regression (the latent variable), normalised to 0 for the worst observed
health state and 100 for the best observed health state.
Figure 6: Distribution of Health index
0.0
1.0
2.0
3.0
4D
ensi
ty
0 20 40 60 80 100index
Note: Weighted. Sample restricted to women who were aged 50 to 65 when first surveyedby SHARE.
53

B Figures and Tables
54

Tab
le7:
Sam
ple
des
crip
tive
s(m
eans)
Age
Yea
rsSin
gle
Yea
rsN
um
ber
Shar
eN
um
ber
Age
at
Fre
quen
cy(w
ave3
)sc
hool
(wav
e3)
wor
kjo
bs
par
ttim
ech
ildre
n1s
tb
irth
N%
Sw
eden
61.6
11.8
34.3
27.3
4.0
22.7
2.0
25.
059
17.3
Den
mar
k59
.713.4
27.6
26.8
4.6
20.1
2.0
24.3
666
8.2
Cze
chia
59.7
12.2
37.1
31.0
3.2
2.7
2.0
24.4
627
7.8
Pol
and
58.7
10.2
36.7
23.9
2.2
2.7
2.5
22.9
598
7.4
Eas
tG
erm
any
60.
213
.836
.229
.73.
712
.12.
022
.514
71.
8F
ran
ce61.
010
.229
.822
.22.
614
.12.
224.
6739
9.1
Aust
ria
62.
710
.441
.222
.42.
414
.72.
123
.423
93.
0W
est
Ger
many
60.1
13.3
29.6
22.7
2.7
28.2
1.9
25.1
454
5.6
Net
her
lan
ds
61.
111
.530
.919
.43.
236
.82.
125
.174
29.
2Sw
itze
rlan
d59.9
11.
632
.421
.33.
935
.21.
925.
8396
4.9
Bel
gium
60.3
10.6
28.2
22.2
2.2
15.4
2.1
24.4
804
9.9
Sp
ain
61.3
7.7
26.3
14.4
1.4
8.0
2.5
24.
8469
5.8
Ital
y61
.27.9
25.1
17.0
1.5
10.7
2.0
24.7
764
9.4
Gre
ece
60.0
9.7
34.4
13.8
0.9
5.7
1.7
25.6
853
10.
6
Nor
dic
60.6
12.6
30.8
27.1
4.3
21.3
2.0
24.
61,
257
15.5
Eas
tern
Euro
pea
n59
.311
.436
.726
.62.
85.
22.3
23.
11,
372
17.0
Conti
nen
tal
60.7
11.3
30.3
22.1
2.7
20.9
2.1
24.8
3,3
7441.
7Sou
ther
n61.
08.
127
.215
.61.
49.
02.
124
.92,0
8625.
8
Tot
al
60.
510
.530
.721
.52.
515
.32.
124.
58,
089
100
Note
:W
eigh
ted
(wit
hex
cepti
onof
the
last
two
colu
mns,
that
show
sam
ple
com
posi
tion).
Sam
ple
rest
rict
edto
wom
enw
ho
wer
eage
50
to65
wh
enfirs
tsu
rvey
edby
SH
AR
E.
Val
ues
for
share
of
single
sand
part
-tim
esh
are
expre
ssed
inp
erce
nt,
the
oth
ers
inre
spec
tive
un
its.
55

Tab
le8:
Sam
ple
des
crip
tive
s(m
eans)
-par
tII
Hea
lth
Hea
lth
Hea
lth
Poor
Poor
Poor
Dep
ress
Dep
ress
Fre
qu
ency
index
ind
ex(W
1)in
dex
(W2)
SR
H(W
3)S
RH
(W2)
SR
H(W
1)sc
ore(
W2)
score
(W1)
N%
Sw
eden
88.2
88.6
86.2
32.7
24.4
10.
62.
02.2
591
7.3
Den
mark
88.
088.0
86.4
28.0
20.7
19.2
2.0
2.0
666
8.2
Cze
chia
85.4
85.4
.37
.231
.9.
2.1
.627
7.8
Pola
nd
83.
183.1
.59
.953
.4.
4.0
.59
87.4
East
Ger
many
88.2
88.3
86.1
47.6
26.2
29.9
2.2
2.1
147
1.8
Fra
nce
86.4
86.
385
.731
.225
.923.
63.
33.2
739
9.1
Aust
ria
87.1
87.3
85.7
40.1
26.4
23.2
2.0
2.2
239
3.0
Wes
tG
erm
any
88.5
88.6
86.5
36.2
30.9
31.7
2.3
2.4
454
5.6
Net
her
lan
ds
88.4
88.5
87.8
32.4
28.8
23.5
2.2
2.3
742
9.2
Sw
itze
rlan
d91
.491.
390
.618
.013
.313
.42.
12.2
396
4.9
Bel
giu
m87.7
87.8
85.7
29.5
24.0
21.2
2.7
2.7
804
9.9
Sp
ain
84.
484.5
81.9
53.8
44.8
39.5
3.3
3.5
469
5.8
Italy
86.
486.5
84.2
43.5
41.8
38.3
2.9
3.1
764
9.4
Gre
ece
89.
389
.387
.922
.116
.920.
71.9
2.4
853
10.6
Nord
ic88.
188.3
86.3
30.2
22.3
13.9
2.0
2.2
1,2
57
15.
5E
ast
ern
Euro
pea
n84.8
84.8
86.1
52.7
42.7
29.9
3.2
2.1
1,37
217
.0C
onti
nen
tal
87.4
87.4
86.2
32.5
27.0
25.4
2.8
2.7
3,3
7441.
7Sou
ther
n86
.386
.584
.142
.638
.135
.62.8
3.1
2,08
625
.8
Tota
l86.7
86.7
85.5
38.8
32.8
28.
22.
82.8
8,0
89100
.0
Note
:W
eigh
ted
(wit
hex
cepti
onof
the
last
two
colu
mns,
that
show
sam
ple
com
posi
tion).
Sam
ple
rest
rict
edto
wom
enw
ho
wer
eage
50
to65
when
firs
tsu
rvey
edby
SH
AR
E.
Hea
lth
index
expre
ssed
on
asc
ale
from
0to
100,
dep
ress
ion
score
on
asc
ale
from
0to
12
and
poor
SR
Has
per
centa
geof
resp
onden
tsw
ho
rate
dth
eir
hea
lth
only
“fa
ir”
or
“p
oor”
.
56

Figure 7: Distribution of years worked, by welfare area.0
1020
300
1020
30
0 10 20 30 40 0 10 20 30 40
Nordic Eastern European
Continental Southern
Per
cent
yrs worked to age 50Graphs by welfare state typology
MothersDistribution of years worked to age 50
Note: Weighted. Sample restricted to women who were age 50 to 65 when first surveyedby SHARE.
Figure 8: Time worked in presence of young children, by welfare area.
01
23
Den
sity
0 .2 .4 .6 .8 1kernel = epanechnikov, bandwidth = 0.0634
Nordic
01
23
4D
ensi
ty
0 .2 .4 .6 .8 1kernel = epanechnikov, bandwidth = 0.0490
Eastern
.51
1.5
2D
ensi
ty
0 .2 .4 .6 .8 1kernel = epanechnikov, bandwidth = 0.0749
Continental
0.5
11.
52
Den
sity
0 .2 .4 .6 .8 1kernel = epanechnikov, bandwidth = 0.0863
Southern
MothersTime worked in presence of young children
Note: Weighted. Sample restricted to women who were age 50 to 65 when first surveyedby SHARE.
57
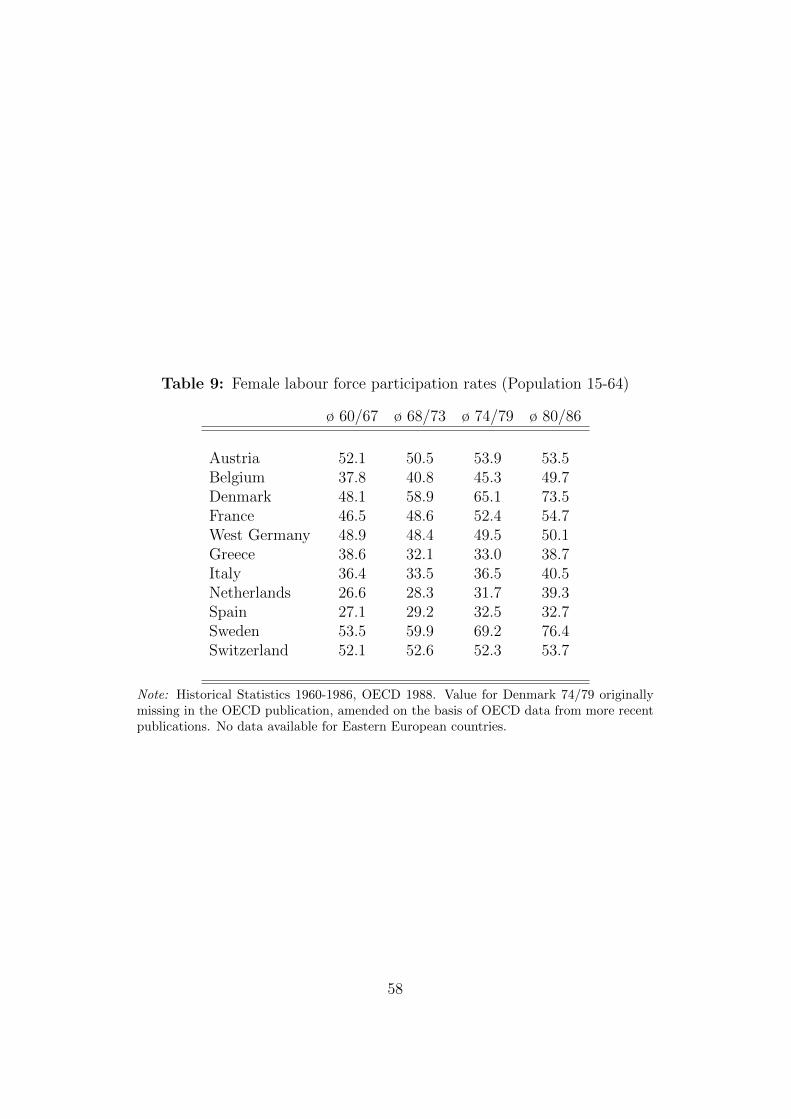
Table 9: Female labour force participation rates (Population 15-64)
ø 60/67 ø 68/73 ø 74/79 ø 80/86
Austria 52.1 50.5 53.9 53.5Belgium 37.8 40.8 45.3 49.7Denmark 48.1 58.9 65.1 73.5France 46.5 48.6 52.4 54.7West Germany 48.9 48.4 49.5 50.1Greece 38.6 32.1 33.0 38.7Italy 36.4 33.5 36.5 40.5Netherlands 26.6 28.3 31.7 39.3Spain 27.1 29.2 32.5 32.7Sweden 53.5 59.9 69.2 76.4Switzerland 52.1 52.6 52.3 53.7
Note: Historical Statistics 1960-1986, OECD 1988. Value for Denmark 74/79 originallymissing in the OECD publication, amended on the basis of OECD data from more recentpublications. No data available for Eastern European countries.
58

Table 10: Employment decision after birth of first child, by work-familyprofile
Interruption after birth of first child?Full sample
Stopped Not worked No inter- No work Totaltemporarily again ruption before child
Home-centred mothers 3.5 3.0 5.7 87.7 100Marginal employment 22.5 18.4 9.7 49.4 100Intermittent employment 53.2 5.0 12.7 29.0 100Full-career mothers 59.7 0.5 35.2 4.6 100
Total 39.6 7.2 18.9 34.4 100
Interruption after birth of first child?Age 50-65
Stopped Not worked No inter- No work Totaltemporarily again ruption before child
Home-centred mothers 4.0 2.7 4.7 88.6 100Marginal employment 25.2 20.5 11.0 43.3 100Intermittent employment 57.2 4.9 12.2 25.7 100Full-career mothers 62.9 0.6 32.5 4.0 100
Total 45.7 7.1 19.4 27.8 100
Note: Weighted. Full sample. Respondents were asked the following question: Did youtemporarily or permanently stop working when the child was born?
59

Table 11: Duration of leave after first child birth
Length of work interruption after birth of first childFull sample
1-3 mth 3 mth-1 yr 1-3 yrs >3 yrs Total
Marginal employment 15.7 22.1 9.4 52.8 100Intermittent employment 13.9 20.0 19.1 47.0 100Full-career mothers 32.8 43.5 16.0 7.6 100
Total 24.7 33.3 15.6 26.4 100
Length of work interruption after birth of first childAge 50-65
1-3 mth 3 mth-1 yr 1-3 yrs >3 yrs Total
Marginal employment 14.1 24.6 8.7 52.6 100Intermittent employment 12.8 20.2 19.7 47.3 100Full-career mothers 30.6 44.5 17.1 7.9 100
Total 23.1 34.6 16.5 25.7 100
Note: Sample consists of those women who said that they stopped to work temporarilyafter the birth of their first child. home-centred mothers are not displayed because of theirsmall number in this subsample.
60

Tab
le12:
Char
acte
rist
ics
ofw
omen
,by
wor
k-f
amily
pro
file
-Soci
o-ec
onom
icin
dic
ator
s
Pro
file
age
year
sH
Hm
arit
alye
ars
num
ber
num
ber
shar
e(w
ave3
)sc
hool
-in
com
est
atus
wor
ked
ofunem
pl
par
ttim
ein
g(l
og)
(1=
singl
e)to
age
50jo
bs
spel
lsw
ork
childle
ssw
omen
mea
n60
.311
.39.
910.
5023
.38
2.5
0.15
9.9
cv0.
082
0.36
80.
118
0.99
30.
498
0.91
52.
538
2.31
4hom
e-ce
ntr
edm
oth
mea
n61
.47.
89.
460.
210.
030.
10.
0327
.3cv
0.07
80.
489
0.12
71.
922
5.84
84.
226
6.00
41.
671
mar
ginal
emplo
ym
mea
n61
.29.
89.
910.
2010
.76
2.1
0.08
17.5
cv0.
078
0.41
00.
097
1.99
60.
456
0.68
23.
245
1.77
5in
term
itte
nt
emp
mea
n60
.610
.810
.05
0.27
26.2
03.
90.
2228
.4cv
0.08
10.
356
0.08
81.
647
0.15
00.
597
2.08
51.
191
care
er-o
rien
ted
mea
n59
.911
.810
.08
0.30
31.4
22.
80.
1512
.2cv
0.07
90.
311
0.09
01.
522
0.11
00.
746
2.64
52.
105
Tot
al mea
n60
.510
.79.
970.
2921
.83
2.6
0.14
17.0
cv0.
080
0.37
60.
099
1.58
30.
535
0.83
92.
700
1.74
8
Note
:Sam
ple
ofw
om
enin
work
ing
age
at
SH
AR
Ew
aves
1or
2.
Wei
ghte
d.
61

Tab
le13:
Char
acte
rist
ics
ofw
omen
,by
wor
k-f
amily
pro
file
-C
hild-r
elat
edin
dic
ator
s
Pro
file
num
ber
age
atch
ores
lost
lone
stre
ssst
ress
of1s
t&
care
par
tner
mot
her
per
iod
wit
hch
ild
childre
nbir
th(1
=al
one)
(1=
yes)
(1=
yes)
(1=
yes)
(1=
yes)
childle
ssw
omen
mea
n.
..
..
0.60
.cv
..
..
.0.
891
.hom
e-ce
ntr
edm
oth
mea
n2.
624
.20.
570.
020.
020.
480.
13cv
0.53
90.
186
0.87
17.
937
6.55
71.
167
2.64
5m
argi
nal
emplo
ym
mea
n2.
624
.30.
530.
050.
040.
630.
24cv
0.48
50.
173
0.94
04.
264
4.98
30.
865
1.77
4in
term
itte
nt
emp
mea
n2.
323
.80.
460.
090.
060.
690.
25cv
0.46
70.
192
1.09
23.
091
4.13
70.
754
1.80
3ca
reer
-ori
ente
dm
ean
2.1
25.2
0.36
0.08
0.06
0.65
0.27
cv0.
433
0.18
11.
330
3.28
23.
877
0.80
61.
799
Tot
al mea
n2.
124
.60.
450.
060.
050.
630.
22cv
0.62
20.
183
1.11
53.
835
4.33
30.
845
1.99
1
Note
:Sam
ple
ofw
om
enin
work
ing
age
at
SH
AR
Ew
aves
1or
2.
Wei
ghte
d.
62

Tab
le14:
Char
acte
rist
ics
ofw
omen
,by
wor
k-f
amily
pro
file
-In
itia
lco
ndit
ions
Pro
file
per
sons
hou
sing
bot
hp
oor
num
ber
num
ber
good
atp
erin
dex
par
ents
hea
lth
inch
ildhood
book
ssc
hool
room
(0-5
)(1
=no)
childhood
illn
esse
s(1
-5)
(1=
yes)
childle
ssw
omen
mea
n1.
772.
570.
070.
131.
062.
380.
53cv
0.75
30.
669
3.69
32.
558
0.67
80.
547
0.93
8hom
e-ce
ntr
edm
oth
mea
n2.
21.
40.
070.
070.
921.
520.
3cv
0.65
01.
053
3.61
63.
567
0.67
60.
569
1.60
3m
argi
nal
emplo
ym
mea
n1.
92.
10.
100.
111.
022.
000.
4cv
0.69
50.
812
3.02
32.
794
0.58
80.
574
1.18
6in
term
itte
nt
emp
mea
n1.
92.
40.
110.
101.
072.
150.
5cv
0.72
10.
729
2.79
43.
058
0.54
00.
537
0.97
2ca
reer
-ori
ente
dm
ean
1.8
2.5
0.10
0.07
1.05
2.34
0.6
cv0.
674
0.72
02.
922
3.70
90.
549
0.49
90.
882
Tot
al mea
n1.
92.
30.
100.
091.
042.
150.
5cv
0.69
60.
768
3.03
13.
145
0.58
30.
549
1.02
1
Note
:Sam
ple
ofw
om
enin
work
ing
age
at
SH
AR
Ew
aves
1or
2.
Wei
ghte
d.
63

Table 15: Determinants of work-family profile, by welfare state group. Spec-ification (1)
Multinomial logit, Ref. cat.: Full-career mothers
Nordic Eastern Continental Southern
Home-centredBirthyear -0.077** -0.058*** -0.086*** -0.016**Housing index -0.564** -0.15 -0.106* 0.009Both parents -0.277 0.07 -0.438* -0.272Good at school -0.758 -0.590* -0.558*** -0.766***Poor childhood health -0.226 -0.116 0.225 -0.073Nr books 0.045 -0.376* -0.04 -0.174*Constant 146.1** 109.2*** 166.1*** 31.4***
Marginal employmentBirthyear -0.089*** -0.009 -0.043*** 0.009Housing index -0.041 -0.214** -0.056* -0.04Both parents -0.117 0.632** -0.173 0.01Good at school -0.442** -0.616*** -0.313*** -0.305**Poor childhood health 0.561* 0.604* 0.395** 0.043Nr books -0.063 0.06 -0.033 -0.082Constant 172.2*** 14.1 166.1*** -16.7
Intermittent employmentBirthyear -0.028*** -0.004 -0.005 0.023**Housing index -0.047 -0.104* -0.081** -0.029Both parents -0.07 0.063 0.087 -0.105Good at school -0.171 -0.309** -0.143 0.021Poor childhood health 0.616** 0.334 0.368** -0.112Nr books -0.076 0.087 0.002 -0.183*Constant 54.3*** 7.5 9.7 -45.6
N 1883 2071 4951 3392Ps R-sqr 0.0673 0.0941 0.0614 0.0384LogLi -1890.3 -1907 -5820 -4275.9BIC 3961.6 4020.1 11946.2 8771.4
Note: * p<0.10, ** p<0.05, *** p<0.01. Full sample.
64

Table 16: Determinants of work-family profile, by welfare state group. Spec-ification (2)
Multinomial logit, Ref. cat.: Full-career mothers
Nordic Eastern Continental Southern
Home-centredBirthyear . . -0.084** 0.037Housing index . . -0.151 0.134Both parents . . -0.053 -0.13Good at school . . -0.168 -0.353Poor childhood health . . 1.083** -0.067Childhood illnesses . . 0.111 0.125Nr books . . 0.069 -0.242Yrs school . . -0.137*** -0.154***Out of wedlock . . -2.035** 0.182Age at first child . . 0.063 0.052*Work before first birth . . -7.479*** -7.717***Constant . . 164.6** -68.0
Marginal employmentBirthyear -0.067** 0.047 -0.059*** 0.008Housing index -0.017 -0.167 0.001 0.05Both parents 0.008 0.838** -0.22 -0.186Good at school -0.369 -0.645** -0.276** -0.267Poor childhood health 1.375*** 0.634 0.379* 0.08Childhood illnesses -0.09 -0.183 -0.064 0.137Nr books -0.058 0.025 0.028 0.016Yrs school -0.149*** -0.019 -0.096*** -0.112***Out of wedlock -0.917** -0.174 -0.428* -0.969*Age at first child -0.068* -0.01 -0.049*** -0.008Work before first birth -1.860*** -1.872*** -1.233*** -1.785***Constant 134.6** -91.4 119.2*** -12.8
Intermittent employmentBirthyear -0.057*** 0.027 -0.015 0.025Housing index -0.051 -0.139* -0.032 0.056Both parents -0.101 0.051 0.072 -0.357Good at school 0.024 -0.293 -0.078 0.114Poor childhood health 0.552 0.34 0.152 -0.054Childhood illnesses -0.114 -0.036 0.072 0.072Nr books 0.029 0.153 0.074 -0.173Yrs school -0.086** -0.077* -0.091*** -0.041Out of wedlock -0.175 -0.169 -0.355 -1.034Age at first child -0.129*** 0.032 -0.054*** -0.059**Work before first birth -0.703** -2.052*** -1.075*** -1.856***Constant 115.6*** -51.3 31.5 -46.4
N 1107 1234 2838 1780Ps R-sqr 0.107 0.139 0.144 0.282LogLi -925.3 -884.8 -2927.4 -1701.7BIC 2032.9 1969 6260.3 3717.7
Note: * p<0.10, ** p<0.05, *** p<0.01. Sample of women in working age at SHARE waves1 or 2. Category for home-centred mothers omitted for Northern and Eastern Europeancountries due to small number of observations.
65

Table 17: Health outcomes, results by welfare area
Reference category: Full-career mothersDependent variable: Health index
Nordic Eastern Continental Southern
Home-centred -0.178 -1.492 -1.63 -0.027-6.426 -1.842 -1.024 -0.68
Marginal employment -2.925*** -2.350** -1.052** -0.739-0.984 -1.092 -0.472 -0.636
Intermittent employment -1.768*** -2.350*** -1.063** -0.512-0.644 -0.774 -0.5 -0.813
R-sqr 0.12 0.122 0.106 0.147BIC 7450 9645 19058 11464N 1018 1260 2591 1562
Note: * p<0.10, ** p<0.05, *** p<0.01. Sample of women in working age at SHAREwaves 1 or 2. Other covariates: age, years of schooling, household income, poor childhoodhealth, marital status, lost partner, stress period, stress period with children, number ofchildren and country dummies.
66

Table 18: Health outcomes, results by welfare area
Reference category: Full-career mothersDependent variable: Poor SRH in wave 3
Nordic Eastern Continental Southern
Home-centred . 0.12 0.411* 0.03(.) -0.372 -0.236 -0.165
Marginal employment 0.908*** 0.402* 0.247** -0.08-0.238 -0.22 -0.115 -0.155
Intermittent employment 0.443*** 0.179 0.125 0.256-0.164 -0.152 -0.123 -0.193
BIC 1210 1706 3147 1971N 1031 1270 2625 1590
Note: * p<0.10, ** p<0.05, *** p<0.01. Sample of women in working age at SHAREwaves 1 or 2. Other covariates: age, years of schooling, household income, poor childhoodhealth, marital status, lost partner, stress period, stress period with children, number ofchildren and country dummies.
67

Table 19: Health outcomes, results by welfare area
Reference category: Full-career mothersDependent variable: EURO-D depression score
Nordic Eastern Continental Southern
Home-centred -2.253* 1.104*** 0.124 -0.013-1.269 -0.369 -0.225 -0.166
Marginal employment 0.588*** 0.538** 0.083 0.266*-0.195 -0.219 -0.103 -0.155
Intermittent employment 0.206 0.175 0.043 0.278-0.126 -0.155 -0.109 -0.200
BIC 1210 1706 3147 1971N 1031 1270 2625 1590
Note: * p<0.10, ** p<0.05, *** p<0.01. Sample of women in working age at SHAREwaves 1 or 2. Other covariates: age, years of schooling, household income, poor childhoodhealth, marital status, lost partner, stress period, stress period with children, number ofchildren and country dummies.
68
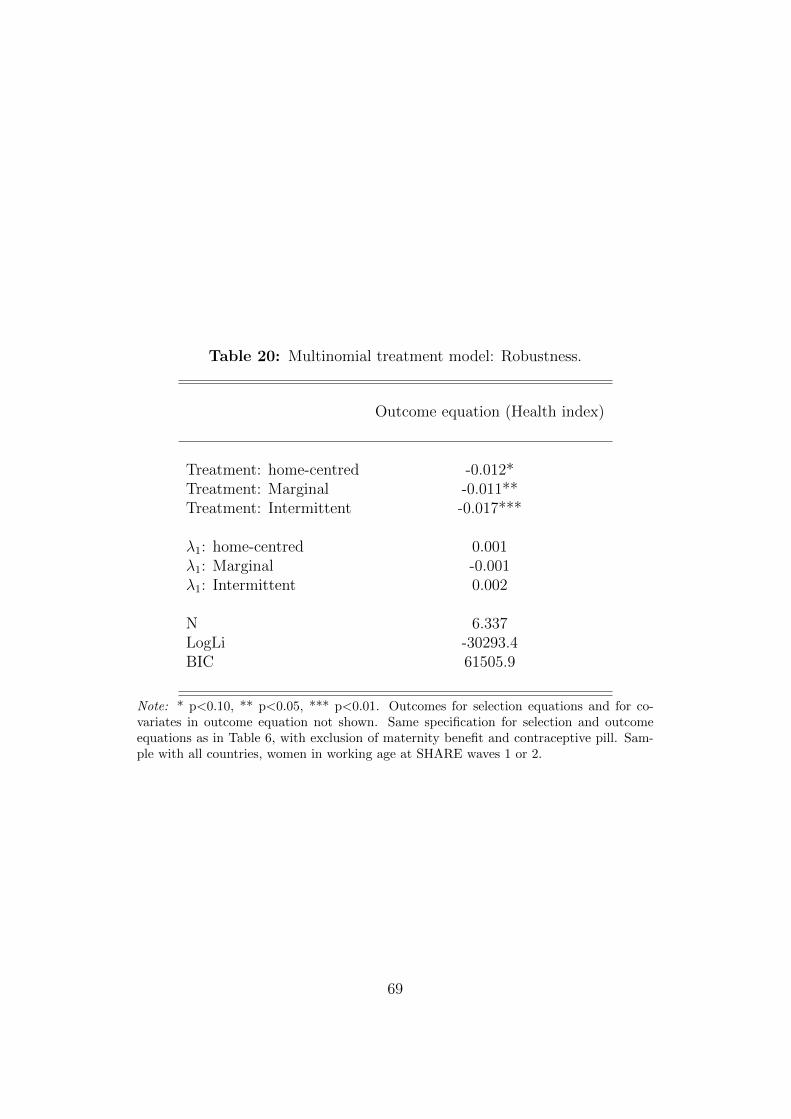
Table 20: Multinomial treatment model: Robustness.
Outcome equation (Health index)
Treatment: home-centred -0.012*Treatment: Marginal -0.011**Treatment: Intermittent -0.017***
λ1: home-centred 0.001λ1: Marginal -0.001λ1: Intermittent 0.002
N 6.337LogLi -30293.4BIC 61505.9
Note: * p<0.10, ** p<0.05, *** p<0.01. Outcomes for selection equations and for co-variates in outcome equation not shown. Same specification for selection and outcomeequations as in Table 6, with exclusion of maternity benefit and contraceptive pill. Sam-ple with all countries, women in working age at SHARE waves 1 or 2.
69

The research leading to these results has received funding from the European Community's Seventh Framework Programme FP7/2007-2013 under grant agreement n° 290647.

Project Information
Welfare, Wealth and Work for Europe
A European research consortium is working on the analytical foundations for a socio-ecological transition
Abstract
Europe needs a change: The financial crisis has exposed long neglected deficiencies in the present growth path, most visibly in unemployment and public debt. At the same time Europe has to cope with new challenges ranging from globalisation and demographic shifts to new technologies and ecological challenges. Under the title of Welfare, Wealth and Work for Europe – WWWforEurope – a European research consortium is laying the analytical foundations for a new development strategy that enables a socio-ecological transition to high levels of employment, social inclusion, gender equity and environmental sustainability. The four year research project within the 7th Framework Programme funded by the European Commission started in April 2012. The consortium brings together researchers from 33 scientific institutions in 12 European countries and is coordinated by the Austrian Institute of Economic Research (WIFO). Project coordinator is Karl Aiginger, director of WIFO.
For details on WWWforEurope see: www.foreurope.eu
Contact for information
Kristin Smeral
WWWforEurope – Project Management Office
WIFO – Austrian Institute of Economic Research
Arsenal, Objekt 20
1030 Vienna
T: +43 1 7982601 332
Domenico Rossetti di Valdalbero
DG Research and Innovation
European Commission

Partners
Austrian Institute of Economic Research WIFO Austria
Budapest Institute Budapest Institute Hungary
Nice Sophia Antipolis University UNS France
Ecologic Institute Ecologic Germany
University of Applied Sciences Jena EAH Jena Germany
Free University of Bozen/Bolzano FUB Italy
Institute for Financial and Regional Analyses GEFRA Germany
Goethe University Frankfurt GUF Germany
ICLEI - Local Governments for Sustainability ICLEI Germany
Institute of Economic Research Slovak Academy of Sciences IER SAVBA Slovakia
Kiel Institute for the World Economy IfW Germany
Institute for World Economics, RCERS, HAS KRTK MTA Hungary
KU Leuven KUL Belgium
Mendel University in Brno MUAF Czech Republic
Austrian Institute for Regional Studies and Spatial Planning OIR Austria
Policy Network policy network United Kingdom
Ratio Ratio Sweden
University of Surrey SURREY United Kingdom
Vienna University of Technology TU WIEN Austria
Universitat Autònoma de Barcelona UAB Spain
Humboldt-Universität zu Berlin UBER Germany
University of Economics in Bratislava UEB Slovakia
Hasselt University UHASSELT Belgium
Alpen-Adria-Universität Klagenfurt UNI-KLU Austria
University of Dundee UNIVDUN United Kingdom
Università Politecnica delle Marche UNIVPM Italy
University of Birmingham UOB United Kingdom
University of Pannonia UP Hungary
Utrecht University UU Netherlands
Vienna University of Economics and Business WU Austria
Centre for European Economic Research ZEW Germany
Coventry University COVUNI United Kingdom
Ivory Tower IVO Sweden


![Lifecourse Health Development: Past, Present and Future · Lifecourse Health Development: Past, Present and Future ... ness, injury, and infectious diseases [1–3]. As evidence subsequently](https://img.pdfslide.us/doc/110x75/5f0c6b3e7e708231d4354e4a/lifecourse-health-development-past-present-and-lifecourse-health-development.jpg)