Embed Size (px)
Citation preview
WP/16/118
Women’s Opportunities and Challenges in Sub-Saharan African Job Markets
by Christine Dieterich, Anni Huang, and Alun Thomas
2
© 2016 International Monetary Fund
African Department
Women’s Opportunities and Challenges in Sub-Saharan African Job Markets
Prepared by Christine Dieterich, Anni Huang, Alun Thomas
Authorized for distribution by Joël Toujas-Bernaté
June 2016
Abstract
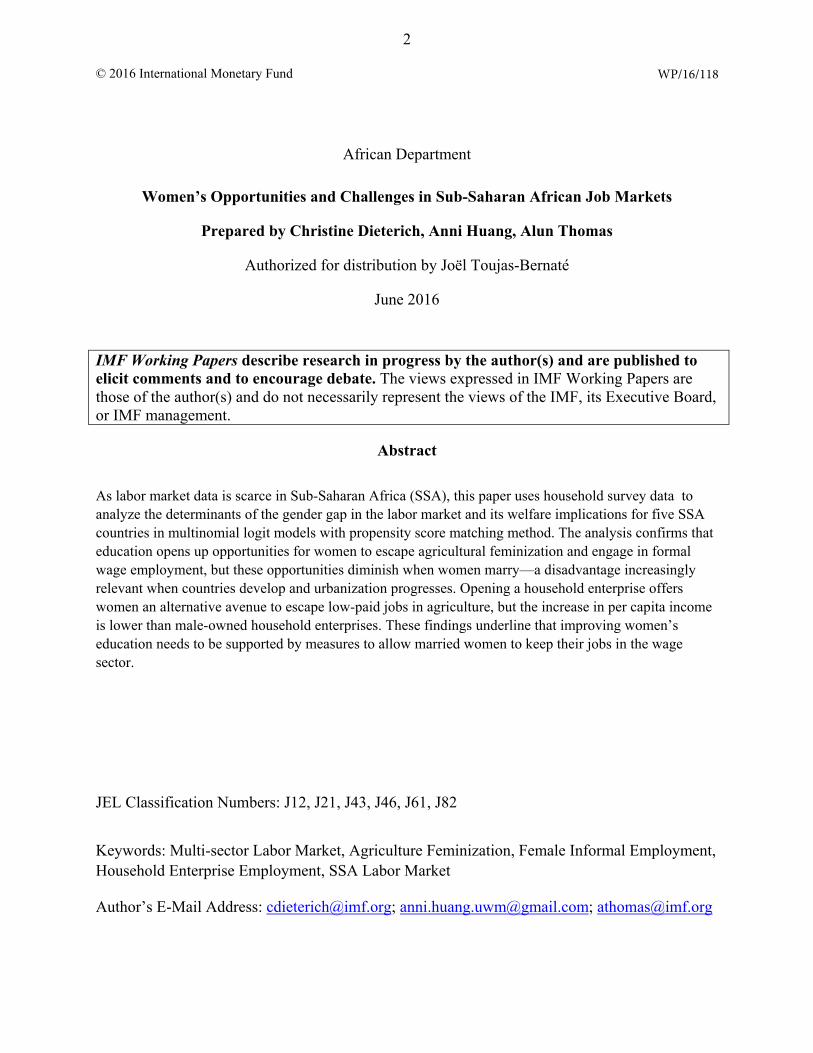
As labor market data is scarce in Sub-Saharan Africa (SSA), this paper uses household survey data to analyze the determinants of the gender gap in the labor market and its welfare implications for five SSA countries in multinomial logit models with propensity score matching method. The analysis confirms that education opens up opportunities for women to escape agricultural feminization and engage in formal wage employment, but these opportunities diminish when women marry—a disadvantage increasingly relevant when countries develop and urbanization progresses. Opening a household enterprise offers women an alternative avenue to escape low-paid jobs in agriculture, but the increase in per capita income is lower than male-owned household enterprises. These findings underline that improving women’s education needs to be supported by measures to allow married women to keep their jobs in the wage sector.
JEL Classification Numbers: J12, J21, J43, J46, J61, J82
Keywords: Multi-sector Labor Market, Agriculture Feminization, Female Informal Employment, Household Enterprise Employment, SSA Labor Market
Author’s E-Mail Address: [email protected]; [email protected]; [email protected]
IMF Working Papers describe research in progress by the author(s) and are published to elicit comments and to encourage debate. The views expressed in IMF Working Papers are those of the author(s) and do not necessarily represent the views of the IMF, its Executive Board, or IMF management.
WP/16/118
3
Contents
ABSTRACT ...............................................................................................................................2
I. INTRODUCTION ..................................................................................................................4
II. LITERATURE REVIEW ......................................................................................................5
III. LOW/LOWER MIDDLE INCOME COUNTRIES AGRICULTURE FEMINIZATION AND FEMALE INFORMAL EMPLOYMENT .......................................................................7
A. Education Determines Employment .........................................................................7 B. Women’s Marriage Cancels out Education Effect ..................................................10 C. Urbanization and Job Opportunity ..........................................................................11 D. Regression Analysis and Welfare Implication ........................................................14
IV. UPPER MIDDLE INCOME COUNTRIES: LOW FEMALE LABOR PARTICIPATION RATE AND HIGH FEMALE UNEMPLOYMENT RATE ...................................................21
V. POLICY IMPLICATIONS .................................................................................................25
REFERENCES ........................................................................................................................27 FIGURES Figure 1. Employment Sectors, by Gender ...............................................................................8 Figure 2. Employment Sectors and Education, by Gender ........................................................9 Figure 3. Employment Sectors and Marital Status, by Gender ................................................12 Figure 4. The Percentage of Wage Employment among the Married and Single Population .13 Figure 5. Employment Sectors and Urban/Rural Division, by Gender ...................................14 Figure 6. Employment Sectors and Migration, by Gender ......................................................15 Figure 7. Mauritius: Labor Market Structure, by Gender ........................................................21 Figure 8. Mauritius: Access to Education among the Working Age Population, by Gender ..22 Figure 9. Mauritius: Employment Sectors and Education, Male .............................................22 Figure 10. Mauritius: Employment Sectors and Education, Female .......................................23 Figure 11. Mauritius: Economic Activity and Marital Status, by Gender ..............................23 Figure 12. Reasons Not to Work, by Gender ...........................................................................24 Figure 13. Effort in Job Searching Among the Unemployed, by Gender ................................24 Figure 14. Mauritius: The Main Reason Why Leave Last Job, by Gender .............................25 TABLES Table 1. Multinomial Logit Model: The Determinants of Employment Sectors .....................18 Table 2. Multinomial Logit Model: The Determinants of Employment Sectors (Lower ........19 Table 3. Welfare Analysis: Average Treatment Effect of Pairwise Employment Sector Outcome Comparison Using Propensity Score Matching Method .........................................................20
4
I. INTRODUCTION
While unprecedented growth over the last decade improved economic opportunities in Sub-Saharan African (SSA) countries, women seem to find it difficult to benefit from this trend equally as their male counterparts. In this paper, five SSA countries are selected, representing various levels of development in this region, to study gender inequality in labor markets.
Gender inequality in SSA labor markets appears in various forms, depending on a country’s development level. Labor force participation of women and men is very similar in low and lower-middle income countries, reflecting the need for women to work to support themselves and their families. In these circumstances, gender inequality mainly materializes in unequal access to wage employment, which becomes more prominent as the share of wage employment rises when countries advance to lower-middle income status. Here are the main features of the employment structure:
Agricultural feminization is prevalent among SSA low income countries. Most of the residents in low income countries still live in rural areas and agriculture hires more than half of the labor force. While the share of female employment in agriculture exceeds the share of male employment, lack of land ownership, credit, and other production inputs often limits women’s productivity and leaves them in extreme poverty. (Croppenstedt et al., 2013)
In lower-middle income countries, more and more residents move out of agriculture to the household enterprise and wage sectors. Females, especially married females, find it difficult to enter and maintain a job in the growing formal wage sector and are mainly employed in household enterprises, which are usually informal. However, constraints in access to credit and other inputs hampers females taking charge of household enterprises, resulting in a lack of economies of scale and lower profitability compared to their male counterparts (Fox and Sohnesen, 2012; Fox et al., 2013).
Once countries hit the upper-middle income level, the gender gap starts to show in diverging labor force participation rates for men and women and unequal access to different labor market sectors
This paper studies gender inequality in multi-sector labor markets in five Sub-Saharan African countries selected on the basis of availability of household survey data. As most SSA countries have no reliable labor market data, household surveys are the only source to analyze employment patterns. The sample consists of Burkina Faso and Rwanda (low income countries), Zambia and Ghana (lower-middle income countries), and Mauritius as the upper-middle income country. For low/ lower-middle income countries, we focus on the determinants of the employment sector structure, because with high labor force participation and low unemployment in these countries for men and women, the employment sector determines the gender gap. We categorize workers based on their primary jobs and sort them into the agriculture
5
sector, the household enterprise sector, and wage sector.1 We assess the welfare effect of employment sector outcomes based on household consumption per capita.
The empirical results suggest that education, marital status, and urbanization shape the gender-split employment sector structure. As expected, the level of education determines, at the aggregate level, the sector of employment. However, more detailed analysis reveals that while the effect of higher education on access to wage employment is broadly similar for single men and women in low and low-middle income countries, the access becomes highly unequal once women marry. As a rising share of the wage sector is one of the features of advancing development and urbanization, this obstacle to wage employment causes a deepening of the gender gap in the labor market as countries become richer
The welfare analysis indicates that the welfare effect associated with household enterprise employment and wage employment are not significantly different, in terms of consumption per capita. Agricultural employment, however, leads to a significantly lower consumption level compared to household enterprise employment. Nevertheless, women gain less than men by moving from the agriculture sector to the household enterprise sector, probably due to the fact that female household enterprise workers are less productive than the male counterparts, reflecting constraints in access to land, capital, and other inputs.
Using very granular household survey data, this paper contributes to the literature by providing new insights on the gender gap, evidenced in the employment sector structure. The focus on the employment sector structure differs from most previous gender studies that analyze labor force participation and employment rates which are not particularly relevant for low and lower-middle income countries according to our findings. Moreover, by our knowledge, this is the first paper which models gender-split employment sector structure in the literature. Additionally, we added the impact of marriage/family responsibility and urbanization to the employment sector outcomes and show that they make a significant difference. Our findings in welfare analysis use the propensity score matching method and confirm Fox and Sohnesen’s finding (2012) that household enterprise employment does not have significantly different welfare implication compared to wage employment in SSA. Moreover, we find that by moving out of agriculture sector, household welfare, in terms of consumption, improves significantly.
II. LITERATURE REVIEW
In low income countries, females often seem to be left behind in the transition towards modern employment, leading to agricultural feminization. Feminization of poverty partially can be explained by agricultural feminization. Although the agricultural sector’s share in employment shrinks during urbanization, the relative proportion of women working in agriculture increases (Lastarria, 2008). Female farmers normally work on small-size plots and are less productive in terms of output per unit of land, regardless of whether we are considering
1 For the precise definitions of these employment sectors, see Fox and Sohnesen (2012). In this paper, we follow exactly the same categorization.
6
the within-household variations or between household variations.2 It suggests that lack of agriculture production inputs, such as, land ownership, fertilizer, and credit etc., explains the gender productivity gap. (Croppenstendt et al., 2013)
In lower-middle income countries, rising female informal employment, defined as female household enterprise employment in our paper, is commonly observed. Filmer and Fox (2014) predict that the household enterprise sector will create the largest number of job opportunities in the coming decade. Even when assuming that the modern wage sector is growing rapidly, it starts at such a low base that it is not capable of providing enough jobs for the fast growing population. Poorly educated, female, and rural workers have little prospect to attain formal wage jobs. (McCaig and Pavcnik, 2015) Therefore, closing the gender productivity differential within the household enterprise sector is essential to reduce gender poverty in SSA countries. (Fox and Sohnesen, 2012; Fox et al., 2013) Similarly, lack of property rights, social connection, and other production inputs explain the gender productivity gap in the household enterprise sector. 3
Despite the common negative perception of informal employment, the welfare effect of household enterprise employment, measured as consumption per capita within the household, is not significantly lower than wage sector employment (Fox and Sohnesen (2012)). This finding underlines that given current constraints women face in the wage sector, household enterprises offer an important potential to increase household’s welfare. This also suggests that governments in SSA countries should provide policy support in household enterprise employment. However, as further discussed in the welfare analysis section, Fox and Sohnesen’s welfare estimations cannot well control for self-selection bias in employment sector outcomes.
Based on the existing literature, our paper deepens the understanding why females are left behind in wage employment opportunities. Using household survey data, this paper applies a multinomial logit model to study the employment sector structure according to gender and explains the root causes of gender employment differences in SSA multi-sector labor markets. This approach goes far beyond the traditional approach of assessing the gender gap in labor markets by comparing labor force participation and unemployment, which is more suitable for more advanced economies. By adding variables like marital status and urbanization measures, the paper provides a richer understanding of the determinants of the labor market outcomes. This offers important insights for policy makers how to translate past successes in improving girls’
2 Literatures in this field use both between-household variations and within-household variations to test whether female farmers are less productive than the male counterparts. Between-household variations compare productivity between male- and female-headed households. See Tiruneh et al. (2001), Horrell and Krishman (2007) and Masterson (2007). Within-household variations compare productivity between husband and wife within each household, taking advantage of the feature that husband and wife farm separated plots within the same household in West African countries. See Udry et al. (1995), Udry (1996) Akresh (2006) in the context of Burkina Faso and Goldstein and Udry (2008) in the context of Ghana.
3 Females inherit less properties from their parents, if any, and are not able to secure their inheritance. Uncertainty in property right also leaves females no room for credit access. Limited access to credit is also essential in explaining small female household enterprises. Moreover, females often need husbands’ approval to open a bank account and access to credit.
7
access to education into more equal access to the different segments of the labor market. Finally, on the econometric front, we innovatively adopt propensity score matching method to check the robustness of Fox and Sohnesen (2012) results and are able to quantify the monetary value of welfare difference between employment sectors.
III. LOW/LOWER MIDDLE INCOME COUNTRIES
AGRICULTURE FEMINIZATION AND FEMALE INFORMAL EMPLOYMENT
After describing the features of the labor market, this section studies the determinants of gender-split employment sector structure in Burkina Faso, Rwanda, Zambia, and Ghana. While education is an important factor in the selection of the employment sector, the opportunities education offers women to work in the wage sector disappear when they get married. This gender gap becomes more pronounced when countries develop and become more urbanized, creating more wage employment. The welfare implications of this gender gap is eased by the fact that employment in the household enterprise sector, where women have easier access than in the formal wage sector, has almost the same positive impact on women’s per capita household income as wage employment.
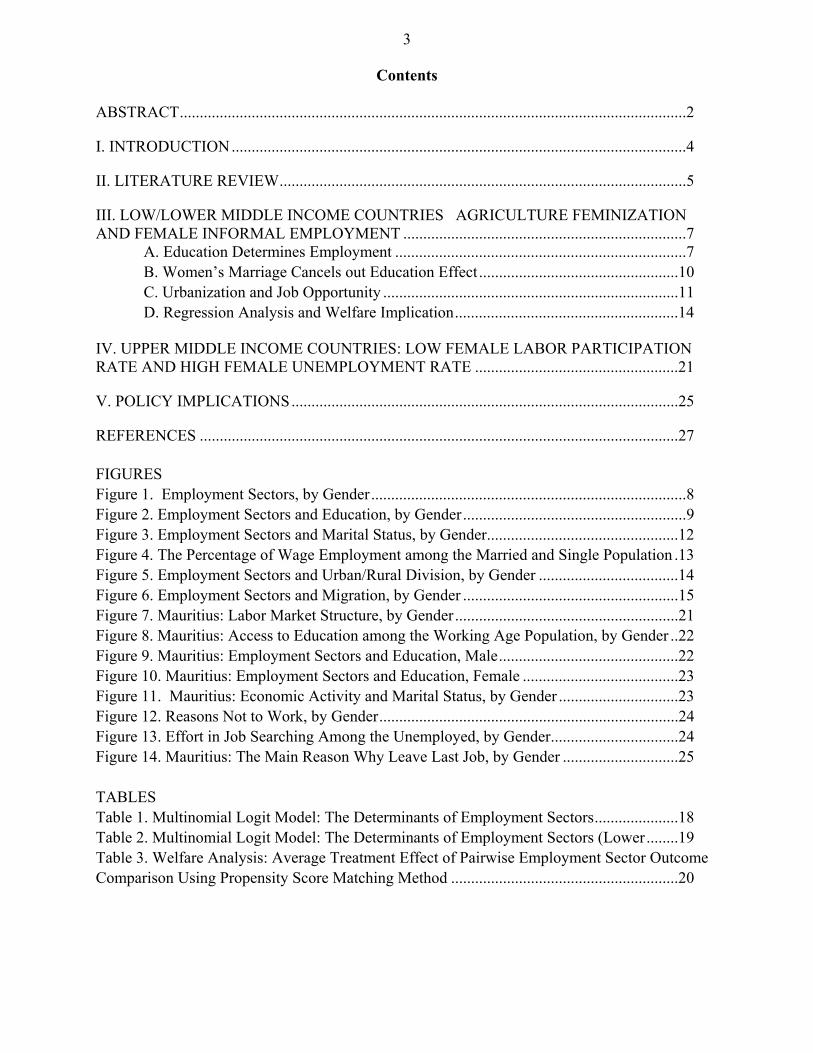
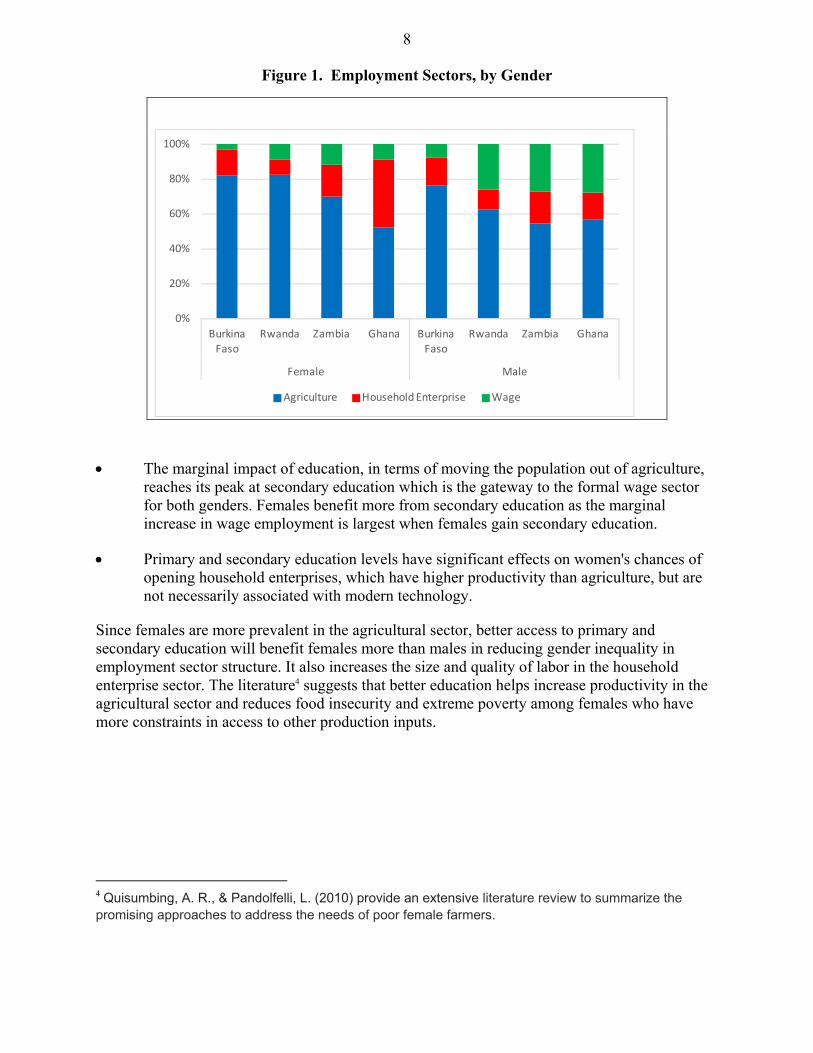
Among low income countries in Sub-Saharan Africa, agriculture feminization is prevalent. Moreover, men and women are equally represented in the household enterprise sector, but wage employment is dominated by men. In Burkina Faso, roughly 80 % of workers are employed in the agriculture sector (82% of women and 76 % of men). The gender gap is more pronounced in Rwanda, where 82% of the female and 62% of the male work in the agriculture sector. (Figure 1) The percentages of household enterprise workers are similar between genders within these two countries. On the other hand, wage employment is dominated by men, who have roughly two to three times higher probability than females to be employed in this sector.
In lower-middle income countries, with further urbanization and the shrinking of the agriculture sector, males gain far more opportunities in wage employment than females, while females tend to move out of agriculture to the household enterprise sector. In Zambia, women continue to work primarily in the agricultural sector and do not gain from increasing employment opportunities that develop along with economic growth. In Ghana, both genders have similar opportunities in non-farm jobs, but females are more likely to be informally employed in the household enterprise sector, which is often referred as female informal employment. Although urbanization is Pareto improvement for both genders, females do not seem to gain their fair share of new employment opportunities in this transition process.
A. Education Determines Employment
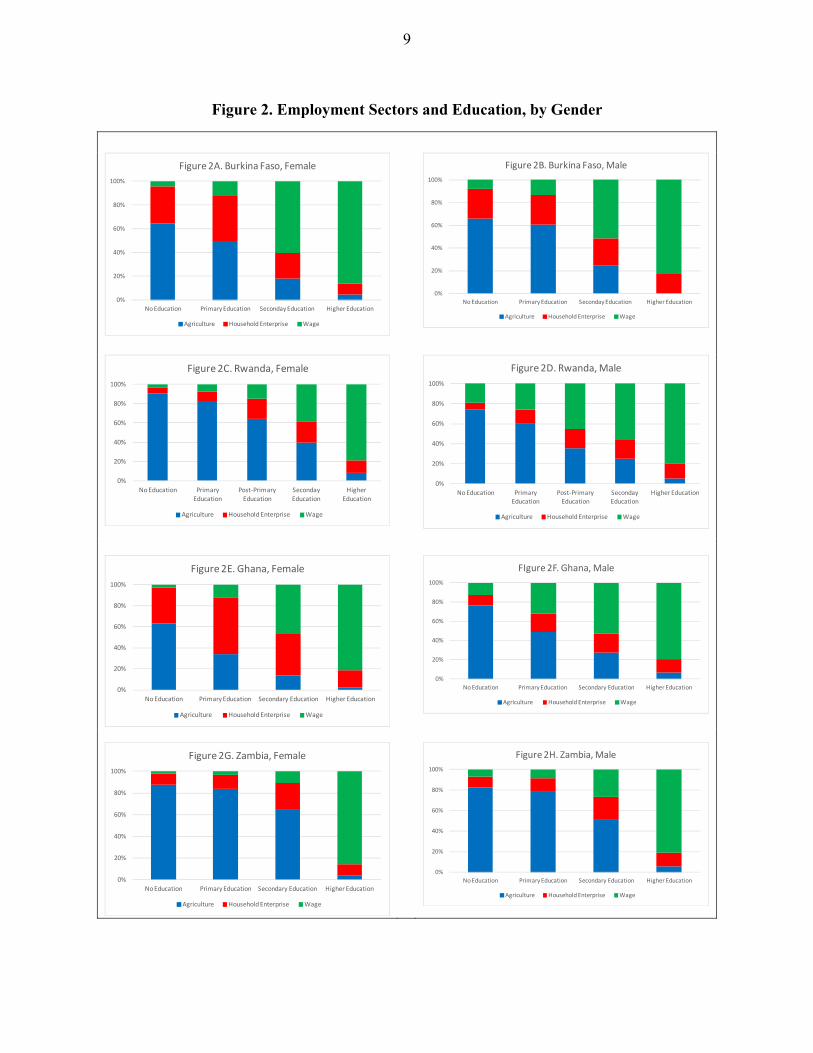
Education is the key factor in determining employment sector outcomes, but the impact of education on employment is non-linear. The percentage of agriculture employment decreases with more advanced education levels in all four country cases, but the following differences are present:
8
Figure 1. Employment Sectors, by Gender
0%
20%
40%
60%
80%
100%
Burkina
Faso
Rwanda Zambia Ghana Burkina
Faso
Rwanda Zambia Ghana
Female Male
Agriculture Household Enterprise Wage
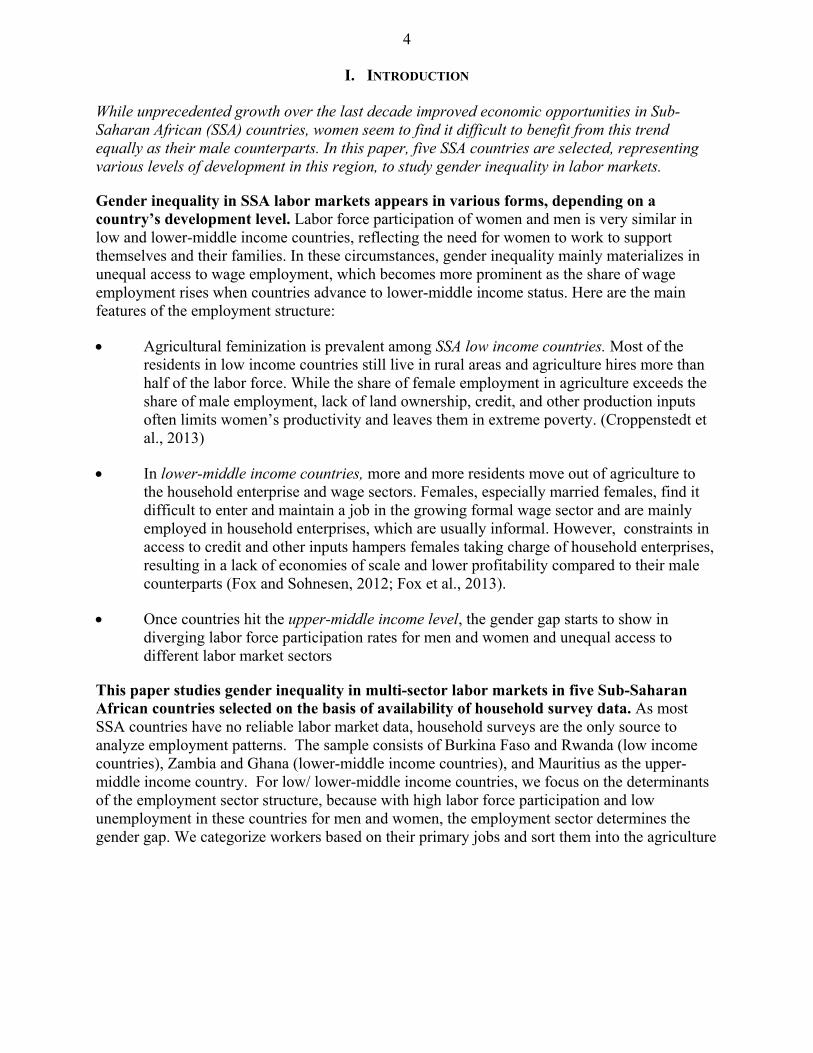
The marginal impact of education, in terms of moving the population out of agriculture,
reaches its peak at secondary education which is the gateway to the formal wage sector for both genders. Females benefit more from secondary education as the marginal increase in wage employment is largest when females gain secondary education.
Primary and secondary education levels have significant effects on women's chances of opening household enterprises, which have higher productivity than agriculture, but are not necessarily associated with modern technology.
Since females are more prevalent in the agricultural sector, better access to primary and secondary education will benefit females more than males in reducing gender inequality in employment sector structure. It also increases the size and quality of labor in the household enterprise sector. The literature4 suggests that better education helps increase productivity in the agricultural sector and reduces food insecurity and extreme poverty among females who have more constraints in access to other production inputs.
4 Quisumbing, A. R., & Pandolfelli, L. (2010) provide an extensive literature review to summarize the promising approaches to address the needs of poor female farmers.
9
Figure 2. Employment Sectors and Education, by Gender
0%
20%
40%
60%
80%
100%
No Education Primary Education Seconday Education Higher Education
Figure 2A. Burkina Faso, Female
Agriculture Household Enterprise Wage
0%
20%
40%
60%
80%
100%
No Education Primary Education Seconday Education Higher Education
Figure 2B. Burkina Faso, Male
Agriculture Household Enterprise Wage
0%
20%
40%
60%
80%
100%
No Education Primary Education
Post-Primary Education
Seconday Education
Higher Education
Figure 2C. Rwanda, Female
Agriculture Household Enterprise Wage
0%
20%
40%
60%
80%
100%
No Education Primary Education
Post-Primary Education
Seconday Education
Higher Education
Figure 2D. Rwanda, Male
Agriculture Household Enterprise Wage
0%
20%
40%
60%
80%
100%
No Education Primary Education Secondary Education Higher Education
Figure 2E. Ghana, Female
Agriculture Household Enterprise Wage
0%
20%
40%
60%
80%
100%
No Education Primary Education Secondary Education Higher Education
FIgure 2F. Ghana, Male
Agriculture Household Enterprise Wage
0%
20%
40%
60%
80%
100%
No Education Primary Education Secondary Education Higher Education
Figure 2G. Zambia, Female
Agriculture Household Enterprise Wage
0%
20%
40%
60%
80%
100%
No Education Primary Education Secondary Education Higher Education
Figure 2H. Zambia, Male
Agriculture Household Enterprise Wage
10
B. Women’s Marriage Cancels out Education Effect
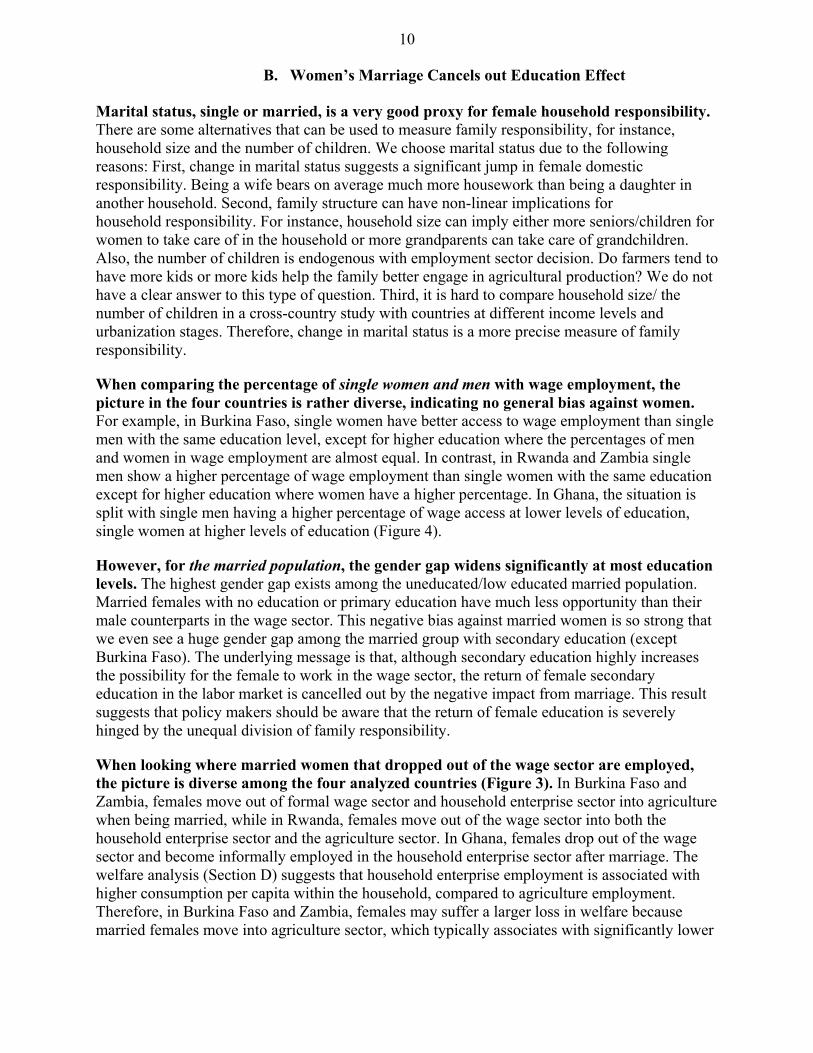
Marital status, single or married, is a very good proxy for female household responsibility. There are some alternatives that can be used to measure family responsibility, for instance, household size and the number of children. We choose marital status due to the following reasons: First, change in marital status suggests a significant jump in female domestic responsibility. Being a wife bears on average much more housework than being a daughter in another household. Second, family structure can have non-linear implications for household responsibility. For instance, household size can imply either more seniors/children for women to take care of in the household or more grandparents can take care of grandchildren. Also, the number of children is endogenous with employment sector decision. Do farmers tend to have more kids or more kids help the family better engage in agricultural production? We do not have a clear answer to this type of question. Third, it is hard to compare household size/ the number of children in a cross-country study with countries at different income levels and urbanization stages. Therefore, change in marital status is a more precise measure of family responsibility.
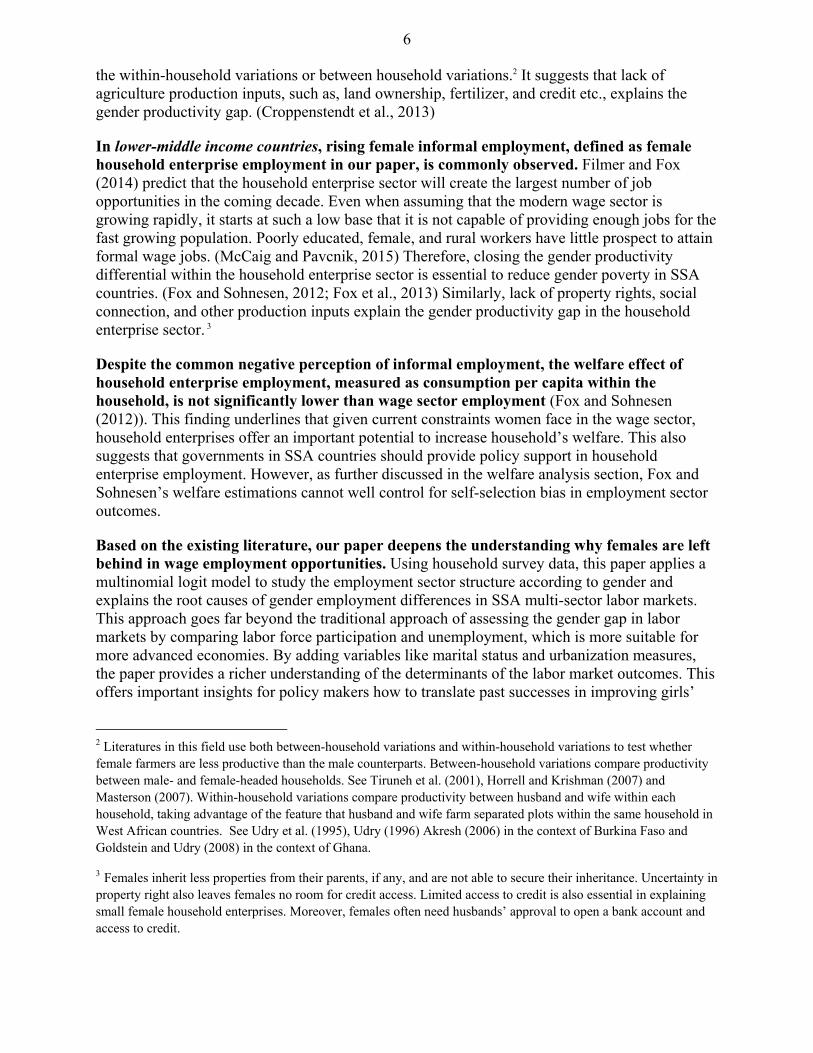
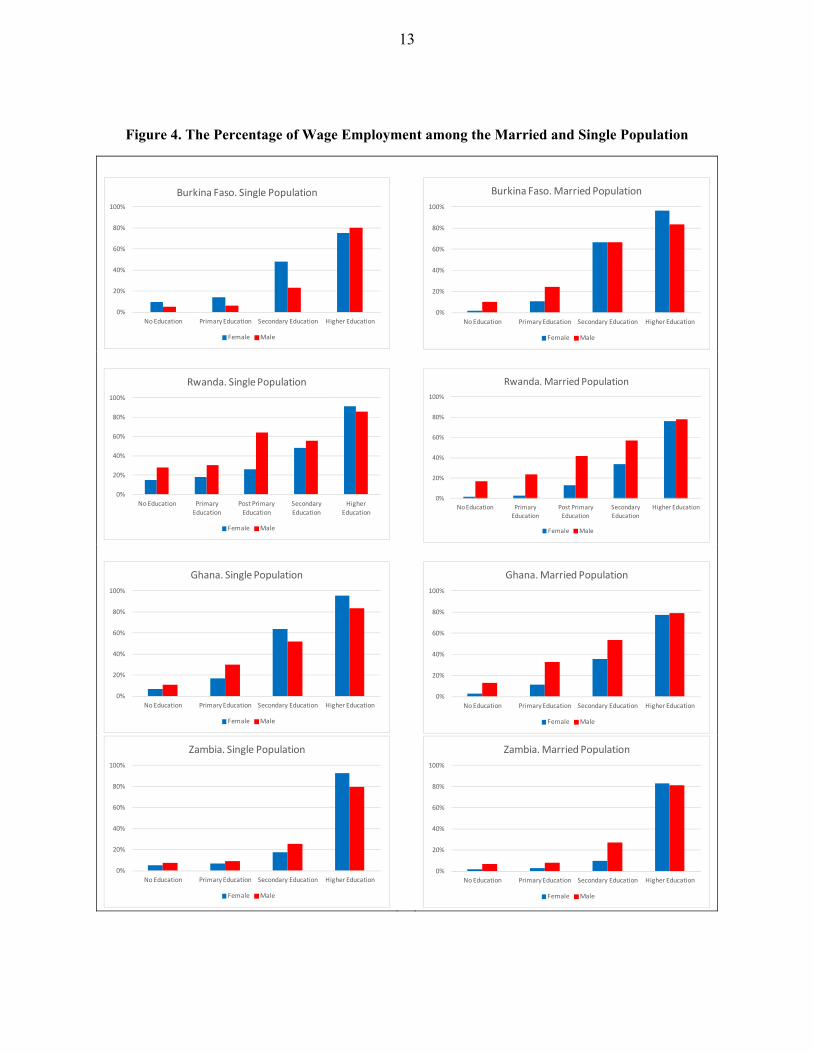
When comparing the percentage of single women and men with wage employment, the picture in the four countries is rather diverse, indicating no general bias against women. For example, in Burkina Faso, single women have better access to wage employment than single men with the same education level, except for higher education where the percentages of men and women in wage employment are almost equal. In contrast, in Rwanda and Zambia single men show a higher percentage of wage employment than single women with the same education except for higher education where women have a higher percentage. In Ghana, the situation is split with single men having a higher percentage of wage access at lower levels of education, single women at higher levels of education (Figure 4).
However, for the married population, the gender gap widens significantly at most education levels. The highest gender gap exists among the uneducated/low educated married population. Married females with no education or primary education have much less opportunity than their male counterparts in the wage sector. This negative bias against married women is so strong that we even see a huge gender gap among the married group with secondary education (except Burkina Faso). The underlying message is that, although secondary education highly increases the possibility for the female to work in the wage sector, the return of female secondary education in the labor market is cancelled out by the negative impact from marriage. This result suggests that policy makers should be aware that the return of female education is severely hinged by the unequal division of family responsibility.
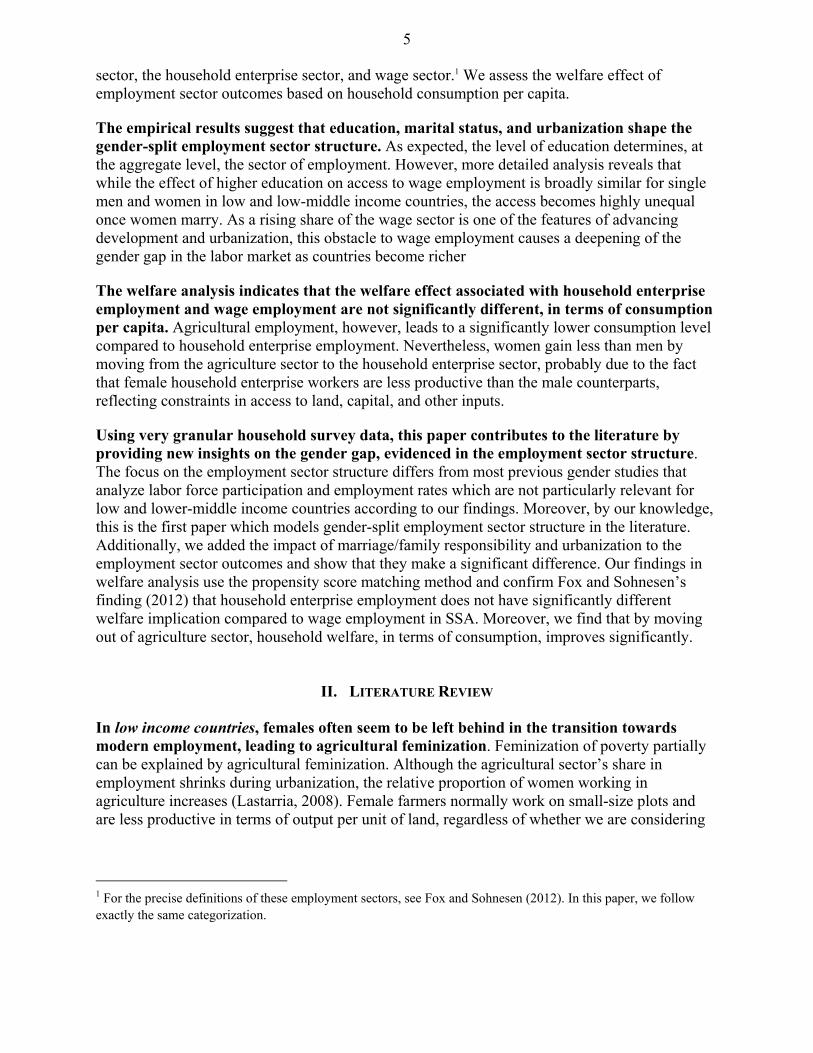
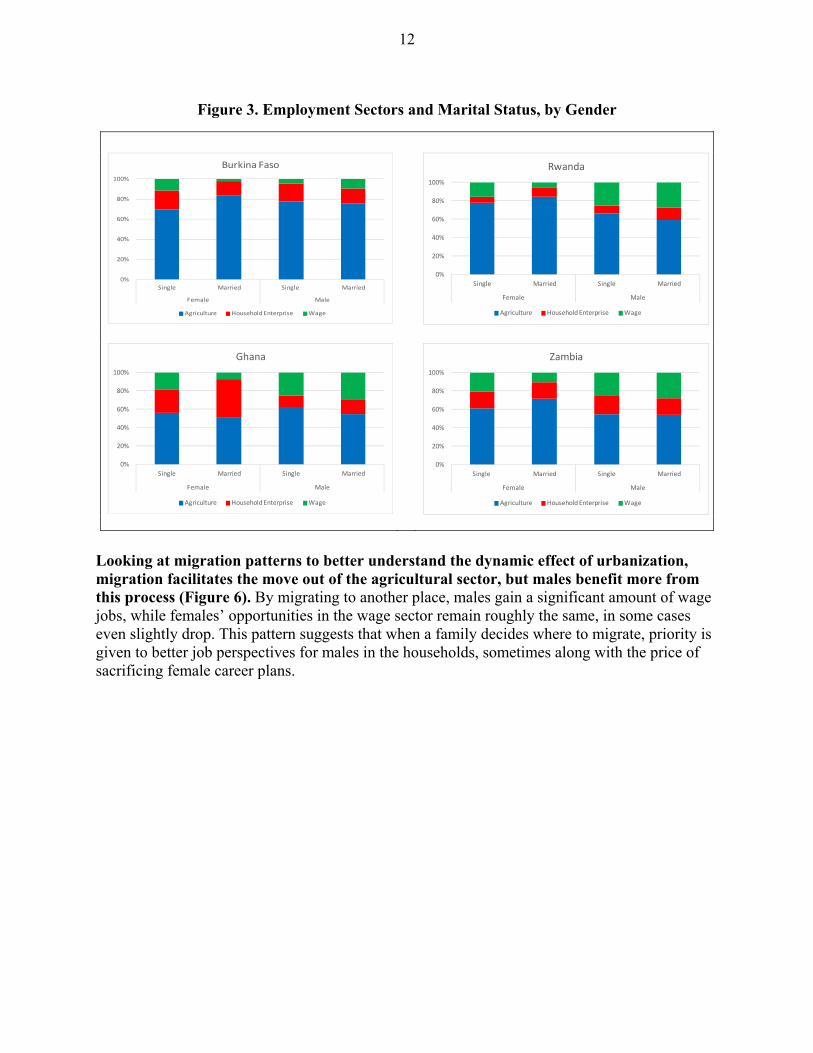
When looking where married women that dropped out of the wage sector are employed, the picture is diverse among the four analyzed countries (Figure 3). In Burkina Faso and Zambia, females move out of formal wage sector and household enterprise sector into agriculture when being married, while in Rwanda, females move out of the wage sector into both the household enterprise sector and the agriculture sector. In Ghana, females drop out of the wage sector and become informally employed in the household enterprise sector after marriage. The welfare analysis (Section D) suggests that household enterprise employment is associated with higher consumption per capita within the household, compared to agriculture employment. Therefore, in Burkina Faso and Zambia, females may suffer a larger loss in welfare because married females move into agriculture sector, which typically associates with significantly lower
11
consumption level. In Rwanda and Ghana, at least part of the married females move into household enterprises, which provides a higher level of per capita consumption than agriculture.
C. Urbanization and Job Opportunity
Urbanization provides more job opportunities outside agriculture. In this section, we analyze the impact of urbanization on the gender-split first from a more static angle, checking the employment sector structure by urban/rural division; this method enables us to see the spatial difference in job creation. The more dynamic angle looks at the impact of migration on sectoral opportunities by gender, providing insights how much female/male migration is linked to seeking better job opportunities.
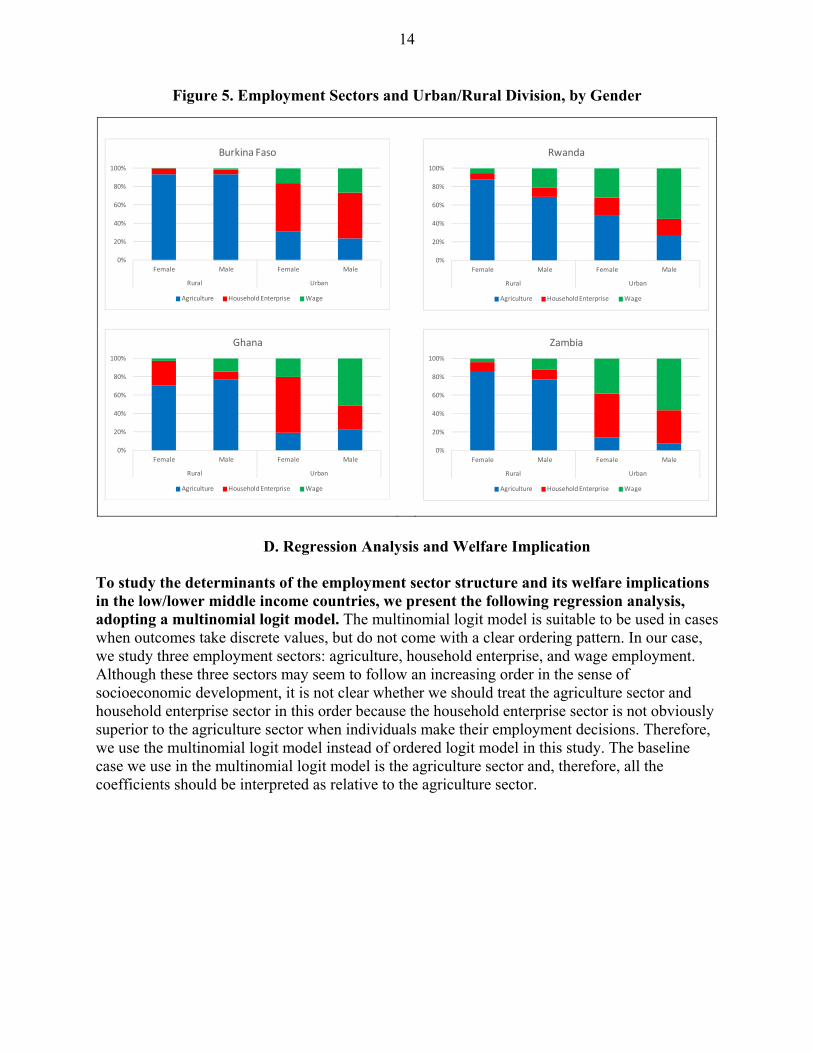
Urban areas in general provide much better job opportunities outside the traditional agriculture sector, but urbanization seems to deepen the gap between men and women in terms of employment structure (Figure 5). In rural areas, gender disparity in the employment sector is narrower than in the urban areas, due to the fact that few wage jobs are available in rural areas. Burkina Faso, which is in an early stage of urbanization with a share of urban population of 29% in 2014 (World Bank Database), has few wage jobs available in the rural areas and the employment sector distribution is very similar between males and females. However, in the urban areas, men’s wage employment is 10 percentage points higher than women’s. In Rwanda, whose share of urban population is at 28% very close to Burkina Faso, males in rural areas also have better access to wage employment than females, but the gender gap is still relatively small. In contrast, in urban Rwanda, 55% of males versus only 21% of females are employed in the wage sector. In Ghana, urbanization is more advanced with 53% of the population living in urban areas. Females there are much more likely to work in the household enterprise sector. In comparison, their male counterparts have more than twice as many wage jobs than in rural areas. Zambia shares the similar pattern as Ghana despite a lower urbanization rate of 40%.
12
Figure 3. Employment Sectors and Marital Status, by Gender
0%
20%
40%
60%
80%
100%
Single Married Single Married
Female Male
Burkina Faso
Agriculture Household Enterprise Wage
0%
20%
40%
60%
80%
100%
Single Married Single Married
Female Male
Rwanda
Agriculture Household Enterprise Wage
0%
20%
40%
60%
80%
100%
Single Married Single Married
Female Male
Ghana
Agriculture Household Enterprise Wage
0%
20%
40%
60%
80%
100%
Single Married Single Married
Female Male
Zambia
Agriculture Household Enterprise Wage
Looking at migration patterns to better understand the dynamic effect of urbanization, migration facilitates the move out of the agricultural sector, but males benefit more from this process (Figure 6). By migrating to another place, males gain a significant amount of wage jobs, while females’ opportunities in the wage sector remain roughly the same, in some cases even slightly drop. This pattern suggests that when a family decides where to migrate, priority is given to better job perspectives for males in the households, sometimes along with the price of sacrificing female career plans.
13
Figure 4. The Percentage of Wage Employment among the Married and Single Population
0%
20%
40%
60%
80%
100%
No Education Primary Education Secondary Education Higher Education
Burkina Faso. Single Population
Female Male
0%
20%
40%
60%
80%
100%
No Education Primary Education Secondary Education Higher Education
Burkina Faso. Married Population
Female Male
0%
20%
40%
60%
80%
100%
No Education Primary Education
Post Primary Education
Secondary Education
Higher Education
Rwanda. Single Population
Female Male
0%
20%
40%
60%
80%
100%
No Education Primary
Education
Post Primary
Education
Secondary
Education
Higher Education
Rwanda. Married Population
Female Male
0%
20%
40%
60%
80%
100%
No Education Primary Education Secondary Education Higher Education
Ghana. Single Population
Female Male
0%
20%
40%
60%
80%
100%
No Education Primary Education Secondary Education Higher Education
Ghana. Married Population
Female Male
0%
20%
40%
60%
80%
100%
No Education Primary Education Secondary Education Higher Education
Zambia. Single Population
Female Male
0%
20%
40%
60%
80%
100%
No Education Primary Education Secondary Education Higher Education
Zambia. Married Population
Female Male
14
Figure 5. Employment Sectors and Urban/Rural Division, by Gender
0%
20%
40%
60%
80%
100%
Female Male Female Male
Rural Urban
Burkina Faso
Agriculture Household Enterprise Wage
0%
20%
40%
60%
80%
100%
Female Male Female Male
Rural Urban
Rwanda
Agriculture Household Enterprise Wage
0%
20%
40%
60%
80%
100%
Female Male Female Male
Rural Urban
Ghana
Agriculture Household Enterprise Wage
0%
20%
40%
60%
80%
100%
Female Male Female Male
Rural Urban
Zambia
Agriculture Household Enterprise Wage
D. Regression Analysis and Welfare Implication
To study the determinants of the employment sector structure and its welfare implications in the low/lower middle income countries, we present the following regression analysis, adopting a multinomial logit model. The multinomial logit model is suitable to be used in cases when outcomes take discrete values, but do not come with a clear ordering pattern. In our case, we study three employment sectors: agriculture, household enterprise, and wage employment. Although these three sectors may seem to follow an increasing order in the sense of socioeconomic development, it is not clear whether we should treat the agriculture sector and household enterprise sector in this order because the household enterprise sector is not obviously superior to the agriculture sector when individuals make their employment decisions. Therefore, we use the multinomial logit model instead of ordered logit model in this study. The baseline case we use in the multinomial logit model is the agriculture sector and, therefore, all the coefficients should be interpreted as relative to the agriculture sector.
15
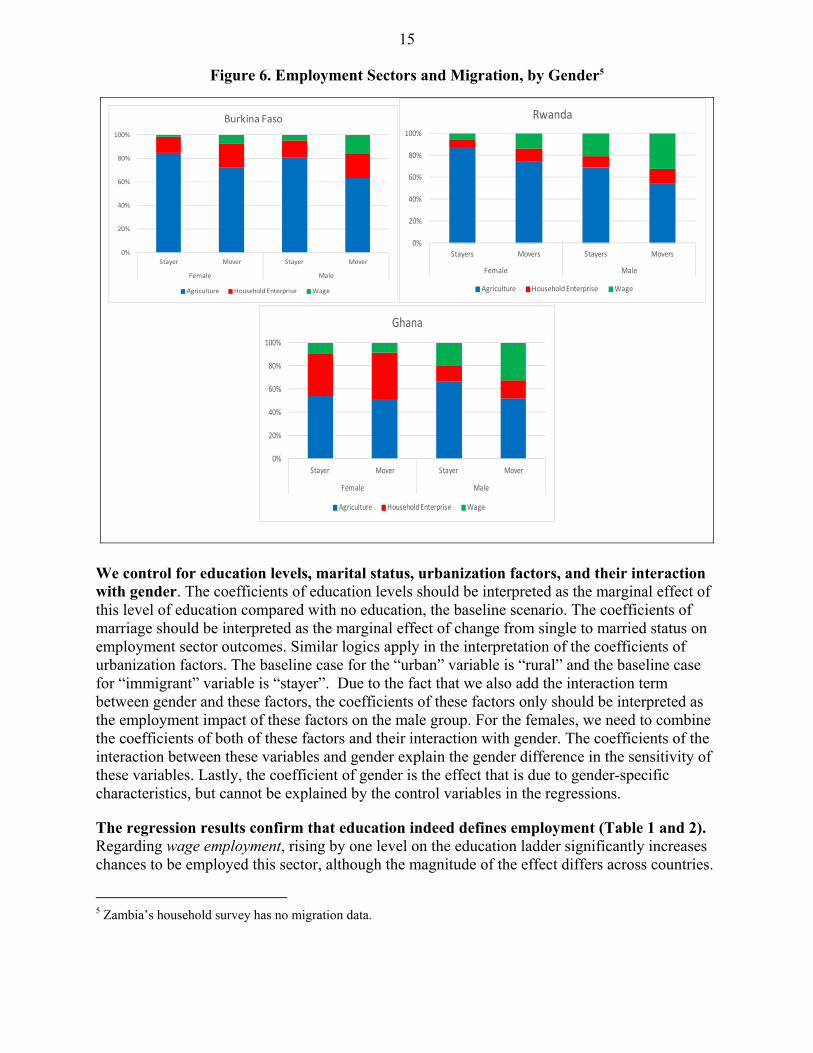
Figure 6. Employment Sectors and Migration, by Gender5
0%
20%
40%
60%
80%
100%
Stayer Mover Stayer Mover
Female Male
Burkina Faso
Agriculture Household Enterprise Wage
0%
20%
40%
60%
80%
100%
Stayers Movers Stayers Movers
Female Male
Rwanda
Agriculture Household Enterprise Wage
0%
20%
40%
60%
80%
100%
Stayer Mover Stayer Mover
Female Male
Ghana
Agriculture Household Enterprise Wage
We control for education levels, marital status, urbanization factors, and their interaction with gender. The coefficients of education levels should be interpreted as the marginal effect of this level of education compared with no education, the baseline scenario. The coefficients of marriage should be interpreted as the marginal effect of change from single to married status on employment sector outcomes. Similar logics apply in the interpretation of the coefficients of urbanization factors. The baseline case for the “urban” variable is “rural” and the baseline case for “immigrant” variable is “stayer”. Due to the fact that we also add the interaction term between gender and these factors, the coefficients of these factors only should be interpreted as the employment impact of these factors on the male group. For the females, we need to combine the coefficients of both of these factors and their interaction with gender. The coefficients of the interaction between these variables and gender explain the gender difference in the sensitivity of these variables. Lastly, the coefficient of gender is the effect that is due to gender-specific characteristics, but cannot be explained by the control variables in the regressions.
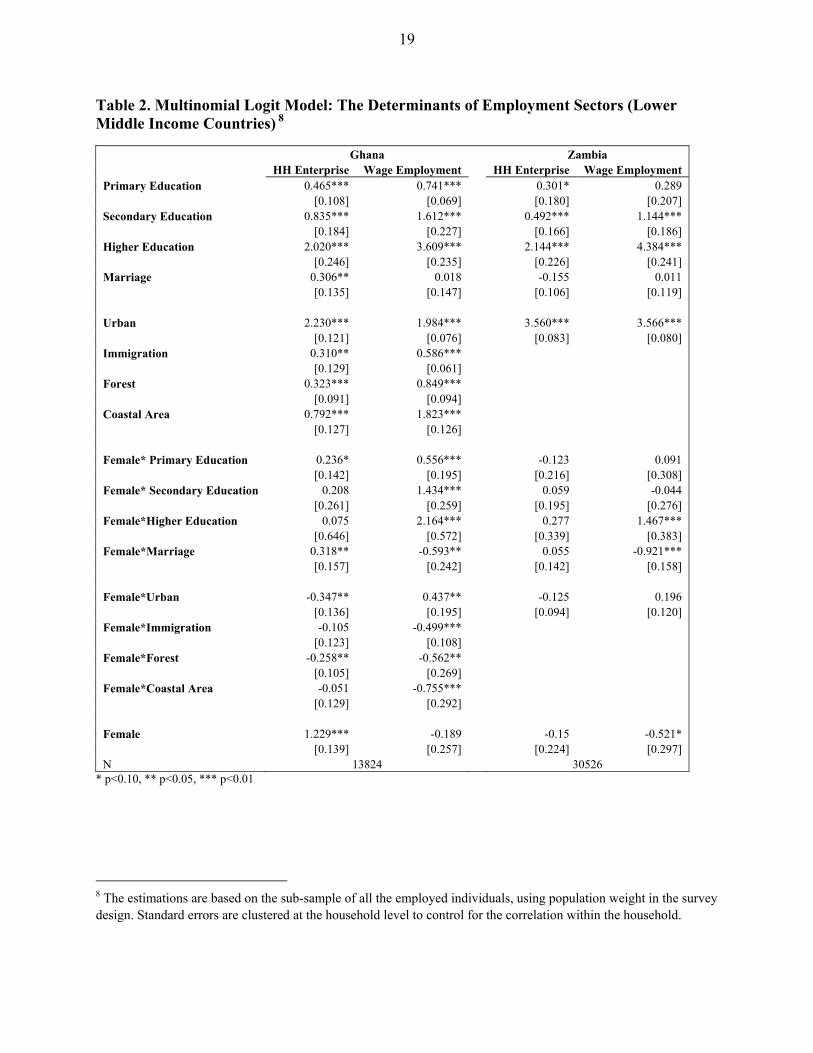
The regression results confirm that education indeed defines employment (Table 1 and 2). Regarding wage employment, rising by one level on the education ladder significantly increases chances to be employed this sector, although the magnitude of the effect differs across countries.
5 Zambia’s household survey has no migration data.
16
For example, in Burkina Faso, if we choose the no education group as the baseline scenario, obtaining primary education increases the probability to get a wage job by 7.7%; obtaining secondary education increases the probability to get a wage job by 28.1%; obtaining higher education increases the probability to get a wage job by 62.5%. .6 In Rwanda, Ghana, and Zambia, we observe a steady and comparable increase in the chance of wage employment when individuals move up the education ladder. Moreover, the impact of education is larger among females, indicating that females rely on education to narrow the wider gender gap among uneducated/less educated population. Regarding household enterprise employment, we also observe that education improves the chance to be employed in the household enterprise sector, while on average the parameter estimates are smaller. Additionally, we do not observe gender difference in the impact of education on the chance to be employed in the household enterprise sector.
The model confirms that marriage does not have an implication on the employment sector structure for males, but massively decreases chances for females to move out of agriculture, a pattern consistently observed across all the four countries. The marginal effect of marriage on chances to work in the wage sector for females seems to be larger in countries with lower urbanization levels. The explanation could be that with urbanization, less social discrimination/ family responsibility is imposed on married working females. The impact of marriage on females’ household enterprise employment is indecisive. This feature confirms that time flexibility in the household enterprise sector offers females the opportunity to stay in or re-enter this sector after marriage— flexibility not offered in the wage sector. However, limited flexibility due to household responsibilities might also explain the lower productivity of female-owned household enterprises.
The impact of female migration is mixed. In Rwanda, female migrants increase the chance to wage employment more than male counterparts. In contrast, in Ghana the pattern is reversed. Explaining this difference requires more insights into what motivates migration. It could be that different social standards for women determine if females migrate to seek for better jobs for themselves or migration decisions are determined by job opportunities for their husbands.
How do these differences in the individuals’ employment sector choices affect their welfare? Does moving out of the agriculture sector imply an increase in household welfare? Does wage employment provide a much higher level of consumption compared to household enterprise employment? Fox and Sohnesen (2012) provide their answer to the second question by studying the impact of the employment sector outcome on consumption per capita within the household. They control for employment sectors and other observed characterisitics in an OLS regression model and find that household enterprise employment generates roughly the same level of consumption per capita within the household, compared to wage employment.
Our study, building on the work of Fox and Sohnesen, innovatively introduces the propensity score matching method to provide additional insights into the question they
6 The probabilities reported here are the marginal effects of the corresponding education attainments changing from the baseline level, i.e., the no education group. These probabilities are computed based on the multinomial logit model coefficient estimations. Details about how to compute these marginal effects, please see the link below: http://data.princeton.edu/wws509/stata/mlogit.html
17
proposed. Our method has the following advantages: First, the propensity score matching method allows us to more accurately pair the individuals with similar observed characteristics but “accidently” choose different employment sectors in the labor market. In our case, apparently, individuals working in the agriculture sector are very different from other sectors and vice versa. Our goal is to compare individuals with similarity in observables because individuals with different characteristics naturally work in different employment sectors and it does not offer policy insight to compare them. The propensity score matching method has the advantage of putting more weight on these individuals who share the similar characteristics, but choose different sectors. Second, the propensity score matching method, together with average treatment effect estimation, allows us to estimate the dollar value of the impact of employment sector outcome on consumption per capita, a quantity that can not be achieved by OLS estimation. We convert the consumption per capita from domestic currency unit to US dollar unit, using the average exchange rate against US dollar within the survey year. Table 3 provides the amount of consumption per year per capita increase in terms of US dollar by moving from one sector to another. This result helps policy makers to better understand the cost and benefit of a policy aiming to change the employment sector structure.
The results show that by moving from agriculture to household enterprise employment, consumption per capita in the worker’s household significantly increases, but moving from household enterprise to wage employment has no significant impact on comsumption per capita (Table 3). Table 3 reports the average treatment effect of moving from one sector to another on consumption per year per capita within the household. The treatment in this case is household members’ employment sector. We study the overall impact by exploiting information from all workers, and also the impact from the female worker subsample and the male worker subsample. In the left panel in Table 3, we study the impact of individuals moving out of agriculture towards household enterprise. Overall, the household enterprise sector increases the consumption per capita per year by 60-270 US dollar, depending on the specific country context, with the smallest impact in Zambia. Both female and male household enterprise workers increase their corresponding household members’ average consumption levels, but male household enterprise workers consistently increase the family consumption level more than the female counterparts. This pattern suggests that female productivity in the household enterprise sector is lower than the male counterparts. Lack of production inputs, like land, credit and other factors may explain the productivity gap between genders. In the right panel of Table 3, we study the impact of individuals moving from household enterprise to wage employment. The results suggest that the household consumption level is not significantly different between these two sectors, which confirms the finding in Fox and Sohensen (2012).
18
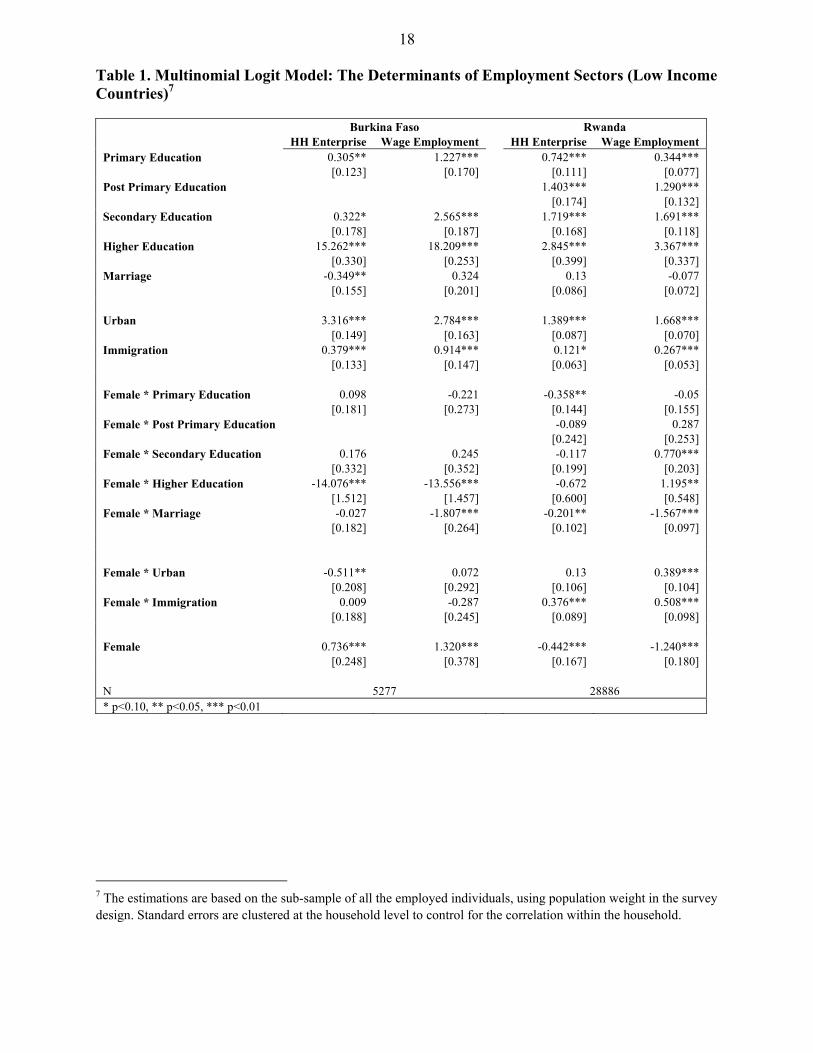
Table 1. Multinomial Logit Model: The Determinants of Employment Sectors (Low Income Countries)7
Burkina Faso Rwanda HH Enterprise Wage Employment HH Enterprise Wage Employment
Primary Education 0.305** 1.227*** 0.742*** 0.344*** [0.123] [0.170] [0.111] [0.077]
Post Primary Education 1.403*** 1.290*** [0.174] [0.132]
Secondary Education 0.322* 2.565*** 1.719*** 1.691*** [0.178] [0.187] [0.168] [0.118]
Higher Education 15.262*** 18.209*** 2.845*** 3.367*** [0.330] [0.253] [0.399] [0.337]
Marriage -0.349** 0.324 0.13 -0.077 [0.155] [0.201] [0.086] [0.072]
Urban 3.316*** 2.784*** 1.389*** 1.668***
[0.149] [0.163] [0.087] [0.070] Immigration 0.379*** 0.914*** 0.121* 0.267***
[0.133] [0.147] [0.063] [0.053]
Female * Primary Education 0.098 -0.221 -0.358** -0.05 [0.181] [0.273] [0.144] [0.155]
Female * Post Primary Education -0.089 0.287 [0.242] [0.253]
Female * Secondary Education 0.176 0.245 -0.117 0.770*** [0.332] [0.352] [0.199] [0.203]
Female * Higher Education -14.076*** -13.556*** -0.672 1.195** [1.512] [1.457] [0.600] [0.548]
Female * Marriage -0.027 -1.807*** -0.201** -1.567*** [0.182] [0.264] [0.102] [0.097]
Female * Urban -0.511** 0.072 0.13 0.389*** [0.208] [0.292] [0.106] [0.104]
Female * Immigration 0.009 -0.287 0.376*** 0.508*** [0.188] [0.245] [0.089] [0.098]
Female 0.736*** 1.320*** -0.442*** -1.240*** [0.248] [0.378] [0.167] [0.180] N 5277 28886 * p<0.10, ** p<0.05, *** p<0.01
7 The estimations are based on the sub-sample of all the employed individuals, using population weight in the survey design. Standard errors are clustered at the household level to control for the correlation within the household.
19
Table 2. Multinomial Logit Model: The Determinants of Employment Sectors (Lower Middle Income Countries) 8
Ghana Zambia HH Enterprise Wage Employment HH Enterprise Wage Employment
Primary Education 0.465*** 0.741*** 0.301* 0.289 [0.108] [0.069] [0.180] [0.207]
Secondary Education 0.835*** 1.612*** 0.492*** 1.144*** [0.184] [0.227] [0.166] [0.186]
Higher Education 2.020*** 3.609*** 2.144*** 4.384*** [0.246] [0.235] [0.226] [0.241]
Marriage 0.306** 0.018 -0.155 0.011 [0.135] [0.147] [0.106] [0.119]
Urban 2.230*** 1.984*** 3.560*** 3.566*** [0.121] [0.076] [0.083] [0.080]
Immigration 0.310** 0.586*** [0.129] [0.061]
Forest 0.323*** 0.849*** [0.091] [0.094]
Coastal Area 0.792*** 1.823*** [0.127] [0.126]
Female* Primary Education 0.236* 0.556*** -0.123 0.091 [0.142] [0.195] [0.216] [0.308]
Female* Secondary Education 0.208 1.434*** 0.059 -0.044 [0.261] [0.259] [0.195] [0.276]
Female*Higher Education 0.075 2.164*** 0.277 1.467*** [0.646] [0.572] [0.339] [0.383]
Female*Marriage 0.318** -0.593** 0.055 -0.921*** [0.157] [0.242] [0.142] [0.158]
Female*Urban -0.347** 0.437** -0.125 0.196 [0.136] [0.195] [0.094] [0.120]
Female*Immigration -0.105 -0.499*** [0.123] [0.108]
Female*Forest -0.258** -0.562** [0.105] [0.269]
Female*Coastal Area -0.051 -0.755*** [0.129] [0.292]
Female 1.229*** -0.189 -0.15 -0.521* [0.139] [0.257] [0.224] [0.297] N 13824 30526
* p<0.10, ** p<0.05, *** p<0.01
8 The estimations are based on the sub-sample of all the employed individuals, using population weight in the survey design. Standard errors are clustered at the household level to control for the correlation within the household.
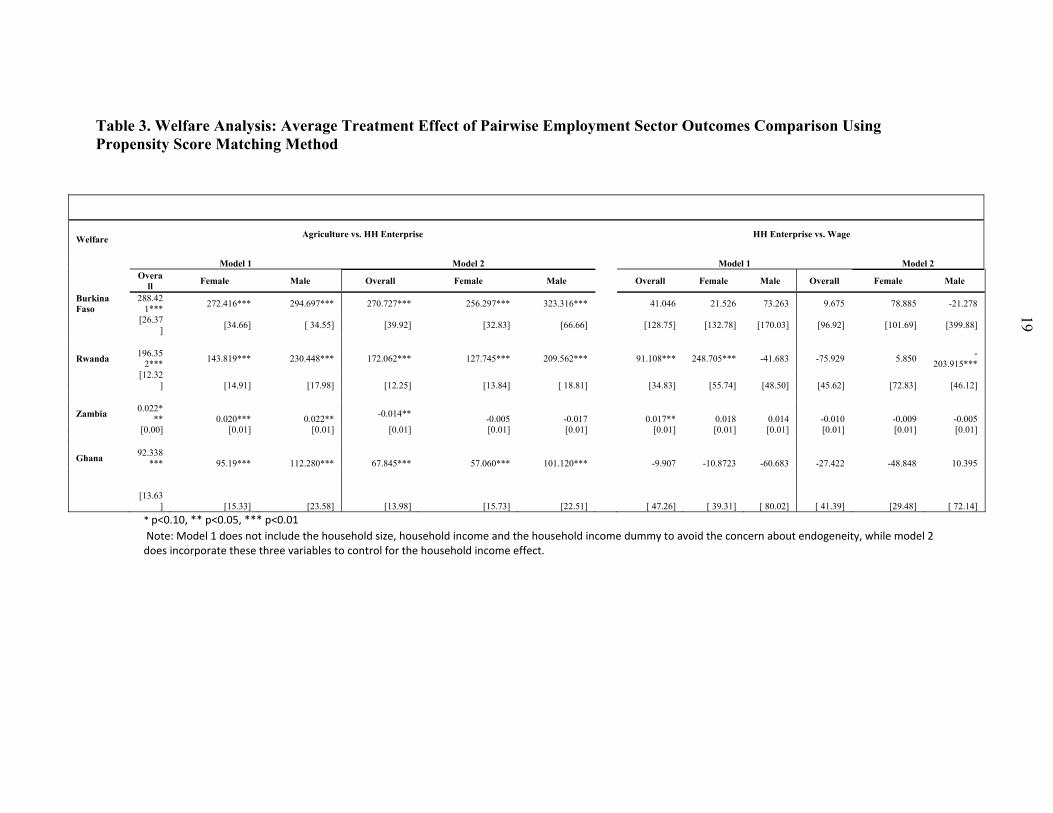
Table 3. Welfare Analysis: Average Treatment Effect of Pairwise Employment Sector Outcomes Comparison Using Propensity Score Matching Method
* p<0.10, ** p<0.05, *** p<0.01
Welfare Agriculture vs. HH Enterprise
HH Enterprise vs. Wage
Model 1 Model 2 Model 1 Model 2 Overa
ll Female Male Overall Female Male
Overall Female Male Overall Female Male
Burkina Faso
288.421***
272.416*** 294.697*** 270.727*** 256.297*** 323.316*** 41.046 21.526 73.263 9.675 78.885 -21.278
[26.37
] [34.66] [ 34.55] [39.92] [32.83] [66.66] [128.75] [132.78] [170.03] [96.92] [101.69] [399.88]
Rwanda 196.35
2*** 143.819*** 230.448*** 172.062*** 127.745*** 209.562*** 91.108*** 248.705*** -41.683 -75.929 5.850
-203.915***
[12.32
] [14.91] [17.98] [12.25] [13.84] [ 18.81] [34.83] [55.74] [48.50] [45.62] [72.83] [46.12]
Zambia 0.022*
** 0.020*** 0.022** -0.014**
-0.005 -0.017 0.017** 0.018 0.014 -0.010 -0.009 -0.005 [0.00] [0.01] [0.01] [0.01] [0.01] [0.01] [0.01] [0.01] [0.01] [0.01] [0.01] [0.01]
Ghana 92.338
*** 95.19*** 112.280*** 67.845*** 57.060*** 101.120*** -9.907 -10.8723 -60.683 -27.422 -48.848 10.395
[13.63] [15.33] [23.58] [13.98] [15.73] [22.51] [ 47.26] [ 39.31] [ 80.02] [ 41.39] [29.48] [ 72.14]
Note: Model 1 does not include the household size, household income and the household income dummy to avoid the concern about endogeneity, while model 2 does incorporate these three variables to control for the household income effect.
19
21
IV. UPPER MIDDLE INCOME COUNTRIES: LOW FEMALE LABOR PARTICIPATION RATE AND
HIGH FEMALE UNEMPLOYMENT RATE
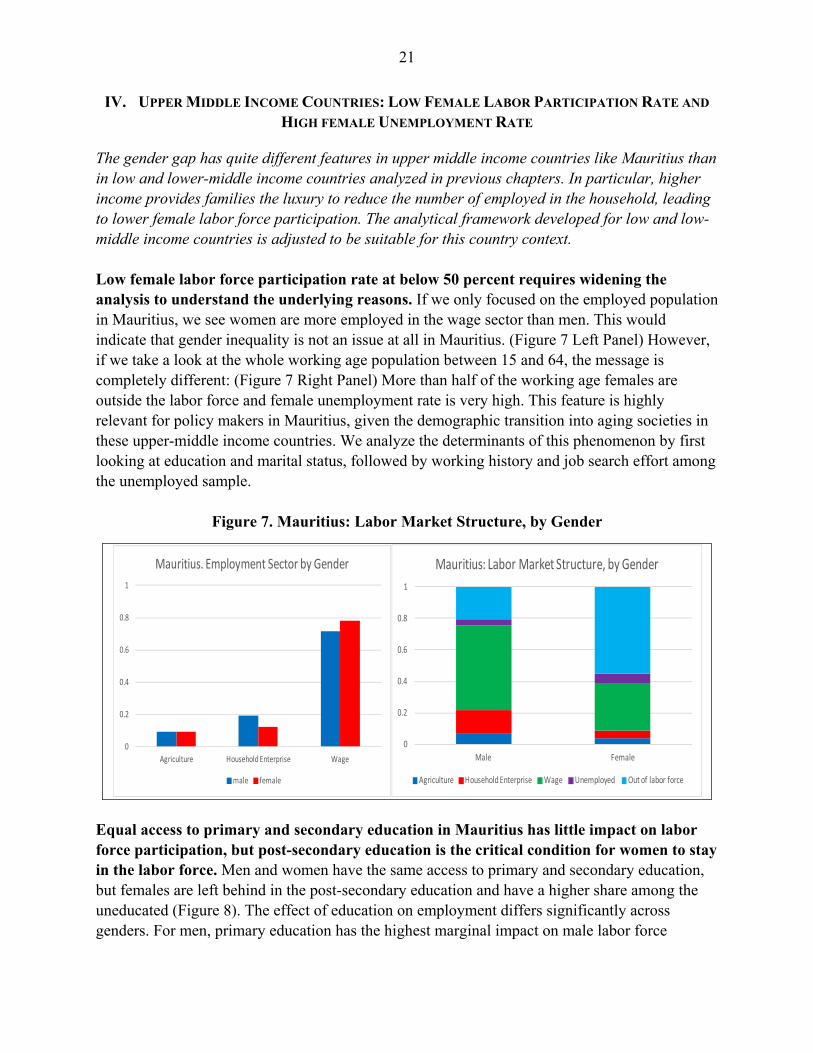
The gender gap has quite different features in upper middle income countries like Mauritius than in low and lower-middle income countries analyzed in previous chapters. In particular, higher income provides families the luxury to reduce the number of employed in the household, leading to lower female labor force participation. The analytical framework developed for low and low-middle income countries is adjusted to be suitable for this country context. Low female labor force participation rate at below 50 percent requires widening the analysis to understand the underlying reasons. If we only focused on the employed population in Mauritius, we see women are more employed in the wage sector than men. This would indicate that gender inequality is not an issue at all in Mauritius. (Figure 7 Left Panel) However, if we take a look at the whole working age population between 15 and 64, the message is completely different: (Figure 7 Right Panel) More than half of the working age females are outside the labor force and female unemployment rate is very high. This feature is highly relevant for policy makers in Mauritius, given the demographic transition into aging societies in these upper-middle income countries. We analyze the determinants of this phenomenon by first looking at education and marital status, followed by working history and job search effort among the unemployed sample.
Figure 7. Mauritius: Labor Market Structure, by Gender
0
0.2
0.4
0.6
0.8
1
Agriculture Household Enterprise Wage
Mauritius. Employment Sector by Gender
male female
0
0.2
0.4
0.6
0.8
1
Male Female
Mauritius: Labor Market Structure, by Gender
Agriculture Household Enterprise Wage Unemployed Out of labor force
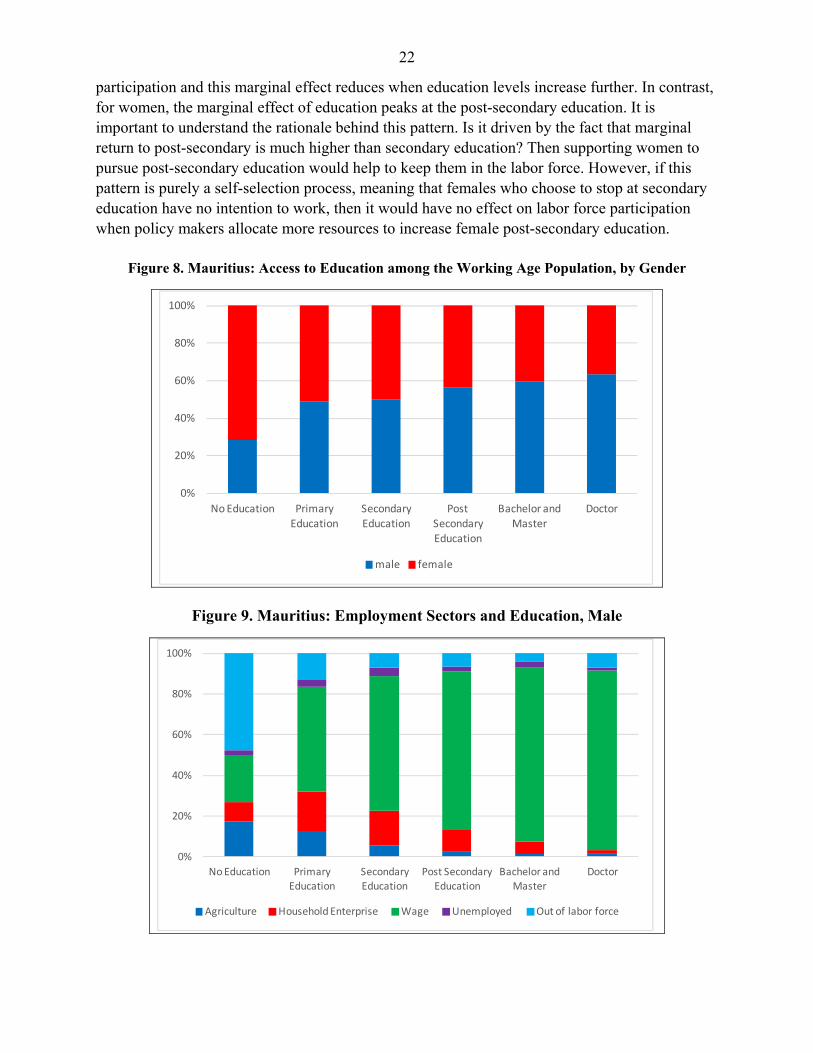
Equal access to primary and secondary education in Mauritius has little impact on labor force participation, but post-secondary education is the critical condition for women to stay in the labor force. Men and women have the same access to primary and secondary education, but females are left behind in the post-secondary education and have a higher share among the uneducated (Figure 8). The effect of education on employment differs significantly across genders. For men, primary education has the highest marginal impact on male labor force
22
participation and this marginal effect reduces when education levels increase further. In contrast, for women, the marginal effect of education peaks at the post-secondary education. It is important to understand the rationale behind this pattern. Is it driven by the fact that marginal return to post-secondary is much higher than secondary education? Then supporting women to pursue post-secondary education would help to keep them in the labor force. However, if this pattern is purely a self-selection process, meaning that females who choose to stop at secondary education have no intention to work, then it would have no effect on labor force participation when policy makers allocate more resources to increase female post-secondary education.
Figure 8. Mauritius: Access to Education among the Working Age Population, by Gender
0%
20%
40%
60%
80%
100%
No Education Primary Education
Secondary Education
Post Secondary Education
Bachelor and Master
Doctor
male female
Figure 9. Mauritius: Employment Sectors and Education, Male
0%
20%
40%
60%
80%
100%
No Education Primary Education
Secondary Education
Post Secondary Education
Bachelor and Master
Doctor
Agriculture Household Enterprise Wage Unemployed Out of labor force
23
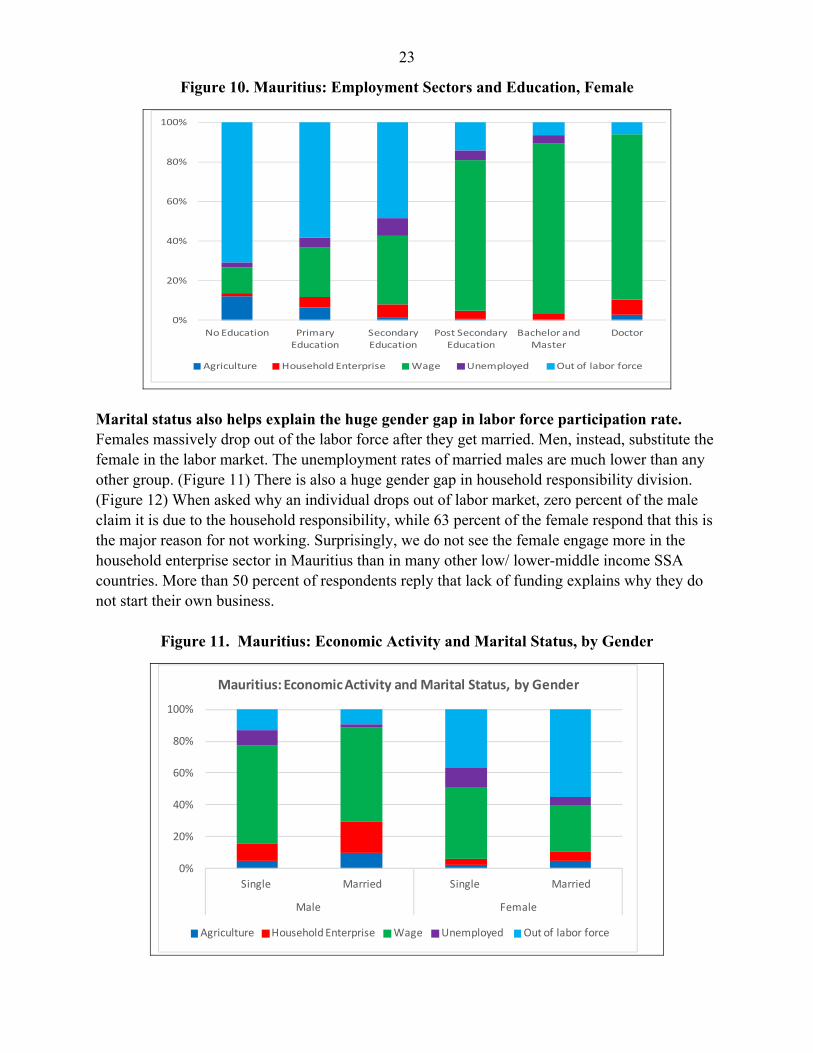
Figure 10. Mauritius: Employment Sectors and Education, Female
0%
20%
40%
60%
80%
100%
No Education Primary Education
Secondary Education
Post Secondary Education
Bachelor and Master
Doctor
Agriculture Household Enterprise Wage Unemployed Out of labor force
Marital status also helps explain the huge gender gap in labor force participation rate. Females massively drop out of the labor force after they get married. Men, instead, substitute the female in the labor market. The unemployment rates of married males are much lower than any other group. (Figure 11) There is also a huge gender gap in household responsibility division. (Figure 12) When asked why an individual drops out of labor market, zero percent of the male claim it is due to the household responsibility, while 63 percent of the female respond that this is the major reason for not working. Surprisingly, we do not see the female engage more in the household enterprise sector in Mauritius than in many other low/ lower-middle income SSA countries. More than 50 percent of respondents reply that lack of funding explains why they do not start their own business.
Figure 11. Mauritius: Economic Activity and Marital Status, by Gender
0%
20%
40%
60%
80%
100%
Single Married Single Married
Male Female
Mauritius: Economic Activity and Marital Status, by Gender
Agriculture Household Enterprise Wage Unemployed Out of labor force
24
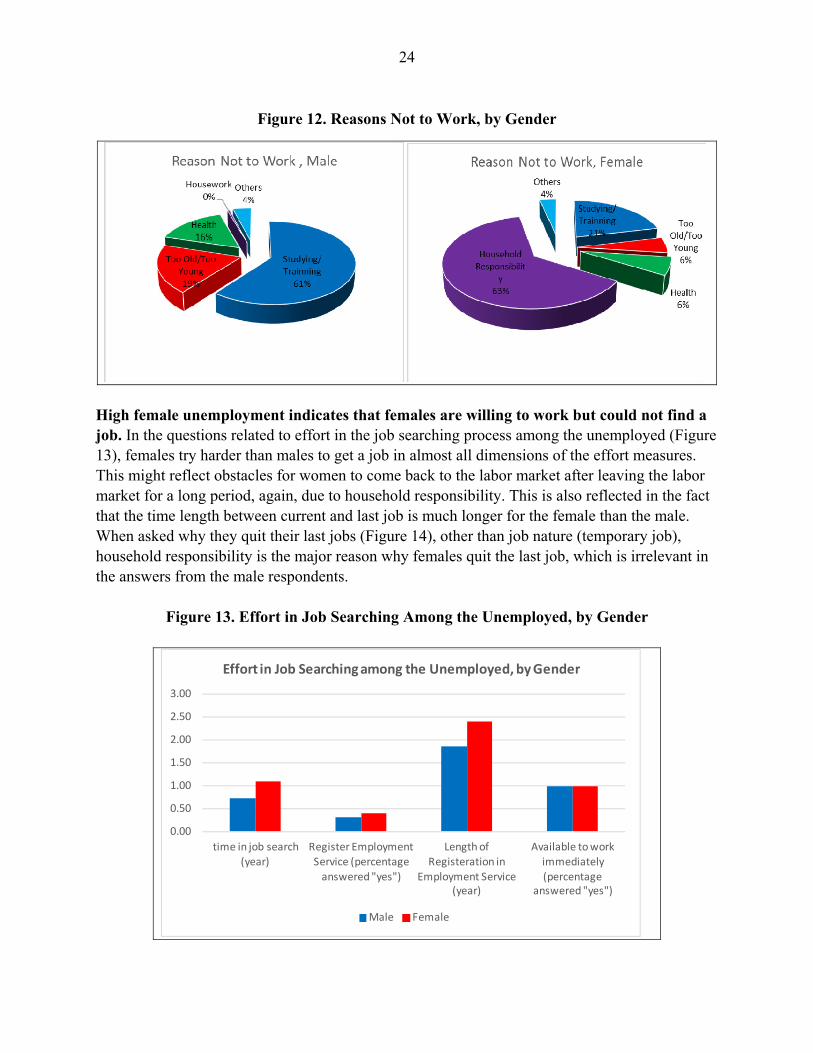
Figure 12. Reasons Not to Work, by Gender
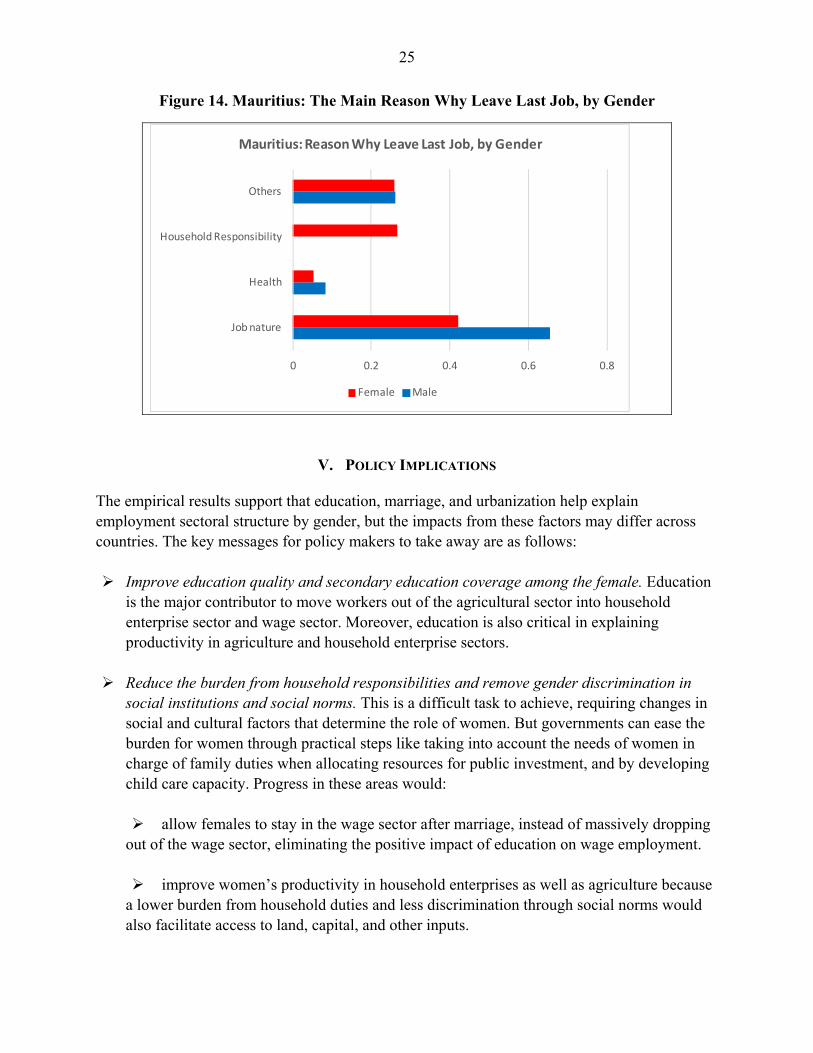
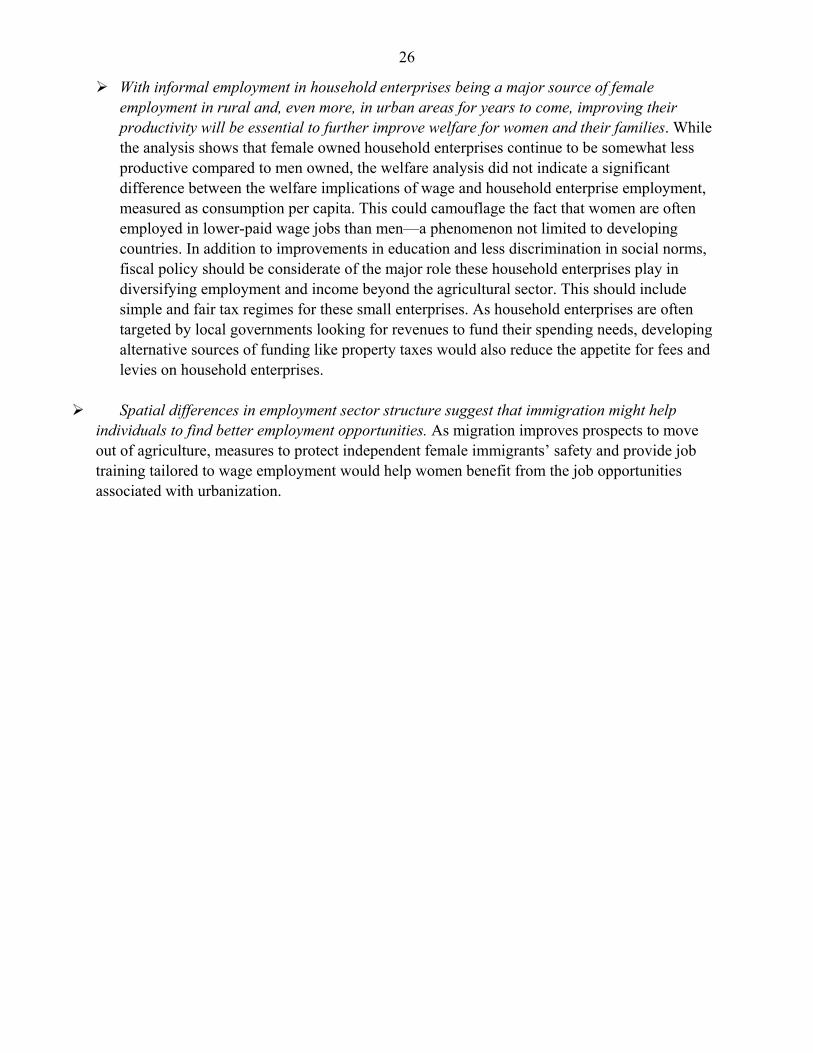
High female unemployment indicates that females are willing to work but could not find a job. In the questions related to effort in the job searching process among the unemployed (Figure 13), females try harder than males to get a job in almost all dimensions of the effort measures. This might reflect obstacles for women to come back to the labor market after leaving the labor market for a long period, again, due to household responsibility. This is also reflected in the fact that the time length between current and last job is much longer for the female than the male. When asked why they quit their last jobs (Figure 14), other than job nature (temporary job), household responsibility is the major reason why females quit the last job, which is irrelevant in the answers from the male respondents.
Figure 13. Effort in Job Searching Among the Unemployed, by Gender
0.00
0.50
1.00
1.50
2.00
2.50
3.00
time in job search (year)
Register Employment Service (percentage
answered "yes")
Length of Registeration in
Employment Service (year)
Available to work immediately
(percentage answered "yes")
Effort in Job Searching among the Unemployed, by Gender
Male Female
25
Figure 14. Mauritius: The Main Reason Why Leave Last Job, by Gender
0 0.2 0.4 0.6 0.8
Job nature
Health
Household Responsibility
Others
Mauritius: Reason Why Leave Last Job, by Gender
Female Male
V. POLICY IMPLICATIONS
The empirical results support that education, marriage, and urbanization help explain employment sectoral structure by gender, but the impacts from these factors may differ across countries. The key messages for policy makers to take away are as follows: Improve education quality and secondary education coverage among the female. Education
is the major contributor to move workers out of the agricultural sector into household enterprise sector and wage sector. Moreover, education is also critical in explaining productivity in agriculture and household enterprise sectors.
Reduce the burden from household responsibilities and remove gender discrimination in
social institutions and social norms. This is a difficult task to achieve, requiring changes in social and cultural factors that determine the role of women. But governments can ease the burden for women through practical steps like taking into account the needs of women in charge of family duties when allocating resources for public investment, and by developing child care capacity. Progress in these areas would: allow females to stay in the wage sector after marriage, instead of massively dropping
out of the wage sector, eliminating the positive impact of education on wage employment. improve women’s productivity in household enterprises as well as agriculture because
a lower burden from household duties and less discrimination through social norms would also facilitate access to land, capital, and other inputs.
26
With informal employment in household enterprises being a major source of female employment in rural and, even more, in urban areas for years to come, improving their productivity will be essential to further improve welfare for women and their families. While the analysis shows that female owned household enterprises continue to be somewhat less productive compared to men owned, the welfare analysis did not indicate a significant difference between the welfare implications of wage and household enterprise employment, measured as consumption per capita. This could camouflage the fact that women are often employed in lower-paid wage jobs than men—a phenomenon not limited to developing countries. In addition to improvements in education and less discrimination in social norms, fiscal policy should be considerate of the major role these household enterprises play in diversifying employment and income beyond the agricultural sector. This should include simple and fair tax regimes for these small enterprises. As household enterprises are often targeted by local governments looking for revenues to fund their spending needs, developing alternative sources of funding like property taxes would also reduce the appetite for fees and levies on household enterprises.
Spatial differences in employment sector structure suggest that immigration might help
individuals to find better employment opportunities. As migration improves prospects to move out of agriculture, measures to protect independent female immigrants’ safety and provide job training tailored to wage employment would help women benefit from the job opportunities associated with urbanization.
27
REFERENCES
Adeniyi, L. (2010). Women Farmer’s and Agriculture Growth: Challenge and Perspective for Africa face the economic crisis. Poster presented at the joint, 3.
Akresh, R. 2005. “Understanding Pareto Inefficient Intrahousehold Allocations.” IZA Discussion Paper No. 1858. Institute for the Study of Labor (IZA), Bonn, Germany.
Adepoju, A. (2008). Migration and social policy in sub-Saharan Africa. IOM–International Organization for Migration. Geneva, Switzerland.
Bastagli, F., Coady, D., & Gupta, S. (2012). Income inequality and fiscal policy (No. 12/08R). International Monetary Fund.
Berg, A., & Ostry, J. (2011). Inequality and Unstable Growth: Two Sides of the Same Coin? IMF Staff Discussion Note, IMF, http://imf.org/external/pubs/ft/sdn/2011/sdn1108.pdf.
Anyanwu, J. C., & Augustine, D. (2013). Gender Equality in Employment in Africa: Empirical Analysis and Policy Implications. African Development Review, 25(4), 400-420.
Croppenstedt, A., Goldstein, M., & Rosas, N. (2013). Gender and agriculture: Inefficiencies, segregation, and low productivity traps. The World Bank Research Observer, lks024.
Elborgh-Woytek, M. K., Newiak, M. M., Kochhar, M. K., Fabrizio, M. S., Kpodar, K., Wingender, M. P. et al. & Schwartz, M. G. (2013). Women, Work, and the Economy: Macroeconomic Gains from Gender Equity. International Monetary Fund.
Filmer, D., & Fox, L. (2014). Youth employment in sub-Saharan Africa. World Bank Publications.
Fox, L., Haines, C., Muñoz, J. H., & Thomas, A. H. (2013). Africa's Got Work to Do: Employment Prospects in the New Century.
Fox, L., & Sohnesen, T. P. (2012). Household enterprises in Sub-Saharan Africa: Why they matter for growth, jobs, and livelihoods. World Bank Policy Research Working Paper, (6184).
Goldstein, M., and Udry C. (2008). “The Profits of Power: Land Rights and Agricultural Investment in Ghana.” Journal of Political Economy 116 (6):981–1022.Gonzales, M. C., Jain-Chandra, S., Kochhar, M. K., & Newiak, M. M. (2015).Fair Play: More Equal Laws Boost Female Labor Force Participation. International Monetary Fund.Horrell, S., and P. Krishnan. 2007. “Poverty and Productivity in Female-Headed Households in Zimbabwe.” Journal of Development Studies 43 (8): 1351–80.
Lastarria-Cornhiel, S. (2008). Feminization of agriculture: Trends and driving forces.
Luci, A., Jütting, J., & Morrisson, C. (2012). Why Do So Many Women End Up in ‘Bad Jobs’ ? A Cross-country Assessment for Developing Countries. European Journal of Development Research, 24(4), 530-549.
Masterson, T. 2007. “Female Land Rights, Crop Specialization, and Productivity in Paraguayan Agriculture.” Working Paper 504. The Levy Economics Institute of Bard College, Annandale-onHudson, NY.
McCaig, B., & Pavcnik, N. (2015). Informal employment in a growing and globalizing low-income country (No. w20891). National Bureau of Economic Research.
28
Mendola, M. (2007). Agricultural technology adoption and poverty reduction: A propensity-score matching analysis for rural Bangladesh. Food policy, 32(3), 372-393.
Ostry, M. J. D., Berg, M. A., & Tsangarides, M. C. G. (2014). Redistribution, inequality, and growth. International Monetary Fund.
Quisumbing, A. R., & Pandolfelli, L. (2010). Promising approaches to address the needs of poor female farmers: Resources, constraints, and interventions. World Development, 38(4), 581-592.
Seguino, S., & Were, M. (2014). Gender, Development and Economic Growth in Sub-Saharan Africa. Journal of African Economies, 23(suppl 1), i18-i61.
Stotsky, J. G. (2006). Gender and its relevance to macroeconomic policy: A survey. IMF Working Papers, 1-68.
Stotsky, J. G. (2007). Budgeting with women in mind. Finance and Development, 44(2), 12.
Taiwo, O. (2013). Employment choice and mobility in multi‐sector labour markets: Theoretical model and evidence from Ghana. International Labour Review, 152(3-4), 469-492.
Tiruneh, A., T. Tesfaye, W. Mwangi, and H. Verkuijl. 2001. Gender Differentials in Agricultural Production and Decision-Making among Smallholders in Ada, Lume and Gimbichu Woredas of the Central Highlands of Ethiopia. El Baton, Mexico: International Maize and Wheat Improvement Center (CIMMYT) and Ethiopian Research Organization (EARO).
Udry, C. 1996. “Gender, Agricultural Production, and the Theory of the Household.” Journal of Political Economy 104 (5):1010– 46.
Udry, C., J. Hoddinott, H. Alderman, and L. Haddad. 1995. “Gender Differentials in Farm Productivity: Implications for Household Efficiency and Agricultural Policy.” Food Policy 20 (5): 407–23.
Vanek, J., Chen, M. A., Carré, F., Heintz, J., & Hussmanns, R. (2014). Statistics on the Informal Economy: Definitions, Regional Estimates and Challenges. Working Informal migrant Entrepreneurship and Inclusive Growth Migration Policy Series, (68).
Whitehead, A. (2009). The gendered impacts of liberalization policies on African agricultural economies and rural livelihoods. The gendered impacts of liberalization: towards ‘embedded’ liberalism.
World Bank Database on Urban Population, World Bank, 2014.