Embed Size (px)
Citation preview
Women’s Health and Newborn
Annual Report2017-2018
Acknowledgements
The following people are acknowledged for their contribution to this report:
Amanda Hinks – Service Development Manager, Child Youth and Maternity (CYM)
Andrea O’Brien – Data Analyst, Health Intelligence and Informatics
Ann Konz – Associate Clinical Charge Midwife, Birthing & Assessment
Dr Ann Sears – Public Health Physician
Anna Hawkins – Interim Clinical Coordinator of Perinatal, Services Maternal Mental Health
Bev Pownall – Team Leader, Lactation Support Services
Carmel Ellis – General Manager, Integrated Child, Youth and Maternity
Caroline Conroy – CM Health Employed Midwife, MERAS Representative
Celeste Stark – Photographer
Dr Charlotte Farrant – Birthing and Assessment Medical Lead
Cindy Blackwell – Improvement Advisor, Ko Awatea
Claire Eyes – Community LMC midwife, Franklin Representative
Claudelle Pillay – Immunisation Nurse Leader
Corinne Tan – Photographer & Multimedia Designer
Dr Christine McIntosh – General Practitioner Liaison
Debra Fenton – Maternity Service Manager
Debbie Davies – Perinatal Loss Midwife Specialist
Dean Papaconstantinou – Data Analyst-Population Health Team
Donna Ritchie – Community LMC Midwife Liaison
Dr Elza Cloete – Healthy Heart Neonatal Pulse Oximetry Screening Trial Lead
Hayley Gill – Maternity Clinical Information System Clinical Midwife Specialist
Heather Muriwai – Te Rito Ora Programme Co-ordinator
Dr Honor Day – Obstetrics and Gynaecology Registrar
Isabella Smart – Midwife Manager, Community Midwifery Service
Jennifer Schroder – Associate Clinical, Midwife Manager
Joyce Cowan – NZ GAP Lead Educator, Midwife
Judith Couch – CM Health Employed Midwife, NZNA Representative
Judy Graham – Specialist Diabetes Midwife
Dr Jyoti Kathuria – Lead Colposcopist
Dr Kara Okesene-Gafa – Obstetrician and Gynaecologist, Senior
Lecturer University of Auckland
Katarina Komene – Acting Community LMC Midwife Liaison
Dr Katherine Sowden – Clinical Lead Gynaecology, Women's Health
Kathy Ogilvy – Professional Development Team Lead, Women’s Health and Kidz First
Katie Ferguson – District Wide Team Manager, Mental Health Services
Kirby Rainbow – Associate Clinical Charge Midwife, B&A
Leigh Henderson – Workforce Development Manager, Maaori Health
Dr Lesa Freeman – Clinical Quality and Risk Manager, Kidz First and Women’s Health
Dr Lindsay Mildenhall – Clinical Lead, Neonates
Lyn Stark – Maternity Quality and Safety Co-ordinator
Lynn Austerberry – Charge Midwife Manager, Pukekohe Birthing Unit
Dr Maisie Wong – Neonatologist
Fepulea’i Margie Apa – Chief Executive Officer
Maya Bachu – Nurse Colposcopist
Megan McCowan – Team Leader, Start Well Māngere
Michelle Lee – Smokefree Advisor, Maternity
Ngatepaeru Marsters – Pasifika Midwifery Liaison and Student Support, AUT
Nettie Knetsch – General Manager, Kidz First and Women’s Health
Niccy Brougham – Nurse Manager
Dr Pip Anderson – Public Health Physician
Pippa Van Paauwe – Service Development Manager, Child Health
Paula Sole – Business Implementation Manager
Paula Taylor – Manager, Stakeholder & Community Communications
Raewyn Makea – PA/Secretary Maternity Services
Dr Renuka Bhat – Clinical Lead, Fetal Medicine
Sanne Wesseling – Midwifery Co-ordinator, New Graduate Programme
Sarah Taane – Senior Communications Advisor
Dr Sarah Tout – Clinical Director, Women’s Health
Sharon Arrol – Data Analyst, Health Intelligence and Informatics
Dr Sue Tutty – General Practitioner Liaison
Thelma Thompson – Director of Midwifery
CM Health would like to thank all the people whose photos have featured in this report including:
The Owen, Chiong, Smith, Tutunoa, Komene, Luk, Reddy, Rashleigh and Enoka Papalii families/whaanau
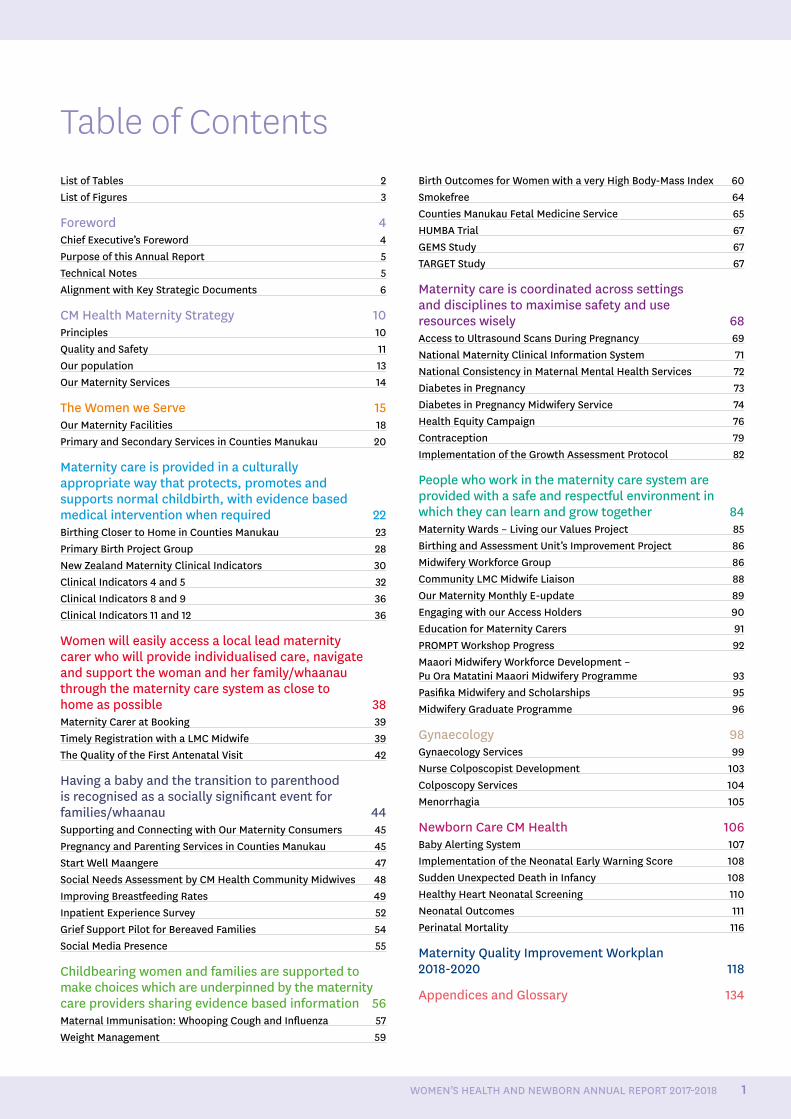
Table of ContentsList of Tables 2List of Figures 3
Foreword 4Chief Executive’s Foreword 4Purpose of this Annual Report 5Technical Notes 5Alignment with Key Strategic Documents 6
CM Health Maternity Strategy 10Principles 10Quality and Safety 11Our population 13Our Maternity Services 14
The Women we Serve 15Our Maternity Facilities 18Primary and Secondary Services in Counties Manukau 20
Maternity care is provided in a culturally appropriate way that protects, promotes and supports normal childbirth, with evidence based medical intervention when required 22Birthing Closer to Home in Counties Manukau 23Primary Birth Project Group 28New Zealand Maternity Clinical Indicators 30Clinical Indicators 4 and 5 32Clinical Indicators 8 and 9 36Clinical Indicators 11 and 12 36
Women will easily access a local lead maternity carer who will provide individualised care, navigate and support the woman and her family/whaanau through the maternity care system as close to home as possible 38Maternity Carer at Booking 39Timely Registration with a LMC Midwife 39The Quality of the First Antenatal Visit 42
Having a baby and the transition to parenthood is recognised as a socially significant event for families/whaanau 44Supporting and Connecting with Our Maternity Consumers 45Pregnancy and Parenting Services in Counties Manukau 45Start Well Maangere 47Social Needs Assessment by CM Health Community Midwives 48Improving Breastfeeding Rates 49Inpatient Experience Survey 52Grief Support Pilot for Bereaved Families 54Social Media Presence 55
Childbearing women and families are supported to make choices which are underpinned by the maternity care providers sharing evidence based information 56Maternal Immunisation: Whooping Cough and Influenza 57Weight Management 59
Birth Outcomes for Women with a very High Body-Mass Index 60Smokefree 64Counties Manukau Fetal Medicine Service 65HUMBA Trial 67GEMS Study 67TARGET Study 67
Maternity care is coordinated across settings and disciplines to maximise safety and use resources wisely 68Access to Ultrasound Scans During Pregnancy 69National Maternity Clinical Information System 71National Consistency in Maternal Mental Health Services 72Diabetes in Pregnancy 73Diabetes in Pregnancy Midwifery Service 74Health Equity Campaign 76Contraception 79Implementation of the Growth Assessment Protocol 82
People who work in the maternity care system are provided with a safe and respectful environment in which they can learn and grow together 84Maternity Wards – Living our Values Project 85Birthing and Assessment Unit’s Improvement Project 86Midwifery Workforce Group 86Community LMC Midwife Liaison 88Our Maternity Monthly E-update 89Engaging with our Access Holders 90Education for Maternity Carers 91PROMPT Workshop Progress 92Maaori Midwifery Workforce Development – Pu Ora Matatini Maaori Midwifery Programme 93Pasifika Midwifery and Scholarships 95Midwifery Graduate Programme 96
Gynaecology 98Gynaecology Services 99Nurse Colposcopist Development 103Colposcopy Services 104Menorrhagia 105
Newborn Care CM Health 106Baby Alerting System 107Implementation of the Neonatal Early Warning Score 108Sudden Unexpected Death in Infancy 108Healthy Heart Neonatal Screening 110Neonatal Outcomes 111Perinatal Mortality 116
Maternity Quality Improvement Workplan 2018-2020 118
Appendices and Glossary 134
WOMEN’S HEALTH AND NEWBORN ANNUAL REPORT 2017-2018 1
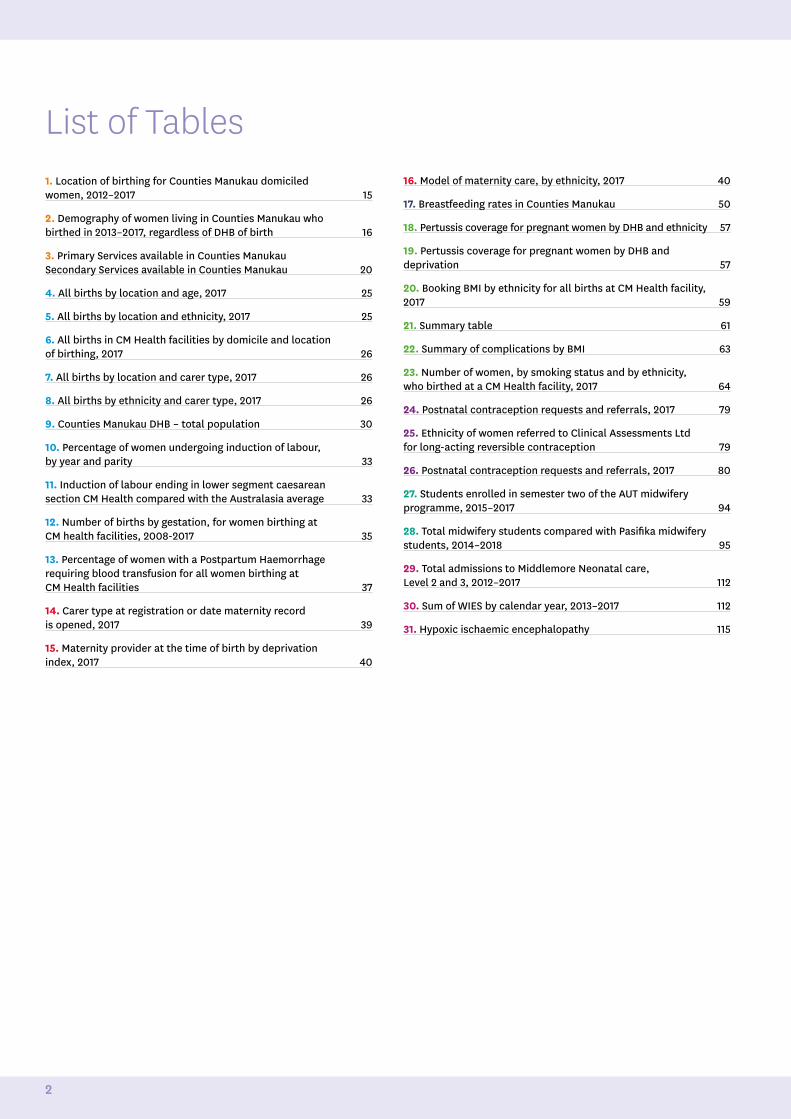
List of Tables1. Location of birthing for Counties Manukau domiciled women, 2012–2017 15
2. Demography of women living in Counties Manukau who birthed in 2013–2017, regardless of DHB of birth 16
3. Primary Services available in Counties Manukau Secondary Services available in Counties Manukau 20
4. All births by location and age, 2017 25
5. All births by location and ethnicity, 2017 25
6. All births in CM Health facilities by domicile and location of birthing, 2017 26
7. All births by location and carer type, 2017 26
8. All births by ethnicity and carer type, 2017 26
9. Counties Manukau DHB – total population 30
10. Percentage of women undergoing induction of labour, by year and parity 33
11. Induction of labour ending in lower segment caesarean section CM Health compared with the Australasia average 33
12. Number of births by gestation, for women birthing at CM health facilities, 2008-2017 35
13. Percentage of women with a Postpartum Haemorrhage requiring blood transfusion for all women birthing at CM Health facilities 37
14. Carer type at registration or date maternity record is opened, 2017 39
15. Maternity provider at the time of birth by deprivation index, 2017 40
16. Model of maternity care, by ethnicity, 2017 40
17. Breastfeeding rates in Counties Manukau 50
18. Pertussis coverage for pregnant women by DHB and ethnicity 57
19. Pertussis coverage for pregnant women by DHB and deprivation 57
20. Booking BMI by ethnicity for all births at CM Health facility, 2017 59
21. Summary table 61
22. Summary of complications by BMI 63
23. Number of women, by smoking status and by ethnicity, who birthed at a CM Health facility, 2017 64
24. Postnatal contraception requests and referrals, 2017 79
25. Ethnicity of women referred to Clinical Assessments Ltd for long-acting reversible contraception 79
26. Postnatal contraception requests and referrals, 2017 80
27. Students enrolled in semester two of the AUT midwifery programme, 2015–2017 94
28. Total midwifery students compared with Pasifika midwifery students, 2014–2018 95
29. Total admissions to Middlemore Neonatal care, Level 2 and 3, 2012–2017 112
30. Sum of WIES by calendar year, 2013–2017 112
31. Hypoxic ischaemic encephalopathy 115
2
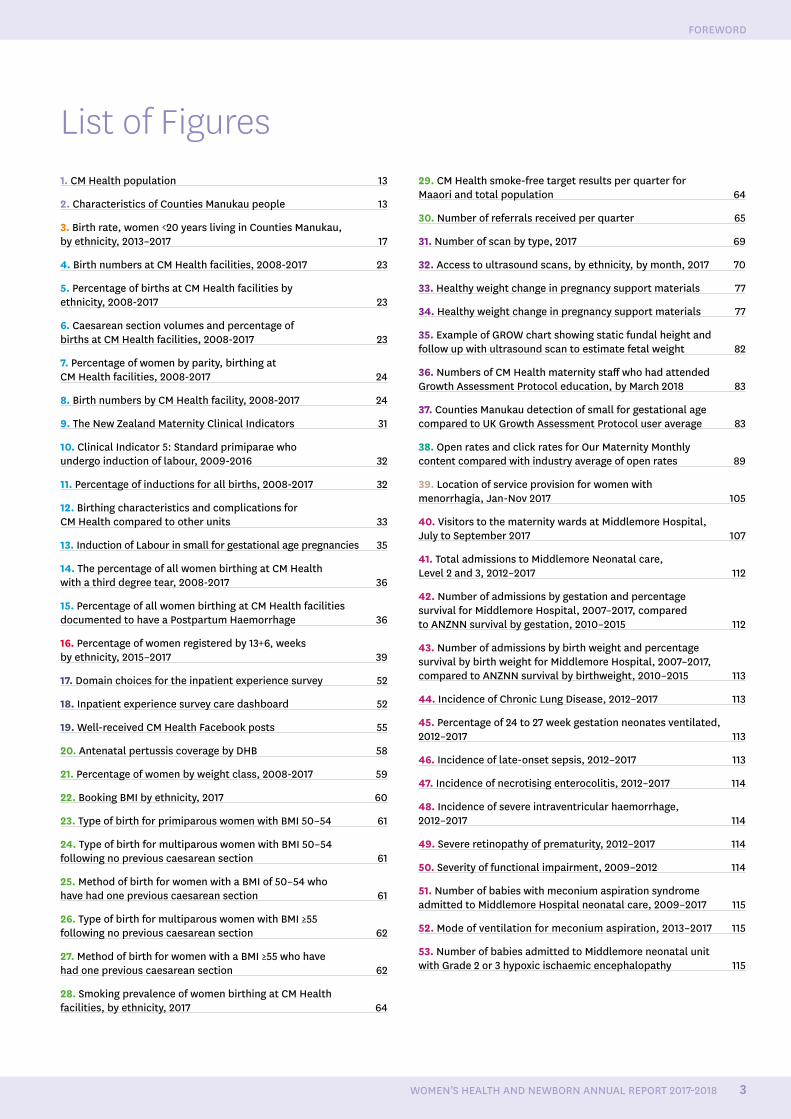
List of Figures1. CM Health population 13
2. Characteristics of Counties Manukau people 13
3. Birth rate, women <20 years living in Counties Manukau, by ethnicity, 2013–2017 17
4. Birth numbers at CM Health facilities, 2008-2017 23
5. Percentage of births at CM Health facilities by ethnicity, 2008-2017 23
6. Caesarean section volumes and percentage of births at CM Health facilities, 2008-2017 23
7. Percentage of women by parity, birthing at CM Health facilities, 2008-2017 24
8. Birth numbers by CM Health facility, 2008-2017 24
9. The New Zealand Maternity Clinical Indicators 31
10. Clinical Indicator 5: Standard primiparae who undergo induction of labour, 2009-2016 32
11. Percentage of inductions for all births, 2008-2017 32
12. Birthing characteristics and complications for CM Health compared to other units 33
13. Induction of Labour in small for gestational age pregnancies 35
14. The percentage of all women birthing at CM Health with a third degree tear, 2008-2017 36
15. Percentage of all women birthing at CM Health facilities documented to have a Postpartum Haemorrhage 36
16. Percentage of women registered by 13+6, weeks by ethnicity, 2015–2017 39
17. Domain choices for the inpatient experience survey 52
18. Inpatient experience survey care dashboard 52
19. Well-received CM Health Facebook posts 55
20. Antenatal pertussis coverage by DHB 58
21. Percentage of women by weight class, 2008-2017 59
22. Booking BMI by ethnicity, 2017 60
23. Type of birth for primiparous women with BMI 50–54 61
24. Type of birth for multiparous women with BMI 50–54 following no previous caesarean section 61
25. Method of birth for women with a BMI of 50–54 who have had one previous caesarean section 61
26. Type of birth for multiparous women with BMI ≥55 following no previous caesarean section 62
27. Method of birth for women with a BMI ≥55 who have had one previous caesarean section 62
28. Smoking prevalence of women birthing at CM Health facilities, by ethnicity, 2017 64
29. CM Health smoke-free target results per quarter for Maaori and total population 64
30. Number of referrals received per quarter 65
31. Number of scan by type, 2017 69
32. Access to ultrasound scans, by ethnicity, by month, 2017 70
33. Healthy weight change in pregnancy support materials 77
34. Healthy weight change in pregnancy support materials 77
35. Example of GROW chart showing static fundal height and follow up with ultrasound scan to estimate fetal weight 82
36. Numbers of CM Health maternity staff who had attended Growth Assessment Protocol education, by March 2018 83
37. Counties Manukau detection of small for gestational age compared to UK Growth Assessment Protocol user average 83
38. Open rates and click rates for Our Maternity Monthly content compared with industry average of open rates 89
39. Location of service provision for women with menorrhagia, Jan-Nov 2017 105
40. Visitors to the maternity wards at Middlemore Hospital, July to September 2017 107
41. Total admissions to Middlemore Neonatal care, Level 2 and 3, 2012–2017 112
42. Number of admissions by gestation and percentage survival for Middlemore Hospital, 2007–2017, compared to ANZNN survival by gestation, 2010–2015 112
43. Number of admissions by birth weight and percentage survival by birth weight for Middlemore Hospital, 2007–2017, compared to ANZNN survival by birthweight, 2010–2015 113
44. Incidence of Chronic Lung Disease, 2012–2017 113
45. Percentage of 24 to 27 week gestation neonates ventilated, 2012–2017 113
46. Incidence of late-onset sepsis, 2012–2017 113
47. Incidence of necrotising enterocolitis, 2012–2017 114
48. Incidence of severe intraventricular haemorrhage, 2012–2017 114
49. Severe retinopathy of prematurity, 2012–2017 114
50. Severity of functional impairment, 2009–2012 114
51. Number of babies with meconium aspiration syndrome admitted to Middlemore Hospital neonatal care, 2009–2017 115
52. Mode of ventilation for meconium aspiration, 2013–2017 115
53. Number of babies admitted to Middlemore neonatal unit with Grade 2 or 3 hypoxic ischaemic encephalopathy 115
FOREWORD
WOMEN’S HEALTH AND NEWBORN ANNUAL REPORT 2017-2018 3
Counties Manukau Health (CM Health) is pleased to provide the Women’s Health and Newborn Annual Report for the 2017/2018 financial year.
I can’t emphasise enough the importance of women’s health and the health of newborns to the future of our communities. Improving the health of women and the health of newborn infants is an investment in the future health and wellbeing of our whanau and our populations. Once again, we are proud to present the Women’s Health and Newborn Annual Report 2017/2018. This report report recognises the significant work that our maternity services, both hospital and community based, have done to support the health of women living in the Counties Manukau district and their whaanau. Of note, as women are able to choose where they give birth, we therefore provide care for some women residing outside the DHBs area and some women living in Counties Manukau are cared for elsewhere.
The activities described in the report also align with the CM Health Maaori Action Health Plan and the New Zealand Maternity Standards. We continue to strengthen our efforts to improve the health of women living in Counties Manukau by identifying and acting on opportunities to achieve better outcomes that meet their needs.
Some highlights from the report that demonstrate areas where CM Health has improved access to services and had a positive impact on women are:
• continuing to improve access to long-acting reversible contraception
• supporting women in financial hardship with the co-payments for ultrasound scans, thereby ensuring that small for gestational age (SGA) babies are monitored in accordance with the national guideline.
In addition, we have retained the user-friendly design of this report as readers have told us they find it engaging and accessible, and it is relevant to key stakeholders, including district health board (DHB) staff, community lead maternity carer (LMC) midwives, general practitioners (GPs), and
women and whaanau who work, live, and birth in Counties Manukau. The report was publicly launched in October 2018, and is available on Paanui (the CM Health intranet website) and the CM Health website.
I would like to thank the Maternity Quality and Safety Governance Group and our entire workforce colleagues – Women’s Health team who work within Middlemore Hospital, the Manukau SuperClinic and in the primary birthing units, DHB and community LMC midwifery workforces based in communities. Your dedication and contribution to ensuring that Counties Manukau women and whaanau are given the best possible care is greatly valued.
The work described in this report is an important contribution to improving equity. CM Health remains committed to the needs of our community and strives to provide appropriate, accessible, quality clinical care to our women, babies and whaanau.
Fepulea’i Margie Apa Chief Executive Officer
Foreword
Chief Executive’s Foreword
4
Purpose of this Annual ReportThe purpose of the CM Health’s Women’s Health and Newborn Annual Report 2017/2018 is to:
• describe the population we serve
• provide information about the quality improvement work underway in the Counties Manukau area for women living and birthing in our district
• provide information about the maternity workforce, including quality improvement work relating to this workforce that is underway in Counties Manukau
• describe the work we do, and provide examples of quality initiatives and outcomes
• document CM Health’s progress towards achieving the Maternity Quality and Safety Programme Work Plan deliverables in 2017/2018
• describe the work planned to improve the quality and safety of maternity services to be delivered in 2018/2019
• benchmark our performance against the New Zealand Maternity Clinical Indicators
• describe the work underway to address the priorities identified by the Perinatal and Maternal Mortality Review Committee and the National Maternity Monitoring Group
• provide the Ministry of Health with the contractually required information, as set out in Section 2 of the Maternity Quality and Safety Programme Crown Funding Agreement Variation.
Technical NotesThrough the CM Health Women’s Health and Newborn Annual Report data are used from a number of sources and are provided for different populations.
The report essentially provides two views; that of the domiciled population (those women that live in Counties Manukau Health area) and the provider arm view (the population to whom CM Health facilities provides service to regardless of where those people live). Different data sources provide information about these two populations. Some of those data sources can provide both views i.e. a domicile and
provider arm view while some can only provide a provider arm view. The majority of data is presented for the 2017 calendar year.
Data Sources used in the report The National Minimum Dataset (NMDS) is maintained by the Ministry of Health and is a national collection of publicly funded hospital discharge information, including clinical information, for inpatients and day patients. All hospital admissions during pregnancy are captured in this dataset, and birth events are recorded for both mothers and infants. It should be noted the district level analysis only captures births that occur in hospital (Z37); therefore homebirths and births that occur before arrival at hospital (e.g. in a car or ambulance) are not captured. This can provide a domicile or facilities view.
The National Maternity Collection (MAT) data is derived from the National Minimum Data Set (NMDS), LMC claims for services provided under the Primary Maternity Services Notice, as well as data from Births, Deaths and Marriages collected by the Department of Internal Affairs. This is able to provide both a facilities and domicile view although there are limitations of the variables available for women receiving care from CM Health services compared to community LMC midwives1.
The Maternity Clinical Information System (MCIS) data, in conjunction with CostPro and ICD10 diagnosis and procedure codes are provided from our Health Intelligence and Informatics team and this provides information for women accessing CM Health facilities (facility view).
The Clinical Indicator data are collated by the Ministry of Health. This information is presented as both Domicile, which relates to all women living in the CM Health district, or the Middlemore Hospital facility view.
Health Roundtable (HRT) produces a suite of customised briefing reports to assist in finding improvement opportunities by benchmarking across Australasian hospitals. The report provides an overview of maternity activity and performance and is based on the Casemix data and supplemented by the parity and neonate data provided by the health services. The Health Intelligence and Informatics team provide data to the maternity submission on an annual basis.
Throughout the CM Health Women’s Health and Newborn Annual Report full titles have been used rather than acronyms where ever possible for ease of reading.
1. Note that throughout this report, ‘community LMC midwife’ is the term used to describe midwives who claim funding from the Ministry of Health, through Section 88 of the New Zealand Public Health and Disability Act 2000, for their services. Other terms commonly used include ‘lead maternity carer’ or ‘LMC’, which is the equivalent to the term ‘self-employed LMC’ used in previous reports.
FOREWORD
WOMEN’S HEALTH AND NEWBORN ANNUAL REPORT 2017-2018 5
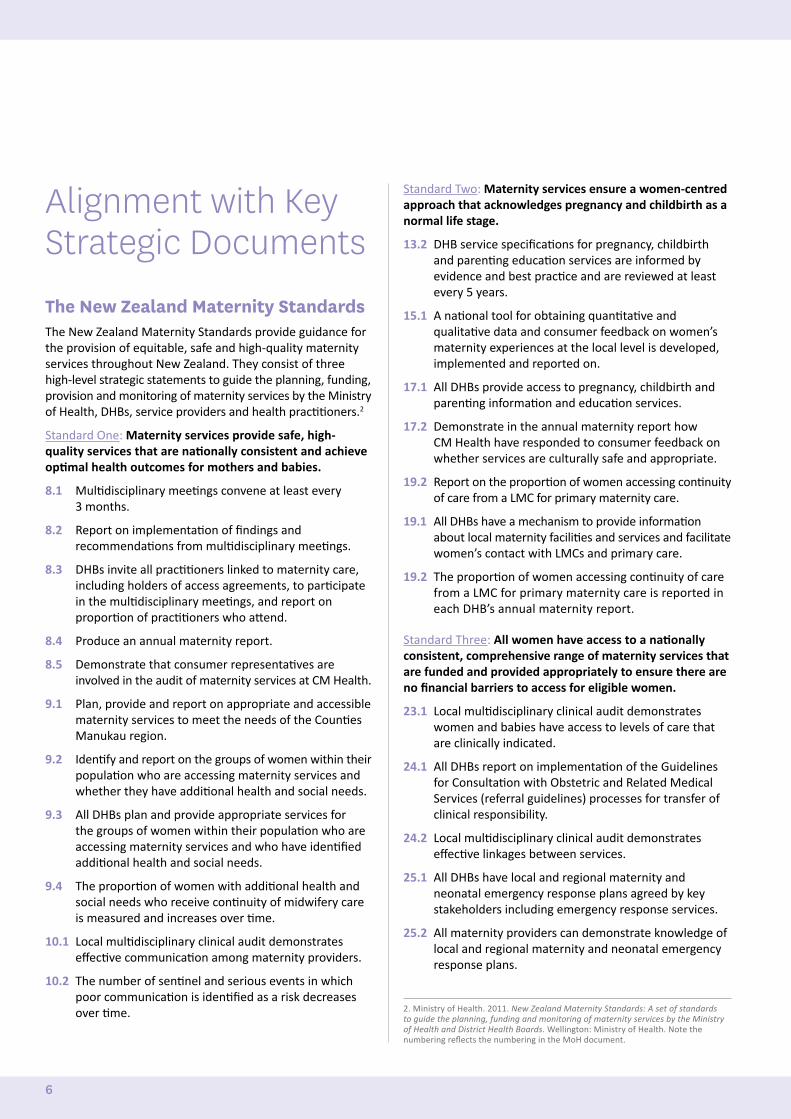
Alignment with Key Strategic DocumentsThe New Zealand Maternity StandardsThe New Zealand Maternity Standards provide guidance for the provision of equitable, safe and high-quality maternity services throughout New Zealand. They consist of three high-level strategic statements to guide the planning, funding, provision and monitoring of maternity services by the Ministry of Health, DHBs, service providers and health practitioners.2
Standard One: Maternity services provide safe, high-quality services that are nationally consistent and achieve optimal health outcomes for mothers and babies.
8.1 Multidisciplinary meetings convene at least every 3 months.
8.2 Report on implementation of findings and recommendations from multidisciplinary meetings.
8.3 DHBs invite all practitioners linked to maternity care, including holders of access agreements, to participate in the multidisciplinary meetings, and report on proportion of practitioners who attend.
8.4 Produce an annual maternity report.
8.5 Demonstrate that consumer representatives are involved in the audit of maternity services at CM Health.
9.1 Plan, provide and report on appropriate and accessible maternity services to meet the needs of the Counties Manukau region.
9.2 Identify and report on the groups of women within their population who are accessing maternity services and whether they have additional health and social needs.
9.3 All DHBs plan and provide appropriate services for the groups of women within their population who are accessing maternity services and who have identified additional health and social needs.
9.4 The proportion of women with additional health and social needs who receive continuity of midwifery care is measured and increases over time.
10.1 Local multidisciplinary clinical audit demonstrates effective communication among maternity providers.
10.2 The number of sentinel and serious events in which poor communication is identified as a risk decreases over time.
Standard Two: Maternity services ensure a women-centred approach that acknowledges pregnancy and childbirth as a normal life stage.
13.2 DHB service specifications for pregnancy, childbirth and parenting education services are informed by evidence and best practice and are reviewed at least every 5 years.
15.1 A national tool for obtaining quantitative and qualitative data and consumer feedback on women’s maternity experiences at the local level is developed, implemented and reported on.
17.1 All DHBs provide access to pregnancy, childbirth and parenting information and education services.
17.2 Demonstrate in the annual maternity report how CM Health have responded to consumer feedback on whether services are culturally safe and appropriate.
19.2 Report on the proportion of women accessing continuity of care from a LMC for primary maternity care.
19.1 All DHBs have a mechanism to provide information about local maternity facilities and services and facilitate women’s contact with LMCs and primary care.
19.2 The proportion of women accessing continuity of care from a LMC for primary maternity care is reported in each DHB’s annual maternity report.
Standard Three: All women have access to a nationally consistent, comprehensive range of maternity services that are funded and provided appropriately to ensure there are no financial barriers to access for eligible women.
23.1 Local multidisciplinary clinical audit demonstrates women and babies have access to levels of care that are clinically indicated.
24.1 All DHBs report on implementation of the Guidelines for Consultation with Obstetric and Related Medical Services (referral guidelines) processes for transfer of clinical responsibility.
24.2 Local multidisciplinary clinical audit demonstrates effective linkages between services.
25.1 All DHBs have local and regional maternity and neonatal emergency response plans agreed by key stakeholders including emergency response services.
25.2 All maternity providers can demonstrate knowledge of local and regional maternity and neonatal emergency response plans.
2. Ministry of Health. 2011. New Zealand Maternity Standards: A set of standards to guide the planning, funding and monitoring of maternity services by the Ministry of Health and District Health Boards. Wellington: Ministry of Health. Note the numbering reflects the numbering in the MoH document.
6
25.3 Local multidisciplinary clinical audit demonstrates effective communication among maternity providers in cases of clinical emergency.
26.1 All DHBs provide, or accommodate, a model of continuity of midwifery and obstetric care when secondary or tertiary services are responsible for the woman’s care.
CM Health Healthy Together Strategic Plan 2015–2020Our strategic goal3
Together, the CM Health system will work with others to achieve equity in key health indicators for Maaori, Pacific and communities with health disparities by 2020.
We will measure the impact we have on healthy life years every year. This is our commitment to act and be deliberate in our choices and priorities. This means that people will live longer healthier lives in the community.
CM Health Maaori Health PlanSection 5.1 Maatua, pepi me tamariki – parents, infants and children
The CM Health Maaori Health Plan 2017/184 focussed on improving breastfeeding rates for Maaori infants (refer to section 5.1.1 in the plan), improving immunisation coverage (refer to 5.1.2), reducing the number of babies exposed to smoking at home (refer to 5.1.3), reducing sudden unexpected death in infancy (refer to 5.1.7), and increasing the enrolment of newborn pepi with primary health organisations (refer to 5.1.8).
National Maternity Monitoring Group Recommendations 2017The following is directly quoted from the National Maternity Monitoring Group’s 5th Annual Report, as sourced at the end of this chapter.
Several things need to happen to ensure the continued improvement of maternity services in New Zealand. Many of these items reflect and will support the achievement of specific actions within the New Zealand Health Strategy. Below, we outline those areas in which we expect to see action from key maternity stakeholders.
Workforce
Staffing is an important issue that significantly impacts quality and safety. DHBs need to review basic staffing for midwifery and medical workforces, ensuring that a safe and high-quality service is supported. The workplace culture must enable staff to work collaboratively, feel safe and supported, and maternity services must be women-centred.
3. Counties Manukau District Health Board. 2016. Healthy Together Strategic Plan 2015–2020. Retrieved from http://www.countiesmanukau.health.nz/assets/About-CMH/attachments/CM-Health-Strategic-Plan-April-20164. Counties Manukau District Health Board. 2016. Maaori Health Plan 2017/18. Retrieved from http://www.countiesmanukau.health.nz/assets/About-CMH/Reports-and-planning/Maori-and-pacific-health/2017-0711-2017-18-CMHealth-Maaori-Health-Plan-FINAL
Maternity Quality and Safety Group Annual Reports
DHBs’ Maternity Quality and Safety Group Annual Reports need to be presented to a high standard, include appropriate and effective representation of data; be user-friendly/consumer focused; be publicly available; and ensure that the loops are closed between identifying an issue, responding to it and then reviewing and discussing outcomes. The reports need to include a clear response to National Maternity Monitoring Group priorities, developing quality improvement projects.
Place of birth
DHBs should support low-risk women to birth at primary facilities, and support women who choose to birth at home: the Ministry should convene a national meeting with representatives from across the sector to discuss what can be done to support low-risk women to give birth at primary facilities or at home.
Maternity clinical indicators
DHBs that have high rates of induction of labour and caesarean sections for standard primiparae should investigate why the rates of intervention for this group of women are above average.
Connecting sector leadership
All DHBs should be working towards implementing recommendations made by the Perinatal and Maternal Mortality Review Committee and its sub-committees (Maternal Mortality Working Group, Maternal Morbidity Working Group, Neonatal Encephalopathy Working Group), and the Neonatal Encephalopathy Taskforce.
Equity
Postpartum contraception options (including longacting reversible contraceptives (LARC)) should be discussed with all postpartum women. Women should be given a range of options; comprehensive information about risks and benefits; and they should have equitable access to the contraception of their choice.
Maternal mental health
DHBs should evaluate the use and effectiveness of maternal mental health pathways. Maternal mental health outcomes need to be reported, and the impact of the maternal mental health pathways need to be evaluated. Access to primary maternal mental health (including drug and alcohol addiction services) for pregnant and postpartum women should be improved to avoid unnecessary escalation to acute services.
FOREWORD
WOMEN’S HEALTH AND NEWBORN ANNUAL REPORT 2017-2018 7
The Ministry should convene a national meeting with representatives from across the sector to discuss what can be done to support maternal mental health.
Ultrasounds
The Ministry of Health should act upon the recommendations of the Maternity Ultrasound Advisory Group as soon as possible. The National Maternity Monitoring Group considers that there is value in establishing a multidisciplinary committee to support the timely and effective implementation of the Maternity Ultrasound Advisory Group’s recommendations.
Source: Page 12, National Maternity Monitoring Group. The 5th Annual Report for the National Maternity Monitoring Group 2017.
Perinatal and Maternal Mortality Review Committee Recommendations 2017The following is directly quoted from the Perinatal and Maternal Mortality Review Committee recommendations 2017, as sourced at the end of this chapter.
The Mortality Review Committees’ Maaori Caucus reiterate, “As a matter of urgency, the Ministry of Health update the National Maternity Collection (MAT), including the ethnicity data as identified by the parents in the birth registration process.” (Perinatal and Maternal Mortality Review Committee recommendation ninth report 2015).
• The Perinatal and Maternal Mortality Review Committee recommend the Ministry of Health:a. urgently require DHBs to provide complete and
accurate registration data to the MAT dataset (as required of LMCs providing services to pregnant women in order to receive funding for those services). Specifically this should include women who present for birthing at DHB facilities without previous antenatal LMC registration and women who are provided primary maternity care by DHB maternity services.
b. require that the MAT dataset include complete registration and antenatal data on live and stillborn babies from 20 weeks gestation (including terminations of pregnancy).
• The Perinatal and Maternal Mortality Review Committee investigate why there has been no reduction in neonatal mortality in New Zealand.
• The Perinatal and Maternal Mortality Review Committee supports the development of a national interdisciplinary clinical practice guideline on the indications and timing for induction of labour, to guide clinicians to offer induction when appropriate (that is, where evidence shows that benefit to mother and/or baby outweighs risk) and to avoid induction when not appropriate.
• That DHBs with rates of perinatal related mortality and neonatal encephalopathy significantly higher than the national rate review, or continue to review, the higher rate of mortality or morbidity in their area and identify areas for improvement.
• The Perinatal and Maternal Mortality Review Committee recommend the Health Quality & Safety Commission (HQSC) establish a permanent Suicide Mortality Review Committee.
• Recommendations from the Mortality Review Committees’ Maaori Caucus. Improved awareness and responsiveness to the increased risk for Maaori women Primary care (GPs, Family Planning Association), LMCs, termination of pregnancy services, alcohol and drug services, and secondary and tertiary providers of maternity, obstetric, mental health, and maternal mental health services should improve their systems, guidelines and professional development to ensure that they are responsive to the identified increased risk for Maaori women.
• Risk assessment: Comprehensive assessment of risk factors for Maaori women should be undertaken at diagnosis of pregnancy and/or on first presentation for antenatal care. This should be undertaken for all Maaori women, regardless of age, including those who are seeking termination of pregnancy.
• Managementa. Where Maaori women exhibit symptoms suggesting
serious mental illness or distress, an urgent mental health assessment, including consultant psychiatrist review and consultation with perinatal mental health services, on the same day these symptoms are first noted should be undertaken.
b. Maaori women who have a history of serious mental illness and are currently well should be referred to specialist mental health services for a mental health birth plan, and monitored closely by their maternity care provider +/- mental health services. Where such a woman has a miscarriage, the GP should be notified immediately and an explicit process for early follow up that includes a review of mental health status agreed with the GP.
c. The referring doctor of women who undergo a termination of pregnancy is expected to provide a free post-TOP follow up consultation 10-14 days after the procedure (Report of a Standards Committee to the Abortion Supervisory Committee 2009). The referring doctor should actively follow up Maaori women referred for termination of pregnancy to ensure this consultation is completed and review mental health status during this consultation.
8
• Communication and coordination between primary care (GPs, Family Planning Association), LMCs, termination of pregnancy services, alcohol and drug services, and secondary providers of maternity, obstetric, mental health, and maternal mental health services should be improved and enhanced using a variety of means including but not limited to case management, integrated notes systems, and electronic transfer of information.
• Child and Youth Mortality Review Committee (CYMRC) consider including information about whether female suicide cases were pregnant in the 12 months prior to their deaths in addition to the pregnancy status information currently collected.
Source: Pages 16-21, Perinatal and Maternal Mortality Review Committee Eleventh Annual Report 2017.
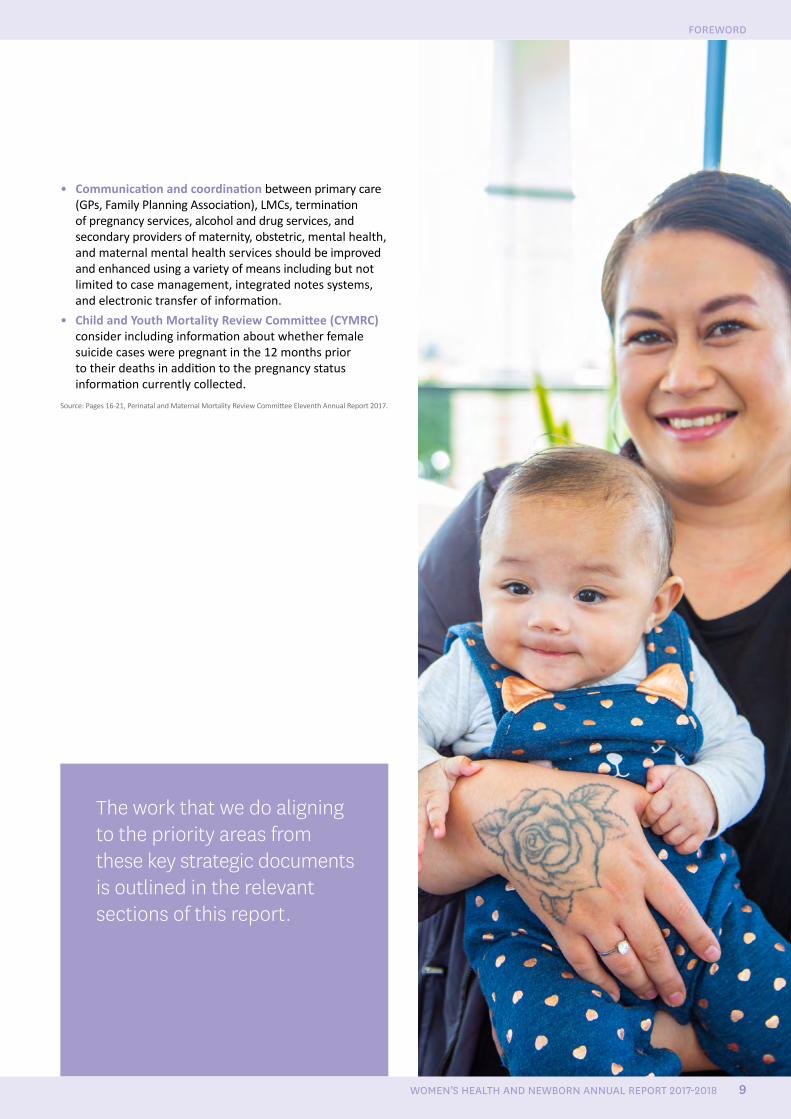
The work that we do aligning to the priority areas from these key strategic documents is outlined in the relevant sections of this report.
FOREWORD
WOMEN’S HEALTH AND NEWBORN ANNUAL REPORT 2017-2018 9
CM Health Maternity Strategy
PrinciplesMaternity care is provided in a culturally appropriate way which supports care that protects, promotes, and supports normal childbirth for women and babies, with evidence based medical intervention when required.
Women will easily access a local lead maternity carer who will provide individualised care, navigate and support the woman and her family/whaanau through the maternity care system as close to home as possible.
Having a baby and the transition to parenthood is recognised as a socially significant event for families/whaanau.
Childbearing women and their families are supported to make choices which are underpinned by the maternity care providers sharing evidenced based information.
Maternity care is co-ordinated across settings and disciplines to maximise safety and use resources wisely.
People who work in the maternity care system are provided with a safe and respectful environment in which they can learn and grow together.
The quality of maternity care and services is measured and evaluated.
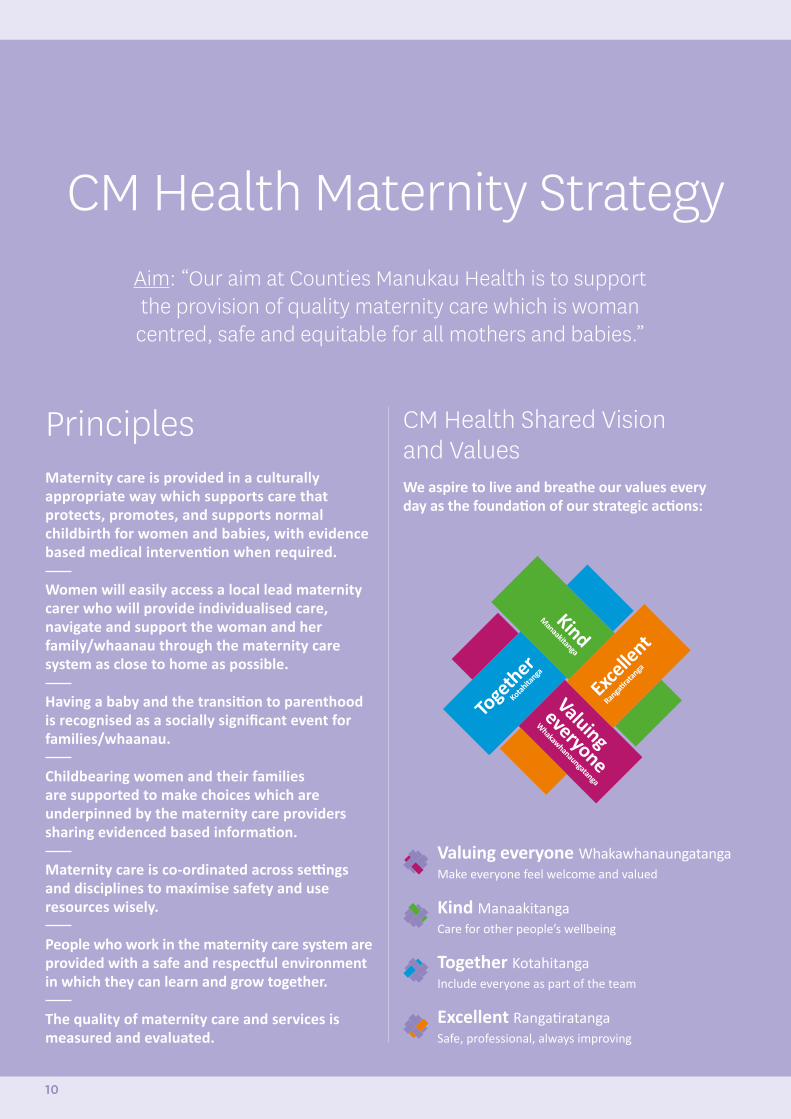
CM Health Shared Vision and ValuesWe aspire to live and breathe our values every day as the foundation of our strategic actions:
Aim: “Our aim at Counties Manukau Health is to support the provision of quality maternity care which is woman
centred, safe and equitable for all mothers and babies.”
Valuing everyone WhakawhanaungatangaMake everyone feel welcome and valued
Kind ManaakitangaCare for other people’s wellbeing
Together KotahitangaInclude everyone as part of the team
Excellent RangatiratangaSafe, professional, always improving
10
CM Health Maternity Strategy Quality and SafetyCM Health has a number of committees and forums that support quality.
The Maternity Quality and Safety Governance Group reports to the Maternity Strategic Group which in turns feeds into the Executive Leadership Team (ELT).
The Maternity Quality and Safety Governance Group and the Maternity Quality Forum have a combined Maternity Quality Improvement Workplan (see page 118). This allows for transparency and oversight over the range of quality activities occurring across all areas of maternity services.
A Women’s Health (Obstetric and Midwifery) Controlled Document Co-ordination Group provides a multidisciplinary approach to the updating of policies, procedures and guidelines and assists in the development of new controlled documents.
Forums and meetings are also held to discuss and share learnings. These include regular ongoing morbidity meetings, perinatal and maternal mortality meetings and serious adverse event presentations.
See Appendix 1 (the Women’s Health Quality Groups and Meetings diagram) for further information on Women’s Health committees and groups that include quality as part of their functions.
Key Roles Supporting Quality and Safety WorkMaternity Quality and Safety Governance Group Formed initially in response to the Maternity Quality and Safety Programme, this group meets monthly and is chaired by the Maternity Quality and Safety Co-ordinator. It consists of several senior medical and midwifery clinicians and maternity management members from across the Women’s Health sector, two community LMC midwives, one urban and one rural, and two consumers.
Maternity Quality and Safety Co-ordinator This role supports the management and implementation of the Maternity Quality and Safety Programme across the CM Heath district. The position involves participation in or leading projects that are part of a sector wide maternity strategy and covers service development, clinical leadership and communication involving initiatives to further improve maternity quality and safety. Continued funding and extension of the Maternity Quality and Safety Programme has allowed CM Health to retain a Maternity Quality and Safety Programme co-ordinator, support the continuation of
regular consumer and community LMC midwife engagement as well as fund a number of quality improvement initiatives across the maternity workforce.
Service Development Manager Maternity Services This role was created in 2014 after the external Maternity Review in 2012 appointed a project manager to implement the Action Plan from the review’s recommendations. The role continues to focus on keys area from the work streams formed from the recommendations. The role is about service development so the work evolves as the system needs to be changed to manage new or developing needs of women in the Maternity Service. There is a strong emphasis on stakeholder engagement with an aim of integrating and strengthening services between secondary and primary care.
Access Holders Monthly Meetings These monthly meetings are chaired by the Maternity Service Development Manager and held at the Manukau SuperClinic which is centrally located and has ample free parking. This forum is well represented by urban and rural community LMC midwives working within the Counties Manukau district.
Clinical Quality and Risk Manager Women’s Health and Kidz First This role is responsible for overseeing, co-ordinating and implementing quality initiatives, risk and incident management (including serious adverse event investigations) and the sharing of learnings and working with key stakeholders to support the provision of high quality patient care across the continuum of services in accordance with CM Health’s vision and values.
The Women's Health Incident Meetings These fortnightly multidisciplinary incident meetings include community LMC midwifery representation. There are two community LMC midwives who are also part of the serious adverse event review teams when there has been community LMC midwifery involvement.
Perinatal Loss Midwife Specialist This role co-ordinates the local monthly Perinatal Morbidity and Mortality meetings, which includes hospital staff as well as community based clinicians and consumers. This role also provides continuity and support for the women and their families who have had a perinatal loss including facilitating access to counselling support.
Workforce Group The Workforce Group, who meet monthly, is made up of community LMCs from the seven geographical areas of Counties Manukau, senior CM Health midwives and managers, New Zealand College of Midwives (NZCOM) and New Zealand Registered Nurses (NZRN) representatives.
CM HEALTH MATERNITY STRATEGY
WOMEN’S HEALTH AND NEWBORN ANNUAL REPORT 2017-2018 11
LMC Midwife Liaison This role was appointed to progress early engagement and registration , support new to area and graduate community LMC midwives and to enhance collegial relationships between primary and secondary care. Currently also involved in supporting planned pregnancy through providing Long Acting Reversible Contraception (LARC) insertion on the Maternity Ward.
Maternity Consumer Panel The panel was made up of 13 diverse CM Health consumer members and supported by an independent facilitator. The Maternity Consumer Panel met three times a year and more often if required. Since February 2018 the format has changed to focus groups while systems for consumer feedback are being reviewed.
Health Intelligence and Informatics Team, Population Health Team and Public Health Physicians These teams provide data analysis and resource support for Women’s Health and maternity quality and safety.
Community Birthing Steering Group The Steering Group was established in May 2017 to promote and protect birthing closer to home, increase utilisation of the birthing units, and support homebirth to be offered as an option. The group is chaired by the Service Development Manager, Maternity Services.
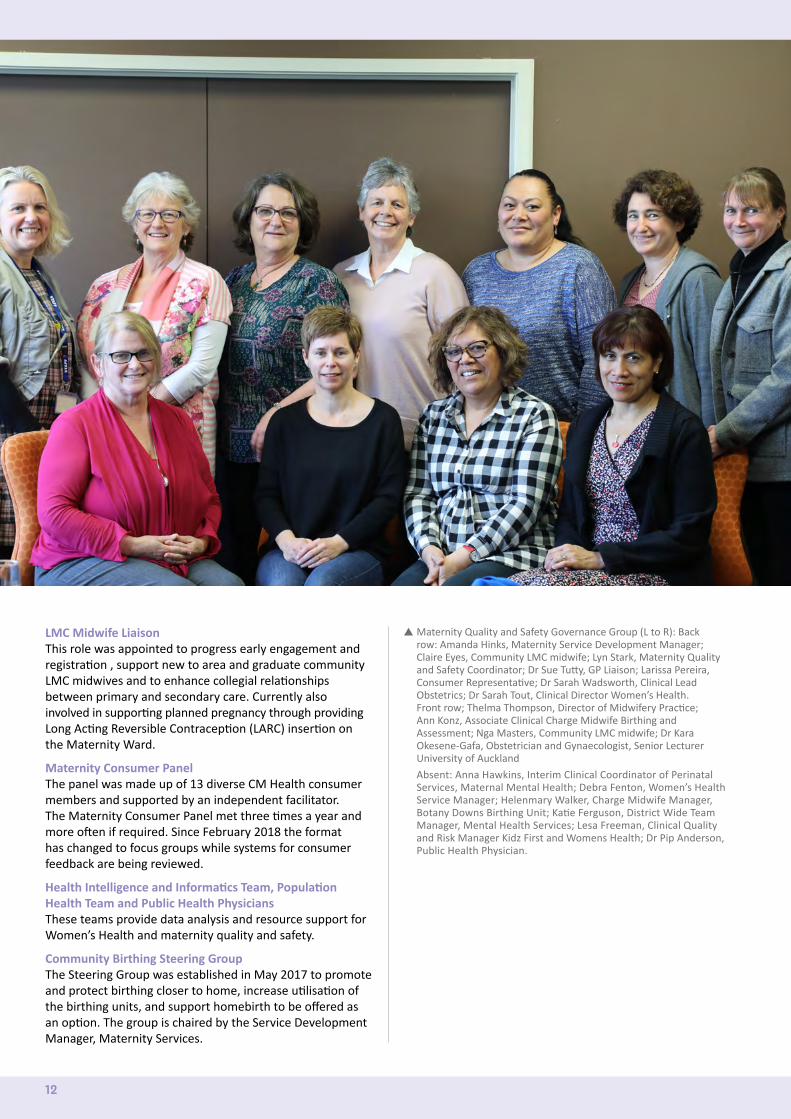
Maternity Quality and Safety Governance Group (L to R): Back row: Amanda Hinks, Maternity Service Development Manager; Claire Eyes, Community LMC midwife; Lyn Stark, Maternity Quality and Safety Coordinator; Dr Sue Tutty, GP Liaison; Larissa Pereira, Consumer Representative; Dr Sarah Wadsworth, Clinical Lead Obstetrics; Dr Sarah Tout, Clinical Director Women’s Health. Front row; Thelma Thompson, Director of Midwifery Practice; Ann Konz, Associate Clinical Charge Midwife Birthing and Assessment; Nga Masters, Community LMC midwife; Dr Kara Okesene-Gafa, Obstetrician and Gynaecologist, Senior Lecturer University of Auckland
Absent: Anna Hawkins, Interim Clinical Coordinator of Perinatal Services, Maternal Mental Health; Debra Fenton, Women’s Health Service Manager; Helenmary Walker, Charge Midwife Manager, Botany Downs Birthing Unit; Katie Ferguson, District Wide Team Manager, Mental Health Services; Lesa Freeman, Clinical Quality and Risk Manager Kidz First and Womens Health; Dr Pip Anderson, Public Health Physician.
12
Our populationCM Health is one of 20 DHBs established under the New Zealand Health and Disability Act 2000 to plan and fund the provision of personal health, public health and disability support services for the improvement of the health of the population.
As a collective health system, CM Health provided and funded health and disability services for an estimated 546,000 people in 2017/2018. These people reside in the local authority areas of Auckland, Waikato and Hauraki District.
It is estimated there were approximately 120,000 women of childbearing age (15 to 44 years) living in the area serviced by CM Health in 2017/2018. We are one of the fastest growing DHB populations in New Zealand, with a youthful and ageing population (see Figure 1).
FIGURE 1.
CM Health population
The communities we serve in Counties Manukau in 2017
Counti es Manukau is home to By 2025
Maaori
non-Maaori, non-Pacifi c
Life expectancy at birth
MaaoriPacifi c
Maaori
Born overseas European/Other
Asian Asian
16% 17%12% 37% 20%of New
Zealand's Maaori
populati on
of New Zealand's
Pacifi c
of New Zealand's
Asian
40% 34%
196,500
62,000 2 3
25%
84YEARS YEARS YEARS
76.6 74.8
28%
more people every year
more older people every yearpeople aged 65 years and over
Are fast growing
Are youthful
And ageing
Are vibrant and diverse
Their health is not the same
people live in the most socioeconomically deprived areas
people smoke people are overweight or obese
people receive care for a mental health conditi on
children
live in the most socioeconomically deprived areas
people more people by 2025
more older people by 2025
545,720
22,000
70,000
122,570 1 IN 2
61,730
1-2%
4%
13%of New Zealand's children live here
Pacifi c Pacifi c21% 21%
OUT OF
Counties Manukau is home to New Zealand’s second largest Maaori population and largest population of Pacific people, as well as a fast-growing Asian community. Our population is diverse and vibrant with strong cultural values.
Statistics New Zealand’s first survey on Maaori well-being, Te Kupenga (2013)5, highlighted a number of strengths in our local Maaori. A high level of connectedness with whaanau was reported and 83% of people surveyed said it was ‘easy’ or ‘very easy’ to get support from their whaanau.
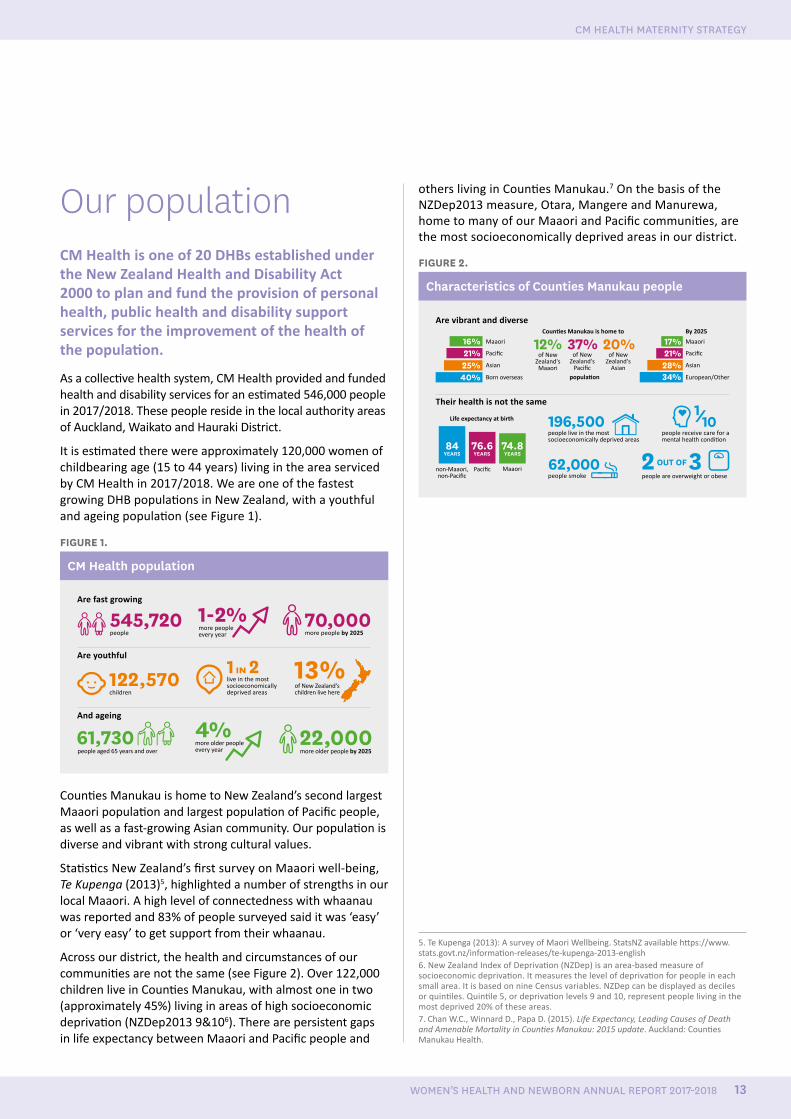
Across our district, the health and circumstances of our communities are not the same (see Figure 2). Over 122,000 children live in Counties Manukau, with almost one in two (approximately 45%) living in areas of high socioeconomic deprivation (NZDep2013 9&106). There are persistent gaps in life expectancy between Maaori and Pacific people and
others living in Counties Manukau.7 On the basis of the NZDep2013 measure, Otara, Mangere and Manurewa, home to many of our Maaori and Pacific communities, are the most socioeconomically deprived areas in our district.
FIGURE 2.
Characteristics of Counties Manukau people
The communities we serve in Counties Manukau in 2017
Counti es Manukau is home to By 2025
Maaori
non-Maaori, non-Pacifi c
Life expectancy at birth
MaaoriPacifi c
Maaori
Born overseas European/Other
Asian Asian
16% 17%12% 37% 20%of New
Zealand's Maaori
populati on
of New Zealand's
Pacifi c
of New Zealand's
Asian
40% 34%
196,500
62,000 2 3
25%
84YEARS YEARS YEARS
76.6 74.8
28%
more people every year
more older people every yearpeople aged 65 years and over
Are fast growing
Are youthful
And ageing
Are vibrant and diverse
Their health is not the same
people live in the most socioeconomically deprived areas
people smoke people are overweight or obese
people receive care for a mental health conditi on
children
live in the most socioeconomically deprived areas
people more people by 2025
more older people by 2025
545,720
22,000
70,000
122,570 1 IN 2
61,730
1-2%
4%
13%of New Zealand's children live here
Pacifi c Pacifi c21% 21%
OUT OF
5. Te Kupenga (2013): A survey of Maori Wellbeing. StatsNZ available https://www.stats.govt.nz/information-releases/te-kupenga-2013-english6. New Zealand Index of Deprivation (NZDep) is an area-based measure of socioeconomic deprivation. It measures the level of deprivation for people in each small area. It is based on nine Census variables. NZDep can be displayed as deciles or quintiles. Quintile 5, or deprivation levels 9 and 10, represent people living in the most deprived 20% of these areas.7. Chan W.C., Winnard D., Papa D. (2015). Life Expectancy, Leading Causes of Death and Amenable Mortality in Counties Manukau: 2015 update. Auckland: Counties Manukau Health.
WOMEN’S HEALTH AND NEWBORN ANNUAL REPORT 2017-2018 13
CM HEALTH MATERNITY STRATEGY
Our Maternity Services
14
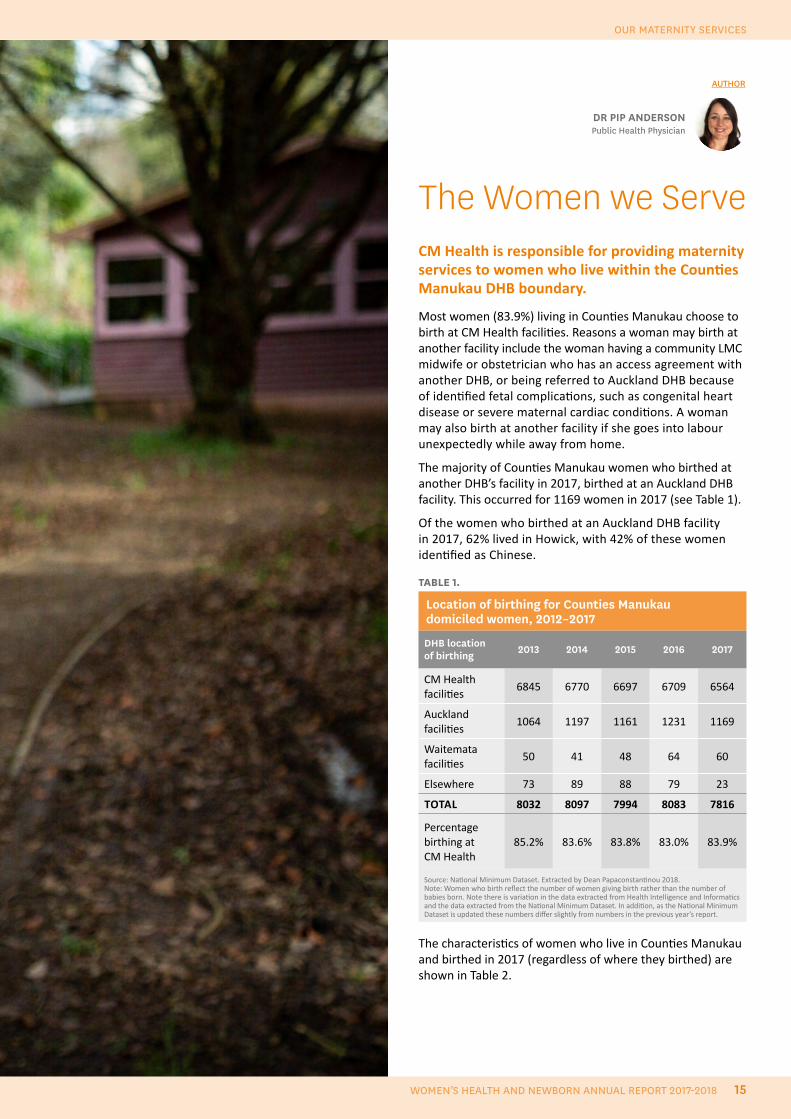
The Women we Serve CM Health is responsible for providing maternity services to women who live within the Counties Manukau DHB boundary.
Most women (83.9%) living in Counties Manukau choose to birth at CM Health facilities. Reasons a woman may birth at another facility include the woman having a community LMC midwife or obstetrician who has an access agreement with another DHB, or being referred to Auckland DHB because of identified fetal complications, such as congenital heart disease or severe maternal cardiac conditions. A woman may also birth at another facility if she goes into labour unexpectedly while away from home.
The majority of Counties Manukau women who birthed at another DHB’s facility in 2017, birthed at an Auckland DHB facility. This occurred for 1169 women in 2017 (see Table 1).
Of the women who birthed at an Auckland DHB facility in 2017, 62% lived in Howick, with 42% of these women identified as Chinese.
TABLE 1.
Location of birthing for Counties Manukau domiciled women, 2012–2017
DHB location of birthing 2013 2014 2015 2016 2017
CM Health facilities
6845 6770 6697 6709 6564
Auckland facilities
1064 1197 1161 1231 1169
Waitemata facilities
50 41 48 64 60
Elsewhere 73 89 88 79 23
TOTAL 8032 8097 7994 8083 7816
Percentage birthing at CM Health
85.2% 83.6% 83.8% 83.0% 83.9%
Source: National Minimum Dataset. Extracted by Dean Papaconstantinou 2018. Note: Women who birth reflect the number of women giving birth rather than the number of babies born. Note there is variation in the data extracted from Health Intelligence and Informatics and the data extracted from the National Minimum Dataset. In addition, as the National Minimum Dataset is updated these numbers differ slightly from numbers in the previous year’s report.
The characteristics of women who live in Counties Manukau and birthed in 2017 (regardless of where they birthed) are shown in Table 2.
Our Maternity Services
DR PIP ANDERSONPublic Health Physician
AUTHOR
OUR MATERNITY SERVICES
15WOMEN’S HEALTH AND NEWBORN ANNUAL REPORT 2017-2018
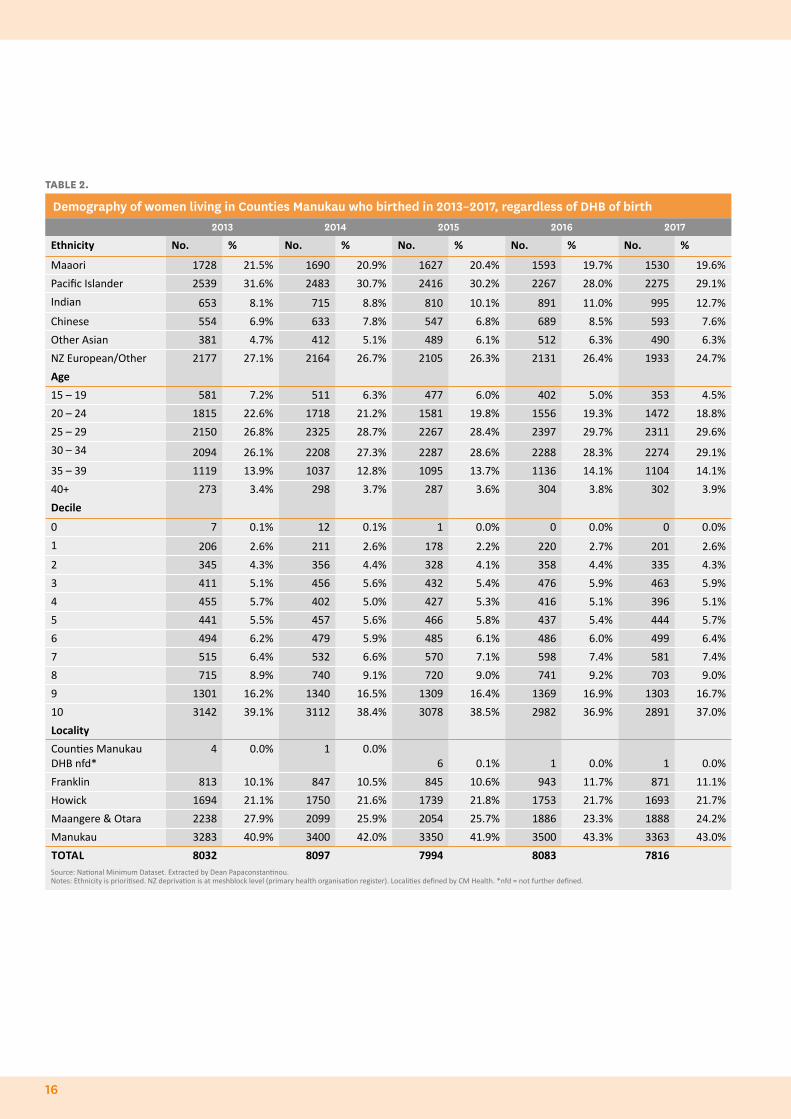
TABLE 2.
Demography of women living in Counties Manukau who birthed in 2013–2017, regardless of DHB of birth2013 2014 2015 2016 2017
Ethnicity No. % No. % No. % No. % No. %
Maaori 1728 21.5% 1690 20.9% 1627 20.4% 1593 19.7% 1530 19.6%
Pacific Islander 2539 31.6% 2483 30.7% 2416 30.2% 2267 28.0% 2275 29.1%
Indian 653 8.1% 715 8.8% 810 10.1% 891 11.0% 995 12.7%
Chinese 554 6.9% 633 7.8% 547 6.8% 689 8.5% 593 7.6%
Other Asian 381 4.7% 412 5.1% 489 6.1% 512 6.3% 490 6.3%
NZ European/Other 2177 27.1% 2164 26.7% 2105 26.3% 2131 26.4% 1933 24.7%
Age
15 – 19 581 7.2% 511 6.3% 477 6.0% 402 5.0% 353 4.5%
20 – 24 1815 22.6% 1718 21.2% 1581 19.8% 1556 19.3% 1472 18.8%
25 – 29 2150 26.8% 2325 28.7% 2267 28.4% 2397 29.7% 2311 29.6%
30 – 34 2094 26.1% 2208 27.3% 2287 28.6% 2288 28.3% 2274 29.1%
35 – 39 1119 13.9% 1037 12.8% 1095 13.7% 1136 14.1% 1104 14.1%
40+ 273 3.4% 298 3.7% 287 3.6% 304 3.8% 302 3.9%
Decile
0 7 0.1% 12 0.1% 1 0.0% 0 0.0% 0 0.0%
1 206 2.6% 211 2.6% 178 2.2% 220 2.7% 201 2.6%
2 345 4.3% 356 4.4% 328 4.1% 358 4.4% 335 4.3%
3 411 5.1% 456 5.6% 432 5.4% 476 5.9% 463 5.9%
4 455 5.7% 402 5.0% 427 5.3% 416 5.1% 396 5.1%
5 441 5.5% 457 5.6% 466 5.8% 437 5.4% 444 5.7%
6 494 6.2% 479 5.9% 485 6.1% 486 6.0% 499 6.4%
7 515 6.4% 532 6.6% 570 7.1% 598 7.4% 581 7.4%
8 715 8.9% 740 9.1% 720 9.0% 741 9.2% 703 9.0%
9 1301 16.2% 1340 16.5% 1309 16.4% 1369 16.9% 1303 16.7%
10 3142 39.1% 3112 38.4% 3078 38.5% 2982 36.9% 2891 37.0%
Locality
Counties Manukau DHB nfd*
4 0.0% 1 0.0%6 0.1% 1 0.0% 1 0.0%
Franklin 813 10.1% 847 10.5% 845 10.6% 943 11.7% 871 11.1%
Howick 1694 21.1% 1750 21.6% 1739 21.8% 1753 21.7% 1693 21.7%
Maangere & Otara 2238 27.9% 2099 25.9% 2054 25.7% 1886 23.3% 1888 24.2%
Manukau 3283 40.9% 3400 42.0% 3350 41.9% 3500 43.3% 3363 43.0%
TOTAL 8032 8097 7994 8083 7816Source: National Minimum Dataset. Extracted by Dean Papaconstantinou.Notes: Ethnicity is prioritised. NZ deprivation is at meshblock level (primary health organisation register). Localities defined by CM Health. *nfd = not further defined.
16
Of the women who live in Counties Manukau and birthed in 2017, 29.1% were Pacific Islander, 24.7% were NZ European/other, 19.6% were Maaori, 12.7% were Indian and 7.6% were Chinese. It is important to note that ethnicity is prioritised.8
The number of Maaori women birthing, as a percentage of the birthing cohort, is trending down over time, while the percentage of Indian women birthing has been trending up (see Table 2).
The highest number of births in 2017 was to women living in Manukau (3363), followed by Mangere and Otara (1888), Howick (1693), and then Franklin (871). Across the district, the health and circumstances of communities are not the same. On the basis of the NZDep2013 measure, Otara, Mangere and Manurewa are the most socioeconomically deprived areas in our district. Of the women who birthed in 2017, 53.7% lived in the socioeconomically deprived areas (decile 9 and 10) (see Table 2).
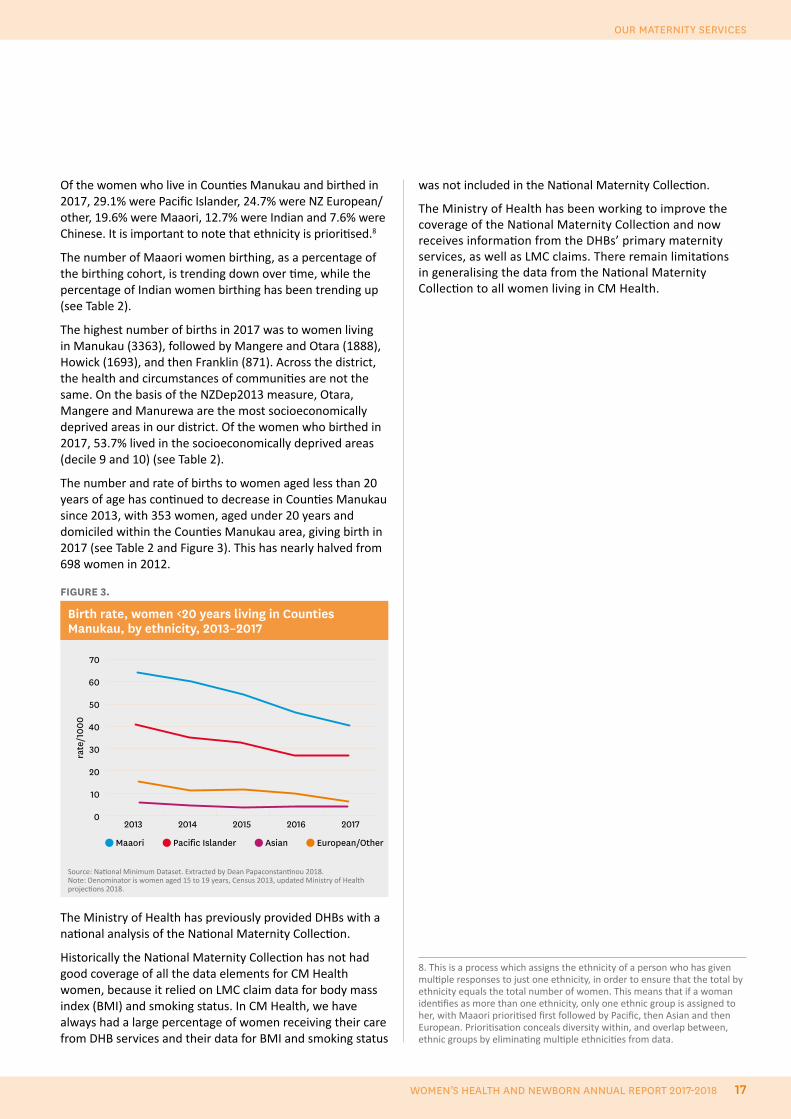
The number and rate of births to women aged less than 20 years of age has continued to decrease in Counties Manukau since 2013, with 353 women, aged under 20 years and domiciled within the Counties Manukau area, giving birth in 2017 (see Table 2 and Figure 3). This has nearly halved from 698 women in 2012.
FIGURE 3.
Birth rate, women <20 years living in Counties Manukau, by ethnicity, 2013–2017
2013
2014 2015 2016 2017
70
60
50
40
30
20
10
0
Maaori Pacific Islander Asian European/Other
rate
/100
0
Source: National Minimum Dataset. Extracted by Dean Papaconstantinou 2018.Note: Denominator is women aged 15 to 19 years, Census 2013, updated Ministry of Health projections 2018.
The Ministry of Health has previously provided DHBs with a national analysis of the National Maternity Collection.
Historically the National Maternity Collection has not had good coverage of all the data elements for CM Health women, because it relied on LMC claim data for body mass index (BMI) and smoking status. In CM Health, we have always had a large percentage of women receiving their care from DHB services and their data for BMI and smoking status
8. This is a process which assigns the ethnicity of a person who has given multiple responses to just one ethnicity, in order to ensure that the total by ethnicity equals the total number of women. This means that if a woman identifies as more than one ethnicity, only one ethnic group is assigned to her, with Maaori prioritised first followed by Pacific, then Asian and then European. Prioritisation conceals diversity within, and overlap between, ethnic groups by eliminating multiple ethnicities from data.
was not included in the National Maternity Collection.
The Ministry of Health has been working to improve the coverage of the National Maternity Collection and now receives information from the DHBs’ primary maternity services, as well as LMC claims. There remain limitations in generalising the data from the National Maternity Collection to all women living in CM Health.
OUR MATERNITY SERVICES
17WOMEN’S HEALTH AND NEWBORN ANNUAL REPORT 2017-2018
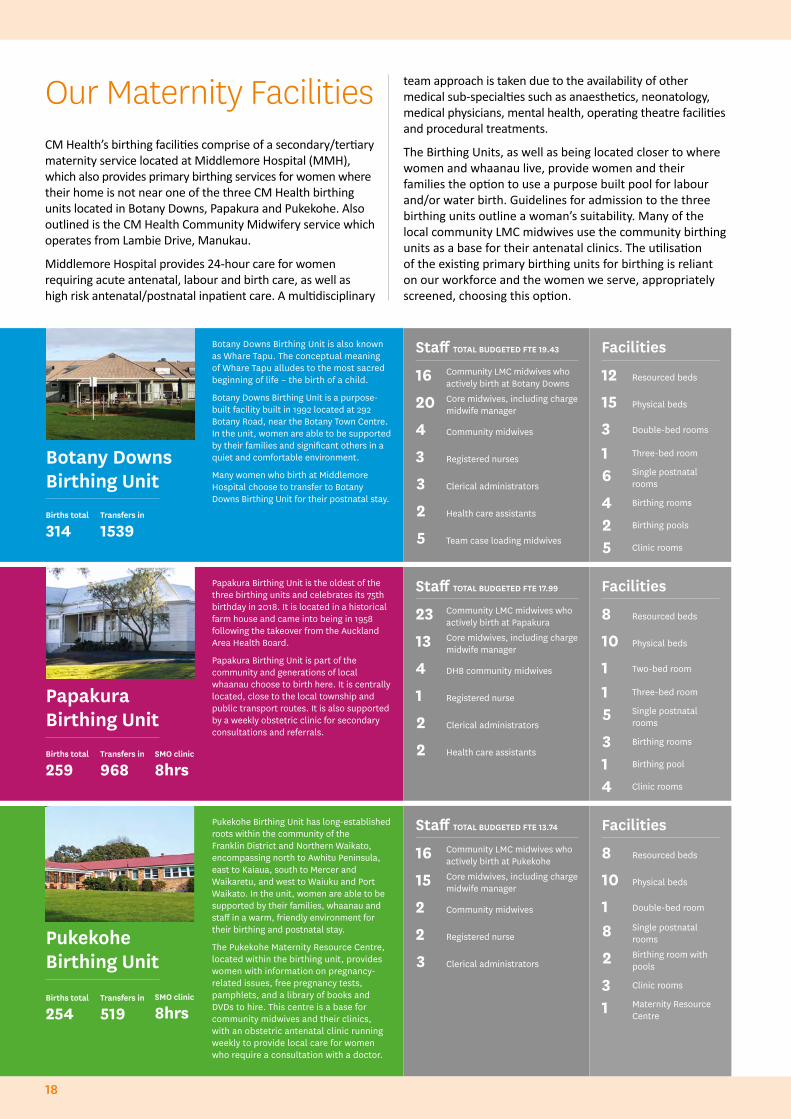
CM Health’s birthing facilities comprise of a secondary/tertiary maternity service located at Middlemore Hospital (MMH), which also provides primary birthing services for women where their home is not near one of the three CM Health birthing units located in Botany Downs, Papakura and Pukekohe. Also outlined is the CM Health Community Midwifery service which operates from Lambie Drive, Manukau.
Middlemore Hospital provides 24-hour care for women requiring acute antenatal, labour and birth care, as well as high risk antenatal/postnatal inpatient care. A multidisciplinary
Botany Downs Birthing Unit is also known as Whare Tapu. The conceptual meaning of Whare Tapu alludes to the most sacred beginning of life – the birth of a child.
Botany Downs Birthing Unit is a purpose-built facility built in 1992 located at 292 Botany Road, near the Botany Town Centre. In the unit, women are able to be supported by their families and significant others in a quiet and comfortable environment.
Many women who birth at Middlemore Hospital choose to transfer to Botany Downs Birthing Unit for their postnatal stay.
Botany Downs Birthing Unit
Staff TOTAL BUDGETED FTE 19.43
16 Community LMC midwives who actively birth at Botany Downs
20 Core midwives, including charge midwife manager
4 Community midwives
3 Registered nurses
3 Clerical administrators
2 Health care assistants
5 Team case loading midwives
Facilities
12 Resourced beds
15 Physical beds
3 Double-bed rooms
1 Three-bed room
6 Single postnatal rooms
4 Birthing rooms
2 Birthing pools
5 Clinic rooms
Papakura Birthing Unit is the oldest of the three birthing units and celebrates its 75th birthday in 2018. It is located in a historical farm house and came into being in 1958 following the takeover from the Auckland Area Health Board.
Papakura Birthing Unit is part of the community and generations of local whaanau choose to birth here. It is centrally located, close to the local township and public transport routes. It is also supported by a weekly obstetric clinic for secondary consultations and referrals.
Papakura Birthing UnitBirths total
259 Transfers in
968SMO clinic
8hrs
Staff TOTAL BUDGETED FTE 17.99
23 Community LMC midwives who actively birth at Papakura
13 Core midwives, including charge midwife manager
4 DHB community midwives
1 Registered nurse
2 Clerical administrators
2 Health care assistants
Facilities
8 Resourced beds
10 Physical beds
1 Two-bed room
1 Three-bed room
5 Single postnatal rooms
3 Birthing rooms
1 Birthing pool
4 Clinic rooms
Births total
314 Transfers in
1539
Pukekohe Birthing Unit has long-established roots within the community of the Franklin District and Northern Waikato, encompassing north to Awhitu Peninsula, east to Kaiaua, south to Mercer and Waikaretu, and west to Waiuku and Port Waikato. In the unit, women are able to be supported by their families, whaanau and staff in a warm, friendly environment for their birthing and postnatal stay.
The Pukekohe Maternity Resource Centre, located within the birthing unit, provides women with information on pregnancy-related issues, free pregnancy tests, pamphlets, and a library of books and DVDs to hire. This centre is a base for community midwives and their clinics, with an obstetric antenatal clinic running weekly to provide local care for women who require a consultation with a doctor.
Pukekohe Birthing Unit
Births total
254 Transfers in
519SMO clinic
8hrs
Staff TOTAL BUDGETED FTE 13.74
16 Community LMC midwives who actively birth at Pukekohe
15 Core midwives, including charge midwife manager
2 Community midwives
2 Registered nurse
3 Clerical administrators
Facilities
8 Resourced beds
10 Physical beds
1 Double-bed room
8 Single postnatal rooms
2 Birthing room with pools
3 Clinic rooms
1 Maternity Resource Centre
team approach is taken due to the availability of other medical sub-specialties such as anaesthetics, neonatology, medical physicians, mental health, operating theatre facilities and procedural treatments.
The Birthing Units, as well as being located closer to where women and whaanau live, provide women and their families the option to use a purpose built pool for labour and/or water birth. Guidelines for admission to the three birthing units outline a woman’s suitability. Many of the local community LMC midwives use the community birthing units as a base for their antenatal clinics. The utilisation of the existing primary birthing units for birthing is reliant on our workforce and the women we serve, appropriately screened, choosing this option.
Our Maternity Facilities
18
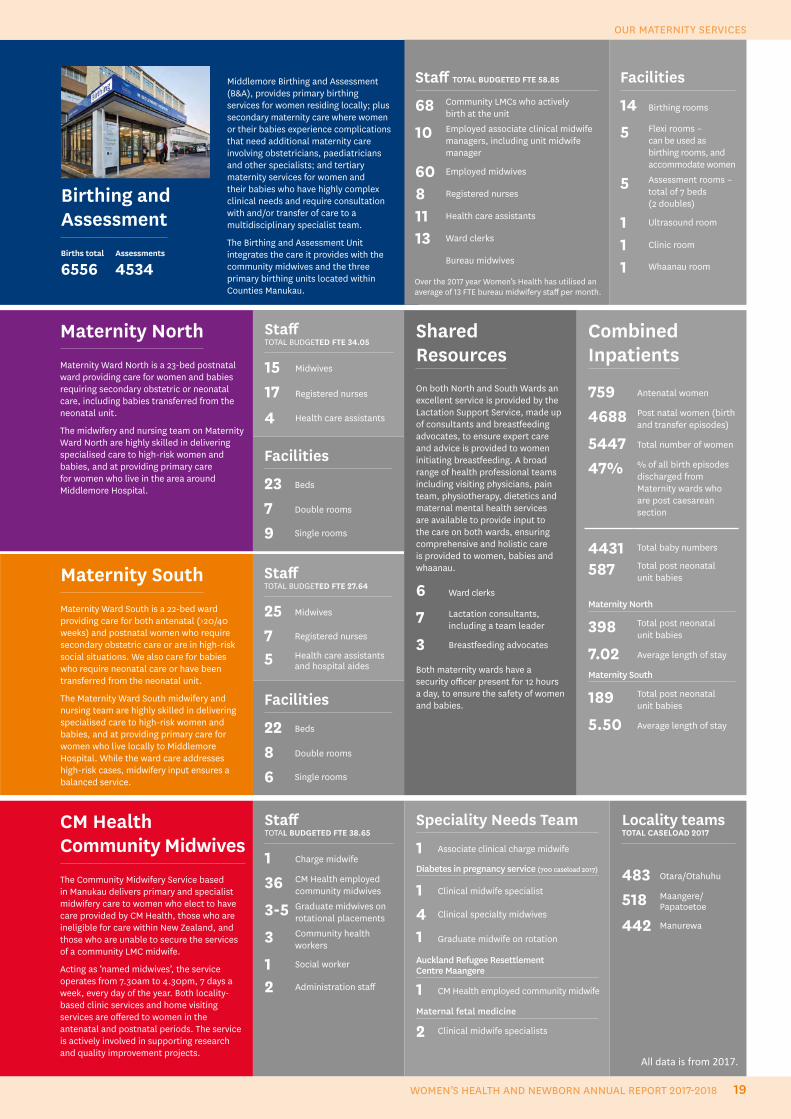
Middlemore Birthing and Assessment (B&A), provides primary birthing services for women residing locally; plus secondary maternity care where women or their babies experience complications that need additional maternity care involving obstetricians, paediatricians and other specialists; and tertiary maternity services for women and their babies who have highly complex clinical needs and require consultation with and/or transfer of care to a multidisciplinary specialist team.
The Birthing and Assessment Unit integrates the care it provides with the community midwives and the three primary birthing units located within Counties Manukau.
Birthing and Assessment
Staff TOTAL BUDGETED FTE 58.85
68 Community LMCs who activelybirth at the unit
10 Employed associate clinical midwife managers, including unit midwife manager
60 Employed midwives
8 Registered nurses
11 Health care assistants
13 Ward clerks
Bureau midwives
Facilities
14 Birthing rooms
5 Flexi rooms – can be used as birthing rooms, and accommodate women
5 Assessment rooms – total of 7 beds (2 doubles)
1 Ultrasound room
1 Clinic room
1 Whaanau room Births total
6556 Assessments
4534
Combined Inpatients
759 Antenatal women
4688 Post natal women (birth and transfer episodes)
5447 Total number of women
47% % of all birth episodes discharged from Maternity wards who are post caesarean section
4431 Total baby numbers
587 Total post neonatal unit babies
Maternity North
398 Total post neonatal unit babies
7.02 Average length of stay
Maternity South
189 Total post neonatal unit babies
5.50 Average length of stay
Staff TOTAL BUDGETED FTE 34.05
15 Midwives
17 Registered nurses
4 Health care assistants
Shared ResourcesOn both North and South Wards an excellent service is provided by the Lactation Support Service, made up of consultants and breastfeeding advocates, to ensure expert care and advice is provided to women initiating breastfeeding. A broad range of health professional teams including visiting physicians, pain team, physiotherapy, dietetics and maternal mental health services are available to provide input to the care on both wards, ensuring comprehensive and holistic care is provided to women, babies and whaanau.
6 Ward clerks
7 Lactation consultants, including a team leader
3 Breastfeeding advocates
Both maternity wards have a security officer present for 12 hours a day, to ensure the safety of women and babies.
Facilities
23 Beds
7 Double rooms
9 Single rooms
Staff TOTAL BUDGETED FTE 27.64
25 Midwives
7 Registered nurses
5 Health care assistantsand hospital aides
Facilities
22 Beds
8 Double rooms
6 Single rooms
CM Health Community MidwivesThe Community Midwifery Service based in Manukau delivers primary and specialist midwifery care to women who elect to have care provided by CM Health, those who are ineligible for care within New Zealand, and those who are unable to secure the services of a community LMC midwife.
Acting as ‘named midwives’, the service operates from 7.30am to 4.30pm, 7 days a week, every day of the year. Both locality-based clinic services and home visiting services are offered to women in the antenatal and postnatal periods. The service is actively involved in supporting research and quality improvement projects.
Speciality Needs Team
1 Associate clinical charge midwife
Diabetes in pregnancy service (700 caseload 2017)
1 Clinical midwife specialist
4 Clinical specialty midwives
1 Graduate midwife on rotation
Auckland Refugee Resettlement Centre Maangere
1 CM Health employed community midwife
Maternal fetal medicine
2 Clinical midwife specialists
Staff TOTAL BUDGETED FTE 38.65
1 Charge midwife
36 CM Health employed community midwives
3-5 Graduate midwives on rotational placements
3 Community health workers
1 Social worker
2 Administration staff
Locality teams TOTAL CASELOAD 2017
483 Otara/Otahuhu
518 Maangere/Papatoetoe
442 Manurewa
Maternity SouthMaternity Ward South is a 22-bed ward providing care for both antenatal (>20/40 weeks) and postnatal women who require secondary obstetric care or are in high-risk social situations. We also care for babies who require neonatal care or have been transferred from the neonatal unit.
The Maternity Ward South midwifery and nursing team are highly skilled in delivering specialised care to high-risk women and babies, and at providing primary care for women who live locally to Middlemore Hospital. While the ward care addresses high-risk cases, midwifery input ensures a balanced service.
Maternity NorthMaternity Ward North is a 23-bed postnatal ward providing care for women and babies requiring secondary obstetric or neonatal care, including babies transferred from the neonatal unit.
The midwifery and nursing team on Maternity Ward North are highly skilled in delivering specialised care to high-risk women and babies, and at providing primary care for women who live in the area around Middlemore Hospital.
All data is from 2017.
Over the 2017 year Women’s Health has utilised an average of 13 FTE bureau midwifery staff per month.
OUR MATERNITY SERVICES
19WOMEN’S HEALTH AND NEWBORN ANNUAL REPORT 2017-2018
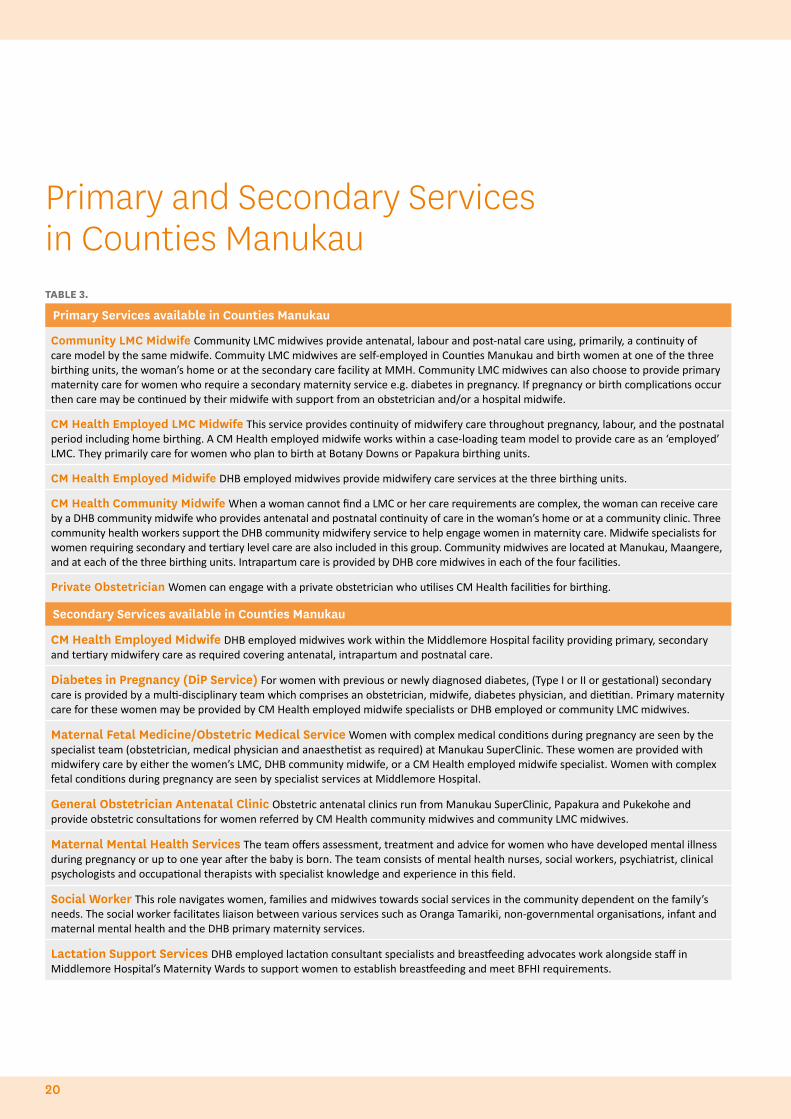
TABLE 3.
Primary Services available in Counties Manukau
Community LMC Midwife Community LMC midwives provide antenatal, labour and post-natal care using, primarily, a continuity of care model by the same midwife. Commuity LMC midwives are self-employed in Counties Manukau and birth women at one of the three birthing units, the woman’s home or at the secondary care facility at MMH. Community LMC midwives can also choose to provide primary maternity care for women who require a secondary maternity service e.g. diabetes in pregnancy. If pregnancy or birth complications occur then care may be continued by their midwife with support from an obstetrician and/or a hospital midwife.
CM Health Employed LMC Midwife This service provides continuity of midwifery care throughout pregnancy, labour, and the postnatal period including home birthing. A CM Health employed midwife works within a case-loading team model to provide care as an ‘employed’ LMC. They primarily care for women who plan to birth at Botany Downs or Papakura birthing units.
CM Health Employed Midwife DHB employed midwives provide midwifery care services at the three birthing units.
CM Health Community Midwife When a woman cannot find a LMC or her care requirements are complex, the woman can receive care by a DHB community midwife who provides antenatal and postnatal continuity of care in the woman’s home or at a community clinic. Three community health workers support the DHB community midwifery service to help engage women in maternity care. Midwife specialists for women requiring secondary and tertiary level care are also included in this group. Community midwives are located at Manukau, Maangere, and at each of the three birthing units. Intrapartum care is provided by DHB core midwives in each of the four facilities.
Private Obstetrician Women can engage with a private obstetrician who utilises CM Health facilities for birthing.
Secondary Services available in Counties Manukau
CM Health Employed Midwife DHB employed midwives work within the Middlemore Hospital facility providing primary, secondary and tertiary midwifery care as required covering antenatal, intrapartum and postnatal care.
Diabetes in Pregnancy (DiP Service) For women with previous or newly diagnosed diabetes, (Type I or II or gestational) secondary care is provided by a multi-disciplinary team which comprises an obstetrician, midwife, diabetes physician, and dietitian. Primary maternity care for these women may be provided by CM Health employed midwife specialists or DHB employed or community LMC midwives.
Maternal Fetal Medicine/Obstetric Medical Service Women with complex medical conditions during pregnancy are seen by the specialist team (obstetrician, medical physician and anaesthetist as required) at Manukau SuperClinic. These women are provided with midwifery care by either the women’s LMC, DHB community midwife, or a CM Health employed midwife specialist. Women with complex fetal conditions during pregnancy are seen by specialist services at Middlemore Hospital.
General Obstetrician Antenatal Clinic Obstetric antenatal clinics run from Manukau SuperClinic, Papakura and Pukekohe and provide obstetric consultations for women referred by CM Health community midwives and community LMC midwives.
Maternal Mental Health Services The team offers assessment, treatment and advice for women who have developed mental illness during pregnancy or up to one year after the baby is born. The team consists of mental health nurses, social workers, psychiatrist, clinical psychologists and occupational therapists with specialist knowledge and experience in this field.
Social Worker This role navigates women, families and midwives towards social services in the community dependent on the family’s needs. The social worker facilitates liaison between various services such as Oranga Tamariki, non-governmental organisations, infant and maternal mental health and the DHB primary maternity services.
Lactation Support Services DHB employed lactation consultant specialists and breastfeeding advocates work alongside staff in Middlemore Hospital’s Maternity Wards to support women to establish breastfeeding and meet BFHI requirements.
Primary and Secondary Services in Counties Manukau
20
OUR MATERNITY SERVICES
21WOMEN’S HEALTH AND NEWBORN ANNUAL REPORT 2017-2018
Maternity care is provided in a culturally appropriate way that protects, promotes and supports normal childbirth, with evidence based medical intervention when required
22
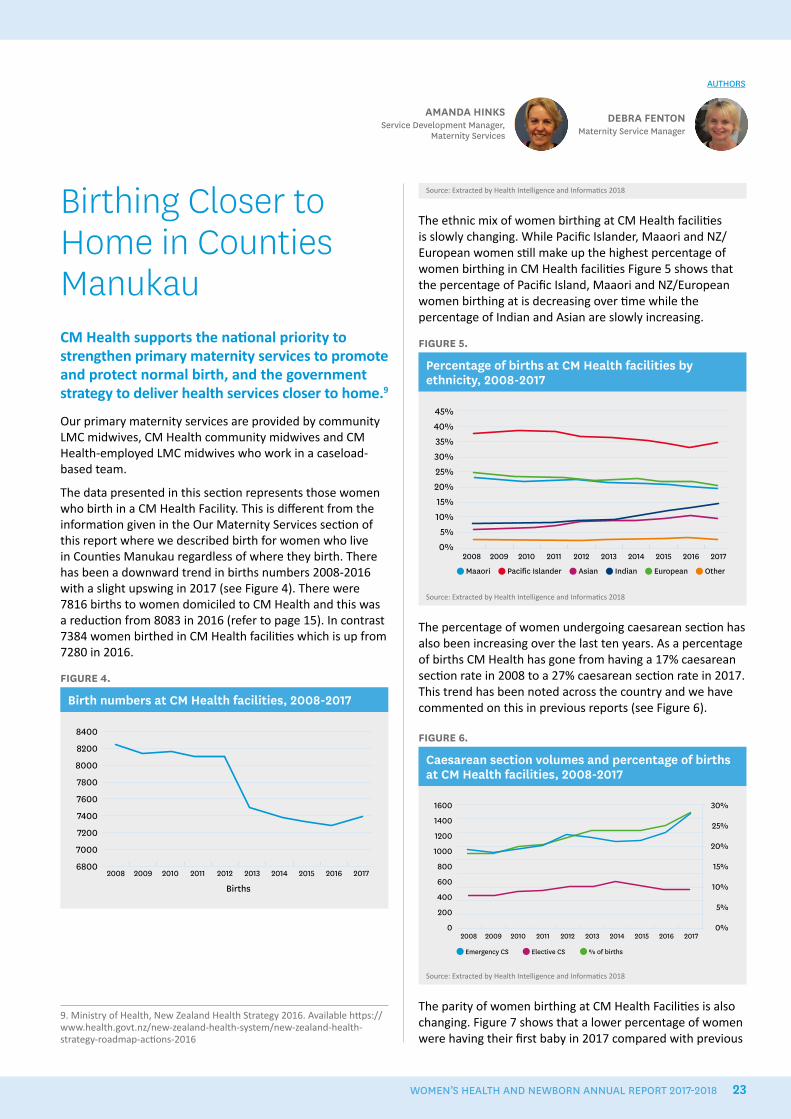
Birthing Closer to Home in Counties Manukau CM Health supports the national priority to strengthen primary maternity services to promote and protect normal birth, and the government strategy to deliver health services closer to home.9
Our primary maternity services are provided by community LMC midwives, CM Health community midwives and CM Health-employed LMC midwives who work in a caseload-based team.
The data presented in this section represents those women who birth in a CM Health Facility. This is different from the information given in the Our Maternity Services section of this report where we described birth for women who live in Counties Manukau regardless of where they birth. There has been a downward trend in births numbers 2008-2016 with a slight upswing in 2017 (see Figure 4). There were 7816 births to women domiciled to CM Health and this was a reduction from 8083 in 2016 (refer to page 15). In contrast 7384 women birthed in CM Health facilities which is up from 7280 in 2016.
FIGURE 4.
Birth numbers at CM Health facilities, 2008-2017
Births
8400
8200
8000
7800
7600
7400
7200
7000
68002008 2009 2010 2011 2012 2013 2014 2015 2016 2017
DEBRA FENTONMaternity Service Manager
AMANDA HINKSService Development Manager,
Maternity Services
9. Ministry of Health, New Zealand Health Strategy 2016. Available https://www.health.govt.nz/new-zealand-health-system/new-zealand-health-strategy-roadmap-actions-2016
AUTHORS
Source: Extracted by Health Intelligence and Informatics 2018
The ethnic mix of women birthing at CM Health facilities is slowly changing. While Pacific Islander, Maaori and NZ/European women still make up the highest percentage of women birthing in CM Health facilities Figure 5 shows that the percentage of Pacific Island, Maaori and NZ/European women birthing at is decreasing over time while the percentage of Indian and Asian are slowly increasing.
FIGURE 5.
Percentage of births at CM Health facilities by ethnicity, 2008-2017
45%40%35%30%25%20%15%10%
5%0%
2008 2009 2010 2011 2012 2013 2014 2015 2016 2017
Maaori Pacific Islander Asian Indian European Other
Source: Extracted by Health Intelligence and Informatics 2018
The percentage of women undergoing caesarean section has also been increasing over the last ten years. As a percentage of births CM Health has gone from having a 17% caesarean section rate in 2008 to a 27% caesarean section rate in 2017. This trend has been noted across the country and we have commented on this in previous reports (see Figure 6).
FIGURE 6.
Caesarean section volumes and percentage of births at CM Health facilities, 2008-2017
1600
1400
1200
1000
800
600
400
200
02008 2009 2010 2011 2012 2013 2014 2015 2016 2017
Emergency CS Elective CS % of births
30%
25%
20%
15%
10%
5%
0%
Source: Extracted by Health Intelligence and Informatics 2018
The parity of women birthing at CM Health Facilities is also changing. Figure 7 shows that a lower percentage of women were having their first baby in 2017 compared with previous
WOMEN’S HEALTH AND NEWBORN ANNUAL REPORT 2017-2018 23
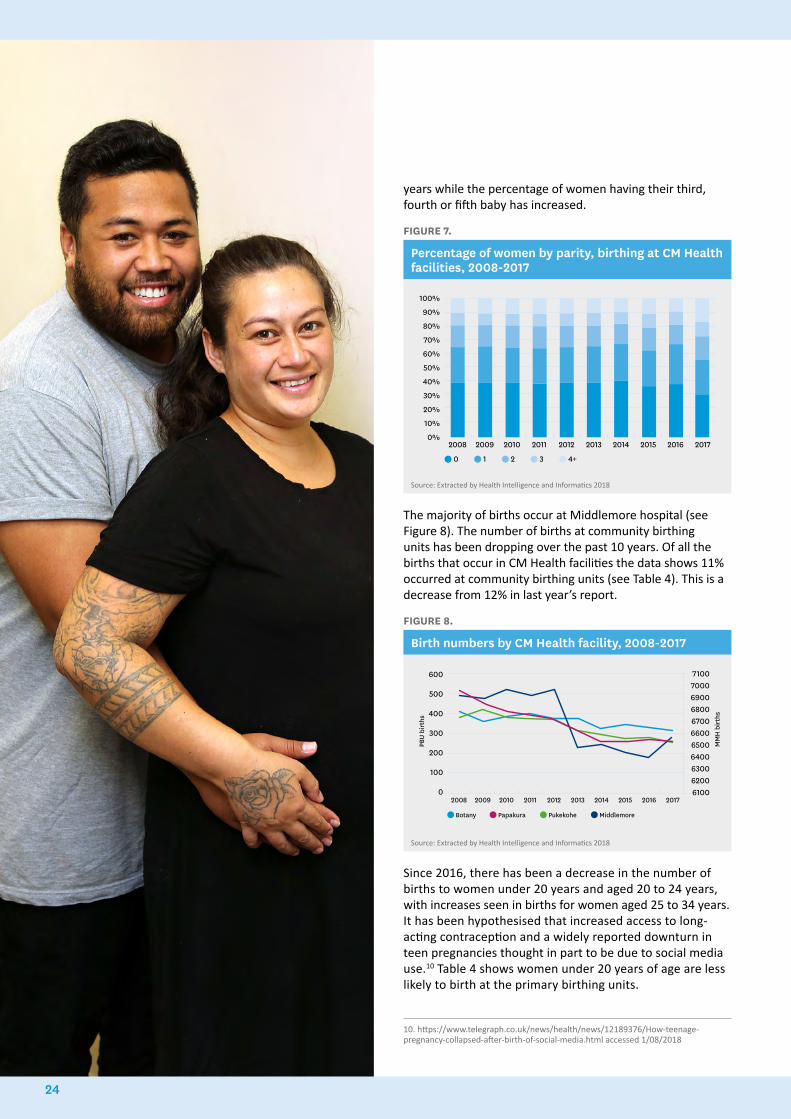
years while the percentage of women having their third, fourth or fifth baby has increased.
FIGURE 7.
Percentage of women by parity, birthing at CM Health facilities, 2008-2017
2008 2009 2010 2011 2012 2013 2014 2015 2016 2017
100%
90%
80%
70%
60%
50%
40%
30%
20%
10%
0%
0 1 2 3 4+
Source: Extracted by Health Intelligence and Informatics 2018
The majority of births occur at Middlemore hospital (see Figure 8). The number of births at community birthing units has been dropping over the past 10 years. Of all the births that occur in CM Health facilities the data shows 11% occurred at community birthing units (see Table 4). This is a decrease from 12% in last year’s report.
FIGURE 8.
Birth numbers by CM Health facility, 2008-2017
600
500
400
300
200
100
02008 2009 2010 2011 2012 2013 2014 2015 2016 2017
Botany Papakura Pukekohe Middlemore
71007000690068006700660065006400630062006100
PBU
birt
hs
MM
H b
irth
s
Source: Extracted by Health Intelligence and Informatics 2018
Since 2016, there has been a decrease in the number of births to women under 20 years and aged 20 to 24 years, with increases seen in births for women aged 25 to 34 years. It has been hypothesised that increased access to long-acting contraception and a widely reported downturn in teen pregnancies thought in part to be due to social media use.10 Table 4 shows women under 20 years of age are less likely to birth at the primary birthing units.
10. https://www.telegraph.co.uk/news/health/news/12189376/How-teenage-pregnancy-collapsed-after-birth-of-social-media.html accessed 1/08/2018
24
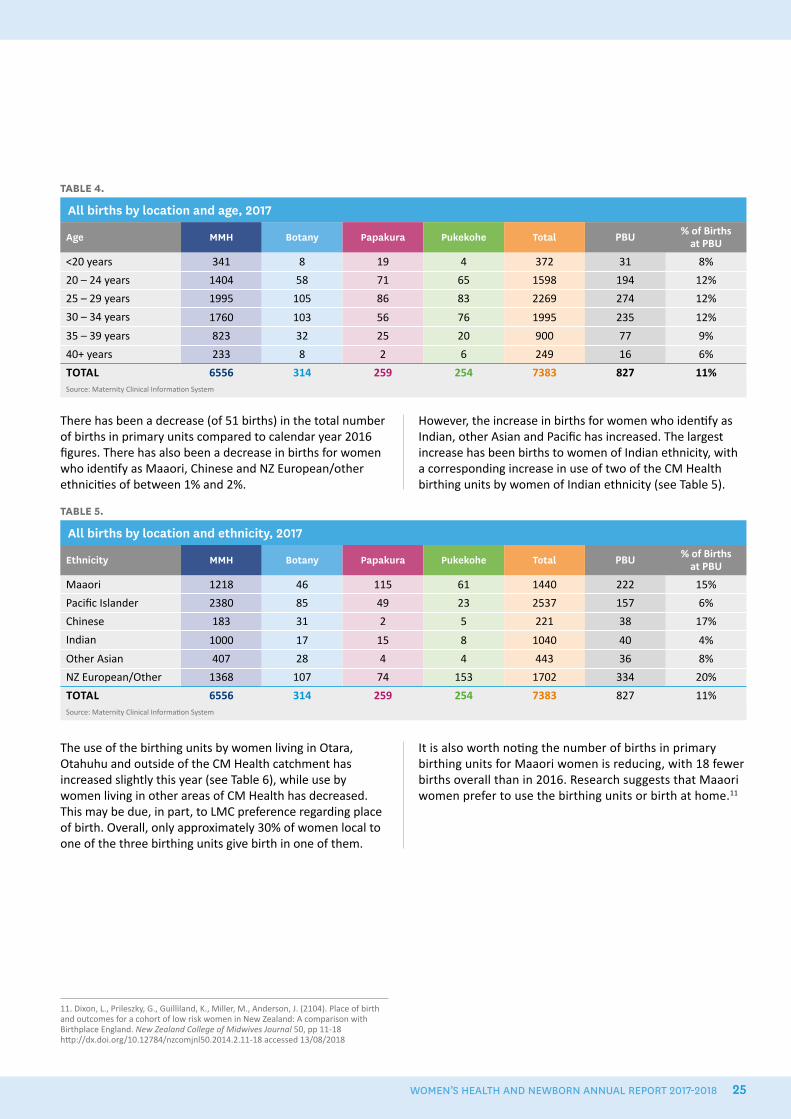
There has been a decrease (of 51 births) in the total number of births in primary units compared to calendar year 2016 figures. There has also been a decrease in births for women who identify as Maaori, Chinese and NZ European/other ethnicities of between 1% and 2%.
However, the increase in births for women who identify as Indian, other Asian and Pacific has increased. The largest increase has been births to women of Indian ethnicity, with a corresponding increase in use of two of the CM Health birthing units by women of Indian ethnicity (see Table 5).
TABLE 4.
All births by location and age, 2017
Age MMH Botany Papakura Pukekohe Total PBU % of Births at PBU
<20 years 341 8 19 4 372 31 8%
20 – 24 years 1404 58 71 65 1598 194 12%
25 – 29 years 1995 105 86 83 2269 274 12%
30 – 34 years 1760 103 56 76 1995 235 12%
35 – 39 years 823 32 25 20 900 77 9%
40+ years 233 8 2 6 249 16 6%
TOTAL 6556 314 259 254 7383 827 11%Source: Maternity Clinical Information System
TABLE 5.
All births by location and ethnicity, 2017
Ethnicity MMH Botany Papakura Pukekohe Total PBU % of Births at PBU
Maaori 1218 46 115 61 1440 222 15%
Pacific Islander 2380 85 49 23 2537 157 6%
Chinese 183 31 2 5 221 38 17%
Indian 1000 17 15 8 1040 40 4%
Other Asian 407 28 4 4 443 36 8%
NZ European/Other 1368 107 74 153 1702 334 20%
TOTAL 6556 314 259 254 7383 827 11%Source: Maternity Clinical Information System
The use of the birthing units by women living in Otara, Otahuhu and outside of the CM Health catchment has increased slightly this year (see Table 6), while use by women living in other areas of CM Health has decreased. This may be due, in part, to LMC preference regarding place of birth. Overall, only approximately 30% of women local to one of the three birthing units give birth in one of them.
It is also worth noting the number of births in primary birthing units for Maaori women is reducing, with 18 fewer births overall than in 2016. Research suggests that Maaori women prefer to use the birthing units or birth at home.11
11. Dixon, L., Prileszky, G., Guilliland, K., Miller, M., Anderson, J. (2104). Place of birth and outcomes for a cohort of low risk women in New Zealand: A comparison with Birthplace England. New Zealand College of Midwives Journal 50, pp 11-18 http://dx.doi.org/10.12784/nzcomjnl50.2014.2.11-18 accessed 13/08/2018
WOMEN’S HEALTH AND NEWBORN ANNUAL REPORT 2017-2018 25
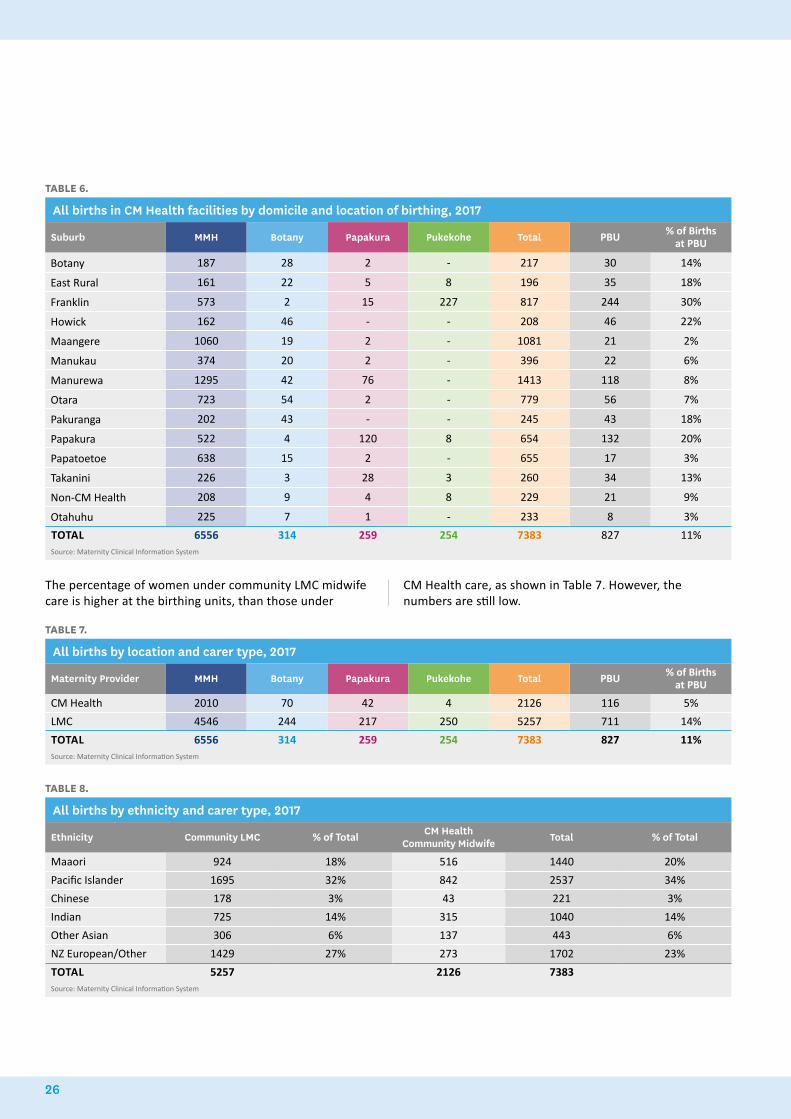
TABLE 6.
All births in CM Health facilities by domicile and location of birthing, 2017
Suburb MMH Botany Papakura Pukekohe Total PBU % of Births at PBU
Botany 187 28 2 - 217 30 14%
East Rural 161 22 5 8 196 35 18%
Franklin 573 2 15 227 817 244 30%
Howick 162 46 - - 208 46 22%
Maangere 1060 19 2 - 1081 21 2%
Manukau 374 20 2 - 396 22 6%
Manurewa 1295 42 76 - 1413 118 8%
Otara 723 54 2 - 779 56 7%
Pakuranga 202 43 - - 245 43 18%
Papakura 522 4 120 8 654 132 20%
Papatoetoe 638 15 2 - 655 17 3%
Takanini 226 3 28 3 260 34 13%
Non-CM Health 208 9 4 8 229 21 9%
Otahuhu 225 7 1 - 233 8 3%
TOTAL 6556 314 259 254 7383 827 11%Source: Maternity Clinical Information System
TABLE 7.
All births by location and carer type, 2017
Maternity Provider MMH Botany Papakura Pukekohe Total PBU % of Births at PBU
CM Health 2010 70 42 4 2126 116 5%
LMC 4546 244 217 250 5257 711 14%
TOTAL 6556 314 259 254 7383 827 11%Source: Maternity Clinical Information System
The percentage of women under community LMC midwife care is higher at the birthing units, than those under
CM Health care, as shown in Table 7. However, the numbers are still low.
TABLE 8.
All births by ethnicity and carer type, 2017
Ethnicity Community LMC % of Total CM Health Community Midwife Total % of Total
Maaori 924 18% 516 1440 20%
Pacific Islander 1695 32% 842 2537 34%
Chinese 178 3% 43 221 3%
Indian 725 14% 315 1040 14%
Other Asian 306 6% 137 443 6%
NZ European/Other 1429 27% 273 1702 23%
TOTAL 5257 2126 7383Source: Maternity Clinical Information System
26
An audit was undertaken to ascertain the number of women who could potentially birth at a birthing unit. Birth data was collected over 6 months, from July to December 2017, and reviewed to identify the number of women and their domicile. The audit identified that 27% of all women who birthed at Middlemore Hospital, which is primarily a secondary- and tertiary-level facility, are low risk and suitable to birth at a birthing unit. It was found that 15% these women lived in Mangere, 20% in Manurewa, 11% in Papatoetoe and 11% in Otara.
Data from the Maternity Clinical Information System also shows that the LMC for these women, who were identified as being appropriate to start labour in a primary birthing unit, was a community LMC midwife 75% of the time while 23% were under a CM Health community midwife. Thirty-five per cent (n=315) of these women were primigravidae.
Local research undertaken by Dr David Bailey has demonstrated that labour in birth units was associated with significantly lower rates of instrumental birth, caesarean section and blood transfusion compared with labour in hospital.12 Neonatal unit admission rates were lower for infants of nulliparous women labouring in birth units. Intrapartum and neonatal mortality rates for birth units were low and were not significantly different from the hospital population.13 The challenge is supporting mothers to make informed decisions about place of birth, and for their carer to be supported to birth in a primary setting.
It is acknowledged that Middlemore Hospital is both a secondary-care facility and the primary birthing facility for women who live locally or choose to birth there. Middlemore’s birthing and postnatal capacity is frequently exceeded and ideally primary women would birth in primary units. This would require access to a local birthing unit which women and LMCs felt confident birthing at.
The other drivers for women using Middlemore Hospital for primary birth could be lack of information for women regarding their choice of place of birth, the ability of community LMC midwifes to manage their caseloads in various birth locations, and issues surrounding travelling distances and traffic congestion, if women are birthing at multiple sites.
From a Pasifika woman’s perspective, there is a belief that having a first birth at a hospital is required and women are often influenced by their partner and their whaanau and friends.14
12. Bailey, D.J. 2017. Birth outcomes for women using free-standing birth centers in South Auckland. New Zealand Birth, 44(3): pp 246-251.13. Bailey, D.J. 2017. Birth outcomes for women using free-standing birth centers in South Auckland. New Zealand Birth, 44(3): pp 246-251.14. McAra-Couper, J., Farry, A., Marsters, N., Otukolo, D., Clemons, J., & Smythe, L. Pasifika women’s choice of birthplace. New Zealand College of Midwifes Journal 54, pp 15-21. Available at https://www.midwife.org.nz/resources-events/nzcom-journal
WOMEN’S HEALTH AND NEWBORN ANNUAL REPORT 2017-2018 27
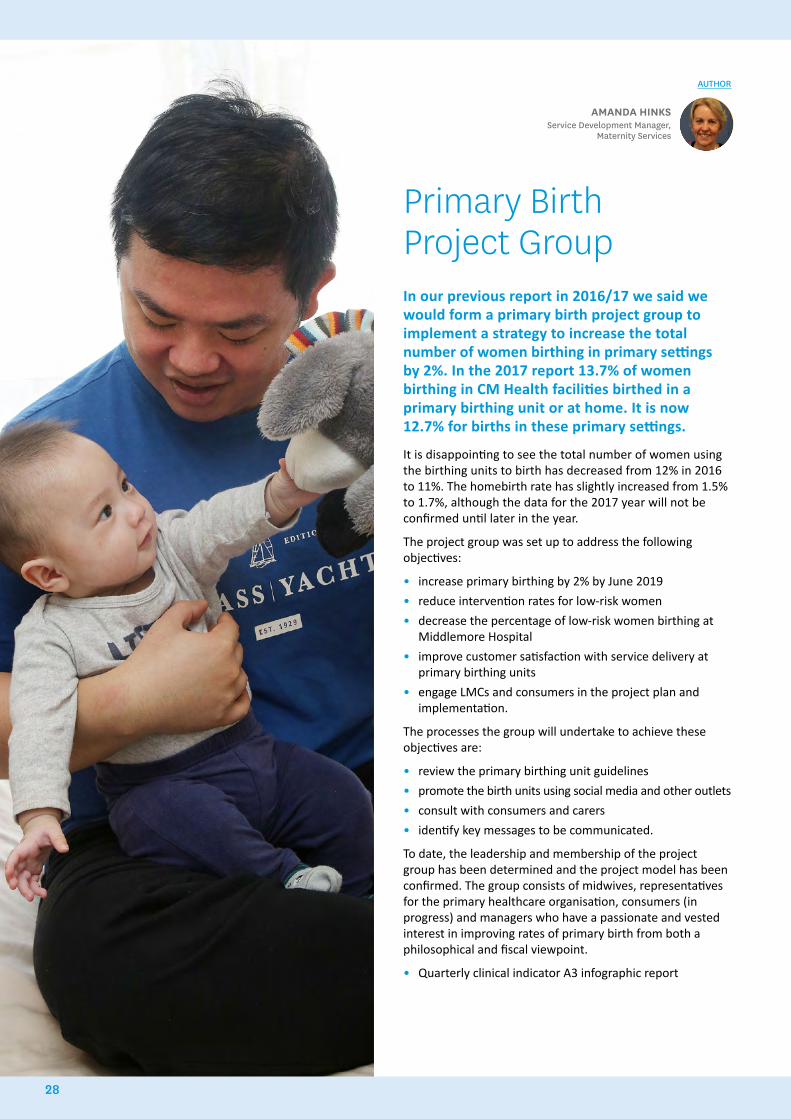
Primary Birth Project GroupIn our previous report in 2016/17 we said we would form a primary birth project group to implement a strategy to increase the total number of women birthing in primary settings by 2%. In the 2017 report 13.7% of women birthing in CM Health facilities birthed in a primary birthing unit or at home. It is now 12.7% for births in these primary settings.
It is disappointing to see the total number of women using the birthing units to birth has decreased from 12% in 2016 to 11%. The homebirth rate has slightly increased from 1.5% to 1.7%, although the data for the 2017 year will not be confirmed until later in the year.
The project group was set up to address the following objectives:
• increase primary birthing by 2% by June 2019
• reduce intervention rates for low-risk women
• decrease the percentage of low-risk women birthing at Middlemore Hospital
• improve customer satisfaction with service delivery at primary birthing units
• engage LMCs and consumers in the project plan and implementation.
The processes the group will undertake to achieve these objectives are:
• review the primary birthing unit guidelines
• promote the birth units using social media and other outlets
• consult with consumers and carers
• identify key messages to be communicated.
To date, the leadership and membership of the project group has been determined and the project model has been confirmed. The group consists of midwives, representatives for the primary healthcare organisation, consumers (in progress) and managers who have a passionate and vested interest in improving rates of primary birth from both a philosophical and fiscal viewpoint.
• Quarterly clinical indicator A3 infographic report
AMANDA HINKSService Development Manager,
Maternity Services
AUTHOR
28
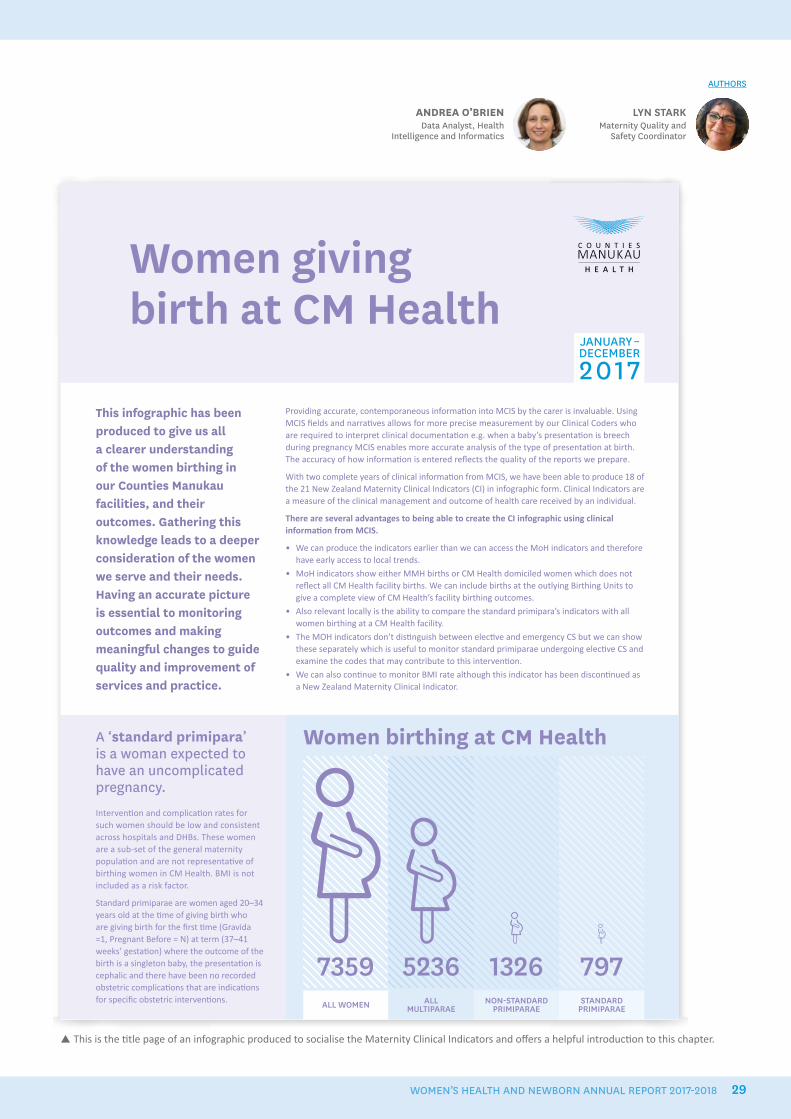
JANUARY–DECEMBER
2017
ALL WOMEN ALL MULTIPARAE
NON-STANDARD PRIMIPARAE
STANDARD PRIMIPARAE
7359 5236 1326 797
Women giving birth at CM Health
A ‘standard primipara’ is a woman expected to have an uncomplicated pregnancy.
Interventi on and complicati on rates for such women should be low and consistent across hospitals and DHBs. These women are a sub-set of the general maternity populati on and are not representati ve of birthing women in CM Health. BMI is not included as a risk factor.
Standard primiparae are women aged 20–34 years old at the ti me of giving birth who are giving birth for the fi rst ti me (Gravida =1, Pregnant Before = N) at term (37–41 weeks’ gestati on) where the outcome of the birth is a singleton baby, the presentati on is cephalic and there have been no recorded obstetric complicati ons that are indicati ons for specifi c obstetric interventi ons.
Providing accurate, contemporaneous informati on into MCIS by the carer is invaluable. Using MCIS fi elds and narrati ves allows for more precise measurement by our Clinical Coders who are required to interpret clinical documentati on e.g. when a baby’s presentati on is breech during pregnancy MCIS enables more accurate analysis of the type of presentati on at birth. The accuracy of how informati on is entered refl ects the quality of the reports we prepare.
With two complete years of clinical informati on from MCIS, we have been able to produce 18 of the 21 New Zealand Maternity Clinical Indicators (CI) in infographic form. Clinical Indicators are a measure of the clinical management and outcome of health care received by an individual.
There are several advantages to being able to create the CI infographic using clinical informati on from MCIS.
• We can produce the indicators earlier than we can access the MoH indicators and therefore have early access to local trends.
• MoH indicators show either MMH births or CM Health domiciled women which does not refl ect all CM Health facility births. We can include births at the outlying Birthing Units to give a complete view of CM Health’s facility birthing outcomes.
• Also relevant locally is the ability to compare the standard primipara’s indicators with all women birthing at a CM Health facility.
• The MOH indicators don’t disti nguish between electi ve and emergency CS but we can show these separately which is useful to monitor standard primiparae undergoing electi ve CS and examine the codes that may contribute to this interventi on.
• We can also conti nue to monitor BMI rate although this indicator has been disconti nued as a New Zealand Maternity Clinical Indicator.
Women birthing at CM Health
This infographic has been produced to give us all a clearer understanding of the women birthing in our Counties Manukau facilities, and their outcomes. Gathering this knowledge leads to a deeper consideration of the women we serve and their needs. Having an accurate picture is essential to monitoring outcomes and making meaningful changes to guide quality and improvement of services and practice.
This is the title page of an infographic produced to socialise the Maternity Clinical Indicators and offers a helpful introduction to this chapter.
LYN STARKMaternity Quality and
Safety Coordinator
ANDREA O’BRIENData Analyst, Health
Intelligence and Informatics
AUTHORS
WOMEN’S HEALTH AND NEWBORN ANNUAL REPORT 2017-2018 29
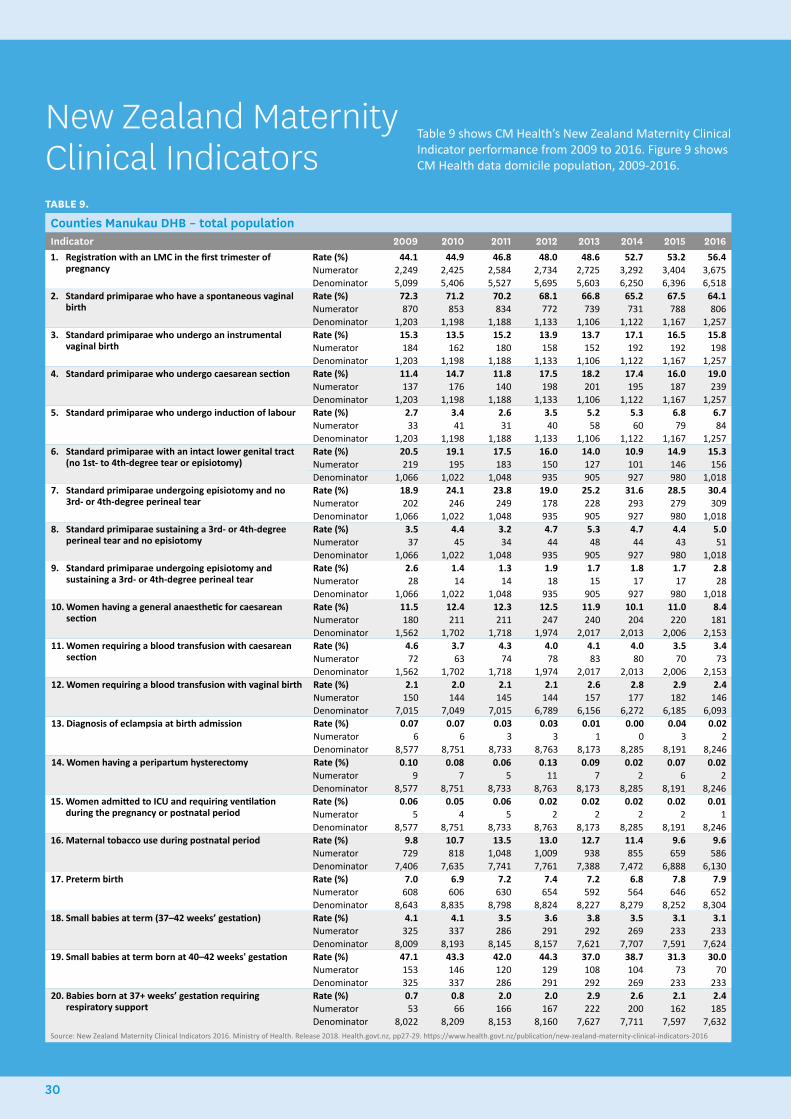
TABLE 9.
Counties Manukau DHB – total populationIndicator 2009 2010 2011 2012 2013 2014 2015 20161. Registration with an LMC in the first trimester of
pregnancyRate (%) 44.1 44.9 46.8 48.0 48.6 52.7 53.2 56.4Numerator 2,249 2,425 2,584 2,734 2,725 3,292 3,404 3,675Denominator 5,099 5,406 5,527 5,695 5,603 6,250 6,396 6,518
2. Standard primiparae who have a spontaneous vaginal birth
Rate (%) 72.3 71.2 70.2 68.1 66.8 65.2 67.5 64.1Numerator 870 853 834 772 739 731 788 806Denominator 1,203 1,198 1,188 1,133 1,106 1,122 1,167 1,257
3. Standard primiparae who undergo an instrumental vaginal birth
Rate (%) 15.3 13.5 15.2 13.9 13.7 17.1 16.5 15.8Numerator 184 162 180 158 152 192 192 198Denominator 1,203 1,198 1,188 1,133 1,106 1,122 1,167 1,257
4. Standard primiparae who undergo caesarean section Rate (%) 11.4 14.7 11.8 17.5 18.2 17.4 16.0 19.0Numerator 137 176 140 198 201 195 187 239Denominator 1,203 1,198 1,188 1,133 1,106 1,122 1,167 1,257
5. Standard primiparae who undergo induction of labour Rate (%) 2.7 3.4 2.6 3.5 5.2 5.3 6.8 6.7Numerator 33 41 31 40 58 60 79 84Denominator 1,203 1,198 1,188 1,133 1,106 1,122 1,167 1,257
6. Standard primiparae with an intact lower genital tract (no 1st- to 4th-degree tear or episiotomy)
Rate (%) 20.5 19.1 17.5 16.0 14.0 10.9 14.9 15.3Numerator 219 195 183 150 127 101 146 156Denominator 1,066 1,022 1,048 935 905 927 980 1,018
7. Standard primiparae undergoing episiotomy and no 3rd- or 4th-degree perineal tear
Rate (%) 18.9 24.1 23.8 19.0 25.2 31.6 28.5 30.4Numerator 202 246 249 178 228 293 279 309Denominator 1,066 1,022 1,048 935 905 927 980 1,018
8. Standard primiparae sustaining a 3rd- or 4th-degree perineal tear and no episiotomy
Rate (%) 3.5 4.4 3.2 4.7 5.3 4.7 4.4 5.0Numerator 37 45 34 44 48 44 43 51Denominator 1,066 1,022 1,048 935 905 927 980 1,018
9. Standard primiparae undergoing episiotomy and sustaining a 3rd- or 4th-degree perineal tear
Rate (%) 2.6 1.4 1.3 1.9 1.7 1.8 1.7 2.8Numerator 28 14 14 18 15 17 17 28Denominator 1,066 1,022 1,048 935 905 927 980 1,018
10. Women having a general anaesthetic for caesarean section
Rate (%) 11.5 12.4 12.3 12.5 11.9 10.1 11.0 8.4Numerator 180 211 211 247 240 204 220 181Denominator 1,562 1,702 1,718 1,974 2,017 2,013 2,006 2,153
11. Women requiring a blood transfusion with caesarean section
Rate (%) 4.6 3.7 4.3 4.0 4.1 4.0 3.5 3.4Numerator 72 63 74 78 83 80 70 73Denominator 1,562 1,702 1,718 1,974 2,017 2,013 2,006 2,153
12. Women requiring a blood transfusion with vaginal birth Rate (%) 2.1 2.0 2.1 2.1 2.6 2.8 2.9 2.4Numerator 150 144 145 144 157 177 182 146Denominator 7,015 7,049 7,015 6,789 6,156 6,272 6,185 6,093
13. Diagnosis of eclampsia at birth admission Rate (%) 0.07 0.07 0.03 0.03 0.01 0.00 0.04 0.02Numerator 6 6 3 3 1 0 3 2Denominator 8,577 8,751 8,733 8,763 8,173 8,285 8,191 8,246
14. Women having a peripartum hysterectomy Rate (%) 0.10 0.08 0.06 0.13 0.09 0.02 0.07 0.02Numerator 9 7 5 11 7 2 6 2Denominator 8,577 8,751 8,733 8,763 8,173 8,285 8,191 8,246
15. Women admitted to ICU and requiring ventilation during the pregnancy or postnatal period
Rate (%) 0.06 0.05 0.06 0.02 0.02 0.02 0.02 0.01Numerator 5 4 5 2 2 2 2 1Denominator 8,577 8,751 8,733 8,763 8,173 8,285 8,191 8,246
16. Maternal tobacco use during postnatal period Rate (%) 9.8 10.7 13.5 13.0 12.7 11.4 9.6 9.6Numerator 729 818 1,048 1,009 938 855 659 586Denominator 7,406 7,635 7,741 7,761 7,388 7,472 6,888 6,130
17. Preterm birth Rate (%) 7.0 6.9 7.2 7.4 7.2 6.8 7.8 7.9Numerator 608 606 630 654 592 564 646 652Denominator 8,643 8,835 8,798 8,824 8,227 8,279 8,252 8,304
18. Small babies at term (37–42 weeks’ gestation) Rate (%) 4.1 4.1 3.5 3.6 3.8 3.5 3.1 3.1Numerator 325 337 286 291 292 269 233 233Denominator 8,009 8,193 8,145 8,157 7,621 7,707 7,591 7,624
19. Small babies at term born at 40–42 weeks' gestation Rate (%) 47.1 43.3 42.0 44.3 37.0 38.7 31.3 30.0Numerator 153 146 120 129 108 104 73 70Denominator 325 337 286 291 292 269 233 233
20. Babies born at 37+ weeks’ gestation requiring respiratory support
Rate (%) 0.7 0.8 2.0 2.0 2.9 2.6 2.1 2.4Numerator 53 66 166 167 222 200 162 185Denominator 8,022 8,209 8,153 8,160 7,627 7,711 7,597 7,632
Source: New Zealand Maternity Clinical Indicators 2016. Ministry of Health. Release 2018. Health.govt.nz, pp27-29. https://www.health.govt.nz/publication/new-zealand-maternity-clinical-indicators-2016
New Zealand Maternity Clinical Indicators
Table 9 shows CM Health’s New Zealand Maternity Clinical Indicator performance from 2009 to 2016. Figure 9 shows CM Health data domicile population, 2009-2016.
30
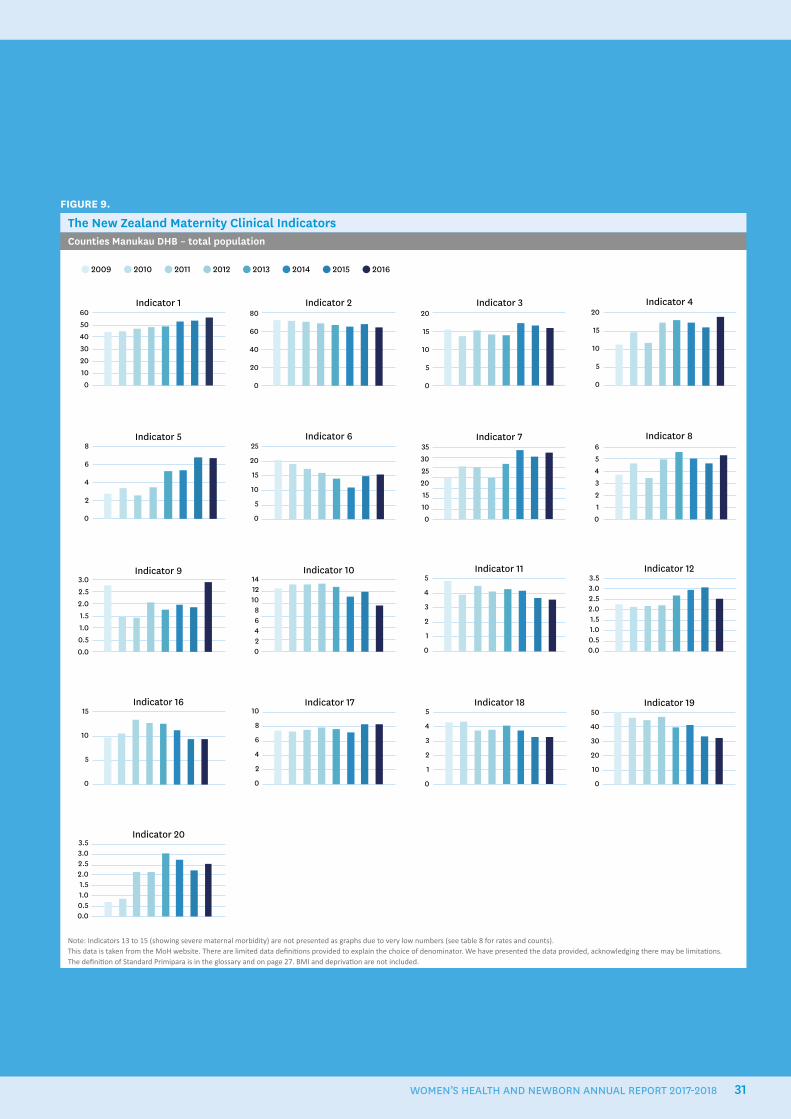
FIGURE 9.
The New Zealand Maternity Clinical IndicatorsCounties Manukau DHB – total population
Indicator 19
Indicator 20
50
40
30
20
10
0
3.53.02.52.01.51.00.50.0
Indicator 16 Indicator 17 Indicator 1810
8
6
4
2
0
15
10
5
0
5
4
3
2
1
0
Indicator 10 Indicator 11Indicator 9 Indicator 1214121086420
5
4
3
2
1
0
3.02.52.01.51.00.50.0
3.53.02.52.01.51.00.50.0
Indicator 46050403020100
Indicator 1 Indicator 3Indicator 280
60
40
20
0
20
15
10
5
0
20
15
10
5
0
Indicator 7Indicator 5 Indicator 8Indicator 63530252015100
654321
0
8
6
4
2
0
25
20
15
10
5
0
2009 2010 2011 2012 2013 2014 2015 2016
Note: Indicators 13 to 15 (showing severe maternal morbidity) are not presented as graphs due to very low numbers (see table 8 for rates and counts).This data is taken from the MoH website. There are limited data definitions provided to explain the choice of denominator. We have presented the data provided, acknowledging there may be limitations.The definition of Standard Primipara is in the glossary and on page 27. BMI and deprivation are not included.
WOMEN’S HEALTH AND NEWBORN ANNUAL REPORT 2017-2018 31
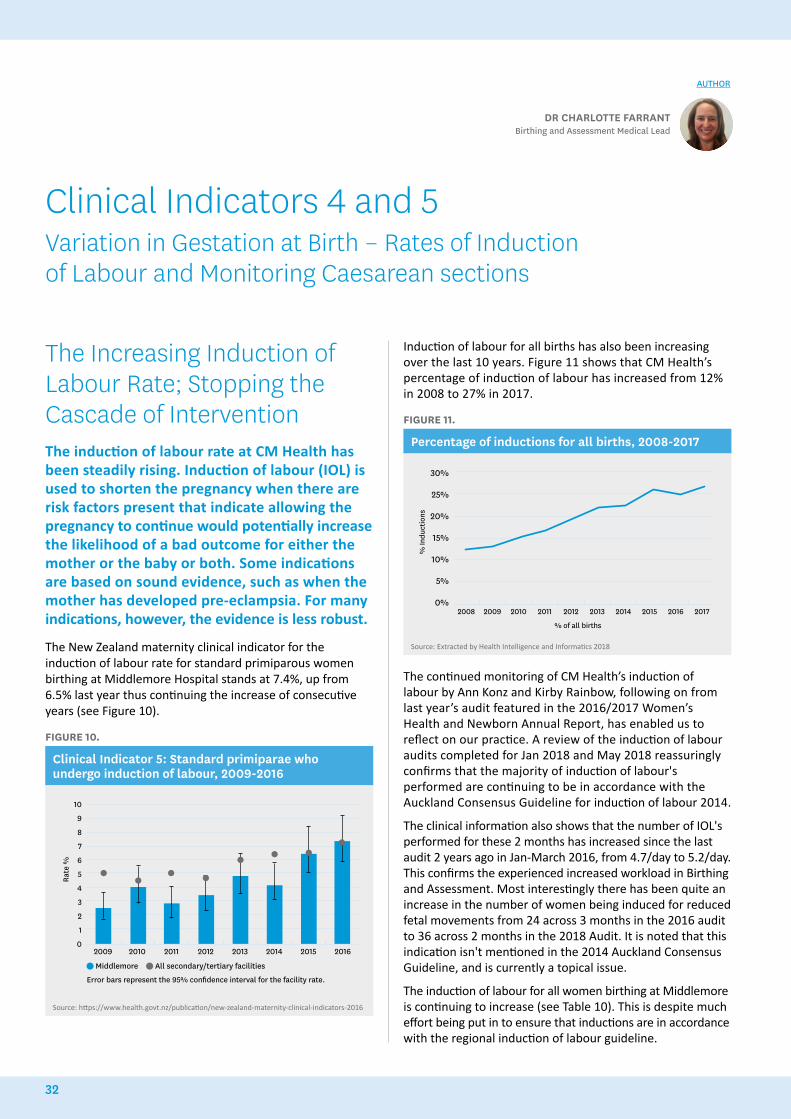
The Increasing Induction of Labour Rate; Stopping the Cascade of InterventionThe induction of labour rate at CM Health has been steadily rising. Induction of labour (IOL) is used to shorten the pregnancy when there are risk factors present that indicate allowing the pregnancy to continue would potentially increase the likelihood of a bad outcome for either the mother or the baby or both. Some indications are based on sound evidence, such as when the mother has developed pre-eclampsia. For many indications, however, the evidence is less robust.
The New Zealand maternity clinical indicator for the induction of labour rate for standard primiparous women birthing at Middlemore Hospital stands at 7.4%, up from 6.5% last year thus continuing the increase of consecutive years (see Figure 10).
FIGURE 10.
Clinical Indicator 5: Standard primiparae who undergo induction of labour, 2009-2016
2009 2010 2011 2012 2013 2014 2015 2016
10
9
8
7
6
5
4
3
2
1
0
Middlemore All secondary/tertiary facilities
Rate
%
Error bars represent the 95% confidence interval for the facility rate.
Source: https://www.health.govt.nz/publication/new-zealand-maternity-clinical-indicators-2016
Induction of labour for all births has also been increasing over the last 10 years. Figure 11 shows that CM Health’s percentage of induction of labour has increased from 12% in 2008 to 27% in 2017.
FIGURE 11.
Percentage of inductions for all births, 2008-2017
30%
25%
20%
15%
10%
5%
0%2008 2009 2010 2011 2012 2013 2014 2015 2016 2017
% In
duct
ions
% of all births
Source: Extracted by Health Intelligence and Informatics 2018
The continued monitoring of CM Health’s induction of labour by Ann Konz and Kirby Rainbow, following on from last year’s audit featured in the 2016/2017 Women’s Health and Newborn Annual Report, has enabled us to reflect on our practice. A review of the induction of labour audits completed for Jan 2018 and May 2018 reassuringly confirms that the majority of induction of labour's performed are continuing to be in accordance with the Auckland Consensus Guideline for induction of labour 2014.
The clinical information also shows that the number of IOL's performed for these 2 months has increased since the last audit 2 years ago in Jan-March 2016, from 4.7/day to 5.2/day. This confirms the experienced increased workload in Birthing and Assessment. Most interestingly there has been quite an increase in the number of women being induced for reduced fetal movements from 24 across 3 months in the 2016 audit to 36 across 2 months in the 2018 Audit. It is noted that this indication isn't mentioned in the 2014 Auckland Consensus Guideline, and is currently a topical issue.
The induction of labour for all women birthing at Middlemore is continuing to increase (see Table 10). This is despite much effort being put in to ensure that inductions are in accordance with the regional induction of labour guideline.
DR CHARLOTTE FARRANTBirthing and Assessment Medical Lead
AUTHOR
Clinical Indicators 4 and 5 Variation in Gestation at Birth – Rates of Induction of Labour and Monitoring Caesarean sections
32
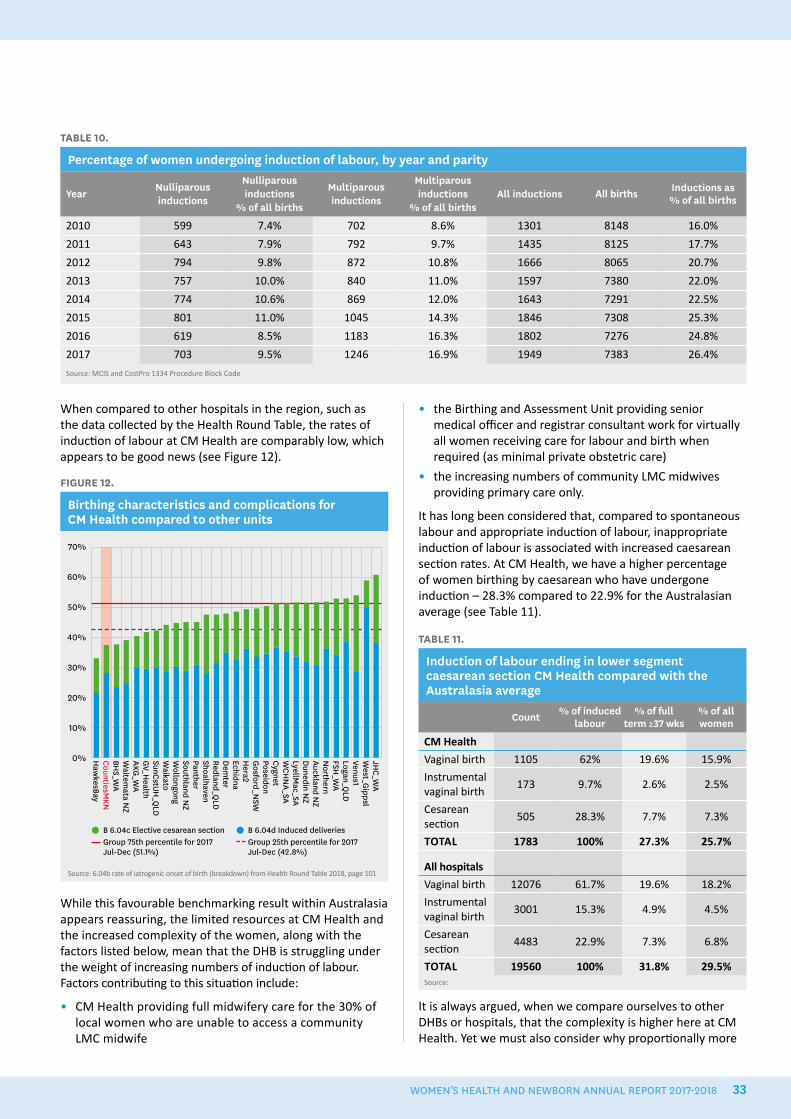
When compared to other hospitals in the region, such as the data collected by the Health Round Table, the rates of induction of labour at CM Health are comparably low, which appears to be good news (see Figure 12).
FIGURE 12.
Birthing characteristics and complications for CM Health compared to other units
70%
60%
50%
40%
30%
20%
10%
0%
B 6.04c Elective cesarean section Group 75th percentile for 2017 Jul-Dec (51.1%)
B 6.04d Induced deliveries Group 25th percentile for 2017 Jul-Dec (42.8%)
JHC_W
AW
est_Gippsl
Venus1Logan_Q
LDFSH
_WA
Northern
Auckland NZ
Dunedin N
ZLyellM
ac_SAW
CHN
A_SACygnetPoseidonG
osford_NSW
Hera2
EchidnaD
emter
Redland_QLD
ShoalhavenPantherSouthland N
ZW
ollongongW
aikatoSunCstUH
_QLD
GV_H
ealthAKG
_WA
Waitem
ata NZ
BHS_W
ACountiesM
KNH
awkesBay
Source: 6.04b rate of iatrogenic onset of birth (breakdown) from Health Round Table 2018, page 101
While this favourable benchmarking result within Australasia appears reassuring, the limited resources at CM Health and the increased complexity of the women, along with the factors listed below, mean that the DHB is struggling under the weight of increasing numbers of induction of labour. Factors contributing to this situation include:
• CM Health providing full midwifery care for the 30% of local women who are unable to access a community LMC midwife
• the Birthing and Assessment Unit providing senior medical officer and registrar consultant work for virtually all women receiving care for labour and birth when required (as minimal private obstetric care)
• the increasing numbers of community LMC midwives providing primary care only.
It has long been considered that, compared to spontaneous labour and appropriate induction of labour, inappropriate induction of labour is associated with increased caesarean section rates. At CM Health, we have a higher percentage of women birthing by caesarean who have undergone induction – 28.3% compared to 22.9% for the Australasian average (see Table 11).
TABLE 11.
Induction of labour ending in lower segment caesarean section CM Health compared with the Australasia average
Count % of induced labour
% of full term ≥37 wks
% of all women
CM Health
Vaginal birth 1105 62% 19.6% 15.9%
Instrumental vaginal birth
173 9.7% 2.6% 2.5%
Cesarean section
505 28.3% 7.7% 7.3%
TOTAL 1783 100% 27.3% 25.7%
All hospitals
Vaginal birth 12076 61.7% 19.6% 18.2%
Instrumental vaginal birth
3001 15.3% 4.9% 4.5%
Cesarean section
4483 22.9% 7.3% 6.8%
TOTAL 19560 100% 31.8% 29.5%Source:
It is always argued, when we compare ourselves to other DHBs or hospitals, that the complexity is higher here at CM Health. Yet we must also consider why proportionally more
TABLE 10.
Percentage of women undergoing induction of labour, by year and parity
YearNulliparousinductions
Nulliparousinductions
% of all births
Multiparous inductions
Multiparous inductions
% of all birthsAll inductions All births Inductions as
% of all births
2010 599 7.4% 702 8.6% 1301 8148 16.0%
2011 643 7.9% 792 9.7% 1435 8125 17.7%
2012 794 9.8% 872 10.8% 1666 8065 20.7%
2013 757 10.0% 840 11.0% 1597 7380 22.0%
2014 774 10.6% 869 12.0% 1643 7291 22.5%
2015 801 11.0% 1045 14.3% 1846 7308 25.3%
2016 619 8.5% 1183 16.3% 1802 7276 24.8%
2017 703 9.5% 1246 16.9% 1949 7383 26.4%
Source: MCIS and CostPro 1334 Procedure Block Code
WOMEN’S HEALTH AND NEWBORN ANNUAL REPORT 2017-2018 33
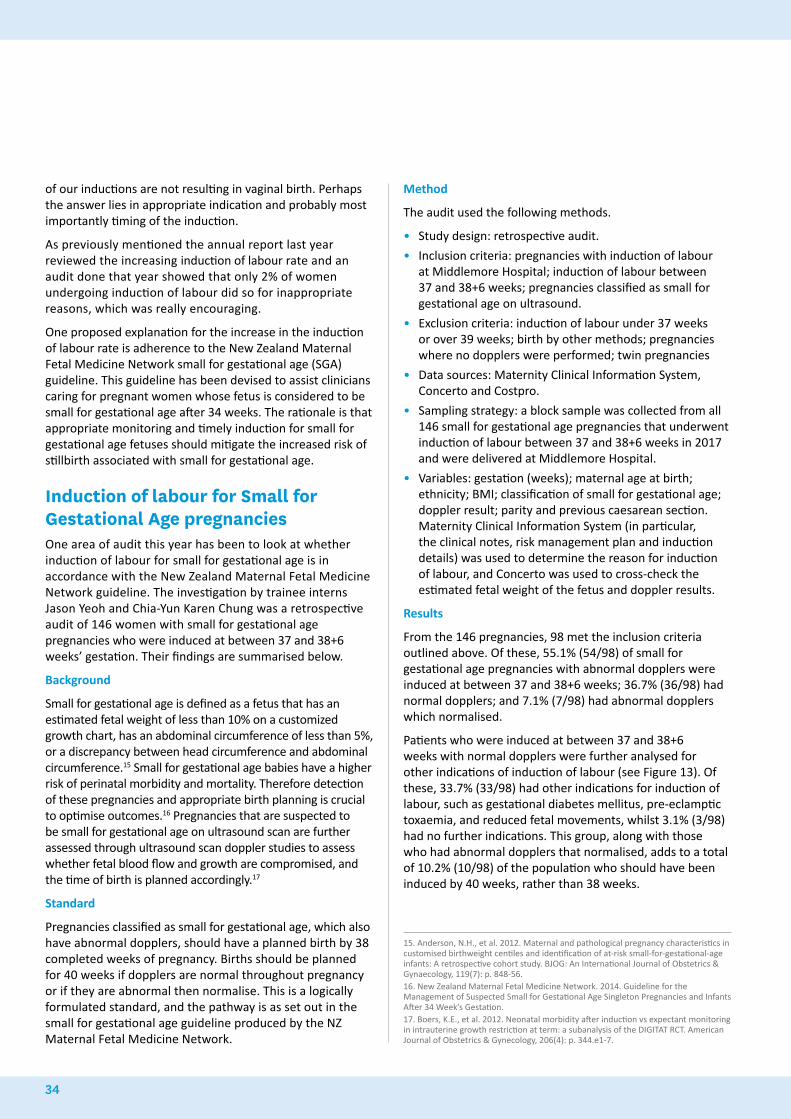
of our inductions are not resulting in vaginal birth. Perhaps the answer lies in appropriate indication and probably most importantly timing of the induction.
As previously mentioned the annual report last year reviewed the increasing induction of labour rate and an audit done that year showed that only 2% of women undergoing induction of labour did so for inappropriate reasons, which was really encouraging.
One proposed explanation for the increase in the induction of labour rate is adherence to the New Zealand Maternal Fetal Medicine Network small for gestational age (SGA) guideline. This guideline has been devised to assist clinicians caring for pregnant women whose fetus is considered to be small for gestational age after 34 weeks. The rationale is that appropriate monitoring and timely induction for small for gestational age fetuses should mitigate the increased risk of stillbirth associated with small for gestational age.
Induction of labour for Small for Gestational Age pregnanciesOne area of audit this year has been to look at whether induction of labour for small for gestational age is in accordance with the New Zealand Maternal Fetal Medicine Network guideline. The investigation by trainee interns Jason Yeoh and Chia-Yun Karen Chung was a retrospective audit of 146 women with small for gestational age pregnancies who were induced at between 37 and 38+6 weeks’ gestation. Their findings are summarised below.
Background
Small for gestational age is defined as a fetus that has an estimated fetal weight of less than 10% on a customized growth chart, has an abdominal circumference of less than 5%, or a discrepancy between head circumference and abdominal circumference.15 Small for gestational age babies have a higher risk of perinatal morbidity and mortality. Therefore detection of these pregnancies and appropriate birth planning is crucial to optimise outcomes.16 Pregnancies that are suspected to be small for gestational age on ultrasound scan are further assessed through ultrasound scan doppler studies to assess whether fetal blood flow and growth are compromised, and the time of birth is planned accordingly.17
Standard
Pregnancies classified as small for gestational age, which also have abnormal dopplers, should have a planned birth by 38 completed weeks of pregnancy. Births should be planned for 40 weeks if dopplers are normal throughout pregnancy or if they are abnormal then normalise. This is a logically formulated standard, and the pathway is as set out in the small for gestational age guideline produced by the NZ Maternal Fetal Medicine Network.
Method
The audit used the following methods.
• Study design: retrospective audit.
• Inclusion criteria: pregnancies with induction of labour at Middlemore Hospital; induction of labour between 37 and 38+6 weeks; pregnancies classified as small for gestational age on ultrasound.
• Exclusion criteria: induction of labour under 37 weeks or over 39 weeks; birth by other methods; pregnancies where no dopplers were performed; twin pregnancies
• Data sources: Maternity Clinical Information System, Concerto and Costpro.
• Sampling strategy: a block sample was collected from all 146 small for gestational age pregnancies that underwent induction of labour between 37 and 38+6 weeks in 2017 and were delivered at Middlemore Hospital.
• Variables: gestation (weeks); maternal age at birth; ethnicity; BMI; classification of small for gestational age; doppler result; parity and previous caesarean section. Maternity Clinical Information System (in particular, the clinical notes, risk management plan and induction details) was used to determine the reason for induction of labour, and Concerto was used to cross-check the estimated fetal weight of the fetus and doppler results.
Results
From the 146 pregnancies, 98 met the inclusion criteria outlined above. Of these, 55.1% (54/98) of small for gestational age pregnancies with abnormal dopplers were induced at between 37 and 38+6 weeks; 36.7% (36/98) had normal dopplers; and 7.1% (7/98) had abnormal dopplers which normalised.
Patients who were induced at between 37 and 38+6 weeks with normal dopplers were further analysed for other indications of induction of labour (see Figure 13). Of these, 33.7% (33/98) had other indications for induction of labour, such as gestational diabetes mellitus, pre-eclamptic toxaemia, and reduced fetal movements, whilst 3.1% (3/98) had no further indications. This group, along with those who had abnormal dopplers that normalised, adds to a total of 10.2% (10/98) of the population who should have been induced by 40 weeks, rather than 38 weeks.
15. Anderson, N.H., et al. 2012. Maternal and pathological pregnancy characteristics in customised birthweight centiles and identification of at-risk small-for-gestational-age infants: A retrospective cohort study. BJOG: An International Journal of Obstetrics & Gynaecology, 119(7): p. 848-56.16. New Zealand Maternal Fetal Medicine Network. 2014. Guideline for the Management of Suspected Small for Gestational Age Singleton Pregnancies and Infants After 34 Week’s Gestation.17. Boers, K.E., et al. 2012. Neonatal morbidity after induction vs expectant monitoring in intrauterine growth restriction at term: a subanalysis of the DIGITAT RCT. American Journal of Obstetrics & Gynecology, 206(4): p. 344.e1-7.
34
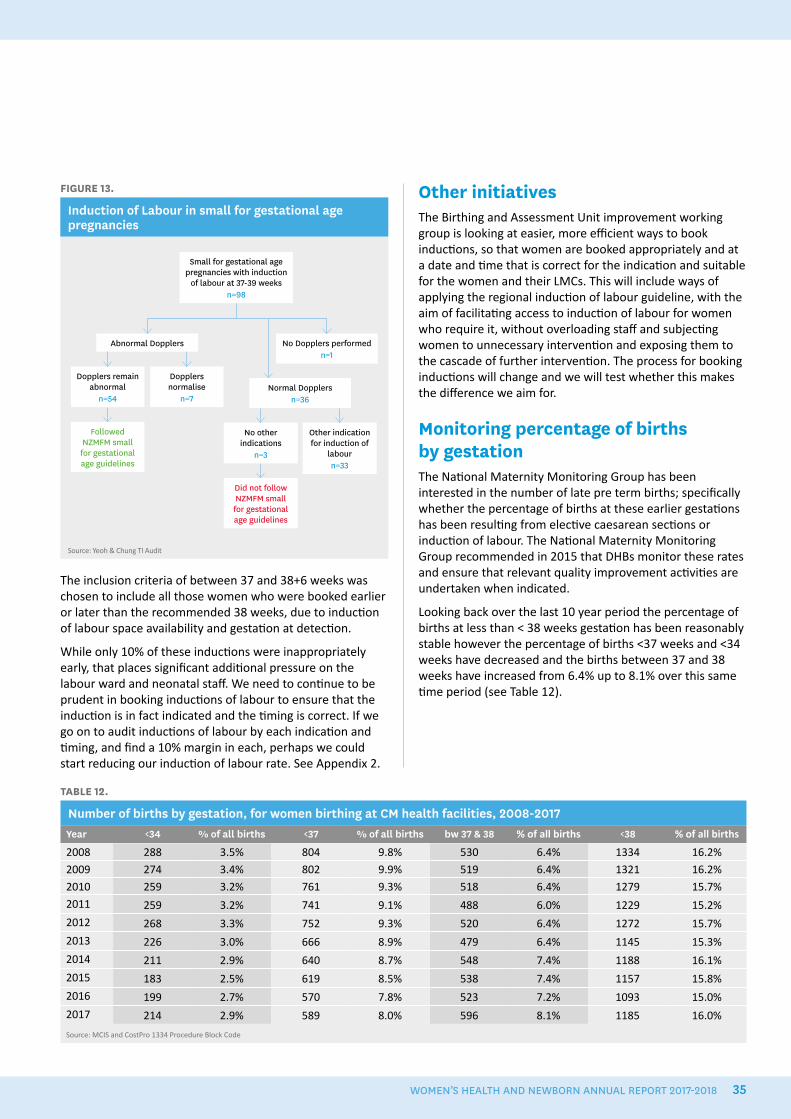
FIGURE 13.
Induction of Labour in small for gestational age pregnancies
Small for gestational age pregnancies with induction
of labour at 37-39 weeksn=98
Abnormal Dopplers
Dopplers remain abnormal
n=54
Dopplers normalise
n=7
No Dopplers performedn=1
Normal Dopplersn=36
No other indications
n=3
Other indication for induction of
labourn=33
Did not follow NZMFM small for gestational age guidelines
Followed NZMFM small for gestational age guidelines
Source: Yeoh & Chung TI Audit
The inclusion criteria of between 37 and 38+6 weeks was chosen to include all those women who were booked earlier or later than the recommended 38 weeks, due to induction of labour space availability and gestation at detection.
While only 10% of these inductions were inappropriately early, that places significant additional pressure on the labour ward and neonatal staff. We need to continue to be prudent in booking inductions of labour to ensure that the induction is in fact indicated and the timing is correct. If we go on to audit inductions of labour by each indication and timing, and find a 10% margin in each, perhaps we could start reducing our induction of labour rate. See Appendix 2.
Other initiativesThe Birthing and Assessment Unit improvement working group is looking at easier, more efficient ways to book inductions, so that women are booked appropriately and at a date and time that is correct for the indication and suitable for the women and their LMCs. This will include ways of applying the regional induction of labour guideline, with the aim of facilitating access to induction of labour for women who require it, without overloading staff and subjecting women to unnecessary intervention and exposing them to the cascade of further intervention. The process for booking inductions will change and we will test whether this makes the difference we aim for.
Monitoring percentage of births by gestationThe National Maternity Monitoring Group has been interested in the number of late pre term births; specifically whether the percentage of births at these earlier gestations has been resulting from elective caesarean sections or induction of labour. The National Maternity Monitoring Group recommended in 2015 that DHBs monitor these rates and ensure that relevant quality improvement activities are undertaken when indicated.
Looking back over the last 10 year period the percentage of births at less than < 38 weeks gestation has been reasonably stable however the percentage of births <37 weeks and <34 weeks have decreased and the births between 37 and 38 weeks have increased from 6.4% up to 8.1% over this same time period (see Table 12).
TABLE 12.
Number of births by gestation, for women birthing at CM health facilities, 2008-2017Year <34 % of all births <37 % of all births bw 37 & 38 % of all births <38 % of all births
2008 288 3.5% 804 9.8% 530 6.4% 1334 16.2%
2009 274 3.4% 802 9.9% 519 6.4% 1321 16.2%
2010 259 3.2% 761 9.3% 518 6.4% 1279 15.7%
2011 259 3.2% 741 9.1% 488 6.0% 1229 15.2%
2012 268 3.3% 752 9.3% 520 6.4% 1272 15.7%
2013 226 3.0% 666 8.9% 479 6.4% 1145 15.3%
2014 211 2.9% 640 8.7% 548 7.4% 1188 16.1%
2015 183 2.5% 619 8.5% 538 7.4% 1157 15.8%
2016 199 2.7% 570 7.8% 523 7.2% 1093 15.0%
2017 214 2.9% 589 8.0% 596 8.1% 1185 16.0%
Source: MCIS and CostPro 1334 Procedure Block Code
WOMEN’S HEALTH AND NEWBORN ANNUAL REPORT 2017-2018 35
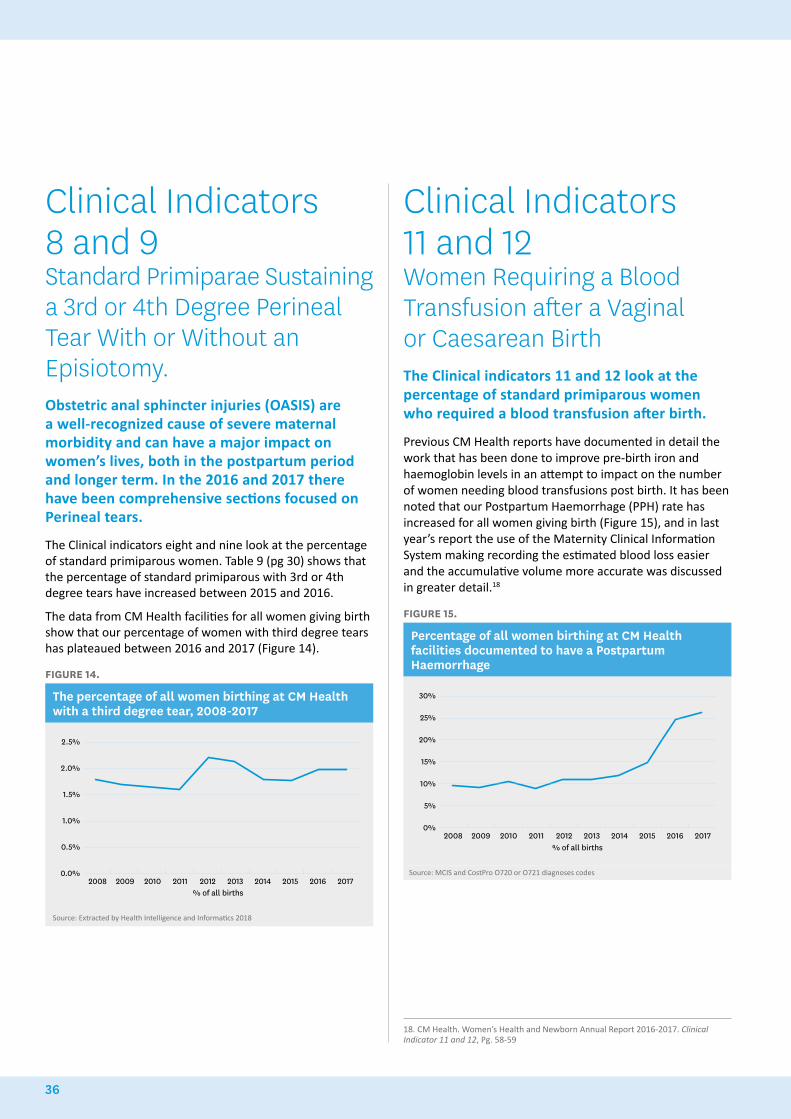
Clinical Indicators 8 and 9 Standard Primiparae Sustaining a 3rd or 4th Degree Perineal Tear With or Without an Episiotomy. Obstetric anal sphincter injuries (OASIS) are a well-recognized cause of severe maternal morbidity and can have a major impact on women’s lives, both in the postpartum period and longer term. In the 2016 and 2017 there have been comprehensive sections focused on Perineal tears.
The Clinical indicators eight and nine look at the percentage of standard primiparous women. Table 9 (pg 30) shows that the percentage of standard primiparous with 3rd or 4th degree tears have increased between 2015 and 2016.
The data from CM Health facilities for all women giving birth show that our percentage of women with third degree tears has plateaued between 2016 and 2017 (Figure 14).
FIGURE 14.
The percentage of all women birthing at CM Health with a third degree tear, 2008-2017
2.5%
2.0%
1.5%
1.0%
0.5%
0.0%
% of all births2008 2009 2010 2011 2012 2013 2014 2015 2016 2017
Source: Extracted by Health Intelligence and Informatics 2018
Clinical Indicators 11 and 12 Women Requiring a Blood Transfusion after a Vaginal or Caesarean BirthThe Clinical indicators 11 and 12 look at the percentage of standard primiparous women who required a blood transfusion after birth.
Previous CM Health reports have documented in detail the work that has been done to improve pre-birth iron and haemoglobin levels in an attempt to impact on the number of women needing blood transfusions post birth. It has been noted that our Postpartum Haemorrhage (PPH) rate has increased for all women giving birth (Figure 15), and in last year’s report the use of the Maternity Clinical Information System making recording the estimated blood loss easier and the accumulative volume more accurate was discussed in greater detail.18
FIGURE 15.
Percentage of all women birthing at CM Health facilities documented to have a Postpartum Haemorrhage
30%
25%
20%
15%
10%
5%
0%
% of all births2008 2009 2010 2011 2012 2013 2014 2015 2016 2017
Source: MCIS and CostPro O720 or O721 diagnoses codes
18. CM Health. Women’s Health and Newborn Annual Report 2016-2017. Clinical Indicator 11 and 12, Pg. 58-59
36
Of interest, the number of primiparous women requiring a blood transfusion has fallen as documented by the Clinical Indicators 11 and 12 (Figure 9). Data from CM Health facilities for women birthing show that this has possibly been trending down over the last three years (Table 13). It is possible the denominator has increased due to better recording of Postpartum Haemorrhage in the Maternity Clinical Information System (MCIS).
TABLE 13.
Percentage of women with a Postpartum Haemorrhage requiring blood transfusion for all women birthing at CM Health facilities
Year Blood Transfusions
All Postpartum Haemorrhage
Cases
Transfusions as % of
Postpartum Haemorrhage
2003 87 521 16.7%
2004 67 493 13.6%
2005 91 428 21.3%
2006 90 575 15.7%
2007 125 802 15.6%
2008 169 827 20.4%
2009 165 797 20.7%
2010 144 872 16.5%
2011 154 750 20.5%
2012 185 899 20.6%
2013 149 758 19.7%
2014 165 860 19.2%
2015 169 1061 15.9%
2016 143 1740 8.2%
2017 227 1888 12.0%Source: MCIS and CostPro O720 or O721 diagnoses codes
WOMEN’S HEALTH AND NEWBORN ANNUAL REPORT 2017-2018 37
Women will easily access a local lead maternity carer who will provide individualised care, navigate and support the woman and her family/whaanau through the maternity care system as close to home as possible
38
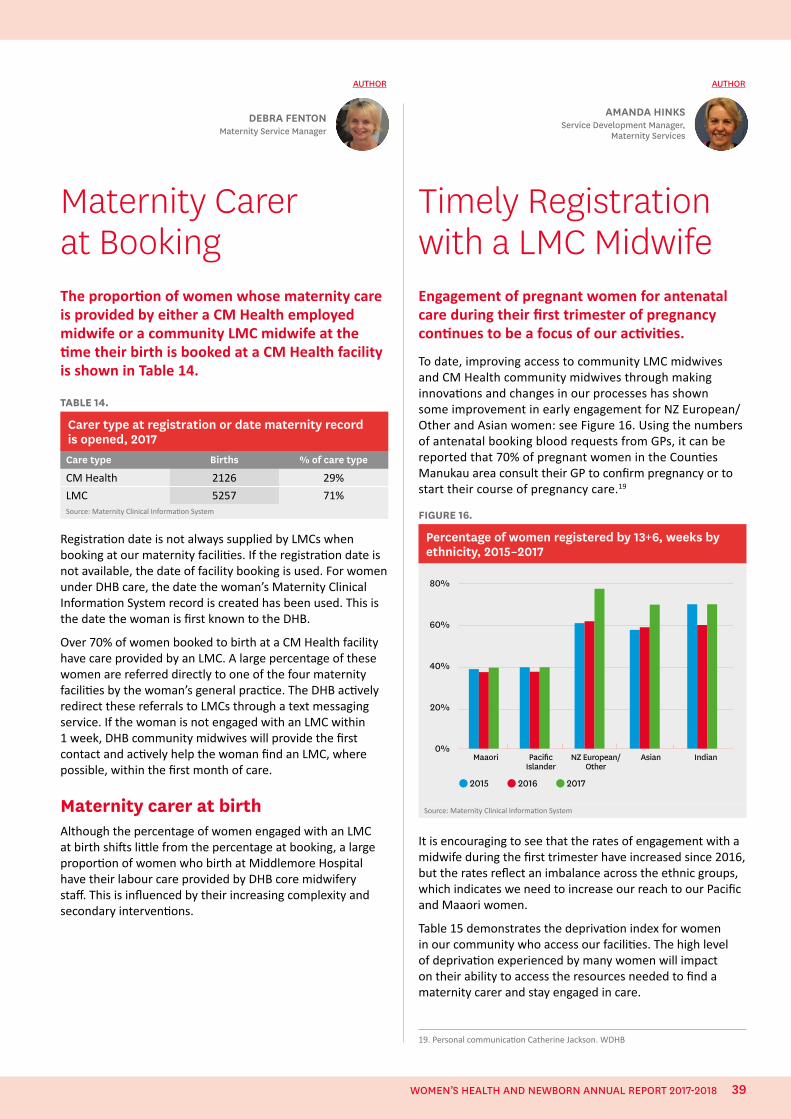
Maternity Carer at BookingThe proportion of women whose maternity care is provided by either a CM Health employed midwife or a community LMC midwife at the time their birth is booked at a CM Health facility is shown in Table 14.
TABLE 14.
Carer type at registration or date maternity record is opened, 2017Care type Births % of care type
CM Health 2126 29%
LMC 5257 71%Source: Maternity Clinical Information System
Registration date is not always supplied by LMCs when booking at our maternity facilities. If the registration date is not available, the date of facility booking is used. For women under DHB care, the date the woman’s Maternity Clinical Information System record is created has been used. This is the date the woman is first known to the DHB.
Over 70% of women booked to birth at a CM Health facility have care provided by an LMC. A large percentage of these women are referred directly to one of the four maternity facilities by the woman’s general practice. The DHB actively redirect these referrals to LMCs through a text messaging service. If the woman is not engaged with an LMC within 1 week, DHB community midwives will provide the first contact and actively help the woman find an LMC, where possible, within the first month of care.
Maternity carer at birthAlthough the percentage of women engaged with an LMC at birth shifts little from the percentage at booking, a large proportion of women who birth at Middlemore Hospital have their labour care provided by DHB core midwifery staff. This is influenced by their increasing complexity and secondary interventions.
Timely Registration with a LMC MidwifeEngagement of pregnant women for antenatal care during their first trimester of pregnancy continues to be a focus of our activities.
To date, improving access to community LMC midwives and CM Health community midwives through making innovations and changes in our processes has shown some improvement in early engagement for NZ European/Other and Asian women: see Figure 16. Using the numbers of antenatal booking blood requests from GPs, it can be reported that 70% of pregnant women in the Counties Manukau area consult their GP to confirm pregnancy or to start their course of pregnancy care.19
FIGURE 16.
Percentage of women registered by 13+6, weeks by ethnicity, 2015–2017
Maaori Pacific Islander
NZ European/Other
Asian Indian
80%
60%
40%
20%
0%
2015 2016 2017
Source: Maternity Clinical Information System
It is encouraging to see that the rates of engagement with a midwife during the first trimester have increased since 2016, but the rates reflect an imbalance across the ethnic groups, which indicates we need to increase our reach to our Pacific and Maaori women.
Table 15 demonstrates the deprivation index for women in our community who access our facilities. The high level of deprivation experienced by many women will impact on their ability to access the resources needed to find a maternity carer and stay engaged in care.
DEBRA FENTONMaternity Service Manager
AUTHOR
AMANDA HINKSService Development Manager,
Maternity Services
AUTHOR
19. Personal communication Catherine Jackson. WDHB
WOMEN’S HEALTH AND NEWBORN ANNUAL REPORT 2017-2018 39
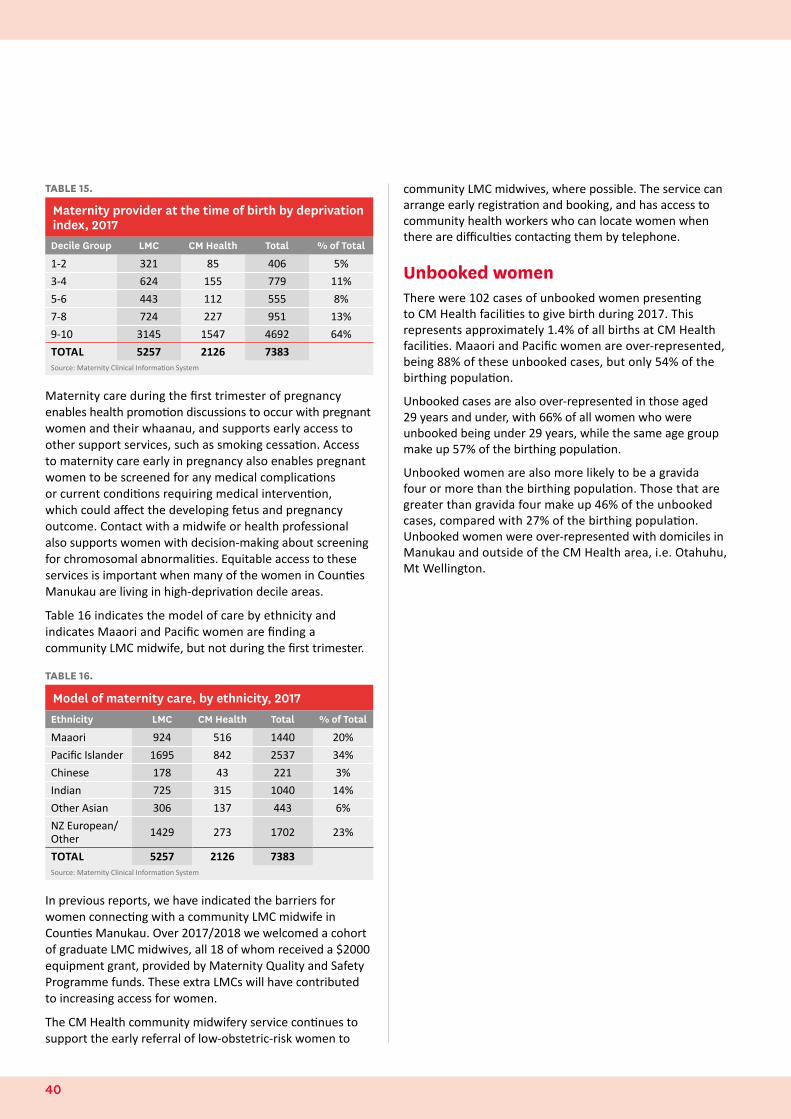
TABLE 15.
Maternity provider at the time of birth by deprivation index, 2017Decile Group LMC CM Health Total % of Total
1-2 321 85 406 5%
3-4 624 155 779 11%
5-6 443 112 555 8%
7-8 724 227 951 13%
9-10 3145 1547 4692 64%
TOTAL 5257 2126 7383 Source: Maternity Clinical Information System
Maternity care during the first trimester of pregnancy enables health promotion discussions to occur with pregnant women and their whaanau, and supports early access to other support services, such as smoking cessation. Access to maternity care early in pregnancy also enables pregnant women to be screened for any medical complications or current conditions requiring medical intervention, which could affect the developing fetus and pregnancy outcome. Contact with a midwife or health professional also supports women with decision-making about screening for chromosomal abnormalities. Equitable access to these services is important when many of the women in Counties Manukau are living in high-deprivation decile areas.
Table 16 indicates the model of care by ethnicity and indicates Maaori and Pacific women are finding a community LMC midwife, but not during the first trimester.
TABLE 16.
Model of maternity care, by ethnicity, 2017Ethnicity LMC CM Health Total % of Total
Maaori 924 516 1440 20%
Pacific Islander 1695 842 2537 34%
Chinese 178 43 221 3%
Indian 725 315 1040 14%
Other Asian 306 137 443 6%
NZ European/Other 1429 273 1702 23%
TOTAL 5257 2126 7383Source: Maternity Clinical Information System
In previous reports, we have indicated the barriers for women connecting with a community LMC midwife in Counties Manukau. Over 2017/2018 we welcomed a cohort of graduate LMC midwives, all 18 of whom received a $2000 equipment grant, provided by Maternity Quality and Safety Programme funds. These extra LMCs will have contributed to increasing access for women.
The CM Health community midwifery service continues to support the early referral of low-obstetric-risk women to
community LMC midwives, where possible. The service can arrange early registration and booking, and has access to community health workers who can locate women when there are difficulties contacting them by telephone.
Unbooked womenThere were 102 cases of unbooked women presenting to CM Health facilities to give birth during 2017. This represents approximately 1.4% of all births at CM Health facilities. Maaori and Pacific women are over-represented, being 88% of these unbooked cases, but only 54% of the birthing population.
Unbooked cases are also over-represented in those aged 29 years and under, with 66% of all women who were unbooked being under 29 years, while the same age group make up 57% of the birthing population.
Unbooked women are also more likely to be a gravida four or more than the birthing population. Those that are greater than gravida four make up 46% of the unbooked cases, compared with 27% of the birthing population. Unbooked women were over-represented with domiciles in Manukau and outside of the CM Health area, i.e. Otahuhu, Mt Wellington.
40
WOMEN’S HEALTH AND NEWBORN ANNUAL REPORT 2017-2018 41
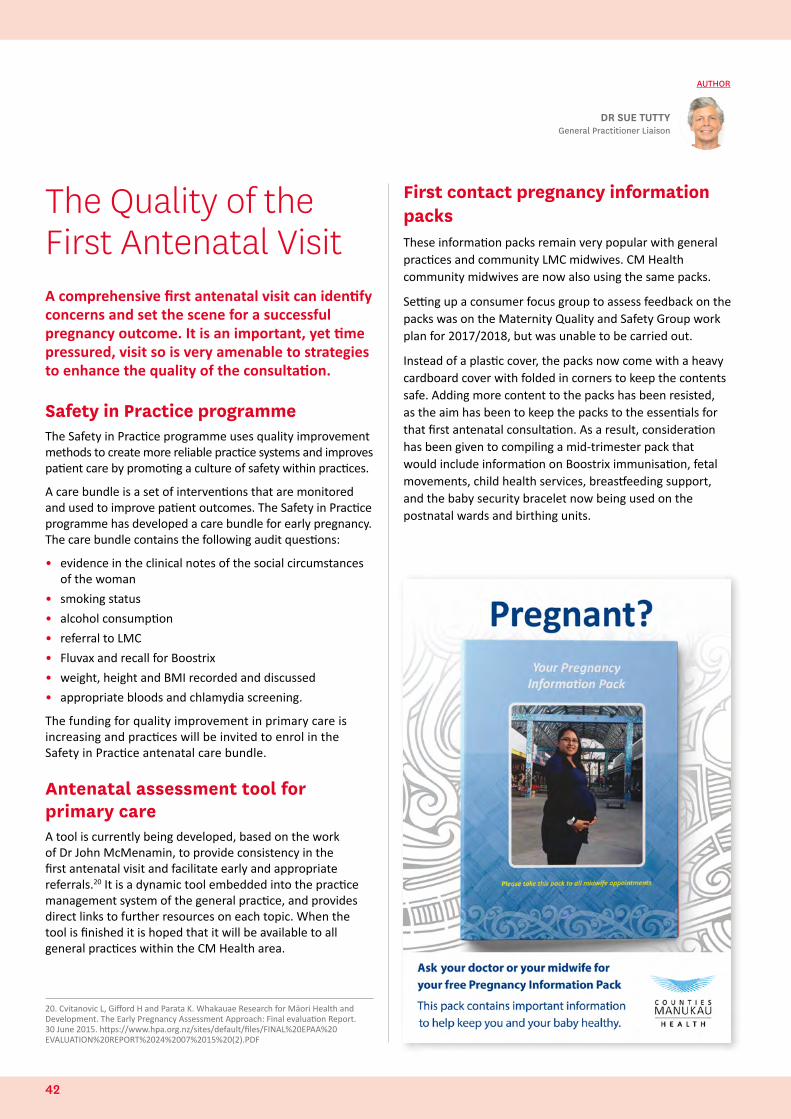
The Quality of the First Antenatal VisitA comprehensive first antenatal visit can identify concerns and set the scene for a successful pregnancy outcome. It is an important, yet time pressured, visit so is very amenable to strategies to enhance the quality of the consultation.
Safety in Practice programmeThe Safety in Practice programme uses quality improvement methods to create more reliable practice systems and improves patient care by promoting a culture of safety within practices.
A care bundle is a set of interventions that are monitored and used to improve patient outcomes. The Safety in Practice programme has developed a care bundle for early pregnancy. The care bundle contains the following audit questions:
• evidence in the clinical notes of the social circumstances of the woman
• smoking status
• alcohol consumption
• referral to LMC
• Fluvax and recall for Boostrix
• weight, height and BMI recorded and discussed
• appropriate bloods and chlamydia screening.
The funding for quality improvement in primary care is increasing and practices will be invited to enrol in the Safety in Practice antenatal care bundle.
Antenatal assessment tool for primary careA tool is currently being developed, based on the work of Dr John McMenamin, to provide consistency in the first antenatal visit and facilitate early and appropriate referrals.20 It is a dynamic tool embedded into the practice management system of the general practice, and provides direct links to further resources on each topic. When the tool is finished it is hoped that it will be available to all general practices within the CM Health area.
First contact pregnancy information packsThese information packs remain very popular with general practices and community LMC midwives. CM Health community midwives are now also using the same packs.
Setting up a consumer focus group to assess feedback on the packs was on the Maternity Quality and Safety Group work plan for 2017/2018, but was unable to be carried out.
Instead of a plastic cover, the packs now come with a heavy cardboard cover with folded in corners to keep the contents safe. Adding more content to the packs has been resisted, as the aim has been to keep the packs to the essentials for that first antenatal consultation. As a result, consideration has been given to compiling a mid-trimester pack that would include information on Boostrix immunisation, fetal movements, child health services, breastfeeding support, and the baby security bracelet now being used on the postnatal wards and birthing units.
AUTHOR
DR SUE TUTTYGeneral Practitioner Liaison
20. Cvitanovic L, Gifford H and Parata K. Whakauae Research for Māori Health and Development. The Early Pregnancy Assessment Approach: Final evaluation Report. 30 June 2015. https://www.hpa.org.nz/sites/default/files/FINAL%20EPAA%20EVALUATION%20REPORT%2024%2007%2015%20(2).PDF
42
Audits of antenatal careClinical audits provide evidence of the effectiveness of current strategies and processes and highlight areas for further improvement.
Iodine use
An audit looking at the prescribing of iodine to women who have given birth at Middlemore Hospital showed that only 67.7% of women had received iodine at any time during their pregnancy, 47.8% had filled a prescription for iodine in the last 6 months and 19.9% had received iodine in early pregnancy, but not in the past 6 months. These results suggest considerable room for improvement.
Time interval from seeing GP to midwife registration
This audit looked at the time interval from GP referral to Women’s Health to registration with a CM Health community midwife, and found that on average the interval was 2 to 3 weeks. However, only 12% of these registrations occurred within the first 12 weeks of pregnancy, as recommended by the Perinatal and Maternal Mortality Review Committee.
The time interval reflects a great deal of work by Maternity Services in processing referrals from GPs, using the Dialhog system to send them to community LMC midwives and then finding CM Health community midwives if community LMC midwives do not pick the women up. The average interval of 2 to 3 weeks suggests this pathway is working efficiently. It is unclear whether the registrations were late in the pregnancy because the GPs had been late doing the referrals or the women had been late presenting to the GPs, i.e. presenting at 11 weeks would push them into the second trimester by the time they were processed.
Feedback from perinatal mortality meetings GPs are invited to perinatal mortality meetings, which are held every 4 weeks. However, they are rarely free to attend.
Outcomes from the reviews conducted at the meetings are provided to the GP concerned if it is felt the GP service may have been contributory. This feedback is to inform and improve practice.
WOMEN’S HEALTH AND NEWBORN ANNUAL REPORT 2017-2018 43
Having a baby and the transition to parenthood is recognised as a socially significant event for families/whaanau
44
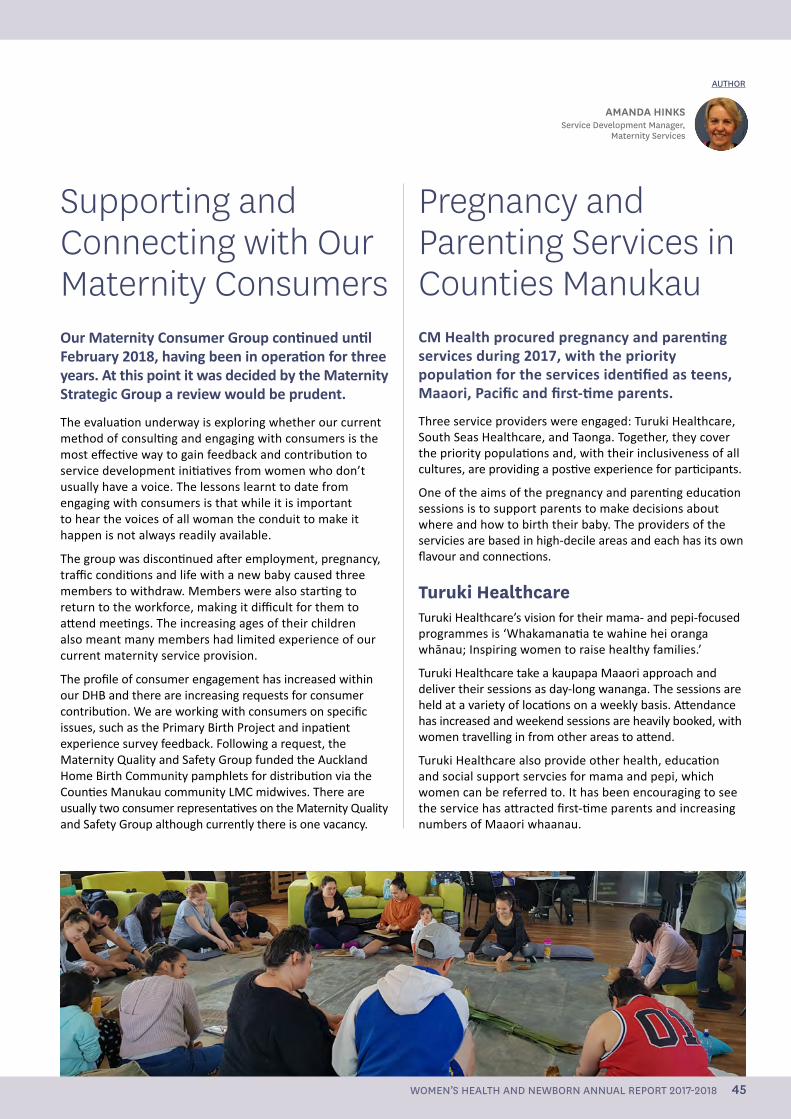
Supporting and Connecting with Our Maternity Consumers Our Maternity Consumer Group continued until February 2018, having been in operation for three years. At this point it was decided by the Maternity Strategic Group a review would be prudent.
The evaluation underway is exploring whether our current method of consulting and engaging with consumers is the most effective way to gain feedback and contribution to service development initiatives from women who don’t usually have a voice. The lessons learnt to date from engaging with consumers is that while it is important to hear the voices of all woman the conduit to make it happen is not always readily available.
The group was discontinued after employment, pregnancy, traffic conditions and life with a new baby caused three members to withdraw. Members were also starting to return to the workforce, making it difficult for them to attend meetings. The increasing ages of their children also meant many members had limited experience of our current maternity service provision.
The profile of consumer engagement has increased within our DHB and there are increasing requests for consumer contribution. We are working with consumers on specific issues, such as the Primary Birth Project and inpatient experience survey feedback. Following a request, the Maternity Quality and Safety Group funded the Auckland Home Birth Community pamphlets for distribution via the Counties Manukau community LMC midwives. There are usually two consumer representatives on the Maternity Quality and Safety Group although currently there is one vacancy.
AMANDA HINKSService Development Manager,
Maternity Services
AUTHOR
Pregnancy and Parenting Services in Counties ManukauCM Health procured pregnancy and parenting services during 2017, with the priority population for the services identified as teens, Maaori, Pacific and first-time parents.
Three service providers were engaged: Turuki Healthcare, South Seas Healthcare, and Taonga. Together, they cover the priority populations and, with their inclusiveness of all cultures, are providing a postive experience for participants.
One of the aims of the pregnancy and parenting education sessions is to support parents to make decisions about where and how to birth their baby. The providers of the servicies are based in high-decile areas and each has its own flavour and connections.
Turuki HealthcareTuruki Healthcare’s vision for their mama- and pepi-focused programmes is ‘Whakamanatia te wahine hei oranga whānau; Inspiring women to raise healthy families.’
Turuki Healthcare take a kaupapa Maaori approach and deliver their sessions as day-long wananga. The sessions are held at a variety of locations on a weekly basis. Attendance has increased and weekend sessions are heavily booked, with women travelling in from other areas to attend.
Turuki Healthcare also provide other health, education and social support servcies for mama and pepi, which women can be referred to. It has been encouraging to see the service has attracted first-time parents and increasing numbers of Maaori whaanau.
WOMEN’S HEALTH AND NEWBORN ANNUAL REPORT 2017-2018 45
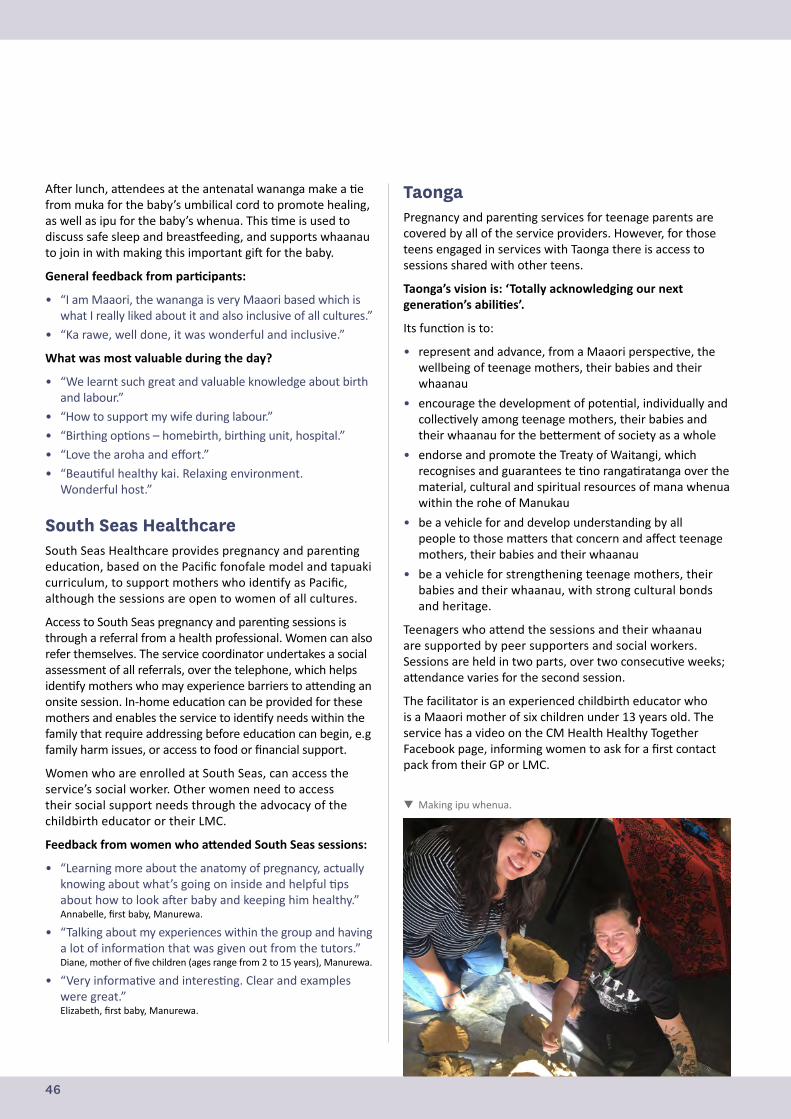
After lunch, attendees at the antenatal wananga make a tie from muka for the baby’s umbilical cord to promote healing, as well as ipu for the baby’s whenua. This time is used to discuss safe sleep and breastfeeding, and supports whaanau to join in with making this important gift for the baby.
General feedback from participants:
• “I am Maaori, the wananga is very Maaori based which is what I really liked about it and also inclusive of all cultures.”
• “Ka rawe, well done, it was wonderful and inclusive.”
What was most valuable during the day?
• “We learnt such great and valuable knowledge about birth and labour.”
• “How to support my wife during labour.”• “Birthing options – homebirth, birthing unit, hospital.”• “Love the aroha and effort.”• “Beautiful healthy kai. Relaxing environment.
Wonderful host.”
South Seas HealthcareSouth Seas Healthcare provides pregnancy and parenting education, based on the Pacific fonofale model and tapuaki curriculum, to support mothers who identify as Pacific, although the sessions are open to women of all cultures.
Access to South Seas pregnancy and parenting sessions is through a referral from a health professional. Women can also refer themselves. The service coordinator undertakes a social assessment of all referrals, over the telephone, which helps identify mothers who may experience barriers to attending an onsite session. In-home education can be provided for these mothers and enables the service to identify needs within the family that require addressing before education can begin, e.g family harm issues, or access to food or financial support.
Women who are enrolled at South Seas, can access the service’s social worker. Other women need to access their social support needs through the advocacy of the childbirth educator or their LMC.
Feedback from women who attended South Seas sessions:
• “Learning more about the anatomy of pregnancy, actually knowing about what’s going on inside and helpful tips about how to look after baby and keeping him healthy.” Annabelle, first baby, Manurewa.
• “Talking about my experiences within the group and having a lot of information that was given out from the tutors.” Diane, mother of five children (ages range from 2 to 15 years), Manurewa.
• “Very informative and interesting. Clear and examples were great.” Elizabeth, first baby, Manurewa.
Making ipu whenua.
TaongaPregnancy and parenting services for teenage parents are covered by all of the service providers. However, for those teens engaged in services with Taonga there is access to sessions shared with other teens.
Taonga’s vision is: ‘Totally acknowledging our next generation’s abilities’.
Its function is to:
• represent and advance, from a Maaori perspective, the wellbeing of teenage mothers, their babies and their whaanau
• encourage the development of potential, individually and collectively among teenage mothers, their babies and their whaanau for the betterment of society as a whole
• endorse and promote the Treaty of Waitangi, which recognises and guarantees te tino rangatiratanga over the material, cultural and spiritual resources of mana whenua within the rohe of Manukau
• be a vehicle for and develop understanding by all people to those matters that concern and affect teenage mothers, their babies and their whaanau
• be a vehicle for strengthening teenage mothers, their babies and their whaanau, with strong cultural bonds and heritage.
Teenagers who attend the sessions and their whaanau are supported by peer supporters and social workers. Sessions are held in two parts, over two consecutive weeks; attendance varies for the second session.
The facilitator is an experienced childbirth educator who is a Maaori mother of six children under 13 years old. The service has a video on the CM Health Healthy Together Facebook page, informing women to ask for a first contact pack from their GP or LMC.
46
Start Well Maangere
Start Well Maangere (Start Well) is a home-visiting initiative that has been set up in South Auckland. Maangere is a vibrant community within South Auckland, where the majority of residents identify as Pasifika and Maaori.
Start Well’s focus is on supporting teen mothers from pregnancy through to when their children are aged five. It was started in November 2017 as an initiative of the South Auckland Social Wellbeing Board.
The Social Wellbeing Board was itself set up in 2016 to support whaanau experiencing challenging life circumstances. It has a particular focus on whaanau with children aged 0 to 5 years. This focus recognises the importance of children’s early years in supporting a ‘best start’ in life and the lasting impact that early life experiences have on a child’s future.
The Social Wellbeing Board includes representatives from 12 agencies, including CM Health, the Ministry of Health, the Ministry for Children – Oranga Tamariki, the Ministry for Social Development, Housing New Zealand Corporation, the Ministry of Education, Te Puni Kōkiri, the Ministry for Pacific Peoples, the New Zealand Police, the Ministry of Justice, the Department of Corrections and Auckland Council.
Start Well was set up with the involvement of CM Health, Oranga Tamariki, Family Start Maangere, Plunket and the Ministry of Health. It incorporates elements of the Well Child Tamariki Ora service, additional ‘unwell child’ expertise and the Family Start programme, and integrates a key worker model. The aim is to support the mothers’ and babies’ health and social needs through a strengths-based approach that focuses on relationships and whaanau partnership.
Start Well staff are currently working with 23 teen mothers and 27 babies/children. Staff are nurse and social work specialists who follow a flexible, combined key worker model of care. The Start Well team are walking alongside whaanau through developing a strong trusted relationship to address the barriers that have reduced their wellness and increased their vulnerability, particularly in addressing mental health, and empowerment to address lifelong emotional, social, environment and health challenges.
A key focus is on enabling caregiver responsiveness to baby and the benefits of this on brain development. By supporting
DR ANN SEARSPublic Health Physician
MEGAN MCCOWANTeam Leader, Start Well Māngere
AUTHORS
whaanau past crisis situations, the aim is to improve their emotional and mental capacity for responsive parenting.
Some key areas where Start Well has supported mothers so far include:
• helping them access permanent housing and increased financial support through the Ministry of Social Development and Housing New Zealand services
• working with them antenatally to ensure they are receiving the health and wider social support they need to prepare for the arrival of baby
• supporting them to build health literacy
• reducing their use of alcohol and other substances during pregnancy and the postnatal period
• empowering them and whaanau to remove family harm from their homes.
Start Well is also enabling us to better understand the workforce and degree of engagement needed to deliver effective, flexible support in a timely way to those young mums who most need it.
DR PIP ANDERSONPublic Health Physician
WOMEN’S HEALTH AND NEWBORN ANNUAL REPORT 2017-2018 47
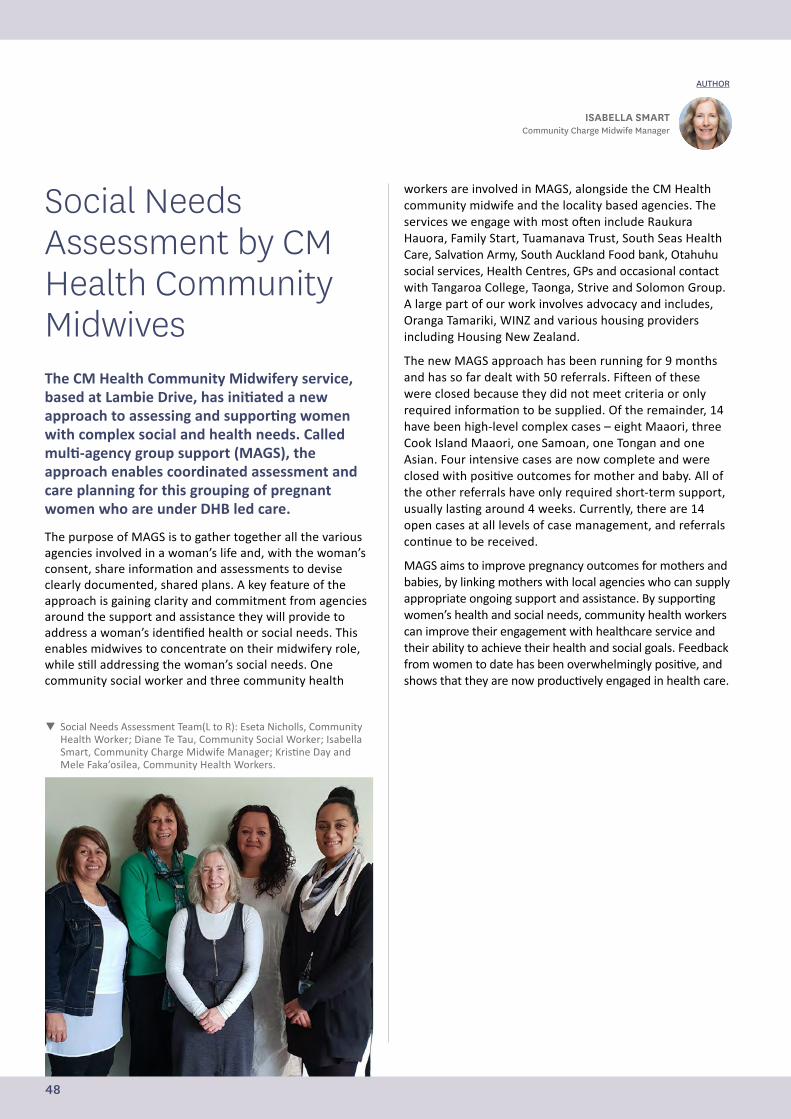
Social Needs Assessment by CM Health Community MidwivesThe CM Health Community Midwifery service, based at Lambie Drive, has initiated a new approach to assessing and supporting women with complex social and health needs. Called multi-agency group support (MAGS), the approach enables coordinated assessment and care planning for this grouping of pregnant women who are under DHB led care.
The purpose of MAGS is to gather together all the various agencies involved in a woman’s life and, with the woman’s consent, share information and assessments to devise clearly documented, shared plans. A key feature of the approach is gaining clarity and commitment from agencies around the support and assistance they will provide to address a woman’s identified health or social needs. This enables midwives to concentrate on their midwifery role, while still addressing the woman’s social needs. One community social worker and three community health
workers are involved in MAGS, alongside the CM Health community midwife and the locality based agencies. The services we engage with most often include Raukura Hauora, Family Start, Tuamanava Trust, South Seas Health Care, Salvation Army, South Auckland Food bank, Otahuhu social services, Health Centres, GPs and occasional contact with Tangaroa College, Taonga, Strive and Solomon Group. A large part of our work involves advocacy and includes, Oranga Tamariki, WINZ and various housing providers including Housing New Zealand.
The new MAGS approach has been running for 9 months and has so far dealt with 50 referrals. Fifteen of these were closed because they did not meet criteria or only required information to be supplied. Of the remainder, 14 have been high-level complex cases – eight Maaori, three Cook Island Maaori, one Samoan, one Tongan and one Asian. Four intensive cases are now complete and were closed with positive outcomes for mother and baby. All of the other referrals have only required short-term support, usually lasting around 4 weeks. Currently, there are 14 open cases at all levels of case management, and referrals continue to be received.
MAGS aims to improve pregnancy outcomes for mothers and babies, by linking mothers with local agencies who can supply appropriate ongoing support and assistance. By supporting women’s health and social needs, community health workers can improve their engagement with healthcare service and their ability to achieve their health and social goals. Feedback from women to date has been overwhelmingly positive, and shows that they are now productively engaged in health care.
ISABELLA SMARTCommunity Charge Midwife Manager
AUTHOR
Social Needs Assessment Team(L to R): Eseta Nicholls, Community Health Worker; Diane Te Tau, Community Social Worker; Isabella Smart, Community Charge Midwife Manager; Kristine Day and Mele Faka’osilea, Community Health Workers.
48
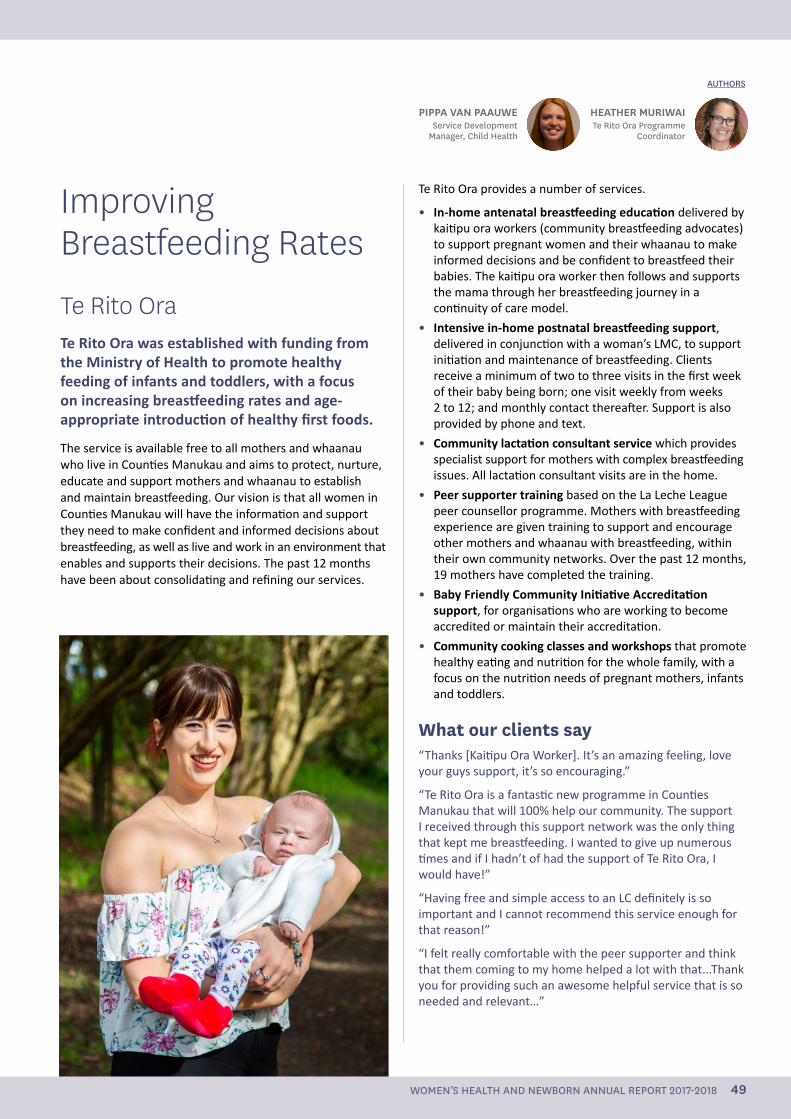
Improving Breastfeeding Rates
Te Rito Ora Te Rito Ora was established with funding from the Ministry of Health to promote healthy feeding of infants and toddlers, with a focus on increasing breastfeeding rates and age-appropriate introduction of healthy first foods.
The service is available free to all mothers and whaanau who live in Counties Manukau and aims to protect, nurture, educate and support mothers and whaanau to establish and maintain breastfeeding. Our vision is that all women in Counties Manukau will have the information and support they need to make confident and informed decisions about breastfeeding, as well as live and work in an environment that enables and supports their decisions. The past 12 months have been about consolidating and refining our services.
HEATHER MURIWAITe Rito Ora Programme
Coordinator
PIPPA VAN PAAUWEService Development
Manager, Child Health
AUTHORS
Te Rito Ora provides a number of services.
• In-home antenatal breastfeeding education delivered by kaitipu ora workers (community breastfeeding advocates) to support pregnant women and their whaanau to make informed decisions and be confident to breastfeed their babies. The kaitipu ora worker then follows and supports the mama through her breastfeeding journey in a continuity of care model.
• Intensive in-home postnatal breastfeeding support, delivered in conjunction with a woman’s LMC, to support initiation and maintenance of breastfeeding. Clients receive a minimum of two to three visits in the first week of their baby being born; one visit weekly from weeks 2 to 12; and monthly contact thereafter. Support is also provided by phone and text.
• Community lactation consultant service which provides specialist support for mothers with complex breastfeeding issues. All lactation consultant visits are in the home.
• Peer supporter training based on the La Leche League peer counsellor programme. Mothers with breastfeeding experience are given training to support and encourage other mothers and whaanau with breastfeeding, within their own community networks. Over the past 12 months, 19 mothers have completed the training.
• Baby Friendly Community Initiative Accreditation support, for organisations who are working to become accredited or maintain their accreditation.
• Community cooking classes and workshops that promote healthy eating and nutrition for the whole family, with a focus on the nutrition needs of pregnant mothers, infants and toddlers.
What our clients say“Thanks [Kaitipu Ora Worker]. It’s an amazing feeling, love your guys support, it’s so encouraging.”
“Te Rito Ora is a fantastic new programme in Counties Manukau that will 100% help our community. The support I received through this support network was the only thing that kept me breastfeeding. I wanted to give up numerous times and if I hadn’t of had the support of Te Rito Ora, I would have!”
“Having free and simple access to an LC definitely is so important and I cannot recommend this service enough for that reason!”
“I felt really comfortable with the peer supporter and think that them coming to my home helped a lot with that...Thank you for providing such an awesome helpful service that is so needed and relevant…”
WOMEN’S HEALTH AND NEWBORN ANNUAL REPORT 2017-2018 49
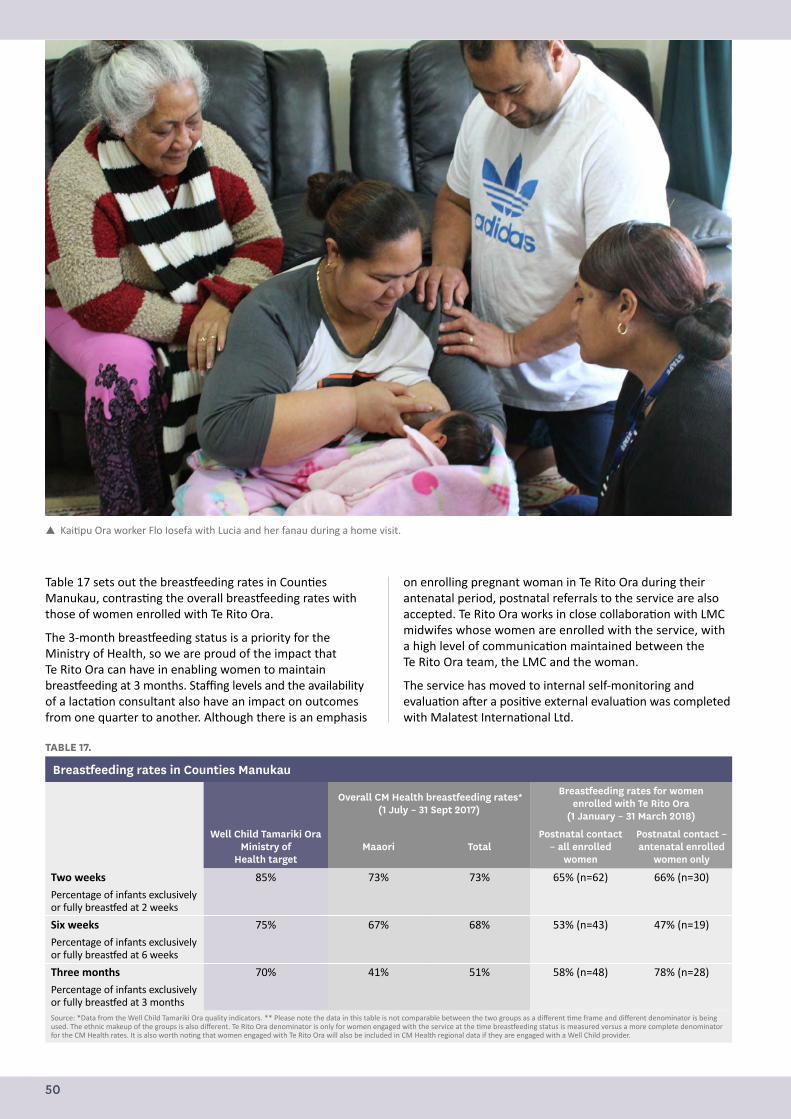
TABLE 17.
Breastfeeding rates in Counties Manukau
Overall CM Health breastfeeding rates* (1 July – 31 Sept 2017)
Breastfeeding rates for women enrolled with Te Rito Ora
(1 January – 31 March 2018)
Well Child Tamariki Ora Ministry of
Health targetMaaori Total
Postnatal contact – all enrolled
women
Postnatal contact – antenatal enrolled
women only
Two weeks 85% 73% 73% 65% (n=62) 66% (n=30)
Percentage of infants exclusively or fully breastfed at 2 weeks
Six weeks 75% 67% 68% 53% (n=43) 47% (n=19)
Percentage of infants exclusively or fully breastfed at 6 weeks
Three months 70% 41% 51% 58% (n=48) 78% (n=28)
Percentage of infants exclusively or fully breastfed at 3 monthsSource: *Data from the Well Child Tamariki Ora quality indicators. ** Please note the data in this table is not comparable between the two groups as a different time frame and different denominator is being used. The ethnic makeup of the groups is also different. Te Rito Ora denominator is only for women engaged with the service at the time breastfeeding status is measured versus a more complete denominator for the CM Health rates. It is also worth noting that women engaged with Te Rito Ora will also be included in CM Health regional data if they are engaged with a Well Child provider.
Table 17 sets out the breastfeeding rates in Counties Manukau, contrasting the overall breastfeeding rates with those of women enrolled with Te Rito Ora.
The 3-month breastfeeding status is a priority for the Ministry of Health, so we are proud of the impact that Te Rito Ora can have in enabling women to maintain breastfeeding at 3 months. Staffing levels and the availability of a lactation consultant also have an impact on outcomes from one quarter to another. Although there is an emphasis
on enrolling pregnant woman in Te Rito Ora during their antenatal period, postnatal referrals to the service are also accepted. Te Rito Ora works in close collaboration with LMC midwifes whose women are enrolled with the service, with a high level of communication maintained between the Te Rito Ora team, the LMC and the woman.
The service has moved to internal self-monitoring and evaluation after a positive external evaluation was completed with Malatest International Ltd.
Kaitipu Ora worker Flo Iosefa with Lucia and her fanau during a home visit.
50
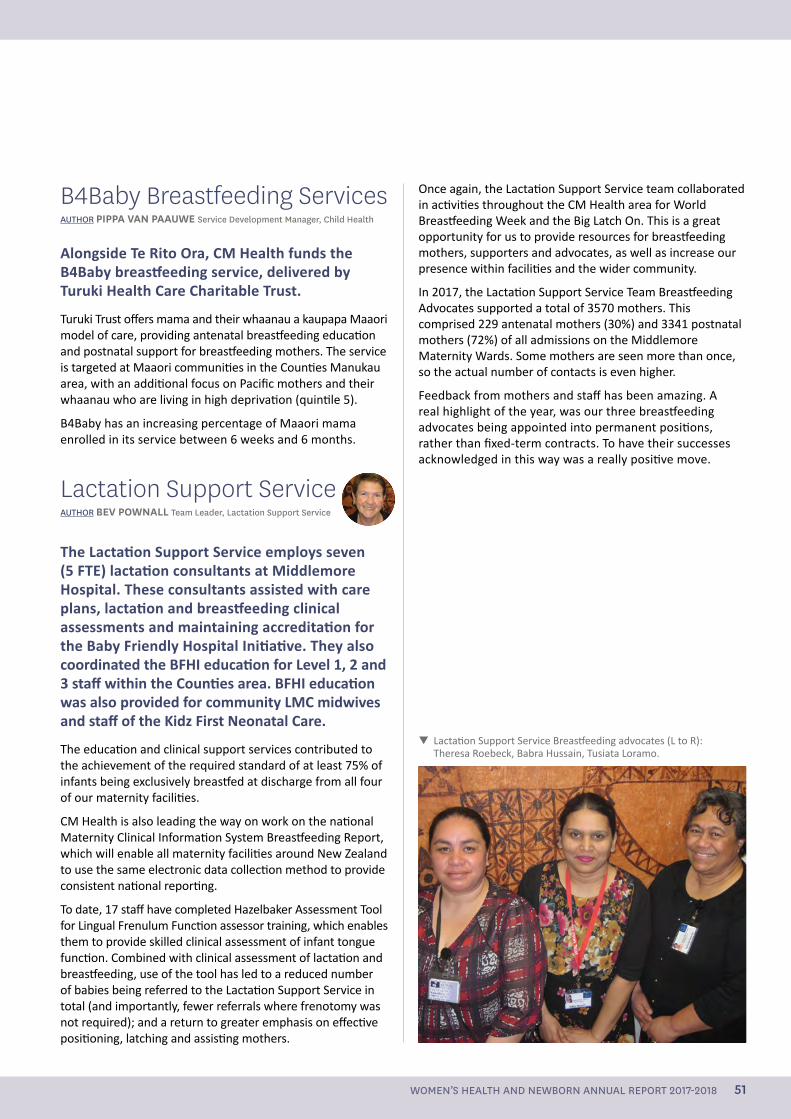
B4Baby Breastfeeding ServicesAUTHOR PIPPA VAN PAAUWE Service Development Manager, Child Health
Alongside Te Rito Ora, CM Health funds the B4Baby breastfeeding service, delivered by Turuki Health Care Charitable Trust.
Turuki Trust offers mama and their whaanau a kaupapa Maaori model of care, providing antenatal breastfeeding education and postnatal support for breastfeeding mothers. The service is targeted at Maaori communities in the Counties Manukau area, with an additional focus on Pacific mothers and their whaanau who are living in high deprivation (quintile 5).
B4Baby has an increasing percentage of Maaori mama enrolled in its service between 6 weeks and 6 months.
Lactation Support ServiceAUTHOR BEV POWNALL Team Leader, Lactation Support Service
The Lactation Support Service employs seven (5 FTE) lactation consultants at Middlemore Hospital. These consultants assisted with care plans, lactation and breastfeeding clinical assessments and maintaining accreditation for the Baby Friendly Hospital Initiative. They also coordinated the BFHI education for Level 1, 2 and 3 staff within the Counties area. BFHI education was also provided for community LMC midwives and staff of the Kidz First Neonatal Care.
The education and clinical support services contributed to the achievement of the required standard of at least 75% of infants being exclusively breastfed at discharge from all four of our maternity facilities.
CM Health is also leading the way on work on the national Maternity Clinical Information System Breastfeeding Report, which will enable all maternity facilities around New Zealand to use the same electronic data collection method to provide consistent national reporting.
To date, 17 staff have completed Hazelbaker Assessment Tool for Lingual Frenulum Function assessor training, which enables them to provide skilled clinical assessment of infant tongue function. Combined with clinical assessment of lactation and breastfeeding, use of the tool has led to a reduced number of babies being referred to the Lactation Support Service in total (and importantly, fewer referrals where frenotomy was not required); and a return to greater emphasis on effective positioning, latching and assisting mothers.
Once again, the Lactation Support Service team collaborated in activities throughout the CM Health area for World Breastfeeding Week and the Big Latch On. This is a great opportunity for us to provide resources for breastfeeding mothers, supporters and advocates, as well as increase our presence within facilities and the wider community.
In 2017, the Lactation Support Service Team Breastfeeding Advocates supported a total of 3570 mothers. This comprised 229 antenatal mothers (30%) and 3341 postnatal mothers (72%) of all admissions on the Middlemore Maternity Wards. Some mothers are seen more than once, so the actual number of contacts is even higher.
Feedback from mothers and staff has been amazing. A real highlight of the year, was our three breastfeeding advocates being appointed into permanent positions, rather than fixed-term contracts. To have their successes acknowledged in this way was a really positive move.
Lactation Support Service Breastfeeding advocates (L to R): Theresa Roebeck, Babra Hussain, Tusiata Loramo.
WOMEN’S HEALTH AND NEWBORN ANNUAL REPORT 2017-2018 51
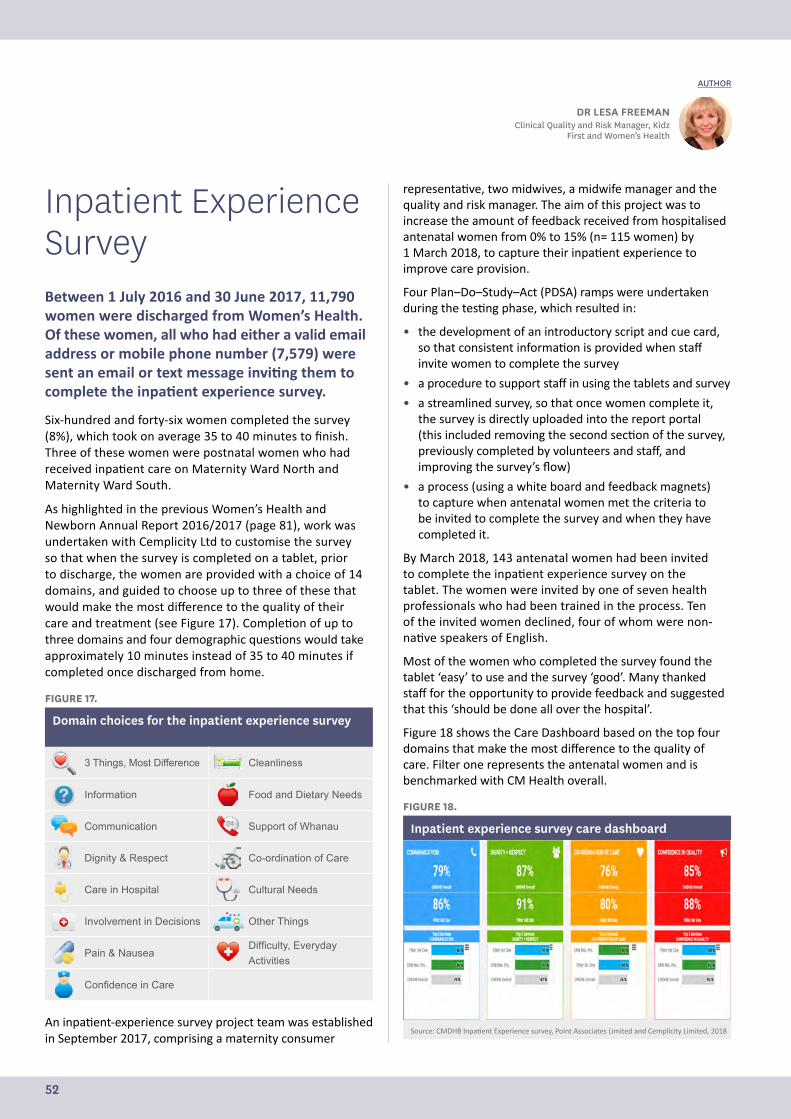
Inpatient Experience SurveyBetween 1 July 2016 and 30 June 2017, 11,790 women were discharged from Women’s Health. Of these women, all who had either a valid email address or mobile phone number (7,579) were sent an email or text message inviting them to complete the inpatient experience survey.
Six-hundred and forty-six women completed the survey (8%), which took on average 35 to 40 minutes to finish. Three of these women were postnatal women who had received inpatient care on Maternity Ward North and Maternity Ward South.
As highlighted in the previous Women’s Health and Newborn Annual Report 2016/2017 (page 81), work was undertaken with Cemplicity Ltd to customise the survey so that when the survey is completed on a tablet, prior to discharge, the women are provided with a choice of 14 domains, and guided to choose up to three of these that would make the most difference to the quality of their care and treatment (see Figure 17). Completion of up to three domains and four demographic questions would take approximately 10 minutes instead of 35 to 40 minutes if completed once discharged from home.
FIGURE 17.
Domain choices for the inpatient experience survey
3 Things, Most Difference Cleanliness
Information Food and Dietary Needs
Communication Support of Whanau
Dignity & Respect Co-ordination of Care
Care in Hospital Cultural Needs
Involvement in Decisions Other Things
Pain & NauseaDifficulty, Everyday Activities
Confidence in Care
An inpatient-experience survey project team was established in September 2017, comprising a maternity consumer
representative, two midwives, a midwife manager and the quality and risk manager. The aim of this project was to increase the amount of feedback received from hospitalised antenatal women from 0% to 15% (n= 115 women) by 1 March 2018, to capture their inpatient experience to improve care provision.
Four Plan–Do–Study–Act (PDSA) ramps were undertaken during the testing phase, which resulted in:
• the development of an introductory script and cue card, so that consistent information is provided when staff invite women to complete the survey
• a procedure to support staff in using the tablets and survey
• a streamlined survey, so that once women complete it, the survey is directly uploaded into the report portal (this included removing the second section of the survey, previously completed by volunteers and staff, and improving the survey’s flow)
• a process (using a white board and feedback magnets) to capture when antenatal women met the criteria to be invited to complete the survey and when they have completed it.
By March 2018, 143 antenatal women had been invited to complete the inpatient experience survey on the tablet. The women were invited by one of seven health professionals who had been trained in the process. Ten of the invited women declined, four of whom were non-native speakers of English.
Most of the women who completed the survey found the tablet ‘easy’ to use and the survey ‘good’. Many thanked staff for the opportunity to provide feedback and suggested that this ‘should be done all over the hospital’.
Figure 18 shows the Care Dashboard based on the top four domains that make the most difference to the quality of care. Filter one represents the antenatal women and is benchmarked with CM Health overall.
FIGURE 18.
Inpatient experience survey care dashboard
60
Following the completion of the testing phase, the project was implemented in April 2018 through:
• training all nursing and midwifery staff on Maternity Ward South to invite antenatal women to participate in the survey
• developing a communication strategy for staff, LMCs and women
• including the inpatient experience survey into the antenatal care pathway that is currently being developed.
The next phase of this project is to spread the inpatient experience survey across all of Women’s Health, and invite postnatal and gynaecology women to complete the survey before they are discharged. The survey will be completed on tablets, purchased through MQSP funding, that have been set up with a smart survey link related to the division and location of the wards and community birthing units.
Grief support pilot for bereaved families By Debbie Davies, Perinatal Loss Midwife Specialist
At the start of July 2017, CM Health completed a successful pilot offering grief support services for bereaved families following the loss of a baby. The services are offered through four grief support counsellors.
Following the pilot, it has become standard practice to offer grief support to families. The providers include The Grief Centre, which has a number of counsellors who specialise in grief support, as well as support people who offer telephone support under the supervision of a counsellor, plus two other individual counsellors experienced in grief support (one of the counsellors involved in the pilot retired in December).
Source: CMDHB Inpatient Experience survey, Point Associates Limited and Cemplicity Limited, 2018
DR LESA FREEMANClinical Quality and Risk Manager, Kidz
First and Women’s Health
AUTHOR
52
Following the completion of the testing phase, the project was implemented in April 2018 through:
• training all nursing and midwifery staff on Maternity Ward South to invite antenatal women to participate in the survey
• developing a communication strategy for staff, LMCs and women
• including the inpatient experience survey into the antenatal care pathway that is currently being developed.
The next phase of this project is to spread the inpatient experience survey across all of Women’s Health, and invite postnatal and gynaecology women to complete the survey before they are discharged. The survey will be completed on tablets, purchased through MQSP funding, that have been set up with a smart survey link related to the division and location of the wards and community birthing units.
WOMEN’S HEALTH AND NEWBORN ANNUAL REPORT 2017-2018 53
Grief Support Pilot for Bereaved FamiliesAt the start of July 2017, CM Health completed a successful pilot offering grief support services for bereaved families following the loss of a baby. The services are offered through four grief support counsellors.
Following the pilot, it has become standard practice to offer grief support to families. The providers include The Grief Centre, which has a number of counsellors who specialise in grief support, as well as support people who offer telephone support under the supervision of a counsellor, plus two other individual counsellors experienced in grief support (one of the counsellors involved in the pilot retired in December).
Together, the counsellors can provide support in English, Hindi, Punjab, Gujarati, Arabic and Italian. Despite considerable effort, we have been unable to engage a Maaori-speaking counsellor.
The support is offered to families at two different times: at the time of birth, although this has not had a large uptake, and again at the follow-up appointment or letter, depending on which option is requested by the family.
Between July 2017 and March 2018, we have had 81 perinatal-related deaths. Of those 81 families, 49 attended follow-up appointments, and the rest received follow-up letters. All were offered grief support services. Sixteen referrals have been made to the grief support services. Of these referrals, one person has not attended the arranged session and two have declined to attend, once contacted by the service provider.
Although there have not been a large number of people who have accepted the support, those that have, have found it very useful. The number of sessions accessed has varied, with some people using only one session and others negotiating two or three additional sessions above the three initial sessions allocated. One mother, who made contact about the service during a subsequent pregnancy, was able to be referred to Maternal Mental Health for ongoing support.
Feedback from the both the services and the families includes:
• “I found it useful to talk through the process of grief and to do the exercises, aligning our understanding. We got a better understanding of our emotions.”
• “The woman has engaged really well with me.”
• “After just two calls I felt okay and agreed I would call if I needed further help.”
• “My husband and I had one session which cleared things up. We will decide if we wish to bring our daughter with us again.”
• “As grief is a very individual process and each person will react differently, I feel that even having the opportunity of getting some support gives people a sense that should they not be managing there is help available. I am very appreciative of the funding supplied by the Maternity Quality and Safety Programme funding and I hope this service continues to be made available as it enriches the care we are able to provide to our families who have experienced the loss of a baby.”
DEBBIE DAVIESPerinatal Loss Midwife Specialist
AUTHOR
54
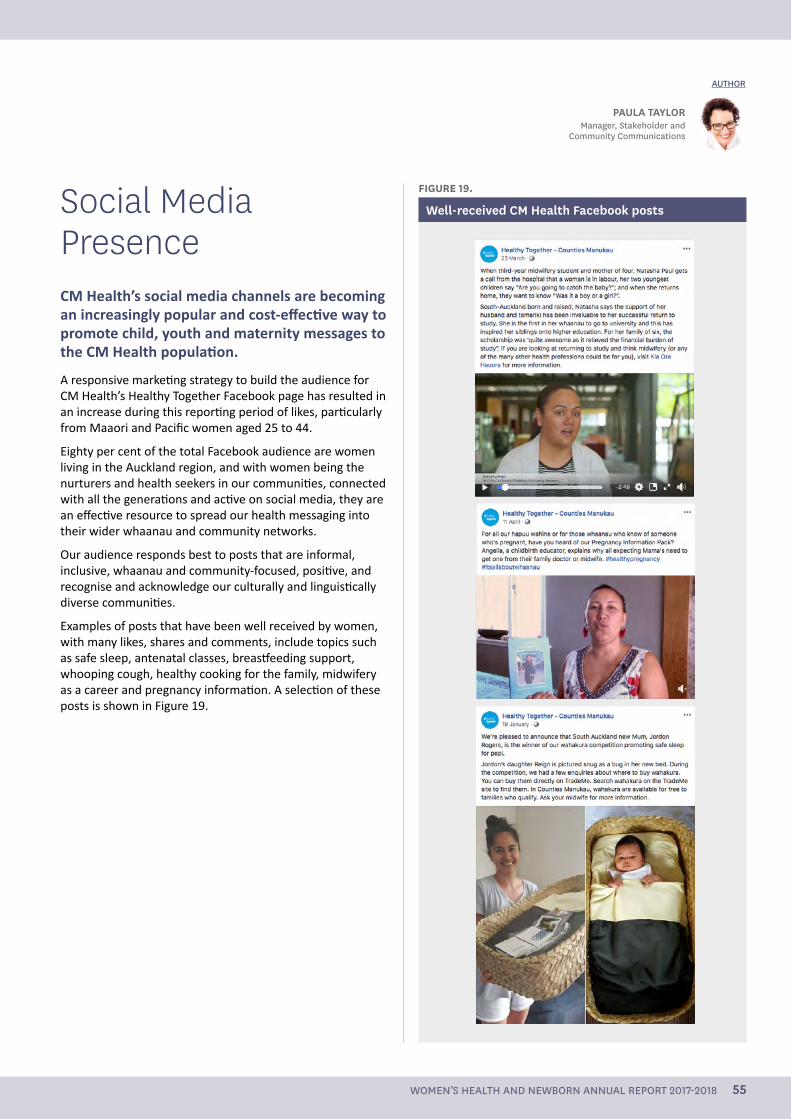
Social Media PresenceCM Health’s social media channels are becoming an increasingly popular and cost-effective way to promote child, youth and maternity messages to the CM Health population.
A responsive marketing strategy to build the audience for CM Health’s Healthy Together Facebook page has resulted in an increase during this reporting period of likes, particularly from Maaori and Pacific women aged 25 to 44.
Eighty per cent of the total Facebook audience are women living in the Auckland region, and with women being the nurturers and health seekers in our communities, connected with all the generations and active on social media, they are an effective resource to spread our health messaging into their wider whaanau and community networks.
Our audience responds best to posts that are informal, inclusive, whaanau and community-focused, positive, and recognise and acknowledge our culturally and linguistically diverse communities.
Examples of posts that have been well received by women, with many likes, shares and comments, include topics such as safe sleep, antenatal classes, breastfeeding support, whooping cough, healthy cooking for the family, midwifery as a career and pregnancy information. A selection of these posts is shown in Figure 19.
PAULA TAYLORManager, Stakeholder and
Community Communications
AUTHOR
FIGURE 19.
Well-received CM Health Facebook posts
WOMEN’S HEALTH AND NEWBORN ANNUAL REPORT 2017-2018 55
Childbearing women and families are supported to make choices which are underpinned by the maternity care providers sharing evidence based information
56
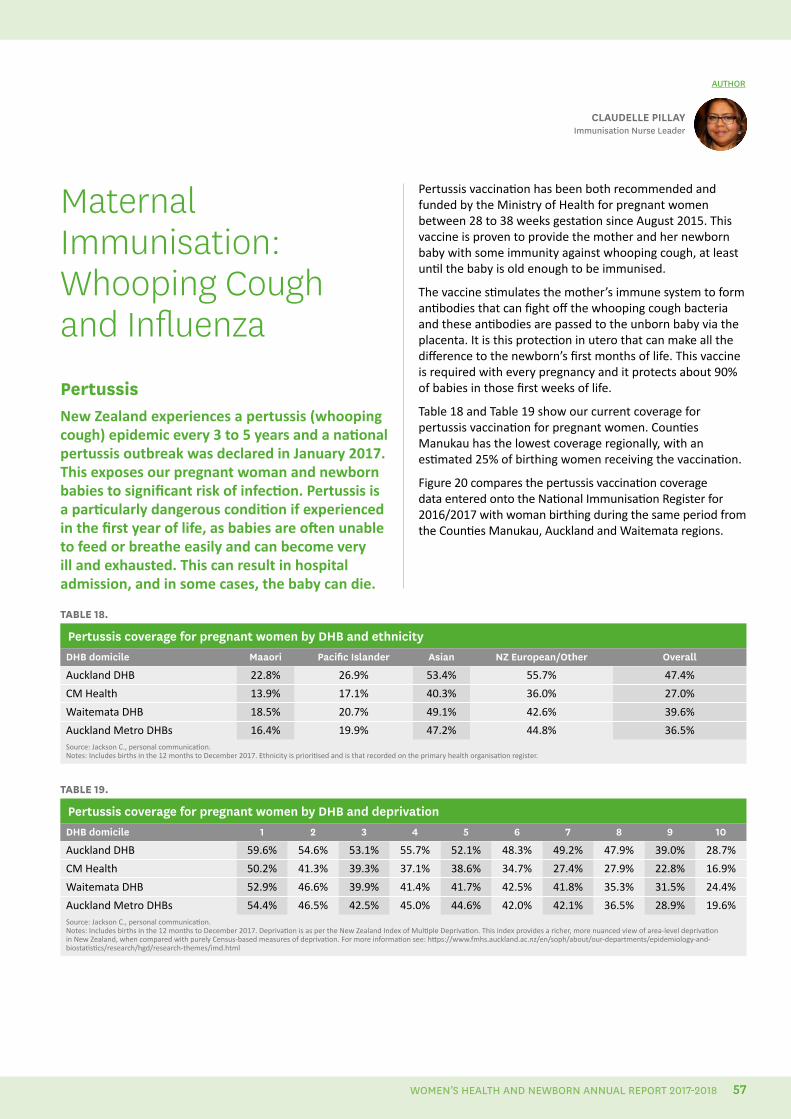
Maternal Immunisation: Whooping Cough and InfluenzaPertussisNew Zealand experiences a pertussis (whooping cough) epidemic every 3 to 5 years and a national pertussis outbreak was declared in January 2017. This exposes our pregnant woman and newborn babies to significant risk of infection. Pertussis is a particularly dangerous condition if experienced in the first year of life, as babies are often unable to feed or breathe easily and can become very ill and exhausted. This can result in hospital admission, and in some cases, the baby can die.
CLAUDELLE PILLAYImmunisation Nurse Leader
AUTHOR
TABLE 18.
Pertussis coverage for pregnant women by DHB and ethnicityDHB domicile Maaori Pacific Islander Asian NZ European/Other Overall
Auckland DHB 22.8% 26.9% 53.4% 55.7% 47.4%
CM Health 13.9% 17.1% 40.3% 36.0% 27.0%
Waitemata DHB 18.5% 20.7% 49.1% 42.6% 39.6%
Auckland Metro DHBs 16.4% 19.9% 47.2% 44.8% 36.5%Source: Jackson C., personal communication. Notes: Includes births in the 12 months to December 2017. Ethnicity is prioritised and is that recorded on the primary health organisation register.
TABLE 19.
Pertussis coverage for pregnant women by DHB and deprivationDHB domicile 1 2 3 4 5 6 7 8 9 10
Auckland DHB 59.6% 54.6% 53.1% 55.7% 52.1% 48.3% 49.2% 47.9% 39.0% 28.7%
CM Health 50.2% 41.3% 39.3% 37.1% 38.6% 34.7% 27.4% 27.9% 22.8% 16.9%
Waitemata DHB 52.9% 46.6% 39.9% 41.4% 41.7% 42.5% 41.8% 35.3% 31.5% 24.4%
Auckland Metro DHBs 54.4% 46.5% 42.5% 45.0% 44.6% 42.0% 42.1% 36.5% 28.9% 19.6%Source: Jackson C., personal communication.Notes: Includes births in the 12 months to December 2017. Deprivation is as per the New Zealand Index of Multiple Deprivation. This index provides a richer, more nuanced view of area-level deprivation in New Zealand, when compared with purely Census-based measures of deprivation. For more information see: https://www.fmhs.auckland.ac.nz/en/soph/about/our-departments/epidemiology-and-biostatistics/research/hgd/research-themes/imd.html
Pertussis vaccination has been both recommended and funded by the Ministry of Health for pregnant women between 28 to 38 weeks gestation since August 2015. This vaccine is proven to provide the mother and her newborn baby with some immunity against whooping cough, at least until the baby is old enough to be immunised.
The vaccine stimulates the mother’s immune system to form antibodies that can fight off the whooping cough bacteria and these antibodies are passed to the unborn baby via the placenta. It is this protection in utero that can make all the difference to the newborn’s first months of life. This vaccine is required with every pregnancy and it protects about 90% of babies in those first weeks of life.
Table 18 and Table 19 show our current coverage for pertussis vaccination for pregnant women. Counties Manukau has the lowest coverage regionally, with an estimated 25% of birthing women receiving the vaccination.
Figure 20 compares the pertussis vaccination coverage data entered onto the National Immunisation Register for 2016/2017 with woman birthing during the same period from the Counties Manukau, Auckland and Waitemata regions.
WOMEN’S HEALTH AND NEWBORN ANNUAL REPORT 2017-2018 57
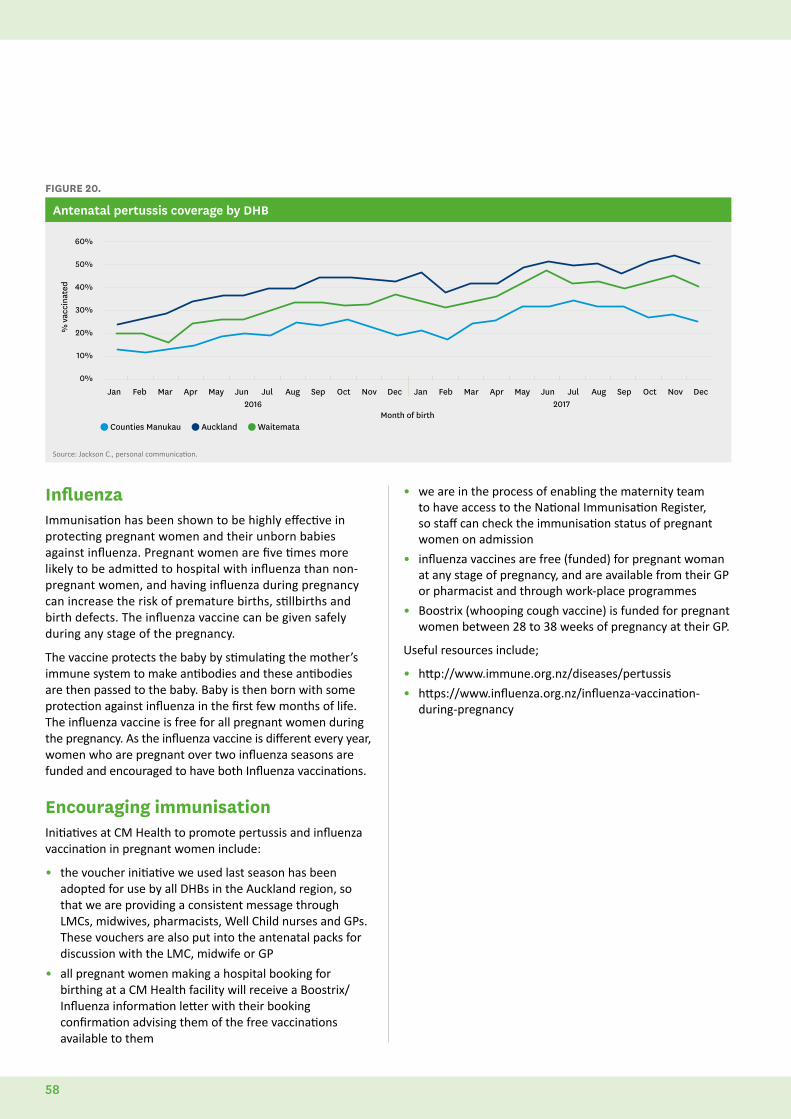
FIGURE 20.
Antenatal pertussis coverage by DHB
60%
50%
40%
30%
20%
10%
0%
Jan Feb Mar Apr May Jun Jul Aug Sep Oct Nov Dec Jan Feb Mar Apr May Jun Jul Aug Sep Oct Nov Dec
Counties Manukau Auckland Waitemata
% v
acci
nate
d
2016 2017Month of birth
Source: Jackson C., personal communication.
InfluenzaImmunisation has been shown to be highly effective in protecting pregnant women and their unborn babies against influenza. Pregnant women are five times more likely to be admitted to hospital with influenza than non-pregnant women, and having influenza during pregnancy can increase the risk of premature births, stillbirths and birth defects. The influenza vaccine can be given safely during any stage of the pregnancy.
The vaccine protects the baby by stimulating the mother’s immune system to make antibodies and these antibodies are then passed to the baby. Baby is then born with some protection against influenza in the first few months of life. The influenza vaccine is free for all pregnant women during the pregnancy. As the influenza vaccine is different every year, women who are pregnant over two influenza seasons are funded and encouraged to have both Influenza vaccinations.
Encouraging immunisationInitiatives at CM Health to promote pertussis and influenza vaccination in pregnant women include:
• the voucher initiative we used last season has been adopted for use by all DHBs in the Auckland region, so that we are providing a consistent message through LMCs, midwives, pharmacists, Well Child nurses and GPs. These vouchers are also put into the antenatal packs for discussion with the LMC, midwife or GP
• all pregnant women making a hospital booking for birthing at a CM Health facility will receive a Boostrix/Influenza information letter with their booking confirmation advising them of the free vaccinations available to them
• we are in the process of enabling the maternity team to have access to the National Immunisation Register, so staff can check the immunisation status of pregnant women on admission
• influenza vaccines are free (funded) for pregnant woman at any stage of pregnancy, and are available from their GP or pharmacist and through work-place programmes
• Boostrix (whooping cough vaccine) is funded for pregnant women between 28 to 38 weeks of pregnancy at their GP.
Useful resources include;
• http://www.immune.org.nz/diseases/pertussis
• https://www.influenza.org.nz/influenza-vaccination-during-pregnancy
58
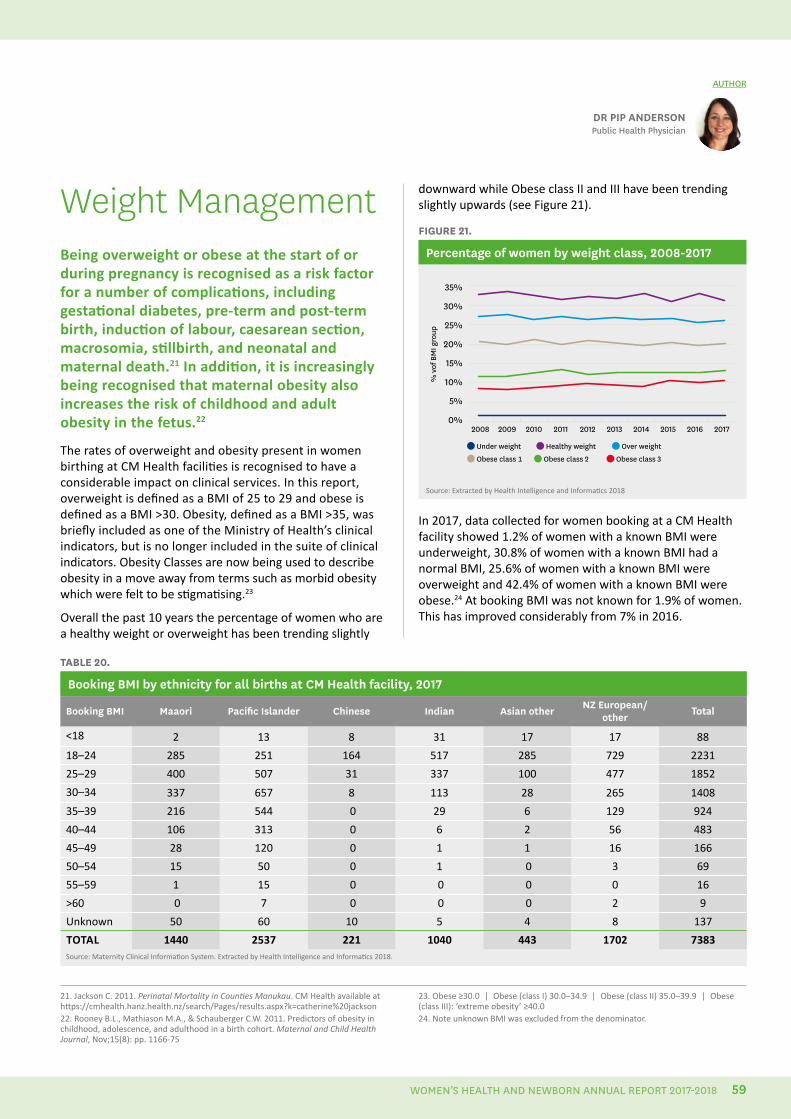
Weight ManagementBeing overweight or obese at the start of or during pregnancy is recognised as a risk factor for a number of complications, including gestational diabetes, pre-term and post-term birth, induction of labour, caesarean section, macrosomia, stillbirth, and neonatal and maternal death.21 In addition, it is increasingly being recognised that maternal obesity also increases the risk of childhood and adult obesity in the fetus.22
The rates of overweight and obesity present in women birthing at CM Health facilities is recognised to have a considerable impact on clinical services. In this report, overweight is defined as a BMI of 25 to 29 and obese is defined as a BMI >30. Obesity, defined as a BMI >35, was briefly included as one of the Ministry of Health’s clinical indicators, but is no longer included in the suite of clinical indicators. Obesity Classes are now being used to describe obesity in a move away from terms such as morbid obesity which were felt to be stigmatising.23
Overall the past 10 years the percentage of women who are a healthy weight or overweight has been trending slightly
21. Jackson C. 2011. Perinatal Mortality in Counties Manukau. CM Health available at https://cmhealth.hanz.health.nz/search/Pages/results.aspx?k=catherine%20jackson22. Rooney B.L., Mathiason M.A., & Schauberger C.W. 2011. Predictors of obesity in childhood, adolescence, and adulthood in a birth cohort. Maternal and Child Health Journal, Nov;15(8): pp. 1166-75
23. Obese ≥30.0 | Obese (class I) 30.0–34.9 | Obese (class II) 35.0–39.9 | Obese (class III): ‘extreme obesity’ ≥40.024. Note unknown BMI was excluded from the denominator.
DR PIP ANDERSONPublic Health Physician
AUTHOR
downward while Obese class II and III have been trending slightly upwards (see Figure 21).
FIGURE 21.
Percentage of women by weight class, 2008-2017
35%
30%
25%
20%
15%
10%
5%
0%2008 2009 2010 2011 2012 2013 2014 2015 2016 2017
Under weight Healthy weight Over weight
% v
of B
MI g
roup
Obese class 1 Obese class 2 Obese class 3
Source: Extracted by Health Intelligence and Informatics 2018
In 2017, data collected for women booking at a CM Health facility showed 1.2% of women with a known BMI were underweight, 30.8% of women with a known BMI had a normal BMI, 25.6% of women with a known BMI were overweight and 42.4% of women with a known BMI were obese.24 At booking BMI was not known for 1.9% of women. This has improved considerably from 7% in 2016.
TABLE 20.
Booking BMI by ethnicity for all births at CM Health facility, 2017
Booking BMI Maaori Pacific Islander Chinese Indian Asian other NZ European/other Total
<18 2 13 8 31 17 17 88
18–24 285 251 164 517 285 729 2231
25–29 400 507 31 337 100 477 1852
30–34 337 657 8 113 28 265 1408
35–39 216 544 0 29 6 129 924
40–44 106 313 0 6 2 56 483
45–49 28 120 0 1 1 16 166
50–54 15 50 0 1 0 3 69
55–59 1 15 0 0 0 0 16
>60 0 7 0 0 0 2 9
Unknown 50 60 10 5 4 8 137
TOTAL 1440 2537 221 1040 443 1702 7383Source: Maternity Clinical Information System. Extracted by Health Intelligence and Informatics 2018.
WOMEN’S HEALTH AND NEWBORN ANNUAL REPORT 2017-2018 59
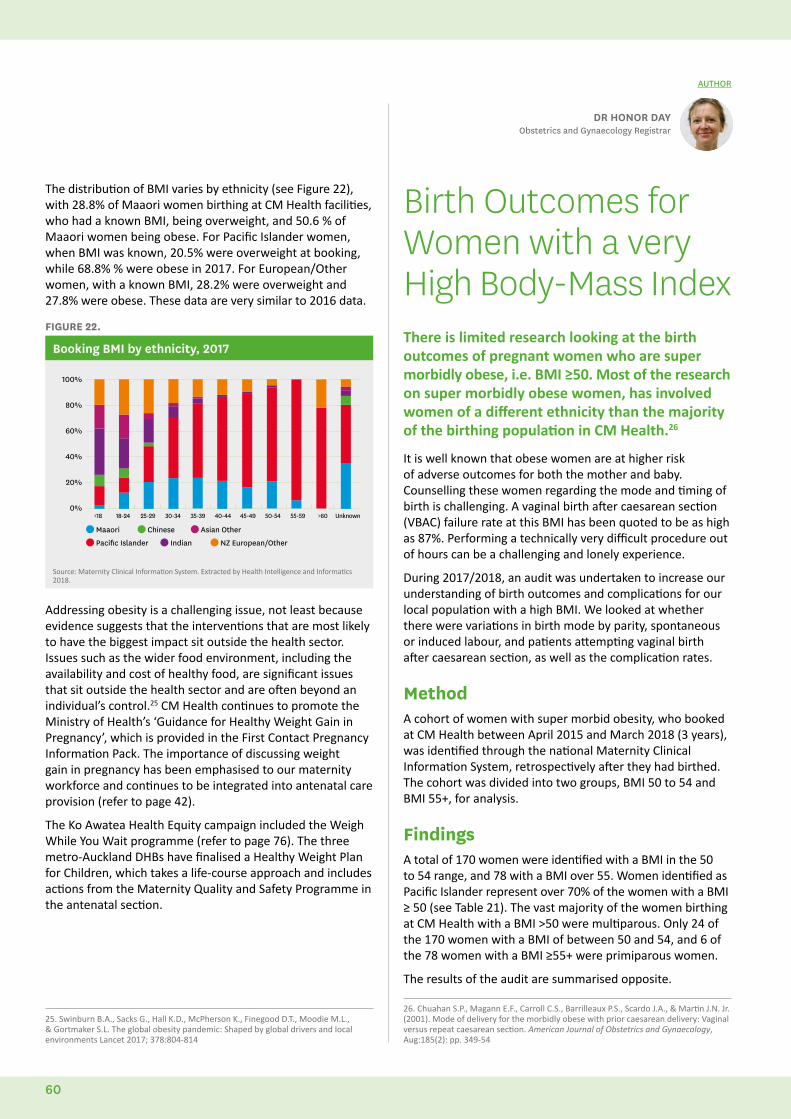
The distribution of BMI varies by ethnicity (see Figure 22), with 28.8% of Maaori women birthing at CM Health facilities, who had a known BMI, being overweight, and 50.6 % of Maaori women being obese. For Pacific Islander women, when BMI was known, 20.5% were overweight at booking, while 68.8% % were obese in 2017. For European/Other women, with a known BMI, 28.2% were overweight and 27.8% were obese. These data are very similar to 2016 data.
FIGURE 22.
Booking BMI by ethnicity, 2017
100%
80%
60%
40%
20%
0%<18 18-24 25-29 30-34 35-39 40-44 45-49 50-54 55-59 >60 Unknown
Maaori Chinese Asian Other
Pacific Islander Indian NZ European/Other
Source: Maternity Clinical Information System. Extracted by Health Intelligence and Informatics 2018.
Addressing obesity is a challenging issue, not least because evidence suggests that the interventions that are most likely to have the biggest impact sit outside the health sector. Issues such as the wider food environment, including the availability and cost of healthy food, are significant issues that sit outside the health sector and are often beyond an individual’s control.25 CM Health continues to promote the Ministry of Health’s ‘Guidance for Healthy Weight Gain in Pregnancy’, which is provided in the First Contact Pregnancy Information Pack. The importance of discussing weight gain in pregnancy has been emphasised to our maternity workforce and continues to be integrated into antenatal care provision (refer to page 42).
The Ko Awatea Health Equity campaign included the Weigh While You Wait programme (refer to page 76). The three metro-Auckland DHBs have finalised a Healthy Weight Plan for Children, which takes a life-course approach and includes actions from the Maternity Quality and Safety Programme in the antenatal section.
Birth Outcomes for Women with a very High Body-Mass IndexThere is limited research looking at the birth outcomes of pregnant women who are super morbidly obese, i.e. BMI ≥50. Most of the research on super morbidly obese women, has involved women of a different ethnicity than the majority of the birthing population in CM Health.26
It is well known that obese women are at higher risk of adverse outcomes for both the mother and baby. Counselling these women regarding the mode and timing of birth is challenging. A vaginal birth after caesarean section (VBAC) failure rate at this BMI has been quoted to be as high as 87%. Performing a technically very difficult procedure out of hours can be a challenging and lonely experience.
During 2017/2018, an audit was undertaken to increase our understanding of birth outcomes and complications for our local population with a high BMI. We looked at whether there were variations in birth mode by parity, spontaneous or induced labour, and patients attempting vaginal birth after caesarean section, as well as the complication rates.
MethodA cohort of women with super morbid obesity, who booked at CM Health between April 2015 and March 2018 (3 years), was identified through the national Maternity Clinical Information System, retrospectively after they had birthed. The cohort was divided into two groups, BMI 50 to 54 and BMI 55+, for analysis.
Findings A total of 170 women were identified with a BMI in the 50 to 54 range, and 78 with a BMI over 55. Women identified as Pacific Islander represent over 70% of the women with a BMI ≥ 50 (see Table 21). The vast majority of the women birthing at CM Health with a BMI >50 were multiparous. Only 24 of the 170 women with a BMI of between 50 and 54, and 6 of the 78 women with a BMI ≥55+ were primiparous women.
The results of the audit are summarised opposite.
DR HONOR DAYObstetrics and Gynaecology Registrar
AUTHOR
25. Swinburn B.A., Sacks G., Hall K.D., McPherson K., Finegood D.T., Moodie M.L., & Gortmaker S.L. The global obesity pandemic: Shaped by global drivers and local environments Lancet 2017; 378:804-814
26. Chuahan S.P., Magann E.F., Carroll C.S., Barrilleaux P.S., Scardo J.A., & Martin J.N. Jr. (2001). Mode of delivery for the morbidly obese with prior caesarean delivery: Vaginal versus repeat caesarean section. American Journal of Obstetrics and Gynaecology, Aug:185(2): pp. 349-54
60
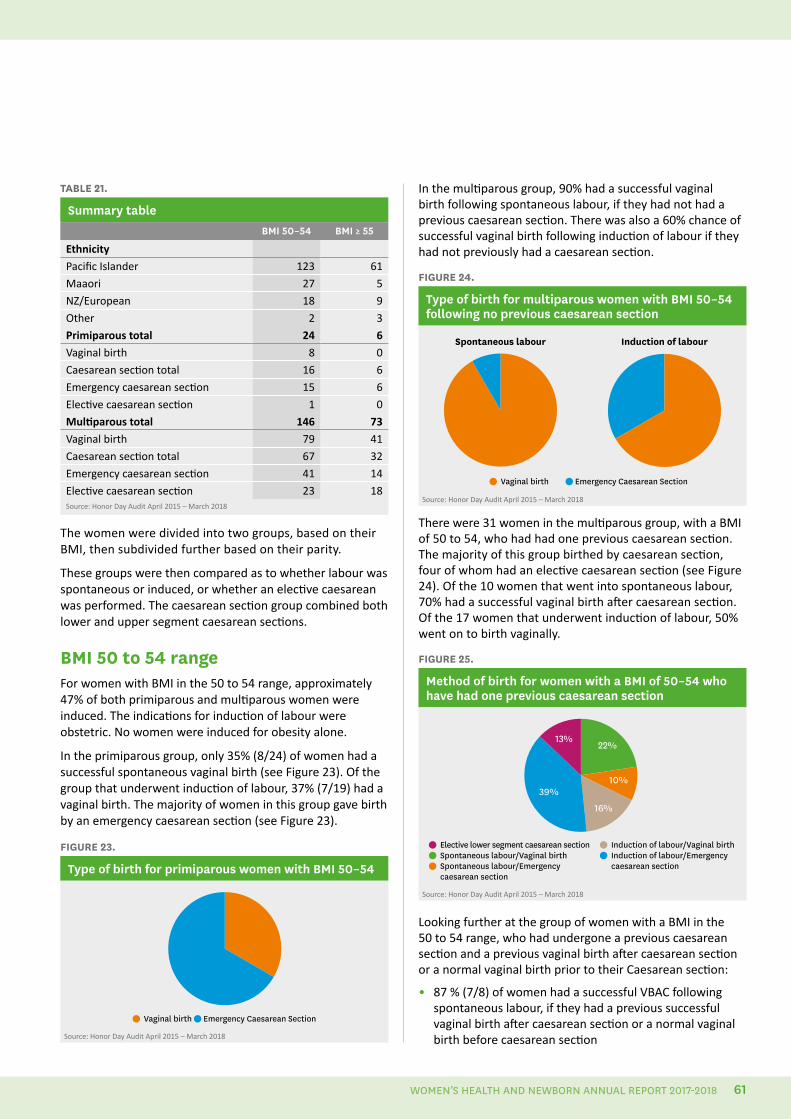
TABLE 21.
Summary table BMI 50–54 BMI ≥ 55
Ethnicity
Pacific Islander 123 61
Maaori 27 5
NZ/European 18 9
Other 2 3
Primiparous total 24 6
Vaginal birth 8 0
Caesarean section total 16 6
Emergency caesarean section 15 6
Elective caesarean section 1 0
Multiparous total 146 73
Vaginal birth 79 41
Caesarean section total 67 32
Emergency caesarean section 41 14
Elective caesarean section 23 18Source: Honor Day Audit April 2015 – March 2018
The women were divided into two groups, based on their BMI, then subdivided further based on their parity.
These groups were then compared as to whether labour was spontaneous or induced, or whether an elective caesarean was performed. The caesarean section group combined both lower and upper segment caesarean sections.
BMI 50 to 54 rangeFor women with BMI in the 50 to 54 range, approximately 47% of both primiparous and multiparous women were induced. The indications for induction of labour were obstetric. No women were induced for obesity alone.
In the primiparous group, only 35% (8/24) of women had a successful spontaneous vaginal birth (see Figure 23). Of the group that underwent induction of labour, 37% (7/19) had a vaginal birth. The majority of women in this group gave birth by an emergency caesarean section (see Figure 23).
FIGURE 23.
Type of birth for primiparous women with BMI 50–54
Vaginal birth Emergency Caesarean Section
Source: Honor Day Audit April 2015 – March 2018
In the multiparous group, 90% had a successful vaginal birth following spontaneous labour, if they had not had a previous caesarean section. There was also a 60% chance of successful vaginal birth following induction of labour if they had not previously had a caesarean section.
FIGURE 24.
Type of birth for multiparous women with BMI 50–54 following no previous caesarean section
Vaginal birth Emergency Caesarean Section
Induction of labourSpontaneous labour
Source: Honor Day Audit April 2015 – March 2018
There were 31 women in the multiparous group, with a BMI of 50 to 54, who had had one previous caesarean section. The majority of this group birthed by caesarean section, four of whom had an elective caesarean section (see Figure 24). Of the 10 women that went into spontaneous labour, 70% had a successful vaginal birth after caesarean section. Of the 17 women that underwent induction of labour, 50% went on to birth vaginally.
FIGURE 25.
Method of birth for women with a BMI of 50–54 who have had one previous caesarean section
Elective lower segment caesarean section Spontaneous labour/Vaginal birth Spontaneous labour/Emergency caesarean section
39%
13%
16%
10%
22%
Induction of labour/Vaginal birth Induction of labour/Emergency caesarean section
Source: Honor Day Audit April 2015 – March 2018
Looking further at the group of women with a BMI in the 50 to 54 range, who had undergone a previous caesarean section and a previous vaginal birth after caesarean section or a normal vaginal birth prior to their Caesarean section:
• 87 % (7/8) of women had a successful VBAC following spontaneous labour, if they had a previous successful vaginal birth after caesarean section or a normal vaginal birth before caesarean section
WOMEN’S HEALTH AND NEWBORN ANNUAL REPORT 2017-2018 61
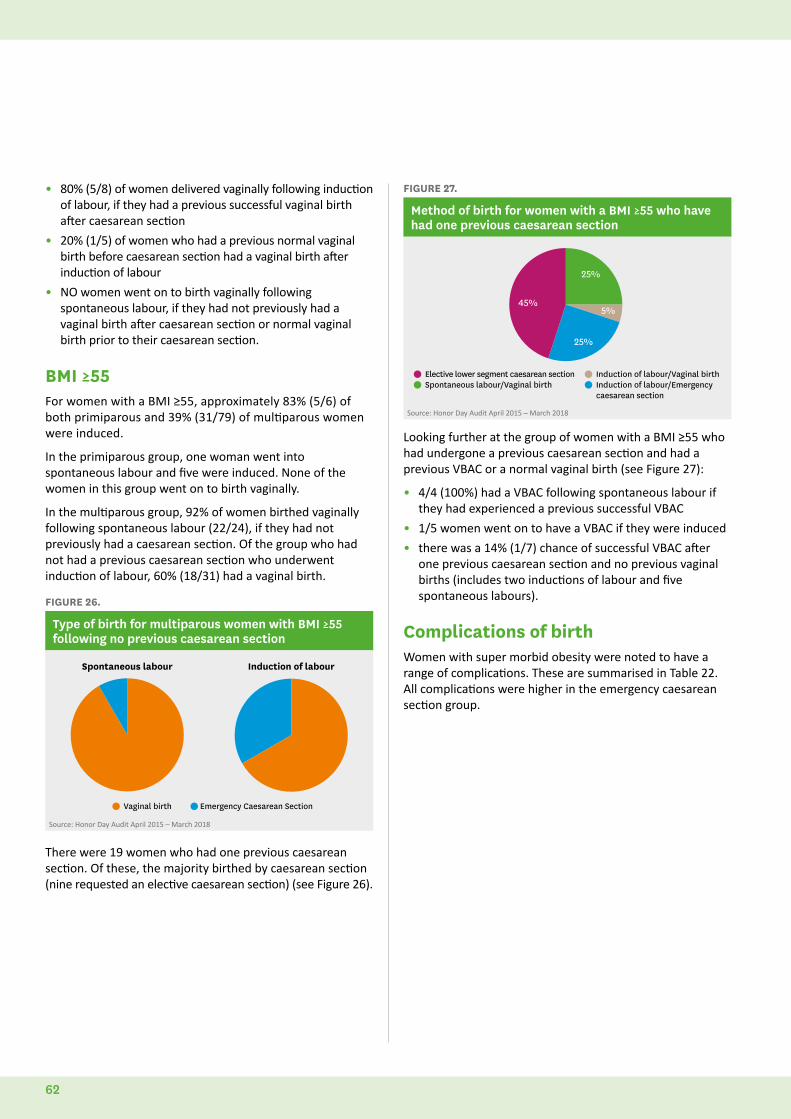
• 80% (5/8) of women delivered vaginally following induction of labour, if they had a previous successful vaginal birth after caesarean section
• 20% (1/5) of women who had a previous normal vaginal birth before caesarean section had a vaginal birth after induction of labour
• NO women went on to birth vaginally following spontaneous labour, if they had not previously had a vaginal birth after caesarean section or normal vaginal birth prior to their caesarean section.
BMI ≥55For women with a BMI ≥55, approximately 83% (5/6) of both primiparous and 39% (31/79) of multiparous women were induced.
In the primiparous group, one woman went into spontaneous labour and five were induced. None of the women in this group went on to birth vaginally.
In the multiparous group, 92% of women birthed vaginally following spontaneous labour (22/24), if they had not previously had a caesarean section. Of the group who had not had a previous caesarean section who underwent induction of labour, 60% (18/31) had a vaginal birth.
FIGURE 26.
Type of birth for multiparous women with BMI ≥55 following no previous caesarean section
Vaginal birth Emergency Caesarean Section
Induction of labourSpontaneous labour
Source: Honor Day Audit April 2015 – March 2018
There were 19 women who had one previous caesarean section. Of these, the majority birthed by caesarean section (nine requested an elective caesarean section) (see Figure 26).
FIGURE 27.
Method of birth for women with a BMI ≥55 who have had one previous caesarean section
Elective lower segment caesarean section Spontaneous labour/Vaginal birth
39%
16%
10%
22%
Induction of labour/Vaginal birth Induction of labour/Emergency caesarean section
5%45%
25%
25%
Source: Honor Day Audit April 2015 – March 2018
Looking further at the group of women with a BMI ≥55 who had undergone a previous caesarean section and had a previous VBAC or a normal vaginal birth (see Figure 27):
• 4/4 (100%) had a VBAC following spontaneous labour if they had experienced a previous successful VBAC
• 1/5 women went on to have a VBAC if they were induced
• there was a 14% (1/7) chance of successful VBAC after one previous caesarean section and no previous vaginal births (includes two inductions of labour and five spontaneous labours).
Complications of birthWomen with super morbid obesity were noted to have a range of complications. These are summarised in Table 22. All complications were higher in the emergency caesarean section group.
62
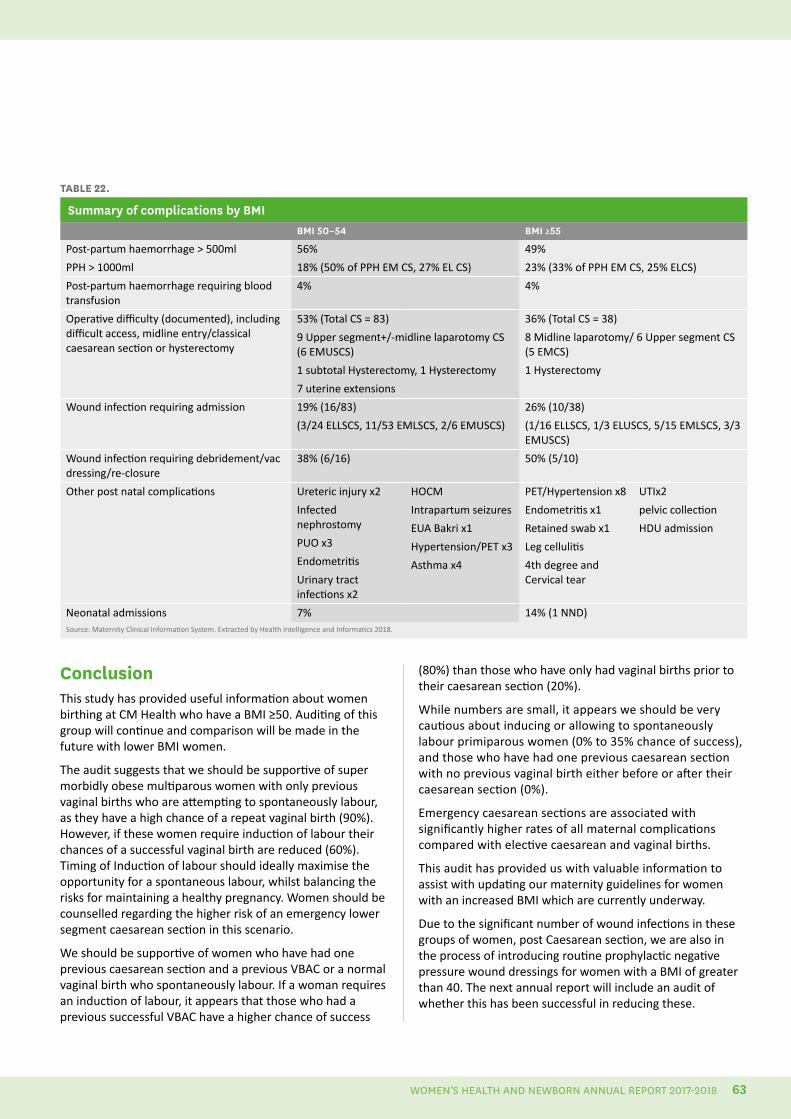
Conclusion This study has provided useful information about women birthing at CM Health who have a BMI ≥50. Auditing of this group will continue and comparison will be made in the future with lower BMI women.
The audit suggests that we should be supportive of super morbidly obese multiparous women with only previous vaginal births who are attempting to spontaneously labour, as they have a high chance of a repeat vaginal birth (90%). However, if these women require induction of labour their chances of a successful vaginal birth are reduced (60%). Timing of Induction of labour should ideally maximise the opportunity for a spontaneous labour, whilst balancing the risks for maintaining a healthy pregnancy. Women should be counselled regarding the higher risk of an emergency lower segment caesarean section in this scenario.
We should be supportive of women who have had one previous caesarean section and a previous VBAC or a normal vaginal birth who spontaneously labour. If a woman requires an induction of labour, it appears that those who had a previous successful VBAC have a higher chance of success
TABLE 22.
Summary of complications by BMIBMI 50–54 BMI ≥55
Post-partum haemorrhage > 500ml
PPH > 1000ml
56%
18% (50% of PPH EM CS, 27% EL CS)
49%
23% (33% of PPH EM CS, 25% ELCS)
Post-partum haemorrhage requiring blood transfusion
4% 4%
Operative difficulty (documented), including difficult access, midline entry/classical caesarean section or hysterectomy
53% (Total CS = 83)
9 Upper segment+/-midline laparotomy CS (6 EMUSCS)
1 subtotal Hysterectomy, 1 Hysterectomy
7 uterine extensions
36% (Total CS = 38)
8 Midline laparotomy/ 6 Upper segment CS (5 EMCS)
1 Hysterectomy
Wound infection requiring admission 19% (16/83)
(3/24 ELLSCS, 11/53 EMLSCS, 2/6 EMUSCS)
26% (10/38)
(1/16 ELLSCS, 1/3 ELUSCS, 5/15 EMLSCS, 3/3 EMUSCS)
Wound infection requiring debridement/vac dressing/re-closure
38% (6/16) 50% (5/10)
Other post natal complications Ureteric injury x2
Infected nephrostomy
PUO x3
Endometritis
Urinary tract infections x2
HOCM
Intrapartum seizures
EUA Bakri x1
Hypertension/PET x3
Asthma x4
PET/Hypertension x8
Endometritis x1
Retained swab x1
Leg cellulitis
4th degree and Cervical tear
UTIx2
pelvic collection
HDU admission
Neonatal admissions 7% 14% (1 NND)Source: Maternity Clinical Information System. Extracted by Health Intelligence and Informatics 2018.
(80%) than those who have only had vaginal births prior to their caesarean section (20%).
While numbers are small, it appears we should be very cautious about inducing or allowing to spontaneously labour primiparous women (0% to 35% chance of success), and those who have had one previous caesarean section with no previous vaginal birth either before or after their caesarean section (0%).
Emergency caesarean sections are associated with significantly higher rates of all maternal complications compared with elective caesarean and vaginal births.
This audit has provided us with valuable information to assist with updating our maternity guidelines for women with an increased BMI which are currently underway.
Due to the significant number of wound infections in these groups of women, post Caesarean section, we are also in the process of introducing routine prophylactic negative pressure wound dressings for women with a BMI of greater than 40. The next annual report will include an audit of whether this has been successful in reducing these.
WOMEN’S HEALTH AND NEWBORN ANNUAL REPORT 2017-2018 63
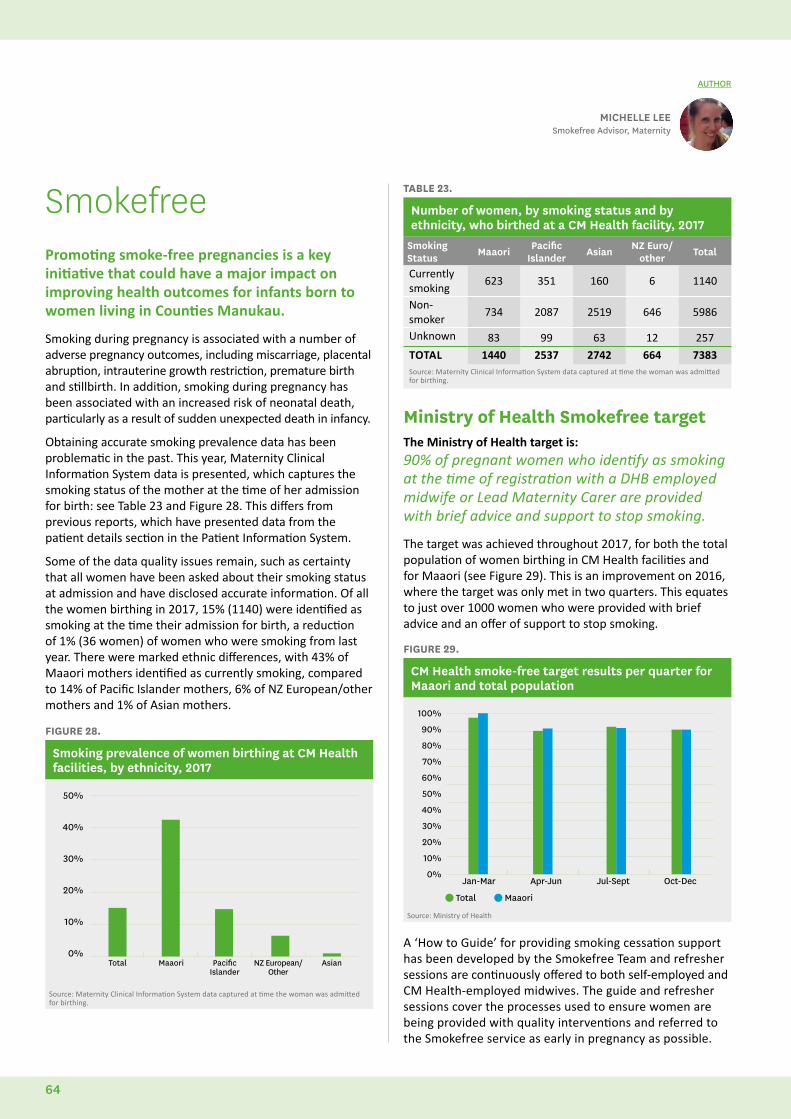
SmokefreePromoting smoke-free pregnancies is a key initiative that could have a major impact on improving health outcomes for infants born to women living in Counties Manukau.
Smoking during pregnancy is associated with a number of adverse pregnancy outcomes, including miscarriage, placental abruption, intrauterine growth restriction, premature birth and stillbirth. In addition, smoking during pregnancy has been associated with an increased risk of neonatal death, particularly as a result of sudden unexpected death in infancy.
Obtaining accurate smoking prevalence data has been problematic in the past. This year, Maternity Clinical Information System data is presented, which captures the smoking status of the mother at the time of her admission for birth: see Table 23 and Figure 28. This differs from previous reports, which have presented data from the patient details section in the Patient Information System.
Some of the data quality issues remain, such as certainty that all women have been asked about their smoking status at admission and have disclosed accurate information. Of all the women birthing in 2017, 15% (1140) were identified as smoking at the time their admission for birth, a reduction of 1% (36 women) of women who were smoking from last year. There were marked ethnic differences, with 43% of Maaori mothers identified as currently smoking, compared to 14% of Pacific Islander mothers, 6% of NZ European/other mothers and 1% of Asian mothers.
FIGURE 28.
Smoking prevalence of women birthing at CM Health facilities, by ethnicity, 2017
50%
40%
30%
20%
10%
0%Total Maaori Pacific
IslanderNZ European/
OtherAsian
Source: Maternity Clinical Information System data captured at time the woman was admitted for birthing.
TABLE 23.
Number of women, by smoking status and by ethnicity, who birthed at a CM Health facility, 2017
Smoking Status Maaori Pacific
Islander Asian NZ Euro/other Total
Currently smoking
623 351 160 6 1140
Non-smoker
734 2087 2519 646 5986
Unknown 83 99 63 12 257
TOTAL 1440 2537 2742 664 7383Source: Maternity Clinical Information System data captured at time the woman was admitted for birthing.
Ministry of Health Smokefree targetThe Ministry of Health target is:90% of pregnant women who identify as smoking at the time of registration with a DHB employed midwife or Lead Maternity Carer are provided with brief advice and support to stop smoking.
The target was achieved throughout 2017, for both the total population of women birthing in CM Health facilities and for Maaori (see Figure 29). This is an improvement on 2016, where the target was only met in two quarters. This equates to just over 1000 women who were provided with brief advice and an offer of support to stop smoking.
FIGURE 29.
CM Health smoke-free target results per quarter for Maaori and total population
Jan-Mar Apr-Jun Jul-Sept Oct-Dec
100%
90%
80%
70%
60%
50%
40%
30%
20%
10%
0%
Total Maaori
Source: Ministry of Health
A ‘How to Guide’ for providing smoking cessation support has been developed by the Smokefree Team and refresher sessions are continuously offered to both self-employed and CM Health-employed midwives. The guide and refresher sessions cover the processes used to ensure women are being provided with quality interventions and referred to the Smokefree service as early in pregnancy as possible.
MICHELLE LEESmokefree Advisor, Maternity
AUTHOR
64
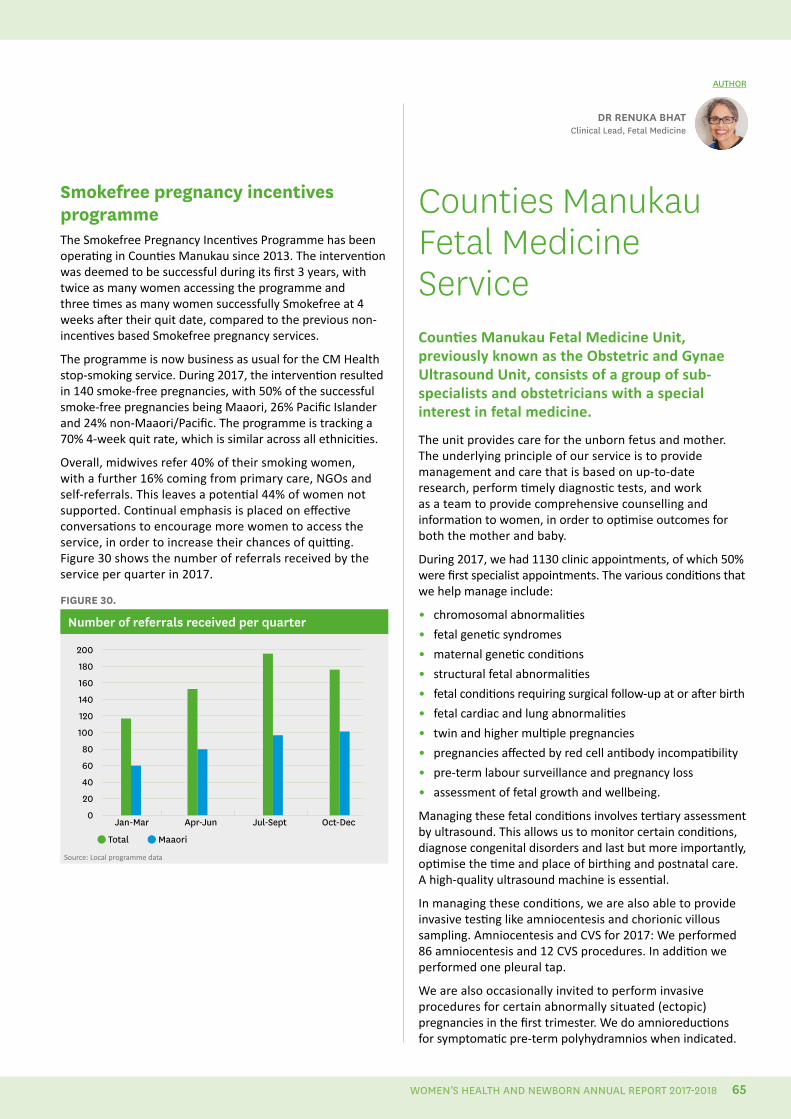
DR RENUKA BHAT Clinical Lead, Fetal Medicine
AUTHOR
Smokefree pregnancy incentives programmeThe Smokefree Pregnancy Incentives Programme has been operating in Counties Manukau since 2013. The intervention was deemed to be successful during its first 3 years, with twice as many women accessing the programme and three times as many women successfully Smokefree at 4 weeks after their quit date, compared to the previous non-incentives based Smokefree pregnancy services.
The programme is now business as usual for the CM Health stop-smoking service. During 2017, the intervention resulted in 140 smoke-free pregnancies, with 50% of the successful smoke-free pregnancies being Maaori, 26% Pacific Islander and 24% non-Maaori/Pacific. The programme is tracking a 70% 4-week quit rate, which is similar across all ethnicities.
Overall, midwives refer 40% of their smoking women, with a further 16% coming from primary care, NGOs and self-referrals. This leaves a potential 44% of women not supported. Continual emphasis is placed on effective conversations to encourage more women to access the service, in order to increase their chances of quitting. Figure 30 shows the number of referrals received by the service per quarter in 2017.
FIGURE 30.
Number of referrals received per quarter
Jan-Mar Apr-Jun Jul-Sept Oct-Dec
200
180
160
140
120
100
80
60
40
20
0
Total Maaori
Source: Local programme data
Counties Manukau Fetal Medicine Service Counties Manukau Fetal Medicine Unit, previously known as the Obstetric and Gynae Ultrasound Unit, consists of a group of sub-specialists and obstetricians with a special interest in fetal medicine.
The unit provides care for the unborn fetus and mother. The underlying principle of our service is to provide management and care that is based on up-to-date research, perform timely diagnostic tests, and work as a team to provide comprehensive counselling and information to women, in order to optimise outcomes for both the mother and baby.
During 2017, we had 1130 clinic appointments, of which 50% were first specialist appointments. The various conditions that we help manage include:
• chromosomal abnormalities
• fetal genetic syndromes
• maternal genetic conditions
• structural fetal abnormalities
• fetal conditions requiring surgical follow-up at or after birth
• fetal cardiac and lung abnormalities
• twin and higher multiple pregnancies
• pregnancies affected by red cell antibody incompatibility
• pre-term labour surveillance and pregnancy loss
• assessment of fetal growth and wellbeing.
Managing these fetal conditions involves tertiary assessment by ultrasound. This allows us to monitor certain conditions, diagnose congenital disorders and last but more importantly, optimise the time and place of birthing and postnatal care. A high-quality ultrasound machine is essential.
In managing these conditions, we are also able to provide invasive testing like amniocentesis and chorionic villous sampling. Amniocentesis and CVS for 2017: We performed 86 amniocentesis and 12 CVS procedures. In addition we performed one pleural tap.
We are also occasionally invited to perform invasive procedures for certain abnormally situated (ectopic) pregnancies in the first trimester. We do amnioreductions for symptomatic pre-term polyhydramnios when indicated.
WOMEN’S HEALTH AND NEWBORN ANNUAL REPORT 2017-2018 65
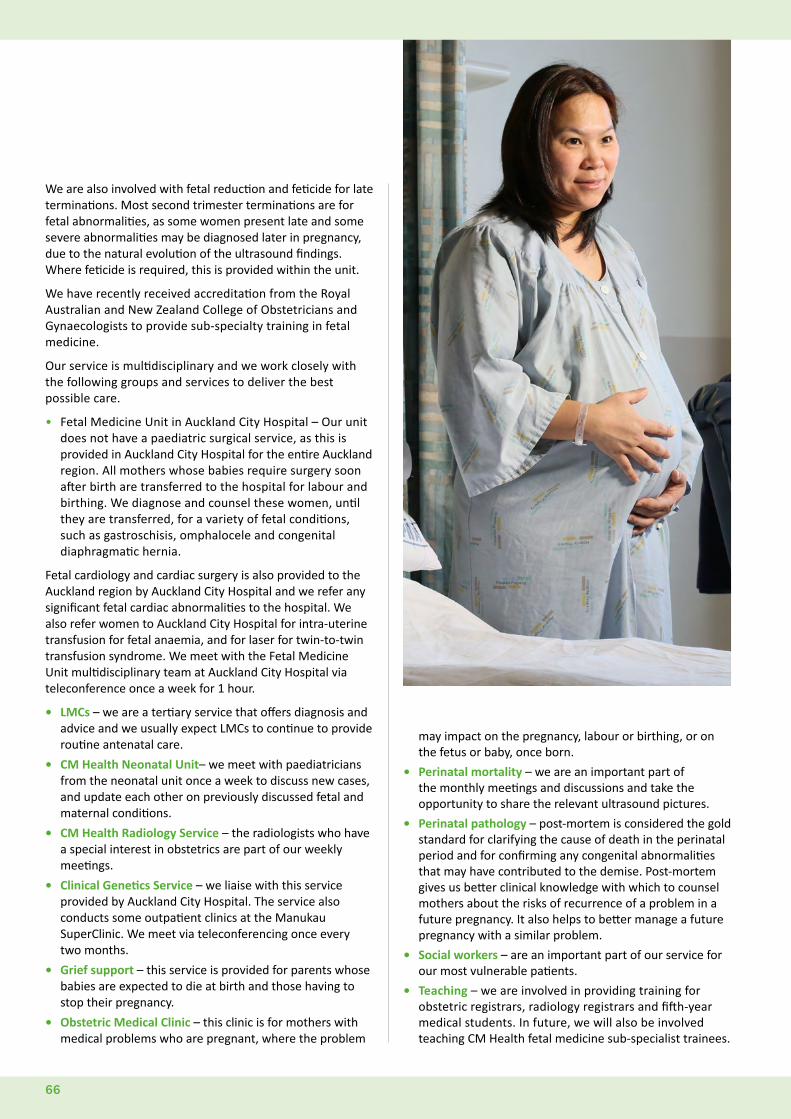
We are also involved with fetal reduction and feticide for late terminations. Most second trimester terminations are for fetal abnormalities, as some women present late and some severe abnormalities may be diagnosed later in pregnancy, due to the natural evolution of the ultrasound findings. Where feticide is required, this is provided within the unit.
We have recently received accreditation from the Royal Australian and New Zealand College of Obstetricians and Gynaecologists to provide sub-specialty training in fetal medicine.
Our service is multidisciplinary and we work closely with the following groups and services to deliver the best possible care.
• Fetal Medicine Unit in Auckland City Hospital – Our unit does not have a paediatric surgical service, as this is provided in Auckland City Hospital for the entire Auckland region. All mothers whose babies require surgery soon after birth are transferred to the hospital for labour and birthing. We diagnose and counsel these women, until they are transferred, for a variety of fetal conditions, such as gastroschisis, omphalocele and congenital diaphragmatic hernia.
Fetal cardiology and cardiac surgery is also provided to the Auckland region by Auckland City Hospital and we refer any significant fetal cardiac abnormalities to the hospital. We also refer women to Auckland City Hospital for intra-uterine transfusion for fetal anaemia, and for laser for twin-to-twin transfusion syndrome. We meet with the Fetal Medicine Unit multidisciplinary team at Auckland City Hospital via teleconference once a week for 1 hour.
• LMCs – we are a tertiary service that offers diagnosis and advice and we usually expect LMCs to continue to provide routine antenatal care.
• CM Health Neonatal Unit– we meet with paediatricians from the neonatal unit once a week to discuss new cases, and update each other on previously discussed fetal and maternal conditions.
• CM Health Radiology Service – the radiologists who have a special interest in obstetrics are part of our weekly meetings.
• Clinical Genetics Service – we liaise with this service provided by Auckland City Hospital. The service also conducts some outpatient clinics at the Manukau SuperClinic. We meet via teleconferencing once every two months.
• Grief support – this service is provided for parents whose babies are expected to die at birth and those having to stop their pregnancy.
• Obstetric Medical Clinic – this clinic is for mothers with medical problems who are pregnant, where the problem
may impact on the pregnancy, labour or birthing, or on the fetus or baby, once born.
• Perinatal mortality – we are an important part of the monthly meetings and discussions and take the opportunity to share the relevant ultrasound pictures.
• Perinatal pathology – post-mortem is considered the gold standard for clarifying the cause of death in the perinatal period and for confirming any congenital abnormalities that may have contributed to the demise. Post-mortem gives us better clinical knowledge with which to counsel mothers about the risks of recurrence of a problem in a future pregnancy. It also helps to better manage a future pregnancy with a similar problem.
• Social workers – are an important part of our service for our most vulnerable patients.
• Teaching – we are involved in providing training for obstetric registrars, radiology registrars and fifth-year medical students. In future, we will also be involved teaching CM Health fetal medicine sub-specialist trainees.
66
HUMBA TrialThe Healthy Mums and Babies (HUMBA) Trial was a study that was carried out in Counties Manukau in 230 pregnant women with obesity. Women who agreed to be in the study were divided into two groups. One group (116 women) had four planned dietary education meetings with a community health worker (trained in nutrition and healthy conversations) and also received health text messages on their phone. The other group (114 women) received the usual diet and healthy weight gain pamphlets from the NZ Ministry of Health.
The same group of 230 women were also given probiotics (115 women) or a similar tablet that looked like probiotics but had no probiotics in it (115 women). The study aimed to see if helping women to eat healthily and be supported by text messages, with or without probiotics, would reduce women gaining too much weight in pregnancy and improve the weight of the baby.
In total, Maaori (23%), Pacific Islander (50%), European (18%), Indian (6%) and other (4%) participated in the study.
Encouragingly, the women who were offered a dietary intervention had almost 2kg less total weight gain, between when they were recruited and 36 weeks gestation. Almost all of the women (92%) found participation in HUMBA a positive experience.
In the dietary intervention group:
• 71% found that education from a community health worker helped them to eat healthy food
• all participants said they would recommend a community health worker to a friend
• 92% reported reading their text messages.
Further detailed analysis of the trial is currently underway and will be available for next year’s report.
GEMS StudyThe GEMS study (Gestational Diabetes Mellitus Study of Diagnostic Thresholds) is a large population study, which compares the effect of two different criteria for diagnosing gestational diabetes mellitus, on the health outcomes for women and their infants. The two criteria are:
• the current New Zealand thresholds for the oral glucose tolerance test in pregnancy
DR KARA OKESENE-GAFALead Clinician, Diabetes in
Pregnancy Service
AUTHOR
• the lower International Association of the Study of Diabetes in Pregnancy Group (IADPSG) thresholds.
The study asks the question ‘Which threshold is best for the health and wellbeing of mums and babies?’
The 2014 Ministry of Health gestational diabetes mellitus guidelines recommend that pregnant women should be offered participation in the GEMS study as one of their options for pregnancy screening for diabetes.
To date, over 2200 women from Counties Manukau and Auckland DHBs have joined the study. The CM Health Diabetes in Pregnancy Service sees women who have been diagnosed with gestational diabetes by either threshold, and the service is not made aware of the women’s allocation group and actual oral glucose tolerance test results (unless they fall in the frank diabetic range).
The GEMS study team is keen to maximise the involvement of Counties Manukau women in this important research. All women with a singleton pregnancy and without prior history of gestational diabetes mellitus or diabetes are eligible to participate. For further information, please contact [email protected] or ring 09 923-1356.
TARGET StudyThe TARGET study is comparing less tight with tighter treatment targets for glycaemic control for women with gestational diabetes mellitus. The TARGET study is asking the question, ‘Is it best for women with gestational diabetes mellitus to follow less tight or tighter blood sugar targets?’ In this study, the hospital begins by using less tight targets and moves to tighter targets at a randomly specified time point.
Since 1 March 2016, the diabetes service has used the tighter glycaemic targets for women with diabetes in pregnancy. Counties Manukau is one of the busiest sites participating in this multi-centre New Zealand-based randomised controlled trial. All 10 hospitals participating in TARGET have now been randomised to the tighter glycaemic targets and recruitment was completed as of November 2017.
The TARGET study team is grateful to the Diabetes in Pregnancy Service health professionals for endorsing the glycaemic targets at the various time points, and for successfully implementing the change from ‘less tight’ to ‘tight’. The study results will provide much needed data regarding effective treatment for women with gestational diabetes mellitus.
WOMEN’S HEALTH AND NEWBORN ANNUAL REPORT 2017-2018 67
Maternity care is coordinated across settings and disciplines to maximise safety and use resources wisely
68
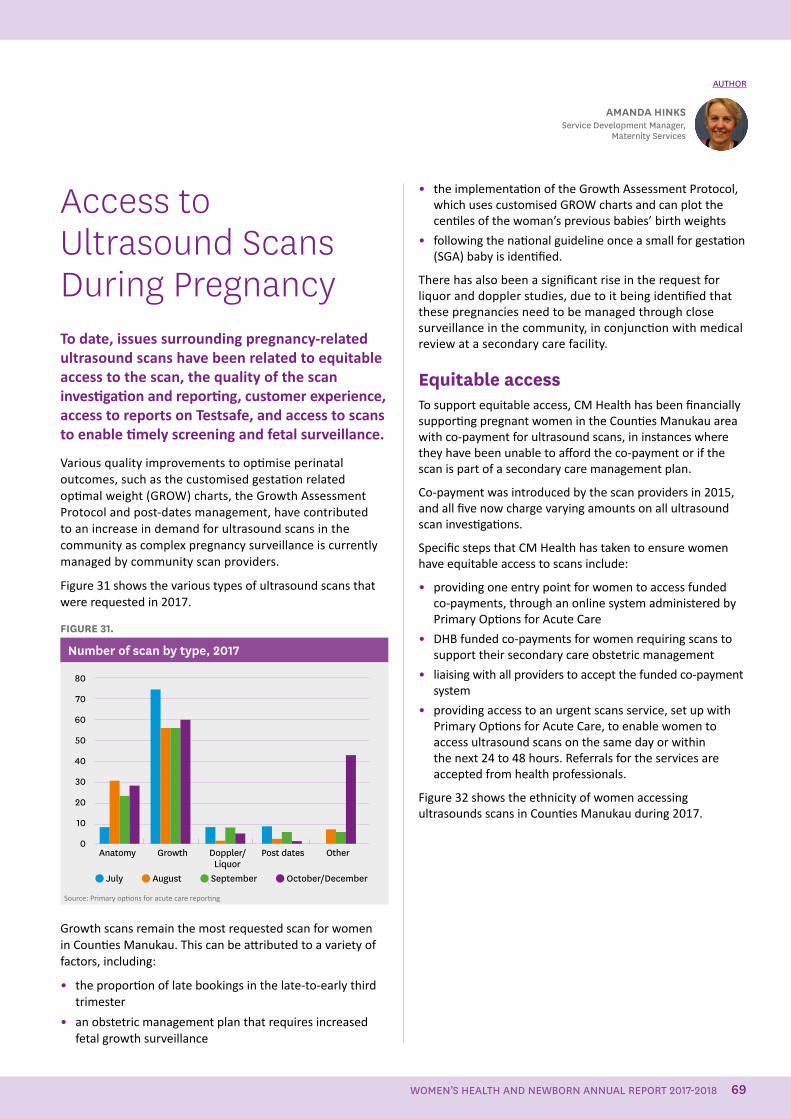
Access to Ultrasound Scans During PregnancyTo date, issues surrounding pregnancy-related ultrasound scans have been related to equitable access to the scan, the quality of the scan investigation and reporting, customer experience, access to reports on Testsafe, and access to scans to enable timely screening and fetal surveillance.
Various quality improvements to optimise perinatal outcomes, such as the customised gestation related optimal weight (GROW) charts, the Growth Assessment Protocol and post-dates management, have contributed to an increase in demand for ultrasound scans in the community as complex pregnancy surveillance is currently managed by community scan providers.
Figure 31 shows the various types of ultrasound scans that were requested in 2017.
FIGURE 31.
Number of scan by type, 2017
Anatomy Growth Doppler/ Post dates Other
80
70
60
50
40
30
20
10
0
July August September October/DecemberLiquor
Source: Primary options for acute care reporting
Growth scans remain the most requested scan for women in Counties Manukau. This can be attributed to a variety of factors, including:
• the proportion of late bookings in the late-to-early third trimester
• an obstetric management plan that requires increased fetal growth surveillance
• the implementation of the Growth Assessment Protocol, which uses customised GROW charts and can plot the centiles of the woman’s previous babies’ birth weights
• following the national guideline once a small for gestation (SGA) baby is identified.
There has also been a significant rise in the request for liquor and doppler studies, due to it being identified that these pregnancies need to be managed through close surveillance in the community, in conjunction with medical review at a secondary care facility.
Equitable accessTo support equitable access, CM Health has been financially supporting pregnant women in the Counties Manukau area with co-payment for ultrasound scans, in instances where they have been unable to afford the co-payment or if the scan is part of a secondary care management plan.
Co-payment was introduced by the scan providers in 2015, and all five now charge varying amounts on all ultrasound scan investigations.
Specific steps that CM Health has taken to ensure women have equitable access to scans include:
• providing one entry point for women to access funded co-payments, through an online system administered by Primary Options for Acute Care
• DHB funded co-payments for women requiring scans to support their secondary care obstetric management
• liaising with all providers to accept the funded co-payment system
• providing access to an urgent scans service, set up with Primary Options for Acute Care, to enable women to access ultrasound scans on the same day or within the next 24 to 48 hours. Referrals for the services are accepted from health professionals.
Figure 32 shows the ethnicity of women accessing ultrasounds scans in Counties Manukau during 2017.
AMANDA HINKSService Development Manager,
Maternity Services
AUTHOR
WOMEN’S HEALTH AND NEWBORN ANNUAL REPORT 2017-2018 69
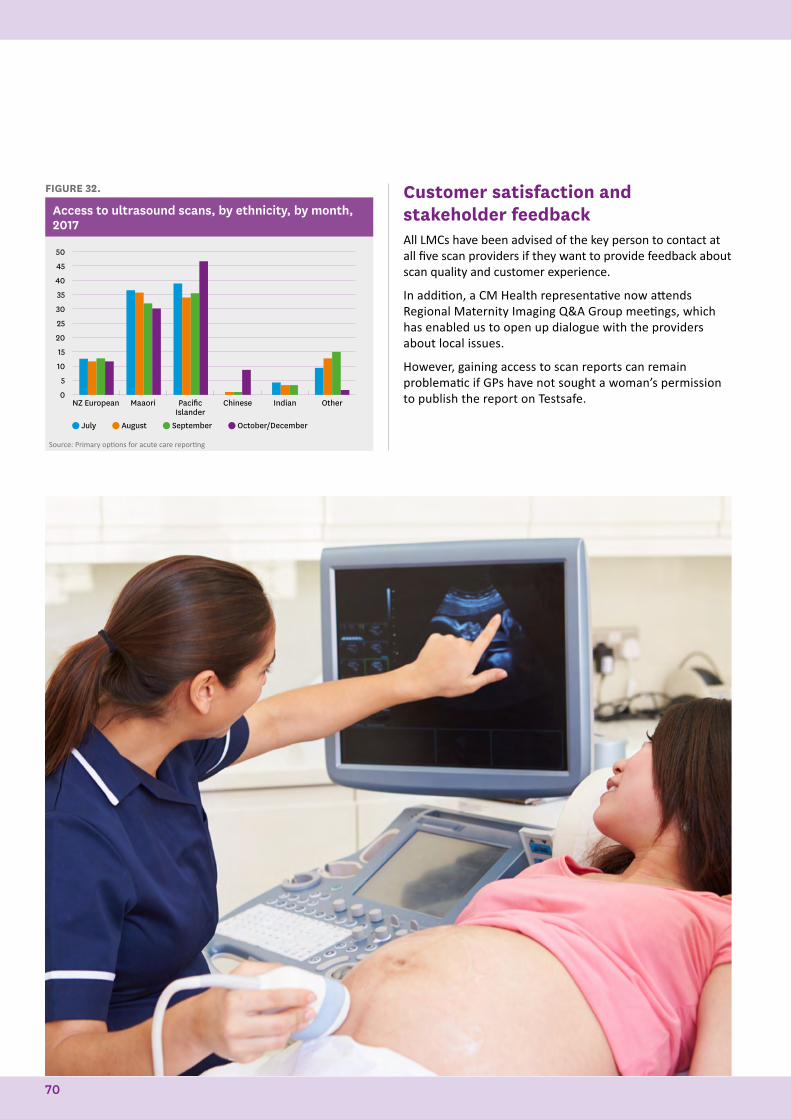
FIGURE 32.
Access to ultrasound scans, by ethnicity, by month, 2017
NZ European Maaori Pacific Islander
Chinese Indian Other
50
45
40
35
30
25
20
15
10
5
0
July August September October/December
Source: Primary options for acute care reporting
Customer satisfaction and stakeholder feedbackAll LMCs have been advised of the key person to contact at all five scan providers if they want to provide feedback about scan quality and customer experience.
In addition, a CM Health representative now attends Regional Maternity Imaging Q&A Group meetings, which has enabled us to open up dialogue with the providers about local issues.
However, gaining access to scan reports can remain problematic if GPs have not sought a woman’s permission to publish the report on Testsafe.
70
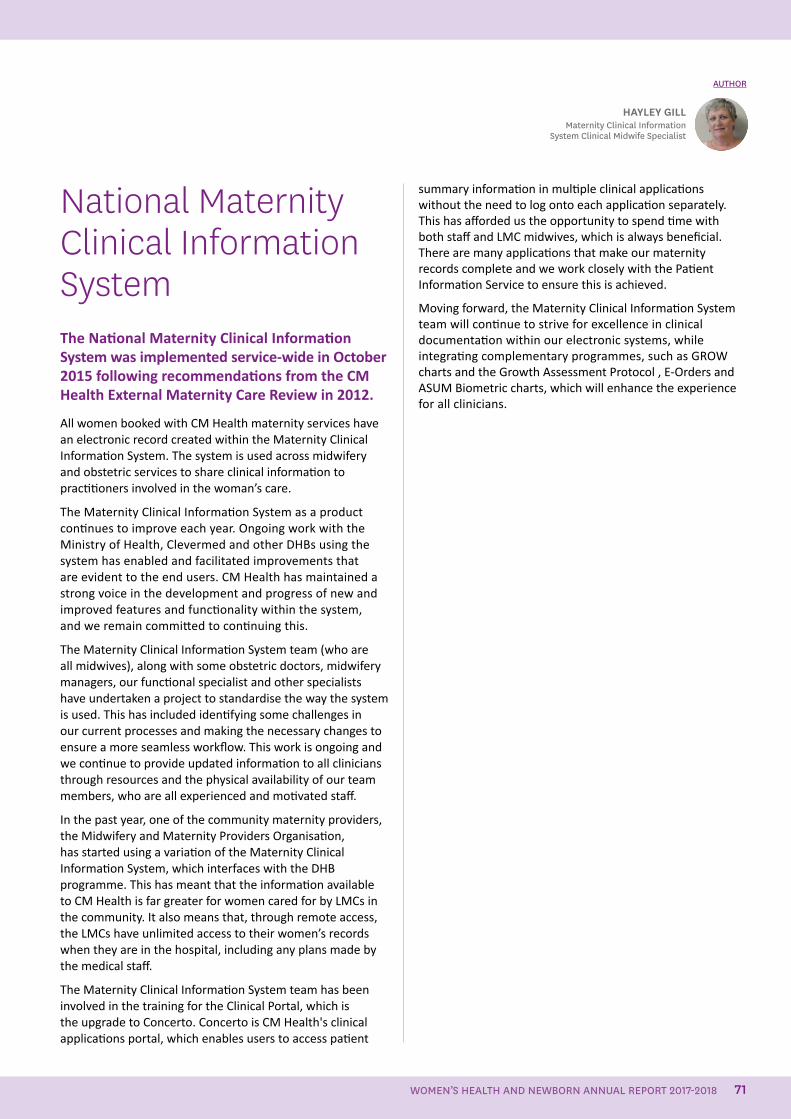
National Maternity Clinical Information System The National Maternity Clinical Information System was implemented service-wide in October 2015 following recommendations from the CM Health External Maternity Care Review in 2012.
All women booked with CM Health maternity services have an electronic record created within the Maternity Clinical Information System. The system is used across midwifery and obstetric services to share clinical information to practitioners involved in the woman’s care.
The Maternity Clinical Information System as a product continues to improve each year. Ongoing work with the Ministry of Health, Clevermed and other DHBs using the system has enabled and facilitated improvements that are evident to the end users. CM Health has maintained a strong voice in the development and progress of new and improved features and functionality within the system, and we remain committed to continuing this.
The Maternity Clinical Information System team (who are all midwives), along with some obstetric doctors, midwifery managers, our functional specialist and other specialists have undertaken a project to standardise the way the system is used. This has included identifying some challenges in our current processes and making the necessary changes to ensure a more seamless workflow. This work is ongoing and we continue to provide updated information to all clinicians through resources and the physical availability of our team members, who are all experienced and motivated staff.
In the past year, one of the community maternity providers, the Midwifery and Maternity Providers Organisation, has started using a variation of the Maternity Clinical Information System, which interfaces with the DHB programme. This has meant that the information available to CM Health is far greater for women cared for by LMCs in the community. It also means that, through remote access, the LMCs have unlimited access to their women’s records when they are in the hospital, including any plans made by the medical staff.
The Maternity Clinical Information System team has been involved in the training for the Clinical Portal, which is the upgrade to Concerto. Concerto is CM Health's clinical applications portal, which enables users to access patient
summary information in multiple clinical applications without the need to log onto each application separately. This has afforded us the opportunity to spend time with both staff and LMC midwives, which is always beneficial. There are many applications that make our maternity records complete and we work closely with the Patient Information Service to ensure this is achieved.
Moving forward, the Maternity Clinical Information System team will continue to strive for excellence in clinical documentation within our electronic systems, while integrating complementary programmes, such as GROW charts and the Growth Assessment Protocol , E-Orders and ASUM Biometric charts, which will enhance the experience for all clinicians.
HAYLEY GILLMaternity Clinical Information
System Clinical Midwife Specialist
AUTHOR
WOMEN’S HEALTH AND NEWBORN ANNUAL REPORT 2017-2018 71
National Consistency in Maternal Mental Health ServicesEarly identification and easy access to services for the assessment and treatment of mental illness during the perinatal period has been identified as a crucial factor in determining the health outcomes for mothers with mental illness and their babies. A key determinant to achieve this is a well-integrated health system, where the maternity services and the mental health services are well coordinated in the care of women with mental illness.
The Maternal Mental Health team provides specialist care for women who are pregnant or up to 12 months postpartum. The team sees women who are experiencing moderate to severe mental health problems, which are impacting on their pregnancy or functioning as a mother. Psychiatric pre-pregnancy consultations are offered for women who have current or previous significant mental health difficulties and are planning a pregnancy.
Over the past 12 months, the Maternal Mental Health team has continued to build on previous service enhancements following the increase of funding from the Ministry of Health (2014–2017). This has included education for primary care providers, coordinated service delivery with Community Mental Health Services and further service enhancements within the team. Recent progress in aligning the CM Health Whakatupu Ora, Infant Mental Health and Maternal Mental Health teams reflects the goal of greater integration of early intervention for infants with the provision of maternal mental health assessment and treatment.
Maternal mental health initiativesDuring 2017/2018, the Maternal Mental Health team has:
• provided training and consultation for the Intake and Assessment team (the mental health system point of entry) to facilitate appropriate referrals to Maternal Mental Health
• set up a Maternal Mental Health referrals email address, for the Intake and Assessment team to use when sending through referrals electronically, and to enhance liaison and consultation between the Intake and Assessment team and maternal intake clinicians
KATIE FERGUSONDistrict Wide Team Manager,
Mental Health Services
AUTHORS
ANNA HAWKINSInterim Clinical Coordinator of Perinatal
Services Maternal Mental Health
• based two clinicians in Franklin and providing a monthly clinic day at Pukekohe Hospital, with a Maternal Mental Health team consultant psychiatrist available for psychiatric assessments and reviews.
• benefited from the relocation of the Infant Mental Health team to Whirinaki, so the two teams can work alongside each other on site. This has involved making available refitted clinic rooms suitable for the specialist treatments provided by Infant Mental Health.
• enabled some of its clinicians to be trained in the MCIS, in order to facilitate information sharing and coordination of care across maternal clinicians
• attended monthly access holders meetings to provide updates and feedback.
Shared care approachWith respect to facilitating a shared care approach, the Maternal Mental Health team has:
• held education sessions with the Community Mental Health teams about improving the provision of shared care for clients with pre-existing mental health concerns who are pregnant or postnatal
• begun aligning the services provided by the Infant Mental Health and Maternal Mental Health teams, through increased consultation and case discussion regarding parental mental health and its impact on infant development and attachment
• liaised with LMCs, for all referrals for pregnant women, within 4 weeks of the referral
• together with Infant Mental Health clinicians, provided a Dealing with Distress Group programme for adolescent parents at a Teen Parenting Unit
• made progress towards developing a kaupapa Maaori Dealing with Distress Group for Maaori women.
Education and clinical networkingThe Maternal Mental Health team has provided a number of education sessions to increase the awareness of other health providers about maternal mental health services and indicators that women may benefit from a referral to the team.
These have included:
• the Annual Midwives Training Day in June 2018, which has been broadened to include nurses working in Women’s Health (gynaecology, obstetrics and maternity)
• a locality based 3-hour training session for community LMC midwives accessing the Pukekohe, Papakura and Botany Downs birthing units, including the referral process and commonly presenting mental health concerns
72
• a presentation by clinical psychologists from the team at a Grief and Loss Forum attended by midwives and nurses from Women’s Health and Kidz First; the presentation highlighted the impact of grief on mental health and indicators for referral to the Maternal Mental Health team
• education for Kāhui Tū Kaha staff who work at Awhi Rito, the mother–baby respite facility used by the Maternal Mental Health team
• two education sessions for nurses (registered, practice, public health and in the justice system), as part of the collaborative mental health and addictions credentialing programme. Feedback indicated that the nurses have made changes in their practice as a result of the sessions, including being more proactive in screening for postnatal depression and bonding concerns. The following feedback received from a practice nurse who attended a session illustrates this: “Last week in a meeting with the doctors and nurses at my workplace I was able to share information from the course and suggest innovation and it was listed to-we are implementing the Edinburgh Postnatal Depression Scale (EPDS) and monitoring for metabolic syndrome and antipsychotics.”
In addition, the Maternal Mental Health team has developed an education pamphlet to be included in the First Contact Pregnancy Information Pack that is provided to all women on confirmation of pregnancy. The pamphlet provides brief prompts designed to alert pregnant women and their whaanau to possible indicators of mental health difficulties and where to gain support.
SummaryThe Maternal Mental Health team is passionate about providing a responsive and effective service to women during the perinatal period. The team’s dedication to quality service provision was reflected in being awarded a 2017 Service Award for Mental Health at the 2017 Nursing and Midwifery Awards for CM Health.
In presenting the award, Lyn Murphy, Chairperson of the Hospital Advisory Committee of CM Health said:
“The Team received this award for their work, in collaboration with their Non- Governmental Organisation partner, to develop a clear and contemporary model of care which provides improved access to maternal mental health support for women when pregnant or with a new baby.”
Diabetes in PregnancyDiabetes in pregnancy is a growing concern in Counties Manukau, due to the high rates of women entering pregnancy with obesity, which is a risk factor for developing gestational diabetes. Obesity also increases risks of Type 2 diabetes. Women with any type of diabetes during pregnancy (gestational diabetes mellitus, Type 1 and Type 2) have increased risks of developing major pregnancy complications.
Women with diabetes during pregnancy have increased risks of miscarriage, congenital abnormalities, hypertension, large for gestational age babies, stillbirth, difficult labours and deliveries, and their babies have an increased risk of hypoglycaemia and admission to the neonatal unit. Women with gestational diabetes mellitus have a 50% risk of developing Type 2 diabetes (this could be soon after their pregnancy or up to 10 years later).
Optimising blood glucose control pre-pregnancy for those with pre-existing diabetes, and during pregnancy for all types of diabetes ,reduces the risk of adverse pregnancy outcomes. Healthier lifestyle interventions post-birth reduces the risks of developing Type 2 diabetes and improves long-term health consequences for those women with pre-existing diabetes.
The number of women who birthed in CM Health facilities and identified as having diabetes in pregnancy increased steadily from 3.1% (n=246) in 2005 to 8.6% (n=630) in 2015. The numbers have continued to increase, putting increasing pressure on current health care services. The Diabetes in Pregnancy Service is assessing the current structure of the service and considering recommendations for increasing resources or restructuring the service to be able to cope with demand. This may require management of lower-risk diabetes cases to be transferred to a general obstetrics clinic or to GPs in the community, with support from the tertiary Diabetes in Pregnancy Service.
VisionThe Diabetes in Pregnancy Service vision has been developed to align with the CM Health’s Healthy Together Strategic Plan 2015–2020 objective of “safe, quality healthcare services provided by professionals whom are well trained and knowledgeable in their areas of expertise”.
DR KARA OKESENE-GAFALead Clinician, Diabetes in
Pregnancy Service
AUTHOR
WOMEN’S HEALTH AND NEWBORN ANNUAL REPORT 2017-2018 73
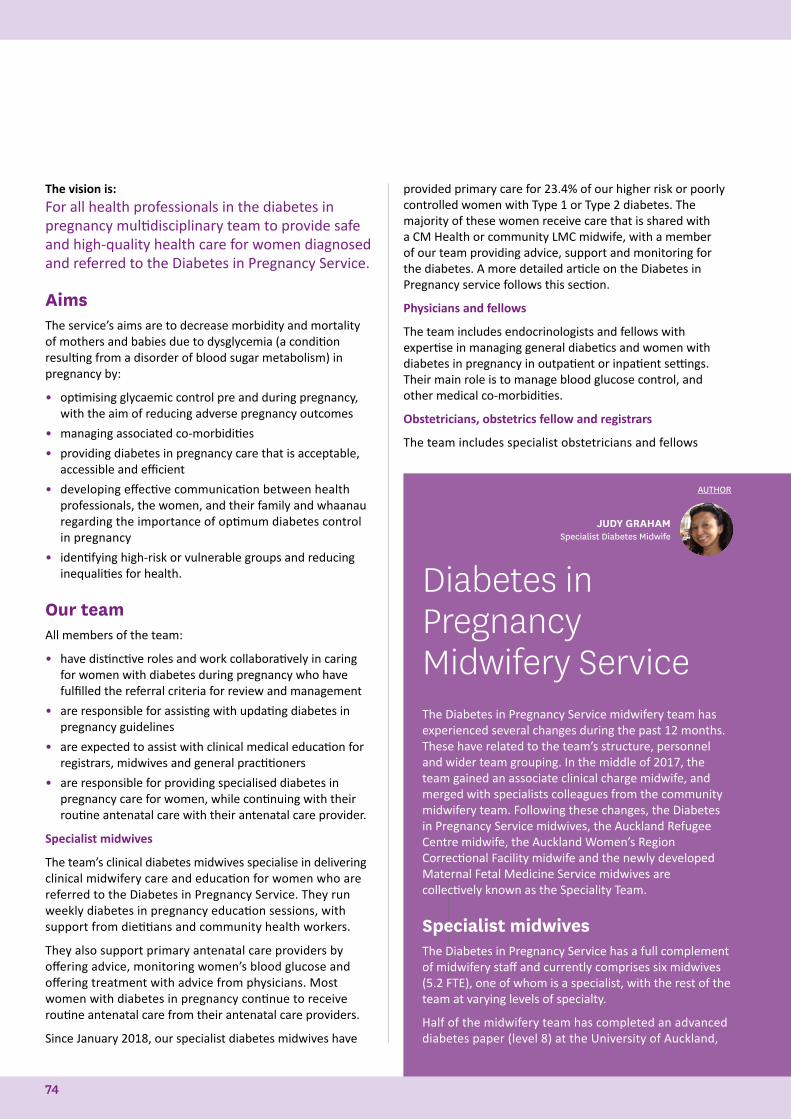
The vision is: For all health professionals in the diabetes in pregnancy multidisciplinary team to provide safe and high-quality health care for women diagnosed and referred to the Diabetes in Pregnancy Service.
AimsThe service’s aims are to decrease morbidity and mortality of mothers and babies due to dysglycemia (a condition resulting from a disorder of blood sugar metabolism) in pregnancy by:
• optimising glycaemic control pre and during pregnancy, with the aim of reducing adverse pregnancy outcomes
• managing associated co-morbidities
• providing diabetes in pregnancy care that is acceptable, accessible and efficient
• developing effective communication between health professionals, the women, and their family and whaanau regarding the importance of optimum diabetes control in pregnancy
• identifying high-risk or vulnerable groups and reducing inequalities for health.
Our teamAll members of the team:
• have distinctive roles and work collaboratively in caring for women with diabetes during pregnancy who have fulfilled the referral criteria for review and management
• are responsible for assisting with updating diabetes in pregnancy guidelines
• are expected to assist with clinical medical education for registrars, midwives and general practitioners
• are responsible for providing specialised diabetes in pregnancy care for women, while continuing with their routine antenatal care with their antenatal care provider.
Specialist midwives
The team’s clinical diabetes midwives specialise in delivering clinical midwifery care and education for women who are referred to the Diabetes in Pregnancy Service. They run weekly diabetes in pregnancy education sessions, with support from dietitians and community health workers.
They also support primary antenatal care providers by offering advice, monitoring women’s blood glucose and offering treatment with advice from physicians. Most women with diabetes in pregnancy continue to receive routine antenatal care from their antenatal care providers.
Since January 2018, our specialist diabetes midwives have
provided primary care for 23.4% of our higher risk or poorly controlled women with Type 1 or Type 2 diabetes. The majority of these women receive care that is shared with a CM Health or community LMC midwife, with a member of our team providing advice, support and monitoring for the diabetes. A more detailed article on the Diabetes in Pregnancy service follows this section.
Physicians and fellows
The team includes endocrinologists and fellows with expertise in managing general diabetics and women with diabetes in pregnancy in outpatient or inpatient settings. Their main role is to manage blood glucose control, and other medical co-morbidities.
Obstetricians, obstetrics fellow and registrars
The team includes specialist obstetricians and fellows
Diabetes in Pregnancy Midwifery ServiceThe Diabetes in Pregnancy Service midwifery team has experienced several changes during the past 12 months. These have related to the team’s structure, personnel and wider team grouping. In the middle of 2017, the team gained an associate clinical charge midwife, and merged with specialists colleagues from the community midwifery team. Following these changes, the Diabetes in Pregnancy Service midwives, the Auckland Refugee Centre midwife, the Auckland Women’s Region Correctional Facility midwife and the newly developed Maternal Fetal Medicine Service midwives are collectively known as the Speciality Team.
Specialist midwivesThe Diabetes in Pregnancy Service has a full complement of midwifery staff and currently comprises six midwives (5.2 FTE), one of whom is a specialist, with the rest of the team at varying levels of specialty.
Half of the midwifery team has completed an advanced diabetes paper (level 8) at the University of Auckland,
JUDY GRAHAMSpecialist Diabetes Midwife
AUTHOR
74
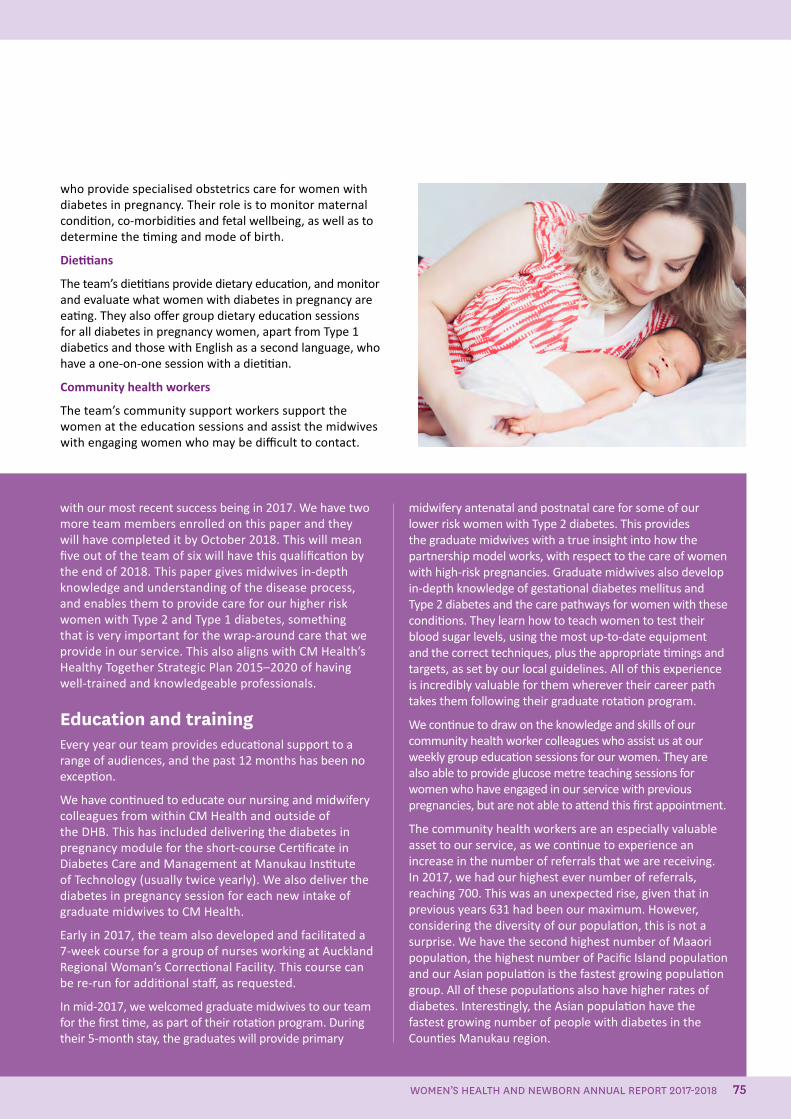
with our most recent success being in 2017. We have two more team members enrolled on this paper and they will have completed it by October 2018. This will mean five out of the team of six will have this qualification by the end of 2018. This paper gives midwives in-depth knowledge and understanding of the disease process, and enables them to provide care for our higher risk women with Type 2 and Type 1 diabetes, something that is very important for the wrap-around care that we provide in our service. This also aligns with CM Health’s Healthy Together Strategic Plan 2015–2020 of having well-trained and knowledgeable professionals.
Education and training Every year our team provides educational support to a range of audiences, and the past 12 months has been no exception.
We have continued to educate our nursing and midwifery colleagues from within CM Health and outside of the DHB. This has included delivering the diabetes in pregnancy module for the short-course Certificate in Diabetes Care and Management at Manukau Institute of Technology (usually twice yearly). We also deliver the diabetes in pregnancy session for each new intake of graduate midwives to CM Health.
Early in 2017, the team also developed and facilitated a 7-week course for a group of nurses working at Auckland Regional Woman’s Correctional Facility. This course can be re-run for additional staff, as requested.
In mid-2017, we welcomed graduate midwives to our team for the first time, as part of their rotation program. During their 5-month stay, the graduates will provide primary
who provide specialised obstetrics care for women with diabetes in pregnancy. Their role is to monitor maternal condition, co-morbidities and fetal wellbeing, as well as to determine the timing and mode of birth.
Dietitians
The team’s dietitians provide dietary education, and monitor and evaluate what women with diabetes in pregnancy are eating. They also offer group dietary education sessions for all diabetes in pregnancy women, apart from Type 1 diabetics and those with English as a second language, who have a one-on-one session with a dietitian.
Community health workers
The team’s community support workers support the women at the education sessions and assist the midwives with engaging women who may be difficult to contact.
midwifery antenatal and postnatal care for some of our lower risk women with Type 2 diabetes. This provides the graduate midwives with a true insight into how the partnership model works, with respect to the care of women with high-risk pregnancies. Graduate midwives also develop in-depth knowledge of gestational diabetes mellitus and Type 2 diabetes and the care pathways for women with these conditions. They learn how to teach women to test their blood sugar levels, using the most up-to-date equipment and the correct techniques, plus the appropriate timings and targets, as set by our local guidelines. All of this experience is incredibly valuable for them wherever their career path takes them following their graduate rotation program.
We continue to draw on the knowledge and skills of our community health worker colleagues who assist us at our weekly group education sessions for our women. They are also able to provide glucose metre teaching sessions for women who have engaged in our service with previous pregnancies, but are not able to attend this first appointment.
The community health workers are an especially valuable asset to our service, as we continue to experience an increase in the number of referrals that we are receiving. In 2017, we had our highest ever number of referrals, reaching 700. This was an unexpected rise, given that in previous years 631 had been our maximum. However, considering the diversity of our population, this is not a surprise. We have the second highest number of Maaori population, the highest number of Pacific Island population and our Asian population is the fastest growing population group. All of these populations also have higher rates of diabetes. Interestingly, the Asian population have the fastest growing number of people with diabetes in the Counties Manukau region.
WOMEN’S HEALTH AND NEWBORN ANNUAL REPORT 2017-2018 75
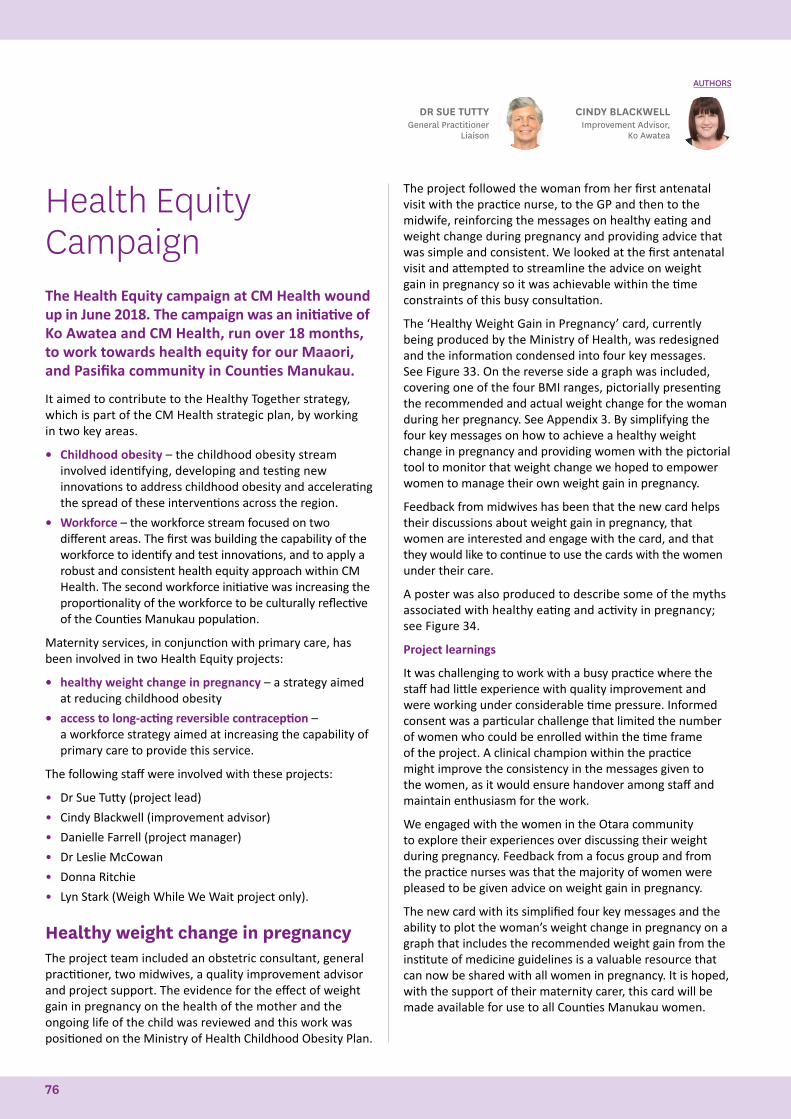
Health Equity CampaignThe Health Equity campaign at CM Health wound up in June 2018. The campaign was an initiative of Ko Awatea and CM Health, run over 18 months, to work towards health equity for our Maaori, and Pasifika community in Counties Manukau.
It aimed to contribute to the Healthy Together strategy, which is part of the CM Health strategic plan, by working in two key areas.
• Childhood obesity – the childhood obesity stream involved identifying, developing and testing new innovations to address childhood obesity and accelerating the spread of these interventions across the region.
• Workforce – the workforce stream focused on two different areas. The first was building the capability of the workforce to identify and test innovations, and to apply a robust and consistent health equity approach within CM Health. The second workforce initiative was increasing the proportionality of the workforce to be culturally reflective of the Counties Manukau population.
Maternity services, in conjunction with primary care, has been involved in two Health Equity projects:
• healthy weight change in pregnancy – a strategy aimed at reducing childhood obesity
• access to long-acting reversible contraception – a workforce strategy aimed at increasing the capability of primary care to provide this service.
The following staff were involved with these projects:
• Dr Sue Tutty (project lead)
• Cindy Blackwell (improvement advisor)
• Danielle Farrell (project manager)
• Dr Leslie McCowan
• Donna Ritchie
• Lyn Stark (Weigh While We Wait project only).
Healthy weight change in pregnancyThe project team included an obstetric consultant, general practitioner, two midwives, a quality improvement advisor and project support. The evidence for the effect of weight gain in pregnancy on the health of the mother and the ongoing life of the child was reviewed and this work was positioned on the Ministry of Health Childhood Obesity Plan.
CINDY BLACKWELLImprovement Advisor,
Ko Awatea
AUTHORS
DR SUE TUTTYGeneral Practitioner
Liaison
The project followed the woman from her first antenatal visit with the practice nurse, to the GP and then to the midwife, reinforcing the messages on healthy eating and weight change during pregnancy and providing advice that was simple and consistent. We looked at the first antenatal visit and attempted to streamline the advice on weight gain in pregnancy so it was achievable within the time constraints of this busy consultation.
The ‘Healthy Weight Gain in Pregnancy’ card, currently being produced by the Ministry of Health, was redesigned and the information condensed into four key messages. See Figure 33. On the reverse side a graph was included, covering one of the four BMI ranges, pictorially presenting the recommended and actual weight change for the woman during her pregnancy. See Appendix 3. By simplifying the four key messages on how to achieve a healthy weight change in pregnancy and providing women with the pictorial tool to monitor that weight change we hoped to empower women to manage their own weight gain in pregnancy.
Feedback from midwives has been that the new card helps their discussions about weight gain in pregnancy, that women are interested and engage with the card, and that they would like to continue to use the cards with the women under their care.
A poster was also produced to describe some of the myths associated with healthy eating and activity in pregnancy; see Figure 34.
Project learnings
It was challenging to work with a busy practice where the staff had little experience with quality improvement and were working under considerable time pressure. Informed consent was a particular challenge that limited the number of women who could be enrolled within the time frame of the project. A clinical champion within the practice might improve the consistency in the messages given to the women, as it would ensure handover among staff and maintain enthusiasm for the work.
We engaged with the women in the Otara community to explore their experiences over discussing their weight during pregnancy. Feedback from a focus group and from the practice nurses was that the majority of women were pleased to be given advice on weight gain in pregnancy.
The new card with its simplified four key messages and the ability to plot the woman’s weight change in pregnancy on a graph that includes the recommended weight gain from the institute of medicine guidelines is a valuable resource that can now be shared with all women in pregnancy. It is hoped, with the support of their maternity carer, this card will be made available for use to all Counties Manukau women.
76
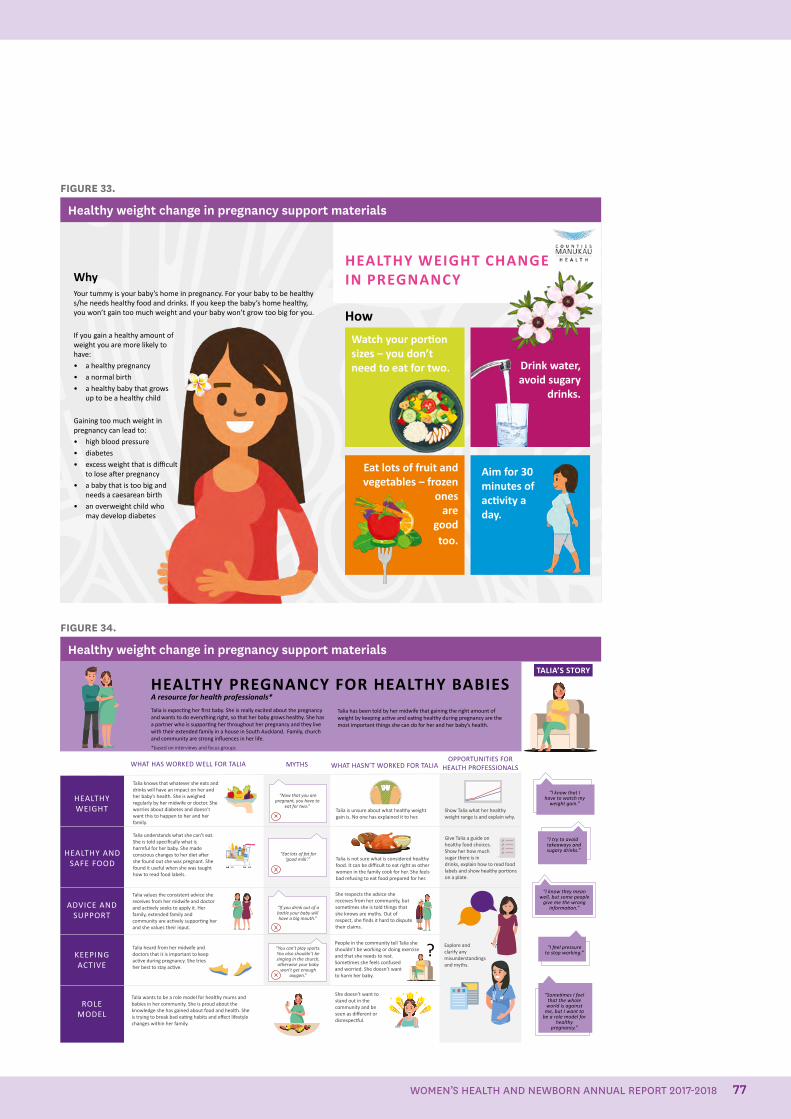
Aim for 30 minutes of activity a day.
Drink water, avoid sugary
drinks.
Watch your portion sizes – you don’t need to eat for two.
Eat lots of fruit and vegetables – frozen
ones are
good too.
How
WhyYour tummy is your baby’s home in pregnancy. For your baby to be healthy s/he needs healthy food and drinks. If you keep the baby’s home healthy, you won’t gain too much weight and your baby won’t grow too big for you.
If you gain a healthy amount of weight you are more likely to have:• a healthy pregnancy• a normal birth• a healthy baby that grows
up to be a healthy child
Gaining too much weight in pregnancy can lead to:• high blood pressure• diabetes• excess weight that is difficult
to lose after pregnancy• a baby that is too big and
needs a caesarean birth• an overweight child who
may develop diabetes
HEALTHY WEIGHT CHANGE IN PREGNANCY
FIGURE 33.
Healthy weight change in pregnancy support materials
FIGURE 34.
Healthy weight change in pregnancy support materials
Talia knows that whatever she eats and drinks will have an impact on her and her baby’s health. She is weighed regularly by her midwife or doctor. She worries about diabetes and doesn't want this to happen to her and her family.
“Now that you are pregnant, you have to
eat for two.”
Talia understands what she can’t eat. She is told specifically what is harmful for her baby. She made conscious changes to her diet after she found out she was pregnant. She found it useful when she was taught how to read food labels.
Talia is not sure what is considered healthy food. It can be difficult to eat right as other women in the family cook for her. She feels bad refusing to eat food prepared for her.
Give Talia a guide on healthy food choices. Show her how much sugar there is in drinks, explain how to read food labels and show healthy portions on a plate.
Talia values the consistent advice she receives from her midwife and doctor and actively seeks to apply it. Her family, extended family and community are actively supporting her and she values their input.
She respects the advice she receives from her community, but sometimes she is told things that she knows are myths. Out of respect, she finds it hard to dispute their claims.
Talia heard from her midwife and doctors that it is important to keep active during pregnancy. She tries her best to stay active.
People in the community tell Talia she shouldn’t be working or doing exercise and that she needs to rest. Sometimes she feels confused and worried. She doesn’t want to harm her baby.
“Eat lots of fat for ‘good milk’.”
“If you drink out of a bottle your baby will have a big mouth.”
Talia wants to be a role model for healthy mums and babies in her community. She is proud about the knowledge she has gained about food and health. She is trying to break bad eating habits and effect lifestyle changes within her family.
She doesn’t want to stand out in the community and be seen as different or disrespectful.
“You can’t play sports. You also shouldn’t be singing in the church, otherwise your baby
won’t get enough oxygen.”
Talia has been told by her midwife that gaining the right amount of weight by keeping active and eating healthy during pregnancy are the most important things she can do for her and her baby’s health.
Talia is expecting her first baby. She is really excited about the pregnancy and wants to do everything right, so that her baby grows healthy. She has a partner who is supporting her throughout her pregnancy and they live with their extended family in a house in South Auckland. Family, church and community are strong influences in her life.
HEALTHY PREGNANCY FOR HEALTHY BABIESA resource for health professionals*
WHAT HAS WORKED WELL FOR TALIA WHAT HASN’T WORKED FOR TALIAOPPORTUNITIES FOR
HEALTH PROFESSIONALS
HEALTHY WEIGHT
HEALTHY AND SAFE FOOD
ADVICE AND SUPPORT
KEEPING ACTIVE
ROLE MODEL
Talia is unsure about what healthy weight gain is. No one has explained it to her.
Show Talia what her healthy weight range is and explain why.
?
TALIA’S STORY
MYTHS
“I know that I have to watch my
weight gain.”
“I know they mean well, but some people
give me the wrong information.”
“I try to avoid takeaways and sugary drinks.”
“I feel pressure to stop working.”
“Sometimes I feel that the whole
world is against me, but I want to
be a role model for healthy
pregnancy.”
Explore and clarify any misunderstandings and myths.
*based on interviews and focus groups
WOMEN’S HEALTH AND NEWBORN ANNUAL REPORT 2017-2018 77
Access to Long-Acting Reversible Contraception A similar team to the healthy weight gain in pregnancy project (refer Health Equity Campaign, page 76) was involved in this project, again including an obstetric consultant, general practitioner, midwife, a quality improvement advisor and project support.
The project’s aim to increase the uptake of long-acting reversible contraception in the community proved difficult to achieve, with little increase in the number of insertions. However, we now have a better understanding of the barriers to the use of contraception, and to the use of long-acting reversible contraception specifically.
The first step was to provide funding for long-acting reversible contraception insertions in Otara. Because of initial uncertainty as to the demand this would unleash, this was offered to only three practices, but it was later extended to other practices in Otara.
The concept of a contraception clinic was tested, with data collected on the equipment needed, the costings, timings and acceptability of the clinic for the patients. The clinic closed after 6 months of operation, due to the high number of women who did not attend and the fact that it was not financially viable for the company running it. However, the data from this clinic has informed a business plan for a locality based contraception clinic that could have a major role as a training clinic.
Women’s views on contraception were sought by individually interviewing women on the postnatal ward, using an online survey for youth, and conducting a focus group. The survey of predominantly Maaori and Pacific Islander young people found that 32% were sexually active without using contraception. Forty-six per cent of this group were aware of Jadelles and only 36% aware of IUDs. The GP was a popular source of information, as were peers. However, they recognised that the information from their peers was not always reliable. Cost, embarrassment and transport were the major barriers to accessing contraception.
Once funding was secure, a number of other strategies were tried within the practice to increase the uptake of long-acting reversible contraception in the community.
These included:
• installing a contraception display in the GP practice
• having alerts on the practice management system for opportunistic contraception conversations
• offering Depo Provera patients long-acting reversible
contraception as an alternative to their Depo Provera
• having conversations about contraception options after negative pregnancy tests
• sending a text and letter out to women enrolled in the practice to invite them to a well-woman clinic or to discuss contraception needs and options.
An advertisement was produced to run on Radio Mai FM over a 10-day period. It was a 30-second sound-bite conversation between two women, to encourage them to consider contraception and particularly a long-acting reversible contraception, and was funded by the Auckland Zonta club. Family planning and our medical centres were asked to report if anyone presented for a long-acting reversible contraception, because of having heard the advertisement. There were no reports of insertions following the advertisement. However, we know, particularly from our focus group of young women, that there is very little knowledge of long-acting reversible contraception in the community. This lack of community awareness is still felt to be a major barrier to its uptake.
Multiple opportunities were taken to provide education to health professionals on the benefits of long-acting reversible contraception, and to encourage them to have these discussions with patients and recommend long-acting reversible contraception if appropriate.
An infographic was developed as an education tool for practice staff and to help them to counsel women about long-acting reversible contraception. Posters for the surgery were printed to encourage women to consider their family planning needs and particularly to consider using a long-acting reversible contraception. The contraception pamphlet was updated to include typical user failure rates, showing the improved reliability of long-acting reversible contraception over other forms of contraception.
Project learnings
The project showed that providing funded services alone is not sufficient, but is the starting point. Other major learnings were:
• consistent messaging needs to start with a consistent service
• health literacy is as important as the provision of the service
• messages may need to be given several times before women are ready to make a behavioural change.
The major barriers to women accessing long-acting reversible contraception were reported as cost, embarrassment and transport.
78
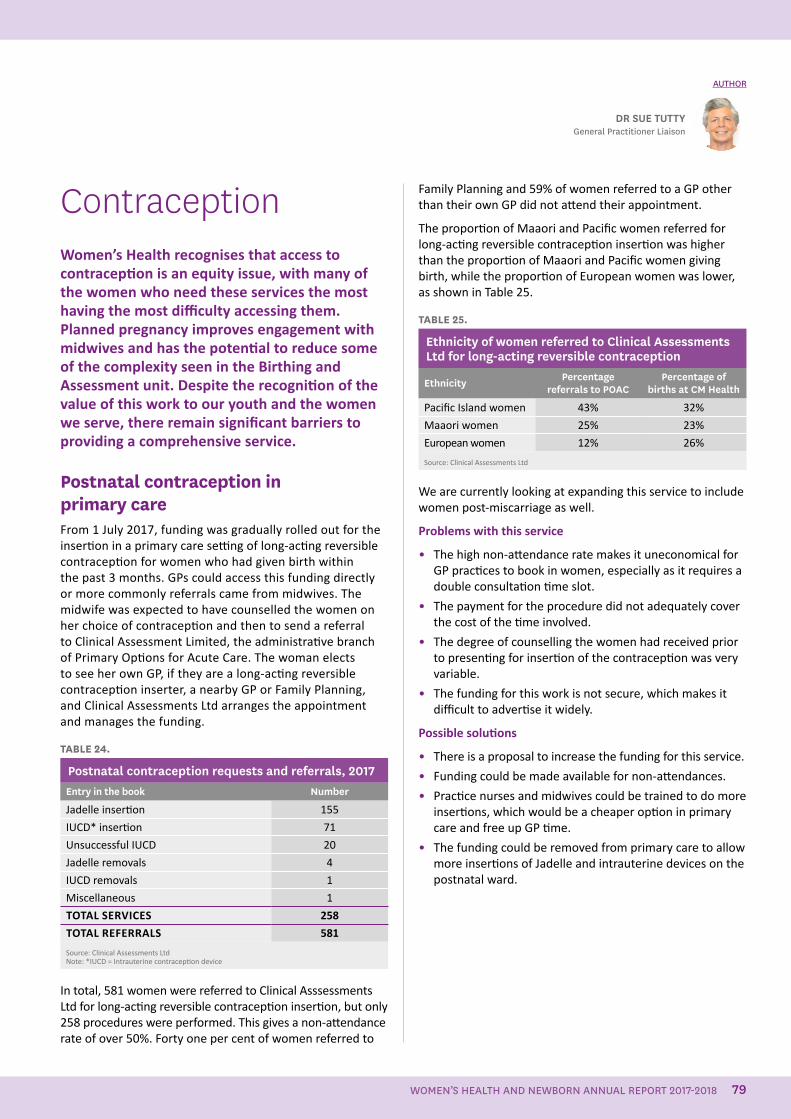
ContraceptionWomen’s Health recognises that access to contraception is an equity issue, with many of the women who need these services the most having the most difficulty accessing them. Planned pregnancy improves engagement with midwives and has the potential to reduce some of the complexity seen in the Birthing and Assessment unit. Despite the recognition of the value of this work to our youth and the women we serve, there remain significant barriers to providing a comprehensive service.
Postnatal contraception in primary careFrom 1 July 2017, funding was gradually rolled out for the insertion in a primary care setting of long-acting reversible contraception for women who had given birth within the past 3 months. GPs could access this funding directly or more commonly referrals came from midwives. The midwife was expected to have counselled the women on her choice of contraception and then to send a referral to Clinical Assessment Limited, the administrative branch of Primary Options for Acute Care. The woman elects to see her own GP, if they are a long-acting reversible contraception inserter, a nearby GP or Family Planning, and Clinical Assessments Ltd arranges the appointment and manages the funding.
TABLE 24.
Postnatal contraception requests and referrals, 2017Entry in the book Number
Jadelle insertion 155
IUCD* insertion 71
Unsuccessful IUCD 20
Jadelle removals 4
IUCD removals 1
Miscellaneous 1
TOTAL SERVICES 258
TOTAL REFERRALS 581
Source: Clinical Assessments Ltd Note: *IUCD = Intrauterine contraception device
In total, 581 women were referred to Clinical Asssessments Ltd for long-acting reversible contraception insertion, but only 258 procedures were performed. This gives a non-attendance rate of over 50%. Forty one per cent of women referred to
Family Planning and 59% of women referred to a GP other than their own GP did not attend their appointment.
The proportion of Maaori and Pacific women referred for long-acting reversible contraception insertion was higher than the proportion of Maaori and Pacific women giving birth, while the proportion of European women was lower, as shown in Table 25.
TABLE 25.
Ethnicity of women referred to Clinical Assessments Ltd for long-acting reversible contraception
Ethnicity Percentage referrals to POAC
Percentage of births at CM Health
Pacific Island women 43% 32%
Maaori women 25% 23%
European women 12% 26%
Source: Clinical Assessments Ltd
We are currently looking at expanding this service to include women post-miscarriage as well.
Problems with this service
• The high non-attendance rate makes it uneconomical for GP practices to book in women, especially as it requires a double consultation time slot.
• The payment for the procedure did not adequately cover the cost of the time involved.
• The degree of counselling the women had received prior to presenting for insertion of the contraception was very variable.
• The funding for this work is not secure, which makes it difficult to advertise it widely.
Possible solutions
• There is a proposal to increase the funding for this service.
• Funding could be made available for non-attendances.
• Practice nurses and midwives could be trained to do more insertions, which would be a cheaper option in primary care and free up GP time.
• The funding could be removed from primary care to allow more insertions of Jadelle and intrauterine devices on the postnatal ward.
DR SUE TUTTYGeneral Practitioner Liaison
AUTHOR
WOMEN’S HEALTH AND NEWBORN ANNUAL REPORT 2017-2018 79
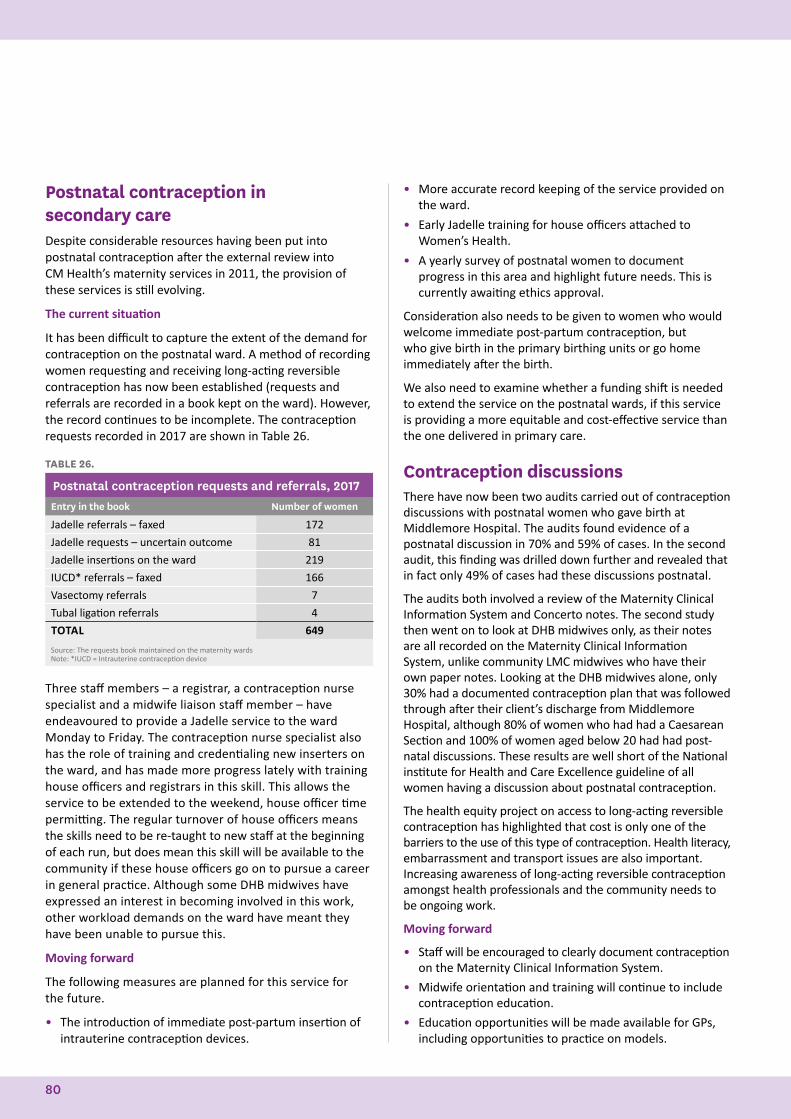
Postnatal contraception in secondary careDespite considerable resources having been put into postnatal contraception after the external review into CM Health’s maternity services in 2011, the provision of these services is still evolving.
The current situation
It has been difficult to capture the extent of the demand for contraception on the postnatal ward. A method of recording women requesting and receiving long-acting reversible contraception has now been established (requests and referrals are recorded in a book kept on the ward). However, the record continues to be incomplete. The contraception requests recorded in 2017 are shown in Table 26.
TABLE 26.
Postnatal contraception requests and referrals, 2017Entry in the book Number of women
Jadelle referrals – faxed 172
Jadelle requests – uncertain outcome 81
Jadelle insertions on the ward 219
IUCD* referrals – faxed 166
Vasectomy referrals 7
Tubal ligation referrals 4
TOTAL 649
Source: The requests book maintained on the maternity wardsNote: *IUCD = Intrauterine contraception device
Three staff members – a registrar, a contraception nurse specialist and a midwife liaison staff member – have endeavoured to provide a Jadelle service to the ward Monday to Friday. The contraception nurse specialist also has the role of training and credentialing new inserters on the ward, and has made more progress lately with training house officers and registrars in this skill. This allows the service to be extended to the weekend, house officer time permitting. The regular turnover of house officers means the skills need to be re-taught to new staff at the beginning of each run, but does mean this skill will be available to the community if these house officers go on to pursue a career in general practice. Although some DHB midwives have expressed an interest in becoming involved in this work, other workload demands on the ward have meant they have been unable to pursue this.
Moving forward
The following measures are planned for this service for the future.
• The introduction of immediate post-partum insertion of intrauterine contraception devices.
• More accurate record keeping of the service provided on the ward.
• Early Jadelle training for house officers attached to Women’s Health.
• A yearly survey of postnatal women to document progress in this area and highlight future needs. This is currently awaiting ethics approval.
Consideration also needs to be given to women who would welcome immediate post-partum contraception, but who give birth in the primary birthing units or go home immediately after the birth.
We also need to examine whether a funding shift is needed to extend the service on the postnatal wards, if this service is providing a more equitable and cost-effective service than the one delivered in primary care.
Contraception discussions There have now been two audits carried out of contraception discussions with postnatal women who gave birth at Middlemore Hospital. The audits found evidence of a postnatal discussion in 70% and 59% of cases. In the second audit, this finding was drilled down further and revealed that in fact only 49% of cases had these discussions postnatal.
The audits both involved a review of the Maternity Clinical Information System and Concerto notes. The second study then went on to look at DHB midwives only, as their notes are all recorded on the Maternity Clinical Information System, unlike community LMC midwives who have their own paper notes. Looking at the DHB midwives alone, only 30% had a documented contraception plan that was followed through after their client’s discharge from Middlemore Hospital, although 80% of women who had had a Caesarean Section and 100% of women aged below 20 had had post-natal discussions. These results are well short of the National institute for Health and Care Excellence guideline of all women having a discussion about postnatal contraception.
The health equity project on access to long-acting reversible contraception has highlighted that cost is only one of the barriers to the use of this type of contraception. Health literacy, embarrassment and transport issues are also important. Increasing awareness of long-acting reversible contraception amongst health professionals and the community needs to be ongoing work.
Moving forward
• Staff will be encouraged to clearly document contraception on the Maternity Clinical Information System.
• Midwife orientation and training will continue to include contraception education.
• Education opportunities will be made available for GPs, including opportunities to practice on models.
80
• CM Health is looking at establishing a contraception clinic in a local hub at Mangere, which could also become a training clinic. This clinic will be staffed by an experienced long-acting reversible contraception inserter and allow midwives, nurses and GPs to attend and become credentialed. The procedure for credentialing will be guided by advice from the Ministry of Health, as will the development of a training package.
• The contraception pamphlet will continue to be included in the antenatal and postnatal packs. Primary care will be asked to discuss contraception at the first antenatal visit and at the visit 6 weeks after the birth.
National initiatives Increased funding for the insertion of long-acting reversible contraception for women who live in quintile 5 or have community services cards is welcomed and will meet the needs of many of our women.
National guidelines and credentialing will provide direction and consistency in the provision of this work.
VasectomyThis service continues to be delivered by a private provider under contract to the DHB. However, due to funding constraints, the volume has been reduced to 10 per month, with priority being given to partners of postnatal women, partners of women seeking a termination for an unplanned pregnancy and partners of women requesting a tubal ligation.
Conclusion Contraception is an important issue in South Auckland and can make a significant difference to the health and welfare of our women, their babies and their whaanau.
A one-team and whole-of-system approach is required, with primary and secondary care taking collective responsibility to provide contraception services wherever possible.
Access to contraception is vital to providing an equitable contraception service. This needs to be considered when setting credentialing requirements, along with an inserter’s previous experience, self-reported confidence and any numerical standards that are set.
WOMEN’S HEALTH AND NEWBORN ANNUAL REPORT 2017-2018 81
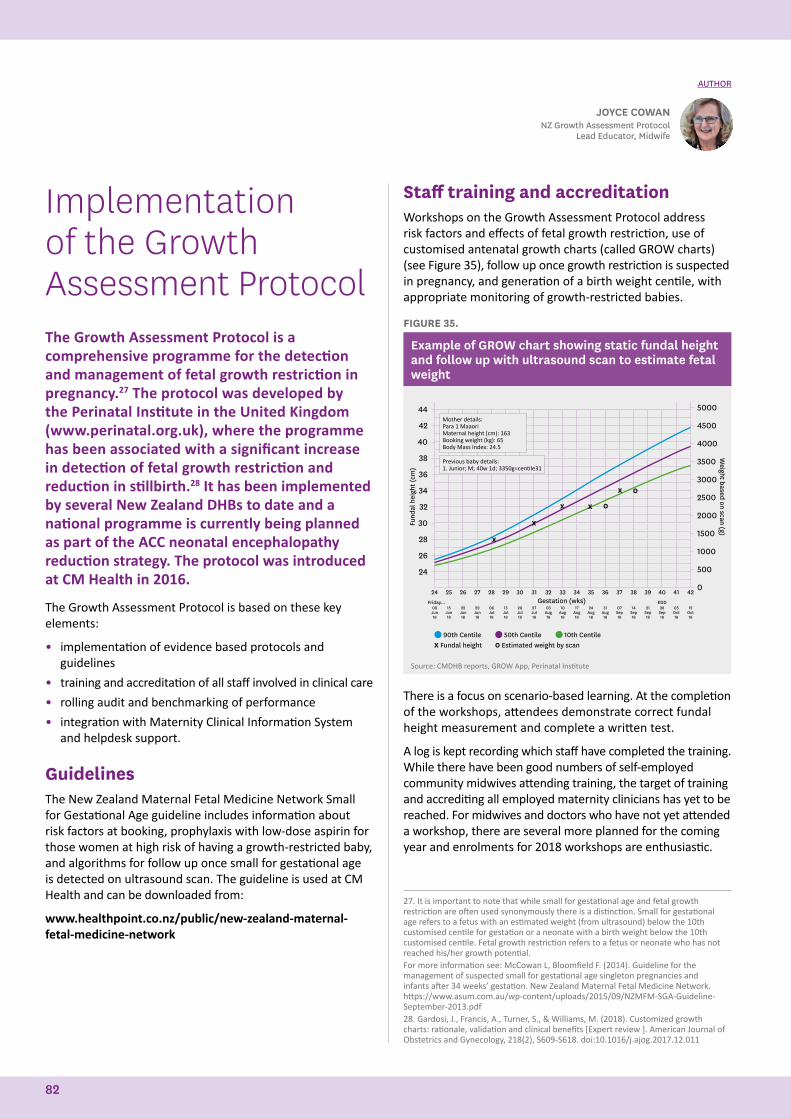
Implementation of the Growth Assessment ProtocolThe Growth Assessment Protocol is a comprehensive programme for the detection and management of fetal growth restriction in pregnancy.27 The protocol was developed by the Perinatal Institute in the United Kingdom (www.perinatal.org.uk), where the programme has been associated with a significant increase in detection of fetal growth restriction and reduction in stillbirth.28 It has been implemented by several New Zealand DHBs to date and a national programme is currently being planned as part of the ACC neonatal encephalopathy reduction strategy. The protocol was introduced at CM Health in 2016.
The Growth Assessment Protocol is based on these key elements:
• implementation of evidence based protocols and guidelines
• training and accreditation of all staff involved in clinical care
• rolling audit and benchmarking of performance
• integration with Maternity Clinical Information System and helpdesk support.
Guidelines The New Zealand Maternal Fetal Medicine Network Small for Gestational Age guideline includes information about risk factors at booking, prophylaxis with low-dose aspirin for those women at high risk of having a growth-restricted baby, and algorithms for follow up once small for gestational age is detected on ultrasound scan. The guideline is used at CM Health and can be downloaded from:
www.healthpoint.co.nz/public/new-zealand-maternal-fetal-medicine-network
Staff training and accreditationWorkshops on the Growth Assessment Protocol address risk factors and effects of fetal growth restriction, use of customised antenatal growth charts (called GROW charts) (see Figure 35), follow up once growth restriction is suspected in pregnancy, and generation of a birth weight centile, with appropriate monitoring of growth-restricted babies.
FIGURE 35.
Example of GROW chart showing static fundal height and follow up with ultrasound scan to estimate fetal weight
44
42
40
38
36
34
32
30
28
26
24
90th Centile 50th Centile 10th Centile
5000
4500
4000
3500
3000
2500
2000
1500
1000
500
0
X Fundal height O Estimated weight by scan
Fund
al h
eigh
t (cm
)
Weight based on scan (g)
Gestation (wks)
Mother details: Para 1 MaaoriMaternal height (cm): 163Booking weight (kg): 65Body Mass Index: 24.5
Previous baby details: 1. Junior; M; 40w 1d; 3350g=centile31
24 25 26 27 28 29 30 31 32 33 34 35 36 37 38 39 40 41 42Friday... EDD
08 Jun 18
15 Jun18
22Jun18
29Jun18
06Jul18
13Jul18
20Jul18
27Jul18
03Aug18
10Aug18
17Aug18
24Aug18
31Aug18
07Sep18
14Sep18
21Sep18
28Sep18
05Oct18
12Oct18
Source: CMDHB reports, GROW App, Perinatal Institute
There is a focus on scenario-based learning. At the completion of the workshops, attendees demonstrate correct fundal height measurement and complete a written test.
A log is kept recording which staff have completed the training. While there have been good numbers of self-employed community midwives attending training, the target of training and accrediting all employed maternity clinicians has yet to be reached. For midwives and doctors who have not yet attended a workshop, there are several more planned for the coming year and enrolments for 2018 workshops are enthusiastic.
JOYCE COWANNZ Growth Assessment Protocol
Lead Educator, Midwife
AUTHOR
27. It is important to note that while small for gestational age and fetal growth restriction are often used synonymously there is a distinction. Small for gestational age refers to a fetus with an estimated weight (from ultrasound) below the 10th customised centile for gestation or a neonate with a birth weight below the 10th customised centile. Fetal growth restriction refers to a fetus or neonate who has not reached his/her growth potential.For more information see: McCowan L, Bloomfield F. (2014). Guideline for the management of suspected small for gestational age singleton pregnancies and infants after 34 weeks’ gestation. New Zealand Maternal Fetal Medicine Network. https://www.asum.com.au/wp-content/uploads/2015/09/NZMFM-SGA-Guideline-September-2013.pdf28. Gardosi, J., Francis, A., Turner, S., & Williams, M. (2018). Customized growth charts: rationale, validation and clinical benefits [Expert review ]. American Journal of Obstetrics and Gynecology, 218(2), S609-S618. doi:10.1016/j.ajog.2017.12.011
82
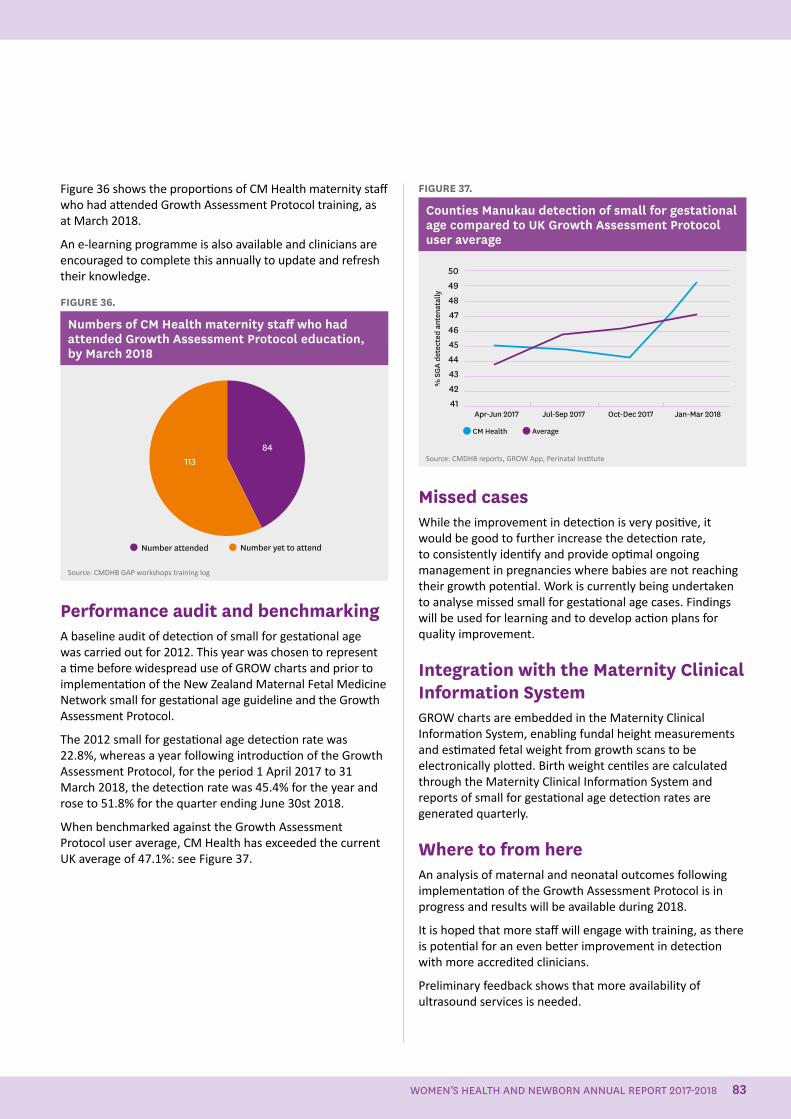
Figure 36 shows the proportions of CM Health maternity staff who had attended Growth Assessment Protocol training, as at March 2018.
An e-learning programme is also available and clinicians are encouraged to complete this annually to update and refresh their knowledge.
FIGURE 36.
Numbers of CM Health maternity staff who had attended Growth Assessment Protocol education, by March 2018
Number attended Number yet to attend
11384
Source: CMDHB GAP workshops training log
Performance audit and benchmarkingA baseline audit of detection of small for gestational age was carried out for 2012. This year was chosen to represent a time before widespread use of GROW charts and prior to implementation of the New Zealand Maternal Fetal Medicine Network small for gestational age guideline and the Growth Assessment Protocol.
The 2012 small for gestational age detection rate was 22.8%, whereas a year following introduction of the Growth Assessment Protocol, for the period 1 April 2017 to 31 March 2018, the detection rate was 45.4% for the year and rose to 51.8% for the quarter ending June 30st 2018.
When benchmarked against the Growth Assessment Protocol user average, CM Health has exceeded the current UK average of 47.1%: see Figure 37.
FIGURE 37.
Counties Manukau detection of small for gestational age compared to UK Growth Assessment Protocol user average
50494847464544434241
Apr-Jun 2017 Jul-Sep 2017 Oct-Dec 2017 Jan-Mar 2018
CM Health Average%
SG
A de
tect
ed a
nten
atal
ly
Source: CMDHB reports, GROW App, Perinatal Institute
Missed casesWhile the improvement in detection is very positive, it would be good to further increase the detection rate, to consistently identify and provide optimal ongoing management in pregnancies where babies are not reaching their growth potential. Work is currently being undertaken to analyse missed small for gestational age cases. Findings will be used for learning and to develop action plans for quality improvement.
Integration with the Maternity Clinical Information SystemGROW charts are embedded in the Maternity Clinical Information System, enabling fundal height measurements and estimated fetal weight from growth scans to be electronically plotted. Birth weight centiles are calculated through the Maternity Clinical Information System and reports of small for gestational age detection rates are generated quarterly.
Where to from hereAn analysis of maternal and neonatal outcomes following implementation of the Growth Assessment Protocol is in progress and results will be available during 2018.
It is hoped that more staff will engage with training, as there is potential for an even better improvement in detection with more accredited clinicians.
Preliminary feedback shows that more availability of ultrasound services is needed.
WOMEN’S HEALTH AND NEWBORN ANNUAL REPORT 2017-2018 83
People who work in the maternity care system are provided with a safe and respectful environment in which they can learn and grow together
84
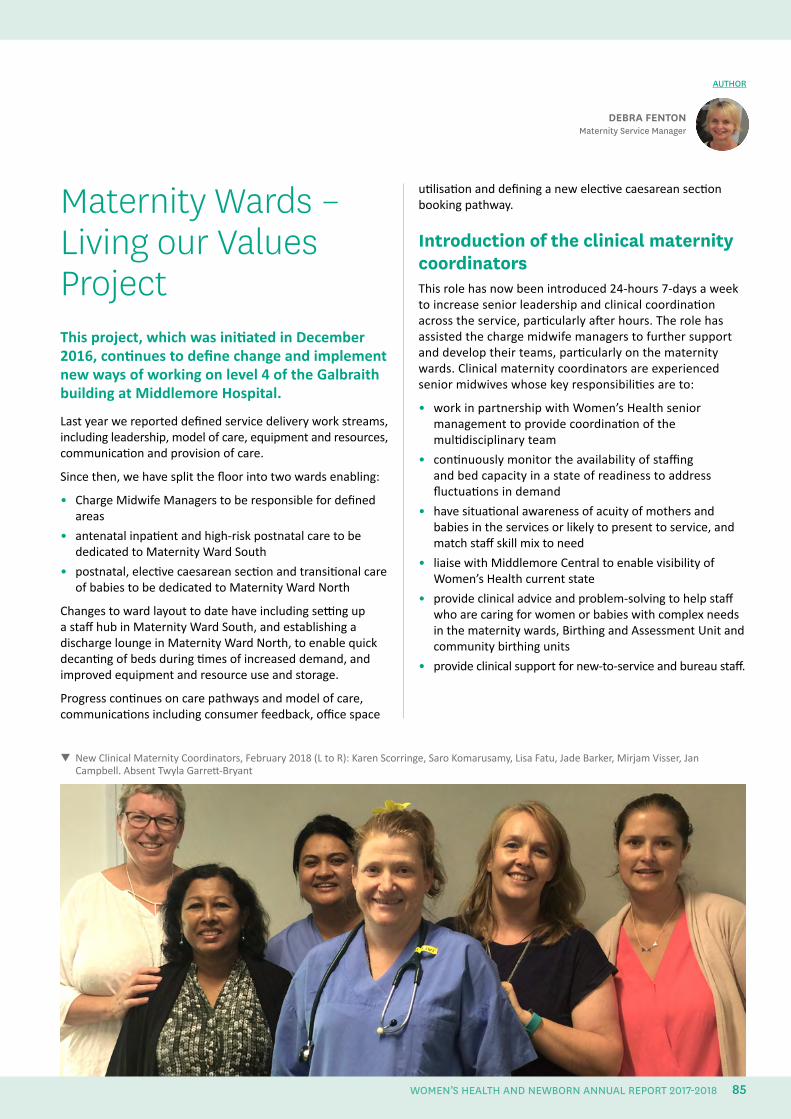
Maternity Wards – Living our Values ProjectThis project, which was initiated in December 2016, continues to define change and implement new ways of working on level 4 of the Galbraith building at Middlemore Hospital.
Last year we reported defined service delivery work streams, including leadership, model of care, equipment and resources, communication and provision of care.
Since then, we have split the floor into two wards enabling:
• Charge Midwife Managers to be responsible for defined areas
• antenatal inpatient and high-risk postnatal care to be dedicated to Maternity Ward South
• postnatal, elective caesarean section and transitional care of babies to be dedicated to Maternity Ward North
Changes to ward layout to date have including setting up a staff hub in Maternity Ward South, and establishing a discharge lounge in Maternity Ward North, to enable quick decanting of beds during times of increased demand, and improved equipment and resource use and storage.
Progress continues on care pathways and model of care, communications including consumer feedback, office space
utilisation and defining a new elective caesarean section booking pathway.
Introduction of the clinical maternity coordinatorsThis role has now been introduced 24-hours 7-days a week to increase senior leadership and clinical coordination across the service, particularly after hours. The role has assisted the charge midwife managers to further support and develop their teams, particularly on the maternity wards. Clinical maternity coordinators are experienced senior midwives whose key responsibilities are to:
• work in partnership with Women’s Health senior management to provide coordination of the multidisciplinary team
• continuously monitor the availability of staffing and bed capacity in a state of readiness to address fluctuations in demand
• have situational awareness of acuity of mothers and babies in the services or likely to present to service, and match staff skill mix to need
• liaise with Middlemore Central to enable visibility of Women’s Health current state
• provide clinical advice and problem-solving to help staff who are caring for women or babies with complex needs in the maternity wards, Birthing and Assessment Unit and community birthing units
• provide clinical support for new-to-service and bureau staff.
DEBRA FENTONMaternity Service Manager
AUTHOR
New Clinical Maternity Coordinators, February 2018 (L to R): Karen Scorringe, Saro Komarusamy, Lisa Fatu, Jade Barker, Mirjam Visser, Jan Campbell. Absent Twyla Garrett-Bryant
WOMEN’S HEALTH AND NEWBORN ANNUAL REPORT 2017-2018 85
Birthing and Assessment Unit’s Improvement ProjectThe Birthing and Assessment Unit’s improvement project kicked off in December 2017, with senior management acting as the sponsors and steering group, and representatives from each health professional group and the Midwifery Employee Representation & Advisory Service (MERAS).
The aim of the project is to improve processes and find efficiencies to reduce workload for staff, and deliver more timely care to women requiring secondary maternity services.
Supported by the Ko Awatea Improvement Advisors, an improvement methodology has been applied to help the project team define current work flow, highlight gaps in care delivery and identify opportunities for improvement. Six workshops have been held to date with themes identified around model of care, equipment, communication, and people, roles and responsibilities.
We are now progressing to look at individualised work streams, and are defining new pathways to test and implement in the work place. Work streams include the induction of labour pathway, triaging of women as they present to the unit, communication between health professionals, equipment and environment, acute medical model and day assessment activity, and the model of care, including the roles and responsibilities of the various health professional types working in the Birthing and Assessment Unit.
We hope to demonstrate change through measures such as the waiting time for women for assessment, staff retention, appropriate induction indications and clinical support.
In 2019, we will report on the outcomes of the work undertaken.
Midwifery Workforce GroupThe Midwifery Workforce Group was established as an action, following the 2012 Maternity Care Review, to develop and implement a Midwifery Workforce Action Plan. The action plan aims to increase the availability of midwives in order to meet demand in the Counties Manukau region.
The Midwifery Workforce Group’s aim is to achieve an appropriate workforce capacity across the maternity care continuum to provide quality care that is women-centred, reflecting the New Zealand maternity model of care. The group’s function is to have open communication between all parties, to enhance the care of women and babies and to ensure the objectives for the Workforce Action Plan are delivered. The group provides a forum to celebrate and share achievements, and problem-solve the challenges that can arise from a diverse population. The group reports to the Maternity Strategic Forum.
Details of the group members are provided below.
Claire Eyes Community LMC midwife, New Zealand College of Midwives LMC representative on the Maternity Quality and Safety Group and Midwifery Workforce Group
I have been on the CM Health Midwifery Workforce Group for the past 3 years. The 2-hour meetings are held monthly at Middlemore Hospital. The group includes Community LMC input from each of the seven geographical areas of CM Health, i.e. Papakura, Manurewa, Otara, Mangere, Manukau/Papatoetoe, East, and Pukekohe/Franklin. The membership comprises seven CM Health employees from various areas, including the maternity wards, Birthing and Assessment Unit, primary community management, and from other professional groups encompassing the New Zealand College of Midwives, the Midwifery Employee Representation and Advisory Service, and the New Zealand Nurses Organisation.
These workforce group’s meetings are generally well attended, and considering the 24-hour on-call nature of a community LMC’s work this is to be commended. Discussion of topics is wide and varied and includes:
• issues around recruitment of midwives
• Midwifery First Year of Practice (MFYP)
DEBRA FENTONMaternity Service Manager
THELMA THOMPSONDirector of Midwifery, Chairperson of the
Midwifery Workforce Group
AUTHOR AUTHOR
86
• communication flow on postnatal wards between staff and LMCs
• professional culture, behaviour and organisational values
• difficulties LMCs encounter when choosing to practise solely primary care and the need to transfer or hand-over to secondary care – particularly in the very overstretched maternal mental health facility
• meeting the Ministry of Health initiatives of early engagement and the barriers around this
• accessibility of contraception
• updates from ongoing trials or research projects, such as HUMBA, GEMS and for pulse oximetry screening
• pregnancy and parenting sessions
• Te Rito Ora updates
• changes to the Vulnerable Children’s Act 2014
• accessibility of and reporting on scans
• non-eligible women and their provision of care.
The group also receives any significant feedback from the Maternity Quality and Safety Group, provides updates on progress on the Maternity Quality Improvement Workplan, and reports on initiatives and progress from regional and national workforce forums.
Despite my frustration with traffic on the southern motorway when attending this meeting, it is a very rewarding experience and gives an overview of the whole organisation, and what it is achieving within the constraints it has to deal with. It also provides a forum to discuss issues and difficulties women have to contend with in accessing services, and engenders respect and understanding of colleagues work situations, both at a core level and within CM Health, and the challenges LMCs deal with. This information ultimately feeds back to all areas, to ensure that women and families remain at the centre of care provision within CM Health.
Katarina Komene Community LMC Midwife Liaison (April to July 2018), Community LMC midwife, Antenatal Educator
I have only just joined the Maternity Workforce Group, but think it is an excellent way of having the voice of community LMCs heard by the senior staff in Women’s Health at CM Health. It is important that we have a voice when it comes to important decisions that affect our workforce and our relationship with the DHB, and I am pleased to be given the opportunity to be heard on behalf of my LMC colleagues, and in particular our graduate midwives.
Lesley Hinson, Community LMC Midwife, LMC representative on the Incident Monitoring and Baby Friendly Hospital Initiative groups, New Zealand College of Midwives
representative on the Midwifery Workforce Group
The Midwifery Workforce Group is unique to CM Health, and includes diverse staff from Women's Health and community LMC midwives. The group works on keeping open communication among all involved, so that all are aware of the reality for practitioners and women in the locality. New projects are brought to the group for future planning and information sharing. CM Health and LMC practitioners want the best care for their population, and so information sharing about current and future care options is vital.
Caroline Conroy CM Health employed midwife, Midwifery Employee Representation and Advisory Service and Papakura Birthing Unit representative
This forum is a something that CM Health should celebrate and be very proud of. It seems to be unique amongst maternity services within New Zealand, providing an opportunity for representatives from community LMC midwives, CM Health employed midwives, the New Zealand College of Midwives, the Midwifery Employee Representation and Advisory Service and the New Zealand Nurses Organisation to meet regularly. By focusing on communication, workforce development and processes this group has been able to provide a solution-focused approach to issues affecting midwifery within Counties Manukau.
Judith Couch CM Health employed midwife, Registered Comprehensive Nurse
I am on the Midwifery Workforce Group as the Pukekohe Birthing Unit representative, as well as the Women's Health Convenor delegate for the New Zealand Nurses Organisation. I work at a community birthing unit as an employed midwife, which includes working as a CM Health community midwife for 1 day of the week. In the past, I also combined this with working on the maternity ward at Middlemore Hospital. I have been employed at CM Health for 28 years, working in all areas of women's health.
I have been involved with the workforce group since the beginning and have found it a very positive working group, striving to improve the care of the women and their whaanau, improve communication between core staff and the LMCs, and review how we do things. I am pleased with our achievements so far, and look forward to continuing to improve the way care is provided and the way all health professionals using the service interact with each other.
WOMEN’S HEALTH AND NEWBORN ANNUAL REPORT 2017-2018 87
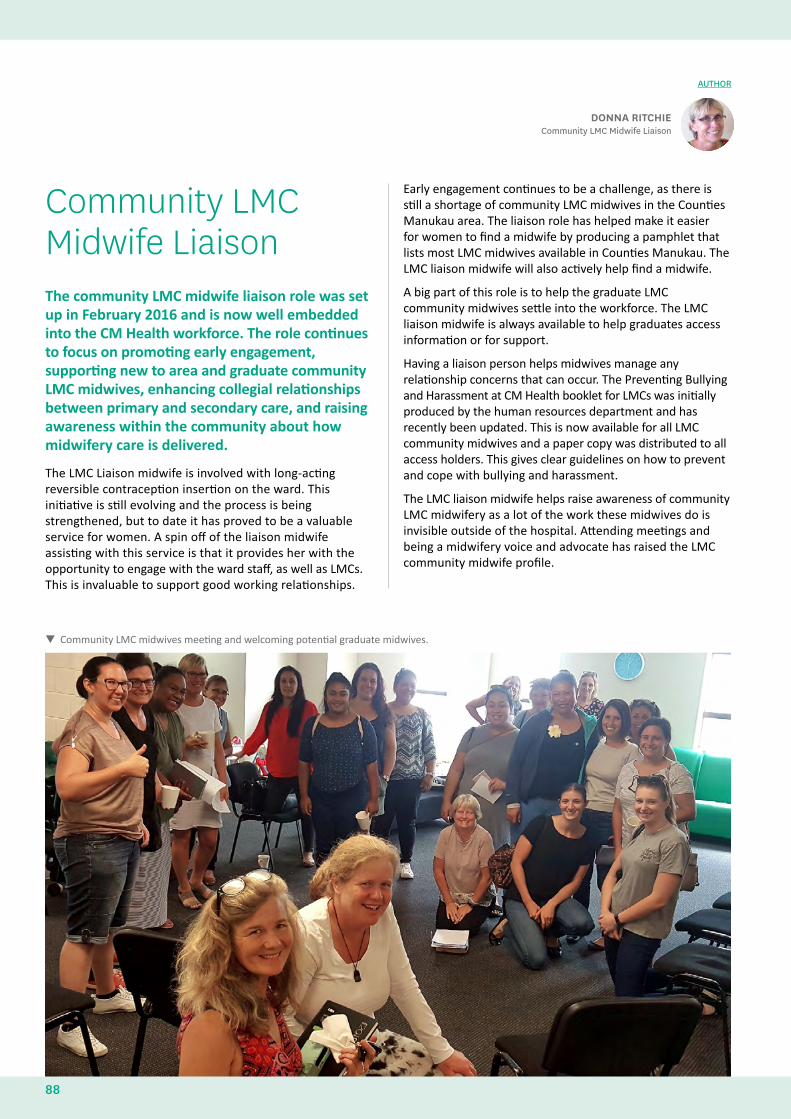
Community LMC Midwife Liaison The community LMC midwife liaison role was set up in February 2016 and is now well embedded into the CM Health workforce. The role continues to focus on promoting early engagement, supporting new to area and graduate community LMC midwives, enhancing collegial relationships between primary and secondary care, and raising awareness within the community about how midwifery care is delivered.
The LMC Liaison midwife is involved with long-acting reversible contraception insertion on the ward. This initiative is still evolving and the process is being strengthened, but to date it has proved to be a valuable service for women. A spin off of the liaison midwife assisting with this service is that it provides her with the opportunity to engage with the ward staff, as well as LMCs. This is invaluable to support good working relationships.
DONNA RITCHIECommunity LMC Midwife Liaison
AUTHOR
Early engagement continues to be a challenge, as there is still a shortage of community LMC midwives in the Counties Manukau area. The liaison role has helped make it easier for women to find a midwife by producing a pamphlet that lists most LMC midwives available in Counties Manukau. The LMC liaison midwife will also actively help find a midwife.
A big part of this role is to help the graduate LMC community midwives settle into the workforce. The LMC liaison midwife is always available to help graduates access information or for support.
Having a liaison person helps midwives manage any relationship concerns that can occur. The Preventing Bullying and Harassment at CM Health booklet for LMCs was initially produced by the human resources department and has recently been updated. This is now available for all LMC community midwives and a paper copy was distributed to all access holders. This gives clear guidelines on how to prevent and cope with bullying and harassment.
The LMC liaison midwife helps raise awareness of community LMC midwifery as a lot of the work these midwives do is invisible outside of the hospital. Attending meetings and being a midwifery voice and advocate has raised the LMC community midwife profile.
Community LMC midwives meeting and welcoming potential graduate midwives.
88
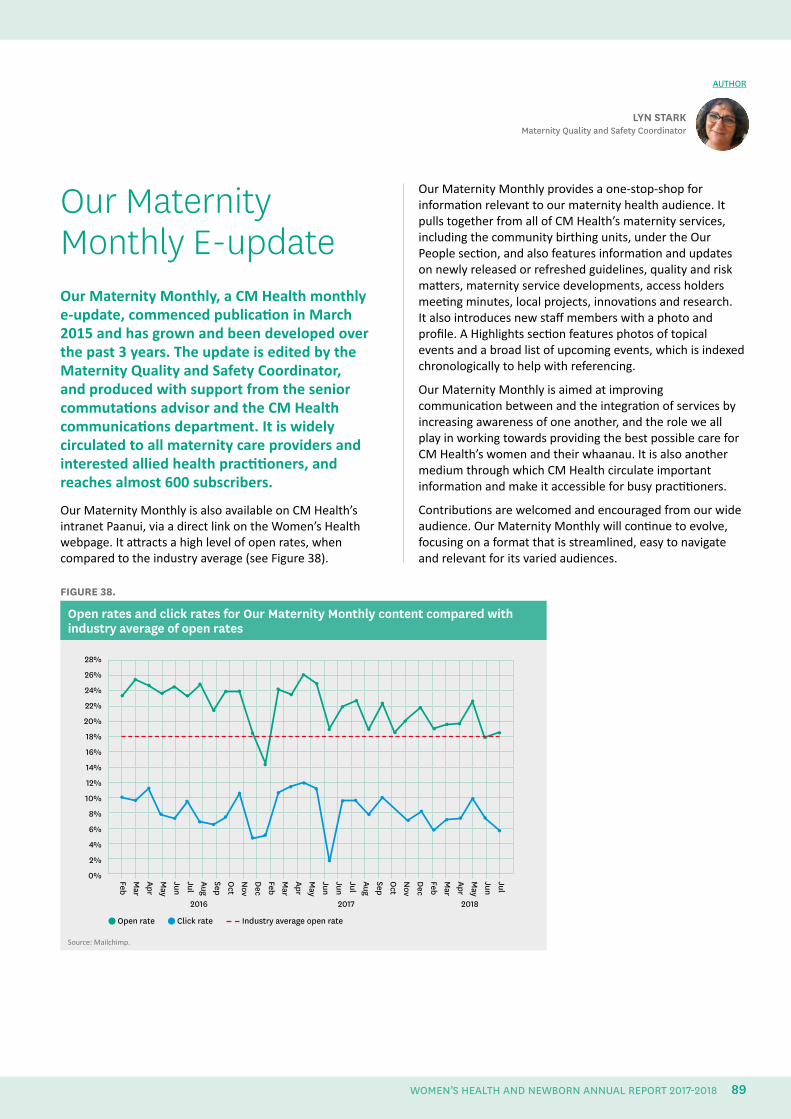
Our Maternity Monthly E-updateOur Maternity Monthly, a CM Health monthly e-update, commenced publication in March 2015 and has grown and been developed over the past 3 years. The update is edited by the Maternity Quality and Safety Coordinator, and produced with support from the senior commutations advisor and the CM Health communications department. It is widely circulated to all maternity care providers and interested allied health practitioners, and reaches almost 600 subscribers.
Our Maternity Monthly is also available on CM Health’s intranet Paanui, via a direct link on the Women’s Health webpage. It attracts a high level of open rates, when compared to the industry average (see Figure 38).
LYN STARKMaternity Quality and Safety Coordinator
AUTHOR
Our Maternity Monthly provides a one-stop-shop for information relevant to our maternity health audience. It pulls together from all of CM Health’s maternity services, including the community birthing units, under the Our People section, and also features information and updates on newly released or refreshed guidelines, quality and risk matters, maternity service developments, access holders meeting minutes, local projects, innovations and research. It also introduces new staff members with a photo and profile. A Highlights section features photos of topical events and a broad list of upcoming events, which is indexed chronologically to help with referencing.
Our Maternity Monthly is aimed at improving communication between and the integration of services by increasing awareness of one another, and the role we all play in working towards providing the best possible care for CM Health’s women and their whaanau. It is also another medium through which CM Health circulate important information and make it accessible for busy practitioners.
Contributions are welcomed and encouraged from our wide audience. Our Maternity Monthly will continue to evolve, focusing on a format that is streamlined, easy to navigate and relevant for its varied audiences.
FIGURE 38.
Open rates and click rates for Our Maternity Monthly content compared with industry average of open rates
2016
JulJunM
ayAprM
arFebD
ecN
ovO
ctSepAugJulJunJunM
ayAprM
arFebD
ecN
ovO
ctSepAugJulJunM
ayAprM
arFeb
28%
26%
24%
22%
20%
18%
16%
14%
12%
10%
8%
6%
4%
2%
0%
2017 2018
Open rate Click rate Industry average open rate
Source: Mailchimp.
WOMEN’S HEALTH AND NEWBORN ANNUAL REPORT 2017-2018 89
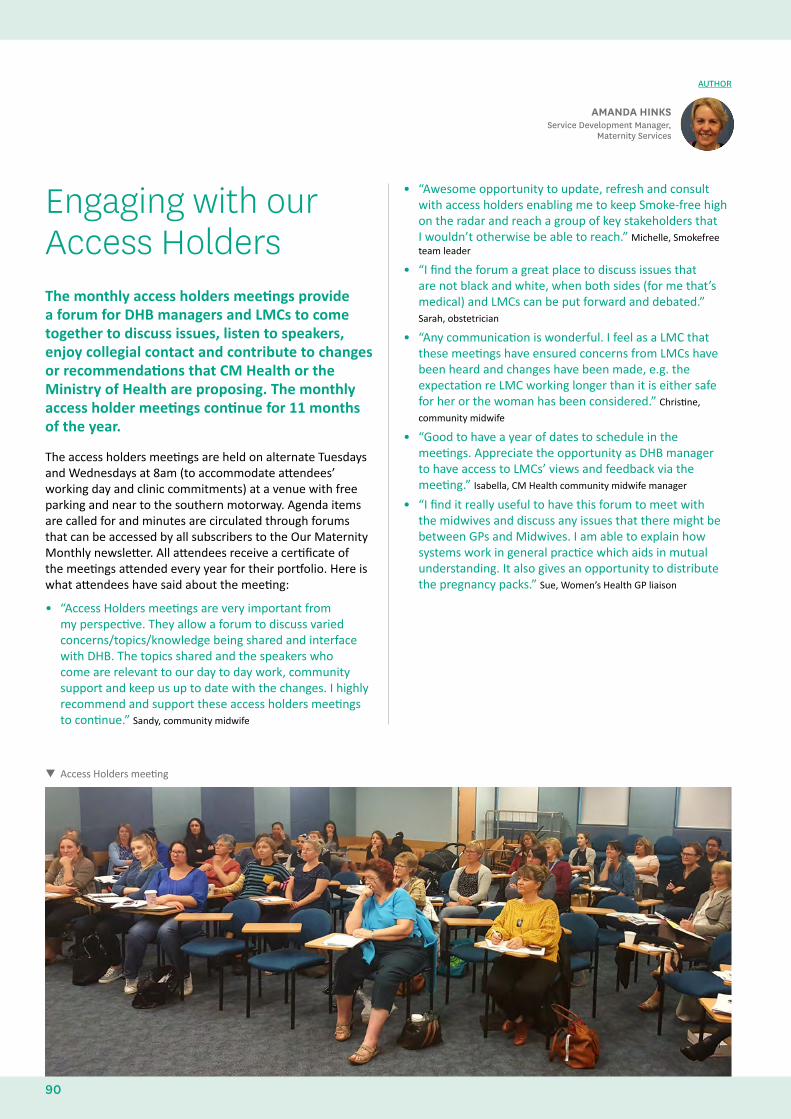
• “Awesome opportunity to update, refresh and consult with access holders enabling me to keep Smoke-free high on the radar and reach a group of key stakeholders that I wouldn’t otherwise be able to reach.” Michelle, Smokefree team leader
• “I find the forum a great place to discuss issues that are not black and white, when both sides (for me that’s medical) and LMCs can be put forward and debated.” Sarah, obstetrician
• “Any communication is wonderful. I feel as a LMC that these meetings have ensured concerns from LMCs have been heard and changes have been made, e.g. the expectation re LMC working longer than it is either safe for her or the woman has been considered.” Christine,
community midwife
• “Good to have a year of dates to schedule in the meetings. Appreciate the opportunity as DHB manager to have access to LMCs’ views and feedback via the meeting.” Isabella, CM Health community midwife manager
• “I find it really useful to have this forum to meet with the midwives and discuss any issues that there might be between GPs and Midwives. I am able to explain how systems work in general practice which aids in mutual understanding. It also gives an opportunity to distribute the pregnancy packs.” Sue, Women’s Health GP liaison
AUTHOR
Engaging with our Access HoldersThe monthly access holders meetings provide a forum for DHB managers and LMCs to come together to discuss issues, listen to speakers, enjoy collegial contact and contribute to changes or recommendations that CM Health or the Ministry of Health are proposing. The monthly access holder meetings continue for 11 months of the year.
The access holders meetings are held on alternate Tuesdays and Wednesdays at 8am (to accommodate attendees’ working day and clinic commitments) at a venue with free parking and near to the southern motorway. Agenda items are called for and minutes are circulated through forums that can be accessed by all subscribers to the Our Maternity Monthly newsletter. All attendees receive a certificate of the meetings attended every year for their portfolio. Here is what attendees have said about the meeting:
• “Access Holders meetings are very important from my perspective. They allow a forum to discuss varied concerns/topics/knowledge being shared and interface with DHB. The topics shared and the speakers who come are relevant to our day to day work, community support and keep us up to date with the changes. I highly recommend and support these access holders meetings to continue.” Sandy, community midwife
AMANDA HINKSService Development Manager,
Maternity Services
Access Holders meeting
90
AUTHOR
Education for Maternity CarersIn the past year, CM Health has offered, and continues to provide, the following education to core and community midwives and nurses working within Women’s Health. The choice of education provided is in response to the annual needs analysis, critical incidents, and trends identified by the services, CM Health and the Ministry of Health.
As well as the usual compulsory Combined Emergency Skills Day, which focuses on situations relevant to CM Health, and Baby Friendly Hospital Initiative workshops, a number of courses have been offered during 2017/2018. These include:
• a half-hour refresher presentation on the Neonatal Early Warning Score, as part of the mandatory training for all midwives
• a 1-hour update on violence intervention, as part of the mandatory training for all employed midwives
• an annual Royal Australian and New Zealand College of Obstetricians and Gynaecologists cardiotograph workshop, and a cardiotograph update as part of the Midwives Annual Update Day
• diabetes education through an online learning module
• Growth Assessment Protocol education sessions provided by the Perinatal Institute
• a grief and loss workshop, focused on the broader concept of grief and loss
• a normal birth workshop
• a vulnerable situations workshop – this is a new workshop to enable midwives to manage the increasing amount of vulnerable women and situations they encounter
• two perineal repair workshops
• a maternal mental health workshop provided by the CM Health Maternal Mental Health team, with the added input of Infant Mental Health
• an immunisation for midwives workshop provided by the Immunisation Advisory Centre
• Practical Obstetric Multi-Professional Training courses held at both Middlemore Hospital and the three community birthing units in Counties Manukau
• an Alcohol and Other Drugs Study Day run by Community Alcohol and Drug Services
• a professional and legal issues workshop
• a skills update workshop providing midwives with the opportunity to practice midwifery skills that they feel less confident in undertaking
• three epidural education workshops for midwives
• a newborn care workshop
• a five day education programme specifically for registered nurses working in maternity, which enables nurses to provide safer care to our women and babies. CM Health continues to be a Midwifery Council approved education provider.
KATHY OGILVY Professional Development Team
Lead, Women’s Health and Kidz First
WOMEN’S HEALTH AND NEWBORN ANNUAL REPORT 2017-2018 91
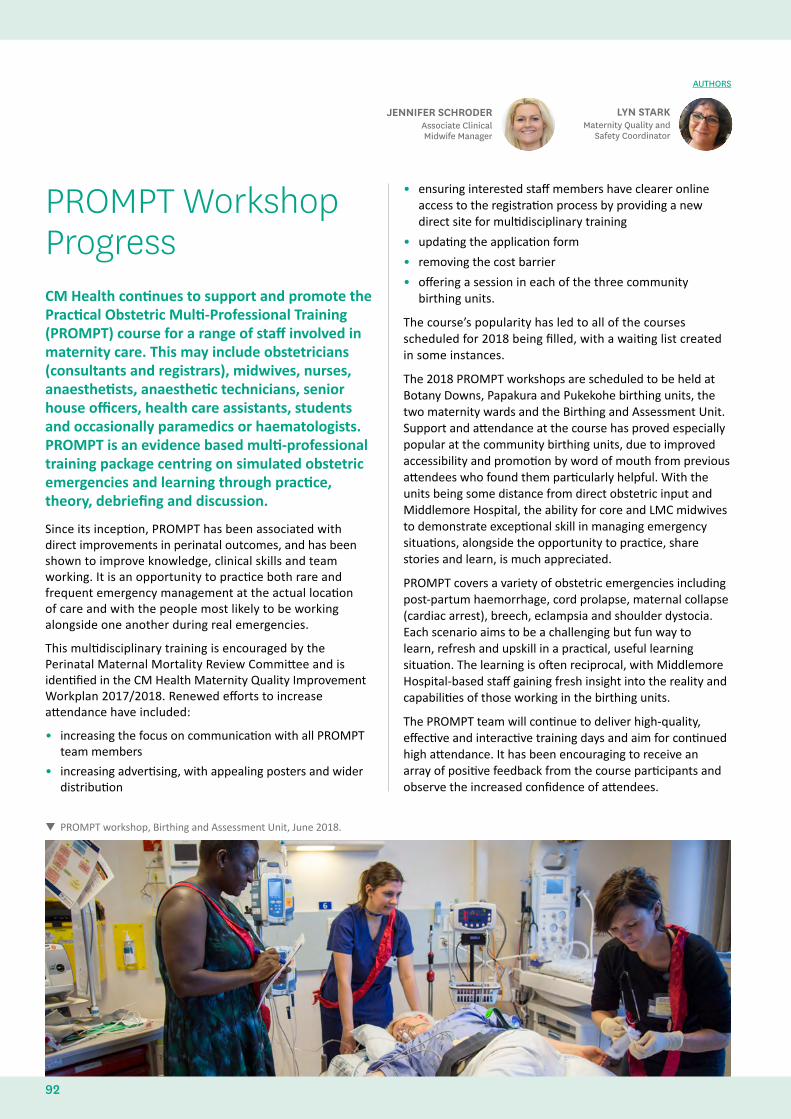
PROMPT Workshop ProgressCM Health continues to support and promote the Practical Obstetric Multi-Professional Training (PROMPT) course for a range of staff involved in maternity care. This may include obstetricians (consultants and registrars), midwives, nurses, anaesthetists, anaesthetic technicians, senior house officers, health care assistants, students and occasionally paramedics or haematologists. PROMPT is an evidence based multi-professional training package centring on simulated obstetric emergencies and learning through practice, theory, debriefing and discussion.
Since its inception, PROMPT has been associated with direct improvements in perinatal outcomes, and has been shown to improve knowledge, clinical skills and team working. It is an opportunity to practice both rare and frequent emergency management at the actual location of care and with the people most likely to be working alongside one another during real emergencies.
This multidisciplinary training is encouraged by the Perinatal Maternal Mortality Review Committee and is identified in the CM Health Maternity Quality Improvement Workplan 2017/2018. Renewed efforts to increase attendance have included:
• increasing the focus on communication with all PROMPT team members
• increasing advertising, with appealing posters and wider distribution
• ensuring interested staff members have clearer online access to the registration process by providing a new direct site for multidisciplinary training
• updating the application form
• removing the cost barrier
• offering a session in each of the three community birthing units.
The course’s popularity has led to all of the courses scheduled for 2018 being filled, with a waiting list created in some instances.
The 2018 PROMPT workshops are scheduled to be held at Botany Downs, Papakura and Pukekohe birthing units, the two maternity wards and the Birthing and Assessment Unit. Support and attendance at the course has proved especially popular at the community birthing units, due to improved accessibility and promotion by word of mouth from previous attendees who found them particularly helpful. With the units being some distance from direct obstetric input and Middlemore Hospital, the ability for core and LMC midwives to demonstrate exceptional skill in managing emergency situations, alongside the opportunity to practice, share stories and learn, is much appreciated.
PROMPT covers a variety of obstetric emergencies including post-partum haemorrhage, cord prolapse, maternal collapse (cardiac arrest), breech, eclampsia and shoulder dystocia. Each scenario aims to be a challenging but fun way to learn, refresh and upskill in a practical, useful learning situation. The learning is often reciprocal, with Middlemore Hospital-based staff gaining fresh insight into the reality and capabilities of those working in the birthing units.
The PROMPT team will continue to deliver high-quality, effective and interactive training days and aim for continued high attendance. It has been encouraging to receive an array of positive feedback from the course participants and observe the increased confidence of attendees.
LYN STARKMaternity Quality and
Safety Coordinator
JENNIFER SCHRODERAssociate Clinical Midwife Manager
AUTHORS
PROMPT workshop, Birthing and Assessment Unit, June 2018.
92
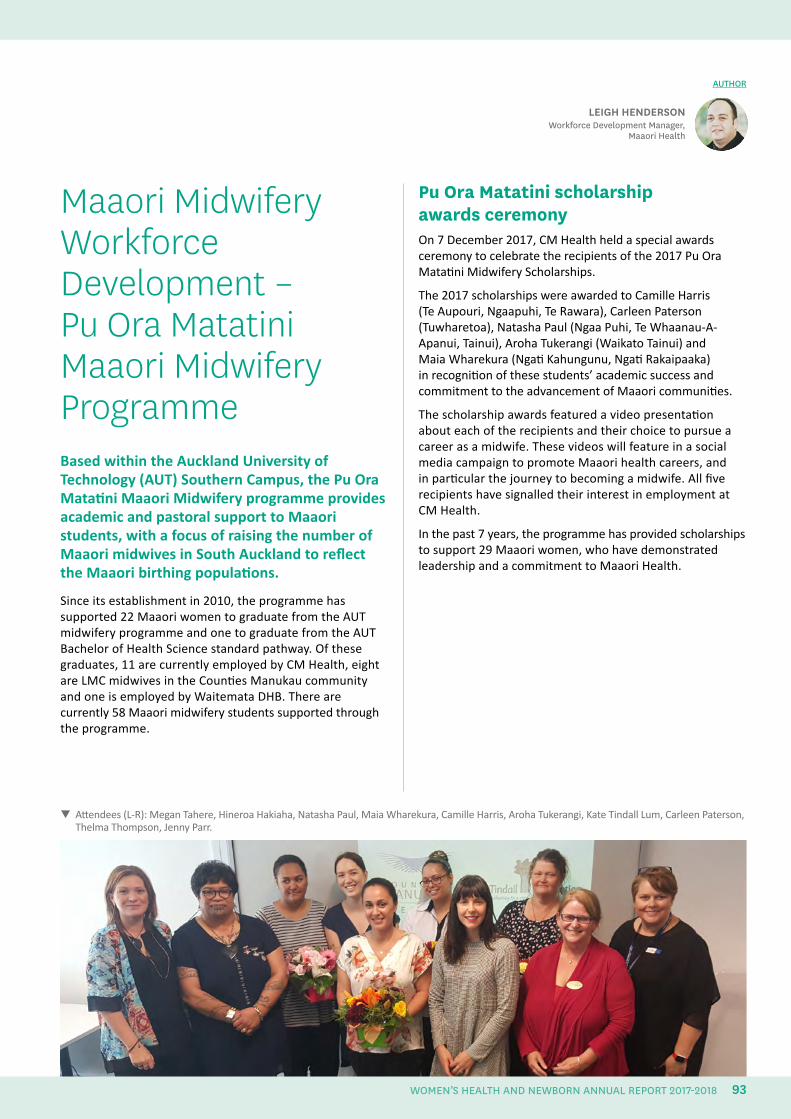
Attendees (L-R): Megan Tahere, Hineroa Hakiaha, Natasha Paul, Maia Wharekura, Camille Harris, Aroha Tukerangi, Kate Tindall Lum, Carleen Paterson, Thelma Thompson, Jenny Parr.
Maaori Midwifery Workforce Development – Pu Ora Matatini Maaori Midwifery ProgrammeBased within the Auckland University of Technology (AUT) Southern Campus, the Pu Ora Matatini Maaori Midwifery programme provides academic and pastoral support to Maaori students, with a focus of raising the number of Maaori midwives in South Auckland to reflect the Maaori birthing populations.
Since its establishment in 2010, the programme has supported 22 Maaori women to graduate from the AUT midwifery programme and one to graduate from the AUT Bachelor of Health Science standard pathway. Of these graduates, 11 are currently employed by CM Health, eight are LMC midwives in the Counties Manukau community and one is employed by Waitemata DHB. There are currently 58 Maaori midwifery students supported through the programme.
Pu Ora Matatini scholarship awards ceremonyOn 7 December 2017, CM Health held a special awards ceremony to celebrate the recipients of the 2017 Pu Ora Matatini Midwifery Scholarships.
The 2017 scholarships were awarded to Camille Harris (Te Aupouri, Ngaapuhi, Te Rawara), Carleen Paterson (Tuwharetoa), Natasha Paul (Ngaa Puhi, Te Whaanau-A-Apanui, Tainui), Aroha Tukerangi (Waikato Tainui) and Maia Wharekura (Ngati Kahungunu, Ngati Rakaipaaka) in recognition of these students’ academic success and commitment to the advancement of Maaori communities.
The scholarship awards featured a video presentation about each of the recipients and their choice to pursue a career as a midwife. These videos will feature in a social media campaign to promote Maaori health careers, and in particular the journey to becoming a midwife. All five recipients have signalled their interest in employment at CM Health.
In the past 7 years, the programme has provided scholarships to support 29 Maaori women, who have demonstrated leadership and a commitment to Maaori Health.
AUTHOR
LEIGH HENDERSONWorkforce Development Manager,
Maaori Health
WOMEN’S HEALTH AND NEWBORN ANNUAL REPORT 2017-2018 93
Increasing the number of Maaori studying to be a midwifeIn the past 7 years, the Pu Ora Matatini programme has increased the number of South Auckland Midwives from 3 to 25, and has lifted the number of Maaori midwives employed at CM Health from 2 (1.8% of the workforce) to 17 (12.6% of the workforce). The programme has also helped significantly increase the number of Maaori studying to be a midwife, from 8 (4% of all AUT midwifery students) in 2011 to 58 (22.7% of all AUT midwifery students) in 2017: see Table 27.
TABLE 27.
Students enrolled in semester two of the AUT midwifery programme, 2015–2017 Ethnicity 2015 2016 2017
Total 247 253 255
Maaori 35 42 58
Maaori percentage of total
14.2% 16.6% 22.7%
Source: AUT Enrolments
Supporting Maaori midwifery students On 25 and 26 November 2017, Nga Maia Ki Tamaki Makaurau hosted the inaugural Maaori Midwifery Student Hui at Ngaa Wai o Horotiu Marae at AUT City Campus. The overarching theme of the weekend forum was ‘Empowering, inspiring, sustaining and retaining our Maaori midwives and future Maaori midwives’. The Hui was attended by over 80 participants, including a mixture of students, midwives and other health professionals.
The programme included presentations from 18 sector leaders, as well as demonstrations on rongoaa Maaori and traditional healing.
Enhancements to the 2018 programme In 2018, AUT will be introducing a series of changes to the Pu Ora Matatini programme designed to support the recruitment and retention of Maaori students.
These changes will include:
• establishing a Maaori midwifery whare at AUT’s Southern Campus, so that students and their whaanau have a space to network and study – the appropriate place for the facility is currently being negotiated.
• recruiting a 0.4 FTE clinical educator to increase support for Maaori completing the first three core papers of the midwifery qualification as part of the Bachelors of Health Science
• recruiting three student mentors to improve academic support for first and second year midwifery students.
Funding for these changes has been allocated from current underspending and through in-kind support from AUT.
Participants at the inaugural Maaori Midwifery Student Hui, November 2017
94
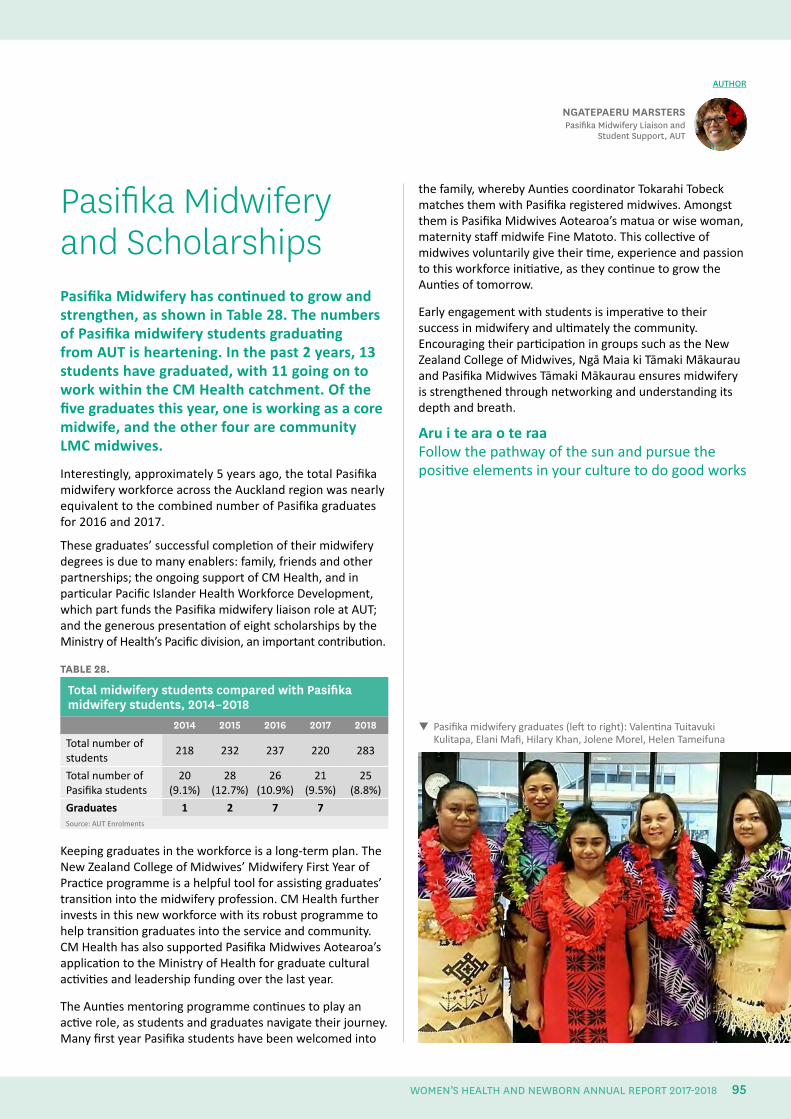
Pasifika midwifery graduates (left to right): Valentina Tuitavuki Kulitapa, Elani Mafi, Hilary Khan, Jolene Morel, Helen Tameifuna
Pasifika Midwifery and ScholarshipsPasifika Midwifery has continued to grow and strengthen, as shown in Table 28. The numbers of Pasifika midwifery students graduating from AUT is heartening. In the past 2 years, 13 students have graduated, with 11 going on to work within the CM Health catchment. Of the five graduates this year, one is working as a core midwife, and the other four are community LMC midwives.
Interestingly, approximately 5 years ago, the total Pasifika midwifery workforce across the Auckland region was nearly equivalent to the combined number of Pasifika graduates for 2016 and 2017.
These graduates’ successful completion of their midwifery degrees is due to many enablers: family, friends and other partnerships; the ongoing support of CM Health, and in particular Pacific Islander Health Workforce Development, which part funds the Pasifika midwifery liaison role at AUT; and the generous presentation of eight scholarships by the Ministry of Health’s Pacific division, an important contribution.
TABLE 28.
Total midwifery students compared with Pasifika midwifery students, 2014–2018
2014 2015 2016 2017 2018
Total number of students
218 232 237 220 283
Total number of Pasifika students
20(9.1%)
28(12.7%)
26(10.9%)
21(9.5%)
25(8.8%)
Graduates 1 2 7 7Source: AUT Enrolments
Keeping graduates in the workforce is a long-term plan. The New Zealand College of Midwives’ Midwifery First Year of Practice programme is a helpful tool for assisting graduates’ transition into the midwifery profession. CM Health further invests in this new workforce with its robust programme to help transition graduates into the service and community. CM Health has also supported Pasifika Midwives Aotearoa’s application to the Ministry of Health for graduate cultural activities and leadership funding over the last year.
The Aunties mentoring programme continues to play an active role, as students and graduates navigate their journey. Many first year Pasifika students have been welcomed into
AUTHOR
NGATEPAERU MARSTERSPasifika Midwifery Liaison and
Student Support, AUT
the family, whereby Aunties coordinator Tokarahi Tobeck matches them with Pasifika registered midwives. Amongst them is Pasifika Midwives Aotearoa’s matua or wise woman, maternity staff midwife Fine Matoto. This collective of midwives voluntarily give their time, experience and passion to this workforce initiative, as they continue to grow the Aunties of tomorrow.
Early engagement with students is imperative to their success in midwifery and ultimately the community. Encouraging their participation in groups such as the New Zealand College of Midwives, Ngā Maia ki Tāmaki Mākaurau and Pasifika Midwives Tāmaki Mākaurau ensures midwifery is strengthened through networking and understanding its depth and breath.
Aru i te ara o te raa Follow the pathway of the sun and pursue the positive elements in your culture to do good works
WOMEN’S HEALTH AND NEWBORN ANNUAL REPORT 2017-2018 95
Midwifery Graduate ProgrammeCM Health has provided and coordinated a graduate midwifery programme since 2002 and is constantly reviewing and adapting it to meet the evolving needs of the service. After trialling several formats and following feedback and evaluation, CM Health settled on a 15-month programme, which enables the graduate midwife to ‘find her feet’ for the first 12 weeks, followed by a solid 2 months of feeling confident and truly part of the team.
In 2013, graduate community LMC midwives, working in the Counties Manukau area, were invited to join the midwifery graduate programme orientation and study days. This enables graduate midwives, irrespective of midwifery practice settings, to continue their pre-registration collegial relationships into supportive professional networks.
The programme is led by the midwife coordinator. This role provides support, guidance, pastoral care and resources to CM Health graduate midwives during their 15-month programme.
The community LMC liaison midwife’s role is to support graduate community LMC midwives into practice and to aid communication between DHB and primary care maternity providers. This support is in addition to that provided by the midwifery graduate’s Midwifery First Year of Practice programme mentor, midwifery practice partners, midwife managers and senior midwives.
The midwifery graduate programme begins with an orientation week with sessions scheduled over 5-days. The sessions include:
• an introduction to midwifery and maternity services, including social work, child protection, Smokefree initiatives, infection control, medication safety, contraception, breastfeeding, diabetes, maternal fetal medicine, perinatal loss, theatre, and administration and referral processes
• practical skills sessions, including adult and neonatal resuscitation
• Information Support Services training, including Paanui, the Clinical Portal and the Maternity Clinical Information System.
For employed graduate midwives, the midwifery graduate programme consists of three 5-month placements: in the maternity wards (high-risk antenatal and postnatal), the
Birthing and Assessment Unit, and either a community birthing unit or with the DHB community midwives in Manukau, Botany and Papakura (who handle antenatal and postnatal caseloads, excluding intrapartum).
The CM Health midwifery graduate programme offers four study days over the 15-month period. These study days are facilitated specifically for graduate midwives. Past topics have included perineal suturing, resilience and self-care, neonatal cardiac examination and jaundice, interpreting laboratory results and biochemistry in pregnancy, and legal matters in midwifery. In addition, the study days include practical skills sessions, as well as the opportunity to share clinical experiences.
For CM Health employed graduate midwives, the orientation and study days are paid rostered days. For community LMC graduate midwives, attendance is free of charge and offers the opportunity to reflect on practice and skills, as well as providing support and networking opportunities.
Preceptor modelThe intake of the May 2017 graduates saw changes to the preceptor model used by CM Health, with the aim of providing greater support to graduate midwives over the initial 12 weeks of each rotation. This model enables the graduate midwife to work the same shifts as her named preceptor during the initial period.
By minimising the number of preceptors, the named preceptor and the graduate preceptee are able to set goals for the orientation period, to work through the orientation manual together, and to identify any ongoing learning needs following the initial period.
For the 3 weeks following the initial period:
• on the maternity wards, the graduate midwife has a workload of two or three women and their babies initially, which is increased to four women and their babies over the 3 weeks. An experienced midwife supervisor is identified on the roster who will be provide graduate support for that shift.
• in the Birthing and Assessment Unit, the graduate midwife works one-on-one with labouring women with an identified ‘link’ midwife. The link midwife is available to support employed and community LMC midwives during this period
• in the community birthing units, the graduate midwife works as in their initial weeks, with one workload shared between the graduate and the preceptor
• in community midwifery, the graduate midwife will care for a small caseload of lower-risk women with her antenatal clinic alongside her preceptor.
DONNA RITCHIECommunity LMC Midwife Liaison
SANNE WESSELINGMidwifery Coordinator of
Graduate Programme
AUTHORS
96
The preceptor model was evaluated in September 2017. Feedback from the May 2017 graduate midwives reflected that this model positively facilitated the midwives to transition from students to registered practitioners enabled work readiness.
In the words of one graduate midwife: “I feel like I have grown as a midwife during those 12 weeks and know my strengths and weaknesses across the midwifery scope. It has helped me to identify the midwife I am and the practice I am passionate about”.
Voluntary bonding for all graduatesCounties Manukau is designated as a hard-to-staff area for midwifery. Those CM Health midwives (both employed and community) who are accepted on the graduate midwifery programme will receive an annual after-tax payment of $3,500, after qualifying as a registered midwife, for up to 5 years. The first payment is made after 3 years ($10,500), and again at the end of the fourth ($3,500) and fifth ($3,500) years.
Our graduatesAs of May 2018, the current place of work of graduate midwives employed by CM Health between 2013 to 2018 is:
• 76% (84) are still employed by CM Health
• 5% (5) have moved to work as a community LMC within the CM Health area
• 17% (19) no longer practice within the CM Health area
• 2% (3) have left the profession.
All graduate LMC community midwives that started working for CM Health in 2017 are still working for us.
In May 2018, 14 graduates LMC community midwives commenced practice in CM Health.
Support for new and graduate community LMC midwives The support provided community LMC midwives who are graduates or new to the CM Health area includes:
• orientation sessions run by CM Health staff, alongside employed graduates
• support from the community LMC liaison midwife
• a $2000 set-up grant (for graduates only) to help with purchasing midwifery equipment
• reimbursement of the Children’s Worker Safety Check fee
• a new Community LMC Midwife Business Start-up booklet to help new midwives navigate through the business side of self-employed midwifery
• a ‘Maternity Information Directory and a Community Prescribing Guide for Maternity Care’, which is available online, with hard copies available to all new access holders
• a handbook on preventing bullying and harassment at CM Health
• Our Maternity Monthly; a monthly digital newsletter
• access to CM Health education, as outlined in the annual education calendar
• monthly access holder meetings, which provide an opportunity to improve communications and the interface between CM Health and community LMC midwives, as well as offering a forum for education and updates
• short and sharp professional updates with DHB community midwives
• regular lunchtime meetings with a variety of interesting speakers and topics to keep up-to-date with current services
• support to connect online with the Maternity Clinical Information System via CITRIX
• familiarisation shifts at CM Health birthing facilities, as arranged with the midwife coordinator and midwife manager concerned
• multidisciplinary perinatal and maternal mortality meetings every 4 weeks, which involve confidential discussion and valuable recommendations being made to improve outcomes
• quarterly serious adverse event and morbidity meetings
• first contact pregnancy information packs, which community LMC midwives can give to women they are booking directly, to ensure they receive equitable access to information
• a maternity Smokefree advisor who manages all referrals accepted by CM Health for smoking pregnant women
• breastfeeding support services, both within the facilities and the community (this support is additional to the compulsory Baby Friendly Hospital Initiative, which requires breastfeeding education to be offered)
• orientation to the maternity systems within CM Health, which can include administration, referral processes and computer training for the Maternity Clinical Information System and Patient Information Management System
• orientation to Middlemore Hospital and the three birthing units if requested.
CM Health 2018 graduates
WOMEN’S HEALTH AND NEWBORN ANNUAL REPORT 2017-2018 97

Gynaecology
98
Gynaecology
DR KATHERINE SOWDENClinical Lead Gynaecology
Gynaecology ServicesCM Health provides gynaecology services at three locations: Middlemore Hospital, Botany SuperClinic and Manukau SuperClinic and Surgical Centre. A multidisciplinary team of gynaecologists, junior medical and nursing staff, provide these services.
Middlemore Hospital provides the 24-hour acute gynaecology service for CM Health, seeing both urgent primary care referrals and women self-presenting through the Emergency Department. The hospital also provides an Early Pregnancy Assessment Clinic to assess and manage early pregnancy problems during office hours.
Elective surgery is performed at both Middlemore Hospital and Manukau SuperClinic, although more complex cases, requiring admission to the Intensive Care Unit or High Dependency Unit post-operatively are performed at the hospital. Both the Botany SuperClinic and Manukau SuperClinic provide elective outpatient gynaecology services, whilst colposcopy is provided exclusively at Manukau SuperClinic.
ReportingAt present, we are restricted to using data collected from clinical coding discharge reporting, case mix reporting and the colposcopy database for reporting purposes. It is not possible to verify the data provided, so it has been assumed it is accurate.
In the future, a database specifically for gynaecology is being considered, with a rigorous audit of the data possibly by clinicians.
The reporting period is 1 January 2017 to 31 December 2017, unless stated otherwise.
Early Pregnancy Assessment Clinic The Early Pregnancy Assessment Clinic is situated next to the gynaecology ward at Middlemore Hospital. The clinic is open 8am to 4pm Monday to Friday, and caters for women who have early pregnancy problems of a non-acute nature. This is a nurse specialist led clinic with cover from a gynaecology registrar and oversight provided by the acute gynaecologist of the day.
During 2017, 613 new patients and 582 follow-ups were assessed in the Early Pregnancy Assessment Clinic. New patients are directly referred from primary care. In addition, 1,973 follow-up phone calls were made.
Management of miscarriage Of the 850 women who presented with missed or incomplete miscarriage in 2017, 60% were managed surgically and the remaining 40% were managed either medically or expectantly. These figures did not include molar pregnancies of which there were 11.
Management of ectopic pregnancy There were 175 women diagnosed with an ectopic gestation in 2017. Of these, 74.3% were managed surgically (n=130), and 25.7% (n=45) were managed either medically with methotrexate or expectantly.
Gynaecology Outpatient AppointmentsDuring 2017, 8,177 women were seen for assessment in the gynaecology outpatient clinics and a further 2,385 in colposcopy clinics.
Outpatient hysteroscopyOne hundred and sixty-two patients were seen in the outpatient hysteroscopy clinic in 2017. Seventeen patients were referred on for hysteroscopy dilatation and curettage, under general anaesthetic, giving a conversion rate of 10.5%.
The recent introduction of the Myosure procedure has significantly reduced the conversion rate from 2016, which was 33%. Eighty-four (51.9%) of the outpatient hysteroscopies performed in 2017 were performed using the Myosure device.
AUTHOR
99
GYNAECOLOGY
WOMEN’S HEALTH AND NEWBORN ANNUAL REPORT 2017-2018
The decision to introduce an outpatient Myosure procedure was based upon good evidence. The American Association of Gynaecologic Laparoscopists advocates the removal of endometrial polyps under direct vision as gold standard, and advises against blind removal with polyp forceps where possible.29 Blind removal (which until 2017 was standard practice at CM Health) has been shown to have a high rate of incomplete resection (up to 59%) and uterine perforation, particularly when blind curettage is used.30 Consequently many consider blind curettage obsolete.31, 32
A small Australian study showed resection of endometrial polyps under local anaesthetic to be very successful, with a complete resection rate of 95.2% with no complications. The procedures were quick and had a high patient satisfaction.33
As we continue to increase the number of outpatient hysteroscopy clinics, we hope to decrease the number of these procedures performed under general anaesthetic, freeing up elective lists so that major cases can be performed in a timely manner.
Acute and Elective Gynaecological Procedures In total, 2,410 acute and elective gynaecological procedures were conducted during the 2017 year.
Complications from these procedures were collated using a combination of the post-discharge coding data and surgeon self-reporting. Surgical complications are discussed in a bimonthly gynaecology complications audit meeting, overseen by the clinical leader of gynaecology.
A complication has been defined as a deviation from the expected postoperative course or outcome. Reporting of complications is limited to the time in which the patient remains under the care of a CM Health clinician. Complications occurring in the community may not be included in the data presented in this report and therefore the documented complication rates may be an underestimate.
The overall complication rate for inpatient gynaecological procedures for 2017 was 5.0%. For the purposes of analysis, the complications were broken down into four categories: haemorrhage and haematoma; perforation of a viscous or organ; infection; and ‘other’, which includes, but is not limited to, pain, ileus, constipation and thromboembolic events.
LaparoscopyA total of 616 laparoscopies were performed in 2017. There were 27 complications noted, giving a complication rate for all types of gynaecological laparoscopy of 4.4%.
Laparoscopy was further broken down into total laparoscopic hysterectomy, laparoscopic ovarian cystectomy, salpingo-oophorectomy, salpingectomy for ectopic pregnancy, tubal ligation, excision of endometriosis and ‘other laparoscopy’.
• There were 68 laparoscopic hysterectomies, with 11 reported complications, giving a complication rate of 16.2%. The most common complication was related to haemorrhage or haematoma (7.4%).
• There were 126 laparoscopic ovarian cystectomies performed, with three reported complications, giving a complication rate of 2.4%.
• There were 47 laparoscopic salpingo-oophorectomies in non-pregnant women, with two complications, giving a complication rate of 4.3%. Both the salpingo-oophorectomies and ovarian cystectomy complications were predominantly in the ‘other’ complication category
• There were 101 laparoscopies performed where a salpingectomy was performed for ectopic pregnancy. There were no reported complications in women who underwent laparoscopic management of their ectopic pregnancy.
• There were 39 laparoscopic tubal ligations in 2017, compared to 95 in 2016. There were no reported complications, however this did not look at any failures subsequent to the procedure. The significant decrease in the number compared to 2016 is due to all referrals for tubal ligation being referred to a clinical nurse specialist to discuss long-acting reversible contraception before review by a gynaecologist. This is in contrast to the process prior to 2016, where all patients requesting tubal ligation were assessed under the GP with a special interest programme and placed directly on the waiting list.
• There were 86 laparoscopies primarily performed for excision of endometriosis, with eight reported complications, giving a rate of 9.3%. The majority of the complications were evenly split between damage to a viscous or organ and ‘other’ complications.
• There were 101 laparoscopies classified as ‘other laparoscopy’. This group primarily includes all diagnostic laparoscopy where there was no further procedure
29. American Association of Gynaecologic Laparoscopists. 2012. Practice report; Practice guidelines for the diagnosis and management of endometrial polyps. Journal of Minimally Invasive Gynaecology, 19(1). 30. McIlwaine, P., et al. 2015. A prospective study of the use of MyoSure resectoscope to manage endometrial polyps in an outpatient setting. Australian and New Zealand Journal of Obstetrics and Gynaecology; 482-6. DOI; 10.1111/ajo.12382.31. Murdoch, M., & Jackson E. 2015. Hysteroscopic resection. The Royal Australian and
New Zealand College of Obstetricians and Gynaecologists O&G Magazine, 17(4).32. McIlwaine, P., et al. 2015. A prospective study of the use of MyoSure resectoscope to manage endometrial polyps in an outpatient setting. Australian and New Zealand Journal of Obstetrics and Gynaecology; 482-6. DOI; 10.1111/ajo.12382.33. McIlwaine, P., et al. 2015. A prospective study of the use of MyoSure resectoscope to manage endometrial polyps in an outpatient setting. Australian and New Zealand Journal of Obstetrics and Gynaecology; 482-6. DOI; 10.1111/ajo.12382.
100
undertaken. In this group, there was one reported complication (damage to viscous or organ), giving a rate of 1%.
HysterectomyThere were 172 total or subtotal abdominal hysterectomies and bilateral salpingectomies performed (plus or minus oophorectomy), 22 vaginal hysterectomies and 68 total laparoscopic hysterectomies in 2017. The total number of all types of hysterectomy for the year was 262, compared to 233 in 2016. Abdominal hysterectomy made up 66% of all hysterectomies, total laparoscopic hysterectomy comprised 26% and vaginal hysterectomy 8.4%.
The complication rate in the abdominal group was 26% (n=45). The majority of these complications were related to infections, closely followed by ‘other’ complications, which predominantly were related to ileus and pain. In the vaginal group, 13.6% (n=3) had complications, all of which were related to haemorrhage or haematoma. Sixteen per cent in the laparoscopic group (n=11) had complications. These were also predominantly related to haemorrhage and haematoma, but were also closely followed by complications in the ‘other’ group.
These figures are in marked contrast to 2009, when only 5% of hysterectomies were noted to be laparoscopically-assisted and none were recorded as a total laparoscopic procedure. In 2016, 70% were abdominal, 9% vaginal and 21% via the laparoscopic route.
There are numerous studies supporting the advantages of a minimal access approach to hysterectomy (vaginal hysterectomy, laparoscopically-assisted vaginal hysterectomy or total laparoscopic hysterectomy), over the standard open abdominal approach either through a transverse suprapubic incision or a midline laparotomy. As a department, we are supporting a move towards increasing the proportion of minimal access hysterectomies, in line with international guidelines on best practice for route of hysterectomy. In 2017, CM Health initiated a pilot programme to support the upskilling of our gynaecology senior medical officers who wanted to improve their laparoscopic skills and offer laparoscopic hysterectomy – either laparoscopically-assisted vaginal hysterectomy or total laparoscopic hysterectomy – to their patients. We hope that by increasing the number of senior medical officers proficient in these procedures we can decrease the number of abdominal hysterectomies
and further increase the proportion of hysterectomies performed via the laparoscopic route. Based on our own and international data , this in turn would be expected to decrease the total number of complications from hysterectomy, reduce the length of hospital stay and improve patient satisfaction in women needing a hysterectomy.34, 35, 36, 37
In our population of women undergoing abdominal hysterectomy, only 17% had a normal BMI of between 18.5 and 24.9. Twenty-five per cent had an overweight BMI of 25 to 29.9; 36% of 30 to 39.9; 14% of 40 to 49.9; and 8% over 50. This means 83% of our patients are classified as overweight or obese, and 58% obese according to the World Health Organization definition of BMI.
By comparison, of women having vaginal hysterectomy, 23% had a normal BMI of 18.5 to 24.9; 32% were overweight with a BMI of 25 to 29.9; 36% had a BMI between 30 and 39.9; 9% between 40 and 49.9; and none with a BMI over 50.
This is in contrast to those having a total laparoscopic hysterectomy, where 31% had a normal BMI; 25% a BMI of 25 to 29.9; 38% of 30 to 39.9; 6% of 40 to 49.9; and again, none had a BMI over 50.
These findings have significant implications for our service provision, as operations in women with an increased BMI become technically more challenging, operative times increase and complications are more common.38, 39
Other laparotomy There were 96 laparotomies performed for reasons other than hysterectomy in 2017 (other laparotomy). There were 11 recorded complications in this group, giving a complication rate of 11.5%. These complications were predominantly in the ‘other’ category.
Hysteroscopy dilatation and curettage There were 869 hysteroscopy dilatation and curettage operations performed under general anaesthetic or sedation, with 11 complications recorded, giving a rate of 1.3%. These complications were predominantly in the perforation of organ or viscous category, specifically uterine perforation.
34. Aarts, J.W., Neiber, T.E., Johnson, N., et al. 2015. Surgical approach to hysterectomy for benign gynaecological disease. Cochrane Database of Systematic Reviews35. Committee on Gynaecological Practice. 2017. Committee opinion No 701: Choosing the route of hysterectomy for benign disease. Obstetric Gynaecology, 129: e155.36. American Association of Gynaecologic Laparoscopists. 2011. American Association of Gynaecologic Laparoscopists position statement: Route of hysterectomy to treat benign uterine disease. Journal of Minimally Invasive Gynecology, 18:1.
37. Garry, Fountain, Mason, et al. 2004. The eVALuate study. British Medical Journal, 328: pp 129.38. American College Obstetricians and Gynaecologists. 2015. Gynaecologic surgery in obese women: Committee opinion No. 619. Obstetric Gynaecology, 125: pp. 274-8.39. Khavanin, N., Lovecchio, F.C., Hanwright, P.J., Brill, E., Milan, M., Biliāa, K.Y. et al. 2013. The influence of BMI on preoperative morbidity following abdominal hysterectomy. American Journal of Obstetric Gynaecology, 208:449.e1-449.e6.[ PubMed].
101
GYNAECOLOGY
WOMEN’S HEALTH AND NEWBORN ANNUAL REPORT 2017-2018
Evacuation of retained products of conception There were 242 evacuations of retained products of conception performed in 2017, with three recorded complications. This gives a rate of 1.3%, predominantly infection.
Cervical LLetz and cone biopsyThere were 92 LLetz procedures performed under general anaesthetic and four reported complications, predominantly infection, giving a rate of 4.3%.
There were 30 cone biopsies and two reported complications, giving a rate of 6.7%, both bleeding and infection being equally represented.
Novasure ablations There were 52 novasure endometrial ablations. There were no complications reported for any of these procedures.
Tension-free vaginal tape, sacrospinous fixation and vaginal repairThere were 60 tension-free vaginal tape procedures performed, with seven reported complications, giving a rate of 11.7%, which were predominantly due to infection.
There were 92 vaginal repairs (plus or minus sacrospinous fixation), with four reported complications, giving a rate of 4.3%, which was evenly divided between haemorrhage and ‘other’ complications.
OtherThere were 16 ‘other’ procedures performed during 2017, with two recorded complications, divided between haemorrhage and damaged viscous, giving a complication rate of 12.5%.
102
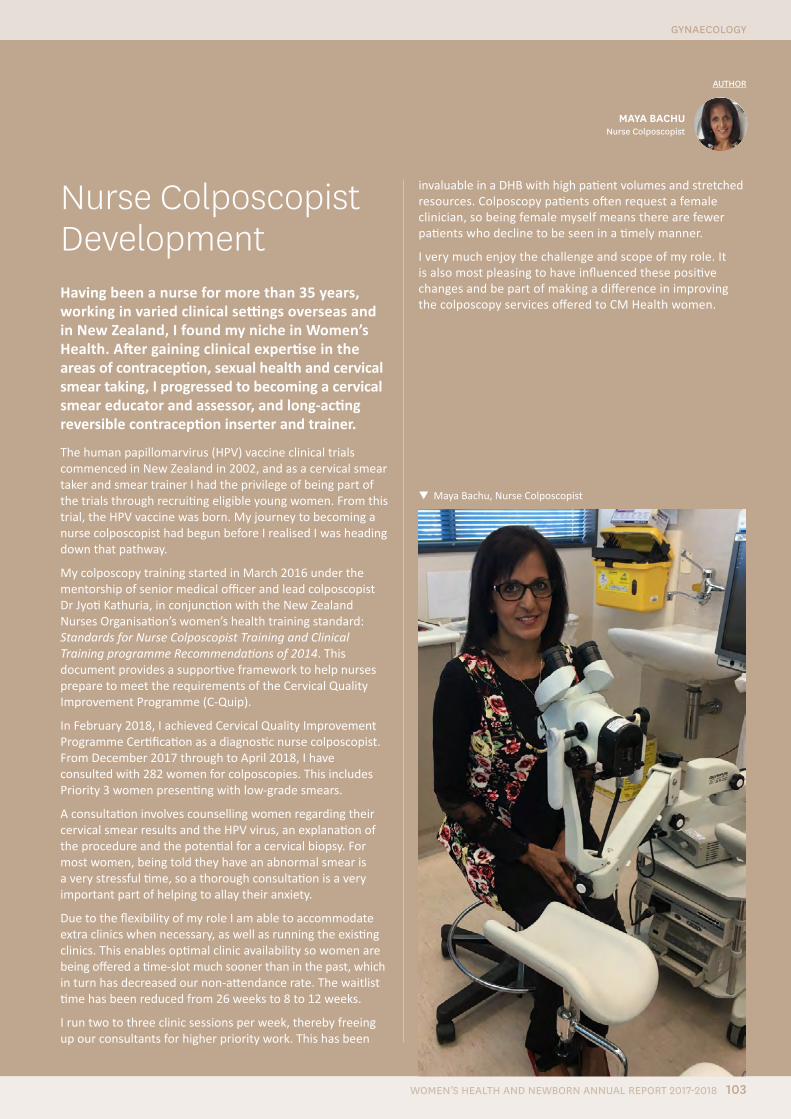
MAYA BACHUNurse Colposcopist
Nurse Colposcopist Development Having been a nurse for more than 35 years, working in varied clinical settings overseas and in New Zealand, I found my niche in Women’s Health. After gaining clinical expertise in the areas of contraception, sexual health and cervical smear taking, I progressed to becoming a cervical smear educator and assessor, and long-acting reversible contraception inserter and trainer.
The human papillomarvirus (HPV) vaccine clinical trials commenced in New Zealand in 2002, and as a cervical smear taker and smear trainer I had the privilege of being part of the trials through recruiting eligible young women. From this trial, the HPV vaccine was born. My journey to becoming a nurse colposcopist had begun before I realised I was heading down that pathway.
My colposcopy training started in March 2016 under the mentorship of senior medical officer and lead colposcopist Dr Jyoti Kathuria, in conjunction with the New Zealand Nurses Organisation’s women’s health training standard: Standards for Nurse Colposcopist Training and Clinical Training programme Recommendations of 2014. This document provides a supportive framework to help nurses prepare to meet the requirements of the Cervical Quality Improvement Programme (C-Quip).
In February 2018, I achieved Cervical Quality Improvement Programme Certification as a diagnostic nurse colposcopist. From December 2017 through to April 2018, I have consulted with 282 women for colposcopies. This includes Priority 3 women presenting with low-grade smears.
A consultation involves counselling women regarding their cervical smear results and the HPV virus, an explanation of the procedure and the potential for a cervical biopsy. For most women, being told they have an abnormal smear is a very stressful time, so a thorough consultation is a very important part of helping to allay their anxiety.
Due to the flexibility of my role I am able to accommodate extra clinics when necessary, as well as running the existing clinics. This enables optimal clinic availability so women are being offered a time-slot much sooner than in the past, which in turn has decreased our non-attendance rate. The waitlist time has been reduced from 26 weeks to 8 to 12 weeks.
I run two to three clinic sessions per week, thereby freeing up our consultants for higher priority work. This has been
invaluable in a DHB with high patient volumes and stretched resources. Colposcopy patients often request a female clinician, so being female myself means there are fewer patients who decline to be seen in a timely manner.
I very much enjoy the challenge and scope of my role. It is also most pleasing to have influenced these positive changes and be part of making a difference in improving the colposcopy services offered to CM Health women.
AUTHOR
Maya Bachu, Nurse Colposcopist
103
GYNAECOLOGY
WOMEN’S HEALTH AND NEWBORN ANNUAL REPORT 2017-2018
DR JYOTI KATHURIA Lead Colposcopist
AUTHOR
Colposcopy ServicesColposcopy Clinics at CM Health, where a detailed examination of a woman’s cervix is performed, are run from Module 10 at Manukau Super Clinic. There are on average 9 clinics every week and about 2000 women are seen annually (based on 2017/2018). The clinical information is recorded and stored electronically on Solutions Plus Database. There is direct correspondence to referrers (general practitioners and other smear takers) from the database which more recently can also be viewed in the Clinical Portal.
Women are seen if they have screen detected cytological abnormalities (cervical intra-epithelial neoplasia /CIN) a pre-cancerous abnormality, Human Papilloma Virus (HPV) positive status with recent colposcopic treatment or high grade cytological abnormality, clinically suspicious or abnormal cervix, recurrent post coital bleeding when other causes of post-coital bleeding (PCB) have been excluded.
The clinical practice is guided by the National Cervical Screening Guidelines. At the initial visit, a colposcopic assessment is performed and cervical biopsies obtained if indicated. If treatment is required, this is performed at the second visit. Cervical excision is performed by either a loop diathermy (Large Loop Excision of Transformation Zone / LLETZ) or a cold knife cone, as indicated. Three quarters of LLETZs are carried out in the clinic under local anaesthetic and the rest are under general anaesthesia in theatre. Common indications for general anaesthesia are woman’s preference, difficult access to cervix, large transformation zone or ectropion or need for additional gynaecological procedures.
The HPV immunisation is available through participating schools or from family doctors, local health centres and some Family Planning clinics. This is free for women and men aged 9-26 years. Every opportunity to encourage women to get immunised is taken and this is supported by providing written information.
The Colposcopy service is supported by the Community Liaison. This is a dedicated resource to engage with difficult to reach patients. This role has access to services in Primary Care to support the women to attend their appointments through education, personal/cultural support and provision of transport.
Eleven consultants and one nurse colposcopist currently provide colposcopy services and are supported by five colposcopy nurses. All practising Colposcopists have C-QuIp (Cervical Quality Improvement Programme) certification.
The Cervical Quality Improvement Program (C-QuIP) is a RANZCOG Quality Assurance program originally developed as an education and audit program for certification and recertification of health professionals performing colposcopy. C-QuIP aims to improve the care of women who are referred for colposcopy and treatment of screen detected abnormalities.
It is a requirement of RANZCOG that all trainees by end of year 4 complete an In Hospital Clinical Assessment (IHCA) in Colposcopy for diagnostic and therapeutic practice. The registrars perform colposcopies under supervision of the consultants and perform LLETZs in operating theatre and in clinic prior to the assessment. Currently four consultants are RANZCOG assessors for IHCA.
A Colposcopy Pathology / Cytology multidisciplinary meeting is held every 4 weeks. This is a forum where discordant cytology and histology, clinically challenging cases, young women (<25 yr old) with CIN2 are discussed. Attendance record is maintained and colposcopists can claim CME points from RANZCOG for attendance.
The Colposcopy unit was audited by the National Cervical Screening Programme in 2015 and found to be compliant in the ‘Providing a Colposcopy Service’ Policies and Standards.
104
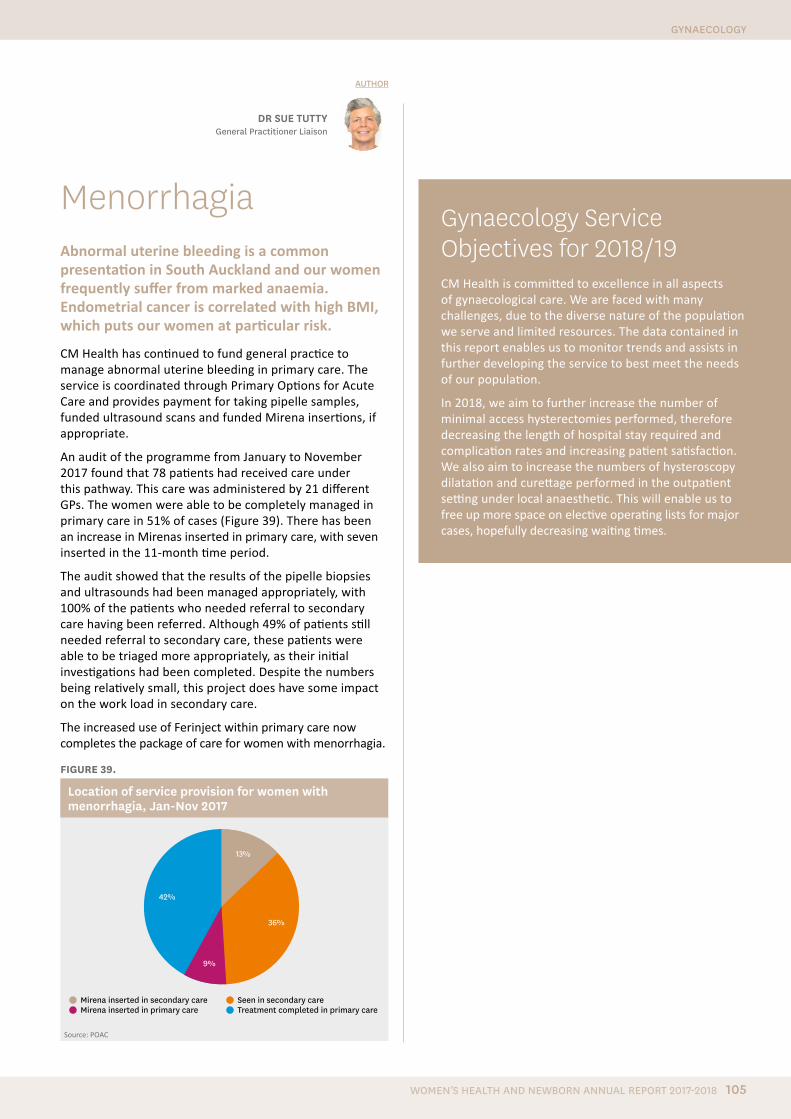
MenorrhagiaAbnormal uterine bleeding is a common presentation in South Auckland and our women frequently suffer from marked anaemia. Endometrial cancer is correlated with high BMI, which puts our women at particular risk.
CM Health has continued to fund general practice to manage abnormal uterine bleeding in primary care. The service is coordinated through Primary Options for Acute Care and provides payment for taking pipelle samples, funded ultrasound scans and funded Mirena insertions, if appropriate.
An audit of the programme from January to November 2017 found that 78 patients had received care under this pathway. This care was administered by 21 different GPs. The women were able to be completely managed in primary care in 51% of cases (Figure 39). There has been an increase in Mirenas inserted in primary care, with seven inserted in the 11-month time period.
The audit showed that the results of the pipelle biopsies and ultrasounds had been managed appropriately, with 100% of the patients who needed referral to secondary care having been referred. Although 49% of patients still needed referral to secondary care, these patients were able to be triaged more appropriately, as their initial investigations had been completed. Despite the numbers being relatively small, this project does have some impact on the work load in secondary care.
The increased use of Ferinject within primary care now completes the package of care for women with menorrhagia.
FIGURE 39.
Location of service provision for women with menorrhagia, Jan-Nov 2017
42%
13%
36%
9%
Mirena inserted in secondary care Mirena inserted in primary care
Seen in secondary care Treatment completed in primary care
Source: POAC
DR SUE TUTTYGeneral Practitioner Liaison
AUTHOR
Gynaecology Service Objectives for 2018/19CM Health is committed to excellence in all aspects of gynaecological care. We are faced with many challenges, due to the diverse nature of the population we serve and limited resources. The data contained in this report enables us to monitor trends and assists in further developing the service to best meet the needs of our population.
In 2018, we aim to further increase the number of minimal access hysterectomies performed, therefore decreasing the length of hospital stay required and complication rates and increasing patient satisfaction. We also aim to increase the numbers of hysteroscopy dilatation and curettage performed in the outpatient setting under local anaesthetic. This will enable us to free up more space on elective operating lists for major cases, hopefully decreasing waiting times.
105
GYNAECOLOGY
WOMEN’S HEALTH AND NEWBORN ANNUAL REPORT 2017-2018
Newborn Care at CM Health
106
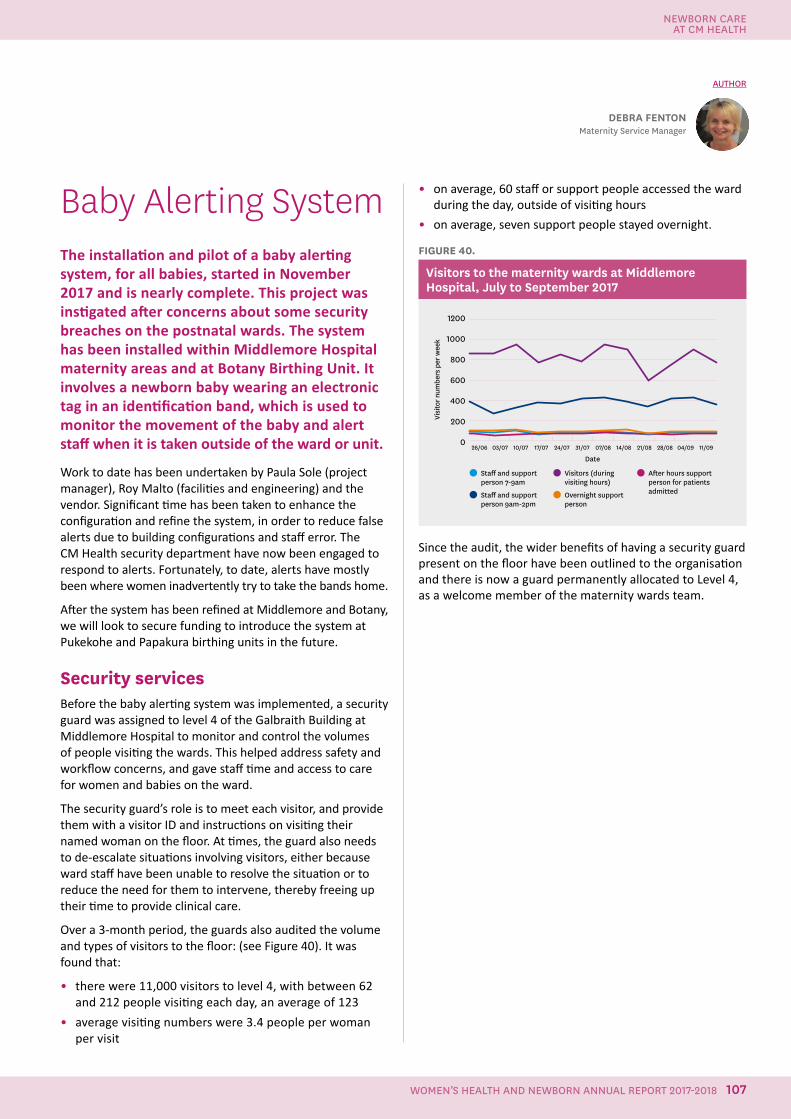
Newborn Care at CM Health
• on average, 60 staff or support people accessed the ward during the day, outside of visiting hours
• on average, seven support people stayed overnight.
FIGURE 40.
Visitors to the maternity wards at Middlemore Hospital, July to September 2017
1200
1000
800
600
400
200
0
Staff and support person 7-9am
Staff and support person 9am-2pm
Visitors (during visiting hours)
Overnight support person
After hours support person for patients admitted
26/06 03/07 10/07 17/07 24/07 31/07 07/08 14/08 21/08 28/08 04/09 11/09
Date
Visi
tor n
umbe
rs p
er w
eek
Since the audit, the wider benefits of having a security guard present on the floor have been outlined to the organisation and there is now a guard permanently allocated to Level 4, as a welcome member of the maternity wards team.
Baby Alerting System The installation and pilot of a baby alerting system, for all babies, started in November 2017 and is nearly complete. This project was instigated after concerns about some security breaches on the postnatal wards. The system has been installed within Middlemore Hospital maternity areas and at Botany Birthing Unit. It involves a newborn baby wearing an electronic tag in an identification band, which is used to monitor the movement of the baby and alert staff when it is taken outside of the ward or unit.
Work to date has been undertaken by Paula Sole (project manager), Roy Malto (facilities and engineering) and the vendor. Significant time has been taken to enhance the configuration and refine the system, in order to reduce false alerts due to building configurations and staff error. The CM Health security department have now been engaged to respond to alerts. Fortunately, to date, alerts have mostly been where women inadvertently try to take the bands home.
After the system has been refined at Middlemore and Botany, we will look to secure funding to introduce the system at Pukekohe and Papakura birthing units in the future.
Security services Before the baby alerting system was implemented, a security guard was assigned to level 4 of the Galbraith Building at Middlemore Hospital to monitor and control the volumes of people visiting the wards. This helped address safety and workflow concerns, and gave staff time and access to care for women and babies on the ward.
The security guard’s role is to meet each visitor, and provide them with a visitor ID and instructions on visiting their named woman on the floor. At times, the guard also needs to de-escalate situations involving visitors, either because ward staff have been unable to resolve the situation or to reduce the need for them to intervene, thereby freeing up their time to provide clinical care.
Over a 3-month period, the guards also audited the volume and types of visitors to the floor: (see Figure 40). It was found that:
• there were 11,000 visitors to level 4, with between 62 and 212 people visiting each day, an average of 123
• average visiting numbers were 3.4 people per woman per visit
DEBRA FENTONMaternity Service Manager
AUTHOR
NEWBORN CARE AT CM HEALTH
107WOMEN’S HEALTH AND NEWBORN ANNUAL REPORT 2017-2018

Implementation of the Neonatal Early Warning ScoreFollowing a serious adverse event review, it was recommended that a graphical recordings chart be introduced for at-risk neonates. The chart would show trends in neonatal vitals status, and provide guidance about when neonates should be referred for medical review and when an emergency code should be called. A multi-disciplinary steering group was established to design and implement a Neonatal Early Warning Score chart and accompanying guideline.
The Neonatal Early Warning Score chart was based on one currently in use at Canterbury DHB, and adapted to reflect local requirements. The chart will be standard documentation for all newborns and will be implemented across maternity services.
The chart will record the following parameters:
• respiratory rate
• work of breathing
• respiratory support
• oxygen saturations
• temperature
• heart rate
• tone and behaviour
• blood glucose.
The assigned score will provide clear guidance about when to escalate care and seek additional medical help at Middlemore Hospital and at CM Health community birthing units. Only babies with risk factors for sepsis or physiological deterioration will require ongoing monitoring.
A large pilot using the chart was undertaken in September 2017 in the Birthing and Assessment Unit, Maternity Ward North and Maternity Ward South, and Pukekohe, Papakura and Botany Downs community birthing units. Following the pilot, a few minor changes were made to the chart.
The planned implementation date was delayed until the procurement of equipment including additional oxygen saturation monitors. The NEWs chart and the accompanying guideline will be rolled out on 30 July 2018. This rollout will follow an education programme for all maternity staff and LMCs.
AUTHORS
DR CHRISTINE MCINTOSH General Practitioner Liaison
AUTHOR
Sudden Unexpected Death in InfancySouth Auckland families continue to be affected by sudden unexpected death in infancy (SUDI) at a rate of 1.06 infants per 1000 live births, higher than the national average of 0.73 per 1000 (NZ Mortality Review Group, 2016). It is well recognised that there is considerable disparity among the groups affected, with burden of SUDI suffered principally by Maaori and Pacific Island families. There has, however, been progress since 2012, with a 29% reduction in deaths nationally and particularly for Maaori infants.40
On 2 August 2017, the Health Minister Jonathan Coleman launched the new National Sudden Unexpected Death in Infancy Coordination service provided by Hāpai te Hauora. The intention is to strengthen the support around the two biggest contributors to SUDI risk for New Zealand babies – exposure to tobacco during pregnancy and bed sharing. Support will be delivered through smoke-free incentive programmes and provision of safe-sleep devices, such as Pepi-pod and wahakura, for families who need them.
In addition, there will be an emphasis on ensuring that SUDI prevention support incorporates all of the factors that reduce risk. Support will be targeted at babies who have been determined by a standardised needs assessment to have an increased need for SUDI protection.
The national programme is supported by regional coordinators, with new local DHB funding to implement local SUDI prevention care. Consequently, over the later part of 2017 and early 2018 the CM Health Safe Sleep Programme has undergone a process of reassessment and planning.
Safe Sleep programmeThe CM Health Safe Sleep programme was reviewed from January 2017 to March 2018. During this time, at least 681 safe-sleep devices (585 Pepi-pod and 96 wahakura) were distributed to families, of which 32% went to Maaori infants, 53% to Pacific infants and 17% to mothers who were very late registering with a LMC or had no antenatal care during pregnancy.
KATHY OGILVY Professional Development
Team Lead, Women’s Health and Kidz First
DR LESA FREEMANClinical Quality and Risk Manager, Kidz First and
Women’s Health
40. Mitchell EA, Cowan S, Tipene-Leach D. The recent fall in post-perinatal mortality in New Zealand and the Safe Sleep Programme. Acta Paediatrica 2016; 105(11):1312–20.
108
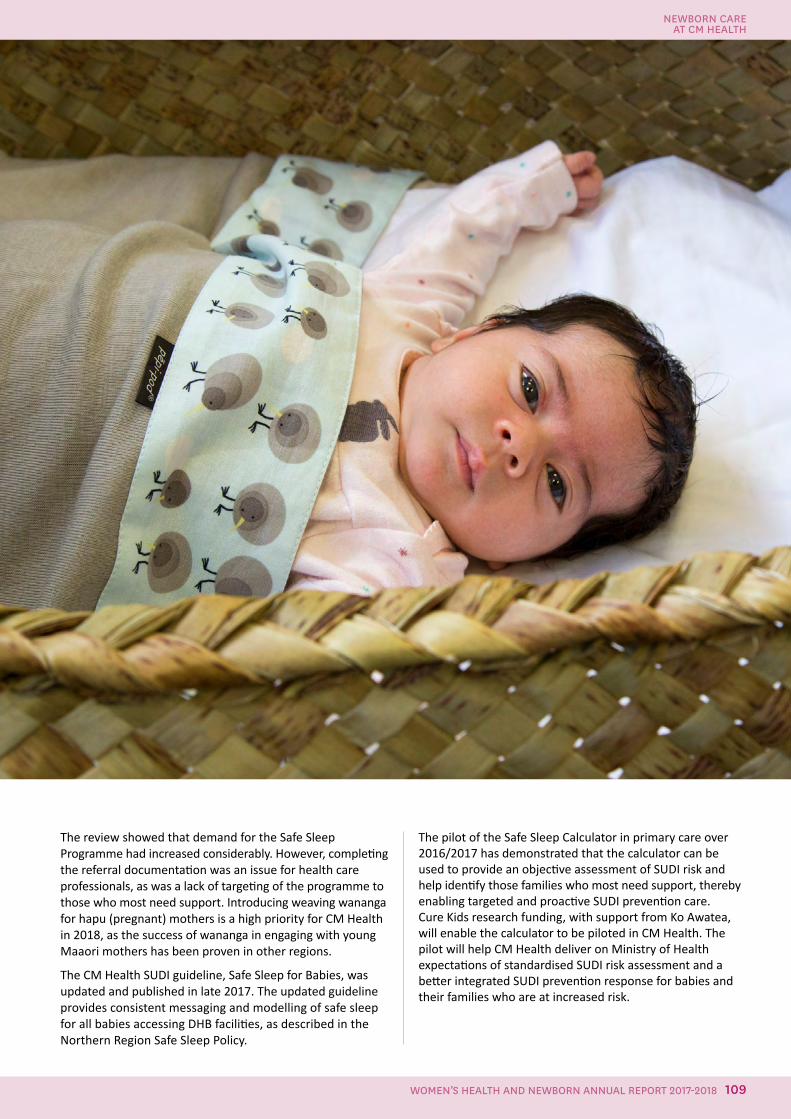
The review showed that demand for the Safe Sleep Programme had increased considerably. However, completing the referral documentation was an issue for health care professionals, as was a lack of targeting of the programme to those who most need support. Introducing weaving wananga for hapu (pregnant) mothers is a high priority for CM Health in 2018, as the success of wananga in engaging with young Maaori mothers has been proven in other regions.
The CM Health SUDI guideline, Safe Sleep for Babies, was updated and published in late 2017. The updated guideline provides consistent messaging and modelling of safe sleep for all babies accessing DHB facilities, as described in the Northern Region Safe Sleep Policy.
The pilot of the Safe Sleep Calculator in primary care over 2016/2017 has demonstrated that the calculator can be used to provide an objective assessment of SUDI risk and help identify those families who most need support, thereby enabling targeted and proactive SUDI prevention care. Cure Kids research funding, with support from Ko Awatea, will enable the calculator to be piloted in CM Health. The pilot will help CM Health deliver on Ministry of Health expectations of standardised SUDI risk assessment and a better integrated SUDI prevention response for babies and their families who are at increased risk.
NEWBORN CARE AT CM HEALTH
109WOMEN’S HEALTH AND NEWBORN ANNUAL REPORT 2017-2018
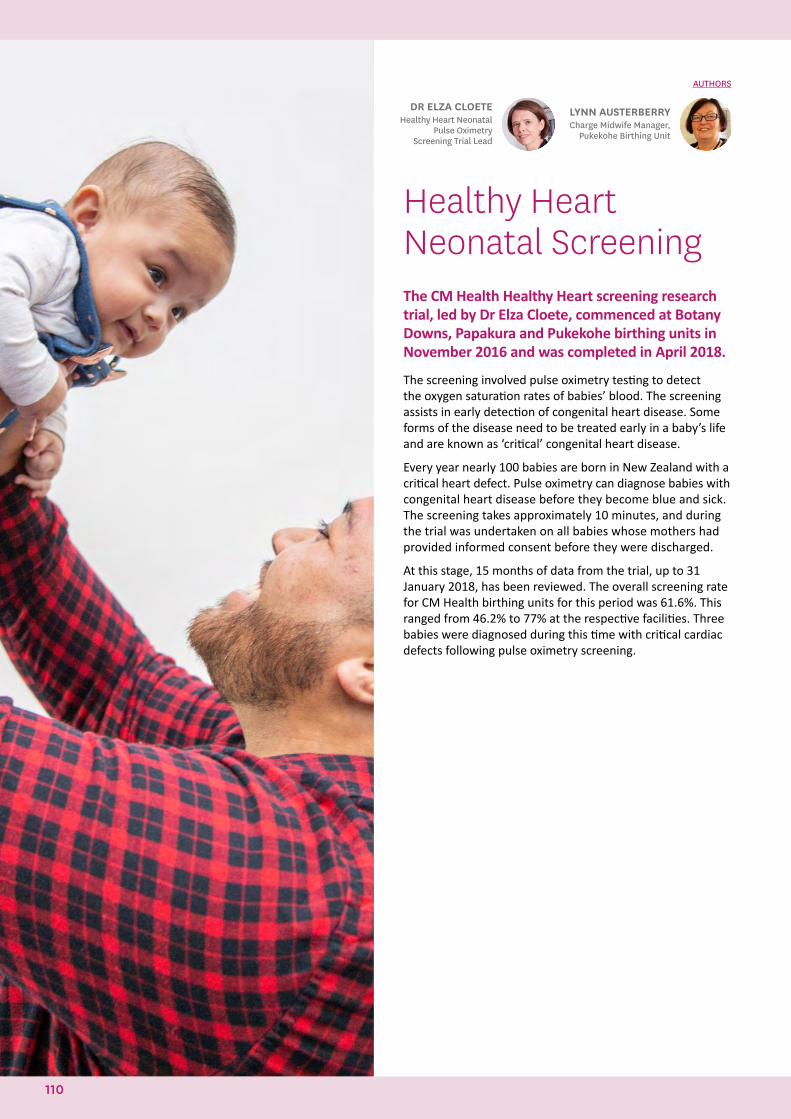
Healthy Heart Neonatal Screening The CM Health Healthy Heart screening research trial, led by Dr Elza Cloete, commenced at Botany Downs, Papakura and Pukekohe birthing units in November 2016 and was completed in April 2018.
The screening involved pulse oximetry testing to detect the oxygen saturation rates of babies’ blood. The screening assists in early detection of congenital heart disease. Some forms of the disease need to be treated early in a baby’s life and are known as ‘critical’ congenital heart disease.
Every year nearly 100 babies are born in New Zealand with a critical heart defect. Pulse oximetry can diagnose babies with congenital heart disease before they become blue and sick. The screening takes approximately 10 minutes, and during the trial was undertaken on all babies whose mothers had provided informed consent before they were discharged.
At this stage, 15 months of data from the trial, up to 31 January 2018, has been reviewed. The overall screening rate for CM Health birthing units for this period was 61.6%. This ranged from 46.2% to 77% at the respective facilities. Three babies were diagnosed during this time with critical cardiac defects following pulse oximetry screening.
LYNN AUSTERBERRYCharge Midwife Manager,
Pukekohe Birthing Unit
DR ELZA CLOETEHealthy Heart Neonatal
Pulse Oximetry Screening Trial Lead
AUTHORS
110
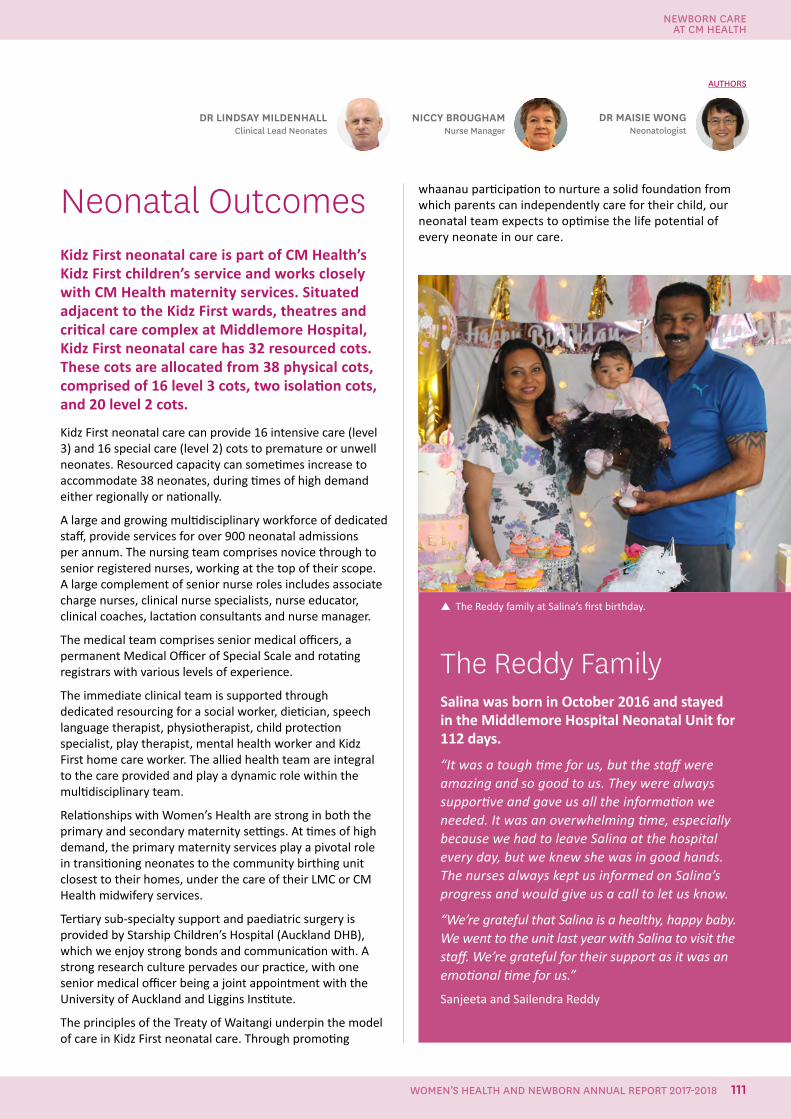
NICCY BROUGHAMNurse Manager
Neonatal OutcomesKidz First neonatal care is part of CM Health’s Kidz First children’s service and works closely with CM Health maternity services. Situated adjacent to the Kidz First wards, theatres and critical care complex at Middlemore Hospital, Kidz First neonatal care has 32 resourced cots. These cots are allocated from 38 physical cots, comprised of 16 level 3 cots, two isolation cots, and 20 level 2 cots.
Kidz First neonatal care can provide 16 intensive care (level 3) and 16 special care (level 2) cots to premature or unwell neonates. Resourced capacity can sometimes increase to accommodate 38 neonates, during times of high demand either regionally or nationally.
A large and growing multidisciplinary workforce of dedicated staff, provide services for over 900 neonatal admissions per annum. The nursing team comprises novice through to senior registered nurses, working at the top of their scope. A large complement of senior nurse roles includes associate charge nurses, clinical nurse specialists, nurse educator, clinical coaches, lactation consultants and nurse manager.
The medical team comprises senior medical officers, a permanent Medical Officer of Special Scale and rotating registrars with various levels of experience.
The immediate clinical team is supported through dedicated resourcing for a social worker, dietician, speech language therapist, physiotherapist, child protection specialist, play therapist, mental health worker and Kidz First home care worker. The allied health team are integral to the care provided and play a dynamic role within the multidisciplinary team.
Relationships with Women’s Health are strong in both the primary and secondary maternity settings. At times of high demand, the primary maternity services play a pivotal role in transitioning neonates to the community birthing unit closest to their homes, under the care of their LMC or CM Health midwifery services.
Tertiary sub-specialty support and paediatric surgery is provided by Starship Children’s Hospital (Auckland DHB), which we enjoy strong bonds and communication with. A strong research culture pervades our practice, with one senior medical officer being a joint appointment with the University of Auckland and Liggins Institute.
The principles of the Treaty of Waitangi underpin the model of care in Kidz First neonatal care. Through promoting
whaanau participation to nurture a solid foundation from which parents can independently care for their child, our neonatal team expects to optimise the life potential of every neonate in our care.
DR MAISIE WONGNeonatologist
DR LINDSAY MILDENHALLClinical Lead Neonates
AUTHORS
The Reddy family at Salina’s first birthday.
The Reddy FamilySalina was born in October 2016 and stayed in the Middlemore Hospital Neonatal Unit for 112 days.
“It was a tough time for us, but the staff were amazing and so good to us. They were always supportive and gave us all the information we needed. It was an overwhelming time, especially because we had to leave Salina at the hospital every day, but we knew she was in good hands. The nurses always kept us informed on Salina’s progress and would give us a call to let us know.
“We’re grateful that Salina is a healthy, happy baby. We went to the unit last year with Salina to visit the staff. We’re grateful for their support as it was an emotional time for us.”
Sanjeeta and Sailendra Reddy
NEWBORN CARE AT CM HEALTH
111WOMEN’S HEALTH AND NEWBORN ANNUAL REPORT 2017-2018
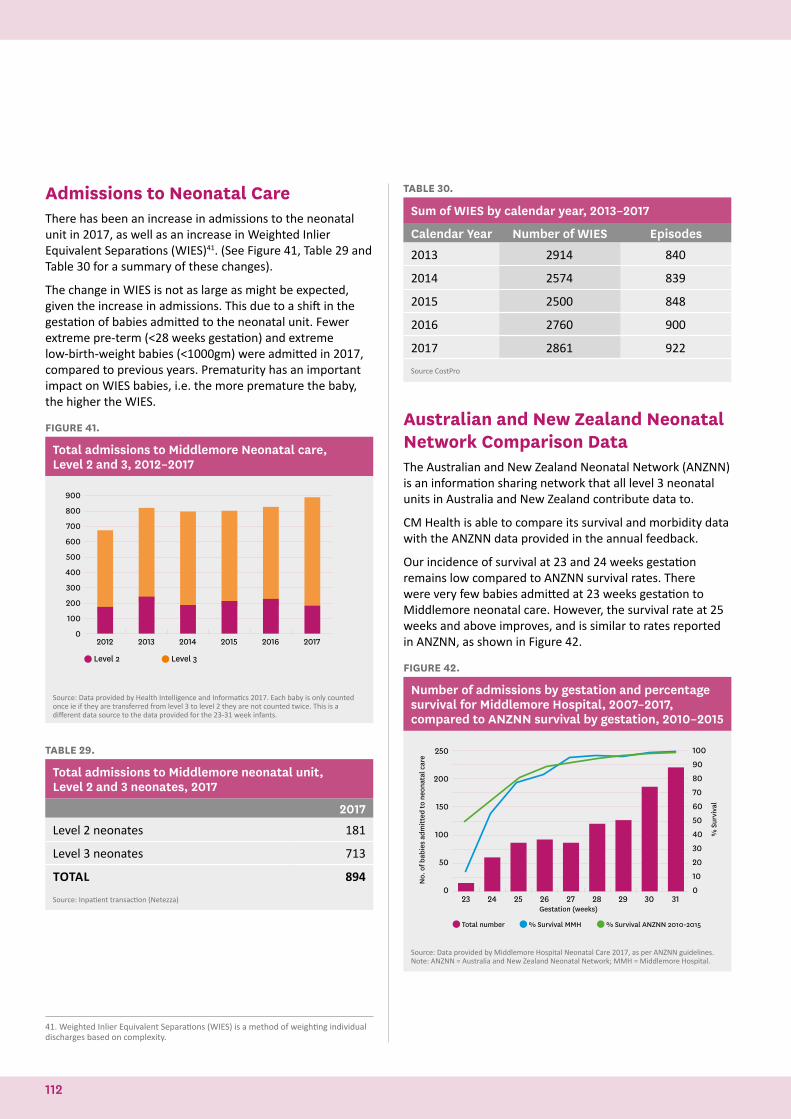
Admissions to Neonatal CareThere has been an increase in admissions to the neonatal unit in 2017, as well as an increase in Weighted Inlier Equivalent Separations (WIES)41. (See Figure 41, Table 29 and Table 30 for a summary of these changes).
The change in WIES is not as large as might be expected, given the increase in admissions. This due to a shift in the gestation of babies admitted to the neonatal unit. Fewer extreme pre-term (<28 weeks gestation) and extreme low-birth-weight babies (<1000gm) were admitted in 2017, compared to previous years. Prematurity has an important impact on WIES babies, i.e. the more premature the baby, the higher the WIES.
FIGURE 41.
Total admissions to Middlemore Neonatal care, Level 2 and 3, 2012–2017
Level 2 Level 3
900
800
700
600
500
400
300
200
100
02012 2013 2014 2015 2016 2017
Source: Data provided by Health Intelligence and Informatics 2017. Each baby is only counted once ie if they are transferred from level 3 to level 2 they are not counted twice. This is a different data source to the data provided for the 23-31 week infants.
TABLE 29.
Total admissions to Middlemore neonatal unit, Level 2 and 3 neonates, 2017
2017
Level 2 neonates 181
Level 3 neonates 713
TOTAL 894
Source: Inpatient transaction (Netezza)
41. Weighted Inlier Equivalent Separations (WIES) is a method of weighting individual discharges based on complexity.
TABLE 30.
Sum of WIES by calendar year, 2013–2017
Calendar Year Number of WIES Episodes
2013 2914 840
2014 2574 839
2015 2500 848
2016 2760 900
2017 2861 922
Source CostPro
Australian and New Zealand Neonatal Network Comparison DataThe Australian and New Zealand Neonatal Network (ANZNN) is an information sharing network that all level 3 neonatal units in Australia and New Zealand contribute data to.
CM Health is able to compare its survival and morbidity data with the ANZNN data provided in the annual feedback.
Our incidence of survival at 23 and 24 weeks gestation remains low compared to ANZNN survival rates. There were very few babies admitted at 23 weeks gestation to Middlemore neonatal care. However, the survival rate at 25 weeks and above improves, and is similar to rates reported in ANZNN, as shown in Figure 42.
FIGURE 42.
Number of admissions by gestation and percentage survival for Middlemore Hospital, 2007–2017, compared to ANZNN survival by gestation, 2010–2015
Total number % Survival MMH % Survival ANZNN 2010-2015
250
200
150
100
50
0
100
90
80
70
60
50
40
30
20
10
0
No.
of b
abie
s ad
mitt
ed to
neo
nata
l car
e
% S
urvi
val
23 24 25 26 27 28 29 30 31Gestation (weeks)
Source: Data provided by Middlemore Hospital Neonatal Care 2017, as per ANZNN guidelines. Note: ANZNN = Australia and New Zealand Neonatal Network; MMH = Middlemore Hospital.
112
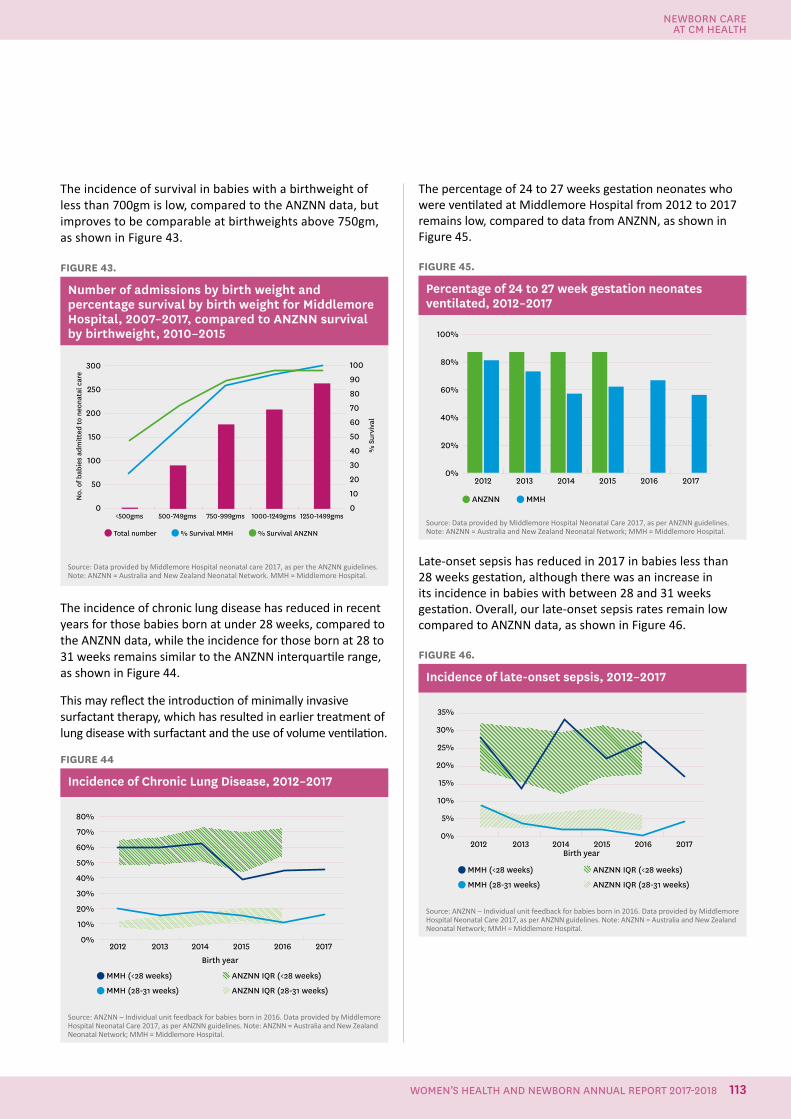
The incidence of survival in babies with a birthweight of less than 700gm is low, compared to the ANZNN data, but improves to be comparable at birthweights above 750gm, as shown in Figure 43.
FIGURE 43.
Number of admissions by birth weight and percentage survival by birth weight for Middlemore Hospital, 2007–2017, compared to ANZNN survival by birthweight, 2010–2015
300
250
200
150
100
50
0
100
90
80
70
60
50
40
30
20
10
0
No.
of b
abie
s ad
mitt
ed to
neo
nata
l car
e
% S
urvi
val
<500gms 500-749gms 750-999gms 1000-1249gms 1250-1499gms
Total number % Survival MMH % Survival ANZNN
Source: Data provided by Middlemore Hospital neonatal care 2017, as per the ANZNN guidelines. Note: ANZNN = Australia and New Zealand Neonatal Network. MMH = Middlemore Hospital.
The incidence of chronic lung disease has reduced in recent years for those babies born at under 28 weeks, compared to the ANZNN data, while the incidence for those born at 28 to 31 weeks remains similar to the ANZNN interquartile range, as shown in Figure 44.
This may reflect the introduction of minimally invasive surfactant therapy, which has resulted in earlier treatment of lung disease with surfactant and the use of volume ventilation.
FIGURE 44
Incidence of Chronic Lung Disease, 2012–2017
MMH (<28 weeks)
MMH (28-31 weeks)
ANZNN IQR (<28 weeks)
ANZNN IQR (28-31 weeks)
Birth year
80%
70%
60%
50%
40%
30%
20%
10%
0%2012 2013 2014 2015 2016 2017
Source: ANZNN – Individual unit feedback for babies born in 2016. Data provided by Middlemore Hospital Neonatal Care 2017, as per ANZNN guidelines. Note: ANZNN = Australia and New Zealand Neonatal Network; MMH = Middlemore Hospital.
The percentage of 24 to 27 weeks gestation neonates who were ventilated at Middlemore Hospital from 2012 to 2017 remains low, compared to data from ANZNN, as shown in Figure 45.
FIGURE 45.
Percentage of 24 to 27 week gestation neonates ventilated, 2012–2017
2012 2013 2014 2015 2016 2017
100%
80%
60%
40%
20%
0%
ANZNN MMH
Source: Data provided by Middlemore Hospital Neonatal Care 2017, as per ANZNN guidelines. Note: ANZNN = Australia and New Zealand Neonatal Network; MMH = Middlemore Hospital.
Late-onset sepsis has reduced in 2017 in babies less than 28 weeks gestation, although there was an increase in its incidence in babies with between 28 and 31 weeks gestation. Overall, our late-onset sepsis rates remain low compared to ANZNN data, as shown in Figure 46.
FIGURE 46.
Incidence of late-onset sepsis, 2012–2017
35%
30%
25%
20%
15%
10%
5%
0%2012 2013 2014 2015 2016 2017
MMH (<28 weeks)
MMH (28-31 weeks)
ANZNN IQR (<28 weeks)
ANZNN IQR (28-31 weeks)
Birth year
Source: ANZNN – Individual unit feedback for babies born in 2016. Data provided by Middlemore Hospital Neonatal Care 2017, as per ANZNN guidelines. Note: ANZNN = Australia and New Zealand Neonatal Network; MMH = Middlemore Hospital.
NEWBORN CARE AT CM HEALTH
113WOMEN’S HEALTH AND NEWBORN ANNUAL REPORT 2017-2018
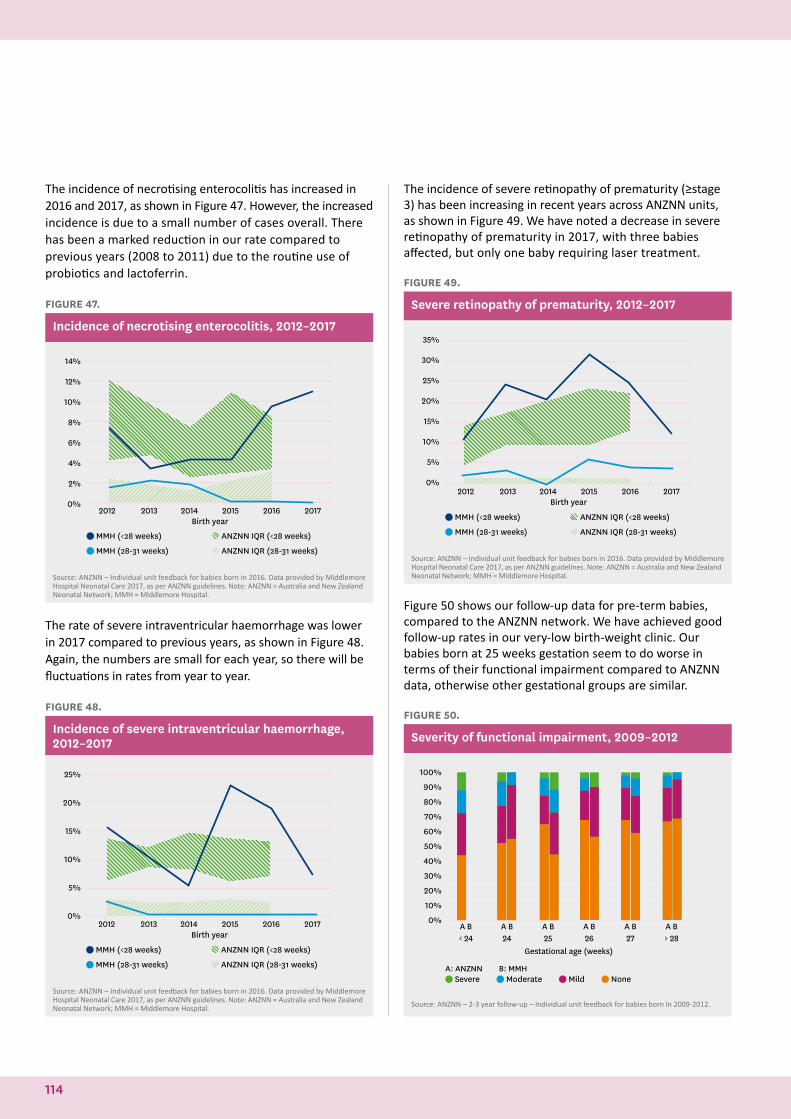
The incidence of necrotising enterocolitis has increased in 2016 and 2017, as shown in Figure 47. However, the increased incidence is due to a small number of cases overall. There has been a marked reduction in our rate compared to previous years (2008 to 2011) due to the routine use of probiotics and lactoferrin.
FIGURE 47.
Incidence of necrotising enterocolitis, 2012–2017
2012 2013 2014 2015 2016 2017Birth year
14%
12%
10%
8%
6%
4%
2%
0%
MMH (<28 weeks)
MMH (28-31 weeks)
ANZNN IQR (<28 weeks)
ANZNN IQR (28-31 weeks)
Source: ANZNN – Individual unit feedback for babies born in 2016. Data provided by Middlemore Hospital Neonatal Care 2017, as per ANZNN guidelines. Note: ANZNN = Australia and New Zealand Neonatal Network; MMH = Middlemore Hospital.
The rate of severe intraventricular haemorrhage was lower in 2017 compared to previous years, as shown in Figure 48. Again, the numbers are small for each year, so there will be fluctuations in rates from year to year.
FIGURE 48.
Incidence of severe intraventricular haemorrhage, 2012–2017
2012 2013 2014 2015 2016 2017Birth year
25%
20%
15%
10%
5%
0%
MMH (<28 weeks)
MMH (28-31 weeks)
ANZNN IQR (<28 weeks)
ANZNN IQR (28-31 weeks)
Source: ANZNN – Individual unit feedback for babies born in 2016. Data provided by Middlemore Hospital Neonatal Care 2017, as per ANZNN guidelines. Note: ANZNN = Australia and New Zealand Neonatal Network; MMH = Middlemore Hospital.
The incidence of severe retinopathy of prematurity (≥stage 3) has been increasing in recent years across ANZNN units, as shown in Figure 49. We have noted a decrease in severe retinopathy of prematurity in 2017, with three babies affected, but only one baby requiring laser treatment.
FIGURE 49.
Severe retinopathy of prematurity, 2012–2017
2012 2013 2014 2015 2016 2017Birth year
MMH (<28 weeks)
MMH (28-31 weeks)
ANZNN IQR (<28 weeks)
ANZNN IQR (28-31 weeks)
35%
30%
25%
20%
15%
10%
5%
0%
Source: ANZNN – Individual unit feedback for babies born in 2016. Data provided by Middlemore Hospital Neonatal Care 2017, as per ANZNN guidelines. Note: ANZNN = Australia and New Zealand Neonatal Network; MMH = Middlemore Hospital.
Figure 50 shows our follow-up data for pre-term babies, compared to the ANZNN network. We have achieved good follow-up rates in our very-low birth-weight clinic. Our babies born at 25 weeks gestation seem to do worse in terms of their functional impairment compared to ANZNN data, otherwise other gestational groups are similar.
FIGURE 50.
Severity of functional impairment, 2009–2012
A B A B A B A B A B A B
100%
90%
80%
70%
60%
50%
40%
30%
20%
10%
0%
< 24 24 25 26 27 > 28Gestational age (weeks)
Severe Moderate Mild NoneA: ANZNN B: MMH
Source: ANZNN – 2-3 year follow-up – Individual unit feedback for babies born in 2009-2012.
114
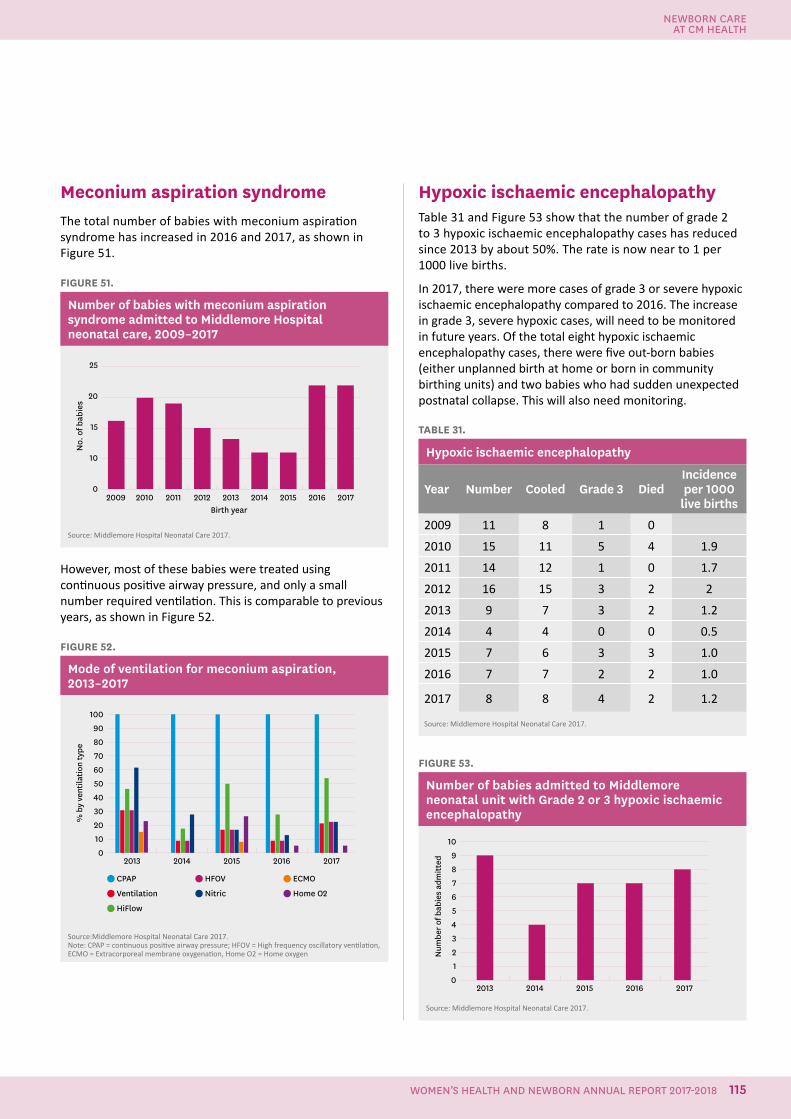
Meconium aspiration syndromeThe total number of babies with meconium aspiration syndrome has increased in 2016 and 2017, as shown in Figure 51.
FIGURE 51.
Number of babies with meconium aspiration syndrome admitted to Middlemore Hospital neonatal care, 2009–2017
25
20
15
10
0
No.
of b
abie
s
2009 2010 2011 2012 2013 2014 2015 2016 2017Birth year
Source: Middlemore Hospital Neonatal Care 2017.
However, most of these babies were treated using continuous positive airway pressure, and only a small number required ventilation. This is comparable to previous years, as shown in Figure 52.
FIGURE 52.
Mode of ventilation for meconium aspiration, 2013–2017
CPAP
Ventilation
HiFlow
HFOV
Nitric
ECMO
Home O2
2013 2014 2015 2016 2017
100
90
80
70
60
50
40
30
20
10
0
% b
y ve
ntila
tion
type
Source:Middlemore Hospital Neonatal Care 2017.Note: CPAP = continuous positive airway pressure; HFOV = High frequency oscillatory ventilation, ECMO = Extracorporeal membrane oxygenation, Home O2 = Home oxygen
Hypoxic ischaemic encephalopathyTable 31 and Figure 53 show that the number of grade 2 to 3 hypoxic ischaemic encephalopathy cases has reduced since 2013 by about 50%. The rate is now near to 1 per 1000 live births.
In 2017, there were more cases of grade 3 or severe hypoxic ischaemic encephalopathy compared to 2016. The increase in grade 3, severe hypoxic cases, will need to be monitored in future years. Of the total eight hypoxic ischaemic encephalopathy cases, there were five out-born babies (either unplanned birth at home or born in community birthing units) and two babies who had sudden unexpected postnatal collapse. This will also need monitoring.
TABLE 31.
Hypoxic ischaemic encephalopathy
Year Number Cooled Grade 3 DiedIncidenceper 1000
live births
2009 11 8 1 0
2010 15 11 5 4 1.9
2011 14 12 1 0 1.7
2012 16 15 3 2 2
2013 9 7 3 2 1.2
2014 4 4 0 0 0.5
2015 7 6 3 3 1.0
2016 7 7 2 2 1.0
2017 8 8 4 2 1.2
Source: Middlemore Hospital Neonatal Care 2017.
FIGURE 53.
Number of babies admitted to Middlemore neonatal unit with Grade 2 or 3 hypoxic ischaemic encephalopathy
2013 2014 2015 2016 2017
10
9
8
7
6
5
4
3
2
1
0
Num
ber o
f bab
ies
adm
itted
Source: Middlemore Hospital Neonatal Care 2017.
NEWBORN CARE AT CM HEALTH
115WOMEN’S HEALTH AND NEWBORN ANNUAL REPORT 2017-2018
DR PIP ANDERSONPublic Health Physician
AUTHOR
Perinatal MortalityOne of the most significant outcomes for maternity care is the rate of perinatal deaths. This data is collated and reported by the Perinatal and Maternal Mortality Review Committee. The committee also comments on maternity mortality, but this is not analysed by CM Health as the numbers are small.
In the Perinatal and Maternal Mortality Review Committee’s fifth annual report in 2011, the unadjusted perinatal mortality rate for women living in Counties Manukau for the 3-year period from 2007 to 2009 (inclusive) was 13.7 babies per 1000 births, which was significantly higher than the national rate of 10.8 babies per 1000 births.42
In her 2011 report, Jackson concluded that it is likely that all or most of the variation in perinatal mortality across the DHBs in New Zealand could be accounted for by differences in the population structure. This assertion was supported by the multivariate analysis she undertook which:
…examined the odds of a stillbirth or neonatal death by ethnic group after adjusting for exposure to socio-economic deprivation, parity, smoking, maternity provider, SGA, gestation, or multiple birth in CMDHB women who delivered in a CMDHB facility during 2007-09. This analysis found that ethnicity was not an independent risk factor for a perinatal death i.e. it is not being Maaori or Pacific that places you at higher risk. It is an increased odds of exposure to risk factors such as smoking, obesity, premature birth etc. A review of the main risk factors for perinatal mortality revealed that CMDHB women, and CMDHB Maaori and Pacific women in particular, carry a higher burden of the main drivers of perinatal mortality than women living across New Zealand as a whole.43
The Perinatal and Maternal Mortality Review Committee reported in 2017 that the unadjusted perinatal mortality rate in CM Health was 14.7/1000 births in 2015 which was significantly higher than the New Zealand perinatal mortality rate of 9.7/1000 births for the same time period and had not decreased in the time interval since the 2011 report.44 In addition, women living in Counties Manukau were noted to have a significantly higher stillbirth rate and neonatal death rate than the rest of New Zealand.
42. Perinatal and Maternal Mortality Review Committee. 2011. Fifth Annual Report of the Perinatal and Maternal Mortality Review Committee: Reporting Mortality 2009. Wellington, Health Quality and Safety Commission.43. Jackson, C. 2011. Perinatal Mortality in Counties Manukau. CM Health Internal document. Available https://cmhealth.hanz.health.nz/Womens Health/Reports and Publications44. Perinatal and Maternal Mortality Review Committee. 2017. Eleventh report. Annual report of the perinatal and Maternal Mortality Review Committee: Reporting Mortality 2017. Wellington, Health Quality and Safety Commission.
Eleventh Annual Report of the Perinatal and Maternal Mortality Review Committee
Reporting mortality and morbidity 2015
Seventh Report to the Health Quality & Safety Commission New Zealand
JUNE 2017
116

NEWBORN CARE AT CM HEALTH
117WOMEN’S HEALTH AND NEWBORN ANNUAL REPORT 2017-2018
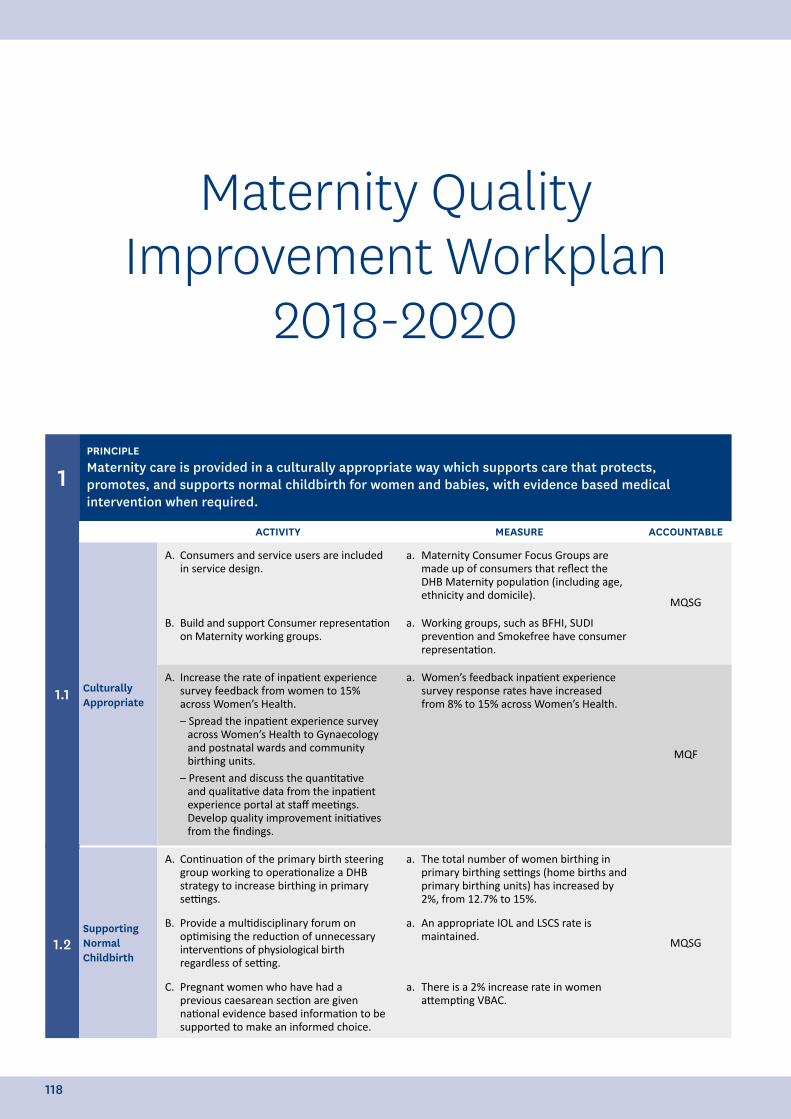
Maternity Quality Improvement Workplan
2018-2020
1PRINCIPLEMaternity care is provided in a culturally appropriate way which supports care that protects, promotes, and supports normal childbirth for women and babies, with evidence based medical intervention when required.
ACTIVITY MEASURE ACCOUNTABLE
1.1 Culturally Appropriate
A. Consumers and service users are included in service design.
a. Maternity Consumer Focus Groups are made up of consumers that reflect the DHB Maternity population (including age, ethnicity and domicile).
MQSG
B. Build and support Consumer representation on Maternity working groups.
a. Working groups, such as BFHI, SUDI prevention and Smokefree have consumer representation.
A. Increase the rate of inpatient experience survey feedback from women to 15% across Women’s Health.– Spread the inpatient experience survey
across Women’s Health to Gynaecology and postnatal wards and community birthing units.
– Present and discuss the quantitative and qualitative data from the inpatient experience portal at staff meetings. Develop quality improvement initiatives from the findings.
a. Women’s feedback inpatient experience survey response rates have increased from 8% to 15% across Women’s Health.
MQF
1.2Supporting Normal Childbirth
A. Continuation of the primary birth steering group working to operationalize a DHB strategy to increase birthing in primary settings.
a. The total number of women birthing in primary birthing settings (home births and primary birthing units) has increased by 2%, from 12.7% to 15%.
MQSG
B. Provide a multidisciplinary forum on optimising the reduction of unnecessary interventions of physiological birth regardless of setting.
a. An appropriate IOL and LSCS rate is maintained.
C. Pregnant women who have had a previous caesarean section are given national evidence based information to be supported to make an informed choice.
a. There is a 2% increase rate in women attempting VBAC.
v
118
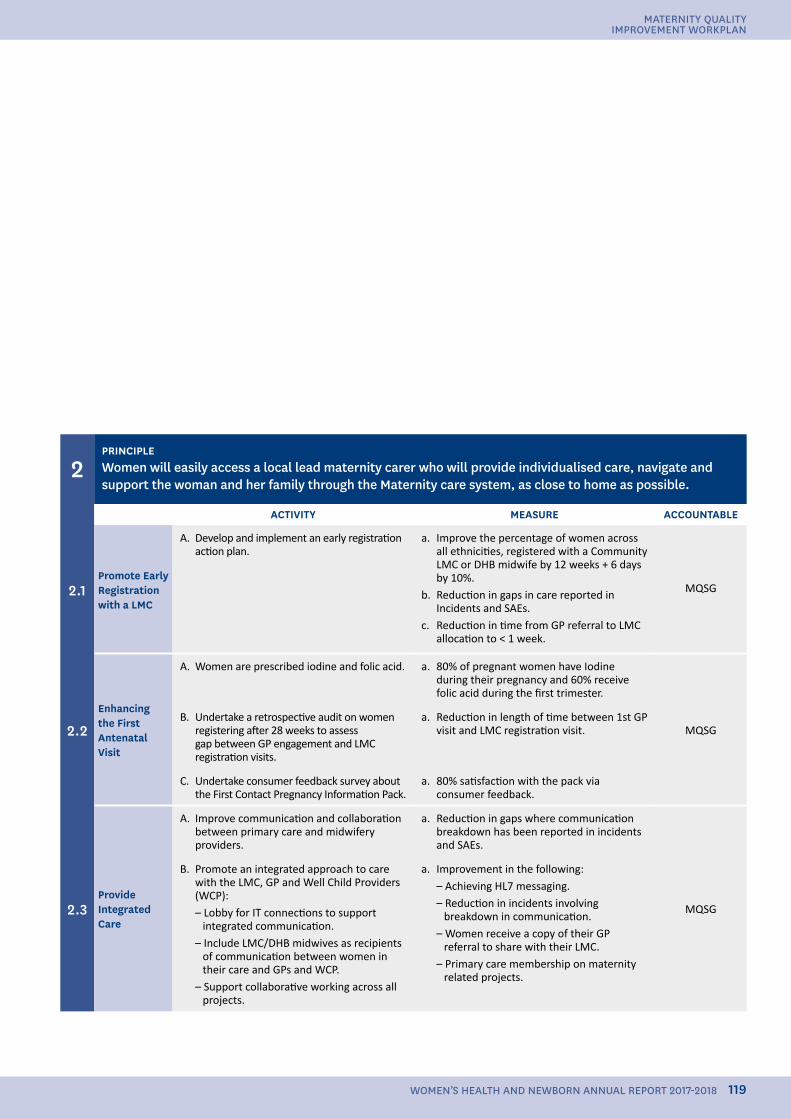
2PRINCIPLEWomen will easily access a local lead maternity carer who will provide individualised care, navigate and support the woman and her family through the Maternity care system, as close to home as possible.
ACTIVITY MEASURE ACCOUNTABLE
2.1Promote Early Registration with a LMC
A. Develop and implement an early registration action plan.
a. Improve the percentage of women across all ethnicities, registered with a Community LMC or DHB midwife by 12 weeks + 6 days by 10%.
b. Reduction in gaps in care reported in Incidents and SAEs.
c. Reduction in time from GP referral to LMC allocation to < 1 week.
MQSG
2.2Enhancing the First Antenatal Visit
A. Women are prescribed iodine and folic acid. a. 80% of pregnant women have Iodine during their pregnancy and 60% receive folic acid during the first trimester.
MQSGB. Undertake a retrospective audit on women
registering after 28 weeks to assess gap between GP engagement and LMC registration visits.
a. Reduction in length of time between 1st GP visit and LMC registration visit.
C. Undertake consumer feedback survey about the First Contact Pregnancy Information Pack.
a. 80% satisfaction with the pack via consumer feedback.
2.3Provide Integrated Care
A. Improve communication and collaboration between primary care and midwifery providers.
a. Reduction in gaps where communication breakdown has been reported in incidents and SAEs.
MQSG
B. Promote an integrated approach to care with the LMC, GP and Well Child Providers (WCP):– Lobby for IT connections to support
integrated communication.– Include LMC/DHB midwives as recipients
of communication between women in their care and GPs and WCP.
– Support collaborative working across all projects.
a. Improvement in the following:– Achieving HL7 messaging.– Reduction in incidents involving
breakdown in communication.– Women receive a copy of their GP
referral to share with their LMC.– Primary care membership on maternity
related projects.
119
MATERNITY QUALITY IMPROVEMENT WORKPLAN
WOMEN’S HEALTH AND NEWBORN ANNUAL REPORT 2017-2018
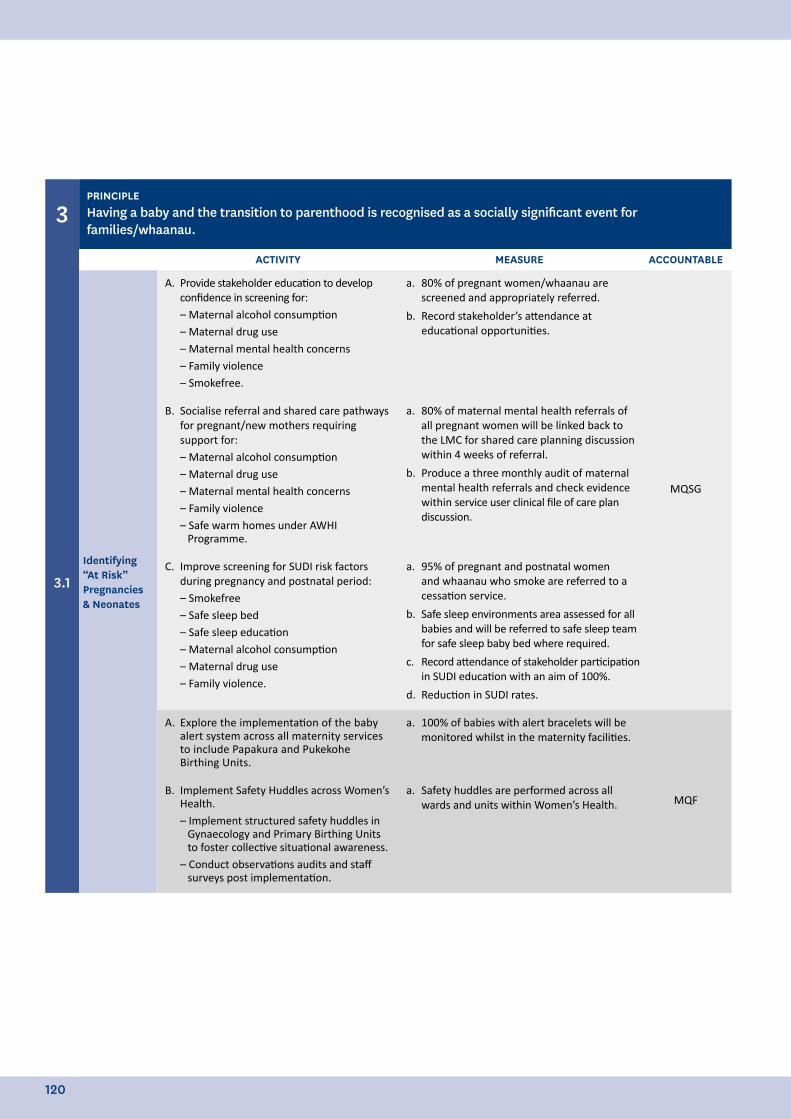
3PRINCIPLEHaving a baby and the transition to parenthood is recognised as a socially significant event for families/whaanau.
ACTIVITY MEASURE ACCOUNTABLE
3.1Identifying “At Risk” Pregnancies & Neonates
A. Provide stakeholder education to develop confidence in screening for:– Maternal alcohol consumption– Maternal drug use– Maternal mental health concerns– Family violence– Smokefree.
a. 80% of pregnant women/whaanau are screened and appropriately referred.
b. Record stakeholder’s attendance at educational opportunities.
MQSG
B. Socialise referral and shared care pathways for pregnant/new mothers requiring support for:– Maternal alcohol consumption – Maternal drug use– Maternal mental health concerns– Family violence– Safe warm homes under AWHI
Programme.
a. 80% of maternal mental health referrals of all pregnant women will be linked back to the LMC for shared care planning discussion within 4 weeks of referral.
b. Produce a three monthly audit of maternal mental health referrals and check evidence within service user clinical file of care plan discussion.
C. Improve screening for SUDI risk factors during pregnancy and postnatal period:– Smokefree– Safe sleep bed– Safe sleep education– Maternal alcohol consumption – Maternal drug use– Family violence.
a. 95% of pregnant and postnatal women and whaanau who smoke are referred to a cessation service.
b. Safe sleep environments area assessed for all babies and will be referred to safe sleep team for safe sleep baby bed where required.
c. Record attendance of stakeholder participation in SUDI education with an aim of 100%.
d. Reduction in SUDI rates.
A. Explore the implementation of the baby alert system across all maternity services to include Papakura and Pukekohe Birthing Units.
a. 100% of babies with alert bracelets will be monitored whilst in the maternity facilities.
MQFB. Implement Safety Huddles across Women’s
Health.– Implement structured safety huddles in
Gynaecology and Primary Birthing Units to foster collective situational awareness.
– Conduct observations audits and staff surveys post implementation.
a. Safety huddles are performed across all wards and units within Women’s Health.
120
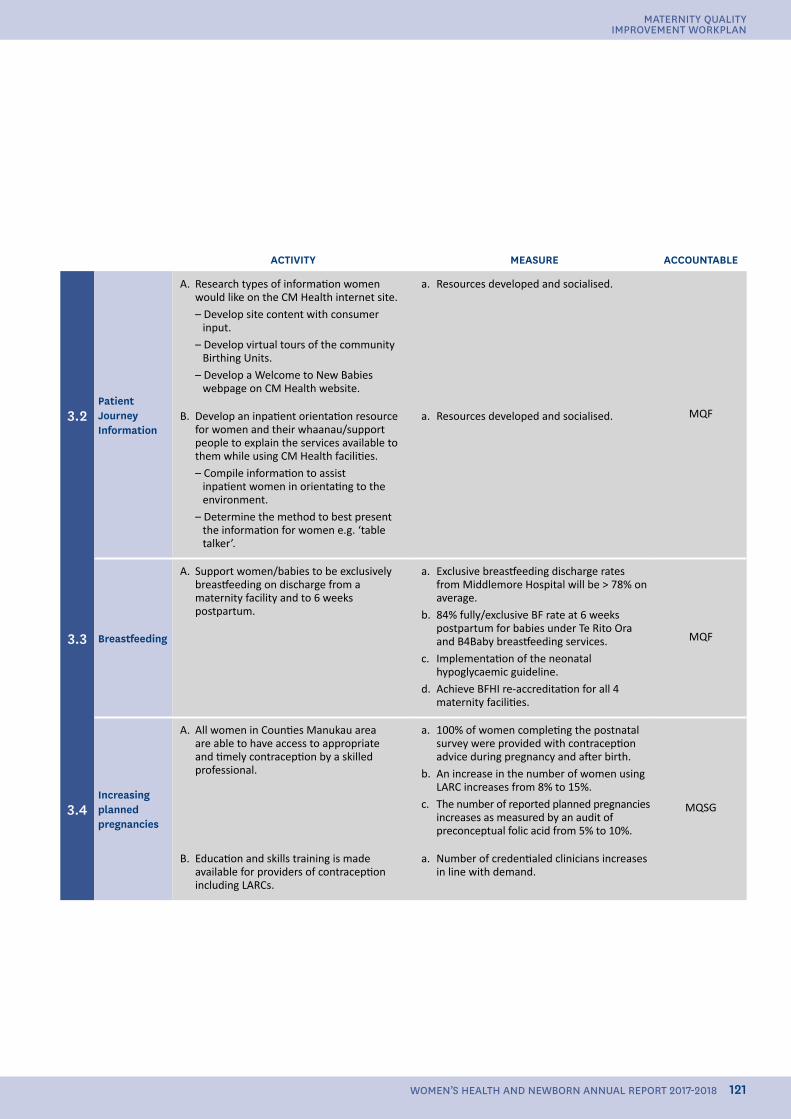
ACTIVITY MEASURE ACCOUNTABLE
3.2Patient Journey Information
A. Research types of information women would like on the CM Health internet site.– Develop site content with consumer
input.– Develop virtual tours of the community
Birthing Units.– Develop a Welcome to New Babies
webpage on CM Health website.
a. Resources developed and socialised.
MQFB. Develop an inpatient orientation resource for women and their whaanau/support people to explain the services available to them while using CM Health facilities.– Compile information to assist
inpatient women in orientating to the environment.
– Determine the method to best present the information for women e.g. ‘table talker’.
a. Resources developed and socialised.
3.3 Breastfeeding
A. Support women/babies to be exclusively breastfeeding on discharge from a maternity facility and to 6 weeks postpartum.
a. Exclusive breastfeeding discharge rates from Middlemore Hospital will be > 78% on average.
b. 84% fully/exclusive BF rate at 6 weeks postpartum for babies under Te Rito Ora and B4Baby breastfeeding services.
c. Implementation of the neonatal hypoglycaemic guideline.
d. Achieve BFHI re-accreditation for all 4 maternity facilities.
MQF
3.4Increasing planned pregnancies
A. All women in Counties Manukau area are able to have access to appropriate and timely contraception by a skilled professional.
a. 100% of women completing the postnatal survey were provided with contraception advice during pregnancy and after birth.
b. An increase in the number of women using LARC increases from 8% to 15%.
c. The number of reported planned pregnancies increases as measured by an audit of preconceptual folic acid from 5% to 10%.
MQSG
B. Education and skills training is made available for providers of contraception including LARCs.
a. Number of credentialed clinicians increases in line with demand.
121
MATERNITY QUALITY IMPROVEMENT WORKPLAN
WOMEN’S HEALTH AND NEWBORN ANNUAL REPORT 2017-2018
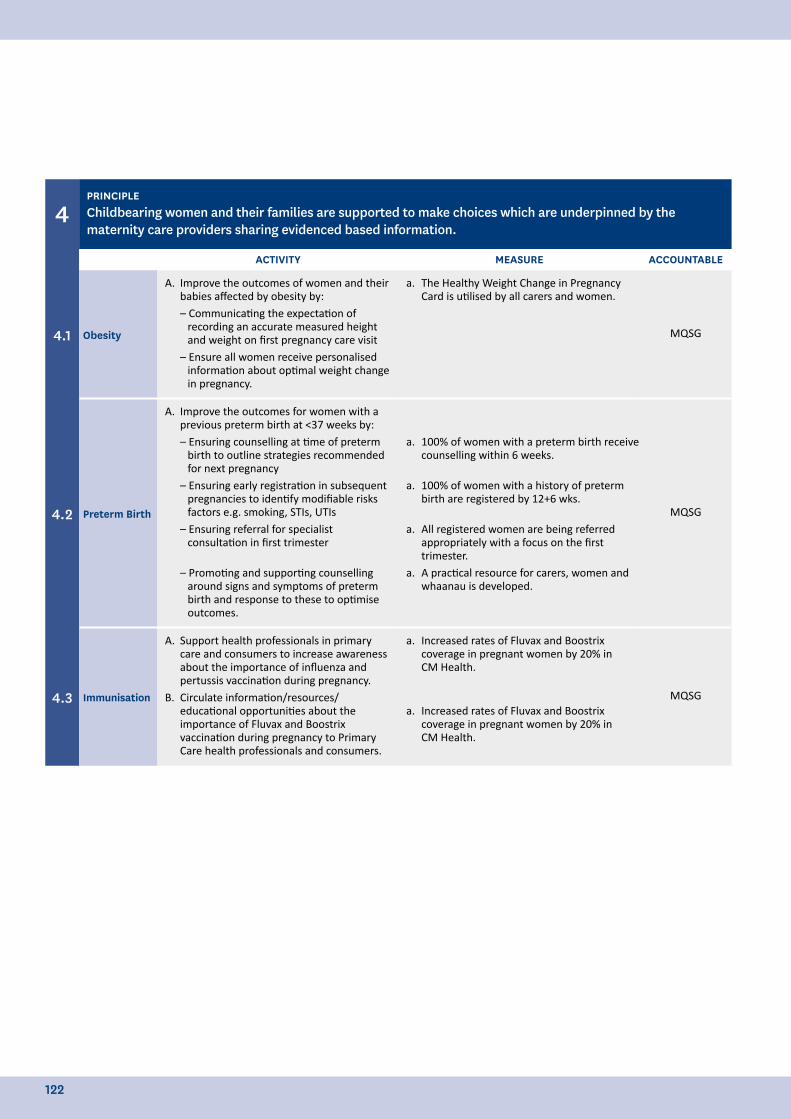
4PRINCIPLEChildbearing women and their families are supported to make choices which are underpinned by the maternity care providers sharing evidenced based information.
ACTIVITY MEASURE ACCOUNTABLE
4.1 Obesity
A. Improve the outcomes of women and their babies affected by obesity by:– Communicating the expectation of
recording an accurate measured height and weight on first pregnancy care visit
– Ensure all women receive personalised information about optimal weight change in pregnancy.
a. The Healthy Weight Change in Pregnancy Card is utilised by all carers and women.
MQSG
4.2 Preterm Birth
A. Improve the outcomes for women with a previous preterm birth at <37 weeks by:– Ensuring counselling at time of preterm
birth to outline strategies recommended for next pregnancy
– Ensuring early registration in subsequent pregnancies to identify modifiable risks factors e.g. smoking, STIs, UTIs
– Ensuring referral for specialist consultation in first trimester
– Promoting and supporting counselling around signs and symptoms of preterm birth and response to these to optimise outcomes.
a. 100% of women with a preterm birth receive counselling within 6 weeks.
a. 100% of women with a history of preterm birth are registered by 12+6 wks.
a. All registered women are being referred appropriately with a focus on the first trimester.
a. A practical resource for carers, women and whaanau is developed.
MQSG
4.3 Immunisation
A. Support health professionals in primary care and consumers to increase awareness about the importance of influenza and pertussis vaccination during pregnancy.
B. Circulate information/resources/educational opportunities about the importance of Fluvax and Boostrix vaccination during pregnancy to Primary Care health professionals and consumers.
a. Increased rates of Fluvax and Boostrix coverage in pregnant women by 20% in CM Health.
a. Increased rates of Fluvax and Boostrix coverage in pregnant women by 20% in CM Health.
MQSG
122
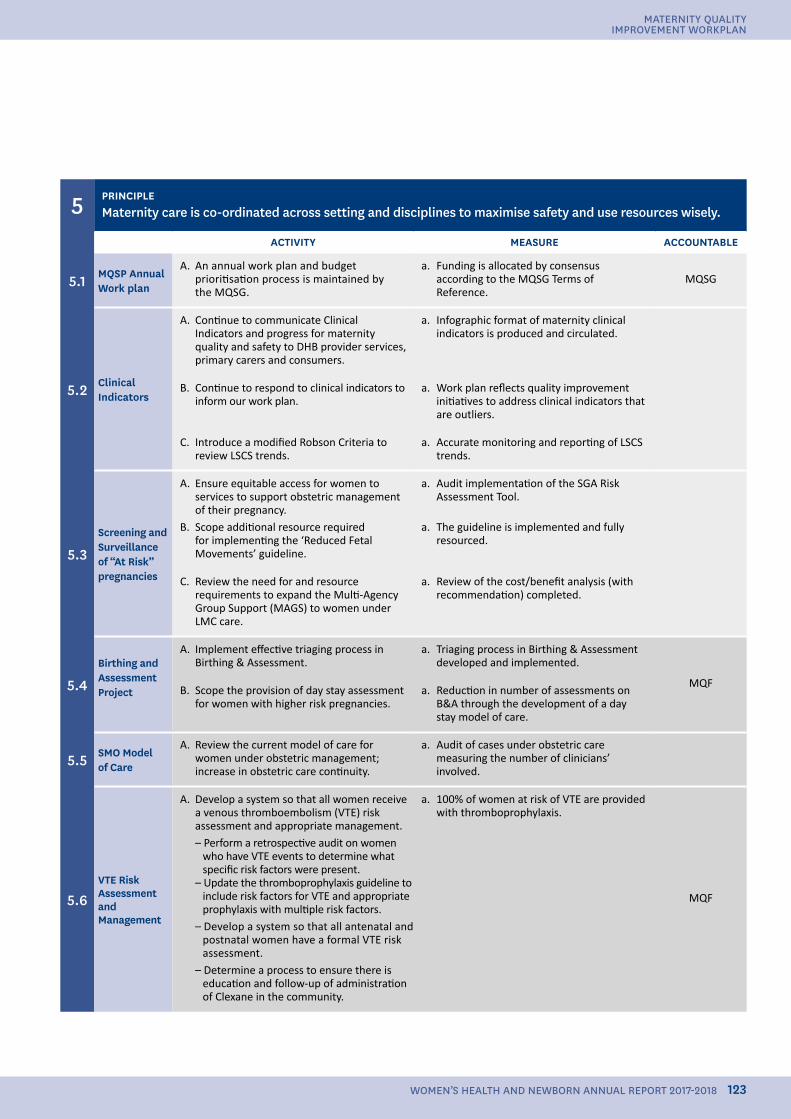
5 PRINCIPLEMaternity care is co-ordinated across setting and disciplines to maximise safety and use resources wisely.
ACTIVITY MEASURE ACCOUNTABLE
5.1 MQSP Annual Work plan
A. An annual work plan and budget prioritisation process is maintained by the MQSG.
a. Funding is allocated by consensus according to the MQSG Terms of Reference.
MQSG
5.2 Clinical Indicators
A. Continue to communicate Clinical Indicators and progress for maternity quality and safety to DHB provider services, primary carers and consumers.
a. Infographic format of maternity clinical indicators is produced and circulated.
B. Continue to respond to clinical indicators to inform our work plan.
a. Work plan reflects quality improvement initiatives to address clinical indicators that are outliers.
C. Introduce a modified Robson Criteria to review LSCS trends.
a. Accurate monitoring and reporting of LSCS trends.
5.3Screening and Surveillance of “At Risk” pregnancies
A. Ensure equitable access for women to services to support obstetric management of their pregnancy.
B. Scope additional resource required for implementing the ‘Reduced Fetal Movements’ guideline.
a. Audit implementation of the SGA Risk Assessment Tool.
a. The guideline is implemented and fully resourced.
C. Review the need for and resource requirements to expand the Multi-Agency Group Support (MAGS) to women under LMC care.
a. Review of the cost/benefit analysis (with recommendation) completed.
5.4Birthing and AssessmentProject
A. Implement effective triaging process in Birthing & Assessment.
a. Triaging process in Birthing & Assessment developed and implemented.
MQFB. Scope the provision of day stay assessment
for women with higher risk pregnancies. a. Reduction in number of assessments on
B&A through the development of a day stay model of care.
5.5 SMO Model of Care
A. Review the current model of care for women under obstetric management; increase in obstetric care continuity.
a. Audit of cases under obstetric care measuring the number of clinicians’ involved.
5.6VTE Risk Assessment and Management
A. Develop a system so that all women receive a venous thromboembolism (VTE) risk assessment and appropriate management.– Perform a retrospective audit on women
who have VTE events to determine what specific risk factors were present.
– Update the thromboprophylaxis guideline to include risk factors for VTE and appropriate prophylaxis with multiple risk factors.
– Develop a system so that all antenatal and postnatal women have a formal VTE risk assessment.
– Determine a process to ensure there is education and follow-up of administration of Clexane in the community.
a. 100% of women at risk of VTE are provided with thromboprophylaxis.
MQF
123
MATERNITY QUALITY IMPROVEMENT WORKPLAN
WOMEN’S HEALTH AND NEWBORN ANNUAL REPORT 2017-2018
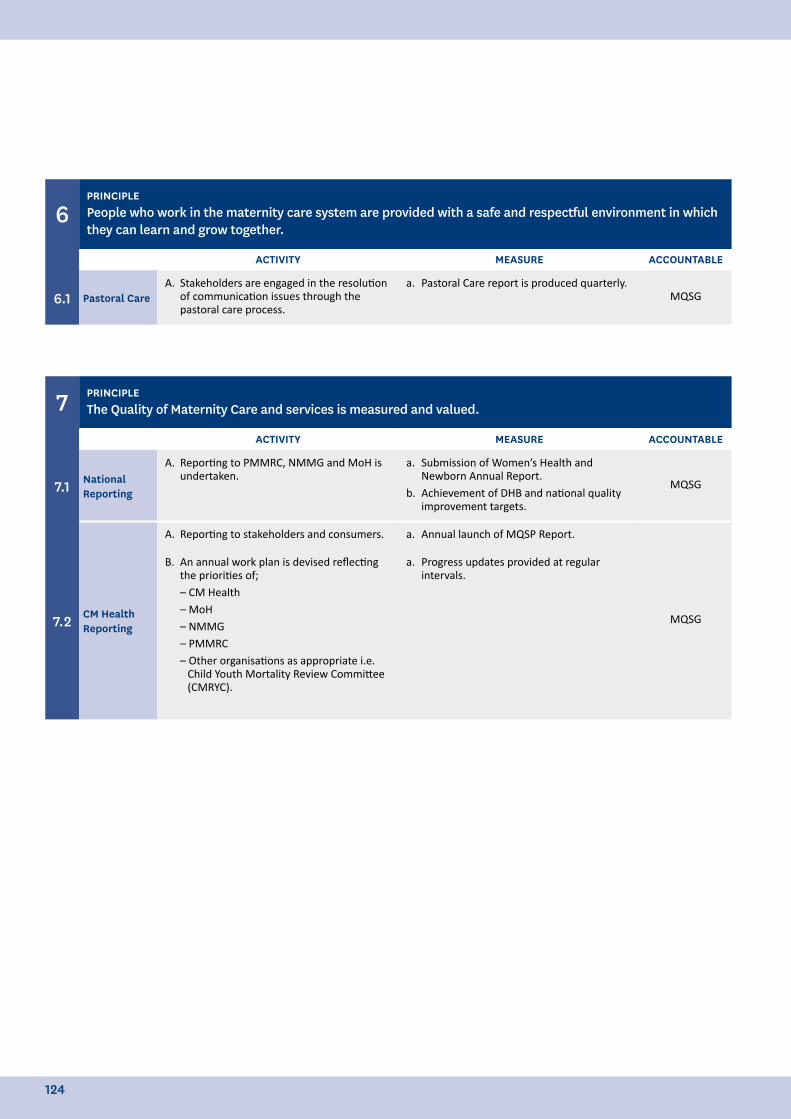
6PRINCIPLEPeople who work in the maternity care system are provided with a safe and respectful environment in which they can learn and grow together.
ACTIVITY MEASURE ACCOUNTABLE
6.1 Pastoral CareA. Stakeholders are engaged in the resolution
of communication issues through the pastoral care process.
a. Pastoral Care report is produced quarterly.MQSG
7 PRINCIPLEThe Quality of Maternity Care and services is measured and valued.
ACTIVITY MEASURE ACCOUNTABLE
7.1 National Reporting
A. Reporting to PMMRC, NMMG and MoH is undertaken.
a. Submission of Women’s Health and Newborn Annual Report.
b. Achievement of DHB and national quality improvement targets.
MQSG
7.2 CM Health Reporting
A. Reporting to stakeholders and consumers. a. Annual launch of MQSP Report.
MQSG
B. An annual work plan is devised reflecting the priorities of;– CM Health– MoH– NMMG– PMMRC– Other organisations as appropriate i.e.
Child Youth Mortality Review Committee (CMRYC).
a. Progress updates provided at regular intervals.
124

125
MATERNITY QUALITY IMPROVEMENT WORKPLAN
WOMEN’S HEALTH AND NEWBORN ANNUAL REPORT 2017-2018
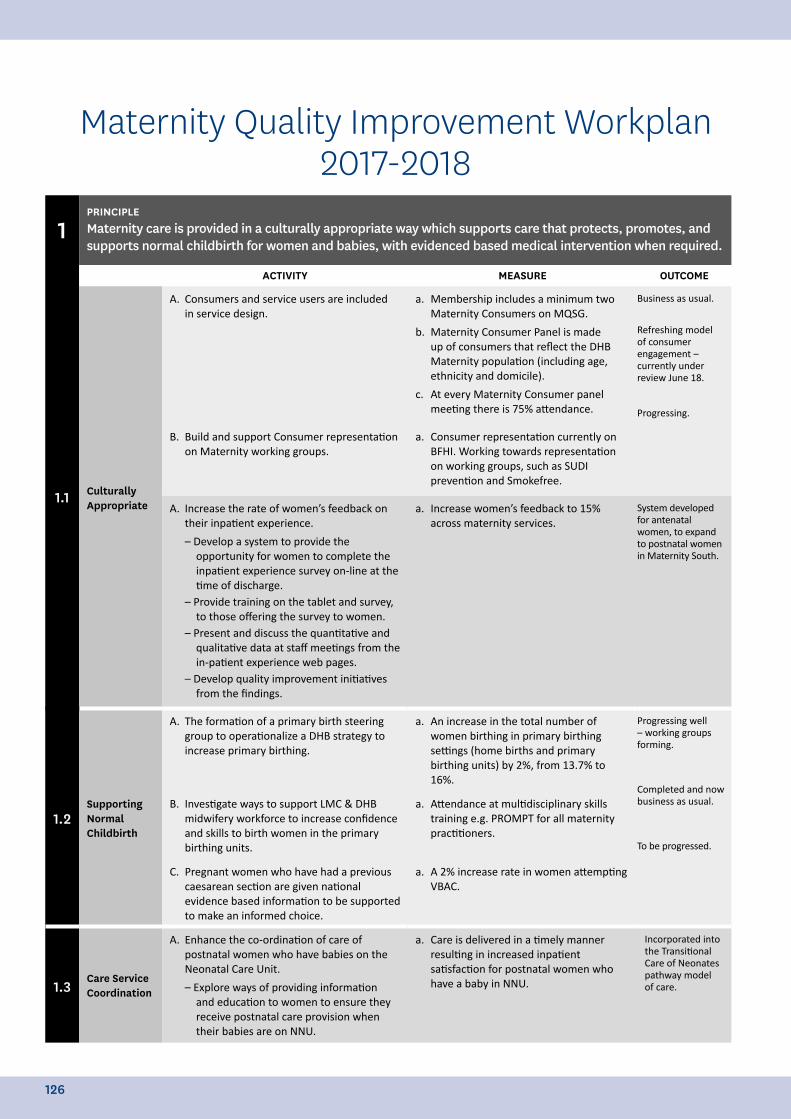
1PRINCIPLEMaternity care is provided in a culturally appropriate way which supports care that protects, promotes, and supports normal childbirth for women and babies, with evidenced based medical intervention when required.
ACTIVITY MEASURE OUTCOME
1.1 Culturally Appropriate
A. Consumers and service users are included in service design.
a. Membership includes a minimum two Maternity Consumers on MQSG.
b. Maternity Consumer Panel is made up of consumers that reflect the DHB Maternity population (including age, ethnicity and domicile).
c. At every Maternity Consumer panel meeting there is 75% attendance.
Business as usual.
Refreshing model of consumer engagement – currently under review June 18.
Progressing.
B. Build and support Consumer representation on Maternity working groups.
a. Consumer representation currently on BFHI. Working towards representation on working groups, such as SUDI prevention and Smokefree.
A. Increase the rate of women’s feedback on their inpatient experience.
– Develop a system to provide the opportunity for women to complete the inpatient experience survey on-line at the time of discharge.
– Provide training on the tablet and survey, to those offering the survey to women.
– Present and discuss the quantitative and qualitative data at staff meetings from the in-patient experience web pages.
– Develop quality improvement initiatives from the findings.
a. Increase women’s feedback to 15% across maternity services.
System developed for antenatal women, to expand to postnatal women in Maternity South.
1.2Supporting Normal Childbirth
A. The formation of a primary birth steering group to operationalize a DHB strategy to increase primary birthing.
a. An increase in the total number of women birthing in primary birthing settings (home births and primary birthing units) by 2%, from 13.7% to 16%.
Progressing well – working groups forming.
Completed and now business as usual.
To be progressed.
B. Investigate ways to support LMC & DHB midwifery workforce to increase confidence and skills to birth women in the primary birthing units.
a. Attendance at multidisciplinary skills training e.g. PROMPT for all maternity practitioners.
C. Pregnant women who have had a previous caesarean section are given national evidence based information to be supported to make an informed choice.
a. A 2% increase rate in women attempting VBAC.
1.3Care Service Coordination
A. Enhance the co-ordination of care of postnatal women who have babies on the Neonatal Care Unit.
– Explore ways of providing information and education to women to ensure they receive postnatal care provision when their babies are on NNU.
a. Care is delivered in a timely manner resulting in increased inpatient satisfaction for postnatal women who have a baby in NNU.
Incorporated into the Transitional Care of Neonates pathway model of care.
Maternity Quality Improvement Workplan 2017-2018
126
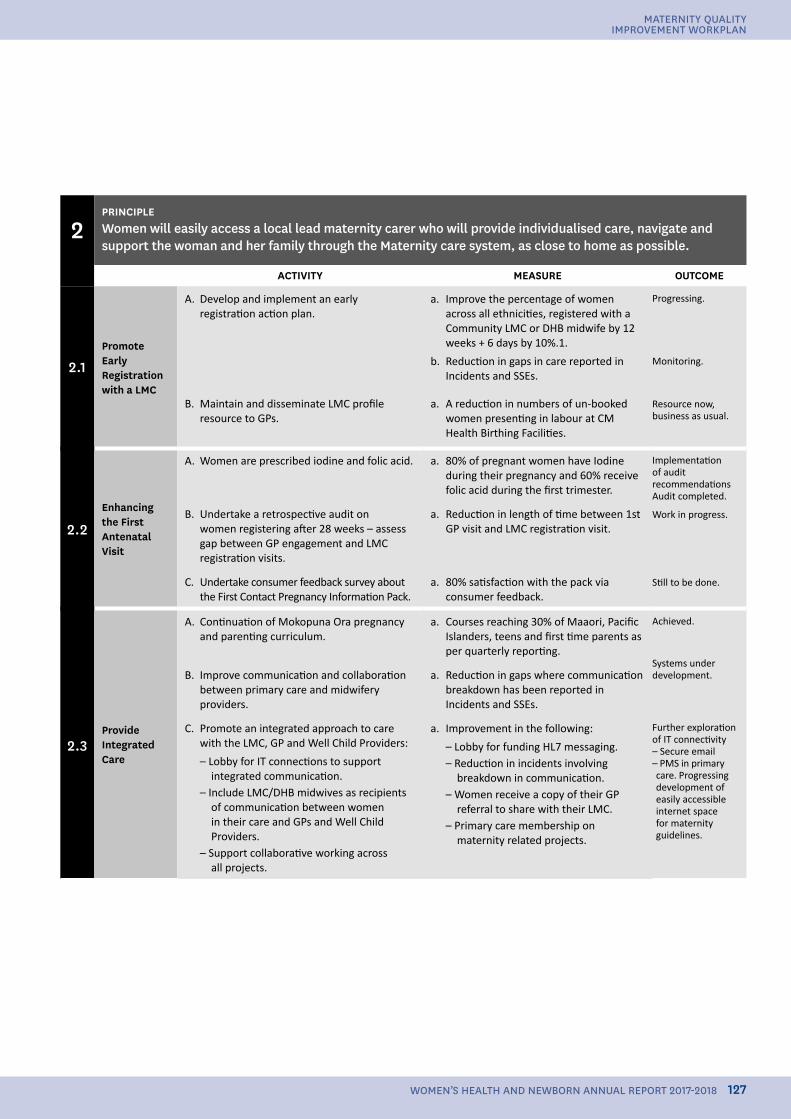
2PRINCIPLEWomen will easily access a local lead maternity carer who will provide individualised care, navigate and support the woman and her family through the Maternity care system, as close to home as possible.
ACTIVITY MEASURE OUTCOME
2.1Promote Early Registration with a LMC
A. Develop and implement an early registration action plan.
a. Improve the percentage of women across all ethnicities, registered with a Community LMC or DHB midwife by 12 weeks + 6 days by 10%.1.
b. Reduction in gaps in care reported in Incidents and SSEs.
Progressing.
Monitoring.
Resource now, business as usual.
B. Maintain and disseminate LMC profile resource to GPs.
a. A reduction in numbers of un-booked women presenting in labour at CM Health Birthing Facilities.
2.2Enhancing the First Antenatal Visit
A. Women are prescribed iodine and folic acid. a. 80% of pregnant women have Iodine during their pregnancy and 60% receive folic acid during the first trimester.
Implementation of audit recommendationsAudit completed.
Work in progress.
Still to be done.
B. Undertake a retrospective audit on women registering after 28 weeks – assess gap between GP engagement and LMC registration visits.
a. Reduction in length of time between 1st GP visit and LMC registration visit.
C. Undertake consumer feedback survey about the First Contact Pregnancy Information Pack.
a. 80% satisfaction with the pack via consumer feedback.
2.3Provide Integrated Care
A. Continuation of Mokopuna Ora pregnancy and parenting curriculum.
a. Courses reaching 30% of Maaori, Pacific Islanders, teens and first time parents as per quarterly reporting.
Achieved.
Systems under development.
Further exploration of IT connectivity– Secure email– PMS in primary care. Progressing development of easily accessible internet space for maternity guidelines.
B. Improve communication and collaboration between primary care and midwifery providers.
a. Reduction in gaps where communication breakdown has been reported in Incidents and SSEs.
C. Promote an integrated approach to care with the LMC, GP and Well Child Providers:
– Lobby for IT connections to support integrated communication.
– Include LMC/DHB midwives as recipients of communication between women in their care and GPs and Well Child Providers.
– Support collaborative working across all projects.
a. Improvement in the following:
– Lobby for funding HL7 messaging.– Reduction in incidents involving
breakdown in communication.– Women receive a copy of their GP
referral to share with their LMC.– Primary care membership on
maternity related projects.
127
MATERNITY QUALITY IMPROVEMENT WORKPLAN
WOMEN’S HEALTH AND NEWBORN ANNUAL REPORT 2017-2018
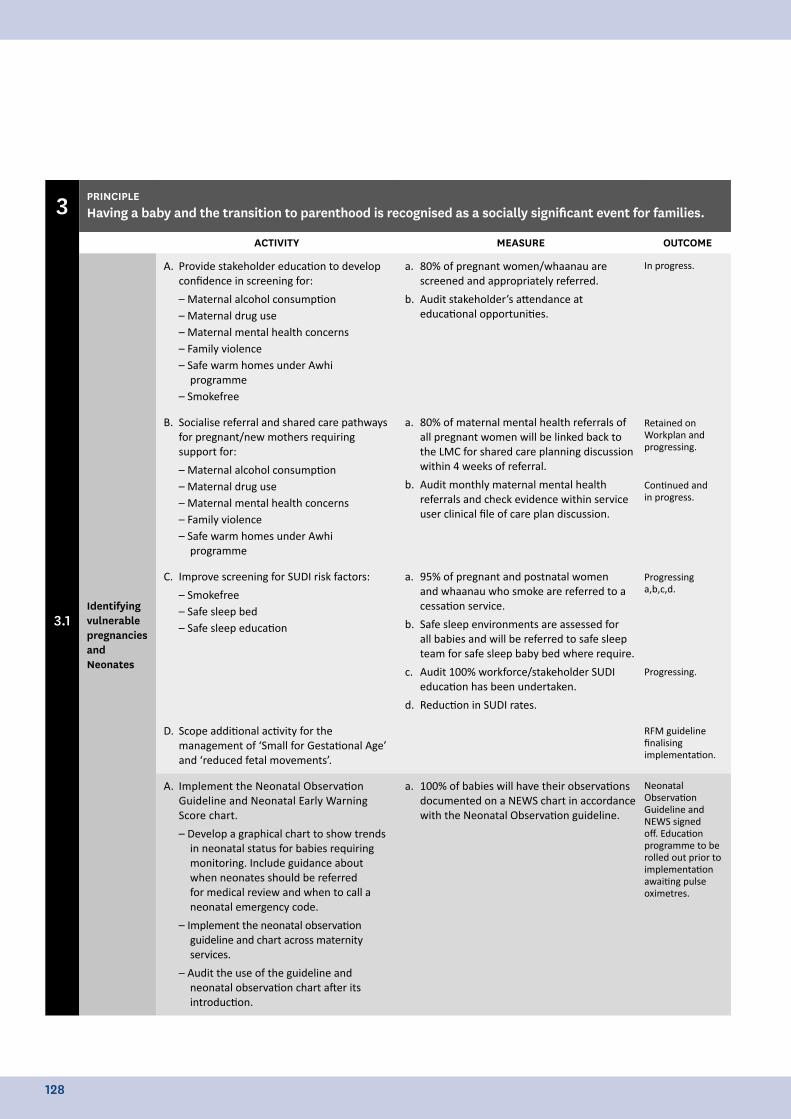
3 PRINCIPLEHaving a baby and the transition to parenthood is recognised as a socially significant event for families.
ACTIVITY MEASURE OUTCOME
3.1Identifying vulnerable pregnancies and Neonates
A. Provide stakeholder education to develop confidence in screening for:
– Maternal alcohol consumption– Maternal drug use– Maternal mental health concerns– Family violence– Safe warm homes under Awhi
programme– Smokefree
a. 80% of pregnant women/whaanau are screened and appropriately referred.
b. Audit stakeholder’s attendance at educational opportunities.
In progress.
Retained on Workplan and progressing.
Continued and in progress.
Progressing a,b,c,d.
Progressing.
RFM guideline finalising implementation.
B. Socialise referral and shared care pathways for pregnant/new mothers requiring support for:
– Maternal alcohol consumption– Maternal drug use– Maternal mental health concerns– Family violence– Safe warm homes under Awhi
programme
a. 80% of maternal mental health referrals of all pregnant women will be linked back to the LMC for shared care planning discussion within 4 weeks of referral.
b. Audit monthly maternal mental health referrals and check evidence within service user clinical file of care plan discussion.
C. Improve screening for SUDI risk factors:
– Smokefree– Safe sleep bed– Safe sleep education
a. 95% of pregnant and postnatal women and whaanau who smoke are referred to a cessation service.
b. Safe sleep environments are assessed for all babies and will be referred to safe sleep team for safe sleep baby bed where require.
c. Audit 100% workforce/stakeholder SUDI education has been undertaken.
d. Reduction in SUDI rates.
D. Scope additional activity for the management of ‘Small for Gestational Age’ and ‘reduced fetal movements’.
A. Implement the Neonatal Observation Guideline and Neonatal Early Warning Score chart.
– Develop a graphical chart to show trends in neonatal status for babies requiring monitoring. Include guidance about when neonates should be referred for medical review and when to call a neonatal emergency code.
– Implement the neonatal observation guideline and chart across maternity services.
– Audit the use of the guideline and neonatal observation chart after its introduction.
a. 100% of babies will have their observations documented on a NEWS chart in accordance with the Neonatal Observation guideline.
Neonatal Observation Guideline and NEWS signed off. Education programme to be rolled out prior to implementation awaiting pulse oximetres.
128
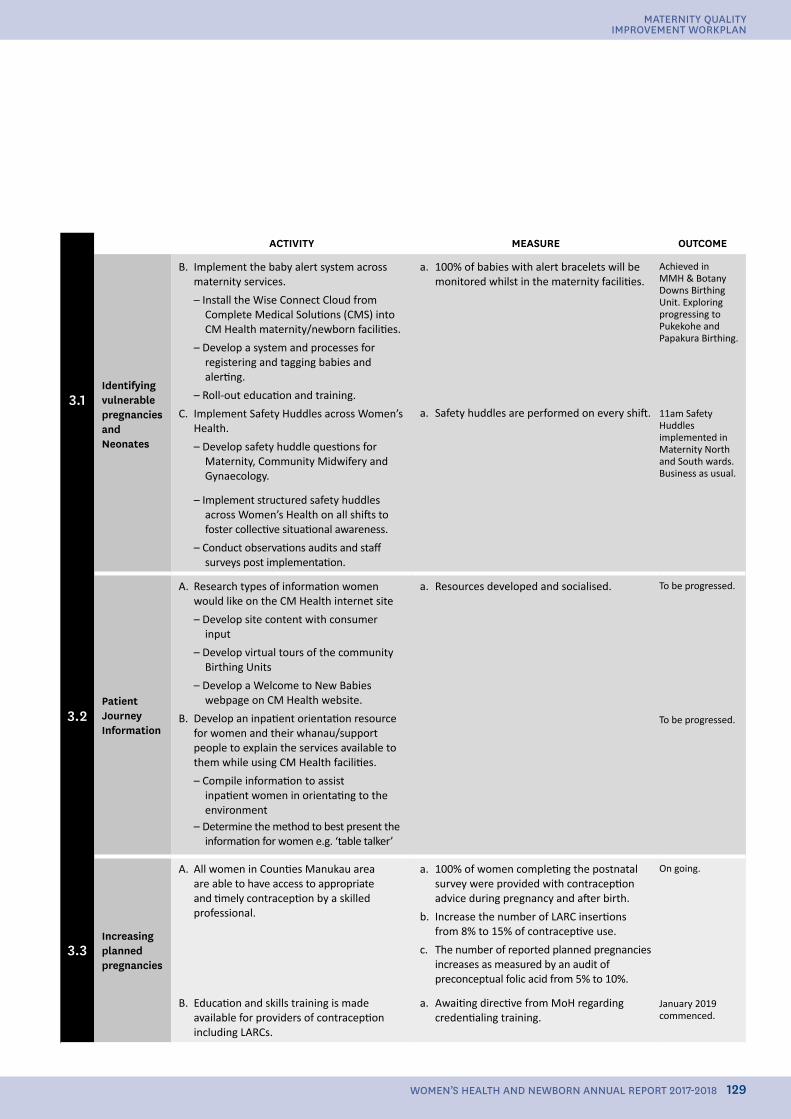
ACTIVITY MEASURE OUTCOME
3.1Identifying vulnerable pregnancies and Neonates
B. Implement the baby alert system across maternity services.
– Install the Wise Connect Cloud from Complete Medical Solutions (CMS) into CM Health maternity/newborn facilities.
– Develop a system and processes for registering and tagging babies and alerting.
– Roll-out education and training.
C. Implement Safety Huddles across Women’s Health.
– Develop safety huddle questions for Maternity, Community Midwifery and Gynaecology.
a. 100% of babies with alert bracelets will be monitored whilst in the maternity facilities.
a. Safety huddles are performed on every shift.
Achieved in MMH & Botany Downs Birthing Unit. Exploring progressing to Pukekohe and Papakura Birthing.
11am Safety Huddles implemented in Maternity North and South wards. Business as usual.
– Implement structured safety huddles across Women’s Health on all shifts to foster collective situational awareness.
– Conduct observations audits and staff surveys post implementation.
3.2Patient Journey Information
A. Research types of information women would like on the CM Health internet site
– Develop site content with consumer input
– Develop virtual tours of the community Birthing Units
– Develop a Welcome to New Babies webpage on CM Health website.
B. Develop an inpatient orientation resource for women and their whanau/support people to explain the services available to them while using CM Health facilities.
– Compile information to assist inpatient women in orientating to the environment
– Determine the method to best present the information for women e.g. ‘table talker’
a. Resources developed and socialised. To be progressed.
To be progressed.
3.3Increasing planned pregnancies
A. All women in Counties Manukau area are able to have access to appropriate and timely contraception by a skilled professional.
a. 100% of women completing the postnatal survey were provided with contraception advice during pregnancy and after birth.
b. Increase the number of LARC insertions from 8% to 15% of contraceptive use.
c. The number of reported planned pregnancies increases as measured by an audit of preconceptual folic acid from 5% to 10%.
On going.
January 2019 commenced.
B. Education and skills training is made available for providers of contraception including LARCs.
a. Awaiting directive from MoH regarding credentialing training.
129
MATERNITY QUALITY IMPROVEMENT WORKPLAN
WOMEN’S HEALTH AND NEWBORN ANNUAL REPORT 2017-2018
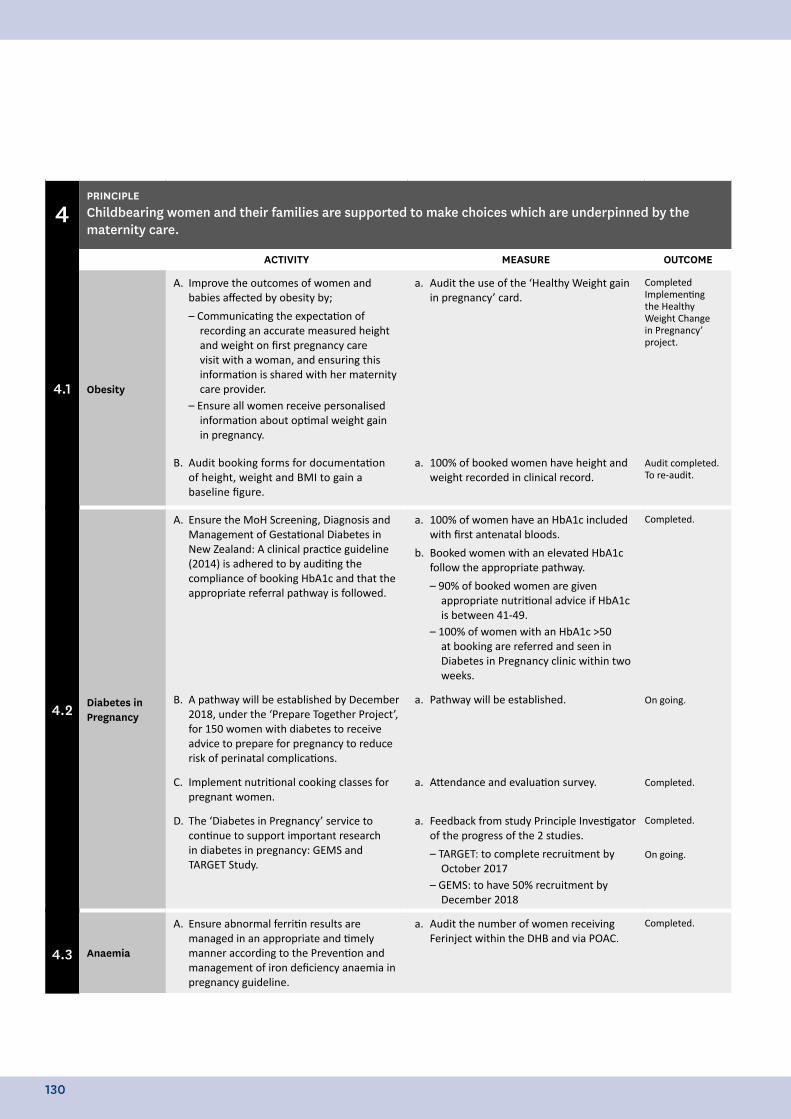
4PRINCIPLEChildbearing women and their families are supported to make choices which are underpinned by the maternity care.
ACTIVITY MEASURE OUTCOME
4.1 Obesity
A. Improve the outcomes of women and babies affected by obesity by;
– Communicating the expectation of recording an accurate measured height and weight on first pregnancy care visit with a woman, and ensuring this information is shared with her maternity care provider.
– Ensure all women receive personalised information about optimal weight gain in pregnancy.
a. Audit the use of the ‘Healthy Weight gain in pregnancy’ card.
CompletedImplementing the Healthy Weight Change in Pregnancy’ project.
Audit completed.To re-audit.
B. Audit booking forms for documentation of height, weight and BMI to gain a baseline figure.
a. 100% of booked women have height and weight recorded in clinical record.
4.2 Diabetes in Pregnancy
A. Ensure the MoH Screening, Diagnosis and Management of Gestational Diabetes in New Zealand: A clinical practice guideline (2014) is adhered to by auditing the compliance of booking HbA1c and that the appropriate referral pathway is followed.
a. 100% of women have an HbA1c included with first antenatal bloods.
b. Booked women with an elevated HbA1c follow the appropriate pathway.
– 90% of booked women are given appropriate nutritional advice if HbA1c is between 41-49.
– 100% of women with an HbA1c >50 at booking are referred and seen in Diabetes in Pregnancy clinic within two weeks.
Completed.
On going.
Completed.
Completed.
On going.
B. A pathway will be established by December 2018, under the ‘Prepare Together Project’, for 150 women with diabetes to receive advice to prepare for pregnancy to reduce risk of perinatal complications.
a. Pathway will be established.
C. Implement nutritional cooking classes for pregnant women.
a. Attendance and evaluation survey.
D. The ‘Diabetes in Pregnancy’ service to continue to support important research in diabetes in pregnancy: GEMS and TARGET Study.
a. Feedback from study Principle Investigator of the progress of the 2 studies.
– TARGET: to complete recruitment by October 2017
– GEMS: to have 50% recruitment by December 2018
4.3 Anaemia
A. Ensure abnormal ferritin results are managed in an appropriate and timely manner according to the Prevention and management of iron deficiency anaemia in pregnancy guideline.
a. Audit the number of women receiving Ferinject within the DHB and via POAC.
Completed.
130
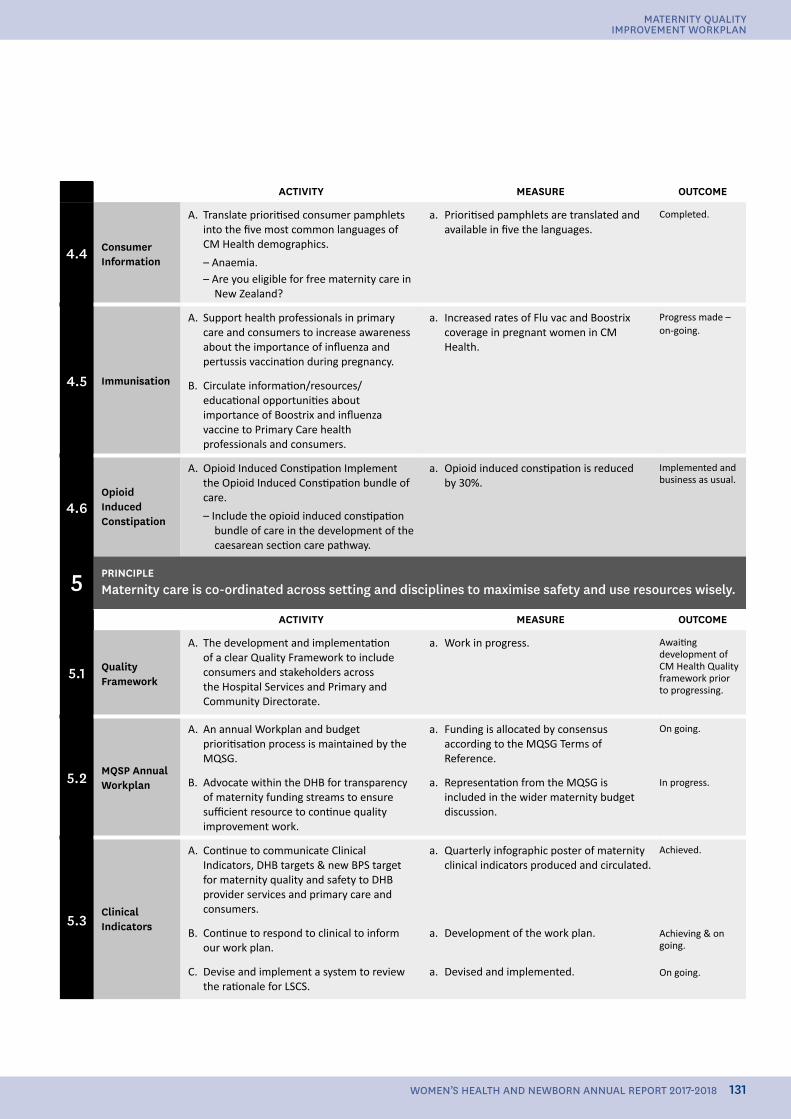
ACTIVITY MEASURE OUTCOME
4.4 Consumer Information
A. Translate prioritised consumer pamphlets into the five most common languages of CM Health demographics.
– Anaemia.– Are you eligible for free maternity care in
New Zealand?
a. Prioritised pamphlets are translated and available in five the languages.
Completed.
4.5 Immunisation
A. Support health professionals in primary care and consumers to increase awareness about the importance of influenza and pertussis vaccination during pregnancy.
a. Increased rates of Flu vac and Boostrix coverage in pregnant women in CM Health.
Progress made – on-going.
B. Circulate information/resources/ educational opportunities about importance of Boostrix and influenza vaccine to Primary Care health professionals and consumers.
4.6Opioid Induced Constipation
A. Opioid Induced Constipation Implement the Opioid Induced Constipation bundle of care.
– Include the opioid induced constipation bundle of care in the development of the caesarean section care pathway.
a. Opioid induced constipation is reduced by 30%.
Implemented and business as usual.
5 PRINCIPLEMaternity care is co-ordinated across setting and disciplines to maximise safety and use resources wisely.
ACTIVITY MEASURE OUTCOME
5.1 Quality Framework
A. The development and implementation of a clear Quality Framework to include consumers and stakeholders across the Hospital Services and Primary and Community Directorate.
a. Work in progress. Awaiting development of CM Health Quality framework prior to progressing.
5.2 MQSP Annual Workplan
A. An annual Workplan and budget prioritisation process is maintained by the MQSG.
a. Funding is allocated by consensus according to the MQSG Terms of Reference.
On going.
In progress.B. Advocate within the DHB for transparency of maternity funding streams to ensure sufficient resource to continue quality improvement work.
a. Representation from the MQSG is included in the wider maternity budget discussion.
5.3Clinical Indicators
A. Continue to communicate Clinical Indicators, DHB targets & new BPS target for maternity quality and safety to DHB provider services and primary care and consumers.
a. Quarterly infographic poster of maternity clinical indicators produced and circulated.
Achieved.
Achieving & on going.
On going.
B. Continue to respond to clinical to inform our work plan.
a. Development of the work plan.
C. Devise and implement a system to review the rationale for LSCS.
a. Devised and implemented.
131
MATERNITY QUALITY IMPROVEMENT WORKPLAN
WOMEN’S HEALTH AND NEWBORN ANNUAL REPORT 2017-2018
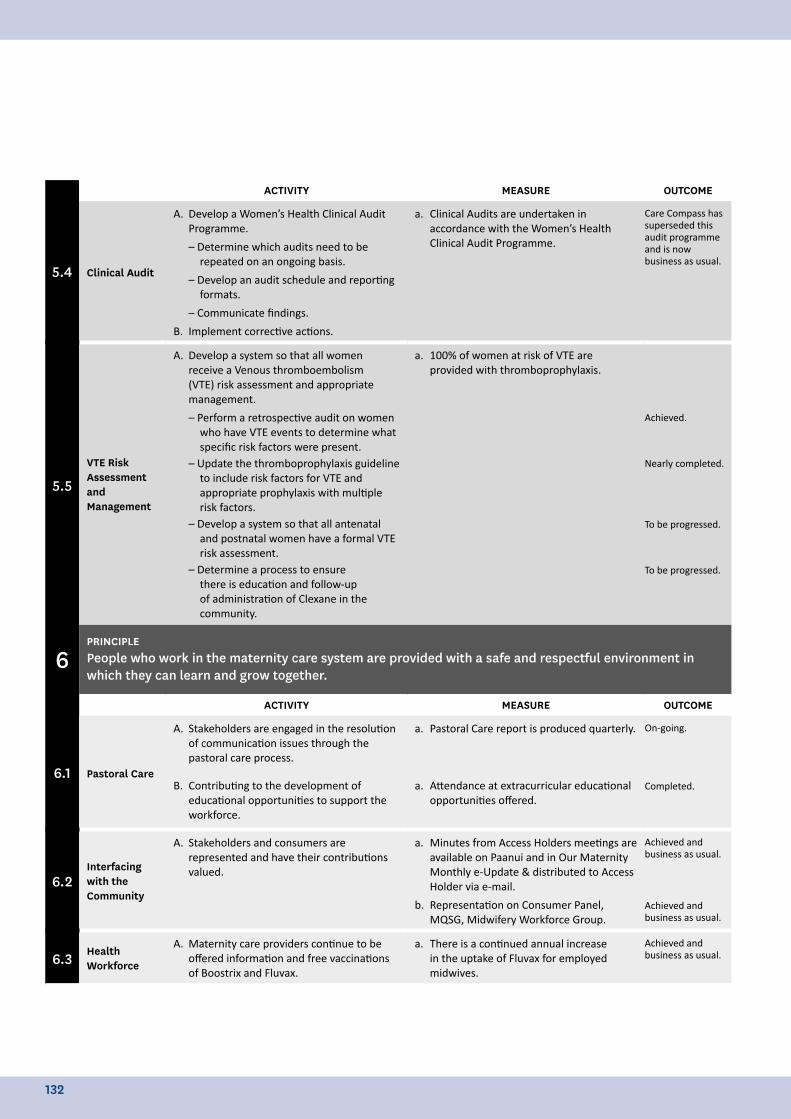
ACTIVITY MEASURE OUTCOME
5.4 Clinical Audit
A. Develop a Women’s Health Clinical Audit Programme.
– Determine which audits need to be repeated on an ongoing basis.
– Develop an audit schedule and reporting formats.
– Communicate findings.
B. Implement corrective actions.
a. Clinical Audits are undertaken in accordance with the Women’s Health Clinical Audit Programme.
Care Compass has superseded this audit programme and is now business as usual.
5.5
VTE Risk Assessment and Management
A. Develop a system so that all women receive a Venous thromboembolism (VTE) risk assessment and appropriate management.
– Perform a retrospective audit on women who have VTE events to determine what specific risk factors were present.
– Update the thromboprophylaxis guideline to include risk factors for VTE and appropriate prophylaxis with multiple risk factors.
– Develop a system so that all antenatal and postnatal women have a formal VTE risk assessment.
– Determine a process to ensure there is education and follow-up of administration of Clexane in the community.
a. 100% of women at risk of VTE are provided with thromboprophylaxis.
Achieved.
Nearly completed.
To be progressed.
To be progressed.
6PRINCIPLEPeople who work in the maternity care system are provided with a safe and respectful environment in which they can learn and grow together.
ACTIVITY MEASURE OUTCOME
6.1 Pastoral Care
A. Stakeholders are engaged in the resolution of communication issues through the pastoral care process.
a. Pastoral Care report is produced quarterly. On-going.
Completed.B. Contributing to the development of educational opportunities to support the workforce.
a. Attendance at extracurricular educational opportunities offered.
6.2Interfacing with the Community
A. Stakeholders and consumers are represented and have their contributions valued.
a. Minutes from Access Holders meetings are available on Paanui and in Our Maternity Monthly e-Update & distributed to Access Holder via e-mail.
b. Representation on Consumer Panel, MQSG, Midwifery Workforce Group.
Achieved and business as usual.
Achieved and business as usual.
6.3 Health Workforce
A. Maternity care providers continue to be offered information and free vaccinations of Boostrix and Fluvax.
a. There is a continued annual increase in the uptake of Fluvax for employed midwives.
Achieved and business as usual.
132
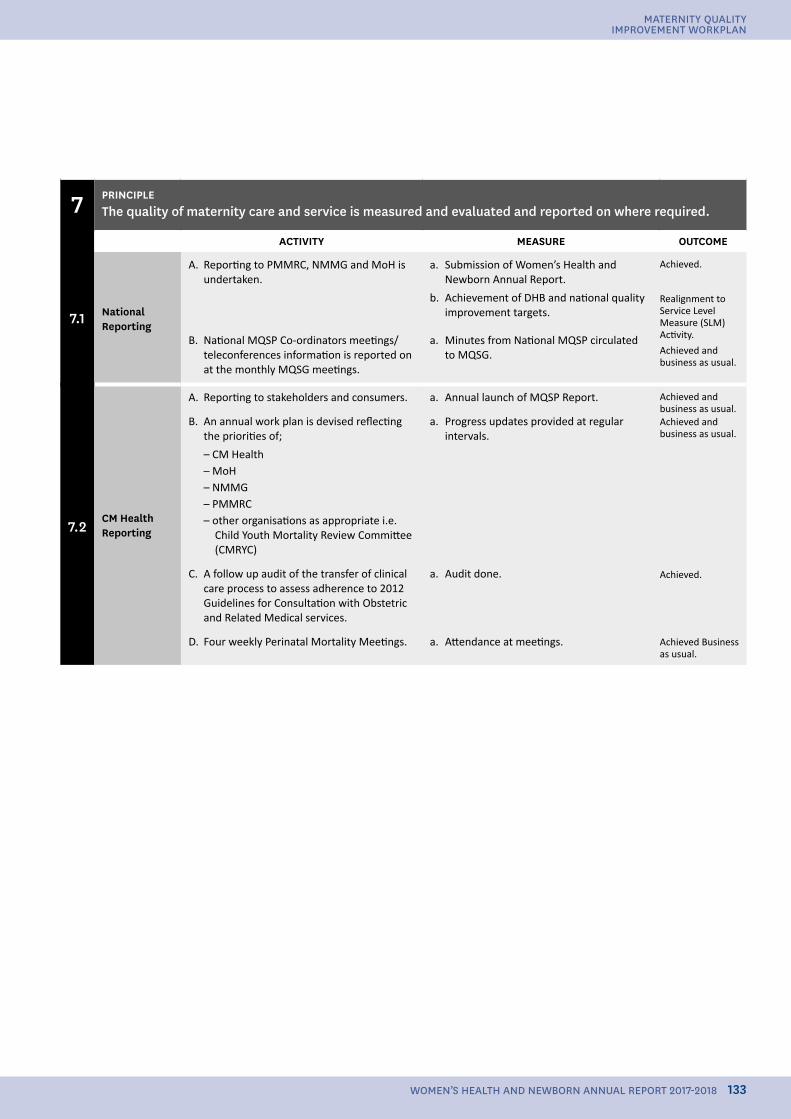
7 PRINCIPLEThe quality of maternity care and service is measured and evaluated and reported on where required.
ACTIVITY MEASURE OUTCOME
7.1 National Reporting
A. Reporting to PMMRC, NMMG and MoH is undertaken.
a. Submission of Women’s Health and Newborn Annual Report.
b. Achievement of DHB and national quality improvement targets.
Achieved.
Realignment to Service Level Measure (SLM) Activity.
Achieved and business as usual.
B. National MQSP Co-ordinators meetings/ teleconferences information is reported on at the monthly MQSG meetings.
a. Minutes from National MQSP circulated to MQSG.
7.2CM Health Reporting
A. Reporting to stakeholders and consumers. a. Annual launch of MQSP Report. Achieved and business as usual.Achieved and business as usual.
Achieved.
Achieved Business as usual.
B. An annual work plan is devised reflecting the priorities of;
– CM Health– MoH– NMMG– PMMRC– other organisations as appropriate i.e.
Child Youth Mortality Review Committee (CMRYC)
a. Progress updates provided at regular intervals.
C. A follow up audit of the transfer of clinical care process to assess adherence to 2012 Guidelines for Consultation with Obstetric and Related Medical services.
a. Audit done.
D. Four weekly Perinatal Mortality Meetings. a. Attendance at meetings.
133
MATERNITY QUALITY IMPROVEMENT WORKPLAN
WOMEN’S HEALTH AND NEWBORN ANNUAL REPORT 2017-2018
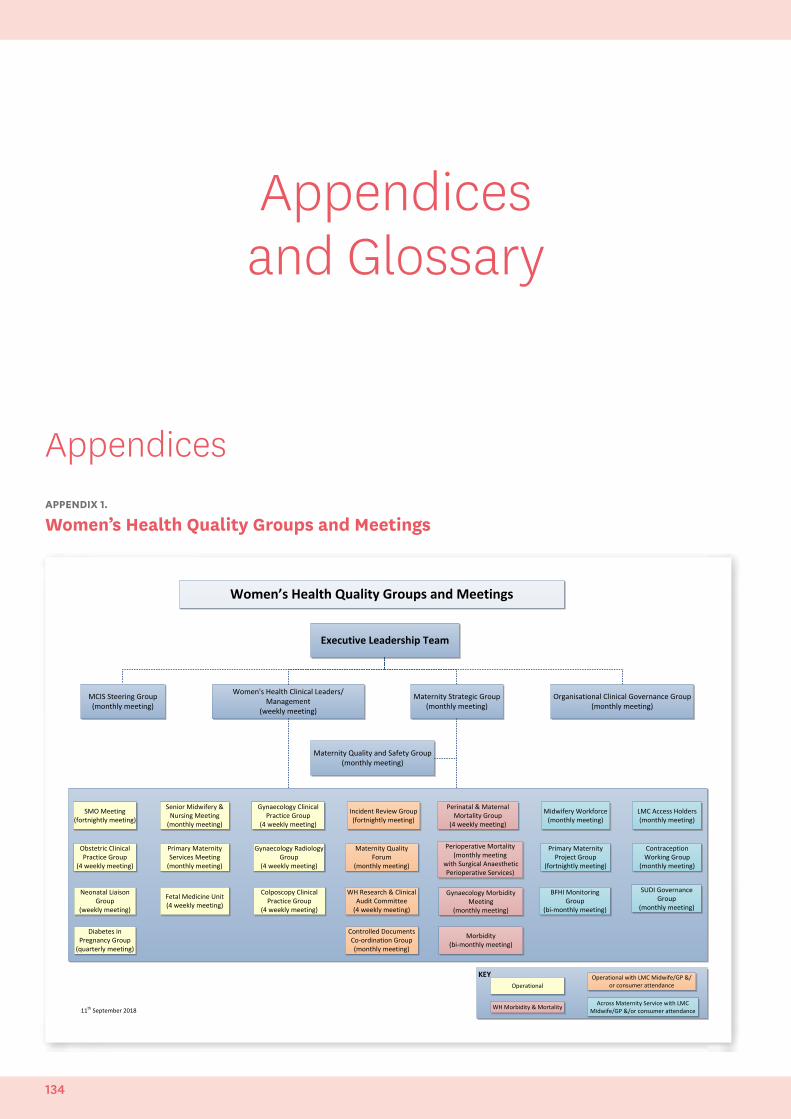
Appendices and Glossary
Appendices
Incident Review Group(fortnightly meeting)
Perinatal & Maternal Mortality Group
(4 weekly meeting)
Maternity Quality Forum
(monthly meeting)
Controlled Documents Co-ordination Group(monthly meeting)
Obstetric Clinical Practice Group
(4 weekly meeting)
SUDI Governance Group
(monthly meeting)
Contraception Working Group
(monthly meeting)
SMO Meeting(fortnightly meeting)
Senior Midwifery & Nursing Meeting
(monthly meeting)
Primary Maternity Services Meeting
(monthly meeting)
Neonatal Liaison Group
(weekly meeting)
Gynaecology Clinical Practice Group
(4 weekly meeting)
Perioperative Mortality (monthly meeting
with Surgical Anaesthetic Perioperative Services)
LMC Access Holders (monthly meeting)
Primary Maternity Project Group
(fortnightly meeting)
Gynaecology Morbidity Meeting
(monthly meeting)
Colposcopy Clinical Practice Group
(4 weekly meeting)
Gynaecology Radiology Group
(4 weekly meeting)
Fetal Medicine Unit (4 weekly meeting)
Midwifery Workforce(monthly meeting)
Morbidity(bi-monthly meeting)
Women’s Health Quality Groups and Meetings
MCIS Steering Group(monthly meeting)
Women's Health Clinical Leaders/ Management
(weekly meeting)
Maternity Strategic Group(monthly meeting)
WH Research & Clinical Audit Committee
(4 weekly meeting)
Organisational Clinical Governance Group(monthly meeting)
Maternity Quality and Safety Group (monthly meeting)
KEYOperational
WH Morbidity & Mortality
Operational with LMC Midwife/GP &/or consumer attendance
Across Maternity Service with LMC Midwife/GP &/or consumer attendance
Executive Leadership Team
BFHI Monitoring Group
(bi-monthly meeting)
11th September 201811th September 2018
Diabetes in Pregnancy Group
(quarterly meeting)
APPENDIX 1.
Women’s Health Quality Groups and Meetings
134
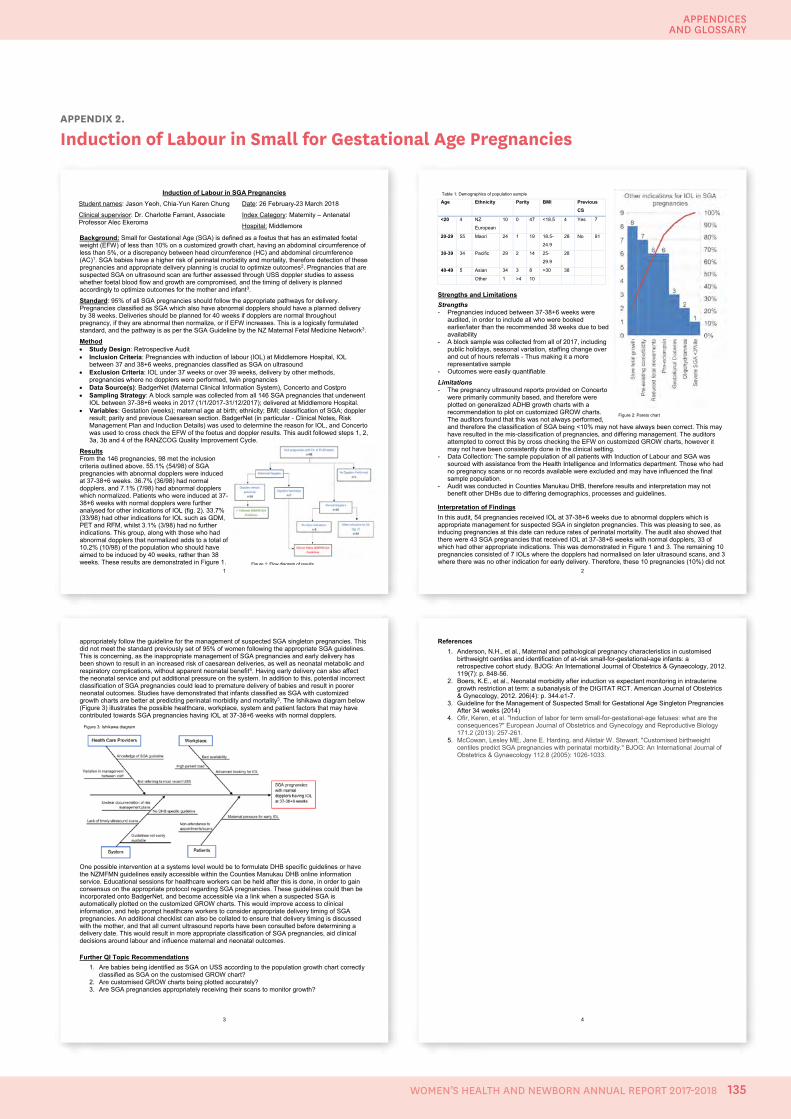
Appendices and Glossary
APPENDIX 2.
Induction of Labour in Small for Gestational Age Pregnancies
1
Induction of Labour in SGA Pregnancies
Student names: Jason Yeoh, Chia-Yun Karen Chung
Clinical supervisor: Dr. Charlotte Farrant, Associate Professor Alec Ekeroma
Date: 26 February-23 March 2018
Index Category: Maternity – Antenatal
Hospital: Middlemore
Background: Small for Gestational Age (SGA) is defined as a foetus that has an estimated foetal weight (EFW) of less than 10% on a customized growth chart, having an abdominal circumference of less than 5%, or a discrepancy between head circumference (HC) and abdominal circumference (AC)1. SGA babies have a higher risk of perinatal morbidity and mortality, therefore detection of these pregnancies and appropriate delivery planning is crucial to optimize outcomes2. Pregnancies that are suspected SGA on ultrasound scan are further assessed through USS doppler studies to assess whether foetal blood flow and growth are compromised, and the timing of delivery is planned accordingly to optimize outcomes for the mother and infant3.
Standard: 95% of all SGA pregnancies should follow the appropriate pathways for delivery. Pregnancies classified as SGA which also have abnormal dopplers should have a planned delivery by 38 weeks. Deliveries should be planned for 40 weeks if dopplers are normal throughout pregnancy, if they are abnormal then normalize, or if EFW increases. This is a logically formulated standard, and the pathway is as per the SGA Guideline by the NZ Maternal Fetal Medicine Network3.
Method • Study Design: Retrospective Audit • Inclusion Criteria: Pregnancies with induction of labour (IOL) at Middlemore Hospital, IOL
between 37 and 38+6 weeks, pregnancies classified as SGA on ultrasound • Exclusion Criteria: IOL under 37 weeks or over 39 weeks, delivery by other methods,
pregnancies where no dopplers were performed, twin pregnancies • Data Source(s): BadgerNet (Maternal Clinical Information System), Concerto and Costpro • Sampling Strategy: A block sample was collected from all 146 SGA pregnancies that underwent
IOL between 37-38+6 weeks in 2017 (1/1/2017-31/12/2017); delivered at Middlemore Hospital. • Variables: Gestation (weeks); maternal age at birth; ethnicity; BMI; classification of SGA; doppler
result; parity and previous Caesarean section. BadgerNet (in particular - Clinical Notes, Risk Management Plan and Induction Details) was used to determine the reason for IOL, and Concerto was used to cross check the EFW of the foetus and doppler results. This audit followed steps 1, 2, 3a, 3b and 4 of the RANZCOG Quality Improvement Cycle.
Results From the 146 pregnancies, 98 met the inclusion criteria outlined above. 55.1% (54/98) of SGA pregnancies with abnormal dopplers were induced at 37-38+6 weeks. 36.7% (36/98) had normal dopplers, and 7.1% (7/98) had abnormal dopplers which normalized. Patients who were induced at 37-38+6 weeks with normal dopplers were further analysed for other indications of IOL (fig. 2). 33.7% (33/98) had other indications for IOL such as GDM, PET and RFM, whilst 3.1% (3/98) had no further indications. This group, along with those who had abnormal dopplers that normalized adds to a total of 10.2% (10/98) of the population who should have aimed to be induced by 40 weeks, rather than 38 weeks. These results are demonstrated in Figure 1.
Figure 1: Flow diagram of results 2
Age Ethnicity Parity BMI Previous
CS
<20 4 NZ
European
10 0 47 <18.5 4 Yes 7
20-29 55 Maori 24 1 19 18.5-
24.9
28 No 91
30-39 34 Pacific 29 2 14 25-
29.9
28
40-49 5 Asian 34 3 8 >30 38
Other 1 >4 10
Strengths and Limitations Strengths - Pregnancies induced between 37-38+6 weeks were
audited, in order to include all who were booked earlier/later than the recommended 38 weeks due to bed availability
- A block sample was collected from all of 2017, including public holidays, seasonal variation, staffing change over and out of hours referrals - Thus making it a more representative sample
- Outcomes were easily quantifiable
Limitations - The pregnancy ultrasound reports provided on Concerto
were primarily community based, and therefore were plotted on generalized ADHB growth charts with a recommendation to plot on customized GROW charts. The auditors found that this was not always performed, and therefore the classification of SGA being <10% may not have always been correct. This may have resulted in the mis-classification of pregnancies, and differing management. The auditors attempted to correct this by cross checking the EFW on customized GROW charts, however it may not have been consistently done in the clinical setting.
- Data Collection: The sample population of all patients with Induction of Labour and SGA was sourced with assistance from the Health Intelligence and Informatics department. Those who had no pregnancy scans or no records available were excluded and may have influenced the final sample population.
- Audit was conducted in Counties Manukau DHB, therefore results and interpretation may not benefit other DHBs due to differing demographics, processes and guidelines.
Interpretation of Findings In this audit, 54 pregnancies received IOL at 37-38+6 weeks due to abnormal dopplers which is appropriate management for suspected SGA in singleton pregnancies. This was pleasing to see, as inducing pregnancies at this date can reduce rates of perinatal mortality. The audit also showed that there were 43 SGA pregnancies that received IOL at 37-38+6 weeks with normal dopplers, 33 of which had other appropriate indications. This was demonstrated in Figure 1 and 3. The remaining 10 pregnancies consisted of 7 IOLs where the dopplers had normalised on later ultrasound scans, and 3 where there was no other indication for early delivery. Therefore, these 10 pregnancies (10%) did not
Figure 2: Pareto Chart showing other indications for IOL in SGA Pregnancies
Table 1: Demographics of population sample
Figure 2: Pareto chart
3
appropriately follow the guideline for the management of suspected SGA singleton pregnancies. This did not meet the standard previously set of 95% of women following the appropriate SGA guidelines. This is concerning, as the inappropriate management of SGA pregnancies and early delivery has been shown to result in an increased risk of caesarean deliveries, as well as neonatal metabolic and respiratory complications, without apparent neonatal benefit4. Having early delivery can also affect the neonatal service and put additional pressure on the system. In addition to this, potential incorrect classification of SGA pregnancies could lead to premature delivery of babies and result in poorer neonatal outcomes. Studies have demonstrated that infants classified as SGA with customized growth charts are better at predicting perinatal morbidity and mortality5. The Ishikawa diagram below (Figure 3) illustrates the possible healthcare, workplace, system and patient factors that may have contributed towards SGA pregnancies having IOL at 37-38+6 weeks with normal dopplers.
One possible intervention at a systems level would be to formulate DHB specific guidelines or have the NZMFMN guidelines easily accessible within the Counties Manukau DHB online information service. Educational sessions for healthcare workers can be held after this is done, in order to gain consensus on the appropriate protocol regarding SGA pregnancies. These guidelines could then be incorporated onto BadgerNet, and become accessible via a link when a suspected SGA is automatically plotted on the customized GROW charts. This would improve access to clinical information, and help prompt healthcare workers to consider appropriate delivery timing of SGA pregnancies. An additional checklist can also be collated to ensure that delivery timing is discussed with the mother, and that all current ultrasound reports have been consulted before determining a delivery date. This would result in more appropriate classification of SGA pregnancies, aid clinical decisions around labour and influence maternal and neonatal outcomes.
Further QI Topic Recommendations 1. Are babies being identified as SGA on USS according to the population growth chart correctly
classified as SGA on the customised GROW chart? 2. Are customised GROW charts being plotted accurately? 3. Are SGA pregnancies appropriately receiving their scans to monitor growth?
Figure 3: Ishikawa diagram
4
References 1. Anderson, N.H., et al., Maternal and pathological pregnancy characteristics in customised
birthweight centiles and identification of at-risk small-for-gestational-age infants: a retrospective cohort study. BJOG: An International Journal of Obstetrics & Gynaecology, 2012. 119(7): p. 848-56.
2. Boers, K.E., et al., Neonatal morbidity after induction vs expectant monitoring in intrauterine growth restriction at term: a subanalysis of the DIGITAT RCT. American Journal of Obstetrics & Gynecology, 2012. 206(4): p. 344.e1-7.
3. Guideline for the Management of Suspected Small for Gestational Age Singleton Pregnancies After 34 weeks (2014)
4. Ofir, Keren, et al. "Induction of labor for term small-for-gestational-age fetuses: what are the consequences?" European Journal of Obstetrics and Gynecology and Reproductive Biology 171.2 (2013): 257-261.
5. McCowan, Lesley ME, Jane E. Harding, and Alistair W. Stewart. "Customised birthweight centiles predict SGA pregnancies with perinatal morbidity." BJOG: An International Journal of Obstetrics & Gynaecology 112.8 (2005): 1026-1033.
135
APPENDICES AND GLOSSARY
WOMEN’S HEALTH AND NEWBORN ANNUAL REPORT 2017-2018
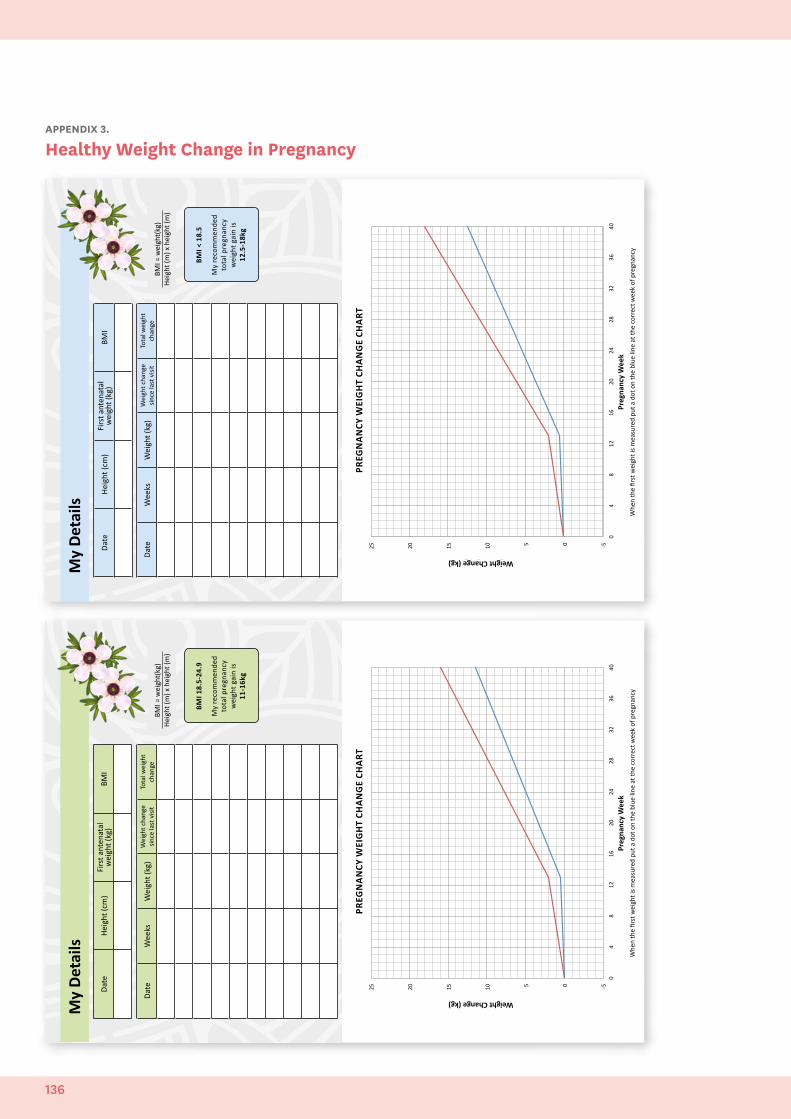
Date
Wee
ksW
eigh
t (kg
)W
eigh
t cha
nge
since
last
visi
tTo
tal w
eigh
t ch
ange
Date
Heig
ht (c
m)
Firs
t ant
enat
al
wei
ght (
kg)
BMI
My
Deta
ils
BMI <
18.
5
My
reco
mm
ende
d to
tal p
regn
ancy
w
eigh
t gai
n is
12.5
-18k
g
PREG
NA
NCY
WEI
GH
T CH
AN
GE
CHA
RT
-‐5 0 5 10
15
20
25
0 4
8 12
16
20
24
28
32
36
40
Weight Change (kg)
Weeks Gesta0o
n
BMI =
wei
ght(
kg)
Heig
ht (m
) x h
eigh
t (m
)
Preg
nanc
y W
eek
Whe
n th
e fir
st w
eigh
t is m
easu
red
put a
dot
on
the
blue
line
at t
he c
orre
ct w
eek
of p
regn
ancy
-‐5.0
0.0
5.0
10.0
15.0
20.0
25.0
0 4
8 12
16
20
24
28
32
36
40
Weight Change (kg)
Weeks Gesta0o
n
Weight Change (kg)
Date
Heig
ht (c
m)
Firs
t ant
enat
al
wei
ght (
kg)
BMI
My
Deta
ils
BMI 1
8.5-
24.9
My
reco
mm
ende
d to
tal p
regn
ancy
w
eigh
t gai
n is
11-1
6kg
PREG
NA
NCY
WEI
GH
T CH
AN
GE
CHA
RT
-‐5 0 5 10
15
20
25
0 4
8 12
16
20
24
28
32
36
40
Weight Change (kg)
Weeks Gesta0o
n
BMI =
wei
ght(
kg)
Heig
ht (m
) x h
eigh
t (m
)
Whe
n th
e fir
st w
eigh
t is m
easu
red
put a
dot
on
the
blue
line
at t
he c
orre
ct w
eek
of p
regn
ancy
Date
Wee
ksW
eigh
t (kg
)W
eigh
t cha
nge
since
last
visi
tTo
tal w
eigh
t ch
ange
Preg
nanc
y W
eek
Weight Change (kg)
APPENDIX 3.
Healthy Weight Change in Pregnancy
136
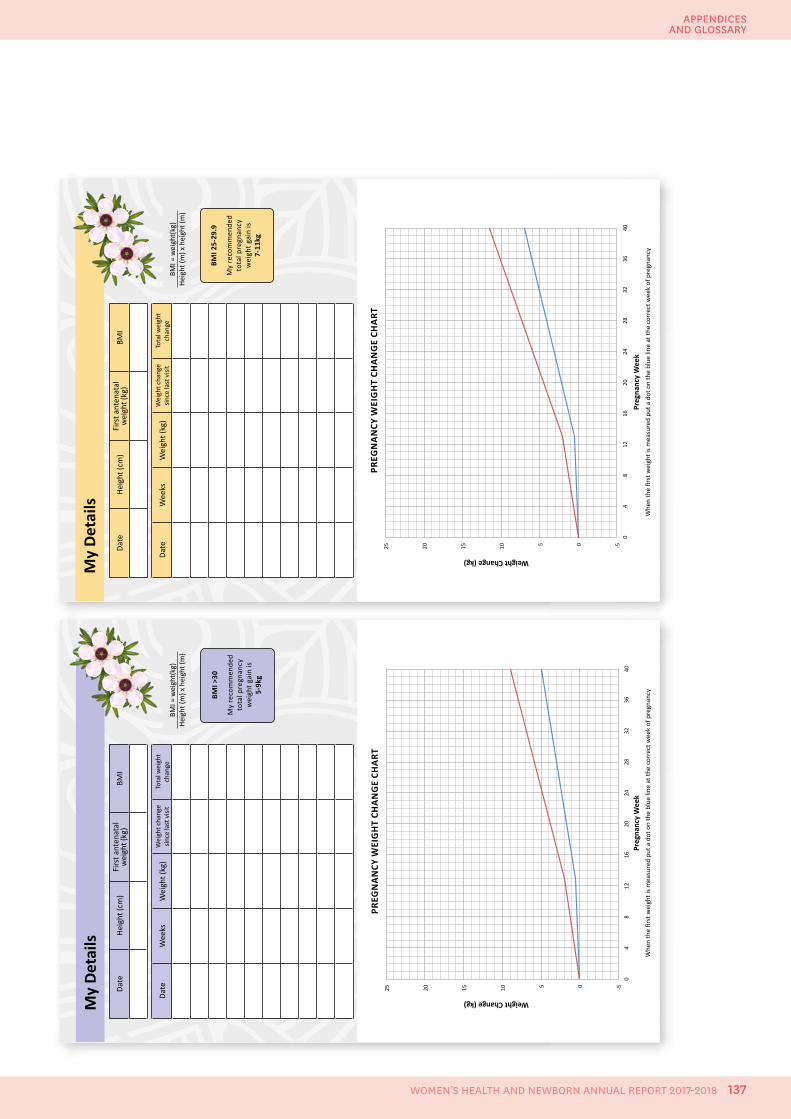
Date
Heig
ht (c
m)
Firs
t ant
enat
al
wei
ght (
kg)
BMI
My
Deta
ils
BMI 2
5-29
.9
My
reco
mm
ende
d to
tal p
regn
ancy
w
eigh
t gai
n is
7-11
kg
BMI =
wei
ght(
kg)
Heig
ht (m
) x h
eigh
t (m
)
PREG
NA
NCY
WEI
GH
T CH
AN
GE
CHA
RT
-‐5 0 5 10
15
20
25
0 4
8 12
16
20
24
28
32
36
40
Weight Change (kg)
Weeks Gesta0o
n Pr
egna
ncy
Wee
k
Whe
n th
e fir
st w
eigh
t is m
easu
red
put a
dot
on
the
blue
line
at t
he c
orre
ct w
eek
of p
regn
ancy
Date
Wee
ksW
eigh
t (kg
)W
eigh
t cha
nge
since
last
visi
tTo
tal w
eigh
t ch
ange
Preg
nanc
y W
eek
Weight Change (kg)
My
Deta
ilsDa
teHe
ight
(cm
)Fi
rst a
nten
atal
w
eigh
t (kg
)BM
I
BMI >
30
My
reco
mm
ende
d to
tal p
regn
ancy
w
eigh
t gai
n is
5-9k
g
BMI =
wei
ght(
kg)
Heig
ht (m
) x h
eigh
t (m
)
PREG
NA
NCY
WEI
GH
T CH
AN
GE
CHA
RT
-‐5 0 5 10
15
20
25
0 4
8 12
16
20
24
28
32
36
40
Weight Change (kg)
Weeks Gesta0o
n Pr
egna
ncy
Wee
k
Whe
n th
e fir
st w
eigh
t is m
easu
red
put a
dot
on
the
blue
line
at t
he c
orre
ct w
eek
of p
regn
ancy
Date
Wee
ksW
eigh
t (kg
)W
eigh
t cha
nge
since
last
visi
tTo
tal w
eigh
t ch
ange
Preg
nanc
y W
eek
Weight Change (kg)
137
APPENDICES AND GLOSSARY
WOMEN’S HEALTH AND NEWBORN ANNUAL REPORT 2017-2018
GlossaryAssisted vaginal birth A vaginal birth that needs assistance (e.g. forceps, vacuum extraction).
Body Mass Index is a measure of body fat based on height and weight that applies to adult men and women (mass (kg)/(height (m))2.
Caesarean section An operative birth through an abdominal incision. This includes emergency and elective, lower segment and classical and it is identified by the presence of any caesarean section clinical code.
Cephalic Head down presentation.
Cooks Catheter Balloon catheter for mechanical induction of labour.
CM Health community midwife Antenatal, labour, and postnatal care is provided by a CM Health employed midwife. Care during labour is provided by CM Health employed midwives at Middlemore Hospital or one of the three primary birthing units.
CM Health employed LMC Midwife A midwife who carries a full clinical primary workload including antenatal, intra-partum and postnatal care. Used to describe salaried position in DHB as opposed to LMC midwife who claims off the Section 88 Notice.
Epidural An injection of analgesic agent outside the dura mater that covers the spinal canal. It includes lumbar, spinal (inside the dura mater) and epidural anaesthetics.
Episiotomy An incision of the perineal tissue surrounding the vagina at the time of birth to facilitate birthing, identified by the presence of an episiotomy clinical code.
Exclusive breastfeeding The infant has never, to the mother’s knowledge, had any water, formula or other liquid or solid food. Only breast milk, from the breast or expressed, and prescribed medicines (as per the Medicines Act 1981) have been given from birth.
Fellow A doctor who is has usually completed their specialised exams and is completing final year of training requirements.
Fully breastfeeding The infant has taken breast milk only, no other liquids or solids except a minimal amount of water or prescribed medicine, in the past 48 hours.
Gravida Number of pregnancies.
House officer A junior doctor, in their first 1-3 years of working, who is not yet on a specialist training scheme.
Hypoxic Ischemic Encephalopathy Brain trauma that occurs when there is an insufficient supply of blood and oxygen carried to the brain.
Induction of labour An intervention to stimulate the onset of labour by pharmacological or other means, identified by induction of labour clinical codes.
Intact lower genital tract Identified by an absence of clinical codes indicating an episiotomy or a tear of any degree (first to fourth, and including unspecified degree).
Large for gestational age Greater than the 90th percentile for their gestational age.
Lead maternity carer A person who a) is a general practitioner with a Diploma in Obstetrics (or equivalent), a midwife or an obstetrician and b) is either a maternity provider in his or her own right; or an employee or contractor of a maternity provider; and c) had been selected by the women to provide her lead maternity care.
Level II neonatal care Level 2 units within New Zealand generally care for babies 32/40 weeks and above and babies who have been transferred from Level 3 units after being clinically stabilised. They do not ventilate babies (except in emergencies) and generally use a less invasive form of ventilation continuous positive airways pressure (CPAP) for babies that are clinically stable. Some Level 2 units provide intermediate (Level 2+) care for babies over 28 weeks.
Level III neonatal care Level 3 unit provides neonatal intensive care and high dependency care. This means that they have the facilities to care for extremely premature infants (from 24 weeks gestation) and sick babies requiring ventilation, intravenous feeding and other types of intensive care monitoring and treatment.
Live birth The complete expulsion or extraction from its mother of a product of conception, irrespective of duration of pregnancy, which, after such separation, breathes or shows any other evidence of life, such as breathing, beating of the heart, pulsation of the umbilical cord, or definite movement of voluntary muscles, whether or not the umbilical cord has been cut or the placenta is attached. Each product of such a birth is considered liveborn (WHO 1975).
Maternity facility A facility that provides labour and birth services and inpatient postnatal care.
Midwife A person who has successfully completed a midwifery education programme that is duly recognised in the country where it is located and that is based on the International Confederation of Midwives (ICM) Essential Competencies for Basic Midwifery Practice and the framework of the ICM Global Standards for Midwifery Education who has aquired the requisite qualifications to be registered and/or legally licensed to practice midwifery and use the title ‘midwife’; and who demonstrates competency in the practice of midwifery.
MyoSure A hysteroscopic device for removal of uterine pathology under direct vision.
Non-governmental organisation An organisation that is neither part of government nor a conventional for profit business.
NZDep2013 is an updated version of the NZDep2006 index of socioeconomic deprivation. NZDep2013 combines census data relating to income, home ownership, employment, qualifications, family structure, housing, access to transport and communications. NZDep2013 provides a deprivation score for each meshblock in New Zealand. Meshblocks are the smallest geographical area defined by Statistics New Zealand, with a population of around 60–110 people.
NZDep2013 groups deprivation scores into deciles, where 1 represents the areas with the least deprived scores and 10 the areas with the most deprived scores. A value of 10 therefore indicates that a meshblock is in the most deprived 10% of areas in New Zealand.
It is important to note that NZDep2013 estimates the relative socioeconomic deprivation of an area, and does not directly relate to individuals. NZDep2013 can not be used to look at changes in absolute deprivation over time as 10% of areas will always be the most deprived, relative to other areas in New Zealand. The indicators used to generate the index may also change over time, depending on their relation to deprivation.The NZDep2013 Index of Deprivation is available on the Ministry of Health website.
Partial breastfeeding The infant has taken some breastmilk and some infant formula or other solid food in the past 48 hours.
Parity The number of times a woman has given birth, including stillbirths.
Postnatal All pregnancy-related events following birth.
Post-term birth A birth at 42 or more completed week’s gestation.
138
Preterm birth, preterm labour Birth or labour before 37 completed week’s gestation.
Premature birth The birth of a baby born between 32 weeks 0 days and 36 weeks 6 days gestation.
Primary maternity facility A facility that does not have inpatient secondary maternity services or 24-hour onsite availability of specialist obstetricians, paediatricians and anaesthetists. This includes birthing units.
PROMPT A one day course managing obstetric emergencies and trauma as part of a multi-disciplinary team.
Referral guidelines Guidelines for Consultation with Obstetric and Related Medical Services.
Secondary maternity care facility A facility that provides additional care during the antenatal, labour and birth and postnatal periods for women and babies who experience complications and who have a clinical need for either consultation or transfer (Health Funding Authority 2000).
Community LMC Midwife Midwives claiming from the MoH to provide antenatal, labour and post-natal care using, primarily, a continuity of care model by the same midwife.
Senior Medical Officer Fully trained specialist doctor/consultant.
Spontaneous vaginal birth The birth of a baby without obstetric intervention (i.e. without caesarean section, forceps or vacuum), identified by the presence of a spontaneous vaginal birth clinical code with no concurrent instrumental/caesarean section code. These may include births where labour has been induced or augmented.
STABLE Course A neonatal education programme focussed on the post-resuscitation/pre-transport stabilisation care of sick infants.
Standard primipara Defined by the MoH as a woman aged between 20 and 34 years at the time of birth, having her first baby (parity = 0) at term (37 to 41 weeks gestation) where the outcome of the birth is a singleton baby, the presentation is cephalic and there have been no recorded obstetric complications that are indications for specific obstetric intervention.
Tertiary maternity care facility A facility that provides a multidisciplinary specialist team for women and babies with complex or rare maternity needs; for example, babies with major fetal disorders requiring prenatal diagnostic and fetal therapy services, or women with obstetric histories that significantly increase the risks during pregnancy, labour and birthing (e.g. those who have already had two placental abruptions). Includes neonatal intensive care units.
Third and fourth degree tear A third or fourth degree perineal laceration during birth, identified by the presence of a third or fourth degree of tear clinical code.
Third and fourth degree tears are defined as;• 3a Less than 50% of the external anal sphincter thickness torn• 3b More than 50% of external anal sphincter torn• 3c both external and internal sphincter torn• Fourth degree tears involve both the anal sphincter complex and
the rectal mucosa.
Weighted Inlier Equivalent Separations (WIES) is a method of weighting individual discharges based on complexity.
139
APPENDICES AND GLOSSARY
WOMEN’S HEALTH AND NEWBORN ANNUAL REPORT 2017-2018

countiesmanukau.health.nz