Embed Size (px)
Citation preview
7/23/2019 Women Workplace
http://slidepdf.com/reader/full/women-workplace 1/30
Women
in theWorkplace
2015
7/23/2019 Women Workplace
http://slidepdf.com/reader/full/women-workplace 2/30
1 Joanna Barsh and Lareina Yee, Special Report: Unlocking the Full Potential of Women in the U.S.
Economy , McKinsey & Company (April 2012), http://www.mckinsey.com/unlocking_potential .
About
the studyWomen in the Workplace is a comprehensive study of
the state of women in corporate America. The study is
part of a long-term partnership between LeanIn.Org and
McKinsey & Company to encourage female leadership
and foster gender equality in the workplace.
One hundred eighteen companies and nearly 30,000
employees participated in this 2015 study, building on
similar research conducted by McKinsey & Company
in 2012.1
2 | WOMEN IN THE WORKPLACE
Contents
03 Introduction
04 Corporate pipeline
10 Employee attitudes
19 Road map to gender equality
28 Looking ahead
29 Acknowledgments
30 Methodology
7/23/2019 Women Workplace
http://slidepdf.com/reader/full/women-workplace 3/30
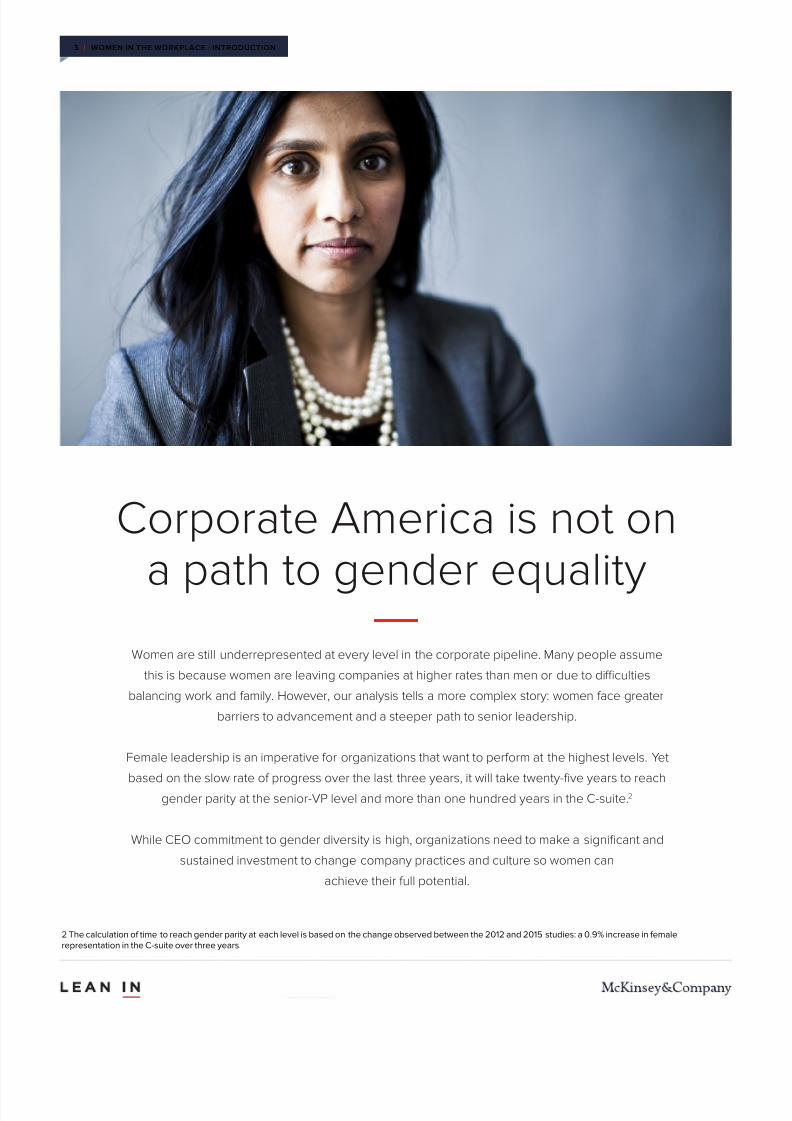
Women are still underrepresented at every level in the corporate pipeline. Many people assume
this is because women are leaving companies at higher rates than men or due to difficulties
balancing work and family. However, our analysis tells a more complex story: women face greater
barriers to advancement and a steeper path to senior leadership.
Female leadership is an imperative for organizations that want to perform at the highest levels. Yet
based on the slow rate of progress over the last three years, it will take twenty-five years to reach
gender parity at the senior-VP level and more than one hundred years in the C-suite.2
While CEO commitment to gender diversity is high, organizations need to make a significant and
sustained investment to change company practices and culture so women can
achieve their full potential.
Corporate America is not on
a path to gender equality
3 | WOMEN IN THE WORKPLACE : INTRODUCTION
2 The calculation of time to reach gender parity at each level is based on the change observed between the 2012 and 2015 studies: a 0.9% increase in female
representation in the C-suite over three years.
7/23/2019 Women Workplace
http://slidepdf.com/reader/full/women-workplace 4/30
A closer look at
the corporatepipelineBased on employee pipeline data from 118 companies
in 2015 and 60 companies in 2012, two broad themes
emerge: women are still underrepresented, and they
face real barriers to advancement.3
4 | WOMEN IN THE WORKPLACE : CORPORATE PIPELINE
3 One hundred eighteen companies submitted aggregate 2014 data for employees in the United States and Canada, including gender, level (individual contributor through
C-suite), line or staff role, age, tenure, attrition, and full-time vs. part-time.

7/23/2019 Women Workplace
http://slidepdf.com/reader/full/women-workplace 5/30
Women are underrepresented
at every level4
Despite modest improvements since 2012, women are stillunderrepresented at every level in the corporate pipeline, and the
disparity is greatest in senior leadership.
4 Based on a comparison of the full participant set for 2012 to 2015, averaged by company, with results weighted to match Fortune 500 industry composition.
5 | WOMEN IN THE WORKPLACE : CORPORATE PIPELINE
7/23/2019 Women Workplace
http://slidepdf.com/reader/full/women-workplace 6/30
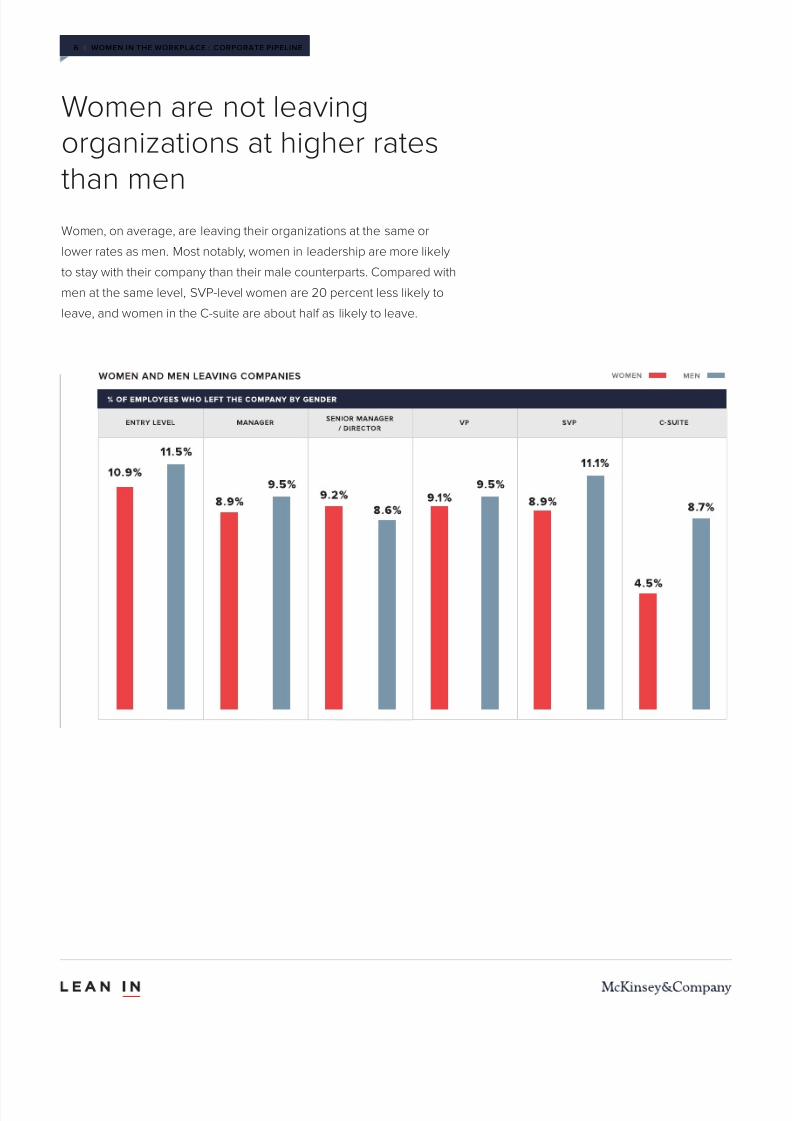
Women are not leaving
organizations at higher rates
than men
Women, on average, are leaving their organizations at the same or
lower rates as men. Most notably, women in leadership are more likely
to stay with their company than their male counterparts. Compared with
men at the same level, SVP-level women are 20 percent less likely to
leave, and women in the C-suite are about half as likely to leave.
6 | WOMEN IN THE WORKPLACE : CORPORATE PIPELINE

7/23/2019 Women Workplace
http://slidepdf.com/reader/full/women-workplace 7/30
There are signs that women
are less likely to advance
than men
If women were advancing at similar rates to men, companies would see
the same share of women from one level to the next. However, that
is not the case. Across levels, the expected representation of women
is 15 percent lower than that of men. This suggests that women face
greater barriers to advancement.
7 | WOMEN IN THE WORKPLACE : CORPORATE PIPELINE

7/23/2019 Women Workplace
http://slidepdf.com/reader/full/women-workplace 8/30
Women face obstacles on the
path to senior leadership
Two trends help explain why women hold so fewtop spots in organizations:
5 Joanna Barsh and Lareina Yee, Special Report: Unlocking the Full Potential of Women in the U.S. Economy , McKinsey & Company (April 2012),
http://www.mckinsey.com/unlocking_potential .
1. Fewer women hold roles that lead to the C-suite
A majority of manager-level women hold line roles (positions with profit-
and-loss responsibility and/or focused on core operations), but by the
VP level more than half of women hold staff roles (positions in functions
that support the organization like legal, human resources, and IT). In
contrast, a majority of men hold line roles at every level. Since lineroles are closer to the company’s core operations and provide critical
preparation for top roles, this disparity can impede women’s path to
senior leadership.
CEOs are promoted
more often from
line roles than staff
roles,5 and a higher
percentage of
C-suite executives
are in line roles.
8 | WOMEN IN THE WORKPLACE : CORPORATE PIPELINE
7/23/2019 Women Workplace
http://slidepdf.com/reader/full/women-workplace 9/30
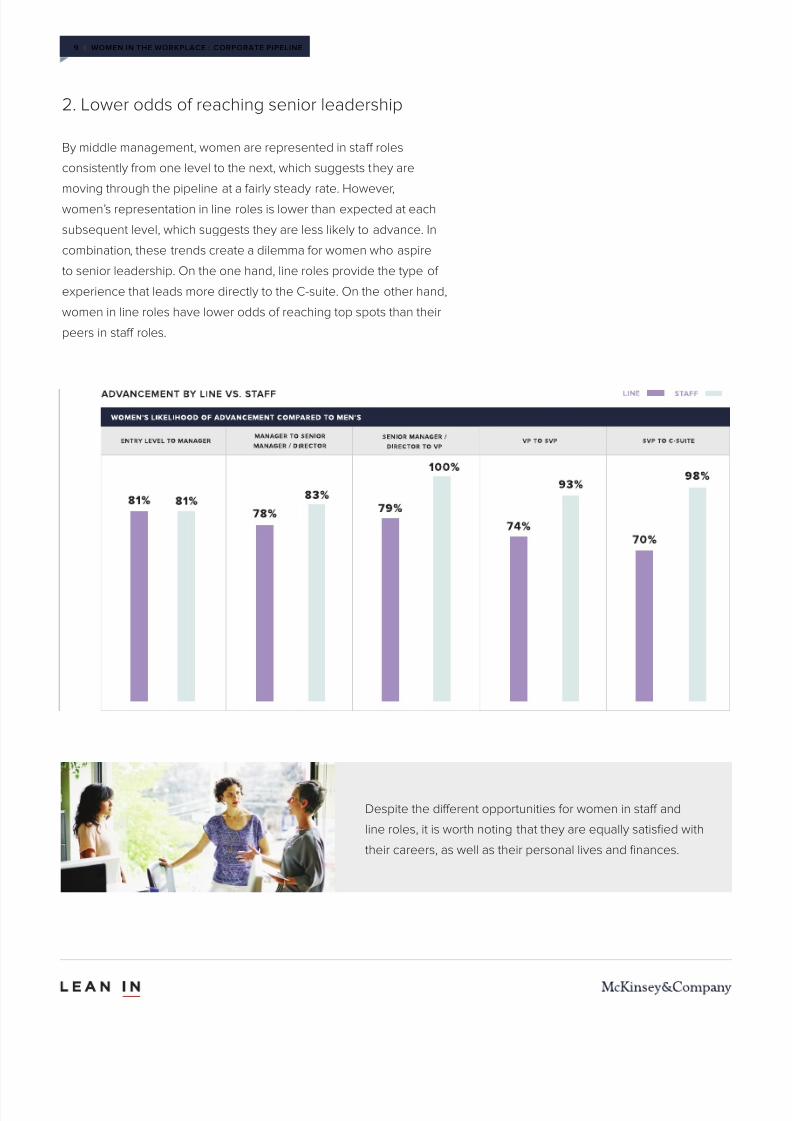
Despite the diff erent opportunities for women in staff and
line roles, it is worth noting that they are equally satisfied with
their careers, as well as their personal lives and finances.
2. Lower odds of reaching senior leadership
By middle management, women are represented in staff roles
consistently from one level to the next, which suggests they are
moving through the pipeline at a fairly steady rate. However,
women’s representation in line roles is lower than expected at each
subsequent level, which suggests they are less likely to advance. In
combination, these trends create a dilemma for women who aspire
to senior leadership. On the one hand, line roles provide the type of
experience that leads more directly to the C-suite. On the other hand,
women in line roles have lower odds of reaching top spots than their
peers in staff roles.
9 | WOMEN IN THE WORKPLACE : CORPORATE PIPELINE
7/23/2019 Women Workplace
http://slidepdf.com/reader/full/women-workplace 10/30
10 | WOMEN IN THE WORKPLACE : EMPLOYEE ATTITUDES
6 Employees from a subset of our 118 participating companies answered a ninety-two-question online survey. Company participation in this additional survey was
encouraged but optional. Reported diff erences between groups are at least five percentage points and are statistically significant at the 95 percent confidence level.
A closer look
at employeeattitudesBased on a survey of nearly 30,000 employees
from thirty-four companies, there is compelling
evidence that women are disadvantaged by company
practices and culture—and in some cases, men are
disadvantaged, too.6
7/23/2019 Women Workplace
http://slidepdf.com/reader/full/women-workplace 11/30
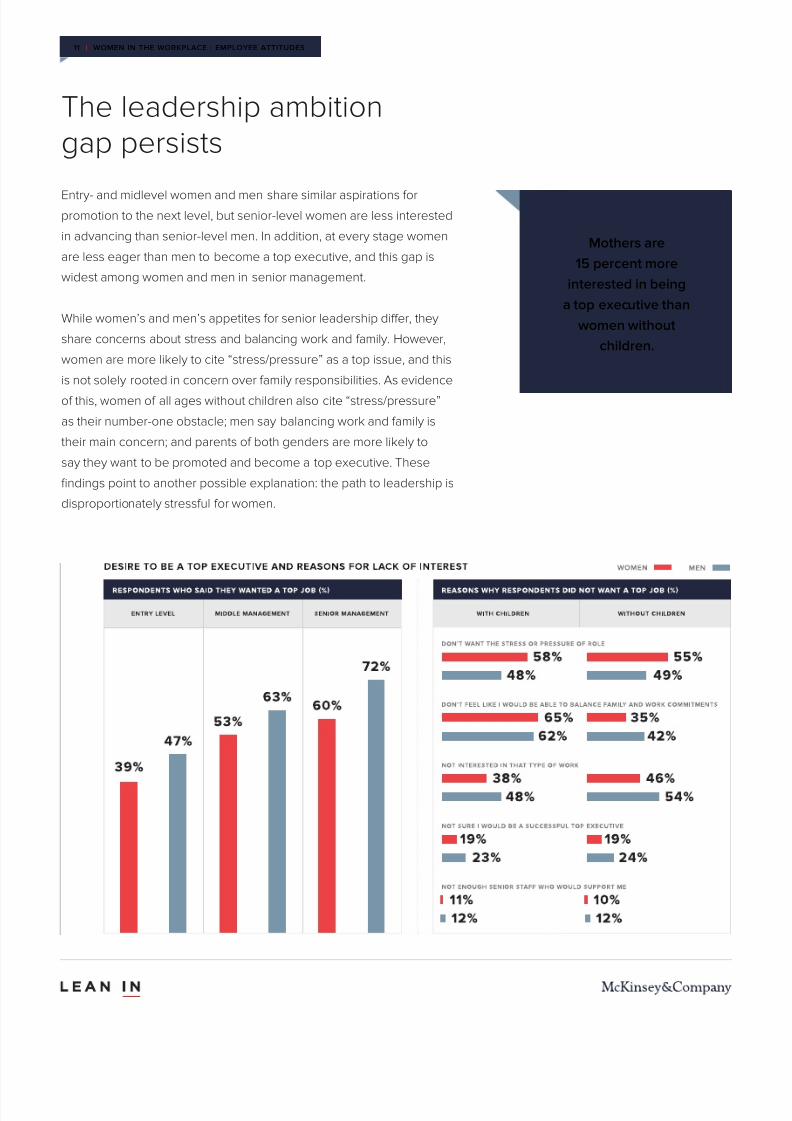
The leadership ambition
gap persists
Entry- and midlevel women and men share similar aspirations forpromotion to the next level, but senior-level women are less interested
in advancing than senior-level men. In addition, at every stage women
are less eager than men to become a top executive, and this gap is
widest among women and men in senior management.
While women’s and men’s appetites for senior leadership diff er, they
share concerns about stress and balancing work and family. However,
women are more likely to cite “stress/pressure” as a top issue, and this
is not solely rooted in concern over family responsibilities. As evidence
of this, women of all ages without children also cite “stress/pressure”
as their number-one obstacle; men say balancing work and family is
their main concern; and parents of both genders are more likely to
say they want to be promoted and become a top executive. These
findings point to another possible explanation: the path to leadership is
disproportionately stressful for women.
Mothers are
15 percent more
interested in being
a top executive than
women without
children.
11 | WOMEN IN THE WORKPLACE : EMPLOYEE ATTITUDES
7/23/2019 Women Workplace
http://slidepdf.com/reader/full/women-workplace 12/30
Women of color and
leadership ambition
Black, Hispanic, and Asian women are more
interested in being promoted than white employees
of both genders. On average, they are 43 percent
more interested in becoming a top executive than
white women and 16 percent more interested than
white men. In contrast, they are similarly interested
in promotion but less interested in becoming a top
executive compared with men of the same ethnicity.
12 | WOMEN IN THE WORKPLACE : EMPLOYEE ATTITUDES
7/23/2019 Women Workplace
http://slidepdf.com/reader/full/women-workplace 13/30
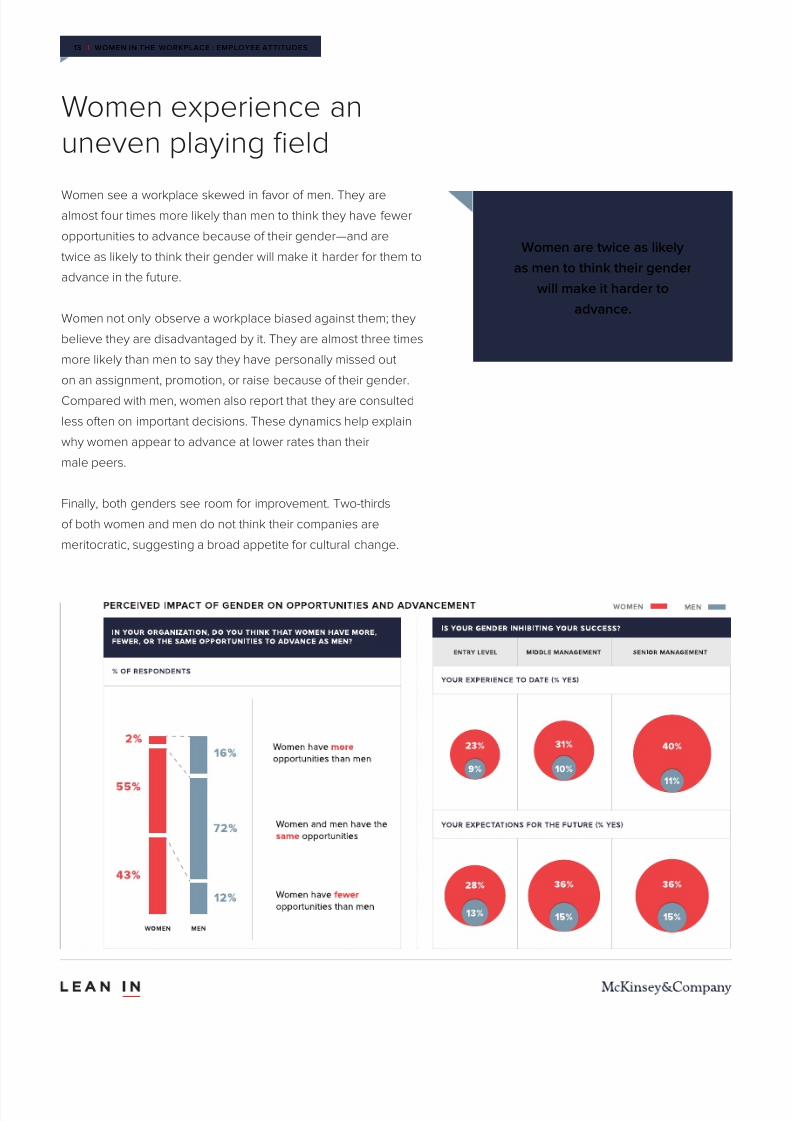
Women experience an
uneven playing field
Women see a workplace skewed in favor of men. They arealmost four times more likely than men to think they have fewer
opportunities to advance because of their gender—and are
twice as likely to think their gender will make it harder for them to
advance in the future.
Women not only observe a workplace biased against them; they
believe they are disadvantaged by it. They are almost three times
more likely than men to say they have personally missed out
on an assignment, promotion, or raise because of their gender.
Compared with men, women also report that they are consulted
less often on important decisions. These dynamics help explain
why women appear to advance at lower rates than their
male peers.
Finally, both genders see room for improvement. Two-thirds
of both women and men do not think their companies are
meritocratic, suggesting a broad appetite for cultural change.
Women are twice as likely
as men to think their gender
will make it harder to
advance.
13 | WOMEN IN THE WORKPLACE : EMPLOYEE ATTITUDES
7/23/2019 Women Workplace
http://slidepdf.com/reader/full/women-workplace 14/30
The playing field seemsmore uneven to women
at the top
Senior-level women view their gender as a bigger
disadvantage than entry-level women do. They are less
likely to view their organization as meritocratic and more
likely to think that women have fewer opportunities.
They are also more likely to believe that their gender
has made it harder—and will continue to make it
harder—for them to advance. Compared with their male
peers, senior-level women are about half as likely to say
that they are consulted on important decisions and are
less likely to feel recognized for their contributions.
This uneven playing field appears to take a toll
on women in leadership. Senior-level women are
markedly less satisfied with their role, opportunities for
advancement, and career than their male counterparts.
Only 28 percent
of senior-level
women are veryhappy with their
careers, compared
with 40 percent of
senior-level men.
14 | WOMEN IN THE WORKPLACE : EMPLOYEE ATTITUDES

7/23/2019 Women Workplace
http://slidepdf.com/reader/full/women-workplace 15/30
Gender diversity is not widely
believed to be a priority
Seventy-four percent of companies report7 that gender diversity is
a top CEO priority, but the message is not reaching the majority of
employees. Less than half of workers believe that gender diversity is
a top priority for their CEO, and only a third view it as a top priority for
their direct manager. Moreover, women are less likely than men to see
gender diversity as a priority for their manager and CEO.
There also appears to be a disconnect between men’s interest in
gender diversity and their understanding of the challenges women
face: 70 percent think gender diversity is important, but only 12 percentbelieve women have fewer opportunities. In addition, there is some
evidence of pushback: men are less likely than women to think their
organization should do more to increase gender diversity, and 13
percent of men believe it is harder for them to advance because they
are disadvantaged by gender-diversity programs.
7 Each company designated a representative from HR or its diversity offi ce to complete the survey and submit data on behalf of the organization.
Only 1 in 9 men believes
that women have fewer
opportunities than men,
and 13 percent of men
believe it is harder for
men to advance because
of gender-diversity
programs.
15 | WOMEN IN THE WORKPLACE : EMPLOYEE ATTITUDES
7/23/2019 Women Workplace
http://slidepdf.com/reader/full/women-workplace 16/30
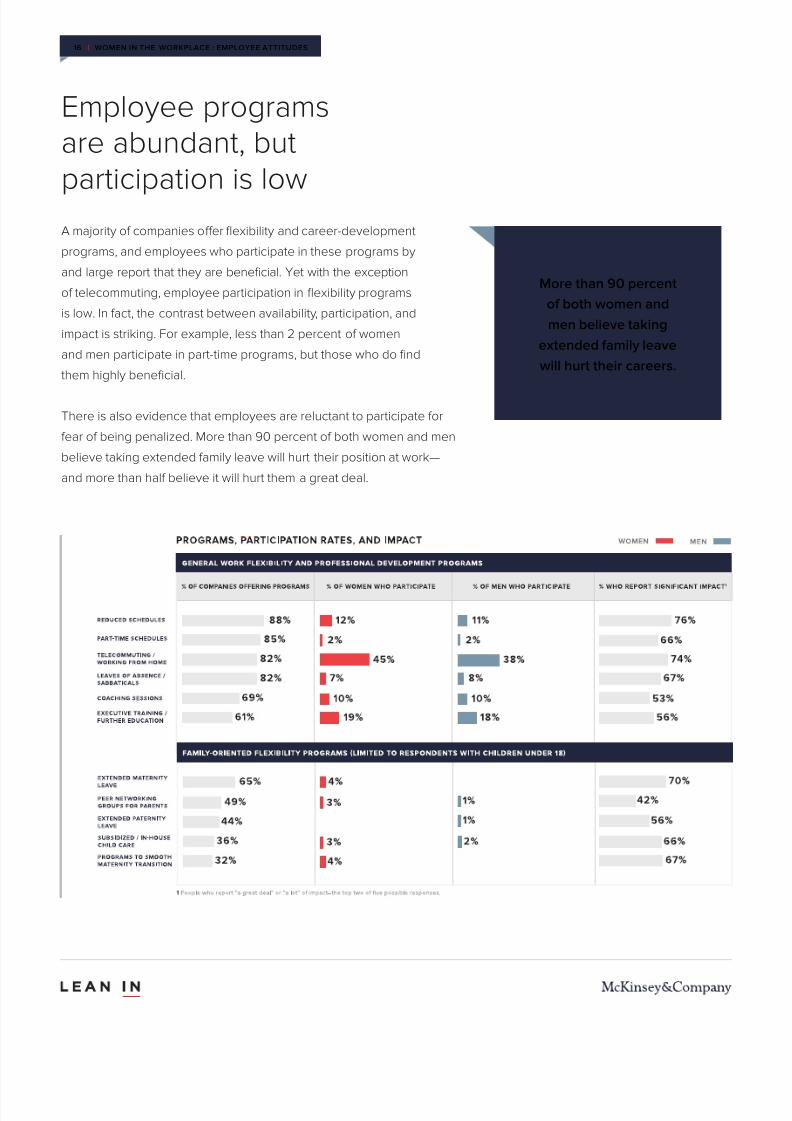
Employee programs
are abundant, but
participation is low
A majority of companies off er flexibility and career-development
programs, and employees who participate in these programs by
and large report that they are beneficial. Yet with the exception
of telecommuting, employee participation in flexibility programs
is low. In fact, the contrast between availability, participation, and
impact is striking. For example, less than 2 percent of women
and men participate in part-time programs, but those who do find
them highly beneficial.
There is also evidence that employees are reluctant to participate for
fear of being penalized. More than 90 percent of both women and men
believe taking extended family leave will hurt their position at work—
and more than half believe it will hurt them a great deal.
More than 90 percent
of both women and
men believe taking
extended family leave
will hurt their careers.
16 | WOMEN IN THE WORKPLACE : EMPLOYEE ATTITUDES
7/23/2019 Women Workplace
http://slidepdf.com/reader/full/women-workplace 17/30
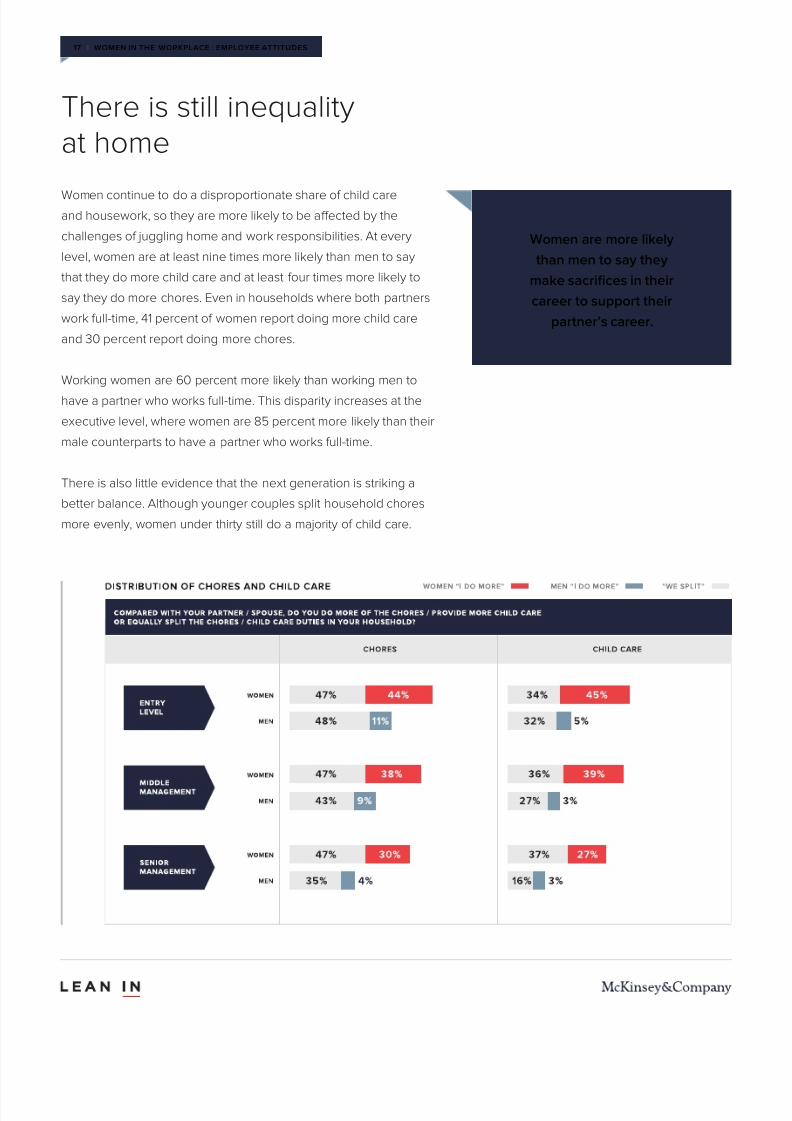
There is still inequality
at home
Women continue to do a disproportionate share of child careand housework, so they are more likely to be aff ected by the
challenges of juggling home and work responsibilities. At every
level, women are at least nine times more likely than men to say
that they do more child care and at least four times more likely to
say they do more chores. Even in households where both partners
work full-time, 41 percent of women report doing more child care
and 30 percent report doing more chores.
Working women are 60 percent more likely than working men to
have a partner who works full-time. This disparity increases at the
executive level, where women are 85 percent more likely than their
male counterparts to have a partner who works full-time.
There is also little evidence that the next generation is striking a
better balance. Although younger couples split household chores
more evenly, women under thirty still do a majority of child care.
Women are more likely
than men to say they
make sacrifices in their
career to support their
partner’s career.
17 | WOMEN IN THE WORKPLACE : EMPLOYEE ATTITUDES
7/23/2019 Women Workplace
http://slidepdf.com/reader/full/women-workplace 18/30
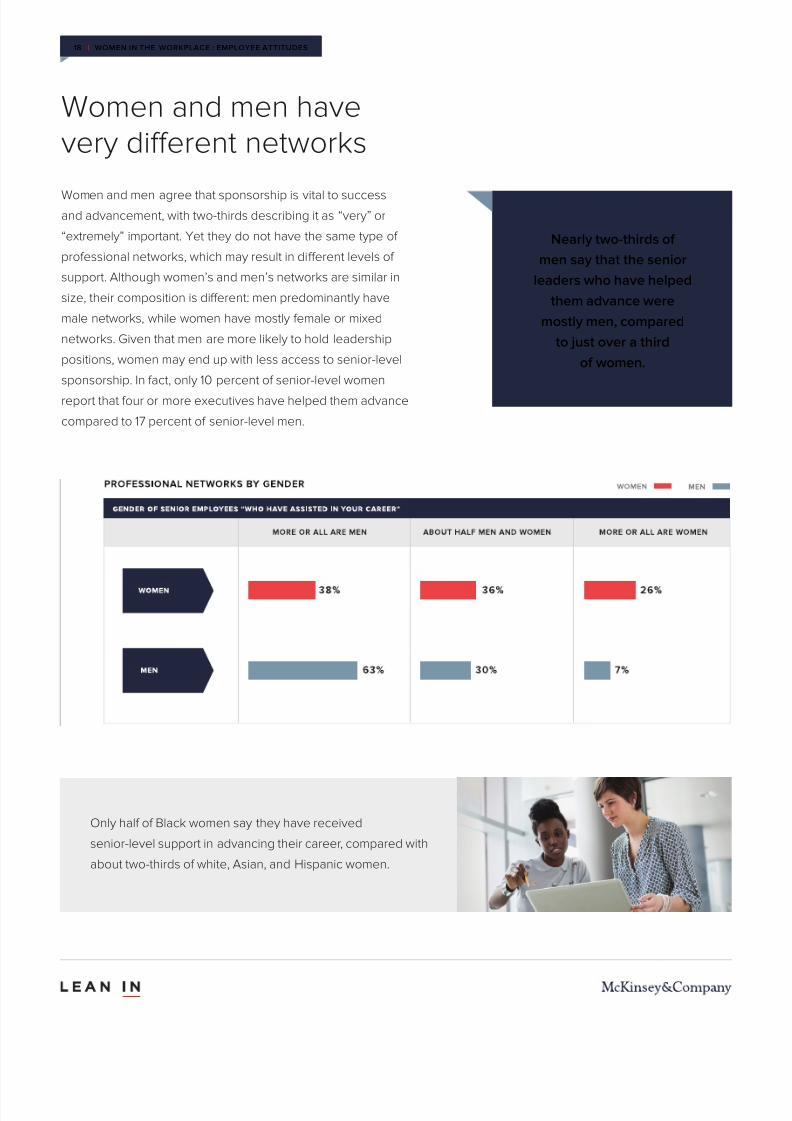
Women and men have
very diff erent networks
Women and men agree that sponsorship is vital to successand advancement, with two-thirds describing it as “very” or
“extremely” important. Yet they do not have the same type of
professional networks, which may result in diff erent levels of
support. Although women’s and men’s networks are similar in
size, their composition is diff erent: men predominantly have
male networks, while women have mostly female or mixed
networks. Given that men are more likely to hold leadership
positions, women may end up with less access to senior-level
sponsorship. In fact, only 10 percent of senior-level women
report that four or more executives have helped them advance
compared to 17 percent of senior-level men.
Only half of Black women say they have received
senior-level support in advancing their career, compared with
about two-thirds of white, Asian, and Hispanic women.
Nearly two-thirds of
men say that the senior
leaders who have helped
them advance were
mostly men, compared
to just over a third
of women.
18 | WOMEN IN THE WORKPLACE : EMPLOYEE ATTITUDES
7/23/2019 Women Workplace
http://slidepdf.com/reader/full/women-workplace 19/30
19 | WOMEN IN THE WORKPLACE : ROAD MAP
A road map to
gender equalityChanging the structure and culture of work to advance
women will take a comprehensive and sustained
eff ort, but gender diversity is an imperative for
companies that want to perform at the highest levels.
Although there is no “one size fits all” solution, we
recommend five key steps.

7/23/2019 Women Workplace
http://slidepdf.com/reader/full/women-workplace 20/30
Key performance indicators for gender equality
Employee pipeline
• Number of women and men at all
stages in the hiring process: sourcing,
résumé screening, interviews, off ers, and
acceptances
• Number of women and men hired (both newand lateral hires)
Performance reviews and
internal promotions
• Promotion rates for women and men
• Promotion rates for staff and line roles
• Performance ratings for women and men
• Allocation of stretch and high-visibility
assignments
Compensation
• Compensation across women and men in
similar levels and roles
Attrition
• Number of women and men leaving at all
levels and why
Employee attitudes/behaviors
• Satisfaction with role, opportunities for
growth, management, etc.
• Perception of meritocracy
• Desire to advance to next level
• Desire to advance to top executive roles
• Perception of work/life balance
Track key metrics so you
understand the problem
It is hard to change what you do not measure. Organizations needto understand their performance metrics (“hard” pipeline data) and
health metrics (“soft” cultural/attitudinal data) to know what is working
and where they can improve. While there is no set formula for this, we
recommend companies go beyond the basics of pipeline performance
to develop a more comprehensive picture of gender disparities. It is
also important that they track key metrics over time to see trends and
assess program eff ectiveness.
PERFORMANCE METRICS HEALTH METRICS
20 | WOMEN IN THE WORKPLACE : ROAD MAP
7/23/2019 Women Workplace
http://slidepdf.com/reader/full/women-workplace 21/30
Demonstrate that gender
diversity is a top priority
It is critical that senior leaders commit to gender diversity, butcommitment is not enough—getting the message across to
employees requires authenticity and accountability. Although 74
percent of companies report that gender diversity is a top CEO
priority, less than half of employees believe that to be true.
To make headway, companies need to invest time and money in
gender diversity. Executives can set the tone by participating in
women’s events and publicly sponsoring high-potential women.
In addition, companies should find ways to take action, from
investing heavily in initiatives that support women and inclusion
more broadly to reviewing employee compensation and closing
pay gaps.
Finally, setting gender targets—and holding leaders accountable
for reaching them—is another way for companies to demonstrate
their commitment and emphasize the importance of results. We
see emerging evidence that companies that set gender targets
for recruiting and advancement will realize better outcomes.
Among the twenty-five companies that participated in the 2012to 2015 studies, those with gender targets over the three-year
period saw the most progress in female representation at entry
levels, while those without formal targets lost ground.8
Only 37 percent of women
and 49 percent of men
believe gender diversity is a
top priority for their CEO.
8 The case study was based on ten companies that did not set targets in 2012 but did in 2015, six companies that set targets in both 2012 and 2015, and seven companies
that did not set targets in either year; two companies were excluded that had targets in 2012 but did not have them in 2015.
21 | WOMEN IN THE WORKPLACE : ROAD MAP
7/23/2019 Women Workplace
http://slidepdf.com/reader/full/women-workplace 22/30
Identify and interrupt
gender bias
Our research suggests that women are less likely to advancethan men, but generally speaking women see this uneven playing
field while men do not. To create an environment for change,
employees of both genders need to understand how gender
bias plays out in the workplace and contributes to creating fewer
opportunities for women.
Transparency and training are vital. If employees see that there
are real, measurable gender inequities in their organization, they
will be more likely to participate in solutions. Companies should
implement training to help employees learn how to identify and
counteract gender bias. This is particularly critical for managers,
who shape the day-to-day work experience of most employees.
It is important that companies find ways to minimize gender bias
in hiring and performance reviews. For example, hiring managers
should ensure that women and men are recruited equally for open
positions and establish consistent résumé review and interviewing
processes so the same standards apply to all candidates. In
the same vein, managers need to be aware of gender bias inperformance evaluations and make sure that evaluation criteria are
set in advance, understood, and measurable.
Only about one-third of
employees believe that
gender diversity is a top
priority for their direct
manager.
22 | WOMEN IN THE WORKPLACE : ROAD MAP
7/23/2019 Women Workplace
http://slidepdf.com/reader/full/women-workplace 23/30
9 For a review of social science studies on gender bias, see Joan C. Williams and Rachel Dempsey, What Works for Women at Work (New York: New York University Press,
2014); Emily Pronin, Thomas Gilovich, and Lee Ross, Objectivity in the Eye of the Beholder: Divergent Perceptions of Bias in Self Versus Others,” Psychological Review111, no. 3 (2004): 781–99; Emily Pronin, Daniel Y. Lin, and Lee Ross, “The Bias Blind Spot: Perceptions of Bias in Self Versus Others,” Personality and Social Psychology
Bulletin 28, no. 3 (2002): 369–81. 10 Madeline E. Heilman and Tyler G. Okimoto, “Why Are Women Penalized for Success at Male Tasks? The Implied Communality Deficit,”
Journal of Applied Psychology 92, no. 1 (2007): 81–92; and Madeline E. Heilman et al., “Penalties for Success: Reactions to Women Who Succeed at Male Gender-Typed
Tasks,” Journal of Applied Psychology 89, no. 3 (2004): 416–27. 11 Madeline E. Heilman et al., “Penalties for Success: Reactions to Women Who Succeed at Male Gender-
Typed Tasks,” Journal of Applied Psychology 89, no. 3 (2004): 416–27; Laurie A. Rudman and Peter Glick, “Prescriptive Gender Stereotypes and Backlash Toward Agentic
Women,” Journal of Social Issues 57, no. 4 (2001): 743–62; Laurie A. Rudman and Peter Glick, “Feminized Management and Backlash Toward Agentic Women: The Hidden
Costs to Women of a Kinder, Gentler Image of Middle Managers,” Journal of Personality and Social Psychology 77, no. 5 (1999): 1004–10; Laurie A. Rudman, “Self-Promotion
as a Risk Factor for Women: The Costs and Benefits of Counterstereotypical Impression Management,” Journal of Personality and Social Psychology 74, no. 3 (1998): 629–
45. 12 Corinne A. Moss-Racusin et al., “Science Faculty’s Subtle Gender Biases Favor Male Students,” Proceedings of the National Academy of Sciences of the United
States of America 109, no. 41 (2012): 16474–79; Claudia Goldin and Cecilia Rouse, “Orchestrating Impartiality: The Impact of ‘Blind’ Auditions on Female Musicians,” The
American Economic Review 90, no. 4 (2000): 715–41; Rhea E. Steinpreis, Katie A. Anders, and Dawn Ritzke, “The Impact of Gender on the Review of Curricula Vitae of Job
Applicants and Tenure Candidates: A National Empirical Study,” Sex Roles 41, nos. 7–8 (1999): 509–28. 13 Eric Luis Uhlmann and Geoff rey L. Cohen, “Constructed Criteria:
Redefining Merit to Justify Discrimination,” Psychological Science 16, no. 6 (2005): 474–80. For a discussion, see Cheryl Staats, State of the Science: Implicit Bias Review
(2014), Kirwan Institute, Ohio State University. 14 Joanna Barsh and Lareina Yee, Special Report: Unlocking the Full Potential of Women in the U.S. Economy , McKinsey &
Company (April 2012), 6, http://www.mckinsey.com/unlocking_potential .
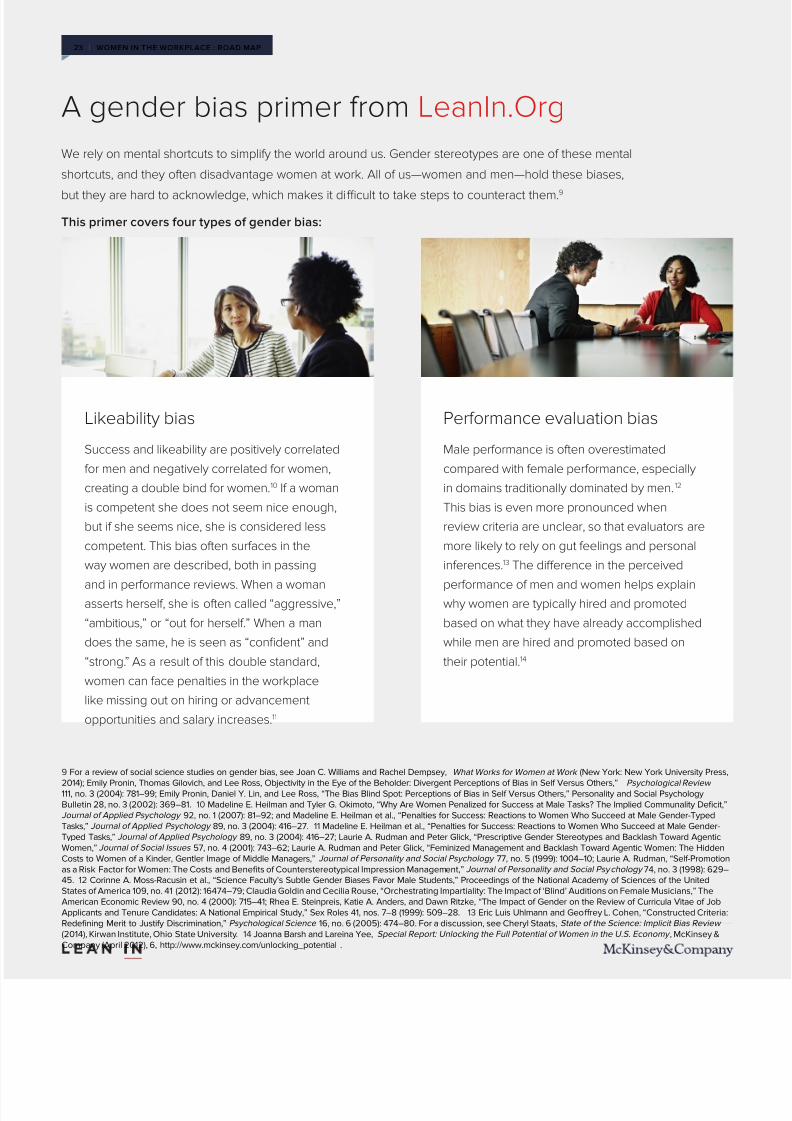
Likeability bias
Success and likeability are positively correlated
for men and negatively correlated for women,
creating a double bind for women.10 If a woman
is competent she does not seem nice enough,
but if she seems nice, she is considered less
competent. This bias often surfaces in the
way women are described, both in passing
and in performance reviews. When a womanasserts herself, she is often called “aggressive,”
“ambitious,” or “out for herself.” When a man
does the same, he is seen as “confident” and
“strong.” As a result of this double standard,
women can face penalties in the workplace
like missing out on hiring or advancement
opportunities and salary increases.11
Performance evaluation bias
Male performance is often overestimated
compared with female performance, especially
in domains traditionally dominated by men.12
This bias is even more pronounced when
review criteria are unclear, so that evaluators are
more likely to rely on gut feelings and personal
inferences.13 The diff erence in the perceived
performance of men and women helps explainwhy women are typically hired and promoted
based on what they have already accomplished
while men are hired and promoted based on
their potential.14
A gender bias primer from LeanIn.Org
We rely on mental shortcuts to simplify the world around us. Gender stereotypes are one of these mental
shortcuts, and they often disadvantage women at work. All of us—women and men—hold these biases,
but they are hard to acknowledge, which makes it difficult to take steps to counteract them.9
This primer covers four types of gender bias:
23 | WOMEN IN THE WORKPLACE : ROAD MAP
7/23/2019 Women Workplace
http://slidepdf.com/reader/full/women-workplace 24/30
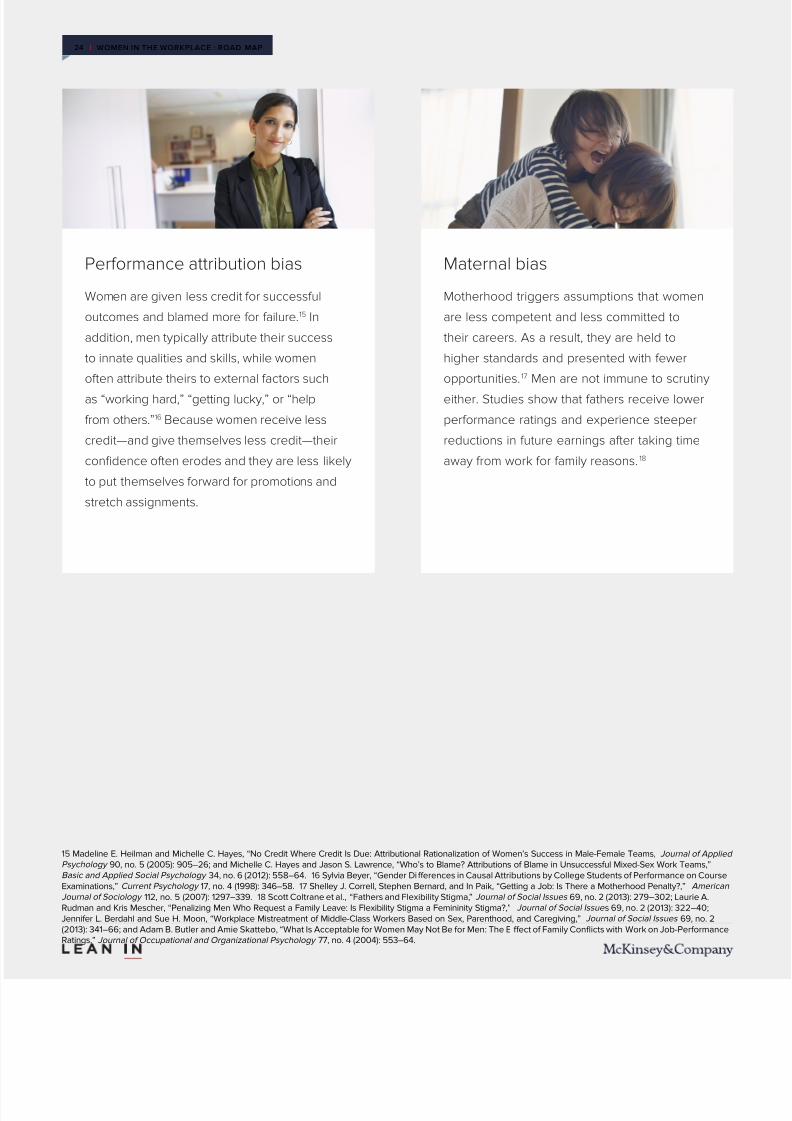
Performance attribution bias
Women are given less credit for successful
outcomes and blamed more for failure.15 In
addition, men typically attribute their success
to innate qualities and skills, while women
often attribute theirs to external factors such
as “working hard,” “getting lucky,” or “help
from others.”16 Because women receive less
credit—and give themselves less credit—their
confidence often erodes and they are less likely
to put themselves forward for promotions and
stretch assignments.
Maternal bias
Motherhood triggers assumptions that women
are less competent and less committed to
their careers. As a result, they are held to
higher standards and presented with fewer
opportunities. 17 Men are not immune to scrutiny
either. Studies show that fathers receive lower
performance ratings and experience steeper
reductions in future earnings after taking time
away from work for family reasons.18
15 Madeline E. Heilman and Michelle C. Hayes, “No Credit Where Credit Is Due: Attributional Rationalization of Women’s Success in Male-Female Teams, Journal of Applied
Psychology 90, no. 5 (2005): 905–26; and Michelle C. Hayes and Jason S. Lawrence, “Who’s to Blame? Attributions of Blame in Unsuccessful Mixed-Sex Work Teams,”
Basic and Applied Social Psychology 34, no. 6 (2012): 558–64. 16 Sylvia Beyer, “Gender Diff erences in Causal Attributions by College Students of Performance on Course
Examinations,” Current Psychology 17, no. 4 (1998): 346–58. 17 Shelley J. Correll, Stephen Bernard, and In Paik, “Getting a Job: Is There a Motherhood Penalty?,” American
Journal of Sociology 112, no. 5 (2007): 1297–339. 18 Scott Coltrane et al., “Fathers and Flexibility Stigma,” Journal of Social Issues 69, no. 2 (2013): 279–302; Laurie A.
Rudman and Kris Mescher, “Penalizing Men Who Request a Family Leave: Is Flexibility Stigma a Femininity Stigma?,” Journal of Social Issue s 69, no. 2 (2013): 322–40;
Jennifer L. Berdahl and Sue H. Moon, “Workplace Mistreatment of Middle-Class Workers Based on Sex, Parenthood, and Caregiving,” Journal of Social Issues 69, no. 2
(2013): 341–66; and Adam B. Butler and Amie Skattebo, “What Is Acceptable for Women May Not Be for Men: The Eff ect of Family Conflicts with Work on Job-Performance
Ratings,” Journal of Occupational and Organizational Psychology 77, no. 4 (2004): 553–64.
24 | WOMEN IN THE WORKPLACE : ROAD MAP
7/23/2019 Women Workplace
http://slidepdf.com/reader/full/women-workplace 25/30
More than 90 percent of
women and men believe
a leave of absence to
handle a family matter will
hurt their career.
Rethink work
Work is not working for lots of employees. While many companies
off er programs aimed at addressing the commitments employees
have outside the workplace, their low uptake suggests that their
efficacy needs to be evaluated.
Working parents are one group that feels this tension. Parents of
both genders are concerned about balancing work and family.
However, they take very little advantage of family-friendly programs,
often for fear of being penalized at work.
Companies need to do more to give all employees the flexibility
to fit work into their lives, from off ering programs that do not
inadvertently penalize participants to fostering a culture that gives
employees permission to take advantage of these options.
In many cases, this requires a more holistic approach to employee
programs. Take parental leave as an example. Off ering it piecemeal
is not enough. Companies should consider implementing ramp-off /
ramp-on programs to ease employee transitions and adjusting the
annual review process to make it clear that employees who take a
leave will not be penalized. In addition, employees need to know
that management supports their decisions to start families and take
parental leave—for example, by making sure high-profile women
and men take full advantage of such programs and celebrating their
decisions publicly.
25 | WOMEN IN THE WORKPLACE : ROAD MAP
7/23/2019 Women Workplace
http://slidepdf.com/reader/full/women-workplace 26/30
Manager Checklist
Conduct regular check-ins with the individuals on your team to understand their aspirations and what
is driving their desire (or lack of desire) to advance. Unless you understand what is aff ecting women’s
ambitions, you cannot do anything to encourage them.
Tap women and men equally to take on high-profile assignments and new opportunities, and push back if
women say they’re “not ready” or “not qualified.” In addition, track the distribution of mission-critical work to
make sure it is evenly divided among women and men.
Talk openly about the trade-off s between staff roles and line roles, and make sure everyone understands
that line roles off er the type of experience that typically accelerates advancement and more often leads to
the C-suite.
Create a level playing field
Companies need to make sure women have access to the same
opportunities as men, and managers and sponsors have a critical
role to play in making this happen.
It is important that managers see themselves as proponents of
the women who report to them. Companies should put systems
in place so managers have the skills to support women and are
rewarded when they do so.
Sponsorship can accelerate career advancement, yet there
is evidence that it is harder for women to gain the support of
senior-level men. Companies can help by establishing formal
mentorship and sponsorship programs and making it a badge of
honor to support women in the organization. From networking
events to group lunches, they can create opportunities for informal
interaction between women and men—these personal connections
can lead to the professional relationships that propel careers.
Finally, company leaders can make sure they sponsor a diverse
group of employees.
Only 40 percent of
companies hold managers
accountable for performance
on gender-diversity metrics.
26 | WOMEN IN THE WORKPLACE : ROAD MAP

7/23/2019 Women Workplace
http://slidepdf.com/reader/full/women-workplace 27/30
Create a virtuous cycle
of female leadership
Company leaders should make it a priority to make senior-
level women feel encouraged and appreciated. Our research
shows that senior-level women are particularly disillusioned
and dissatisfied with their careers, and this works against
creating an environment that fosters female leadership. We
need senior-level women to become more optimistic so they
continue to push to reach the highest levels of the organization
and serve as positive role models for more junior women.
Tap into the power of peer support
Lean In Circles are small peer groups that meet regularly to learn and grow
together. Circles are designed so members practice new skills and benefit
from the insights and expertise of the group. Research shows that peopleare more confident and are able to learn and accomplish more in groups.19
More than 650 companies currently run Circles, and they are producing
results—83 percent of members say they are more likely to tackle a new
challenge or opportunity.
19 Patrick R. Laughlin, Erin C. Hatch, Jonathan S. Silver, and Lee Boh, “Groups Perform Better Than the Best Individuals on Letters-to-Numbers Problems: Eff ects of Induced
Strategies,” Journal of Personality and Social Psychology 90, no. 4 (2006): 644–51; and Paul Zarnoth and Janet A. Sniezek, “The Social Influence of Confidence in Group
Decision Making,” Journal of Experimental Social Psychology 33, no. 4 (1997): 345–66.
27 | WOMEN IN THE WORKPLACE : ROAD MAP
7/23/2019 Women Workplace
http://slidepdf.com/reader/full/women-workplace 28/30
We will all benefit from gender equality in the workplace. Companies that leverage the full talents
of the population have a competitive advantage. Employees on diverse and inclusive teams put
in more eff ort, stay longer, and demonstrate more commitment.20 Women and men of all ages
benefit from the flexibility to be their best selves at work and at home.
While there is still significant work to do, it is encouraging to note that a majority of women and
men report being satisfied with their careers, family situations, and personal lives. Building on this
foundation, corporate America can eliminate the barriers women face and help all employees
achieve their full potential.
Looking ahead
20 Corporate Executive Board, Creating Competitive Advantage Through Workforce Diversity (2013), http://www.diversityresources.stlrbc.org/wp-content/uploads/2013/10/
HRLC-Creating_Competitive_Advantage_Through_Workforce_Diversity.pdf .
28 | WOMEN IN THE WORKPLACE : LOOKING AHEAD
7/23/2019 Women Workplace
http://slidepdf.com/reader/full/women-workplace 29/30
Acknowledgments LeanIn.Org and McKinsey & Company would like to
thank the 118 companies and nearly 30,000 employees
who participated in the Women in the Workplace 2015
study. Their information and insights off er new visibility
into the state of women in the workplace and the steps
that companies can take to achieve gender equality.
Both organizations would also like to acknowledge and
thank the team at SurveyMonkey for their contributions
to the study.
29 | WOMEN IN THE WORKPLACE : ACKNOWLEDGMENTS
All creative images in this report courtesy of Getty Images from the Lean In Collection.

7/23/2019 Women Workplace
http://slidepdf.com/reader/full/women-workplace 30/30
Methodology
30 | WOMEN IN THE WORKPLACE : METHODOLOGY
COMPANY PIPELINE AND PROGRAMS SURVEY
This study is based on research from 118 companies across North
America and builds on research from 60 companies in a similar
study conducted by McKinsey & Company in 2012. Twenty-five
companies participated in both years. Each participating company
submitted its gender diversity talent pipeline, policies and programs
data to McKinsey.
We drew aggregate conclusions from this data set using the
following heuristics:
• Averaging by company: In calculating averages across
companies, each company received equal weighting to avoid a
skew favoring the results of the largest employers.
• Industries weighted to match Fortune 500: Results were also
weighted by industry to approximate the industry composition
of the Fortune 500 as of July 27, 2015, to avoid a skew toward
industries overrepresented in our sample.
• Likelihood of advancement: Women’s likelihood of advancing
compared with men’s was calculated by taking the ratio of
women in a lower level to women at the next level compared
with the ratio of men in a lower level to men at the next level.
This ratio assumes that the more senior level pulls directly from
the level below and does not factor in attrition or external hires.
EMPLOYEE ATTITUDES SURVEY
This study is based on research from thirty-four companies and
nearly 30,000 employees in North America and comprised ninety-two questions.
We drew aggregate conclusions from this data set using the
following heuristics:
• 95 percent confidence level: Diff erences reported are
statistically significant at a 95 percent confidence level unless
otherwise indicated.
• Diff erences greater than 5 percent: Where we report
diff erences between groups of participants, those diff erences
are at least five percentage points.
DEFINITION OF LEVELS
Companies divided their employees into six levels of senioritybased on standard definitions. Companies with more or fewer
than six levels were encouraged to consider three elements when
assigning employees: reporting structure, salary, and advancement.
The levels and definitions are as follows:
• L1—C-level executives and presidents: CEO and his or her
direct reports, responsible for company operations and
profitability
• L2—Senior vice presidents: Senior leaders of the organization
with significant business unit or functional oversight
• L3—Vice presidents: Leaders of the organization who report
directly to senior vice presidents
• L4—Senior manager / Director: Seasoned managers with
responsibility for multiple teams and discrete functions or
operating units
• L5—Managers: Employees who have management
responsibility over a store or team
• L6—Individual contributors: Employees who carry out discrete
tasks and participate on teams, typically in an office or
corporate setting
TAXONOMY OF SENIORITY GROUPINGS
To analyze characteristics of women by seniority, the six levels
were further consolidated into three groupings: senior, middle
management, and entry level. This was done to have a large
enough sample size to run statistically significant analyses given
the uneven distribution (the result of few executive women). The
mapping of levels to these groupings is:
• Senior—L1, L2, and L3
• Middle management—L4 and L5
• Entry level—L6
COMPANIES INCLUDED
Participating companies opted in to the study in response to
invitations from LeanIn.Org and McKinsey & Company or by
indicating interest through a public website. Their participation in
the employee attitudes survey was encouraged but optional. The
industry breakdown of participating companies is as follows:
• Health care and pharmaceuticals—ten
• Industrial (energy, basic materials, automotive, and industrial
manufacturing)—fifteen
• Media and telecom—thirteen
• Finance and professional services (banking, consumer finance,
capital markets, insurance, and professional services) —twenty-
one
• Retail and consumer products (retail, nonfood consumer
products, and food and beverage)—twenty
• Tech (electronics, technology hardware, software, and
information technology services)—twenty-six
• Transport, travel, and logistics (logistics, transportation, and
hospitality)—thirteen
OTHER REGIONS
In addition to data from North America, we collected parallel data
to these two surveys in four additional geographic regions: Europe,
Asia Pacific, Latin America, and Middle East/Africa. While we may
publish further analysis on these regions at a later date, this report
deals only with findings from North America, in which the vast