Embed Size (px)
Citation preview

Illinois State University Illinois State University
ISU ReD: Research and eData ISU ReD: Research and eData
Theses and Dissertations
10-25-2016
Women On The Board Of Directors And Their Impact On The Women On The Board Of Directors And Their Impact On The
Financial Performance Of A Firm: An Empirical Investigation Of Financial Performance Of A Firm: An Empirical Investigation Of
Female Directors In The United States Technology Sector Female Directors In The United States Technology Sector
Obinna Mogbogu Illinois State University, [email protected]
Follow this and additional works at: https://ir.library.illinoisstate.edu/etd
Part of the Databases and Information Systems Commons
Recommended Citation Recommended Citation Mogbogu, Obinna, "Women On The Board Of Directors And Their Impact On The Financial Performance Of A Firm: An Empirical Investigation Of Female Directors In The United States Technology Sector" (2016). Theses and Dissertations. 625. https://ir.library.illinoisstate.edu/etd/625
This Thesis is brought to you for free and open access by ISU ReD: Research and eData. It has been accepted for inclusion in Theses and Dissertations by an authorized administrator of ISU ReD: Research and eData. For more information, please contact [email protected].
WOMEN ON THE BOARD OF DIRECTORS AND THEIR IMPACT ON THE FINANCIAL
PERFORMANCE OF A FIRM: AN EMPIRICAL INVESTIGATION OF FEMALE
DIRECTORS IN THE UNITED STATES TECHNOLOGY SECTOR
Obinna O. Mogbogu
41 Pages
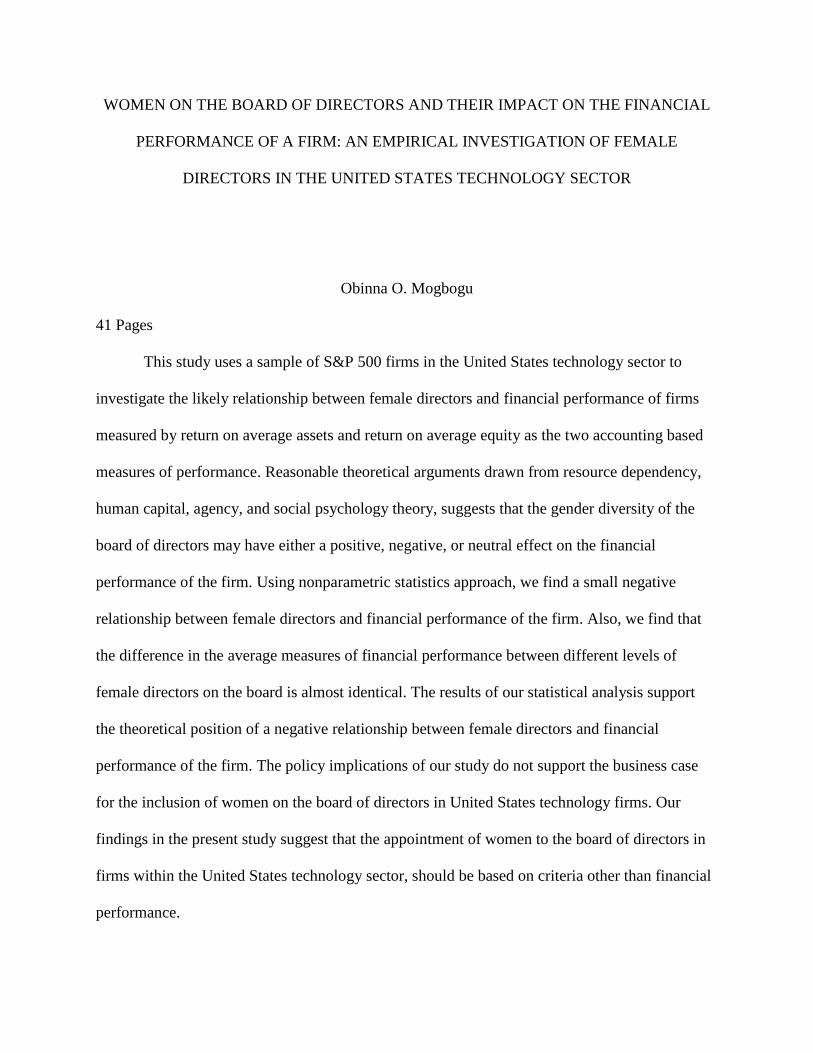
This study uses a sample of S&P 500 firms in the United States technology sector to
investigate the likely relationship between female directors and financial performance of firms
measured by return on average assets and return on average equity as the two accounting based
measures of performance. Reasonable theoretical arguments drawn from resource dependency,
human capital, agency, and social psychology theory, suggests that the gender diversity of the
board of directors may have either a positive, negative, or neutral effect on the financial
performance of the firm. Using nonparametric statistics approach, we find a small negative
relationship between female directors and financial performance of the firm. Also, we find that
the difference in the average measures of financial performance between different levels of
female directors on the board is almost identical. The results of our statistical analysis support
the theoretical position of a negative relationship between female directors and financial
performance of the firm. The policy implications of our study do not support the business case
for the inclusion of women on the board of directors in United States technology firms. Our
findings in the present study suggest that the appointment of women to the board of directors in
firms within the United States technology sector, should be based on criteria other than financial
performance.

KEYWORDS: board composition, board gender diversity, board of directors, corporate
governance, female directors, financial performance, gender diversity, technology, united states,
women

WOMEN ON THE BOARD OF DIRECTORS AND THEIR IMPACT ON THE FINANCIAL
PERFORMANCE OF A FIRM: AN EMPIRICAL INVESTIGATION OF FEMALE
DIRECTORS IN THE UNITED STATES TECHNOLOGY SECTOR
OBINNA O. MOGBOGU
A Thesis Submitted in Partial
Fulfillment of the Requirements
for the Degree of
MASTER OF SCIENCE
School of Information Technology
ILLINOIS STATE UNIVERSITY
2016

Copyright 2016 Obinna O. Mogbogu

WOMEN ON THE BOARD OF DIRECTORS AND THEIR IMPACT ON THE FINANCIAL
PERFORMANCE OF A FIRM: AN EMPIRICAL INVESTIGATION OF FEMALE
DIRECTORS IN THE UNITED STATES TECHNOLOGY SECTOR
OBINNA O. MOGBOGU
COMMITTEE MEMBERS:
James Wolf, Chair
David Sikolia

i
ACKNOWLEDGMENTS
First, I will like to thank my committee members, Dr. James Wolf and Dr. David Sikolia
for guiding me through the successful completion of my master’s thesis. I am very blessed to
have worked under the supervision of both professors. I shall always speak highly of you both,
wherever I go. It has been a pleasure working with you both. I wish you all including your
respective family, a happy life.
I will like to thank my advisor, Sarah Jerome, who have been very supportive during the
one-year period that I spent working on my thesis. I wish you and your family a wonderful life. I
will like to thank Dr. Crowley Paula (Department of Special Education) who also, have been
very nice to me as a mother. May the best things of life always continue to find you and your
family. I will like thank Dr. Amy Hurd, Dana Davidson, Dr. John Baur, and Sarah Dick for being
absolutely nice to me. I wish you all the best in life. I will like to thank Dr. Sarah Walczynski,
who not only has been a wonderful professor but also, have been an amazing person. I am glad
that I got the chance knowing you before I graduate. Thank you for all the support, as well as, the
amazing lectures that you have taught. May all the good things of life come to you and your
family. Also to all the professors in the Information Systems department, I wish you all the best
in life.
Last, I will like to thank my amazing family, my uncles, Kene and Ajulu, my aunt, Nkem,
my dad, my sisters and most importantly my mum who have always supported me in my
struggles. Thank you all so much for all the great experiences that we have shared together as a
family. My heart goes out to you all. May you all continue to remain blessed, successful, and
happy in the years ahead. Shout out to all my friends as well. I wish you all the best in life.
O. O. M.

ii
CONTENTS
Page
ACKNOWLEDGMENTS i
CONTENTS ii
TABLES iv
FIGURES v
CHAPTER I: INTRODUCTION 1
CHAPTER II: LITERATURE REVIEW 4
Theoretical Framework 4
Resource Dependency Theory 5
Human Capital Theory 6
Agency Theory 7
Social Theory 8
Previous Empirical Studies 9
Positive Relationship 9
Negative Relationship 11
No Relationship 12
Null Hypotheses 14
CHAPTER III: METHOD 17
Research Design 17
Sample 17
Data Gathering Procedure and Variables 18
iii
CHAPTER IV: STATISTICAL ANALYSIS AND RESULTS 21
Statistical Tool and Selected Significance Level 21
Shapiro Wilks Test Analysis and Results 21
Spearman Correlation Analysis and Results 22
Kruskal Wallis Rank Sum Test Analysis and Results 27
CHAPTER V: CONCLUSION 34
REFERENCES 38

iv
TABLES
Table Page
1. Descriptive Statistics of the Sample Variables 20
2. Shapiro Normality Test Results 22
3. Calculated p Values Among Variables 24
4. Calculated Spearman (rho) Correlation Among Variables 24
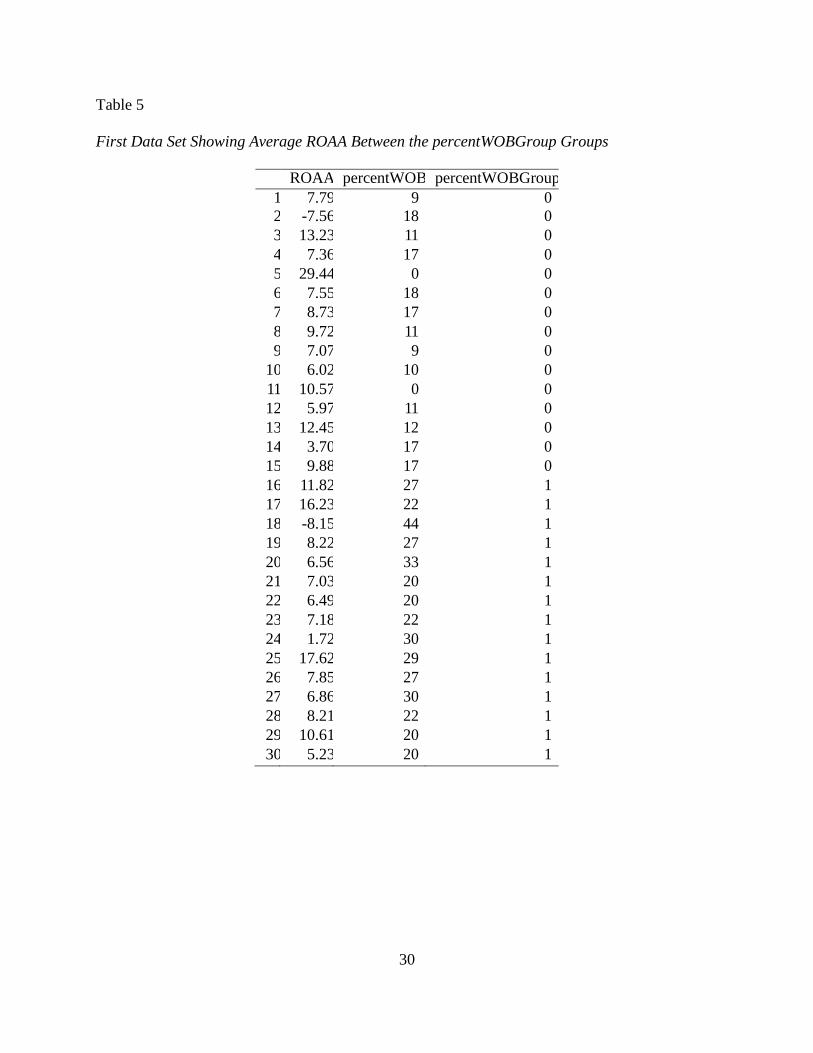
5. First Data Set Showing Average ROAA Between the percentWOBGroup Groups 30
6. Second Data Set Showing Average ROAE Between the percentWOBGroup Groups 31
7. Kruskal Wallis Test of First Null Hypothesis Using the First Data Set 32
8. Kruskal Wallis Test of Second Null Hypothesis Using the Second Data Set 32

v
FIGURES
Figure Page
1. Scatterplot diagram showing the monotonic relationship between ROAA and
percentWOB variables 25
2. Scatterplot diagram showing the monotonic relationship between ROAE and
percentWOB variables 26
3. Scatterplot matrix diagram showing the correlation among ROAA, ROAE, and
percentWOB variables 27
4. Average ROAA between two percentWOBGroup groups 32
5. Average ROAE between two percentWOBGroup groups 33
1
CHAPTER I: INTRODUCTION
The board of directors acts as an internal governance mechanism via its appointment,
supervision and remuneration of senior managers, as well as its framing of corporate strategy
(Campbell & Minguez-Vera, 2008; Minguez-Vera & Martin, 2011). The board composition in
firms is of vital importance within corporate governance, where the aim is to identify structures
that align the interests of management and stakeholders (Rose, 2007).
Hillman, Cannella, and Harris (2002) contend that one of the most important trends in the
composition of the board over the past two decades has generally been centered on the diversity
of the board. There have been several studies on board diversity in the context of a few
developed and developing countries, such as in the United States (Carter, Simkins, & Simpson
2003), Spain (Campbell & Minguez-Vera, 2008), Norway (Oxelheim & Randoy, 2003), Turkey
(Ararat, Aksu, & Tansel, 2010), and Indonesia (Darmadi, 2011). A few number of scholars have
also attempted to link the diversity of the board with different aspects within the firm, such as
corporate strategic change (Goodstein, Gautam, & Boeker, 1994), corporate governance (Adams
& Ferreira, 2009), and corporate social performance (Coffey & Wang, 1998).
In the United States, there has been an ongoing debate regarding the gender diversity of
the board in firms. The gender diversity of the board (or board gender diversity) is defined as the
number or percentage of women on the board of directors. Many scholars studying the board
composition of firms in the United States have attempted to explain the reason behind the
underrepresentation of women on the board of directors. In the United States, there are
increasing attempts by firms to promote equal opportunity among different groups in the
workplace (Ibarra, 1993). The equal employment opportunity commission (EEOC) established in
1965 is used by firms to promote diversity in the United States workforce. Despite many

2
attempts by firms in the United States to improve the gender diversity of the board, many
evidence suggest that the number of women on the board of directors still remains significantly
lower than their male counterparts (Kakabadse, Figueira, Nicolopoulou, Hong Yang, Kakabadse,
& Ozbilgin, 2015).
More recently, the gender diversity of the board has generated debate about the impact of
female directors on the performance of the firm. Few scholars have investigated the relationship
between female directors and financial performance of the firm. Recent empirical studies have
linked the gender diversity of the board with an improved financial performance (Campbell &
Minguez-Vera, 2008; Carter, Simkins, & Simpson 2003; Erhardt, Werbel, & Shrader, 2003).
However, several other studies have pointed to a negative link between the gender diversity of
the board and financial performance of the firm (Adams & Ferreira, 2009; Minguez-Vera &
Martin, 2011), while several other studies have generally been inconclusive on the link itself (N.
Smith, V. Smith, & Verner, 2006; Rose, 2007; Farrell & Hersch, 2005; Shrader, Blackburn, &
Iles, 1997; Carter, D’Souza, Simkins, & Simpson, 2010).
The key issue is whether the gender diversity of the board will stimulate performance in
the firm. In other words, would a more gender diverse board have any impact on the financial
performance of the firm? A realistic understanding of the possible relationship between the
gender diversity of the board and performance of the firm has several important implications for
both public and corporate governance policies in firms. If there is no relationship between the
gender diversity of the board and performance of the firm, then the desirability of a gender
diverse board becomes a public policy issue. However, if there is a positive relationship between
the gender diversity of the board and performance of the firm, then the economic implications of
a gender diverse board are important. Furthermore, if the relationship is negative, then the costs
3
of inclusion of female directors on the board becomes a factor that is to be considered (Carter,
D’souza, Simkins, & Simpson, 2010).
The present study uses a sample of top technology firms listed in the Standard and Poor’s
(S&P) 500 firms for the year 2016. The present study follows a descriptive research approach to
investigate the likely relationship between female directors and financial performance of firms in
the United States technology sector. Financial performance is measured by return on average
assets (ROAA) and return on average equity (ROAE) as the two accounting based measures of
firm’s performance. The present study is considered to be significant, since it offers the
possibility to improve our understanding of the existing business cases for the inclusion of
women on the board of directors, particularly in technology firms situated in the United States.
Thus, the present study deviates from other research studying diversity at the individual, group or
board level alone by investigating the relationship between female directors and financial
performance of firms in the context of the United States technology sector.
The remainder of the paper is organized as follows: chapter two reviews the related
literature and formulate the hypotheses for the present study. In chapter three, we present the
research design. In chapter four, we present the result of the statistical analysis that was
conducted in the present study. We conclude the present study with a discussion of the research
findings in chapter five.

4
CHAPTER II: LITERATURE REVIEW
Theoretical Framework
The board of directors provides four important functions to the firm, this include (1)
monitoring and controlling managers, (2) providing information and counsel to managers, (3)
monitoring compliance with applicable laws and regulations, and (4) linking the corporation to
the external environment (Carter, D’Souza, Simkins, & Simpson, 2010). A number of existing
theories have addressed these functions in one way or another. It is argued that the execution of
these functions by the board, is largely dependent on the composition of the board itself. A well-
organized board comprising of the right composition of board members is generally believed to
be capable of increasing the firm’s performance, by being able to execute all four of the
functions mentioned above. This idea offers the possibility that board composition, in regards to
the gender diversity of the board, is perhaps, likely related to the performance of the firm.
There are a few number of theories from various fields, which have tried to examine the
nature of the relationship between board diversity and financial performance of the firm.
However, there is no single theory that is known to have directly predicted the nature of the
relationship itself. In this section, we adopt an interdisciplinary approach and draw from four
important theories taken from organization theory, economics, and social psychology to provide
the theoretical basis for the hypotheses tested. The four theories discussed in this section provide
some of the known business cases of a gender diverse board of directors in firms. The four
theories we will be reviewing in this section are resource dependency, human capital, agency,
and social psychological theory.

5
Resource Dependency Theory
One of several propositions to dominate the business case of a gender diverse board of
directors is, the notion that female directors provide a unique set of valuable information to both
the board and managers, which helps improve the decision making approach that is undertaken
by the board and ultimately, increase the financial performance of the firm (Fama & Jensen,
1983; Adams & Ferreira, 2007). A related, but more extensive proposition for the business case
of a gender diverse board of directors follows from the resource dependency theory, which posits
that a diverse board will bring diverse perspectives and several nontraditional approaches to
problem solving. The resource dependency theory provides the basis for some of the most
convincing theoretical arguments for the business case of a diverse board of directors.
Pfeffer and Salancik (2003) suggested that the board of directors could serve as a linkage
between a corporation and other external organizations to address environmental dependencies.
They also suggested the following four benefits for the external linkage that is created by the
board of directors: (1) directors deliver valuable resources, such as information and expertise to
managers, (2) directors facilitate an open channel of communication with constituents of
importance to the firm, (3) directors obtain commitments of support from other important
organizations or groups in the external environment, and (4) directors create and supply
legitimacy for the firm in the external environment.
The resource dependency theory also posits that a diverse board of directors will be
capable of providing unique and valuable information to the entire members of the board, as well
as, to the firm’s top managers, which could improve the decision making process in the firm and
ultimately impact the firm’s overall performance. The resource dependency theory also suggests
that the difference in the diversity of the board of directors, will make it possible for firms to

6
have more access to the labor and product market, as well as, an improved accessibility to a
larger and diverse talent pool of human capital resource, which can facilitate the provision and
appointment of more female employees into leadership positions in the firm. Furthermore, the
resource dependency theory suggest a more diverse board of directors will send a positive signal
to the firm’s shareholders, its customer base, and the government as well, in order to publicly
indicate that the firm values and understands the importance of having a generally diverse
workforce composition (Booth & Deli, 1999; Agrawal & Knoeber, 2001).
Human Capital Theory
Terjesen, Sealy, and Singh (2009) used the work of (Becker, 1964) to define the human
capital theory as, the individual’s value to the organization, in regards to, their wealth of
education, work experience, and level of skillsets, which are available and beneficial to the firm
The human capital theory predicts that the diversity of the board of directors will have an impact
on the firm’s performance, as a result of the unique human capital attributes that becomes
available from simply having a diverse board of directors. However, the human capital theory
warns that the effect of a diverse board of directors on the firm’s financial performance could be
positive or negative, since it largely depends on the situation, as well as, the approach that a firm
has decided to use, in order to derive value from the human capital that is available to them.
This is in accordance with the contingency theory in the sense that the value of the
available human capital in one firm at some point in time, may not always remain the same at
other given times or situations (Fiedler & Chemers, 1967; Lawrence & Lorsch, 1967). In other
words, the value of having a woman on the board of directors as a result of her unique set of
human capital attributes, may not always result in a positive or negative impact on the firm’s

7
financial performance; given how the firm uses the available human capital it has on its board of
directors to achieve its targeted financial performance.
Agency Theory
One of the primary functions of the board of directors is the monitoring and controlling
of managers in the firm, which is a fundamental concept from the agency theory itself (Jensen &
Meckling, 1976). The role of the board of directors in an agency framework is to resolve agency
problems that may exist between managers and shareholders, by compensating the shareholders
or replacing the managers that do not create value to the shareholders of the firm (Fama &
Jensen, 1983). One business case for diversity is that the diversity of the board of directors
increases the board’s independence. This implies that members of a very diverse board of
directors are more likely to ask questions and approach problems differently when dealing with
managers than a traditionally or less diverse board of directors will. Therefore, making a more
diverse board of directors a better monitor of managers than one that is not (Carter, Simkins, &
Simpson, 2003).
From the agency theory, one can assume that there is value in having more women serve
on the board of directors, since their presence on the board of directors will make the board more
independent and effective at supervising the managers in the firm. However, the agency theory
warns that a firm may not achieve any value from simply having women serve on its board of
directors. This is likely the case when the women on the board of directors are marginalized from
partaking in many of the board of directors’ crucial activities that could directly have an impact
on the performance of the firm. As more women become increasingly marginalized on the board
of directors, the chances are that a firm will lose many of the potential benefits that are assumed
to be available in a gender diverse board of directors, such as the board of directors’ ability to

8
effectively supervise the managers of the firm (Ibarra, 1993). It is important to note that the
agency theory does not provide a clear prediction of the link between the diversity of the board
of directors and the performance of the firm. However, the agency theory does not dismiss the
possibility that the diversity of the board of directors, could be beneficial in some ways to the
firm.
Social Theory
The presence of women on the board of directors is often viewed favorably by corporate
stakeholders. However, Westphal and Milton (2000) used the social psychology theory to argue
that the presence of women on the board of directors could lower social cohesion between
groups, thus creating a social barrier among the members of the board, which could make it more
difficult for the number of female directors who are on the board, to have any positive value to
both the board’s performance and overall firm’s performance as well.
The social psychology theory predicts that the individuals who have a majority status on
the board (e.g., male directors in most cases), will have the potential to exert an unequal amount
of influence in the board’s decision making processes than the individuals who have a minority
status on the same board (e.g., female directors in this case). Despite the argument by Westphal
et al. (2000), which warns of a likely negative effect of board gender diversity on the firm’s
performance, the social psychology theory still posits that the gender diversity of the board of
directors will not impact the board of directors’ ability to execute its functions and more so, will
not have any influence on the performance of the firm.
Westphal et al. (2000) however suggested that the presence of women on the board of
directors may encourage divergent thinking in the decision making process. Consequently,
suggesting that a more gender diverse board of directors will produce and enhance creativity, as

9
well as, innovation on the board of directors itself. Although, they also suggested that an
increased level of diversity on the board of directors could as well, potentially increase conflict
among its members. Lau and Murnighan (1998) suggested that the conflict(s) that arises within
the board of directors due to its level of diversity, could only make the decision making process
suffer by becoming slower and less effective. The social psychology theory uses the contingency
theory to suggest that the diversity of the board of directors may lead to either a positive or
negative influence on the overall performance of the firm depending on the social dynamic state
of the board at different times or situations.
Previous Empirical Studies
In this section, we review ten past studies in the corporate governance literature that are
known to have empirically investigated the relationship between female directors and financial
performance of the firm. The results from all ten of these studies have generally been mixed.
Some have reported either a positive or negative relationship between female directors and
financial performance of the firm, while others have been inconclusive on the subject matter
itself. We present all ten empirical studies in the following subsections: (1) positive relationship,
(2) negative relationship, and (3) no relationship.
Positive Relationship
Campbell and Minguez-Vera (2008) adopted a panel data methodology in their study in
order to examine the relationship between female directors’ participation and firm’s value.
Tobin’s Q was used in their study as the measure of the firm’s value. The sample for their panel
data analysis in their study consisted of 68 Spanish firms and 408 observations. The data on the
board of directors that was used in their study was obtained from the Spanish stock exchange
commission (CNMV). Also, they obtained the accounting data for their study from the SABI

10
database (Iberian Balance Sheet Analysis System). Campbell et al. (2008) found that the
diversity of the board of directors has a positive impact on the firm’s value. However, they
concluded their study by indicating that the presence of a few number of women on the board of
directors alone, was not enough as a factor to have any significant effect on the firm’s value.
Instead, they suggested that the Spanish firms should focus on balancing the number of women
and men on its board of directors, in order to significantly improve the value of the firm.
Using a two-stage least squares regression analysis model, and a sample consisting of 638
Fortune 1000 firms in the year 1997, Carter, Simkins, and Simpson (2003) examined the
relationship between the performance of the firm and the gender diversity of the board of
directors. The data on the board of directors that was used in their study was obtained from the
“Significant Data for Directors 1999: Board Policies and Governance Trends”, which was
prepared by Directorship. Also, the accounting data for their study was obtained from the
COMPUSTAT database. Carter et al. (2003) found a statistically significant positive relationship
between the presence of women on the board of directors and the firm’s value as measured by
Tobin’s Q. They concluded their study by suggesting that firms should make more commitments
in order to increase the number of women on the board of directors.
Erhardt, Werbel, and Shrader (2003) employed a correlation and regression analysis
approach to investigate the relationship between the demographic diversity of the board of
directors and the financial performance of the firm. The sample for their study consisted of 112
large firms from across several industries in the United States. The ethnic and gender
characteristics of the board of directors were used as the proxy for demographic diversity in their
study. They obtained data on the diversity representation in firms from several company reports,
which were compiled by Fortune magazine. Financial performance was measured as return on

11
assets (ROA) and return on investment (ROI). Also, they used the Compact Disclosure database
to obtain data for the 1993 and 1998 financial record of the firms that were examined in their
study. Erhardt et al. (2003) found a significant positive relationship between the percentage of
females plus ethnic minorities on the board of directors and the financial performance of the
firm, measured as ROA and ROI. The result of their analysis remained after controlling for
several industries, such as service and production sector. Erhardt et al. (2003) concluded their
study by indicating that a firm’s image will improve if it considers increasing the diversity of the
board of directors. Therefore, they suggested that firms should strongly consider diversifying its
board of directors, regardless of whether or not, the diversity of the board of directors impacts
the financial performance of the firm; an approach that critics will likely consider as a practice of
tokenism, in order to exploit and enhance the firm’s public appeal.
Negative Relationship
Adams and Ferreira (2009) examined the impact of female directors on the financial
performance of the firm. The sample for their study consisted of a select number of firms in the
Standards and Poor’s (S&P’s) 1500 firms from 1996 to 2003. They obtained the data for their
study from both the IRRC annual publication and COMPUSTAT ExecuComp database. Adams
et al. (2009) found that there is a negative relationship between the percentage of women on the
board of directors and the financial performance of the firm, as measure by Tobin’s Q. In
conclusion, they suggested that firms with an increased gender diverse board of directors,
performed worse than firms with a less gender diverse board of directors.
Minguez-Vera and Martin (2011) employed a panel data methodology to investigate the
nature of the relationship between female board-membership and financial performance of the
firm, as measured by the return on equity (ROE). The data for their study was obtained from the

12
SABI database (Iberian Balance Sheet Analysis System) for the period, 1998 to 2003. Minguez-
Vera et al. (2011) found a negative relationship between the presence of women on the board of
directors and the financial performance of the firm. The result of their study remained after
controlling for a number of named variables, such as level of debt, age of the firm, logarithm of
the number of employees, logarithm of total assets, and logarithm of the total number of
directors.
No Relationship
N. Smith, V. Smith, and Verner (2006) used data for the 2,500 largest firms in Denmark
during the period 1993 to 2001, to examine the relationship between the diversity of the board of
directors and several accounting measures of financial performance. They obtained the data for
their study from a private Danish data register called, KOB (Købmandsstandens
Oplysningsbureau) and from a second register called, the Statistics Denmark. They found no
significant relationship between the gender diversity of the board of directors and a number of
several accounting measures of firm’s performance. Nevertheless, they concluded their study by
suggesting that firms should have a sufficient talent pool of qualified women, who can fill in the
top level positions in the firm, such as the board of directors and any of the available executive
positons that are opened in the firm.
In another Danish study conducted by Rose (2007), a sample of selected Danish firms
were used in a cross-sectional analysis to investigate the relationship between women on the
board of directors and the financial performance of the firm, as measured by Tobin’s Q. Data on
the firms, including their financial information, was obtained from the Copenhagen Stock
Exchange during the period 1998 to 2001. Rose (2007) found no significant relationship between

13
the number of women on the board of directors and the financial performance of the firm, as
measured by Tobin’s Q.
Farrell and Hersch (2005) used the Poisson regression method, as well as, an event study
to investigate the addition of women on the board of directors in the United States. The Poisson
regression method was used to analyze a panel of data from 300 Fortune 1000 firms over a ten-
year period from 1990 to 1999. They defined the return on assets (ROA) as the measure of the
firm’s financial performance. Their study was inconclusive since they were unable to find any
relationship between the addition of women to the board of directors and the return on assets.
Also, in their study, they found no relationship between the addition of women to the board of
directors and the market returns to shareholders.
Shrader, Blackburn, and Iles (1997) used a hierarchical regression method to examine the
relationship between the percentage of women on the board of directors and the financial
performance of the firm. The financial performance of the firm was measured as the return on
sales (ROS), return on assets (ROA), return on investments (ROI), and return on equity (ROE).
They obtained the accounting data for their study from the Compact Disclosure database, for a
sample of firms in the United States, for years 1992 and 1993. Shrader et al. (1997) found no
significant relationship between the percentage of women on the board of directors and the
financial performance of the firm. This result remained after controlling for total number of
managers, total number of top managers, and total number of board members. They explained
the result of their analysis by stating that women had the tendency of being assigned (or
marginalized) to assignments, which had less impact on the financial performance of the firm.
They also explained that having a few number of women on the board of directors, was simply
not enough to yield any significant impact on the financial performance of the firm itself. They
14
also questioned the experience of the women who served on the board of directors; thus
suggesting that the little experience of women on the board of directors, may explain why the
presence of women on the board of directors had no significant impact on the financial
performance of the firms that was used in their study.
Carter, D’Souza, Simkins, and Simpson (2010), used a three-stage least squares
regression method to analyze a panel data of 641 different firms, which were listed in the
Standard and Poor’s (S&P’s) 500 index during the period, 1998 to 2002. Data on directors was
obtained from the Investor Responsibility Research Center (IRRC) database. Carter et al. (2010)
found no significant relationship between any of the gender and performance variables that were
used in their study. Also, they did not find any significant relationship between the number of
women on the board of directors’ committees and Tobin’s Q, as well as, return on assets, which
were both used as a measure of the firm’s financial performance. Using the contingency theory
to explain the result of their analysis, they indicated that under some conditions, the effect of
board diversity on the financial performance of the firm was varied and thus, understood to be
either positive or negative. Therefore, suggesting that the financial value of having women on the
board of directors did not always yield the same result under varying situations or time periods.
Furthermore, they indicated that the changing results of a positive or negative effect on the
financial performance of the firm, may have canceled out over a given period of time; therefore,
leaving no measurable result to account for a direct linkage between the diversity of the board of
directors and the financial performance of the firm.
Null Hypotheses
Despite signs of a positive link in both the resource dependency and human capital
theory, there still is no definite and direct prediction of a positive relationship between a diverse

15
board of directors and the financial performance of the firm. The agency theory offers the
possibility that the performance of the firm could be improved by diversifying the members of its
board of directors. This way, the board of directors can become a better monitor of management,
which can as well, improve the performance of the firm. However, Adams and Ferreira (2009)
warned that firms with a diverse board of directors, which offered a more and tougher monitor of
management, may not necessarily yield a positive effect on the board of directors’ performance,
as well as, on the overall performance of the firm. Although the agency theory does suggest a
positive link between the diversity of the board of directors and the firm’s performance, yet, it
still remains unclear what the true nature of the link is.
Two important functions of the board of directors include monitoring and controlling of
managers, and strategic decision making to name a few. The social psychological theory posits
that a diverse board of directors may not have any influence on the board’s decision making
ability due to the internal group dynamics that exist in a diverse board of directors. Although it is
likely that a diverse board of directors will promote creative and innovative ideas, yet the social
psychological theory warns that due to the dynamic nature of a diverse board of directors,
conflicts among its members may increase, which could negatively affect the decision making
capabilities of the board and consequently impair the overall performance of the firm.
We adopted an interdisciplinary set of theories from the economics and social psychology
discipline to understand the business case of board gender diversity in firms. The business case
for a gender diverse board have largely been mixed, with signs of a positive, negative and even a
no relationship between female directors and firm’s performance. In this chapter, we reviewed
ten past studies that have empirically investigated the possible relationship between female
directors and financial performance of the firm. From this studies, we find that the nature of the

16
relationship between female directors and financial performance of the firm have largely been
mixed. Using a sample of United States technology firms listed in the S&P 500 firms for the year
2016 and return on average assets (ROAA) as the measure of firm’s financial performance, we
thus state the first null hypothesis for the present study as follows:
• H0: The difference in mean of ROAA between the different percentage levels of
women on the board of directors is identical.
• H1: The difference in mean of ROAA between the different percentage levels of
women on the board of directors is not identical.
Likewise, using the return on average equity (ROAE) as the measure of financial
performance, we thus state our second null hypothesis for the present study as follows:
• H0: The difference in mean of ROAE between the different percentage levels of
women on the board of directors is identical.
• H1: The difference in mean of ROAE between the different percentage levels of
women on the board of directors is not identical.
The percentage of women on the board of directors is the percentage ratio of women on
the board of directors and total board size-comprising of all the members of the board. The two
accounting measures of performance used in the present study are ROAA and ROAE. In addition
to testing the null hypotheses for the present study, we shall also investigate the degree of
relationship (i.e. correlation) that exist between female directors and financial performance of the
firm. In the next chapter, we will present our research method and design used in obtaining and
analyzing the data included in our sample for the present study.

17
CHAPTER III: METHOD
Research Design
The present study follows a descriptive research approach and employs some
nonparametric statistics techniques to analyze the data included in the sample. The selected
statistics techniques were based on the normal distribution of the data included in the sample.
Nonparametric statistics is applied extensively throughout in the present study to analyze and test
the two null-hypotheses stated in the previous chapter (see Null Hypotheses).
Sample
Our sample for the present study consists of 49 publicly traded firms-in the United States
technology sector-listed in the S&P 500 firms for the year 2016. Our choice of sample is based
on the following reasons: (1) The S&P 500 firms includes the top 500 publicly traded firms in
the United States; (2) the S&P 500 firms captures approximately 80 percent coverage of
available market capitalization in the United States; (3) the S&P 500 firms is largely regarded by
many investors as a good representation of the United States stock market and economy.
The technology firms included in our sample are all listed in the S&P 500 firms and are
assumed to be among the top 500 firms in the United States. All of the 49 firms included in the
sample are incorporated in the United States. Our choice of sample is considered appropriate for
the present study since we have a financial interest in the investigation of the likely relationship
between female directors and firm’s financial performance in the context of the United States
technology sector. Data on the United States technology firms listed in the S&P 500 firms for the
year 2016 is obtained from the “YCharts” website at www.ycharts.com, which is a subscription
based online service that provides both recent and historical stock market data of publicly traded
firms in the United States, as well as, in several other countries worldwide.

18
Data on the financial performance for all 49 firms included in the sample is obtained
from the “United States Securities and Exchange Commission (SEC)” website at www.sec.gov.
The SEC is a publicly accessible online service that uses a database called the “EDGAR”
database to track financial statement reports filed by publicly traded firms in the United States.
Data on the board of directors for all 49 firms is obtained from the “2020 Women on Boards”
website at www.2020wob.com. The 2020 Women on Boards’ website is a publicly accessible
online service that contains data on the board of directors for over 1800 firms located in the
United States, as well as, in several other countries worldwide. The accuracy of the data
contained in the 2020 Women on Boards’ website cannot be assured
Data Gathering Procedure and Variables
The YCharts’ website offers access to its online service through a 30-day trial plan. It
also offers access to its service through an annual subscription fee. Data that is contained in the
YCharts’ website can be verified using several financial stock market websites like Yahoo
Finance and Google Finance. Like the annual subscription plan, the YCharts’ 30-day trial plan
likewise, offers a download functionality directly from its website, which we used for
downloading the data on the United States technology firms listed in the S&P 500 firms. The
data is available for download directly from the website in a comma separated values (CSV) file
format. The data obtained from the YCharts’ website consists of the following three variables:
“ticker, name, and currency code”. The “ticker” variable is the stock market symbol for the firm,
the “name” variable is the full name of the firm, and the “currency code” variable is the currency
used by the firm to trade stock(s) on the American stock exchange markets (i.e. Nasdaq and New
York Stock Exchange).

19
The financial data on the firms included in our sample is obtained from the SEC website
using the ticker symbol of the firm. Using the firm’s ticker symbol, we obtained the 10-K
financial statement reports for all 49 firms included in our sample for the years 2014 and 2015,
which was readily available for download in an excel file format. Five financial variables from
the SEC website are included in our sample. They are “netIncome2015, asset2014, asset2015,
stock2014, and stock2015”. The “netIncome2015” variable is the net income (in United States
dollar) earned by the firm for the year 2015. The “asset2014 and asset2015” variables are the
monetary value of the total assets (in United States dollar) owned by the firm for the years 2014
and 2015 respectively. Also, the “stock2014 and stock2015” variables are the 2014 and 2015
total stockholder’s equity (in United States dollar) attributed to the firm respectively. We used all
five of these variables to compute our two financial measures of performance that are required
for the present study.
First, we used the netIncome2015, asset2014, and asset2015 variables to compute the
return on average assets (ROAA) for all 49 firms included in our sample. The computed ROAA
represents the profitability of a firm's assets for the year 2015. A firm’s ROAA for the year 2015
is calculated as the percentage ratio of net income (i.e. netIncome2015) and average total assets
(i.e. asset2014 and asset2015). Next, we used the netIncome2014, stock2014, and stock2015
variables to compute the return on average equity (ROAE) for all 49 firms included in our
sample. The computed ROAE represents the profitability of a firm in relation to the average
shareholders' equity for the year 2015. A firm’s ROAE for the year 2015 is calculated as the
percentage ratio of net income (i.e. netIncome2015) and average stockholder’s equity (i.e.
stock2014 and stock2015).
20
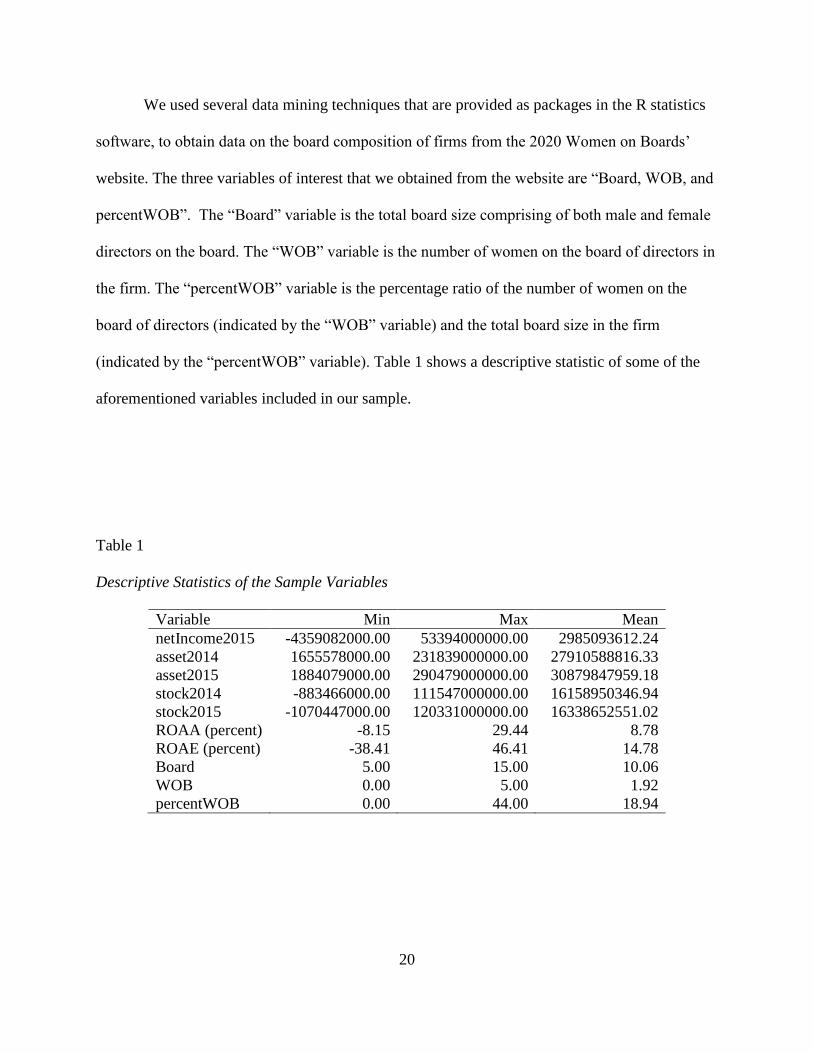
We used several data mining techniques that are provided as packages in the R statistics
software, to obtain data on the board composition of firms from the 2020 Women on Boards’
website. The three variables of interest that we obtained from the website are “Board, WOB, and
percentWOB”. The “Board” variable is the total board size comprising of both male and female
directors on the board. The “WOB” variable is the number of women on the board of directors in
the firm. The “percentWOB” variable is the percentage ratio of the number of women on the
board of directors (indicated by the “WOB” variable) and the total board size in the firm
(indicated by the “percentWOB” variable). Table 1 shows a descriptive statistic of some of the
aforementioned variables included in our sample.
Table 1
Descriptive Statistics of the Sample Variables
Variable Min Max Mean
netIncome2015 -4359082000.00 53394000000.00 2985093612.24
asset2014 1655578000.00 231839000000.00 27910588816.33
asset2015 1884079000.00 290479000000.00 30879847959.18
stock2014 -883466000.00 111547000000.00 16158950346.94
stock2015 -1070447000.00 120331000000.00 16338652551.02
ROAA (percent) -8.15 29.44 8.78
ROAE (percent) -38.41 46.41 14.78
Board 5.00 15.00 10.06
WOB 0.00 5.00 1.92
percentWOB 0.00 44.00 18.94

21
CHAPTER IV: STATISTICAL ANALYSIS AND RESULTS
Statistical Tool and Selected Significance Level
We employed the R statistics software to perform the necessary statistical procedures that
are required in order to examine the relationship between female directors and financial
performance of firms that are included in our sample. The R statistics software combines a
comprehensive set of packages for performing nonparametric statistical analysis of the data
included in our sample. All statistical analysis, figures, and table reports are generated using the
R statistics software. A 0.05 value was set as the standard significance level for the present
study. We used our selected standard significance level as the benchmark to interpret the report
of our statistical analysis. We interpreted a p value greater than 0.05 as not significant. Also, we
interpreted a p value less than 0.05 as significant.
Shapiro Wilks Test Analysis and Results
We employed the Shapiro Wilks normality test to analyze the normal distribution of three
selected variables included in our sample. We were able to determine the appropriate statistical
techniques required for the present study by testing the normality of the following variables:
ROAA, ROAE, and percentWOB. The results of the Shapiro Wilks normality test are presented
in Table 2 below. We find that the p value for ROAA is less than 0.05 (p = 0.0044). Also, we
find that the p value for ROAE is less than 0.05 (p = 0.0001). Furthermore, we find that the p
value for percentWOB is less than 0.05 (p = 0.0231).
The results of the Shapiro Wilks normality test for all three variables included in our
sample are statistically significant. Thus, the results of the Shapiro Wilks normality test indicate
that the sample does not have a normal distribution. For this reason, we employed two
nonparametric statistical techniques for analyzing the data included in our sample. The

22
“Spearman correlation” analysis (a nonparametric statistical technique) was employed to
examine the likely degree of relationship (i.e. correlation) between female directors and financial
performance of the firm. We also employed a second nonparametric statistical technique called
the “Kruskal Wallis rank sum test” to statistically test the two null hypotheses stated for the
present study.
Table 2
Shapiro Normality Test Results
Variable Procedure p value
ROAA Shapiro Wilk normality test 0.0044
ROAE Shapiro Wilk normality test 0.0001
percentWOB Shapiro Wilk normality test 0.0231
Spearman Correlation Analysis and Results
A spearman correlation analysis was used to measure the strength and direction of the
monotonic association between two pairs of variables: (1) percentWOB and ROAA and (2)
percentWOB and ROAE. Cohen’s standard was used to evaluate the strength of the
relationships, where coefficients between 0.10 and 0.29 represent a small relationship,
coefficients between 0.30 and 0.49 represent a moderate relationship, and coefficients above 0.50
indicate a large relationship (P. Cohen, J. Cohen, West, & Aiken, 2013). The sign of the
coefficient indicates the direction of the relationship. If both variables tend to increase or

23
decrease together, the coefficient is positive. If one variable tends to increase as the other
decreases, the coefficient is negative.
The spearman correlation analysis assumes that the variables are measured on an ordinal,
interval or ratio scale. Our variables included in the sample satisfies this assumption. The
spearman correlation analysis also assumes that the relationship between each pair of variables is
monotonic (i.e. does not change direction). Also, our variables included in the sample satisfies
this assumption. In other words, as one variable increases so do the value of the other variable or
as the value of one variable increases, the other variable value decreases. This assumption is
violated if the points on the scatterplot diagram between any pair of variables appear to shift
from a positive to a negative or a negative to a positive relationship.
We set the significance value at 0.05. A p value greater than 0.05 allows us to accept the
calculated spearman coefficient (rho) as not statistically significant. A p value less than 0.05
allows us to accept the calculated spearman coefficient (rho) as statistically significant. Table 3
shows the calculated p values of the spearman correlation analysis. Table 4 shows the calculated
spearman coefficient (rho) of the spearman correlation analysis.
The results of the calculated spearman coefficient (rho) and p values, shows that there
was a statistically non-significant negative correlation between percentWOB and ROAA (rho = -
0.194, p = 0.1819). The spearman coefficient (rho) between percentWOB and ROAA was 0.194,
indicating a small negative relationship. The result of the spearman coefficient suggests that as
percentWOB increases, ROAA tends to decrease. Furthermore, the results of the calculated
spearman coefficient (rho) and p values, shows that there was a statistically significant negative
correlation between percentWOB and ROAE (rho = -0.299, p = 0.0369). The correlation
coefficient rho between percentWOB and ROAE was 0.299, indicating a small negative

24
relationship. The result of the correlation coefficient suggests that as percentWOB increases,
ROAE tends to decrease.
There was a statistically significant positive correlation between ROAA and ROAE (rho
= 0.684, p <0.05). The correlation coefficient (rho) between ROAA and ROAE was 0.684,
indicating a large positive relationship. The result of the correlation coefficient suggests that as
ROAA increases, ROAE tends to increase.
Table 3
Calculated p Values Among Variables
ROAA ROAE percentWOB
ROAA 0.0000 0.1819
ROAE 0.0000 0.0369
percentWOB 0.1819 0.0369
Table 4
Calculated Spearman (rho) Correlation Among Variables
ROAA ROAE percentWOB
ROAA 1.000
ROAE 0.684*** 1.000
percentWOB -0.194 -0.299* 1.000
Significant at p <.10; *p <.05; **p <.01; ***p <.001
25
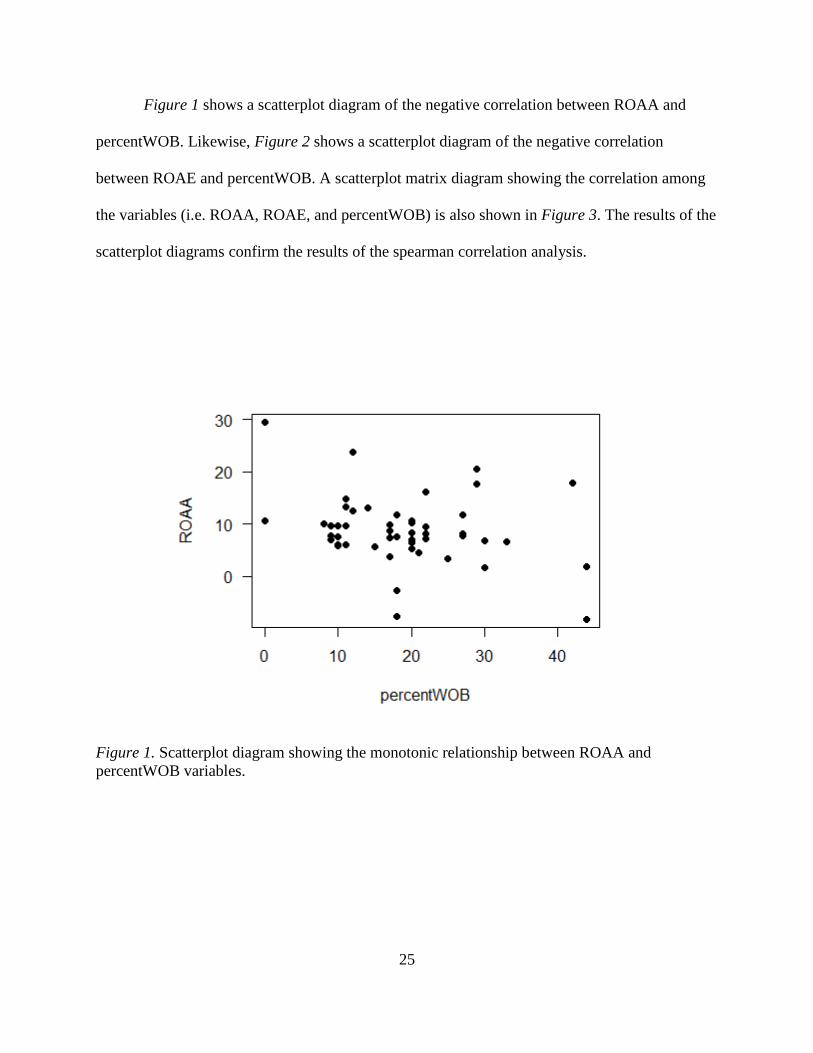
Figure 1 shows a scatterplot diagram of the negative correlation between ROAA and
percentWOB. Likewise, Figure 2 shows a scatterplot diagram of the negative correlation
between ROAE and percentWOB. A scatterplot matrix diagram showing the correlation among
the variables (i.e. ROAA, ROAE, and percentWOB) is also shown in Figure 3. The results of the
scatterplot diagrams confirm the results of the spearman correlation analysis.
Figure 1. Scatterplot diagram showing the monotonic relationship between ROAA and
percentWOB variables.

26
Figure 2. Scatterplot diagram showing the monotonic relationship between ROAE and
percentWOB variables.

27
Figure 3. Scatterplot matrix diagram showing the correlation among ROAA, ROAE, and
percentWOB variables.
Kruskal Wallis Rank Sum Test Analysis and Results
We divided our sample into two new data sets in order to test the null hypotheses for the
present study. The first data set contains 30 randomly selected firms, including the ROAA
financial performance measure for each firm included in the data set. The second data set
contains 30 randomly selected firms, including the ROAE financial performance measure for
each firm included in the data set.
In each of the data sets, we created two levels or groups using the average (i.e. mean) of
percentWOB (see Table 1) from the sample. Each group contained 15 randomly selected firms
per data set. The characteristics of the groups are as follows: (1) group 0 consists of 15 randomly
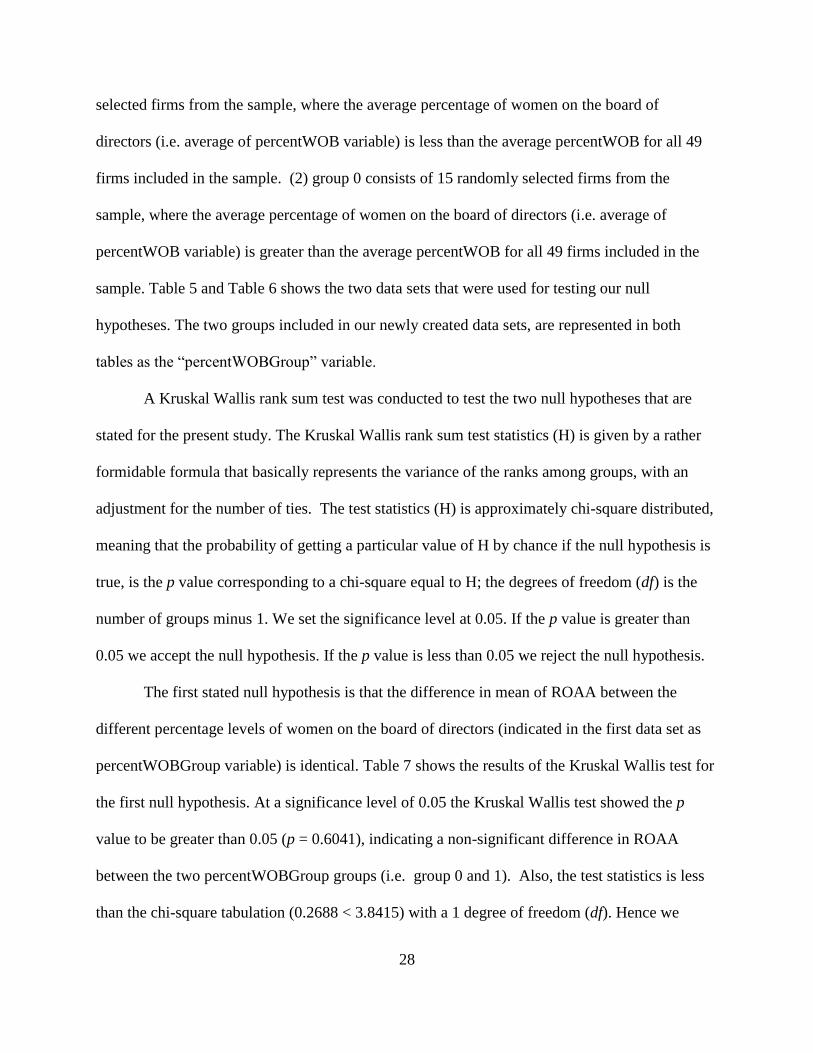
28
selected firms from the sample, where the average percentage of women on the board of
directors (i.e. average of percentWOB variable) is less than the average percentWOB for all 49
firms included in the sample. (2) group 0 consists of 15 randomly selected firms from the
sample, where the average percentage of women on the board of directors (i.e. average of
percentWOB variable) is greater than the average percentWOB for all 49 firms included in the
sample. Table 5 and Table 6 shows the two data sets that were used for testing our null
hypotheses. The two groups included in our newly created data sets, are represented in both
tables as the “percentWOBGroup” variable.
A Kruskal Wallis rank sum test was conducted to test the two null hypotheses that are
stated for the present study. The Kruskal Wallis rank sum test statistics (H) is given by a rather
formidable formula that basically represents the variance of the ranks among groups, with an
adjustment for the number of ties. The test statistics (H) is approximately chi-square distributed,
meaning that the probability of getting a particular value of H by chance if the null hypothesis is
true, is the p value corresponding to a chi-square equal to H; the degrees of freedom (df) is the
number of groups minus 1. We set the significance level at 0.05. If the p value is greater than
0.05 we accept the null hypothesis. If the p value is less than 0.05 we reject the null hypothesis.
The first stated null hypothesis is that the difference in mean of ROAA between the
different percentage levels of women on the board of directors (indicated in the first data set as
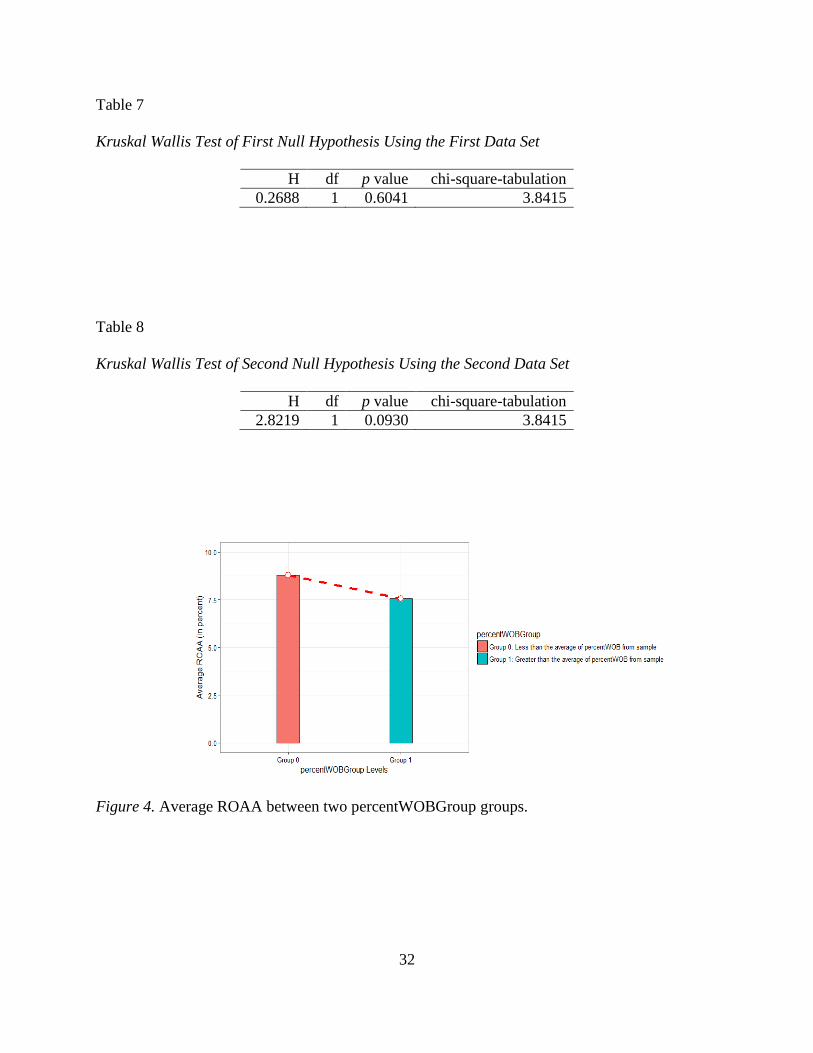
percentWOBGroup variable) is identical. Table 7 shows the results of the Kruskal Wallis test for
the first null hypothesis. At a significance level of 0.05 the Kruskal Wallis test showed the p
value to be greater than 0.05 (p = 0.6041), indicating a non-significant difference in ROAA
between the two percentWOBGroup groups (i.e. group 0 and 1). Also, the test statistics is less
than the chi-square tabulation (0.2688 < 3.8415) with a 1 degree of freedom (df). Hence we

29
accept the null hypothesis and conclude that the difference in mean of ROAA between the
different percentage levels of women on the board of directors is identical.
The second stated null hypothesis is that the difference in mean of ROAA between the
different percentage levels of women on the board of directors (indicated in the second data set
as percentWOBGroup variable) is identical. Table 8 shows the results of the Kruskal Wallis test
for the second null hypothesis. At a significance level of 0.05 the Kruskal Wallis test showed the
p value to be greater than 0.05 (p = 0.0930), indicating a non-significant difference in ROAE
between the two percentWOBGroup groups (i.e. group 0 and 1). Also, the test statistics is less
than the chi-square-tabulation (2.8219 < 3.8415) with a 1 degree of freedom (df). Hence we
accept the null hypothesis and conclude that the difference in mean of ROAE between the
different percentage levels of women on the board of directors is identical.
We employed two bar plot diagrams (shown in Figure 4 and Figure 5 below) to verify
the result of the Kruskal Wallis test. In both diagrams, we find that the difference in the average
financial performance of either the ROAA or ROAE between the two percentWOBGroup groups
was almost identical. This shows that there is no significant difference in the overall financial
performance of the firms between the varying percentage levels of women on board included in
our sample. Fortunately, the results of our bar plot diagrams appear to confirm the result of the
Kruskal Wallis test.
30
Table 5
First Data Set Showing Average ROAA Between the percentWOBGroup Groups
ROAA percentWOB percentWOBGroup
1 7.79 9 0
2 -7.56 18 0
3 13.23 11 0
4 7.36 17 0
5 29.44 0 0
6 7.55 18 0
7 8.73 17 0
8 9.72 11 0
9 7.07 9 0
10 6.02 10 0
11 10.57 0 0
12 5.97 11 0
13 12.45 12 0
14 3.70 17 0
15 9.88 17 0
16 11.82 27 1
17 16.23 22 1
18 -8.15 44 1
19 8.22 27 1
20 6.56 33 1
21 7.03 20 1
22 6.49 20 1
23 7.18 22 1
24 1.72 30 1
25 17.62 29 1
26 7.85 27 1
27 6.86 30 1
28 8.21 22 1
29 10.61 20 1
30 5.23 20 1

31
Table 6
Second Data Set Showing Average ROAE Between the percentWOBGroup Groups
ROAE percentWOB percentWOBGroup
1 28.05 12 0
2 17.60 9 0
3 35.81 0 0
4 11.66 11 0
5 15.11 17 0
6 24.85 0 0
7 15.55 10 0
8 13.35 10 0
9 17.90 9 0
10 19.08 11 0
11 19.53 18 0
12 10.37 9 0
13 12.94 18 0
14 20.80 17 0
15 32.06 11 0
16 6.63 21 1
17 14.97 33 1
18 14.36 20 1
19 10.60 27 1
20 15.44 27 1
21 3.65 30 1
22 4.80 44 1
23 14.58 27 1
24 46.41 20 1
25 27.18 22 1
26 14.93 20 1
27 7.00 25 1
28 16.45 30 1
29 29.37 42 1
30 14.83 20 1
32
Table 7
Kruskal Wallis Test of First Null Hypothesis Using the First Data Set
H df p value chi-square-tabulation
0.2688 1 0.6041 3.8415
Table 8
Kruskal Wallis Test of Second Null Hypothesis Using the Second Data Set
H df p value chi-square-tabulation
2.8219 1 0.0930 3.8415
Figure 4. Average ROAA between two percentWOBGroup groups.

33
Figure 5. Average ROAE between two percentWOBGroup groups.

34
CHAPTER V: CONCLUSION
This study contributes to the ongoing debate and literature on board diversity and
financial performance of the firm. The present study offers new insights into the relationship
between the gender diversity of the board and financial performance of the firm. The study
follows a descriptive research approach to examine the likely relationship between female
directors and financial performance of the firm measured by return on average assets (ROAA)
and return on average equity (ROAE). Our sample consists of 49 firms in the United States
technology sector, which are listed in the S&P 500 firms for the year 2016.
The results of our statistical analysis shows a small negative relationship between female
directors and financial performance of the firm. Specifically, we find a small but statistically
non-significant negative relationship between the percentage of women on the board and
financial performance of the firm, measured by ROAA. In a similar approach, we also find a
small but significant negative relationship between the percentage of women on the board and
financial performance of the firm, measured by ROAE. Also, our sample shows evidence of a
low representation of women on the board of directors in firms within the United States
technology sector.
We tested two null-hypotheses stated in the present study (see Null Hypotheses). For our
first null-hypothesis, we find the average ROAA between the two percentWOBGroup groups,
which was created using the average percentage of women on board (i.e. mean of percentWOB)
from the sample to be identical. This suggests that there was little or no difference in the ROAA
performance of firms included in our sample. Likewise, in our second null-hypothesis test, we
find that the average of the ROAE between the two different percentWOBGroup groups is

35
identical. This also suggests that there was little or no difference in the ROAE performance of
firms included in our sample.
It is important to note the limitations in our research design before drawing any inference
from the observed relationship between female directors and firm’s financial performance as
examined in the present study. First, our research design follows a descriptive approach, which is
not considered a strong approach for drawing any inference on the causal (i.e. cause and effect)
relationship between female directors and firm’s financial performance. Second, the
nonparametric statistical techniques employed in the present study is not as strong as the
parametric techniques, which are typically used for describing the relationship between female
directors and financial performance of the firm. However, our choice of a nonparametric
statistical approach was based on the nature of the data included in our sample. This brings us to
our third limitation, the size of our sample (i.e. sample size). Our sample consisted of only 49
firms in the United States technology sector, which are listed in the S&P 500 firms for the year
2016. We assume that our sample size is not large enough to accurately draw any inference on
the thousands of technology firms that are incorporated in the United States. Finally, our sample
only looks at the financial performance of firms in a two-year period between 2014 and 2015.
Due to the small timeline range, we cannot accurately weigh the average performance of firms
for over a longer period of time, which could have easily provided us with a more accurate
understanding of how the firms included in our sample had performed over the years.
Future research should determine how to resolve the aforementioned limitations of the
present study when investigating the likely relationship between female directors and financial
performance of the firm. Future research should also consider looking at other factors that may
impact the financial performance of the firm. This may include an analysis of the employee size,

36
customer size, industry within the technology sector that the firm belongs to, year when the firm
was established, and number of successful or failed projects that were executed by the firm.
Also, future research should analyze the characteristics of the women who are appointed to the
board of directors in technology firms. Some of the female directors’ characteristics that future
research should pay attention to include the age, income, education background, and race of the
female directors, as well as, the committee assignments that they are assigned to, competence
level of the managers who they supervise, experience acquired from working on the board of
directors in the firm over a given period of time, experience acquired from working on the board
of directors in other firms within or outside the technology sector, and family ties to the existing
members of the board (if any).
Questions regarding the jurisdiction of the firm (i.e., country of establishment,
incorporation, or trading market where the firm operates in), should also be taken into
consideration in future research when examining the relationship between female directors and
financial performance of the firm. We stress that it is important for future research not to take
any biased approach when examining the financial impact of female directors in the context of
the United States technology sector. We believe that by expanding the variables in future
research, we will be closer into understanding the nature of the relationship between female
directors and financial performance of firms in the United States technology sector.
Overall, our results provide evidence of a small negative relationship between female
directors and financial performance of the firm. This is consistent with extant studies in the
corporate governance literature where also a negative relationship between female directors and
financial performance of the firm was reported. However, it is important to note that the
difference in the financial performance measures (i.e. ROAA and ROAE) as observed in the test

37
of our null-hypotheses, is almost identical for all the firms included in the sample, regardless of
the varying number of female directors in those firms.

38
REFERENCES
Adams, R. B., & Ferreira, D. (2007). A Theory of Friendly Boards. The Journal of Finance,
62(1), 217-250. doi:10.1111/j.1540-6261.2007.01206. x.
Adams, R. B., & Ferreira, D. (2007). A Theory of Friendly Boards. The Journal of Finance,
62(1), 217-250. doi:10.1111/j.1540-6261.2007.01206. x.
Adams, R. B., & Ferreira, D. (2009). Women in the boardroom and their impact on governance
and performance. Journal of financial economics,94(2), 291-309.
Agrawal, A., & Knoeber, C. (2001). Do Some Outside Directors Play a Political Role? *. The
Journal of Law and Economics, 44(1), 179-198. doi:10.1086/320271.
Ararat, M., Aksu, M. H., & Tansel Cetin, A. (2010). The impact of board diversity on boards’
monitoring intensity and firm performance: evidence from the Istanbul Stock Exchange.
Available at SSRN 1572283.
Becker, G. S. (1964). Human capital theory. Columbia, New York.
Booth, J. R., & Deli, D. N. (1999). On executives of financial institutions as outside directors.
Journal of Corporate Finance, 5(3), 227-250. doi:10.1016/s0929-1199(99)00004-8.
Campbell, K., & Minguez-Vera, A. (2008). Gender diversity in the boardroom and firm financial
performance. Journal of business ethics, 83(3), 435-451.
Carter, D. A., D’souza, F., Simkins, B. J., & Simpson, W. G. (2010). The Gender and Ethnic
Diversity of US Boards and Board Committees and Firm Financial Performance.
Corporate Governance: An International Review, 18(5), 396-414. doi:10.1111/j.1467-
8683.2010.00809. x.

39
Carter, D. A., Simkins, B. J., & Simpson, W. G. (2003). Corporate Governance, Board Diversity,
and Firm Value. Financial Review the Financial Review, 38(1), 33-53. doi:10.1111/1540-
6288.00034.
Coffey, B. S., & Wang, J. (1998). Board diversity and managerial control as predictors of
corporate social performance. Journal of Business Ethics, 17(14), 1595-1603.
Cohen, J., Cohen, P., West, S. G., & Aiken, L. S. (2013). Applied multiple regression/correlation
analysis for the behavioral sciences. Routledge.
Darmadi, S. (2011). Board diversity and firm performance: The Indonesian evidence. Corporate
ownership and control Journal, 8.
Erhardt, N. L., Werbel, J. D., & Shrader, C. B. (2003). Board of director diversity and firm
financial performance. Corporate governance: An international review, 11(2), 102-111.
doi:10.1111/1467-8683.00011.
Fama, E. F., & Jensen, M. C. (1983). Separation of ownership and control. The Journal of Law &
Economics, 26(2), 301-325.
Farrell, K. A., & Hersch, P. L. (2005). Additions to corporate boards: The effect of gender.
Journal of Corporate Finance,11(1-2), 85-106. doi: 10.1016/j.jcorpfin.2003.12.001.
Fiedler, F. E., & Chemers, M. M. (1967). A theory of leadership effectiveness. Goodstein, J.,
Gautam, K., & Boeker, W. (1994). The effects of board size and diversity on strategic
change. Strategic management journal, 15(3), 241-250.
Hillman, A. J., Cannella, A. A., & Harris, I. C. (2002). Women and Racial Minorities in the
Boardroom: How Do Directors Differ? Journal of Management, 28(6), 747-763.
doi:10.1177/014920630202800603.
40
Ibarra, H. (1993). Personal Networks Of Women And Minorities In Management: A Conceptual
Framework. Academy of Management Review, 18(1), 56-87.
doi:10.5465/amr.1993.3997507.
Jensen, M. C., & Meckling, W. H. (1976). Theory of the firm: Managerial behavior, agency costs
and ownership structure. Journal of Financial Economics, 3(4), 305-360.
doi:10.1016/0304-405x(76)90026-x.
Kakabadse, N. K., Figueira, C., Nicolopoulou, K., Hong Yang, J., Kakabadse, A. P., & Ozbilgin,
M. F. (2015). Gender Diversity and Board Performance: Women’s Experiences and
Perspectives. Human Resource Management, 54(2), 265-281.
Lau, D. C., & Murnighan, J. K. (1998). Demographic Diversity and Faultlines: The
Compositional Dynamics of Organizational Groups. Academy of Management Review,
23(2), 325-340. doi:10.5465/amr.1998.533229.
Lawrence, P. R., & Lorsch, J. W. (1967). Organization and environment: Managing
differentiation and integration. Harvard Business School Press, Boston, MA.
Minguez-Vera, A., & Martin, A. (2011). Gender and management on Spanish SMEs: An
empirical analysis. The International Journal of Human Resource Management, 22(14),
2852-2873. doi:10.1080/09585192.2011.599948.
Oxelheim, L., & Randoy, T. (2003). The impact of foreign board membership on firm value.
Journal of Banking & Finance, 27(12), 2369-2392.
Pfeffer, J., & Salancik, G. R. (2003). The external control of organizations: A resource
dependence perspective. Stanford University Press.

41
Rose, C. (2007). Does female board representation influence firm performance? The Danish
evidence. Corporate Governance: An International Review Corporate Governance, 15(2),
404-413. doi:10.1111/j.1467-8683.2007.00570.x.
Shrader, C. B., Blackburn, V. B., & Iles, P. (1997). Women in management and firm financial
performance: An exploratory study. Journal of managerial issues, 355-372.
Smith, N., Smith, V., & Verner, M. (2006). Do women in top management affect firm
performance? A panel study of 2,500 Danish firms. International Journal of productivity
and Performance management, 55(7), 569-593. doi:10.1108/17410400610702160.
Terjesen, S., Sealy, R., & Singh, V. (2009). Women Directors on Corporate Boards: A Review
and Research Agenda. Corporate Governance: An International Review, 17(3), 320-337.
doi:10.1111/j.1467-8683.2009.00742.x.
United States Tech Industry Employs 6.5 Million in 2014. (2015, Feb 10). Retrieved October 24,
2016, from https://www.comptia.org/about-us/newsroom/ press-
releases/2015/02/10/united-states-tech-industry-employs-6.5-million-in-2014.
Westphal, J. D., & Milton, L. P. (2000). How Experience and Network Ties Affect the Influence
of Demographic Minorities on Corporate Boards. Administrative Science Quarterly,
45(2), 366. doi:10.2307/2667075.