Embed Size (px)
Citation preview
%Women & Minorities in the Marijuana Industry
MJBizDaily.com

© Copyright 2017, Marijuana Business Daily, a division of Anne Holland Ventures Inc. You may NOT copy this book, or make public the data and facts contained herein, in part or in whole. For more copies or editorial permissions, contact [email protected] or call 401.354.7555 x1. 1
Women & Minorities in the Marijuana Industry: 10 Charts
Welcome to the first edition of the Women & Minorities in the Marijuana Industry Report, produced by the research team at Marijuana Business Daily.
Considering the nascent state of the cannabis industry and marijuana’s status as a federally illegal substance, virtually no research examining the number and role of women and minorities in the industry has been conducted. This report therefore represents a first-of-its-kind look at diversity in the cannabis sector.
Inside the report, you’ll find 10 key charts analyzing women and minorities in the cannabis industry through two primary lenses: as executives and as owners/founders of marijuana businesses. In several instances, additional data is provided to help put these results into context – showing how the cannabis industry compares to the broader U.S. economy when it comes to diversity in the highest offices of a business.
The majority of data in this report stems from an anonymous online survey of cannabis professionals, which netted responses from 567 senior executives, company founders and those with ownership stakes in marijuana businesses. Conversations with industry experts well versed in matters of diversity and inclusion helped round out the analysis, providing a perspective that does not come through in the data alone.
Throughout the course of survey development, analysis and publication, great care was taken to provide the most reliable and trustworthy data possible. Our organization’s purpose is not to hype the industry, but rather to serve as a credible reality check. To that end, there are several notes and qualifications regarding the interpretation of certain charts in this report. These are important to point out, as they’ll provide you with a clear grasp of what’s included in the information being presented.
The subject of race and diversity is especially nuanced, and more research on the topic is sorely needed. But as the first data-driven initiative to measure diversity in the cannabis industry, we believe this report serves as an important initial benchmark. As the adage goes, you can’t improve what you don’t measure.
If you have any suggestions or want to provide feedback, please contact me at [email protected].
Best regards,
Eli McVey
Marijuana Business Daily Data Analyst

Women & Minorities in the Marijuana Industry: 10 Charts
© Copyright 2017, Marijuana Business Daily, a division of Anne Holland Ventures Inc. You may NOT copy this report, or make public the data and facts contained herein, in part or in whole. For more copies or editorial permissions, contact [email protected] or call 401.354.7555 x1.2
Women in the Cannabis IndustryChart 1.01: Percentage Of Women Executives In The Cannabis Industry: 2015 Versus 2017
The percentage of women holding executive positions at cannabis businesses has fallen considerably over the past two years – down 9 percentage points from a previous Marijuana Business Daily survey conducted in October 2015 – though it remains higher than the average across the larger U.S. business landscape.
An increasing number of senior-level male executives from more traditional companies have begun entering the marijuana industry, attracted by explosive sales growth and declining social stigma surrounding cannabis use. Consequently, the executive structure of businesses in the traditional economy – where males occupy more than 75% of senior roles – has begun to seep into the marijuana industry.
Source: Marijuana Business Daily reader survey, October 2015 & August 2017; Grant Thornton International Business ReportCopyright 2017 Marijuana Business Daily, a division of Anne Holland Ventures Inc. All rights reserved.
Percentage Of Women Executives In The Cannabis Industry:2015 Versus 2017
Marijuana Business Daily 2015 Survey Marijuana Business Daily 2017 Survey National Average0%
10%
20%
30%
40%
% O
f Exe
cutiv
e Po
sition
s Fill
ed B
y W
omen
36.0%
26.9%
23.0%
Cannabis Industry Average:2015 MJBiz Daily Survey
Cannabis Industry Average:2017 MJBiz Daily Survey
2016 National Average:All U.S. Businesses
© Copyright 2017, Marijuana Business Daily, a division of Anne Holland Ventures Inc. You may NOT copy this report, or make public the data and facts contained herein, in part or in whole. For more copies or editorial permissions, contact [email protected] or call 401.354.7555 x1. 3
Marijuana Business Daily
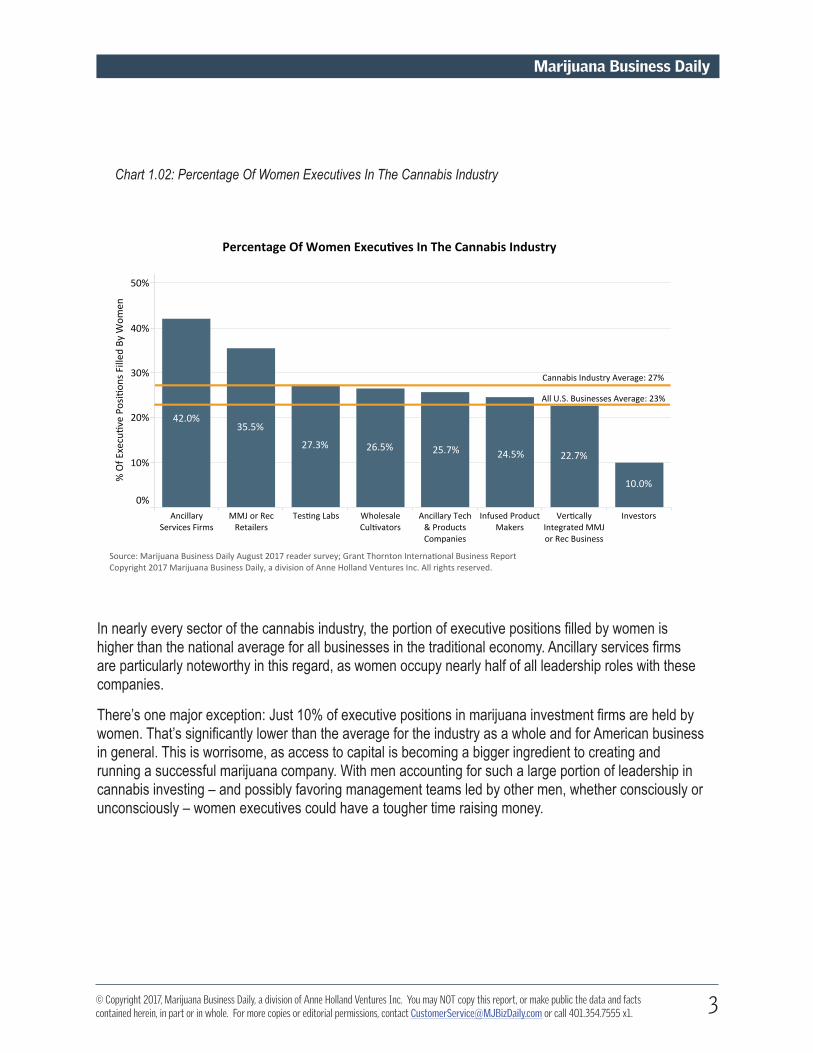
Chart 1.02: Percentage Of Women Executives In The Cannabis Industry
In nearly every sector of the cannabis industry, the portion of executive positions filled by women is higher than the national average for all businesses in the traditional economy. Ancillary services firms are particularly noteworthy in this regard, as women occupy nearly half of all leadership roles with these companies.
There’s one major exception: Just 10% of executive positions in marijuana investment firms are held by women. That’s significantly lower than the average for the industry as a whole and for American business in general. This is worrisome, as access to capital is becoming a bigger ingredient to creating and running a successful marijuana company. With men accounting for such a large portion of leadership in cannabis investing – and possibly favoring management teams led by other men, whether consciously or unconsciously – women executives could have a tougher time raising money.
Source: Marijuana Business Daily August 2017 reader survey; Grant Thornton International Business ReportCopyright 2017 Marijuana Business Daily, a division of Anne Holland Ventures Inc. All rights reserved.
Percentage Of Women Executives In The Cannabis Industry
AncillaryServices Firms
MMJ or RecRetailers
Testing Labs WholesaleCultivators
Ancillary Tech& ProductsCompanies
Infused ProductMakers
VerticallyIntegrated MMJor Rec Business
Investors
0%
10%
20%
30%
40%
50%
% O
f Exe
cutiv
e Po
sition
s Fill
ed B
y W
omen
24.5%25.7%
42.0%35.5%
27.3% 26.5%22.7%
10.0%
Cannabis Industry Average: 27%
All U.S. Businesses Average: 23%

Women & Minorities in the Marijuana Industry: 10 Charts
© Copyright 2017, Marijuana Business Daily, a division of Anne Holland Ventures Inc. You may NOT copy this report, or make public the data and facts contained herein, in part or in whole. For more copies or editorial permissions, contact [email protected] or call 401.354.7555 x1.4
Chart 1.03: Percentage Of Women Owners & Founders In The Cannabis Industry
Over a quarter of survey respondents who launched a cannabis business and/or have an ownership stake in a marijuana company are women – closely mirroring the percentage of executive positions in the MJ industry occupied by females. Ancillary services firms and ancillary tech and products companies are ahead of the pack when it comes to the percentage of female owners and founders. These companies can get off the ground with relatively little capital and without the need to obtain a license because they don’t actually touch the plant.
Marijuana companies need many of the same types of products and services that mainstream businesses require, which has made the ancillary sector of the cannabis industry a prime target for women looking to start their own businesses.
Note: Results reflect the percentage of respondents with any ownership stake in a marijuana business.Source: Marijuana Business Daily August 2017 reader surveyCopyright 2017 Marijuana Business Daily, a division of Anne Holland Ventures Inc. All rights reserved.
AncillaryServices Firms
Testing Labs Ancillary Tech& ProductsCompanies
MMJ or RecRetailers
Infused ProductMakers
WholesaleCultivators
VerticallyIntegrated
MMJ or RecBusiness
Investors
0%
10%
20%
30%
40%
50%
22.2%25.0%26.1%
33.3%
43.3%
29.8%
14.6%11.0%
Percentage Of Women Owners & Founders In The Cannabis Industry
% O
f Fem
ale
Mar
ijuan
a Bu
sines
sO
wne
rs &
Fou
nder
s
Cannabis Industry Average: 26%

© Copyright 2017, Marijuana Business Daily, a division of Anne Holland Ventures Inc. You may NOT copy this report, or make public the data and facts contained herein, in part or in whole. For more copies or editorial permissions, contact [email protected] or call 401.354.7555 x1. 5
Marijuana Business Daily
Chart 1.04: Portion Of Cannabis Businesses With Female Owners/Founders Planning To Expand Into New Markets Within The Next 12 Months
Of the female survey respondents who launched a cannabis business and/or have an ownership stake in a marijuana company, 40% say their company is planning to expand into a new market within the next year – just slightly lower than the 43% of male cannabis business owners/founders also planning to expand.
A sizable majority of female and male leaders who plan to take their companies into new markets have identified opportunities in both the medical and recreational sides of the industry, though a larger percentage of women-led companies are moving into medical-only markets.
With the exception of infused product businesses – which can leverage licensing agreements to more easily expand across state lines – just a handful of female-led plant-touching companies are planning to expand into new markets. With nearly every medical and recreational market continuing to grow, it’s not a surprise that most plant-touching businesses are choosing to stay in their home states.
Note: Results reflect the percentage of respondents with any ownership stake in a marijuana business.Source: Marijuana Business Daily August 2017 reader surveyCopyright 2017 Marijuana Business Daily, a division of Anne Holland Ventures Inc. All rights reserved.
Portion Of Cannabis Businesses With Female Owners/Founders Planning To ExpandInto New Markets Within The Next 12 Months
Ancillary Tech& ProductsCompanies
InfusedProductMakers
Investors AncillaryServices Firms
VerticallyIntegrated
MMJ or RecBusiness
WholesaleCultivators
0%
10%
20%
30%
40%
50%
60%
70%64.3%
55.6%
50.0%47.6%
14.3%
7.7%
Both68%
Medical20%
Recreational13%
Part Of The IndustryTargeted In The ExpansionBreakdown By Sector
%
Of F
emal
e O
wne
rs/F
ound
ers
P
lann
ing
To E
xpan
d Th
eir B
usin
ess
Average Across All CannabisBusinesses With FemaleOwners/Founders: 40%

Women & Minorities in the Marijuana Industry: 10 Charts
© Copyright 2017, Marijuana Business Daily, a division of Anne Holland Ventures Inc. You may NOT copy this report, or make public the data and facts contained herein, in part or in whole. For more copies or editorial permissions, contact [email protected] or call 401.354.7555 x1.6
Chart 1.05: Sampling Of Women Owners & Founders In The Cannabis Industry By State
In California and Colorado – the two largest cannabis markets in the United States – approximately one out of every three founders and/or those with an ownership in a marijuana business is a woman. That’s significantly higher than the industrywide average, where 26% of cannabis company owners/founders are female.
California, Colorado and Oregon were all on the forefront of marijuana legalization, and though barriers to entry have increased dramatically in recent years, the financial requirements to launch a business in the early days of legalization were relatively low and few restrictions were placed on the number of available licenses.
This opened the door for females to enter the industry, and in California and Colorado especially they maintain a significant presence as leaders of marijuana businesses.
Note: Results reflect the percentage of respondents with any ownership stake in a marijuana business.Source: Marijuana Business Daily August 2017 reader surveyCopyright 2017 Marijuana Business Daily, a division of Anne Holland Ventures Inc. All rights reserved.
Sampling Of Women Owners & Founders In The Cannabis Industry By State
California Colorado Oregon
0%
10%
20%
30%
40%
% O
f Fem
ale
Mar
ijuan
a Bu
sines
s Ow
ners
& F
ound
ers
34.5%32.4% 22.6%
Cannabis Industry Average: 26%
22.6%

© Copyright 2017, Marijuana Business Daily, a division of Anne Holland Ventures Inc. You may NOT copy this report, or make public the data and facts contained herein, in part or in whole. For more copies or editorial permissions, contact [email protected] or call 401.354.7555 x1. 7
Marijuana Business Daily
The subject of race is an especially sensitive issue. Over the course of many conversations with prominent figures in the marijuana industry familiar with the topic of diversity and inclusion, it became clear that the findings of our research ran counter to the widely held perceptions that minorities in general have a minuscule presence in the industry. To be sure: Minorities still appear to be vastly underrepresented in leadership roles in the cannabis industry. But it doesn’t appear to be the 1%-or-less level some people have thrown around publicly.
Certain aspects of the survey itself may contribute to a higher rate of minority participation in the cannabis industry than expected, though the differing ideas of what constitutes a racial minority also offer some insight into why perceptions might differ from reality.
With that in mind, please consider the following points as you read through the remaining charts in this report:
• The survey allowed respondents to indicate their race from five major categories – white, Hispanic/Latino, African-American/black, Asian and “other.” Nearly 7% of survey respondents identified as “other” when asked to indicate their race, the second-largest racial category in this survey after white. An increasing number of people do not identify with traditional definitions of race, a trend that’s also playing out across the broader U.S. population.
• In accordance with U.S. Census Bureau methodology, respondents were given the option to identify as more than one race and therefore are included in each race selected. This means that each racial category is constituted by individuals who identify as either a single race or as multiple races. For example, just 59% of all Hispanic/Latino respondents in this survey identified solely as Hispanic/Latino. This leads to scenarios where – to an outside observer – an individual may not appear to be a racial minority, even though that individual identifies as such.
• California has a massive influence on the marijuana industry, given that it accounts for almost a third of annual U.S. retail cannabis sales and has the largest number of MJ businesses in the country. It also has the highest concentration of minority-owned businesses in general, with some estimates putting this figure around 40%. Many marijuana businesses with minority owners also are clustered in the Golden State, having a significant impact on the overall percentage for the industry. Take California out of the equation, and the ranks of minorities who founded or have stakes in MJ companies plummets.
• The percentage of cannabis companies founded or run by minorities differs greatly by industry sector and business stage. Over half the respondents to this survey founded or have ownership stakes in ancillary marijuana businesses. These companies – such as marketing firms or law offices – don’t actually touch the plant and can get off the ground with relatively little capital and without the need to obtain a license. Furthermore, the stage each of these businesses have reached runs the gamut, with some generating six-figure annual revenues while others have yet to secure their first client. Some companies founded by minorities are in their very early stages and have not yet started generating revenue.
• The survey data reflects the percentage of respondents who have any ownership stake in a business, not necessarily a controlling share. For example, 20% of a business may be controlled by a racial minority, meaning the business has a minority owner but is not minority-owned.
Minorities in the Cannabis Industry

Women & Minorities in the Marijuana Industry: 10 Charts
© Copyright 2017, Marijuana Business Daily, a division of Anne Holland Ventures Inc. You may NOT copy this report, or make public the data and facts contained herein, in part or in whole. For more copies or editorial permissions, contact [email protected] or call 401.354.7555 x1.8
Chart 1.06: Percentage Of Minority Executives In The Cannabis Industry
The percentage of minorities who hold executive positions at cannabis businesses stands at 17%, higher than the average across all U.S. businesses as a whole. Bearing in mind how the U.S. war on drugs has disproportionately affected people of color, this is a higher portion than many industry insiders would expect.
That’s partly due to how racial minorities are classified by this survey but is also a reflection of the rise in racially mixed families and individuals throughout the United States.
By sector, minorities occupy a significantly higher percentage of executive positions at wholesale cultivation businesses relative to the rest of the industry. Many medical marijuana markets require dispensaries to grow all the cannabis that will be sold in their stores, eliminating the opportunity for stand-alone cultivation businesses. California does allow wholesale cultivation, which gives the state an even larger presence in the data than it already has. And because of the racially diverse nature of the state, it escalates the percentage of minorities in leadership roles above all other segments of the marijuana industry.
Advocates of racial diversity in the marijuana industry have made meaningful progress in a number of states to influence policy and provide minorities with more opportunities to occupy decision-making roles in cannabis companies. These types of efforts have become more common of late – especially with newly legalized states, like Arkansas, Ohio and Pennsylvania, that are still developing their marijuana programs – hopefully setting the table for a more diverse cannabis industry down the road.
Source: Marijuana Business Daily August 2017 reader survey, 2014 U.S. Equal Employment Opportunity Commission reportCopyright 2017 Marijuana Business Daily, a division of Anne Holland Ventures Inc. All rights reserved.
Percentage Of Minority Executives In The Cannabis Industry
WholesaleCultivators
Ancillary ServicesFirms
Infused ProductMakers
Ancillary Tech &Products
Companies
MMJ or RecRetailers
VerticallyIntegrated MMJ or
Rec Business
Investors
0%
5%
10%
15%
20%
25%
30%
% O
f Exe
cutiv
e Po
sition
s Fill
ed B
y M
inor
ities
15.7%
20.8%24.1%
16.0%13.3% 12.3% 12.2%
Cannabis Industry Average: 17%
All U.S. Businesses Average: 13%

© Copyright 2017, Marijuana Business Daily, a division of Anne Holland Ventures Inc. You may NOT copy this report, or make public the data and facts contained herein, in part or in whole. For more copies or editorial permissions, contact [email protected] or call 401.354.7555 x1. 9
Marijuana Business Daily
Chart 1.07: Percentage Of Female Minority Executives In The Cannabis Industry
As a whole, the highest concentration of women executives in the cannabis industry are at ancillary services firms, which also holds true for women of color. Overall, though, just over 5% of senior roles in the cannabis industry are occupied by female minorities, slightly above the national average across all U.S. businesses.
Relative to their share of the U.S. workforce, both women and minorities are underrepresented in executive positions – and the disparity is even more acute for women of color. There’s an absence of robust data regarding the racial composition of the cannabis industry workforce at large, but it’s likely this trend extends to marijuana businesses as well.
Source: Marijuana Business Daily August 2017 reader survey, 2014 U.S. Equal Employment Opportunity Commission reportCopyright 2017 Marijuana Business Daily, a division of Anne Holland Ventures Inc. All rights reserved.
Percentage Of Female Minority Executives In The Cannabis Industry
Ancillary ServicesFirms
MMJ or RecRetailers
WholesaleCultivators
Ancillary Tech &Products
Companies
Infused ProductMakers
Investors VerticallyIntegrated MMJ or
Rec Business
0%
2%
4%
6%
8%
10%
12%
% O
f Exe
cutiv
e Po
sition
s Fill
ed B
y Fe
mal
e M
inor
ities
10.0%6.5%
4.8% 4.3% 4.1%3.0%
1.3%
Cannabis Industry Average: 5.3%
All U.S. Businesses Average: 4.5%

Women & Minorities in the Marijuana Industry: 10 Charts
© Copyright 2017, Marijuana Business Daily, a division of Anne Holland Ventures Inc. You may NOT copy this report, or make public the data and facts contained herein, in part or in whole. For more copies or editorial permissions, contact [email protected] or call 401.354.7555 x1.10
Chart 1.08: Breakdown Of Marijuana Business Owners & Founders By Race
Nearly 20% of survey respondents who launched a cannabis business and/or have an ownership stake in a marijuana company are racial minorities. Combined, Hispanic/Latinos and African-Americans account for over half of minority owners/founders in the marijuana industry.
These results are somewhat surprising, given the widely held perception that minorities in general have a minuscule presence in the industry. The percentages are still small, but not as low as some think.
It’s important to remember that the survey used to gather this data reflects the percentage of respondents who have any ownership stake in a business, not necessarily a controlling share. So the portion of businesses that are at least 51% minority owned is less than 20% – and perhaps significantly less.
And while many states have taken strides to entice more minority entrepreneurs into the cannabis industry – advocates point to Pennsylvania’s MMJ program as a model for other states seeking to boost diversity – racial minorities still face substantial financial and legal barriers preventing many would-be business owners from entering the industry. Requirements in several states that marijuana business license applicants have no criminal record disproportionately affects people of color, as do the steep application and licensing fees needed to get a business off the ground.
Note: Results reflect the percentage of repondents with any ownership stake in a marijuana business.Source: Marijuana Business Daily August 2017 reader surveyCopyright 2017 Marijuana Business Daily, a division of Anne Holland Ventures Inc. All rights reserved.
Breakdown Of Marijuana Business Owners & Founders By Race
White Other Hispanic/Latino African-American Asian0%
20%
40%
60%
80%
100%
% O
f Mar
ijuan
a Bu
sines
s Ow
ners
& F
ound
ers
81.0%
6.7% 5.7% 4.3% 2.4%

© Copyright 2017, Marijuana Business Daily, a division of Anne Holland Ventures Inc. You may NOT copy this report, or make public the data and facts contained herein, in part or in whole. For more copies or editorial permissions, contact [email protected] or call 401.354.7555 x1. 11
Marijuana Business Daily
Chart 1.09: Breakdown Of Marijuana Business Owners & Founders By Race & Business Type
With the exception of cannabis business owners and/or founders that identified as “other,” the rate of business ownership among racial minorities is higher for ancillary companies relative to that of plant-touching businesses. For African-American and Asian cannabis businesses owners/founders, this trend is especially pronounced.
That’s not especially surprising considering that in many states – especially those with tightly regulated MMJ programs – entrepreneurs hoping to secure a license for a plant-touching business must pay steep application fees and possess large amounts of liquid capital. In an increasing number of states, it can cost hundreds of thousands if not millions of dollars to start a plant-touching business.
Regardless of race, most people simply do not have these kinds of resources. Factor in the additional hurdles faced by a higher proportion of people of color – including lack of access to investors and business connections – and it’s easy to see why minority business owners have gravitated toward the ancillary side of the cannabis industry.
Note: Results reflect the percentage of repondents with any ownership stake in a marijuana business.Source: Marijuana Business Daily August 2017 reader surveyCopyright 2017 Marijuana Business Daily, a division of Anne Holland Ventures Inc. All rights reserved.
Breakdown Of Marijuana Business Owners & Founders By Race & Business Type
0%
20%
40%
60%
80%
100%
% O
f Mar
ijuan
a Bu
sines
s Ow
ners
& F
ound
ers
81.3% 80.7%
9.1%4.7% 5.3% 6.0%
2.7% 5.6%1.6% 3.0%
Plant-Touching Ancillary
White Other Hispanic/Latino African-American Asian

Women & Minorities in the Marijuana Industry: 10 Charts
© Copyright 2017, Marijuana Business Daily, a division of Anne Holland Ventures Inc. You may NOT copy this report, or make public the data and facts contained herein, in part or in whole. For more copies or editorial permissions, contact [email protected] or call 401.354.7555 x1.12
Chart 1.10: Sampling Of Owners & Founders In The Cannabis Industry By State & Race
In general, marijuana business owners and founders in California are more diverse compared to the cannabis industry as a whole. In Colorado, however, approximately nine out of every 10 cannabis company owners/founders are white.
California is more racially diverse than most of the country, so it makes sense that minorities comprise a larger share of the state’s cannabis industry (though the figure is still well below minority ownership across all businesses in the state overall). Furthermore, the barriers to entry in California have historically been extremely low. For decades, marijuana businesses throughout California have operated either in violation of the law or on the fringes of it – providing opportunities for any entrepreneur willing to stomach the risk.
Colorado ranks in the bottom half of all 50 states in terms of minority-owned businesses in the larger economy, so the relative lack of diversity in the cannabis industry is partly a function of the state’s racial composition. Furthermore, Colorado has the most mature marijuana market in the nation, making it hard for any business without substantial resources to survive in such a competitive environment.
Note: Results reflect the percentage of respondents with any ownership stake in a marijuana business.Source: Marijuana Business Daily August 2017 reader surveyCopyright 2017 Marijuana Business Daily, a division of Anne Holland Ventures Inc. All rights reserved.
Sampling Of Owners & Founders In The Cannabis Industry By State & Race
California Colorado
White Hispanic/Latino
Other African-American
Asian White Hispanic/Latino
Other African-American
Asian0%
20%
40%
60%
80%
100%
% O
f Mar
ijuan
a Bu
sines
s Ow
ners
& F
ound
ers
76.6%
8.1% 7.3% 4.8% 3.2%
0.0%
86.1%
5.6% 5.6% 2.8%>1%

© Copyright 2017, Marijuana Business Daily, a division of Anne Holland Ventures Inc. You may NOT copy this report, or make public the data and facts contained herein, in part or in whole. For more copies or editorial permissions, contact [email protected] or call 401.354.7555 x1. 13
Marijuana Business Daily
Table 1.01: Breakdown Of Survey Respondents By Race
Appendix
MethodologyMarijuana Business Daily gathered data for this report through an industrywide, anonymous online survey of cannabis business owners, founders and senior executives. The survey took place from Aug. 9 through Aug. 13 and includes qualified responses from 567 self-identified marijuana industry professionals.
These figures represent responses from individuals who are operating in a legal capacity in the U.S. cannabis industry. We take an extremely conservative approach and exclude data for businesses/respondents whose legal standing is unclear in any manner.
Examples of what we exclude consist of, but are not limited to, responses from those who:
• Claim they operate plant-touching businesses in states that have not legalized medical or recreational cannabis
• Claim they operate wholesale grows in states where such sales are not permitted
The following tables provide further detail regarding the data used in this report:
Race % Survey Respondents
White 81.2%% Identifying as White Only 95.3%
% Identifying as White & Another Race 4.7%
Other 6.6%% Identifying as Other Only 62.5%
% Identifying as Other & Another Race 37.5%
Hispanic/Latino 5.6%% Identifying as Hispanic/Latino Only 58.8%
% Identifying as Hispanic/Latino & Another Race 41.2%
African-American/Black 4.3%% Identifying as African-American/Black Only 65.4%
% Identifying as African-American/Black & Another Race 34.6%
Asian 2.3%% Identifying as Asian Only 64.3%
% Identifying as Asian & Another Race 35.7%

Women & Minorities in the Marijuana Industry: 10 Charts
© Copyright 2017, Marijuana Business Daily, a division of Anne Holland Ventures Inc. You may NOT copy this report, or make public the data and facts contained herein, in part or in whole. For more copies or editorial permissions, contact [email protected] or call 401.354.7555 x1.14
Table 1.02: Breakdown Of Survey Respondents By Business Sector
Table 1.03: Breakdown Of Survey Respondents By Role At Marijuana Company
*This includes individuals with any ownership stake in a cannabis business, not necessarily a controlling interest.
Business Sector % Survey Respondents
Ancillary Services Firms 26.4%Investing 17.4%Wholesale Cultivators 14.5%Vertically Integrated MMJ or Rec Business 13.0%Ancillary Tech & Products Companies 12.4%Infused Product Makers 8.8%MMJ or Rec Retailers 5.4%Testing Labs 2.1%
Role at Marijuana Company % Survey Respondents
Owner/Founder* 63.2%Senior Executive 21.0%Other Executive/Management 15.9%

© Copyright 2017, Marijuana Business Daily, a division of Anne Holland Ventures Inc. You may NOT copy this report, or make public the data and facts contained herein, in part or in whole. For more copies or editorial permissions, contact [email protected] or call 401.354.7555 x1. 15
Marijuana Business Daily
Table 1.04: Breakdown Of Survey Respondents By Business Headquarters
Business Headquarters % Survey Respondents
California 30.4%Colorado 10.7%Florida 8.1%Oregon 7.4%Michigan 6.1%Washington state 5.0%Nevada 4.8%Massachusetts 2.8%New York 2.6%Maryland 2.4%Arizona 2.4%Texas 2.0%Illinois 1.8%Maine 1.5%Pennsylvania 1.1%Alaska 0.9%New Jersey 0.9%Georgia 0.9%Missouri 0.7%Ohio 0.7%Rhode Island 0.6%Kentucky 0.6%Tennessee 0.6%New Mexico 0.6%Virginia 0.4%South Carolina 0.4%North Carolina 0.4%Indiana 0.4%New Hampshire 0.4%

Women & Minorities in the Marijuana Industry: 10 Charts
© Copyright 2017, Marijuana Business Daily, a division of Anne Holland Ventures Inc. You may NOT copy this report, or make public the data and facts contained herein, in part or in whole. For more copies or editorial permissions, contact [email protected] or call 401.354.7555 x1.16
Table 1.04: Breakdown Of Survey By Business Headquarters - Continued
Business Headquarters % Survey Respondents
Washington DC 0.4%Wisconsin 0.4%Idaho 0.2%Utah 0.2%Hawaii 0.2%Arkansas 0.2%Montana 0.2%Connecticut 0.2%Delaware 0.2%Alabama 0.2%Minnesota 0.2%Mississippi 0.2%


![The Legal Marijuana Industry in the U.S.: Its Past, Present and Future [Infographic]](https://img.pdfslide.us/doc/110x75/55a7a8ba1a28ab63638b45cf/the-legal-marijuana-industry-in-the-us-its-past-present-and-future-infographic.jpg)