Embed Size (px)
Citation preview
Special Eurobarometer 376
WOMEN IN DECISION-MAKING POSITIONS
SUMMARY
Fieldwork: September 2011
Publication: March 2012
This survey has been requested by Directorate-General Justice and co-ordinated by Directorate-
General for Communication (DG COMM “Research and Speechwriting” Unit).
http://ec.europa.eu/public_opinion/index_en.htm
This document does not represent the point of view of the European Commission. The interpretations and opinions contained in it are solely those of the authors.
Special Eurobarometer 376 / Wave EB76.1 – TNS Opinion & Social
Special Eurobarometer 376
Women in decision-making positions
Conducted by TNS Opinion & Social at the request of Directorate-General Justice
Survey co-ordinated by Directorate-General Communication
SPECIAL EUROBAROMETER 376 “Women in decision-making positions”
2
TABLE OF CONTENTS
INTRODUCTION AND METHODOLOGY .......................................................... 3
1. GENERAL ASSOCIATIONS WITH GENDER EQUALITY ISSUES ................... 5
1.1 Women and positions of responsibility ..................................................... 5
1.2 Women and their careers ...................................................................... 8
1.3 Women and their family responsibilities .................................................. 9
1.4 Women in the business community ....................................................... 10
2. EQUAL REPRESENTATION OF WOMEN AND MEN IN LEADERSHIP
POSITIONS IN PRIVATE COMPANIES .................................................... 11
2.1 Representation of women in leadership positions in private companies .... 11
2.2 Reasons for promoting equal representation between men and women in
positions of leadership in companies ................................................... 13
3 ACHIEVING A BALANCED REPRESENTATION OF WOMEN AND MEN ON
COMPANY BOARDS ............................................................................... 15
3.1 Best way to achieve balanced representation of women and men on
company boards .............................................................................. 15
3.2 Legislation to achieve balanced representation of women and men on
company boards .............................................................................. 18
3.3 Decision level for measures to improve gender balance on company boards19
4 LEGISLATION PROVIDING A MORE BALANCED REPRESENTATION OF
WOMEN AND MEN ON COMPANY BOARDS ............................................. 21
4.1 Realistic targets ............................................................................... 21
4.2 Appropriate implementation time ....................................................... 23
4.3 Appropriate sanctions in case of non-compliance .................................. 25
ANNEXES TECHNICAL SPECIFICATIONS
SPECIAL EUROBAROMETER 376 “Women in decision-making positions”
3
INTRODUCTION AND METHODOLOGY
In the light of the EU Women’s Charter and the resulting EU Strategy for Equality
between Women and Men for the years 2010-2015, the purpose of this summary is to
present the main results of the Eurobarometer which was launched to gain insight in
Europeans’ opinion on equal representation of women and men on positions of
responsibility.
This summary presents Europeans’ opinions on issues associated with gender equality
and focuses on gender balance in business leadership. A greater understanding of
Europeans’ opinions about women in leadership positions in companies could be of help
to policymakers to develop gender balance policies that take into account the level of
support such legislation would receive from EU citizens, at EU level as well as national
level.
The outline of the summary is as follows.
♦ General associations with gender equality
♦ Equal representation of women and men in positions of responsibility
♦ How to achieve gender balance on company boards
♦ Legislation for more balanced representation of women and men on company
boards
This survey was conducted by TNS Opinion & Social at the request of the Directorate-
General Justice. It was coordinated by the Directorate-General for Communication1.
The Eurobarometer web site can be consulted at the following address:
http://ec.europa.eu/public_opinion/index_en.htm
We would like to take the opportunity to thank all the respondents across the continent
who have given of their time to take part in this survey.
Without their active participation, this study would simply not have been possible.
1 It is the result of the special Eurobarometer 376 (EB76.1) held from 3 to 18 September 2011 (fieldwork) and involved 26,856 interviews in all 27 Member States. The methodology used is that of the Standard Eurobarometer surveys of the Directorate-General for Communication (“Research and Speechwriting” Unit). A technical note explaining the methodology used in carrying out the interviews is annexed to this report

SPECIAL EUROBAROMETER 376 “Women in decision-making positions”
4
In this summary, the countries are represented by their official abbreviations. The
abbreviations used in this summary correspond to:
ABREVIATIONS
EU27 European Union - 27 Member States
EU15 The fifteen Member States that were EU Members prior to
the accession of ten candidate countries on 1 May 2004
NMS12 The twelve Member States that joined the European Union
in the recent years (2004 and 2007)
BE Belgium
BG Bulgaria
CZ Czech Republic
DK Denmark
DE Germany
EE Estonia
IE Ireland
EL Greece
ES Spain
FR France
IT Italy
CY Republic of Cyprus
LV Latvia
LT Lithuania
LU Luxembourg
HU Hungary
MT Malta
NL The Netherlands
AT Austria
PL Poland
PT Portugal
RO Romania
SI Slovenia
SK Slovakia
FI Finland
SE Sweden
UK United Kingdom
SPECIAL EUROBAROMETER 376 “Women in decision-making positions”
5
1. GENERAL ASSOCIATIONS WITH GENDER EQUALITY ISSUES
The first chapter of this report presents Europeans’ views on gender equality in general.
1.1 Women and positions of responsibility
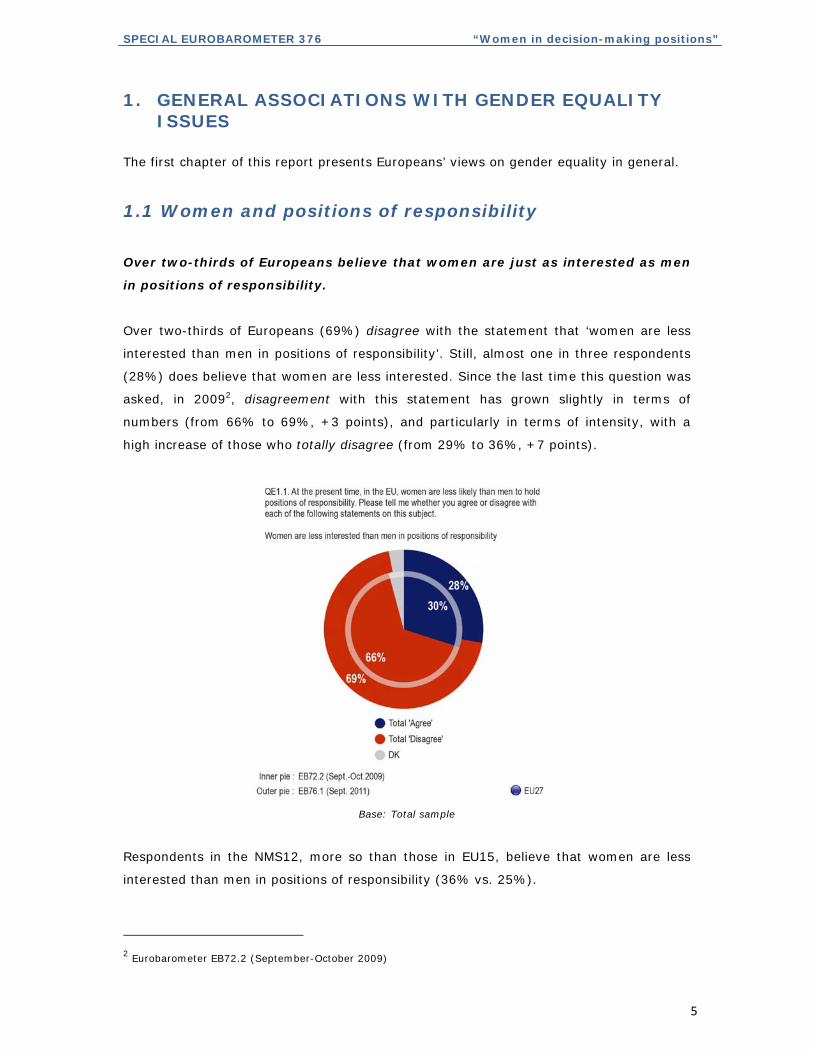
Over two-thirds of Europeans believe that women are just as interested as men
in positions of responsibility.
Over two-thirds of Europeans (69%) disagree with the statement that ‘women are less
interested than men in positions of responsibility’. Still, almost one in three respondents
(28%) does believe that women are less interested. Since the last time this question was
asked, in 20092, disagreement with this statement has grown slightly in terms of
numbers (from 66% to 69%, +3 points), and particularly in terms of intensity, with a
high increase of those who totally disagree (from 29% to 36%, +7 points).
Base: Total sample
Respondents in the NMS12, more so than those in EU15, believe that women are less
interested than men in positions of responsibility (36% vs. 25%).
2 Eurobarometer EB72.2 (September-October 2009)

SPECIAL EUROBAROMETER 376 “Women in decision-making positions”
6
Country-by-country analysis reveals that the highest percentages of respondents
thinking women are less interested than men are found in Denmark (49%), Slovakia
(47%), the Czech Republic (44%), Austria (42%) and Poland (40%). And the smallest
proportions of respondents who believe this are the United Kingdom (18%), Spain
(17%), Sweden (16%), France and Ireland (both 15%).
A large majority of Europeans believe that women have the necessary qualities
and skills to fill positions of responsibility.
Over three-quarters of the Europeans interviewed (76%) disagree with this statement
and about one in five (21%) believes that women do not always have the necessary
qualities and skills to fill positions of responsibility. Since 2009, the proportion of
respondents disagreeing with this statement has clearly grown (from 71% to 76%, +5
points), with a marked increase of respondents who totally disagree (from 38% to 47%,
+9 points).
Base: Total sample
Interviewees in the EU15 are much more likely than those in the NMS12 to disagree with
the statement that women lack qualities and skills (79% vs. 64).
SPECIAL EUROBAROMETER 376 “Women in decision-making positions”
7
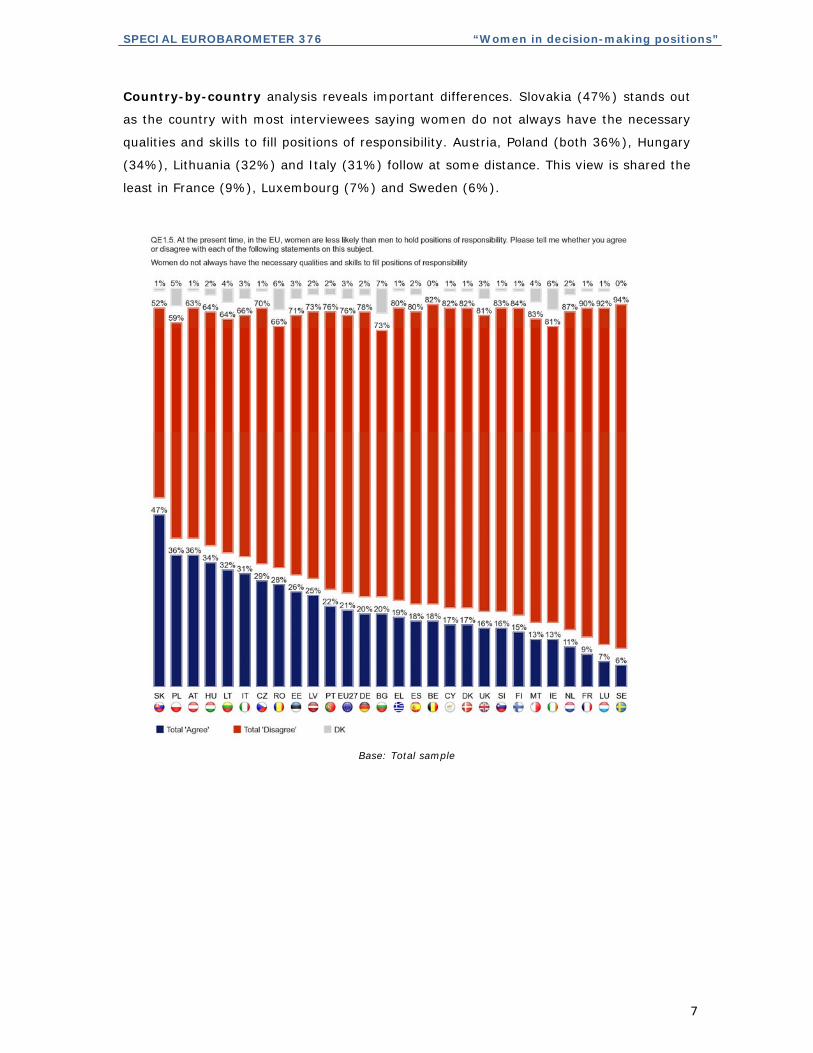
Country-by-country analysis reveals important differences. Slovakia (47%) stands out
as the country with most interviewees saying women do not always have the necessary
qualities and skills to fill positions of responsibility. Austria, Poland (both 36%), Hungary
(34%), Lithuania (32%) and Italy (31%) follow at some distance. This view is shared the
least in France (9%), Luxembourg (7%) and Sweden (6%).
Base: Total sample
SPECIAL EUROBAROMETER 376 “Women in decision-making positions”
8
1.2 Women and their careers
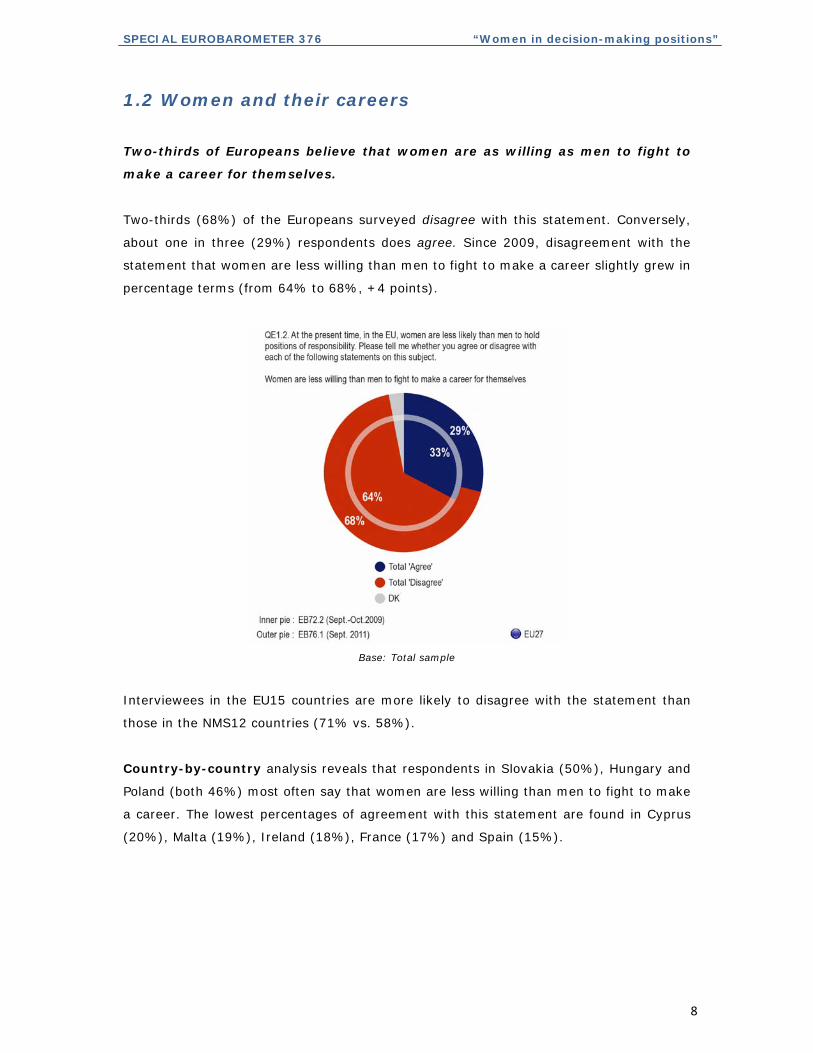
Two-thirds of Europeans believe that women are as willing as men to fight to
make a career for themselves.
Two-thirds (68%) of the Europeans surveyed disagree with this statement. Conversely,
about one in three (29%) respondents does agree. Since 2009, disagreement with the
statement that women are less willing than men to fight to make a career slightly grew in
percentage terms (from 64% to 68%, +4 points).
Base: Total sample
Interviewees in the EU15 countries are more likely to disagree with the statement than
those in the NMS12 countries (71% vs. 58%).
Country-by-country analysis reveals that respondents in Slovakia (50%), Hungary and
Poland (both 46%) most often say that women are less willing than men to fight to make
a career. The lowest percentages of agreement with this statement are found in Cyprus
(20%), Malta (19%), Ireland (18%), France (17%) and Spain (15%).
SPECIAL EUROBAROMETER 376 “Women in decision-making positions”
9
1.3 Women and their family responsibilities
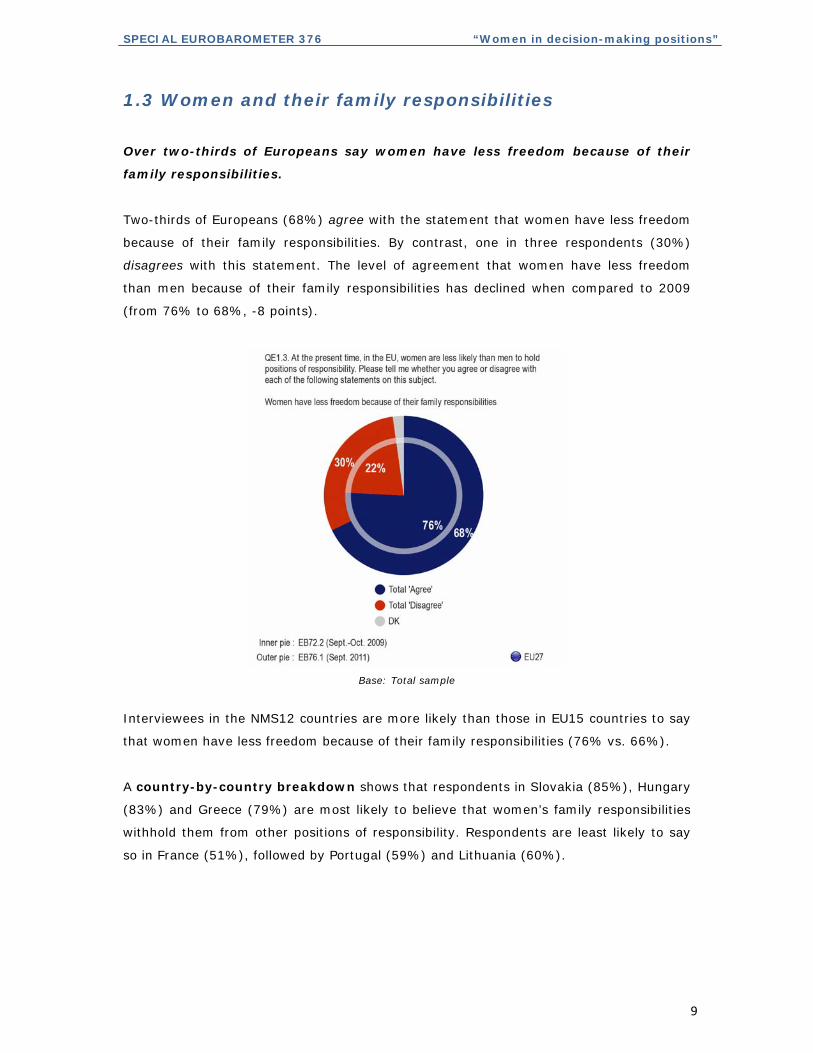
Over two-thirds of Europeans say women have less freedom because of their
family responsibilities.
Two-thirds of Europeans (68%) agree with the statement that women have less freedom
because of their family responsibilities. By contrast, one in three respondents (30%)
disagrees with this statement. The level of agreement that women have less freedom
than men because of their family responsibilities has declined when compared to 2009
(from 76% to 68%, -8 points).
Base: Total sample
Interviewees in the NMS12 countries are more likely than those in EU15 countries to say
that women have less freedom because of their family responsibilities (76% vs. 66%).
A country-by-country breakdown shows that respondents in Slovakia (85%), Hungary
(83%) and Greece (79%) are most likely to believe that women’s family responsibilities
withhold them from other positions of responsibility. Respondents are least likely to say
so in France (51%), followed by Portugal (59%) and Lithuania (60%).
SPECIAL EUROBAROMETER 376 “Women in decision-making positions”
10
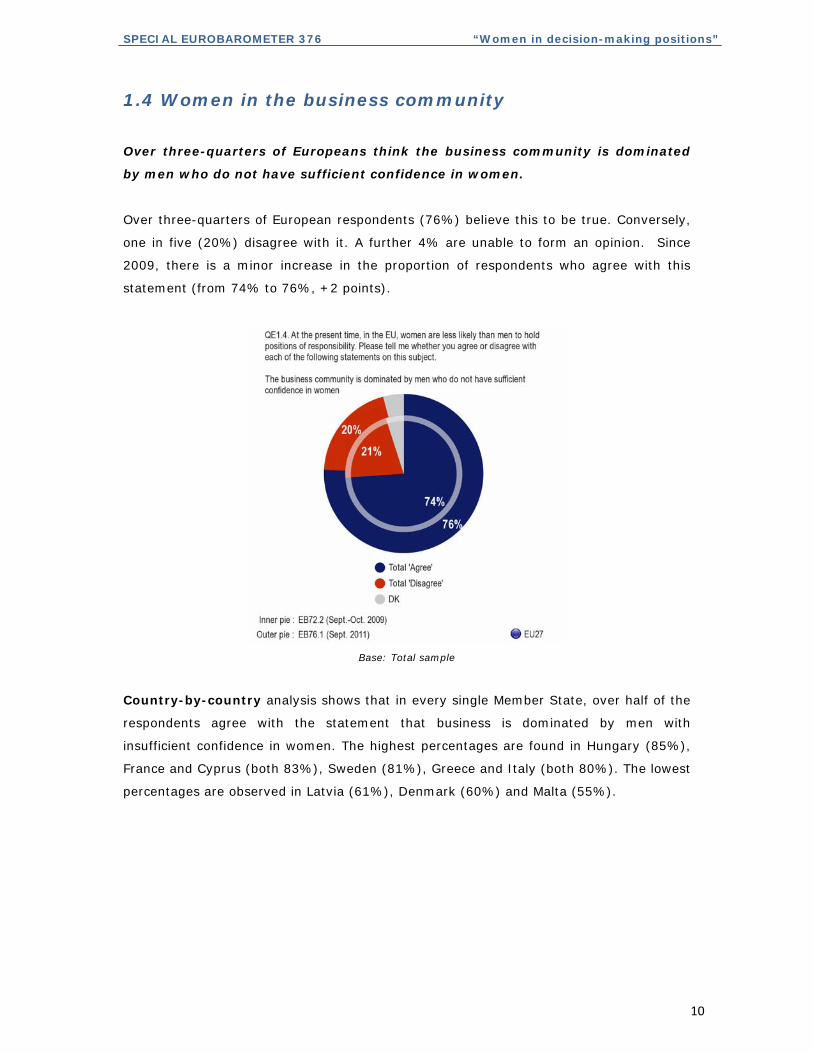
1.4 Women in the business community
Over three-quarters of Europeans think the business community is dominated
by men who do not have sufficient confidence in women.
Over three-quarters of European respondents (76%) believe this to be true. Conversely,
one in five (20%) disagree with it. A further 4% are unable to form an opinion. Since
2009, there is a minor increase in the proportion of respondents who agree with this
statement (from 74% to 76%, +2 points).
Base: Total sample
Country-by-country analysis shows that in every single Member State, over half of the
respondents agree with the statement that business is dominated by men with
insufficient confidence in women. The highest percentages are found in Hungary (85%),
France and Cyprus (both 83%), Sweden (81%), Greece and Italy (both 80%). The lowest
percentages are observed in Latvia (61%), Denmark (60%) and Malta (55%).
SPECIAL EUROBAROMETER 376 “Women in decision-making positions”
11
2. EQUAL REPRESENTATION OF WOMEN AND MEN IN LEADERSHIP POSITIONS IN PRIVATE COMPANIES
The second chapter focussed more specifically on gender balance in leadership positions
in private companies.
2.1 Representation of women in leadership positions in
private companies
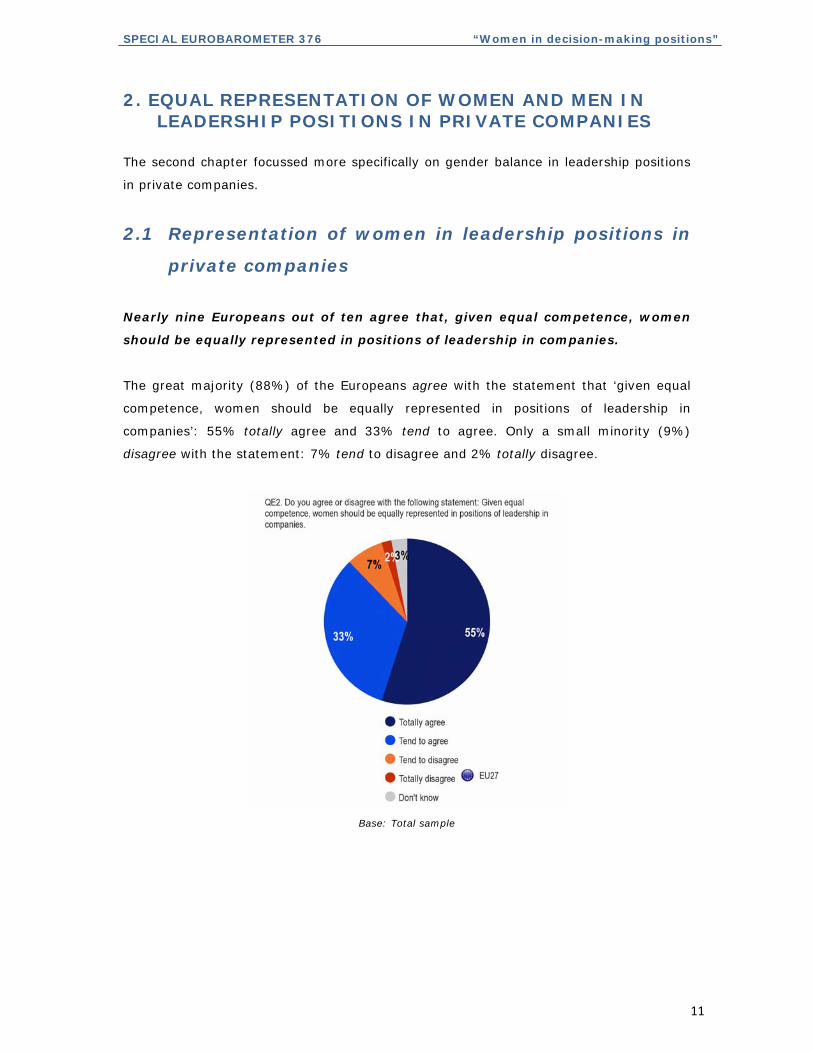
Nearly nine Europeans out of ten agree that, given equal competence, women
should be equally represented in positions of leadership in companies.
The great majority (88%) of the Europeans agree with the statement that ‘given equal
competence, women should be equally represented in positions of leadership in
companies’: 55% totally agree and 33% tend to agree. Only a small minority (9%)
disagree with the statement: 7% tend to disagree and 2% totally disagree.
Base: Total sample
SPECIAL EUROBAROMETER 376 “Women in decision-making positions”
12
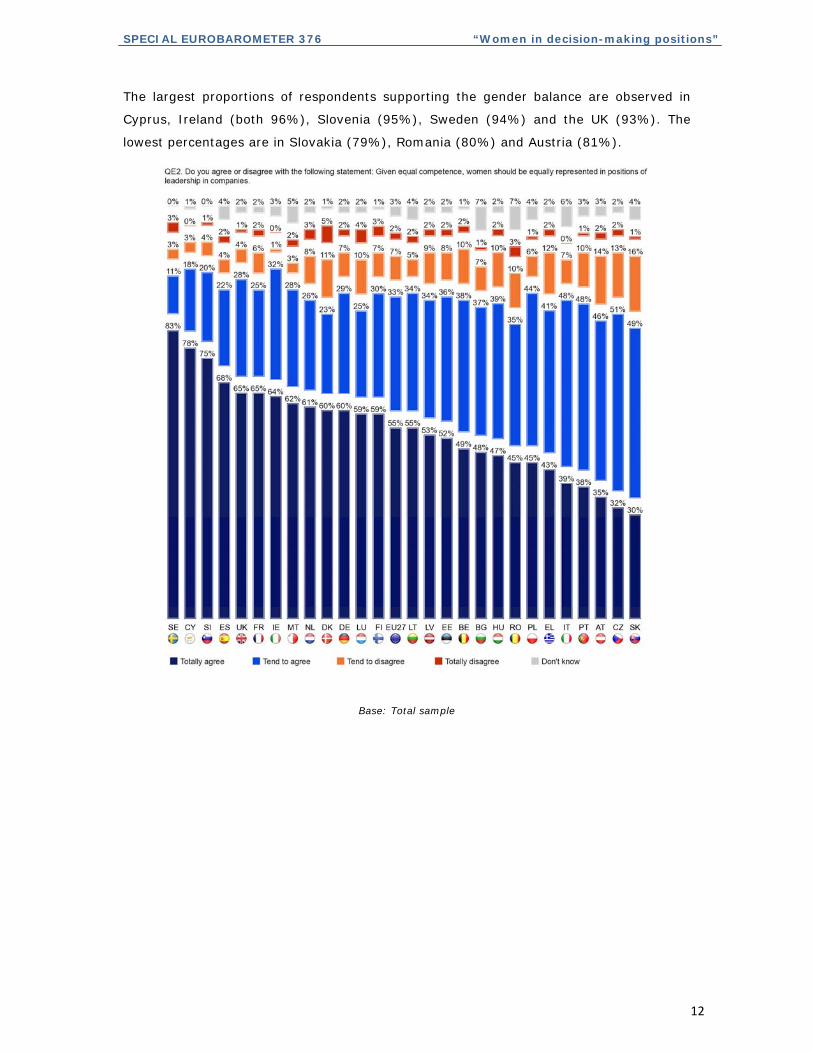
The largest proportions of respondents supporting the gender balance are observed in
Cyprus, Ireland (both 96%), Slovenia (95%), Sweden (94%) and the UK (93%). The
lowest percentages are in Slovakia (79%), Romania (80%) and Austria (81%).
Base: Total sample

SPECIAL EUROBAROMETER 376 “Women in decision-making positions”
13
2.2 Reasons for promoting equal representation
between men and women in positions of leadership
in companies
Europeans mention equal qualifications and equal rights most often
as reasons for gender balance in company leadership.
Of those Europeans who are in favour of gender balance in company leaderships,
majorities say ‘because women are as qualified for these positions as men are’ (62%) or
‘it is about equal rights for women and men’ (58%); fewer than three in ten mention that
‘it would encourage other women to lead a professional career’ (28%) or ‘it would make
a difference in the way companies are run’ (27%); smaller percentages cite ‘it would
ensure a better overall economic performance of companies’ (17%) or ‘it would ensure a
better risk management of companies’ (15%).
Base: Respondents who answered they ‘totally agree’ or ‘tend to agree’
that women should be equally represented (n= 23,700)
A country-by-country breakdown shows that Sweden (84%) and Denmark (82%)
stand out as the Member States with vast majorities saying ‘because women are as
qualified for these positions as men are’.
SPECIAL EUROBAROMETER 376 “Women in decision-making positions”
14
France (77%) stands out as the country with highest percentage of respondents
mentioning ‘equal rights of women and men’, followed on some distance by Finland and
Belgium (both 66%).
The highest percentages of respondents citing ‘because it would encourage other women
to lead a professional career’ are found in Cyprus (45%) and Austria (42%). Conversely,
lowest percentages are found in Spain and Slovenia (both 21%).
Denmark, the Netherlands (both 55%) and Sweden (53%) stand out as the Member
States with over half of the interviewees saying ‘it would make a difference in the way
companies are run’. In contrast, respondents in Poland and Lithuania (both 10%) were
least likely to.
Ireland stands out as the country with largest proportions of respondents citing ‘because
it would ensure a better overall economic performance of companies’ (37%) and
‘because it would ensure a better risk management of companies’ (22%).

SPECIAL EUROBAROMETER 376 “Women in decision-making positions”
15
3 ACHIEVING A BALANCED REPRESENTATION OF WOMEN AND MEN ON COMPANY BOARDS
This chapter will take one step further and discuss Europeans’ views on how to achieve a
balanced representation of women and men on company boards.
3.1 Best way to achieve balanced representation of
women and men on company boards
Opinion is divided on how to achieve gender balance on company boards.
Opinion is divided on the best way to achieve gender balance in company boards. Almost
one-third believes the best way is ‘self-regulation by companies setting their own targets’
(31%). Just over a quarter thinks it would demand ‘binding legal measures’ (26%). One-
fifth says ‘voluntary measures, such as non-binding Corporate Governance Codes and
Charters’ (20%).
Base: total sample
Respondents in NMS12 more often tend not to have an opinion on this topic than those in
EU15 (20% NMS12 vs. 14% EU15). Conversely, respondents in EU15 are somewhat
more likely than those in NMS12 to be in favour of self-regulation by companies (32%
EU15 vs. 27% NMS12).
SPECIAL EUROBAROMETER 376 “Women in decision-making positions”
16
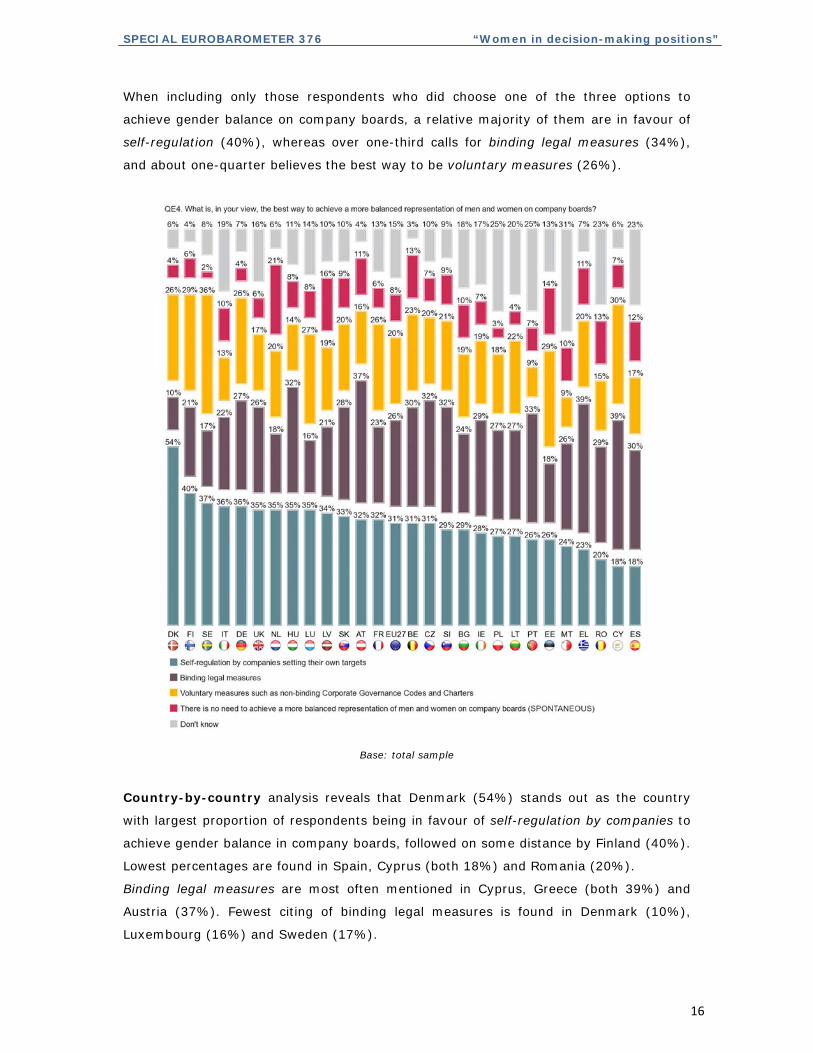
When including only those respondents who did choose one of the three options to
achieve gender balance on company boards, a relative majority of them are in favour of
self-regulation (40%), whereas over one-third calls for binding legal measures (34%),
and about one-quarter believes the best way to be voluntary measures (26%).
Base: total sample
Country-by-country analysis reveals that Denmark (54%) stands out as the country
with largest proportion of respondents being in favour of self-regulation by companies to
achieve gender balance in company boards, followed on some distance by Finland (40%).
Lowest percentages are found in Spain, Cyprus (both 18%) and Romania (20%).
Binding legal measures are most often mentioned in Cyprus, Greece (both 39%) and
Austria (37%). Fewest citing of binding legal measures is found in Denmark (10%),
Luxembourg (16%) and Sweden (17%).
SPECIAL EUROBAROMETER 376 “Women in decision-making positions”
17
Sweden (36%) has the highest percentage of interviewees who prefer voluntary
measures, followed on some distance by Cyprus (30%). By contrast, Malta and Portugal
(both 9%) have the lowest percentages.
The highest percentage of interviewees who spontaneously say that there is no need to
achieve more gender balance on company boards are found in the Netherlands (21%),
followed on some distance by Latvia (16%). Lowest percentages are found in Sweden
(2%) and Poland (3%).
Malta (31%), Portugal and Poland (25%) have the largest proportions of respondents
saying they don’t know.
SPECIAL EUROBAROMETER 376 “Women in decision-making positions”
18
3.2 Legislation to achieve balanced representation of
women and men on company boards
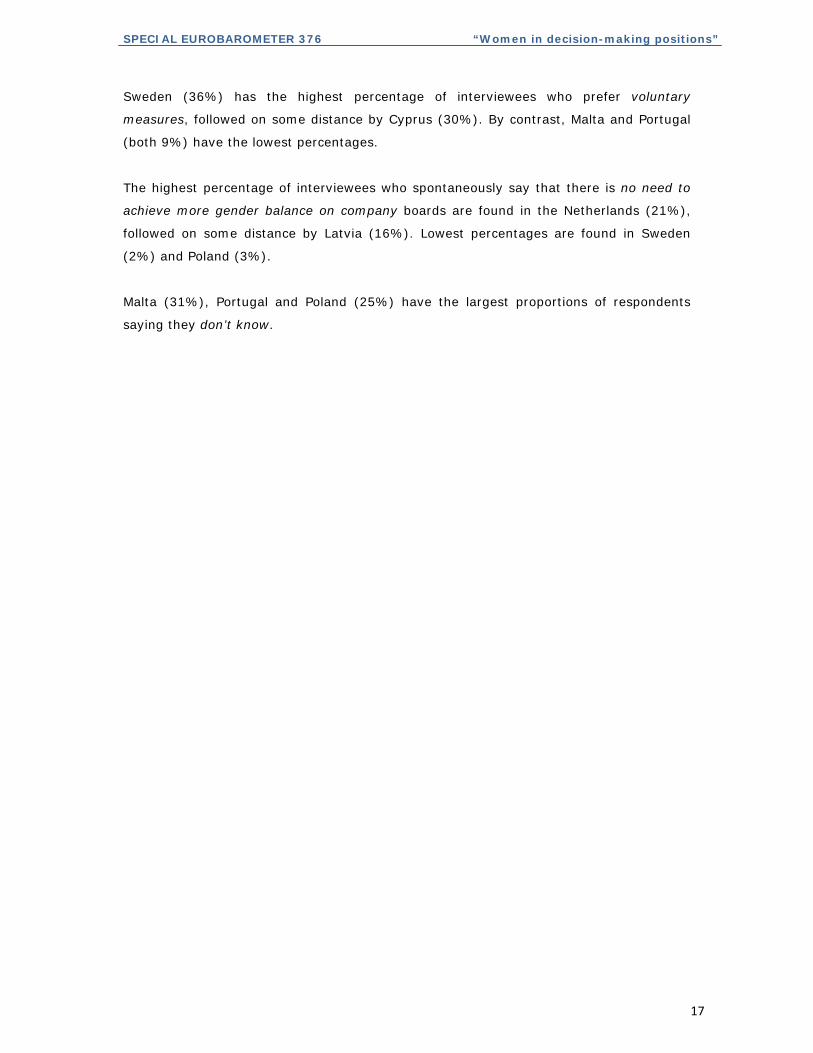
Three-quarters of Europeans are in favour of legislation on gender balance on
company boards.
Three-quarters (75%) of the European interviewees are in favour of such legislation. A
minority (17%) oppose it. A further 8% had no opinion on this topic.
Base: total sample
Country-by-country analysis shows that in every single Member State, there is an
absolute majority in favour of legislation on gender balance on company boards when
qualification is taken into account. Highest percentages of respondents who are in favour
are found in Cyprus (91%), France (86%), Belgium, Portugal, Slovakia (all 84%). Lowest
percentages are in Denmark (52%), Germany (58%) and Sweden (62%).
SPECIAL EUROBAROMETER 376 “Women in decision-making positions”
19
3.3 Decision level for measures to improve gender
balance on company boards
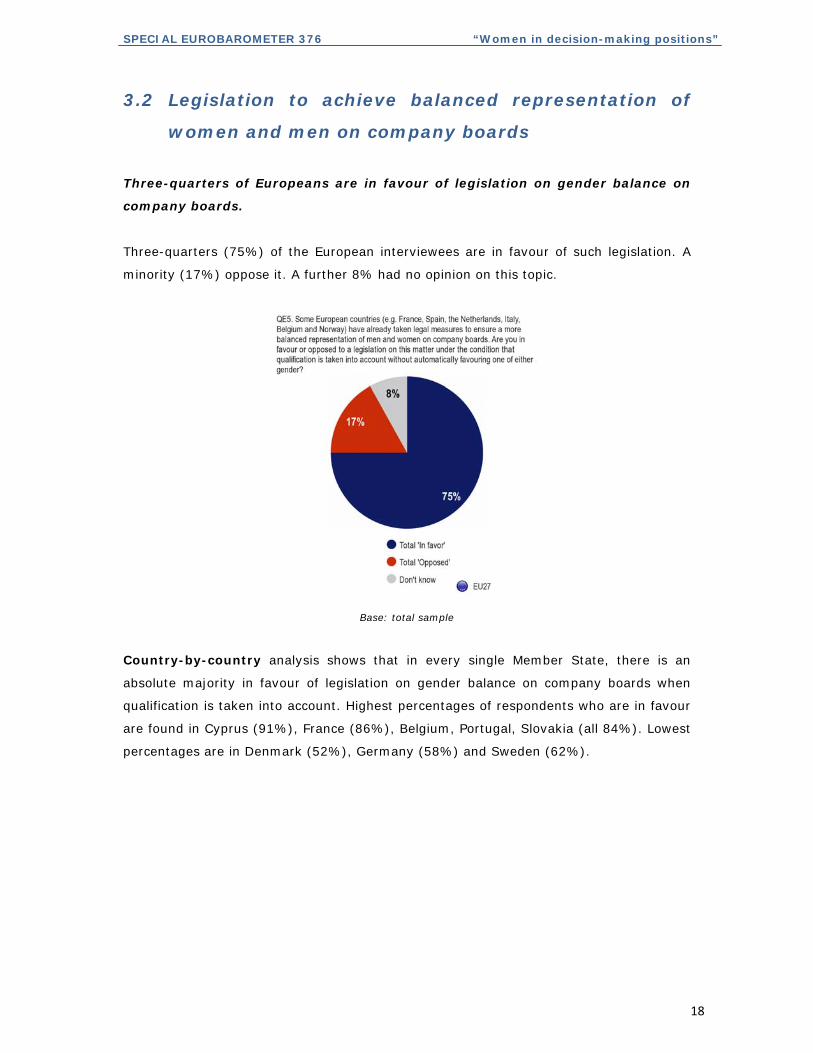
Europeans are divided on the level of decision-making with regards to measures
taken, with a slight preference for the European level rather than the national
level (35% vs. 34%).
Over one-third of the Europeans polled say decisions should be made at European level
(35%), whereas another third prefer at national level (34%). Notably, almost a quarter
of the interviewees spontaneously answer that decisions should be made at both levels
(23%). A further 8% could not form an opinion.
Base: Total sample
Country-by-country analysis reveals notable differences. In three countries, over half
of the interviewees are in favour of the European level, with Belgium (63%) standing out
and Luxembourg (55%) and France (53%) following on at some distance. Smallest
percentages in favour of the European level are found in Denmark (17%), Austria (21%)
and the UK (22%).
SPECIAL EUROBAROMETER 376 “Women in decision-making positions”
20
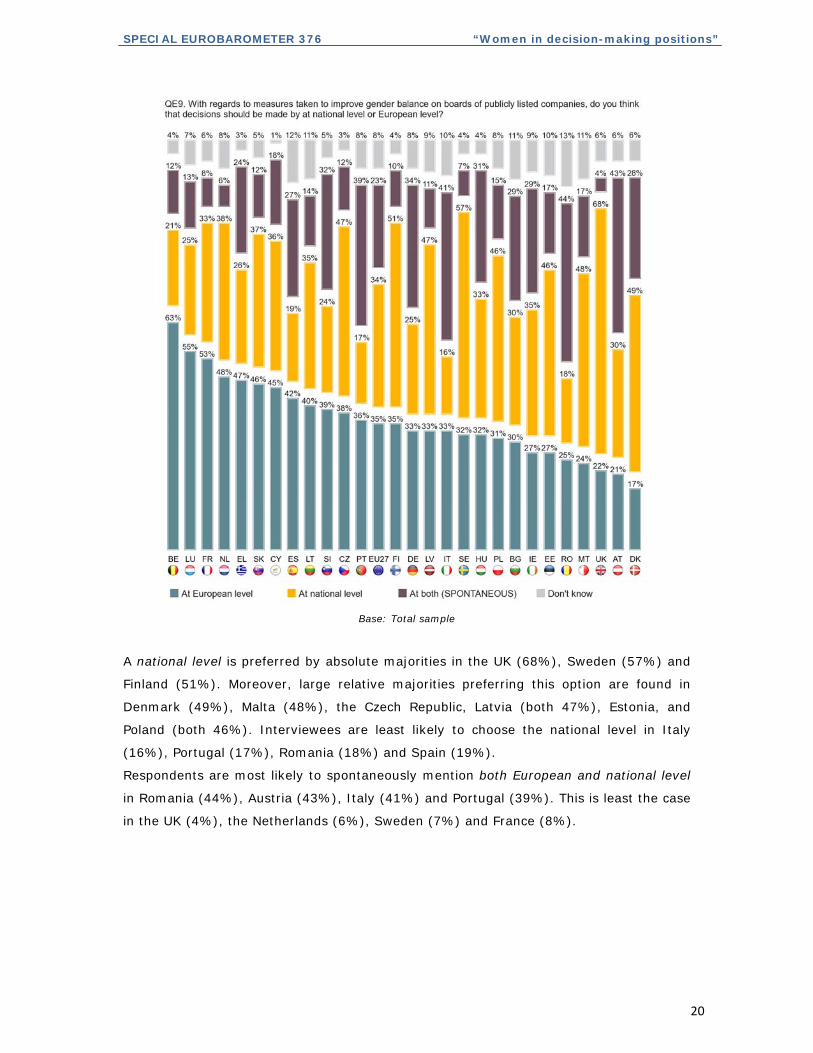
Base: Total sample
A national level is preferred by absolute majorities in the UK (68%), Sweden (57%) and
Finland (51%). Moreover, large relative majorities preferring this option are found in
Denmark (49%), Malta (48%), the Czech Republic, Latvia (both 47%), Estonia, and
Poland (both 46%). Interviewees are least likely to choose the national level in Italy
(16%), Portugal (17%), Romania (18%) and Spain (19%).
Respondents are most likely to spontaneously mention both European and national level
in Romania (44%), Austria (43%), Italy (41%) and Portugal (39%). This is least the case
in the UK (4%), the Netherlands (6%), Sweden (7%) and France (8%).
SPECIAL EUROBAROMETER 376 “Women in decision-making positions”
21
4 LEGISLATION PROVIDING A MORE BALANCED REPRESENTATION OF WOMEN AND MEN ON COMPANY BOARDS
This chapter elaborates further on what such legislation, in their view, should imply.
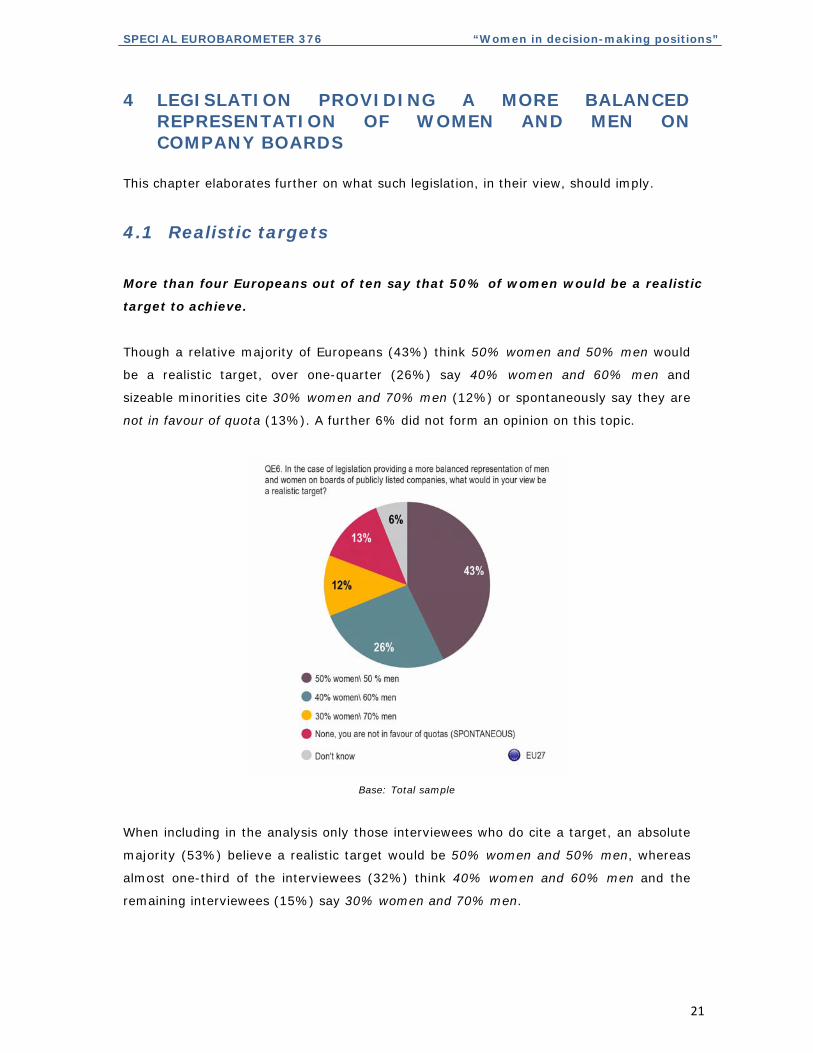
4.1 Realistic targets
More than four Europeans out of ten say that 50% of women would be a realistic
target to achieve.
Though a relative majority of Europeans (43%) think 50% women and 50% men would
be a realistic target, over one-quarter (26%) say 40% women and 60% men and
sizeable minorities cite 30% women and 70% men (12%) or spontaneously say they are
not in favour of quota (13%). A further 6% did not form an opinion on this topic.
Base: Total sample
When including in the analysis only those interviewees who do cite a target, an absolute
majority (53%) believe a realistic target would be 50% women and 50% men, whereas
almost one-third of the interviewees (32%) think 40% women and 60% men and the
remaining interviewees (15%) say 30% women and 70% men.
SPECIAL EUROBAROMETER 376 “Women in decision-making positions”
22
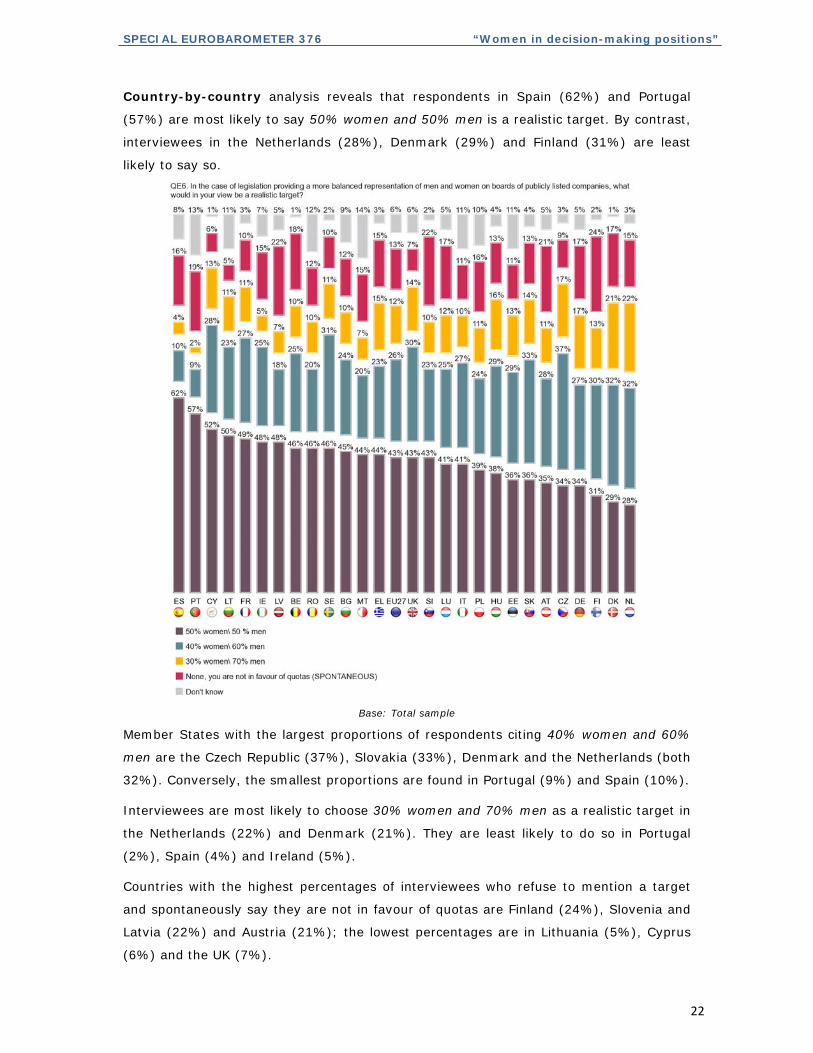
Country-by-country analysis reveals that respondents in Spain (62%) and Portugal
(57%) are most likely to say 50% women and 50% men is a realistic target. By contrast,
interviewees in the Netherlands (28%), Denmark (29%) and Finland (31%) are least
likely to say so.
Base: Total sample
Member States with the largest proportions of respondents citing 40% women and 60%
men are the Czech Republic (37%), Slovakia (33%), Denmark and the Netherlands (both
32%). Conversely, the smallest proportions are found in Portugal (9%) and Spain (10%). Interviewees are most likely to choose 30% women and 70% men as a realistic target in
the Netherlands (22%) and Denmark (21%). They are least likely to do so in Portugal
(2%), Spain (4%) and Ireland (5%). Countries with the highest percentages of interviewees who refuse to mention a target
and spontaneously say they are not in favour of quotas are Finland (24%), Slovenia and
Latvia (22%) and Austria (21%); the lowest percentages are in Lithuania (5%), Cyprus
(6%) and the UK (7%).

SPECIAL EUROBAROMETER 376 “Women in decision-making positions”
23
4.2 Appropriate implementation time
Nearly four Europeans out of ten think that publicly listed companies should be
granted less than 5 years to comply with legislation.
Over one-third (37%) of respondents think this should be less than 5 years, while 26%
say between 5 and 8 years, and 9% think 8 years or more. A further 12% spontaneously
say that companies should not be obliged to comply with quota legislation regarding their
board members. Interestingly, a sizeable minority of 16% could not form an opinion.
Base: total sample
A second analysis that included only those interviewees who chose one of the time period
options yielded the following results: over half of those respondents (52%) say
companies should be granted less than 5 years, while over one-third (36%) think
between 5 and 8 years, and one in eight (12%) say 8 years or more.
When analysing the total number of respondents, almost one-quarter of the respondents
in the NMS12 (24%) have no opinion on this matter compared to 14% in the EU15.
SPECIAL EUROBAROMETER 376 “Women in decision-making positions”
24
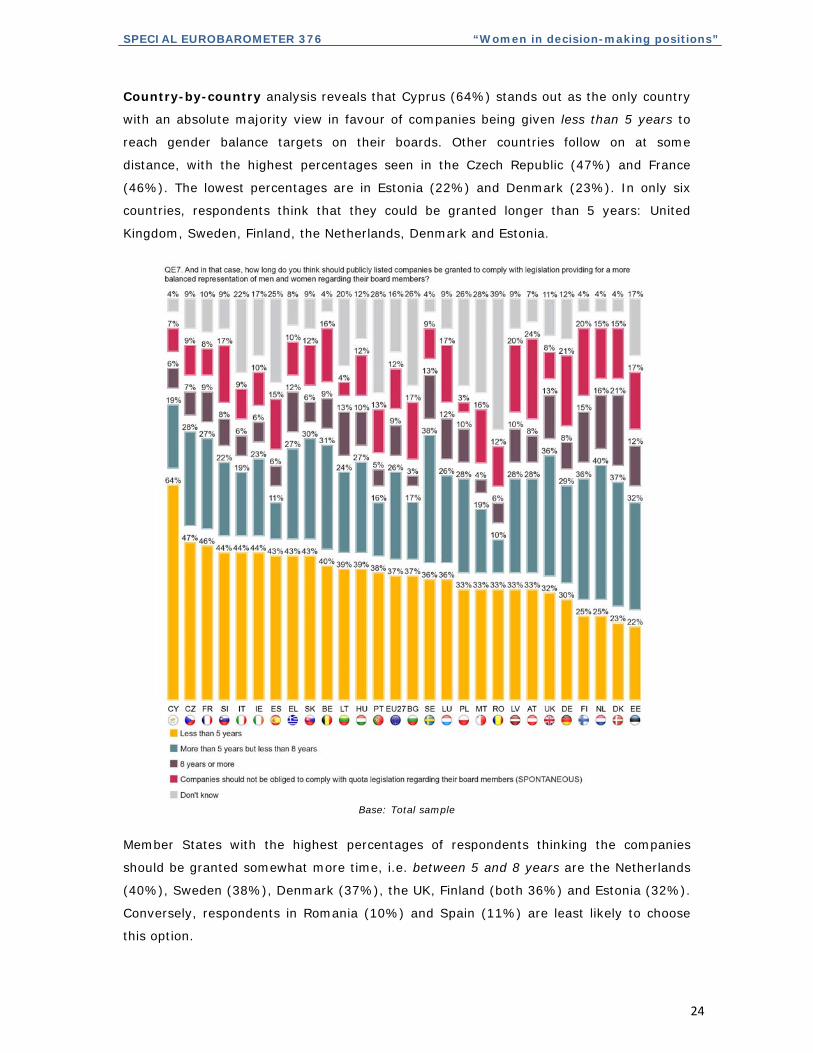
Country-by-country analysis reveals that Cyprus (64%) stands out as the only country
with an absolute majority view in favour of companies being given less than 5 years to
reach gender balance targets on their boards. Other countries follow on at some
distance, with the highest percentages seen in the Czech Republic (47%) and France
(46%). The lowest percentages are in Estonia (22%) and Denmark (23%). In only six
countries, respondents think that they could be granted longer than 5 years: United
Kingdom, Sweden, Finland, the Netherlands, Denmark and Estonia.
Base: Total sample
Member States with the highest percentages of respondents thinking the companies
should be granted somewhat more time, i.e. between 5 and 8 years are the Netherlands
(40%), Sweden (38%), Denmark (37%), the UK, Finland (both 36%) and Estonia (32%).
Conversely, respondents in Romania (10%) and Spain (11%) are least likely to choose
this option.
SPECIAL EUROBAROMETER 376 “Women in decision-making positions”
25
Though relatively smaller proportions of interviewees say 8 years or more, Denmark
(21%) stands out, followed on at some distance by the Netherlands (16%) and Finland
(15%). This option is least likely to be chosen in Bulgaria (3%) and Malta (4%).
Member States with the largest proportions of interviewees who spontaneously say that
companies should not be obliged to comply with quota legislation regarding their board
members are Austria (24%), Germany (21%), Finland and Latvia (both 20%). The
smallest proportions are observed in Poland (3%) and Lithuania (4%).
4.3 Appropriate sanctions in case of non-compliance
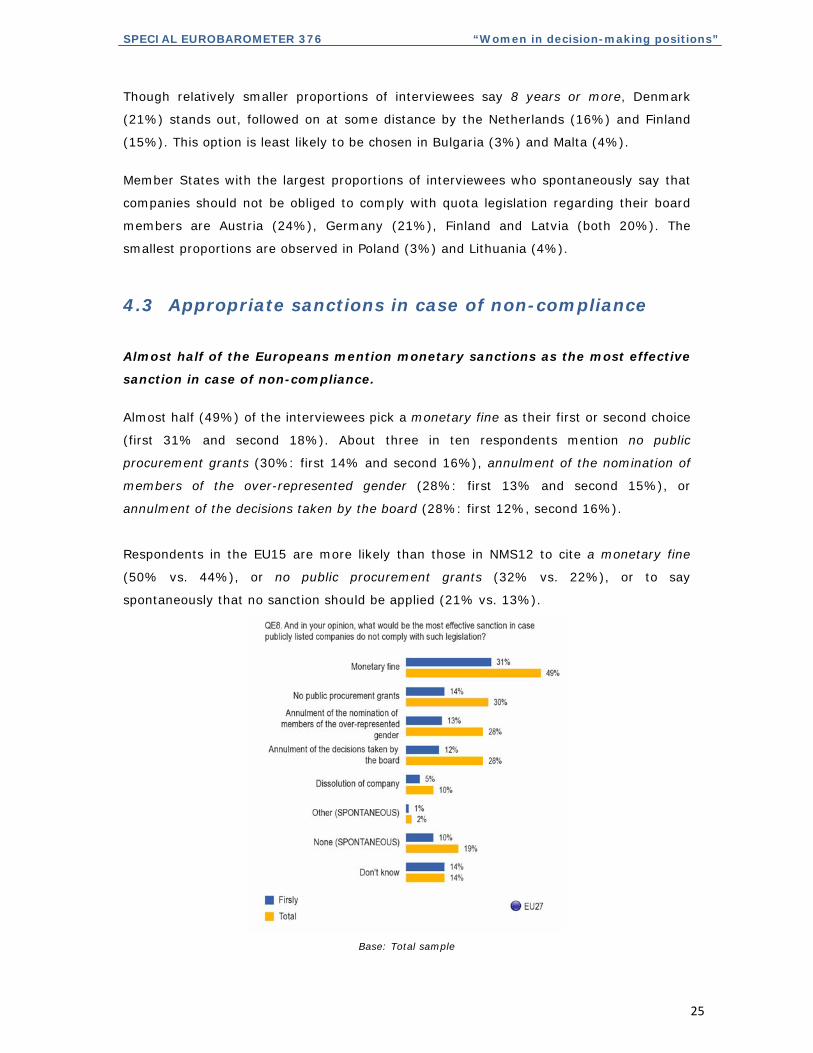
Almost half of the Europeans mention monetary sanctions as the most effective
sanction in case of non-compliance.
Almost half (49%) of the interviewees pick a monetary fine as their first or second choice
(first 31% and second 18%). About three in ten respondents mention no public
procurement grants (30%: first 14% and second 16%), annulment of the nomination of
members of the over-represented gender (28%: first 13% and second 15%), or
annulment of the decisions taken by the board (28%: first 12%, second 16%).
Respondents in the EU15 are more likely than those in NMS12 to cite a monetary fine
(50% vs. 44%), or no public procurement grants (32% vs. 22%), or to say
spontaneously that no sanction should be applied (21% vs. 13%).
Base: Total sample
SPECIAL EUROBAROMETER 376 “Women in decision-making positions”
26
Country-by-country analysis shows that a monetary fine is the sanction cited most
frequently in every single Member State. The highest percentages are in Cyprus (62%)
and Ireland (61%); conversely, the smallest proportions are in Denmark (35%),
Romania (36%), Estonia (37%) and Malta (38%). Respondents in Austria (44%),
Germany (42%) and Ireland (40%) are most likely to cite no public procurement grants;
on the other hand, those in Romania (11%) and Malta (16%) are least likely to do so.
Countries with the largest proportions of respondents citing Annulment of the nomination
of members of the over-represented gender are Greece (45%), Belgium and Italy (both
39%). Again, this is least the case in Malta (13%). Annulment of the decisions taken by
the board is mentioned most often in Greece, Italy and Cyprus (all 39%); and least often
in Spain (17%).
Dissolution of company is cited most often in Italy (19%) and least often in the
Netherlands (4%). Member States with the highest percentages of respondents who
spontaneously say that there should be no sanctions are Denmark (41%), the
Netherlands (39%), Sweden (35%) and Luxembourg (33%). The lowest percentages are
found in Ireland (6%) and Italy (7%).

TECHNICAL SPECIFICATIONS

SPECIAL EUROBAROMETER 376 “Women in decision-making positions”
SPECIAL EUROBAROMETER 376 “Women in decision-making positions”
TECHNICAL SPECIFICATIONS Between the 3rd and the 18th of September 2011, TNS Opinion & Social, a consortium created between TNS plc and TNS opinion, carried out the wave 76.1 of the EUROBAROMETER, on request of the EUROPEAN COMMISSION, Directorate-General for Communication, “Research and Speechwriting”. The SPECIAL EUROBAROMETER 376 is part of wave 76.1 and covers the population of the respective nationalities of the European Union Member States, resident in each of the Member States and aged 15 years and over. The basic sample design applied in all states is a multi-stage, random (probability) one. In each country, a number of sampling points was drawn with probability proportional to population size (for a total coverage of the country) and to population density.
In order to do so, the sampling points were drawn systematically from each of the "administrative regional units", after stratification by individual unit and type of area. They thus represent the whole territory of the countries surveyed according to the EUROSTAT NUTS II (or equivalent) and according to the distribution of the resident population of the respective nationalities in terms of metropolitan, urban and rural areas. In each of the selected sampling points, a starting address was drawn, at random. Further addresses (every Nth address) were selected by standard "random route" procedures, from the initial address. In each household, the respondent was drawn, at random (following the "closest birthday rule"). All interviews were conducted face-to-face in people's homes and in the appropriate national language. As far as the data capture is concerned, CAPI (Computer Assisted Personal Interview) was used in those countries where this technique was available.
1
SPECIAL EUROBAROMETER 376 “Women in decision-making positions”
For each country a comparison between the sample and the universe was carried out. The Universe description was derived from Eurostat population data or from national statistics offices. For all countries surveyed, a national weighting procedure, using marginal and intercellular weighting, was carried out based on this Universe description. In all countries, gender, age, region and size of locality were introduced in the iteration procedure. For international weighting (i.e. EU averages), TNS Opinion & Social applies the official population figures as provided by EUROSTAT or national statistic offices. The total population figures for input in this post-weighting procedure are listed above. Readers are reminded that survey results are estimations, the accuracy of which, everything being equal, rests upon the sample size and upon the observed percentage. With samples of about 1,000 interviews, the real percentages vary within the following confidence limits:
Observed percentages 10% or 90% 20% or 80% 30% or 70% 40% or 60% 50%
Confidence limits ± 1.9 points ± 2.5 points ± 2.7 points ± 3.0 points ± 3.1 points
ABBR. COUNTRIES INSTITUTES N° INTERVIEWS
FIELDWORK DATES
POPULATION 15+
BE Belgium TNS Dimarso 1028 03/09/2011 18/09/2011 8.939.546 BG Bulgaria TNS BBSS 1006 03/09/2011 12/09/2011 6.537.510 CZ Czech Rep. TNS Aisa 1069 03/09/2011 14/09/2011 9.012.443 DK Denmark TNS Gallup DK 1002 03/09/2011 18/09/2011 4.561.264 DE Germany TNS Infratest 1582 03/09/2011 18/09/2011 64.409.146 EE Estonia Emor 1000 03/09/2011 18/09/2011 945.733 IE Ireland Ipsos MRBI 1015 03/09/2011 16/09/2011 3.522.000 EL Greece TNS ICAP 1000 03/09/2011 16/09/2011 8.693.566 ES Spain TNS Demoscopia 1004 03/09/2011 18/09/2011 39.035.867 FR France TNS Sofres 1046 03/09/2011 18/09/2011 47.756.439 IT Italy TNS Infratest 1043 03/09/2011 17/09/2011 51.862.391 CY Rep. of Cyprus Synovate 506 03/09/2011 18/09/2011 660.400 LV Latvia TNS Latvia 1014 03/09/2011 18/09/2011 1.447.866 LT Lithuania TNS Gallup Lithuania 1031 03/09/2011 18/09/2011 2.829.740 LU Luxembourg TNS ILReS 502 03/09/2011 17/09/2011 404.907 HU Hungary TNS Hoffmann Kft 1015 03/09/2011 18/09/2011 8.320.614 MT Malta MISCO 500 03/09/2011 18/09/2011 335.476 NL Netherlands TNS NIPO 1002 03/09/2011 17/09/2011 13.371.980
AT Austria Österreichisches Gallup-Institut 1018
03/09/2011 18/09/2011 7.009.827
PL Poland TNS OBOP 1000 03/09/2011 18/09/2011 32.413.735 PT Portugal TNS EUROTESTE 1035 03/09/2011 18/09/2011 8.080.915 RO Romania TNS CSOP 1050 03/09/2011 12/09/2011 18.246.731 SI Slovenia RM PLUS 1024 03/09/2011 17/09/2011 1.759.701 SK Slovakia TNS Slovakia 1013 03/09/2011 18/09/2011 4.549.955 FI Finland TNS Gallup Oy 1003 03/09/2011 18/09/2011 4.440.004 SE Sweden TNS GALLUP 1020 03/09/2011 18/09/2011 7.791.240 UK United Kingdom TNS UK 1328 03/09/2011 18/09/2011 51.848.010
TOTAL EU27
26.856 03/09/2011 18/09/2011 408.787.006
2