Embed Size (px)
Citation preview
Kehinde et al. Agric & Food Secur (2021) 10:25 https://doi.org/10.1186/s40066-021-00297-7
RESEARCH
Women empowerment, Land Tenure and Property Rights, and household food security among smallholders in NigeriaMojisola Olanike Kehinde1* , Adebayo Musediku Shittu2, Abigail Gbemisola Adeyonu1 and Maria Gbemisola Ogunnaike2
Abstract
Background: Empowering women, land tilting to enhance the security of Land Tenure and Property Rights (LTPRs) in agriculture vis-a-vis food and nutrition security are crucial in the pursuit of the Sustainable Development Goals. The main goal of this paper is to examine the crucial roles of women’s empowerment and LTPRs as they affect household food security among smallholder farmers in Nigeria.
Methodology: Cross-sectional data were obtained from 1152 maize and rice farmers, selected by multistage ran-dom sampling across 192 communities, 16 States and the six geopolitical zones in Nigeria. The data were collected on households’ socio-economics, food security situations, empowerment and LTPRs on parcels cultivated during the 2016/17 farming season by interviewing the adult members of the farmers’ households. HFS was assessed using the United States Department of Agriculture’ HFS Survey Module and Food and Agriculture Organization guidelines for measuring Household Dietary Diversity Score. LTPRs were measured in terms of tenure type and title registration to farmlands. HFS modelling was within the framework of Poisson, Instrumental Variable Poisson (IVP) and Zero-inflated Poisson (ZIP) regression methods, with endogeneity concerns and choice of specification addressed within Hausman specification tests.
Results: The results of the study show that households that have a share of farmland on purchase and also partici-pate in off-farm activities are likely to be certainly food-secure in all regards. Crop diversity, households that cultivate maize only, the share of farmland on purchase and access to extension contact significantly reduce the severity of food insecurity while an increase in farm size increases the severity of food insecurity. Similarly, IV Poisson and ZIP Count results show that increase in the farm size results in the severity of food insecurity. The evidence with respect to women’s empowerment reveals that gender parity and female achievement in group membership, income control, as well as workload; reduce the extent of food insecurity among the farming households in Nigeria. We, however, discover that the female achievement in the productive decision and credit increases the severity of food insecurity among the smallholder farmers. The analyses also reveal that education of the household head, female achievement in the asset; group membership and workload are the major factors that positively influenced household dietary diversity.
© The Author(s) 2021. This article is licensed under a Creative Commons Attribution 4.0 International License, which permits use, sharing, adaptation, distribution and reproduction in any medium or format, as long as you give appropriate credit to the original author(s) and the source, provide a link to the Creative Commons licence, and indicate if changes were made. The images or other third party material in this article are included in the article’s Creative Commons licence, unless indicated otherwise in a credit line to the material. If material is not included in the article’s Creative Commons licence and your intended use is not permitted by statutory regulation or exceeds the permitted use, you will need to obtain permission directly from the copyright holder. To view a copy of this licence, visit http:// creat iveco mmons. org/ licen ses/ by/4. 0/. The Creative Commons Public Domain Dedication waiver (http:// creat iveco mmons. org/ publi cdoma in/ zero/1. 0/) applies to the data made available in this article, unless otherwise stated in a credit line to the data.
Open Access
Agriculture & Food Security
*Correspondence: [email protected] Department of Agriculture, Landmark University, Kwara State, Omu Aran, NigeriaFull list of author information is available at the end of the article
Page 2 of 22Kehinde et al. Agric & Food Secur (2021) 10:25
BackgroundEmpowering women, land tilting to enhance the security of Land Tenure and Property Rights (LTPRs) in agricul-ture vis-a-vis food and nutrition security are crucial in the pursuit of the Sustainable Development Goals (SDGs) 2 and 5 which are to be achieved by the year 2030. These SDGs emphasized the need to end hunger, achieve food security, improve nutrition and promote sustainable agriculture as well as to achieve gender equality, and empower all women and girls. Women’s empowerment includes equal access to and control over household income and productive resources, reduced time con-straints, and joint decision-making with respect to labour and household expenditures [7, 13].
LTPRs have to do with the rights that individuals, com-munities, families, firms and other community struc-tures hold in land and associated natural resources. As noted by Feder and Feeny [25], the rights on the land are either de facto or de jure secure if they are clearly defined, exclusive, enforceable, transferable, and also recognized by relevant authorities. In Nigeria, the law made provi-sion for granting two types of land use rights—customary and statutory rights of occupancy—to all categories of land users [35]. Customary right of occupancy is granted under the Act by the local government councils to indi-viduals, firms, and communities while the Statutory right of occupancy is the right to use land in any part of the state and it is granted under the Act by the State Gov-ernor. A certificate of occupancy is issued to a land user as evidence of being granted statutory right of occupancy on the land by the State Governor, thus making the certif-icate of occupancy the highest form of land title in Nige-ria. Issuance of certificate of occupancy requires that the landowner possesses a purchase receipt, duly stamped deed of transfer, and an approved boundary survey of the land. The customary rights of occupancy are governed by the largely unwritten customary laws in various localities and are also considered de facto held by holders of agri-cultural lands in rural areas that have been under use for agricultural purposes prior to the enactment of the Land Use Act of 1979 [35, 52].
The underlying principle behind the consideration of women’s empowerment in agriculture as a determinant factor of household food security is in its essentiality
to achieve food security and reducing hunger as well as improve household agricultural productivity [23, 36]. Women’s empowerment and secure LTPRs can be linked to household food security in multiple pathways. First, they can directly contribute to the agricultural produc-tion of the smallholders. Second, agricultural productiv-ity gain can improve farm income, and income gain can, in turn, result in physical and economic access to food which eventually improves the food and nutrition secu-rity of the farmers.
Access to land, the security of tenure and women’s empowerment are the main means through which food security can be realized in Africa, Nigeria inclusive [8, 29, 56]. Hence, they remain at the centre of agricultural research and outreach practices in developing countries because they have a direct impact on agricultural pro-ductivity and household food security. A large propor-tion of the smallholders, particularly female farmers, however, lack adequate access to quality land, and when they do have access, they have limited rights to it [4, 48] as they might be able to cultivate the land but not being able to use it as collateral, rent it, sell it, or hold the land for a long enough period to recoup labour and capital investments.
Women produce over 50 percent of the world’s food [23, 26] and comprise about 43% of the agricultural labor force in addition to their traditional domestic responsi-bilities, both globally and in developing countries [14]. This agrees with the findings of Palacios-Lopez et al. [45] who found the share of female labour to be a little above 50% in Malawi, Tanzania and Uganda and significantly lower in Nigeria (37%). Though women earn and pro-duce much less than men, they still invest as much as ten times more of their earnings than men do in their family’s well-being, in areas including child health, education, and nutrition [18]. While there is a paucity of data and statistics on women’s share of food production in Nigeria as of date, Akingbule [5] estimated that women produced about 80% of food in Africa despite their inadequate access to productive resources.
Considering women’s important role in the agricultural sector, empirical evidence shows that there is a gender gap with respect to access to productive resources, such as land and livestock, labour markets, financial capital,
Conclusion: The study suggests the adoption of climate-smart practices to overcome the issue of marginal farm-lands, promotion of crop and livelihood diversification among the smallholder farmers, effective extension services delivery, and improving women’s access to productive resources to enhance household food security status in Nigeria.
Keywords: Women’s empowerment, Land Tenure and Property Rights, Household food security, Smallholders, Nigeria
Page 3 of 22Kehinde et al. Agric & Food Secur (2021) 10:25
education, technology, and advisory services, as against their men counterparts [2, 16, 32, 63]. Women are gener-ally prone to landholding inequality and tenure insecurity in sub-Saharan Africa [24, 43]. Existing research suggests that cultural norms and values restrict women’s ability to inherit the land [37], therefore, making women farmers be more vulnerable to climate impacts than men because they greatly depend on natural resources for livelihoods and food security [46, 60]. It is important to note that the gender gap negatively affects women’s productivity as well as their contribution to the agricultural sector and the achievement of bigger economic and social develop-ment goals [23].
Several empirical studies have found that redistribut-ing inputs between men and women in the household has the potential to increase productivity [34, 47]. In Bang-ladesh, women’s empowerment was found to increase per adult-equivalent calorie availability and dietary diversity [55]. In the same vein, Doss [15] confirms that in Ghana, women’s share of assets with respect to farm-land increased significantly the food expenditure budget. Duflo and Udry [19] and Hoddinott and Haddad [31], on the other hand, found that in Côte d’Ivoire, the more the women’s share of cash income increased significantly the share of household budget allocated to food.
Arising from the foregoing, using smallholder maize and rice farmers in Nigeria as a case study, this paper examined the effects of women’s empowerment in agri-culture and LTPRs on household food security (HFS). We measure the HFS using the United States Department of Agriculture’s (USDA’s)—18 questions HFS modules (Table 10) as well as the Food and Agriculture Organiza-tion of the United Nations (FAO) guidelines for measur-ing Household Dietary Diversity Score (HDDS).
The paper contributes to the ongoing debates on wom-en’s empowerment, LTPRs and HFS in Africa’s small-holder agriculture in a number of ways. First, it updates empirical evidence on the forms of LTPRs that operate for agricultural lands in Nigeria. Second, it measures women empowerment using the abbreviated version of the Women’s Empowerment in Agriculture Index (WEAI) [9]. Third, it provides empirical evidence on the effect of gender parity and the achievement in each of the five domains of empowerment on HFS will be among the smallholders in Nigeria. Fourth, it provides empirical evidence on how empowering women, tenure types and titling as well as other control variables, affect HFS among smallholder maize and rice farmers in Nige-ria. The analyses were within the framework of Poisson, Instrumental Variable Poisson (IVP) and Zero-inflated Poisson (ZIP) regression methods, with endogeneity concerns as well as the choice of specification addressed within the framework of Hausman [30] specification test.
The approach supported the provision of answers to five pertinent research questions, including:
1. Which of the hypothesized determinants are most likely to guarantee that a farm household will achieve a household food security score of zero?
2. Which of the hypothesized determinants contrib-utes to the severity of food insecurity among house-holds of the maize and rice farmers?
3. To what extent do the significant variables contrib-ute to the severity of food insecurity among house-holds of the maize and rice farmers?
4. Which one of LTPRs, gender parity and the achieve-ment in each of the five domains of empowerment influence the household dietary diversity score of the maize and rice smallholders in Nigeria? and
5. To what extent do LTPRs, gender parity and the achievement in each of the five domains of empower-ment influence the household dietary diversity score of the maize and rice smallholders in Nigeria?
Even though some empirical studies focused their attention on the effect of women’s empowerment on food security and nutrition outcomes, such as body mass index, stunting, underweight and wasting [6, 51, 53, 54], it was generally found that women’s empower-ment has the potential to improve both outcomes. So far, only three of those empirical studies [4, 13, 56] used the Abbreviated WEAI to measure women’s empowerment and thereafter determine the effects of women’s empow-erment on food security and agricultural productivity. It is pertinent, however, to note that all the above-men-tioned empirical studies were done outside Nigeria. The only exception is Tanankem et al. [58] who used modified Alkire et al. [9] to assess women empowerment in their work titled “women empowerment and intra-house-hold dietary diversity in Nigeria”. This study, therefore, attempts to fill these identified gaps.
The next section provides the literature review on HFS in Nigeria. The third section presents the research methodology, including the method of data analysis and analytical methods. The fourth presents results and dis-cussion, while the final section presents the conclusions and policy implications.
Literature review on household food security in NigeriaFood security in terms of physical and economic access to sufficient food to meet dietary needs has been a seri-ous problem in Africa, Nigeria inclusive. Evidence from recent studies that were carried out on dietary diversity in Nigeria [11, 40, 58] used the Living Standards Meas-urement Study—Integrated Surveys on Agriculture
Page 4 of 22Kehinde et al. Agric & Food Secur (2021) 10:25
(LSMS-ISA) 2003/2004, 2010/2011, 2012/2013, and 2015/2016 dataset of the World Bank. These studies emphasized the extent of food consumption diversity and the factors influencing demand for diverse foods, house-hold dietary diversity among low-income urban house-holds, the relationship between production diversity and dietary diversity and the linkages between empowerment and the dietary diversity of households. The household dietary diversity was measured using the count of 12 food groups based on the 7-day recall household food con-sumption data in the LSMS-ISA survey.
Obayelu and Osho [40] employed the Simpson index to determine how diversified the diet of low-income urban households in Nigeria is. Simpson’s value varies from zero to one, the higher the Simpson value, and the greater the variety. The index was later classified into low and very low dietary diversity. Ayenew et al. [11] used unbal-anced panel data to analyse the relationship between production diversity and dietary diversity in Nigeria. Information on the household dietary diversity was col-lected twice—at the post-harvest and post-planting—and this makes it possible to evaluate the seasonality of dietary diversity of the household. Obayelu et al. [41], on the other hand, grouped the various food consumed by the households into 12 categories which were later coded and summed into HDDS. They categorized the HDDS which ranged 0–12 food groups into low (≤ 6) and high (6–12) dietary diversity. Households with high HDDS are classified as food-secure while those with low HDDS are classified as food insecure.
Evidence from Onyeji and Sanusi [44] assessed the nutritional status of the reproductive age women with the use of anthropometric indices, weight, and height to estimate the Body Mass Index (BMI), and they eventually checked if there was a correlation between the individual dietary diversity score (IDDS) and BMI of the respond-ents. Thus far, Tanankem et al. [58] seem to be the only study that investigated the relationship between women’s empowerment and the dietary diversity of households in Nigeria using LSMS-ISA data. They measured women empowerment using modified Alkire et al. [9] measure of Women Empowerment in Agriculture Index. WEAI assesses empowerment based on five domains—deci-sions about agricultural production, access to and control over productive resources; control of the use of income; leadership in the community; and time allocation while they constructed modified WEAI using another five domains which are: access to and control over productive resources, leadership in the community, education, infor-mation and connection, as well as insurance.
Most previous household dietary diversity studies in Nigeria modelled HDDS within the framework of pro-bit, instrumental variable (IV) probit, non-parametric
regressions that are based on the local polynomial regres-sion approach, traditional least square regression, ran-dom and fixed-effect model. Empirical evidence shows that most of these studies did not test for endogeneity with the exemption of Obayelu et al. [41] who corrected for endogeneity between human capital and food insecu-rity status among households in rural Nigeria within the framework of Instrumental Variable (IV) probit. They, however, found that there was no bi-causality between human capital and food insecurity. Tanankem et al. [58] also identified that the empowerment variable is likely to be prone to endogeneity. Hence, they applied the stand-ard instrumental variable technique to correct for possi-ble endogeneity bias and used the age difference between the primary male and female decision-makers as well as the type of building in which the household currently resides as the instruments.
Ayenew et al. [11] found that in the post-harvest sea-son, an increase in farm production diversification is associated with an increase in dietary diversity. However, production diversification does not have a significant contribution to dietary diversity in the post-planting sea-son. Tanankem et al. [58] found that increases in women’s empowerment are positively associated with household dietary diversity. Evidence from Ogundari [42] showed that the probability of a household falling into any of the food insecurity categories as against being food-secure decreases significantly and consistently with income, household size, whether households consumed only purchased food, and the geographical region of the household. This probability, however, increased if the household consumed only home-produced food. Die-tary diversity was also found to increase with household income and household size, whether the household head was a farmer, whether households consumed only pur-chased food, and whether households resided in the rural areas. He, however, found that educated household heads and those consuming only home-produced food con-sumed a less diverse diet.
In conclusion, there is a paucity of empirical studies on how women empowerment and LTPRs contribute to HFS in Nigeria. Though, there are several empirical studies done outside Nigeria where WEAI was used to examine the impact of women’s empowerment on food and nutri-tion-related outcomes. These among others are the gaps this study seeks to fill.
Research methodologyDescription of the study areaThe study was conducted in selected farming commu-nities reputed for maize and rice production across the six geopolitical zones, and covering five of the seven Agro-ecological zones (AEZs) of Nigeria Fig. 1. Nigeria is
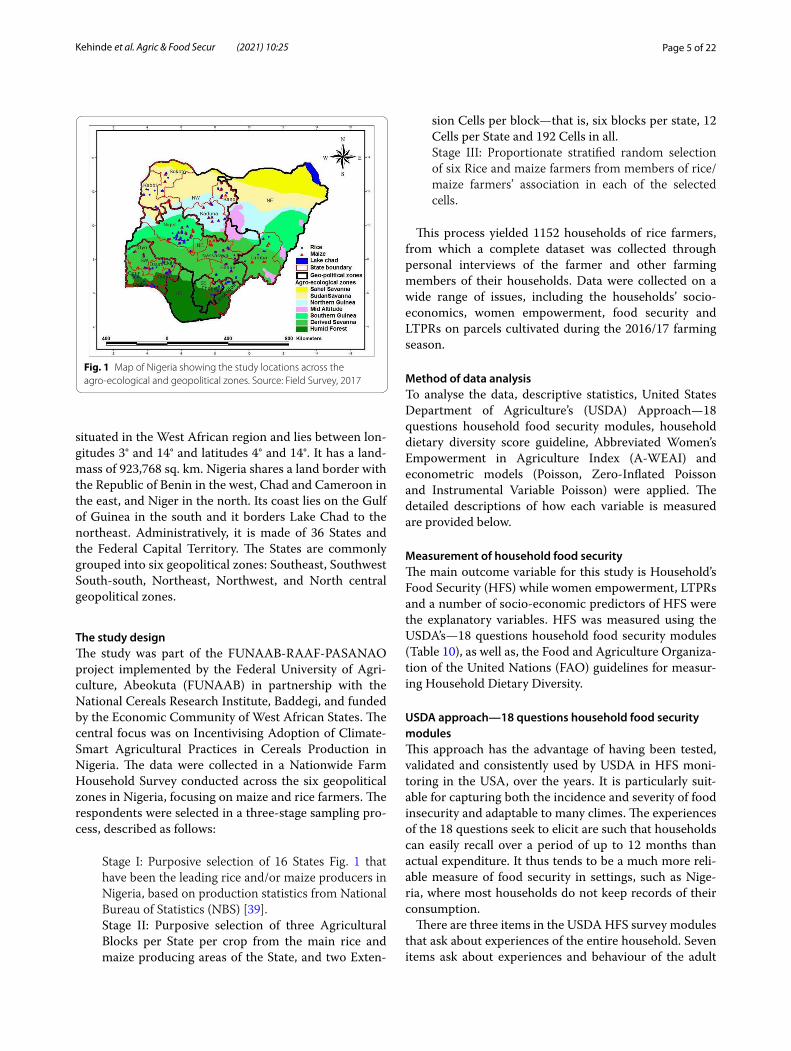
Page 5 of 22Kehinde et al. Agric & Food Secur (2021) 10:25
situated in the West African region and lies between lon-gitudes 3° and 14° and latitudes 4° and 14°. It has a land-mass of 923,768 sq. km. Nigeria shares a land border with the Republic of Benin in the west, Chad and Cameroon in the east, and Niger in the north. Its coast lies on the Gulf of Guinea in the south and it borders Lake Chad to the northeast. Administratively, it is made of 36 States and the Federal Capital Territory. The States are commonly grouped into six geopolitical zones: Southeast, Southwest South-south, Northeast, Northwest, and North central geopolitical zones.
The study designThe study was part of the FUNAAB-RAAF-PASANAO project implemented by the Federal University of Agri-culture, Abeokuta (FUNAAB) in partnership with the National Cereals Research Institute, Baddegi, and funded by the Economic Community of West African States. The central focus was on Incentivising Adoption of Climate-Smart Agricultural Practices in Cereals Production in Nigeria. The data were collected in a Nationwide Farm Household Survey conducted across the six geopolitical zones in Nigeria, focusing on maize and rice farmers. The respondents were selected in a three-stage sampling pro-cess, described as follows:
Stage I: Purposive selection of 16 States Fig. 1 that have been the leading rice and/or maize producers in Nigeria, based on production statistics from National Bureau of Statistics (NBS) [39].Stage II: Purposive selection of three Agricultural Blocks per State per crop from the main rice and maize producing areas of the State, and two Exten-
sion Cells per block—that is, six blocks per state, 12 Cells per State and 192 Cells in all.Stage III: Proportionate stratified random selection of six Rice and maize farmers from members of rice/maize farmers’ association in each of the selected cells.
This process yielded 1152 households of rice farmers, from which a complete dataset was collected through personal interviews of the farmer and other farming members of their households. Data were collected on a wide range of issues, including the households’ socio-economics, women empowerment, food security and LTPRs on parcels cultivated during the 2016/17 farming season.
Method of data analysisTo analyse the data, descriptive statistics, United States Department of Agriculture’s (USDA) Approach—18 questions household food security modules, household dietary diversity score guideline, Abbreviated Women’s Empowerment in Agriculture Index (A-WEAI) and econometric models (Poisson, Zero-Inflated Poisson and Instrumental Variable Poisson) were applied. The detailed descriptions of how each variable is measured are provided below.
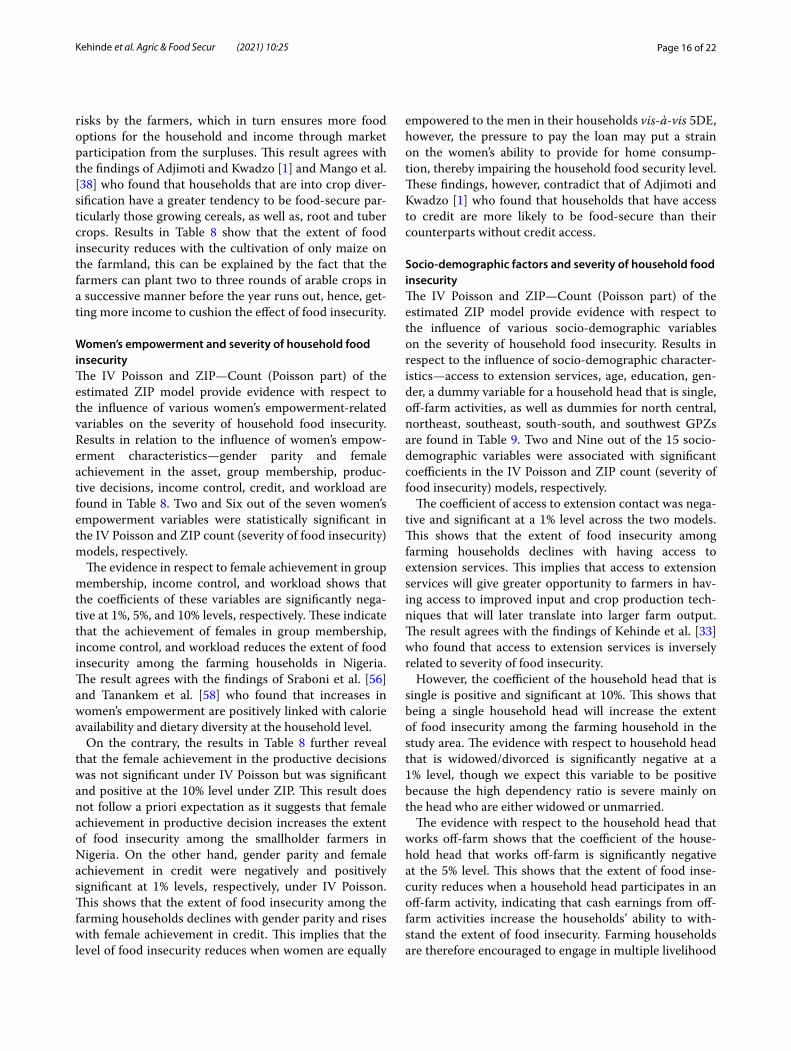
Measurement of household food securityThe main outcome variable for this study is Household’s Food Security (HFS) while women empowerment, LTPRs and a number of socio-economic predictors of HFS were the explanatory variables. HFS was measured using the USDA’s—18 questions household food security modules (Table 10), as well as, the Food and Agriculture Organiza-tion of the United Nations (FAO) guidelines for measur-ing Household Dietary Diversity.
USDA approach—18 questions household food security modulesThis approach has the advantage of having been tested, validated and consistently used by USDA in HFS moni-toring in the USA, over the years. It is particularly suit-able for capturing both the incidence and severity of food insecurity and adaptable to many climes. The experiences of the 18 questions seek to elicit are such that households can easily recall over a period of up to 12 months than actual expenditure. It thus tends to be a much more reli-able measure of food security in settings, such as Nige-ria, where most households do not keep records of their consumption.
There are three items in the USDA HFS survey modules that ask about experiences of the entire household. Seven items ask about experiences and behaviour of the adult
Fig. 1 Map of Nigeria showing the study locations across the agro-ecological and geopolitical zones. Source: Field Survey, 2017
Page 6 of 22Kehinde et al. Agric & Food Secur (2021) 10:25
members of the household, and eight items ask about experiences and conditions of the children in the house-hold. An affirmative response to each of these questions is score one (1) while households that did not experience each of the food insecurity situations are scored zero (0). The scores are summed up across all questions to deter-mine HFS Scores of a household. This could add up to a maximum of 18 for households with at least a child and maximum of 10 for households without children. Table 11 shows how households may be categorised into four mutually exclusive HFS categories based on the HFS Scores, following USDA [59]. The categories include high food security, marginal food security, low food security, and very low food security.
Household dietary diversity score guidelineThe Household Dietary Diversity Score is a guideline developed by the Food and Agriculture Organization of the United Nations and it captures the quantity and, to an extent, quality of household food consumption [22, 57]. HDDS is meant to provide in summary the degree of household economic access to consume a wide range of foods. According to FAO guideline, the dietary diver-sity scores were created by counting the food groups consumed by a household over a certain period of time usually ranges from one to three days, but seven days and periods of up to 15 days have also been reported in the literature [17, 50]. This study makes use of seven days’ recall data collected from the surveyed household and the following set of 12 food groups is used to calculate the HDDS: Cereals, White tubers and roots, Vegetables,1 Fruits,2 Meat,3 Eggs, Fish and other seafood, Legumes, nuts and seeds, Milk and milk products, Oils and fats, Sweets, and Miscellaneous (Spices, condiments and bev-erages). We collected data for the HDDS4 indicator by asking the respondent5 a series of yes or no questions with respect to the food groups consumed by the house-hold members in the home or prepared in the home for consumption by household members outside the home during the last seven days. For a “YES” response, one point is awarded, otherwise, zero point was awarded.
Values for the dietary diversity variable were later com-puted by adding all the 12 food groups included in the dietary diversity score for each household, therefore, making all scores to be within the range of 0–12.
Measurement of women’s empowermentWomen’s empowerment is one of the key regressors in this study together with LTPRs and other control vari-ables. The aim is to establish the linkage between wom-en’s empowerment and the outcome variable—HFS scores and HDDS. In this study, women’s empowerment is measured using the A-WEAI, which is an abbreviated version of the original Women’s Empowerment in Agri-culture Index. A-WEAI was developed as an improve-ment over WEAI based on the response obtained from the survey vis-a-vis the time it takes to complete the WEAI questionnaire and the inability to comprehend some of the subsections [36]. The original WEAI is com-puted using ten indicators while the A-WEAI makes use of only six indicators. The A-WEAI just like its anteced-ent measures women’s empowerment in their roles and extent of engagement across five agricultural domains which are: decisions about agricultural production; access to and decision-making power about productive resources; control of the use of income; leadership in the community; and time allocation.
Each dichotomous indicator measures whether an individual respondent has achieved adequacy based on the definitions shown in Table 12, with correspond-ing weights that ensure that each domain receives equal weight when the indicators are aggregated together. We operationalize the A-WEAI in two ways—by determin-ing the woman’s overall empowerment score using the six weighted indicators, after which a woman’s level of empowerment is established with respect to each indi-vidual A-WEAI indicator.
The Five Domains of Empowerment (5DE) Index is constructed using the Alkire–Foster method [10]. The measure shows how many domains women are empow-ered. This method can distinguish between women who are disempowered in just one domain and those dis-empowered across several domains at the same time. The 5DE index is calculated according to the following formula:
Mo is the disempowerment index, calculated as the prod-uct of the proportion of disempowered women (Hd) and the percentage of domains in which disempowered women do not have adequate achievements (Ae) . He is the percentage of empowered women, where empowered means that a woman has adequate achievements in four of the five domains or is empowered in a combination
(1)5DE = 1−Mo = He +Hd × Ae
1 The vegetable food group is a combination of vitamin A rich vegetables and tubers, dark green leafy vegetables and other vegetables.2 The fruit group is a combination of vitamin A rich fruits and other fruits.3 The meat group is a combination of organ meat and flesh meat.4 One of the reviewers suggested the need to do a Wilcoxon test to test the null hypothesis that both outcomes (USDA HFS scores and HDDS) have the same distribution with the same median. We wish to note, however, that the Z statistics in Wilcoxon test is − 11.650 at p < 0.01, thus indicating that USDA HFS scores and HDDS are statistically different from one another and hence, the need to run the two analyses.5 This is the person responsible for food preparation in the household in the last 7 days.

Page 7 of 22Kehinde et al. Agric & Food Secur (2021) 10:25
of the weighted indicators that make up at least 80 per-cent of the total. Hd is the percentage of disempowered women (1−He) ; Ae is the average absolute empower-ment score among the dis-empowered; Hence, the 5DE index yields a value between 0 and 1, where higher values indicate greater empowerment.
Following Alkire et al. [9] and Gupta et al. [28], Gen-der Parity Index (GPI) compares the 5DE profile of the primary female in a household with that of the primary male. Typically, the primary female and a primary male will be husband and wife; however, where this is not the case, men and women in the same household were also classified as the primary male and female decision-makers regardless of their relationship to each other. Similarly, the most influential adult male and female in the household with respect to decision vis-à-vis agri-cultural production, access to productive resources; control of the use of income; leadership in the commu-nity; and time allocation can also be categorized as pri-mary male and primary female.
Households without a primary adult male are excluded from the computation of the GPI. The GPI shows the share of women who are as empowered as their male counterparts. For those pairs where there is a disparity, the GPI shows the relative empowerment gap between the woman’s 5DE score and the man’s. The GPI is calculated according to the following formula:
HGPI is the percentage of households without gender parity; IGPI is the average empowerment gap between women and men living in households that lack gender parity; Women’s Empowerment in Agriculture Index (WEAI) methodology gives a weight of 90% to the 5DE Index and a weight of 10% to the GPI. Thus, the WEAI is computed as follows:
Measurement of Land Tenure and Property RightsLTPRs of farmers were measured using two key indica-tors—tenure type and tenure security.
Tenure typeThis refers to the mode of land acquisition, which was categorised into four—inherited, Purchased, Leasehold, and Communal. These were included in the study mod-els as the proportion of the farmlands cultivated by all members of the households that fall under each of the four categories.
(2)GPI = 1− (HGPI × IGPI)
(3)WEAI = (5DE× 0.9)+ (GPI× 0.1)
Tenure security (legal)A tenure is de jure secure, if it is duly registered with the land registry and/or the holder is issued a certificate of occupancy by the Governor of the State where it is located. Hence, this study focused on de jure with a view to examining the importance of title registration, which was captured in the model as the proportion of house-hold’s farmland to which the household holds the regis-tered title.
Analytical methodsPoisson regression is used to model count variables, such as the household food security scores and house-hold dietary diversity scores, but in a case when there is an over-abundance of zero counts in data than a Poisson would predict, the Zero-Inflated Poisson (ZIP) regression will be the appropriate model. We, therefore, used the two frameworks in this study of household food security among the farming households in Nigeria.
Poisson modelPoisson distribution is a discrete probability distribution for count variables and can be used to model how likely it is that an event will happen within a specified period of time. In this study, Poisson regression estimates how the explanatory variables influence the number of times the outcome variables occurred. The outcome variables here refer to the USDA HFS scores and HDDS. It is important to note that one of the basic assumptions of the Poisson model is that the expected value (mean) of the Poisson distribution is equal to its variance.
Following Cameron and Trivedi [12] and Greene [27], the Poisson regression model assumes that the depend-ent variable y given the vector of predictor variables x has a Poisson distribution (Eq. 4):
Greene [27] and Wooldridge [61] show that the mean and the variance of the Poisson distribution is given in Eq. 5 to be:
The log-linear conditional mean function E[yi|xi] = µi and its equidispersion Var[yi|xi] = µi assumptions are the main features of the Poisson regression model.
Zero‑Inflated Poisson ModelThe Zero-Inflated Poisson (ZIP) is an extension of the Poisson regression model that is appropriate in a situa-tion when the count data comprise many zero values than
(4)f (yi|xi) =e−µiµ
yii
yi!, yi = 0, 1, 2, ...
(5)E[yi|xi] = Var[yi|xi] = µi = exp(x′iβ) for i = 1, 2, . . . , n
Page 8 of 22Kehinde et al. Agric & Food Secur (2021) 10:25
a Poisson distribution would predict [12]. Hence, ZIP models allow for two regimes—the outcome is always a zero count (regime I) and the counts follow a standard Poisson process (regime II). The ZIP models assume that the excess zero counts come from a logit or probit model and the remaining counts come from a Poisson model. Fitting a ZIP model in Stata allows for the specification of two separate models simultaneously: count model and the inflate model that predicts the always zero cases.
Assuming there are two possible scenarios for each respondent—the count is always zero (scenario I) and the counts (non-negative integers) are generated accord-ing to a Poisson model (scenario II). Suppose that the probability of having scenario I occurring is π, while the probability that scenario II occurs is 1 − π. Hence, the probability distribution of the ZIP random variable yi can be specified in Eq. 6 as:
where j is the observed count, which is a non-negative integer; µi is from the Poisson component of the model, which can include an exposure time t and a set of k regressors (the X’s), and is defined as follows:
The regression coefficients β1, β2, . . . , βk are unknown parameters that are estimated from a set of data.
This study, therefore, deployed the ZIP regression framework to analyse HFS among smallholder farmers in Nigeria. The results were also compared with those of traditional Poisson and Instrumental Variable Poisson in search of appropriate specification and endogeneity test. Table 1 shows the outcome variables of interest as well as the sets of regressors used in the study. It is worthy to note that the same set of regressors was used for both the Logit and the Poisson section of ZIP. Also, considering the fact that all the households responded to questions contextualised over the past 12 months of visiting each of the respondents makes the exposure time (t) not to be applicable to this study.
It is pertinent to note that the whole dataset for the HFS data had 81 households with no children with 0 ≤ HFS Score ≤ 10 and 886 households with at least one (1) child, with 0 ≤ HFS Score ≤ 18. Knowing full well that HFS scores for the two categories of households repre-sent different levels of food insecurity (Table 11), rela-tively fewer cases of households with no children were dropped and the final analysis was based on the remain-ing 886 households with children. We must also note that the HDDS data were analysed within the framework of
(6)Pr(yi = j) =
πi + (1− πi) exp(−µi) if j = 0
(1− πi)µyii exp(−µi)
yi!if j > 0
(7)µi = exp(ln(ti)+ β1X1i + β2X2i + · · · + βkXki)
the Poisson regression because the score is a count vari-able ranging from 1 to 12.
Results and discussionSocio‑economic profiles of households of the maize and rice farmersThe socio-economic profiles of the sampled farm house-holds are summarised in Table 2, while Table 3 summa-rises the characteristics of the farmlands cultivated by their members. As shown in Table 2, the majority (61.4%) of the farmers across the six geopolitical zones of Nigeria were within the age bracket of 31–50 years. The mean age was 46 years. This suggests that maize and rice farmers in Nigeria are mostly within the mid-age, and are rela-tively younger than the typical farmer in the area, which Eze et al. [21] reported was 59 years old. This, however, is most likely because of the recent drive by the Fed-eral Government of Nigeria to encourage the youths to embrace agriculture, targeting maize and rice among selected crops.
Results in Table 2 also show that the typical farmer is 89% likely to belong to a male-headed household, 98% likely to be married, and 63% likely to belong to a house-hold whose members jointly cultivated no more than 2 hectares of land, which is 51% of the cases are fragmented into two or more parcels. Results in Table 3 further show that about 54.0% of the households across the six GPZs inherited their farmlands while about 16.0% purchased the land. Also, 19.0% of the parcels were leased while 11.0% were communal land, respectively. The proportion of parcels held on leasehold and a communal agreement was found to be extremely (8.0% and 3.0%, respec-tively) lower among farmers drawn from northwest and northeast. With respect to key rights held, the majority (71.0%–78.0%) of the farmers across the study area pos-sessed rights to—restrict others from their farm, grow tree crops and develop their parcels further by investing in an irrigating scheme, for example, while the majority of the households perceived they enjoy secure tenure on the land, as most believed they could sell (67.4%) and/or bequeath (64.0%) the land to their children. However, only a few of the landholding was registered either with the Local Government Authorities (5.0%) or the State authorities (3.0%). The general LTPRs patterns are similar across the six GPZs, except that incidences of leasehold are relatively higher (47.0%) in the Southwest and inci-dences of inherited landholding are relatively lower in the Southwest (30.0%).
Unweighted adequacy scores by dual householdsThe unweighted adequacy scores for the indicators that make up the five domains of empowerment by the primary male and female in the household are shown
Page 9 of 22Kehinde et al. Agric & Food Secur (2021) 10:25
in Table 4. A value of one indicates complete adequacy and a value of zero indicates complete inadequacy in an indicator. Alkire et al. [9] define an individual as empowered if he or she achieves adequacy in 80% or
more of the weighted indicators. Female adults in households where an adult male is present are inad-equate in all the indicators compared to their male counterparts in the same household. However, they
Table 1 Definitions of study variables and their descriptive statistics
Variables Descriptive statistics
Min Max Mean Std Dev.
Dependent variables
Household dietary diversity score (number of food groups consumed) 1.00 12.00 6.39 2.53
Household food security score (number of affirmative responses) 0.00 18.00 6.93 5.48
Land tenure and property rights variables
Cultivating maize only (1 if yes, 0 otherwise) 0.00 1.00 0.39 0.49
Farm size (Ha) 0.06 134.50 5.93 8.99
Lowland share of farmland 0.00 1.00 0.49 0.45
Simpson Index (land fragmentation) 0.00 0.96 0.25 0.28
Simpson Diversity Index (crop diversity) 0.00 0.67 0.12 0.16
Maize × farm size 0.00 120.00 2.48 7.23
Maize × lowland 0.00 1.00 0.09 0.25
Maize × SI 0.00 0.96 0.11 0.23
Maize × SDI 0.00 0.67 0.05 0.11
Purchased share of farmland 0.00 1.00 0.18 0.35
Leasehold share of farmland 0.00 1.00 0.19 0.37
Communal share of farmland 0.00 1.00 0.10 0.28
Registered × freehold share 0.00 1.00 0.09 0.24
Credit amount 0.00 1,800,000 97,783.72 557,487.40
Empowerment variables
Female achievement in asset 0.00 1.00 0.53 0.50
Female achievement in group membership (1 if yes, 0 otherwise) 0.00 1.00 0.60 0.49
Female achievement in productive decision (1 if yes, 0 otherwise) 0.00 1.00 0.63 0.48
Female achievement over control of income (1 if yes, 0 otherwise) 0.00 1.00 0.48 0.50
Female achievement in credit (1 if yes, 0 otherwise) 0.00 1.00 0.16 0.37
Female achievement in workload (1 if yes, 0 otherwise) 0.00 1.00 0.76 0.43
Parity (parity = 1) 0.00 1.00 0.32 0.47
Other controls
Extension contact (at least once = 1; none = 0) 0.00 1.00 0.69 0.46
Age of head (years) 18.00 85.00 46.01 11.57
Age squared 324.00 7225.00 2252.24 1131.14
Education of head (schooling years) 0.00 18.00 7.81 5.85
Gender of head (female = 1, male = 0) 0.00 1.00 0.07 0.25
Head is single (1 if yes, 0 otherwise) 0.00 1.00 0.01 0.10
Head is widowed/divorced (1 if yes, 0 otherwise) 0.00 1.00 0.01 0.11
Head works off-farm (1 if yes, 0 otherwise) 0.00 1.00 0.59 0.49
Household size (number of people) 1.00 42.00 9.51 5.90
Dependent ratio 0.00 17.00 1.61 1.71
Location is North central (1 if yes, 0 otherwise) 0.00 1.00 0.17 0.37
Location is Northeast (1 if yes, 0 otherwise) 0.00 1.00 0.08 0.27
Location is Southeast (1 if yes, 0 otherwise) 0.00 1.00 0.09 0.29
Location is South-south (1 if yes, 0 otherwise) 0.00 1.00 0.08 0.28
Location is South west (1 if yes, 0 otherwise) 0.00 1.00 0.18 0.39
Page 10 of 22Kehinde et al. Agric & Food Secur (2021) 10:25
are more adequate in workload compared to males. Table 4 further shows that the primary males were more empowered in three out of the five domains of empowerment when compared to their female coun-terparts. We see that women are less adequate because they score particularly poorly in the production and income domains. As shown in Table 4, primary females in households are the least empowered, achieving adequacy in only 57% of the weighted indicators on
average. This result is much higher when compared to the findings of Wouterse [62] who found that females in the household achieved adequacy in only 44% of the weighted indicators on average. Following Alkire et al. [9] cut-off, we find that in our study data—in dual households—22.53% of women are considered empowered against 52.76% of men, hence, the need to embrace policies targeted at improving women’s access to productive resources.
Table 2 Socio-economic characteristics of the maize and rice farming households. Source: Field Survey, 2017
NC North central, NE Northeast, NW Northwest, SE Southeast, SS South-South, SW Southwest
GPZ NC NE NW SE SS SW All
Variables % % % % % % %
Age group
At most 30 15.9 11.8 10.5 3.1 9.1 4.1 9.5
31–40 29.6 29.4 25.0 24.7 35.2 23.0 26.6
41–50 31.8 32.9 34.3 42.3 29.6 37.8 34.8
51–60 14.8 17.7 22.1 16.5 17.1 25.0 20.2
Above 60 8.0 8.2 8.1 13.4 9.1 10.2 9.0
Mean age (years) 44 45 46 48 45 48 46
Gender
Male 89.2 97.7 97.1 96.9 86.4 88.3 93.3
Female 10.8 2.4 2.9 3.1 13.6 11.7 6.7
Marital status
Married 98.3 96.5 98.1 96.9 96.6 98.0 97.7
Single 0.6 2.4 1.2 3.1 0.0 0.0 1.0
Widow/divorced 1.1 1.2 0.7 0.0 3.4 2.0 1.2
Education attainment
No formal education 30.1 23.5 33.6 13.4 25.0 10.7 25.4
Arabic education 4.0 0.0 14.8 1.0 0.0 0.0 6.6
Primary education 18.8 14.1 16.2 35.1 21.6 26.0 20.4
Secondary education 25.6 21.2 15.2 21.7 33.0 41.8 24.4
Tertiary education 21.6 41.2 20.2 28.9 20.5 21.4 23.2
Mean education attainment (years) 8 9 6 9 8 10 8
Household size
1–5 17.1 28.2 15.0 39.2 31.8 38.8 24.4
6–10 43.2 49.4 35.5 38.1 44.3 51.5 41.8
11–15 21.0 11.8 27.6 17.5 21.6 8.2 20.2
Above 15 18.8 10.6 21.9 5.2 2.3 1.5 13.6
Mean household size 11 9 11 7 7 7 10
Farm size (ha)
Large farm (> 5Ha) 5.1 9.4 8.3 11.3 12.5 15.3 9.8
Medium farm (2–5 Ha) 25.6 30.6 26.2 28.9 22.7 30.6 27.2
Small farm (< 2Ha) 69.3 60.0 65.5 59.8 64.8 54.1 63.0
Mean farm size (ha) 2.2 2.3 2.2 2.2 2.5 3.0 2.4
Simpson Index
Fragmented 47.7 49.4 43.3 40.2 47.7 64.8 48.6
Consolidated 52.3 50.6 56.7 59.8 52.3 35.2 51.4
Mean Simpson Index 52.0 51.0 57.0 60.0 52.0 35.0 51.0
Page 11 of 22Kehinde et al. Agric & Food Secur (2021) 10:25
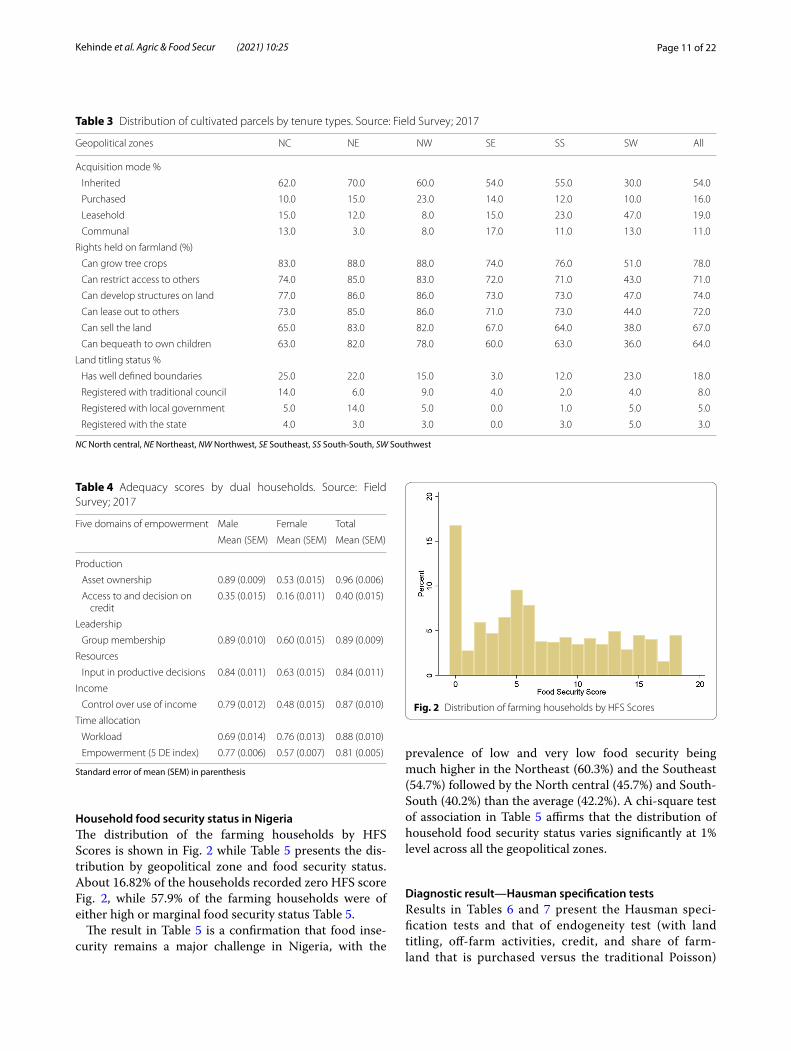
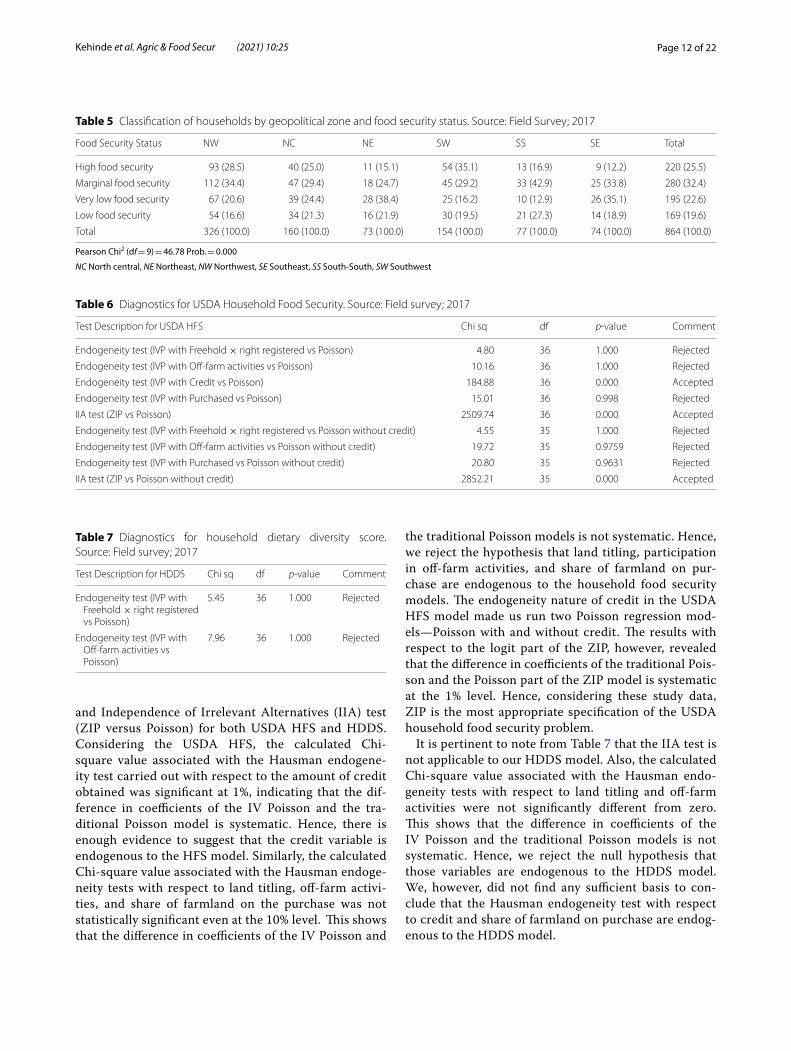
Household food security status in NigeriaThe distribution of the farming households by HFS Scores is shown in Fig. 2 while Table 5 presents the dis-tribution by geopolitical zone and food security status. About 16.82% of the households recorded zero HFS score Fig. 2, while 57.9% of the farming households were of either high or marginal food security status Table 5.
The result in Table 5 is a confirmation that food inse-curity remains a major challenge in Nigeria, with the
prevalence of low and very low food security being much higher in the Northeast (60.3%) and the Southeast (54.7%) followed by the North central (45.7%) and South-South (40.2%) than the average (42.2%). A chi-square test of association in Table 5 affirms that the distribution of household food security status varies significantly at 1% level across all the geopolitical zones.
Diagnostic result—Hausman specification testsResults in Tables 6 and 7 present the Hausman speci-fication tests and that of endogeneity test (with land titling, off-farm activities, credit, and share of farm-land that is purchased versus the traditional Poisson)
Table 3 Distribution of cultivated parcels by tenure types. Source: Field Survey; 2017
NC North central, NE Northeast, NW Northwest, SE Southeast, SS South-South, SW Southwest
Geopolitical zones NC NE NW SE SS SW All
Acquisition mode %
Inherited 62.0 70.0 60.0 54.0 55.0 30.0 54.0
Purchased 10.0 15.0 23.0 14.0 12.0 10.0 16.0
Leasehold 15.0 12.0 8.0 15.0 23.0 47.0 19.0
Communal 13.0 3.0 8.0 17.0 11.0 13.0 11.0
Rights held on farmland (%)
Can grow tree crops 83.0 88.0 88.0 74.0 76.0 51.0 78.0
Can restrict access to others 74.0 85.0 83.0 72.0 71.0 43.0 71.0
Can develop structures on land 77.0 86.0 86.0 73.0 73.0 47.0 74.0
Can lease out to others 73.0 85.0 86.0 71.0 73.0 44.0 72.0
Can sell the land 65.0 83.0 82.0 67.0 64.0 38.0 67.0
Can bequeath to own children 63.0 82.0 78.0 60.0 63.0 36.0 64.0
Land titling status %
Has well defined boundaries 25.0 22.0 15.0 3.0 12.0 23.0 18.0
Registered with traditional council 14.0 6.0 9.0 4.0 2.0 4.0 8.0
Registered with local government 5.0 14.0 5.0 0.0 1.0 5.0 5.0
Registered with the state 4.0 3.0 3.0 0.0 3.0 5.0 3.0
Table 4 Adequacy scores by dual households. Source: Field Survey; 2017
Standard error of mean (SEM) in parenthesis
Five domains of empowerment Male Female Total
Mean (SEM) Mean (SEM) Mean (SEM)
Production
Asset ownership 0.89 (0.009) 0.53 (0.015) 0.96 (0.006)
Access to and decision on credit
0.35 (0.015) 0.16 (0.011) 0.40 (0.015)
Leadership
Group membership 0.89 (0.010) 0.60 (0.015) 0.89 (0.009)
Resources
Input in productive decisions 0.84 (0.011) 0.63 (0.015) 0.84 (0.011)
Income
Control over use of income 0.79 (0.012) 0.48 (0.015) 0.87 (0.010)
Time allocation
Workload 0.69 (0.014) 0.76 (0.013) 0.88 (0.010)
Empowerment (5 DE index) 0.77 (0.006) 0.57 (0.007) 0.81 (0.005)
Fig. 2 Distribution of farming households by HFS Scores
Page 12 of 22Kehinde et al. Agric & Food Secur (2021) 10:25
and Independence of Irrelevant Alternatives (IIA) test (ZIP versus Poisson) for both USDA HFS and HDDS. Considering the USDA HFS, the calculated Chi-square value associated with the Hausman endogene-ity test carried out with respect to the amount of credit obtained was significant at 1%, indicating that the dif-ference in coefficients of the IV Poisson and the tra-ditional Poisson model is systematic. Hence, there is enough evidence to suggest that the credit variable is endogenous to the HFS model. Similarly, the calculated Chi-square value associated with the Hausman endoge-neity tests with respect to land titling, off-farm activi-ties, and share of farmland on the purchase was not statistically significant even at the 10% level. This shows that the difference in coefficients of the IV Poisson and
the traditional Poisson models is not systematic. Hence, we reject the hypothesis that land titling, participation in off-farm activities, and share of farmland on pur-chase are endogenous to the household food security models. The endogeneity nature of credit in the USDA HFS model made us run two Poisson regression mod-els—Poisson with and without credit. The results with respect to the logit part of the ZIP, however, revealed that the difference in coefficients of the traditional Pois-son and the Poisson part of the ZIP model is systematic at the 1% level. Hence, considering these study data, ZIP is the most appropriate specification of the USDA household food security problem.
It is pertinent to note from Table 7 that the IIA test is not applicable to our HDDS model. Also, the calculated Chi-square value associated with the Hausman endo-geneity tests with respect to land titling and off-farm activities were not significantly different from zero. This shows that the difference in coefficients of the IV Poisson and the traditional Poisson models is not systematic. Hence, we reject the null hypothesis that those variables are endogenous to the HDDS model. We, however, did not find any sufficient basis to con-clude that the Hausman endogeneity test with respect to credit and share of farmland on purchase are endog-enous to the HDDS model.
Table 5 Classification of households by geopolitical zone and food security status. Source: Field Survey; 2017
Pearson Chi2 (df = 9) = 46.78 Prob. = 0.000
NC North central, NE Northeast, NW Northwest, SE Southeast, SS South-South, SW Southwest
Food Security Status NW NC NE SW SS SE Total
High food security 93 (28.5) 40 (25.0) 11 (15.1) 54 (35.1) 13 (16.9) 9 (12.2) 220 (25.5)
Marginal food security 112 (34.4) 47 (29.4) 18 (24.7) 45 (29.2) 33 (42.9) 25 (33.8) 280 (32.4)
Very low food security 67 (20.6) 39 (24.4) 28 (38.4) 25 (16.2) 10 (12.9) 26 (35.1) 195 (22.6)
Low food security 54 (16.6) 34 (21.3) 16 (21.9) 30 (19.5) 21 (27.3) 14 (18.9) 169 (19.6)
Total 326 (100.0) 160 (100.0) 73 (100.0) 154 (100.0) 77 (100.0) 74 (100.0) 864 (100.0)
Table 6 Diagnostics for USDA Household Food Security. Source: Field survey; 2017
Test Description for USDA HFS Chi sq df p-value Comment
Endogeneity test (IVP with Freehold × right registered vs Poisson) 4.80 36 1.000 Rejected
Endogeneity test (IVP with Off-farm activities vs Poisson) 10.16 36 1.000 Rejected
Endogeneity test (IVP with Credit vs Poisson) 184.88 36 0.000 Accepted
Endogeneity test (IVP with Purchased vs Poisson) 15.01 36 0.998 Rejected
IIA test (ZIP vs Poisson) 2509.74 36 0.000 Accepted
Endogeneity test (IVP with Freehold × right registered vs Poisson without credit) 4.55 35 1.000 Rejected
Endogeneity test (IVP with Off-farm activities vs Poisson without credit) 19.72 35 0.9759 Rejected
Endogeneity test (IVP with Purchased vs Poisson without credit) 20.80 35 0.9631 Rejected
IIA test (ZIP vs Poisson without credit) 2852.21 35 0.000 Accepted
Table 7 Diagnostics for household dietary diversity score. Source: Field survey; 2017
Test Description for HDDS Chi sq df p-value Comment
Endogeneity test (IVP with Freehold × right registered vs Poisson)
5.45 36 1.000 Rejected
Endogeneity test (IVP with Off-farm activities vs Poisson)
7.96 36 1.000 Rejected
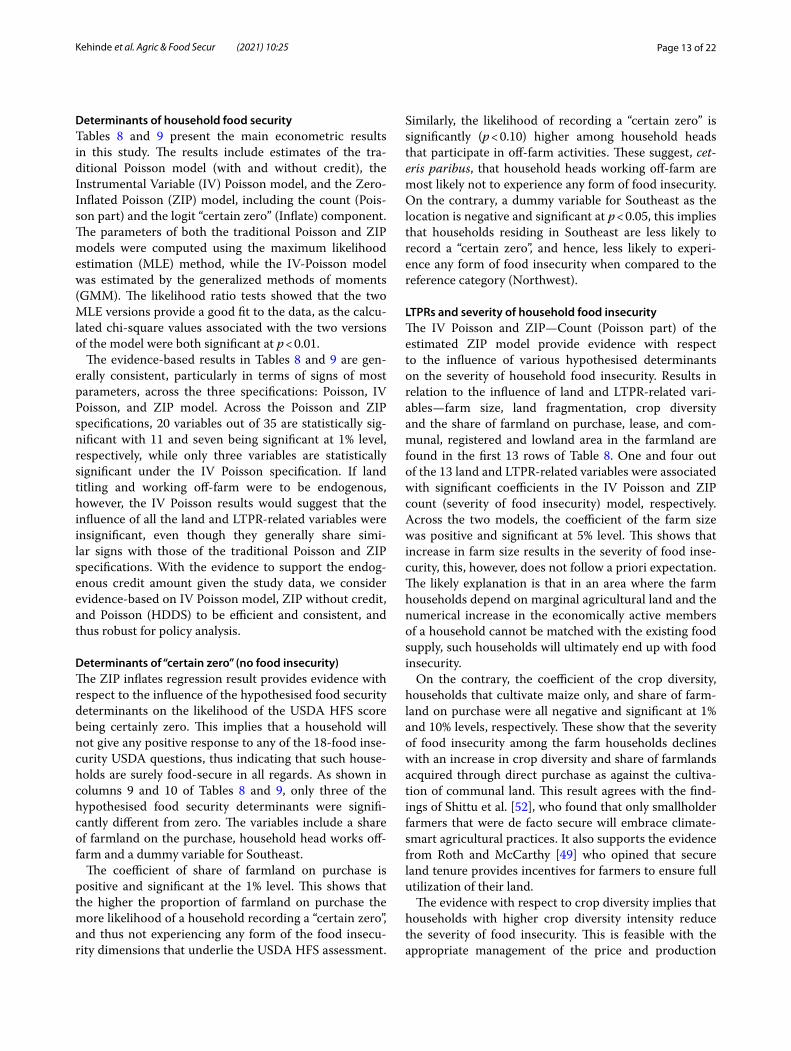
Page 13 of 22Kehinde et al. Agric & Food Secur (2021) 10:25
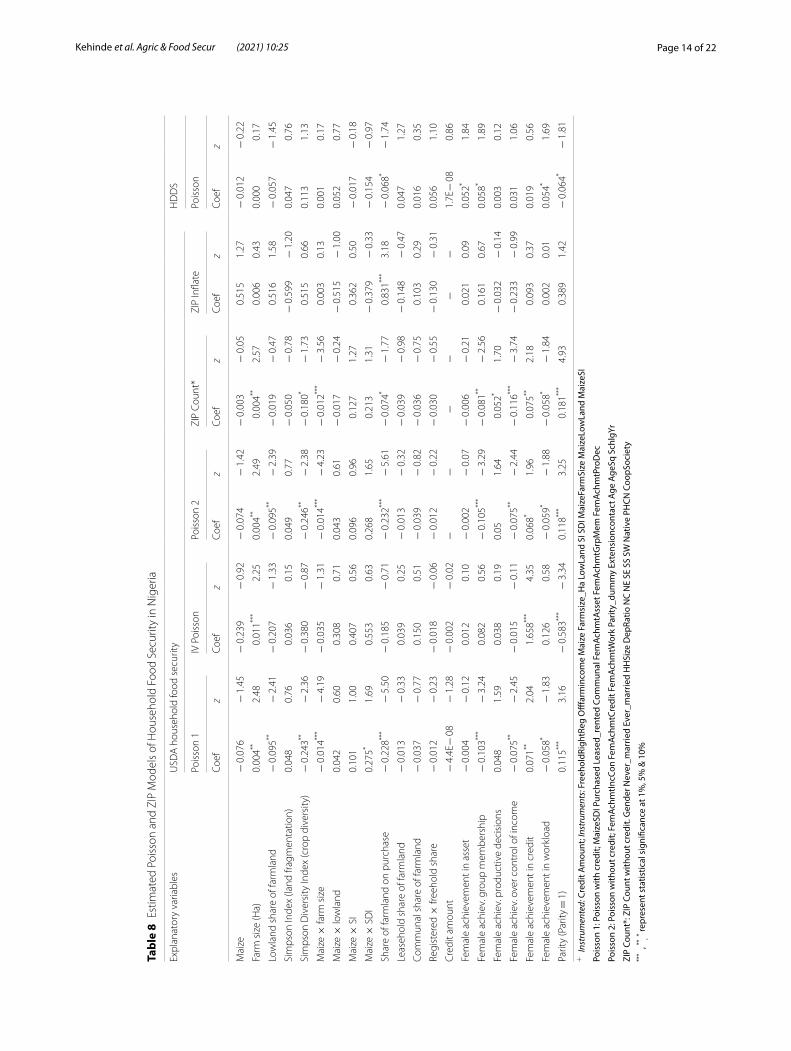
Determinants of household food securityTables 8 and 9 present the main econometric results in this study. The results include estimates of the tra-ditional Poisson model (with and without credit), the Instrumental Variable (IV) Poisson model, and the Zero-Inflated Poisson (ZIP) model, including the count (Pois-son part) and the logit “certain zero” (Inflate) component. The parameters of both the traditional Poisson and ZIP models were computed using the maximum likelihood estimation (MLE) method, while the IV-Poisson model was estimated by the generalized methods of moments (GMM). The likelihood ratio tests showed that the two MLE versions provide a good fit to the data, as the calcu-lated chi-square values associated with the two versions of the model were both significant at p < 0.01.
The evidence-based results in Tables 8 and 9 are gen-erally consistent, particularly in terms of signs of most parameters, across the three specifications: Poisson, IV Poisson, and ZIP model. Across the Poisson and ZIP specifications, 20 variables out of 35 are statistically sig-nificant with 11 and seven being significant at 1% level, respectively, while only three variables are statistically significant under the IV Poisson specification. If land titling and working off-farm were to be endogenous, however, the IV Poisson results would suggest that the influence of all the land and LTPR-related variables were insignificant, even though they generally share simi-lar signs with those of the traditional Poisson and ZIP specifications. With the evidence to support the endog-enous credit amount given the study data, we consider evidence-based on IV Poisson model, ZIP without credit, and Poisson (HDDS) to be efficient and consistent, and thus robust for policy analysis.
Determinants of “certain zero” (no food insecurity)The ZIP inflates regression result provides evidence with respect to the influence of the hypothesised food security determinants on the likelihood of the USDA HFS score being certainly zero. This implies that a household will not give any positive response to any of the 18-food inse-curity USDA questions, thus indicating that such house-holds are surely food-secure in all regards. As shown in columns 9 and 10 of Tables 8 and 9, only three of the hypothesised food security determinants were signifi-cantly different from zero. The variables include a share of farmland on the purchase, household head works off-farm and a dummy variable for Southeast.
The coefficient of share of farmland on purchase is positive and significant at the 1% level. This shows that the higher the proportion of farmland on purchase the more likelihood of a household recording a “certain zero”, and thus not experiencing any form of the food insecu-rity dimensions that underlie the USDA HFS assessment.
Similarly, the likelihood of recording a “certain zero” is significantly (p < 0.10) higher among household heads that participate in off-farm activities. These suggest, cet-eris paribus, that household heads working off-farm are most likely not to experience any form of food insecurity. On the contrary, a dummy variable for Southeast as the location is negative and significant at p < 0.05, this implies that households residing in Southeast are less likely to record a “certain zero”, and hence, less likely to experi-ence any form of food insecurity when compared to the reference category (Northwest).
LTPRs and severity of household food insecurityThe IV Poisson and ZIP—Count (Poisson part) of the estimated ZIP model provide evidence with respect to the influence of various hypothesised determinants on the severity of household food insecurity. Results in relation to the influence of land and LTPR-related vari-ables—farm size, land fragmentation, crop diversity and the share of farmland on purchase, lease, and com-munal, registered and lowland area in the farmland are found in the first 13 rows of Table 8. One and four out of the 13 land and LTPR-related variables were associated with significant coefficients in the IV Poisson and ZIP count (severity of food insecurity) model, respectively. Across the two models, the coefficient of the farm size was positive and significant at 5% level. This shows that increase in farm size results in the severity of food inse-curity, this, however, does not follow a priori expectation. The likely explanation is that in an area where the farm households depend on marginal agricultural land and the numerical increase in the economically active members of a household cannot be matched with the existing food supply, such households will ultimately end up with food insecurity.
On the contrary, the coefficient of the crop diversity, households that cultivate maize only, and share of farm-land on purchase were all negative and significant at 1% and 10% levels, respectively. These show that the severity of food insecurity among the farm households declines with an increase in crop diversity and share of farmlands acquired through direct purchase as against the cultiva-tion of communal land. This result agrees with the find-ings of Shittu et al. [52], who found that only smallholder farmers that were de facto secure will embrace climate-smart agricultural practices. It also supports the evidence from Roth and McCarthy [49] who opined that secure land tenure provides incentives for farmers to ensure full utilization of their land.
The evidence with respect to crop diversity implies that households with higher crop diversity intensity reduce the severity of food insecurity. This is feasible with the appropriate management of the price and production
Page 14 of 22Kehinde et al. Agric & Food Secur (2021) 10:25
Tabl
e 8
Estim
ated
Poi
sson
and
ZIP
Mod
els
of H
ouse
hold
Foo
d Se
curit
y in
Nig
eria
+ I
nstr
umen
ted:
Cre
dit A
mou
nt; I
nstr
umen
ts: F
reeh
oldR
ight
Reg
Offf
arm
inco
me
Mai
ze F
arm
size
_Ha
Low
Land
SI S
DI M
aize
Farm
Size
Mai
zeLo
wLa
nd M
aize
SI
Pois
son
1: P
oiss
on w
ith c
redi
t; M
aize
SDI P
urch
ased
Lea
sed_
rent
ed C
omm
unal
Fem
Achm
tAss
et F
emAc
hmtG
rpM
em F
emAc
hmtP
roD
ec
Pois
son
2: P
oiss
on w
ithou
t cre
dit;
Fem
Achm
tIncC
on F
emAc
hmtC
redi
t Fem
Achm
tWor
k Pa
rity_
dum
my
Exte
nsio
ncon
tact
Age
Age
Sq S
chlg
Yr
ZIP
Coun
t*: Z
IP C
ount
with
out c
redi
t. G
ende
r Nev
er_m
arrie
d Ev
er_m
arrie
d H
HSi
ze D
epRa
tio N
C N
E SE
SS
SW N
ativ
e PH
CN C
oopS
ocie
ty**
* , **
, * repr
esen
t sta
tistic
al s
igni
fican
ce a
t 1%
, 5%
& 1
0%
Expl
anat
ory
varia
bles
USD
A h
ouse
hold
food
sec
urity
HD
DS
Pois
son
1IV
Poi
sson
Pois
son
2ZI
P Co
unt*
ZIP
Infla
tePo
isso
n
Coef
zCo
efz
Coef
zCo
efz
Coef
zCo
efz
Mai
ze−
0.0
76−
1.4
5−
0.2
39−
0.9
2−
0.0
74−
1.4
2−
0.0
03−
0.0
50.
515
1.27
− 0
.012
− 0
.22
Farm
siz
e (H
a)0.
004**
2.48
0.01
1***
2.25
0.00
4**2.
490.
004**
2.57
0.00
60.
430.
000
0.17
Low
land
sha
re o
f far
mla
nd−
0.0
95**
− 2
.41
− 0
.207
− 1
.33
− 0
.095
**−
2.3
9−
0.0
19−
0.4
70.
516
1.58
− 0
.057
− 1
.45
Sim
pson
Inde
x (la
nd fr
agm
enta
tion)
0.04
80.
760.
036
0.15
0.04
90.
77−
0.0
50−
0.7
8−
0.5
99−
1.2
00.
047
0.76
Sim
pson
Div
ersi
ty In
dex
(cro
p di
vers
ity)
− 0
.243
**−
2.3
6−
0.3
80−
0.8
7−
0.2
46**
− 2
.38
− 0
.180
*−
1.7
30.
515
0.66
0.11
31.
13
Mai
ze ×
farm
siz
e−
0.0
14**
*−
4.1
9−
0.0
35−
1.3
1−
0.0
14**
*−
4.2
3−
0.0
12**
*−
3.5
60.
003
0.13
0.00
10.
17
Mai
ze ×
low
land
0.04
20.
600.
308
0.71
0.04
30.
61−
0.0
17−
0.2
4−
0.5
15−
1.0
00.
052
0.77
Mai
ze ×
SI
0.10
11.
000.
407
0.56
0.09
60.
960.
127
1.27
0.36
20.
50−
0.0
17−
0.1
8
Mai
ze ×
SD
I0.
275*
1.69
0.55
30.
630.
268
1.65
0.21
31.
31−
0.3
79−
0.3
3−
0.1
54−
0.9
7
Shar
e of
farm
land
on
purc
hase
− 0
.228
***
− 5
.50
− 0
.185
− 0
.71
− 0
.232
***
− 5
.61
− 0
.074
*−
1.7
70.
831**
*3.
18−
0.0
68*
− 1
.74
Leas
ehol
d sh
are
of fa
rmla
nd−
0.0
13−
0.3
30.
039
0.25
− 0
.013
− 0
.32
− 0
.039
− 0
.98
− 0
.148
− 0
.47
0.04
71.
27
Com
mun
al s
hare
of f
arm
land
− 0
.037
− 0
.77
0.15
00.
51−
0.0
39−
0.8
2−
0.0
36−
0.7
50.
103
0.29
0.01
60.
35
Regi
ster
ed ×
free
hold
sha
re−
0.0
12−
0.2
3−
0.0
18−
0.0
6−
0.0
12−
0.2
2−
0.0
30−
0.5
5−
0.1
30−
0.3
10.
056
1.10
Cre
dit a
mou
nt−
4.4
E− 0
8−
1.2
8−
0.0
02−
0.0
2−
−
−
−
−
−
1.
7E−
08
0.86
Fem
ale
achi
evem
ent i
n as
set
− 0
.004
− 0
.12
0.01
20.
10−
0.0
02−
0.0
7−
0.0
06−
0.2
10.
021
0.09
0.05
2*1.
84
Fem
ale
achi
ev. g
roup
mem
bers
hip
− 0
.103
***
− 3
.24
0.08
20.
56−
0.1
05**
*−
3.2
9−
0.0
81**
− 2
.56
0.16
10.
670.
058*
1.89
Fem
ale
achi
ev. p
rodu
ctiv
e de
cisi
ons
0.04
81.
590.
038
0.19
0.05
1.64
0.05
2*1.
70−
0.0
32−
0.1
40.
003
0.12
Fem
ale
achi
ev. o
ver c
ontr
ol o
f inc
ome
− 0
.075
**−
2.4
5−
0.0
15−
0.1
1−
0.0
75**
− 2
.44
− 0
.116
***
− 3
.74
− 0
.233
− 0
.99
0.03
11.
06
Fem
ale
achi
evem
ent i
n cr
edit
0.07
1**2.
041.
658**
*4.
350.
068*
1.96
0.07
5**2.
180.
093
0.37
0.01
90.
56
Fem
ale
achi
evem
ent i
n w
orkl
oad
− 0
.058
*−
1.8
30.
126
0.58
− 0
.059
*−
1.8
8−
0.0
58*
− 1
.84
0.00
20.
010.
054*
1.69
Parit
y (P
arity
= 1
)0.
115**
*3.
16−
0.5
83**
*−
3.3
40.
118**
*3.
250.
181**
*4.
930.
389
1.42
− 0
.064
*−
1.8
1
Page 15 of 22Kehinde et al. Agric & Food Secur (2021) 10:25
Tabl
e 9
Estim
ated
Poi
sson
and
ZIP
mod
el o
f hou
seho
ld fo
od s
ecur
ity in
Nig
eria
+
Inst
rum
ente
d: C
redi
t Am
ount
; Ins
trum
ents
: Fre
ehol
dRig
htRe
g O
fffar
min
com
e M
aize
Far
msi
ze_H
a Lo
wLa
nd S
I SD
I Mai
zeFa
rmSi
ze M
aize
Low
Land
Mai
zeSI
Pois
son
1: P
oiss
on w
ith c
redi
t; M
aize
SDI P
urch
ased
Lea
sed_
rent
ed C
omm
unal
Fem
Achm
tAss
et F
emAc
hmtG
rpM
em F
emAc
hmtP
roD
ec
Pois
son
2: P
oiss
on w
ithou
t cre
dit;
Fem
Achm
tIncC
on F
emAc
hmtC
redi
t Fem
Achm
tWor
k Pa
rity_
dum
my
Exte
nsio
ncon
tact
Age
Age
Sq S
chlg
Yr
ZIP
Coun
t*: Z
IP C
ount
with
out c
redi
t. G
ende
r Nev
er_m
arrie
d Ev
er_m
arrie
d H
HSi
ze D
epRa
tio N
C N
E SE
SS
SW N
ativ
e PH
CN C
oopS
ocie
ty**
* , **
, * repr
esen
t sta
tistic
al s
igni
fican
ce a
t 1%
, 5%
& 1
0%
Expl
anat
ory
varia
bles
USD
A h
ouse
hold
food
sec
urity
HD
DS
Pois
son
1IV
Poi
sson
Pois
son
2z
ZIP
Coun
t*ZI
P In
flate
Pois
son
Coef
zCo
efz
Coef
Coef
zCo
efz
Coef
z
Exte
nsio
n co
ntac
t (ac
cess
= 1
)−
0.0
83**
*−
2.9
2−
0.3
05**
*−
2.7
9−
0.0
84**
*−
2.9
4−
0.1
03**
*−
3.5
7−
0.1
38−
0.6
5−
5.9
0E−
050.
00
Age
of h
ead
0.01
3*1.
90−
0.0
08−
0.0
90.
013*
1.89
0.00
30.
37−
0.0
65−
1.3
60.
001
0.10
Age
squ
ared
− 8
.30E−
05−
1.2
20.
000
0.16
− 8
.2E−
05−
1.2
12.
31E−
050.
330.
001
1.35
− 1
.70E−
05−
0.2
4
Educ
atio
n of
hea
d (s
choo
ling
year
s)−
0.0
01−
0.2
7−
0.0
09−
0.5
9−
0.0
01−
0.2
60.
001
0.40
0.01
10.
630.
006**
*2.
73
Gen
der o
f hea
d (fe
mal
e =
1)
− 0
.061
− 1
.03
0.20
70.
32−
0.0
60−
1.0
00.
068
1.14
0.52
61.
410.
035
0.63
Hea
d is
sin
gle
0.26
7**2.
31−
0.2
85−
0.3
10.
269**
2.32
0.22
0*1.
88−
0.3
94−
0.3
5−
0.2
09−
1.4
3
Hea
d is
wid
owed
/div
orce
d−
0.4
26**
*−
2.8
0−
0.4
71−
0.5
6−
0.4
25**
*−
2.7
9−
0.4
16**
*−
2.7
00.
101
0.13
0.00
10.
01
Hea
d w
orks
off-
farm
− 2
.37E−
07**
*−
4.4
7−
2.1
0E−
07−
0.8
9−
2.4
1E−
07**
*−
4.5
5−
1.0
1E−
07**
− 1
.97
4.69
E−07
*1.
86−
3.4
0E−
09−
0.0
8
Hou
seho
ld s
ize
− 0
.001
− 0
.04
− 0
.001
− 0
.09
− 0
.001
− 0
.06
− 0
.001
− 0
.37
− 0
.004
− 0
.22
0.00
20.
79
Dep
ende
nt ra
tio−
0.0
07−
0.9
1−
0.0
32−
0.4
4−
0.0
07−
0.9
3−
0.0
02−
0.2
30.
040
0.71
− 0
.020
**−
2.4
4
Nor
th c
entr
al d
umm
y0.
098**
*2.
460.
199
0.85
0.09
5**2.
390.
090**
2.25
0.01
90.
070.
026
0.65
Nor
thea
st d
umm
y0.
312**
*6.
550.
404**
2.08
0.31
2***
6.55
0.25
5***
5.29
− 0
.350
− 0
.84
− 0
.403
***
− 6
.79
Sout
heas
t dum
my
0.27
2***
5.43
0.21
61.
170.
271**
*5.
410.
127**
2.52
− 1
.114
**−
2.1
4−
0.3
09**
*−
5.4
8
Sout
h-so
uth
dum
my
− 0
.005
− 0
.10
− 0
.314
8−
1.1
8−
0.0
06−
0.1
2−
0.0
94*
− 1
.77
− 0
.611
− 1
.45
− 0
.007
− 0
.14
Sout
h w
est d
umm
y−
0.1
44**
*−
2.9
70.
1574
0.75
− 0
.151
2***
− 3
.12
− 0
.112
2**−
2.3
20.
249
0.77
0.16
7***
3.97
Cons
tant
1.8**
*10
.38
2.78
141.
151.
8035
***
10.4
02.
1319
***
12.0
7−
0.8
15−
0.6
71.
736**
*10
.30
LR C
hi s
q. (3
6)29
5.49
293.
5819
2.87
241.
06
Log
likel
ihoo
d−
344
6.63
− 3
447.
58−
273
3.12
− 2
32.3
6
Page 16 of 22Kehinde et al. Agric & Food Secur (2021) 10:25
risks by the farmers, which in turn ensures more food options for the household and income through market participation from the surpluses. This result agrees with the findings of Adjimoti and Kwadzo [1] and Mango et al. [38] who found that households that are into crop diver-sification have a greater tendency to be food-secure par-ticularly those growing cereals, as well as, root and tuber crops. Results in Table 8 show that the extent of food insecurity reduces with the cultivation of only maize on the farmland, this can be explained by the fact that the farmers can plant two to three rounds of arable crops in a successive manner before the year runs out, hence, get-ting more income to cushion the effect of food insecurity.
Women’s empowerment and severity of household food insecurityThe IV Poisson and ZIP—Count (Poisson part) of the estimated ZIP model provide evidence with respect to the influence of various women’s empowerment-related variables on the severity of household food insecurity. Results in relation to the influence of women’s empow-erment characteristics—gender parity and female achievement in the asset, group membership, produc-tive decisions, income control, credit, and workload are found in Table 8. Two and Six out of the seven women’s empowerment variables were statistically significant in the IV Poisson and ZIP count (severity of food insecurity) models, respectively.
The evidence in respect to female achievement in group membership, income control, and workload shows that the coefficients of these variables are significantly nega-tive at 1%, 5%, and 10% levels, respectively. These indicate that the achievement of females in group membership, income control, and workload reduces the extent of food insecurity among the farming households in Nigeria. The result agrees with the findings of Sraboni et al. [56] and Tanankem et al. [58] who found that increases in women’s empowerment are positively linked with calorie availability and dietary diversity at the household level.
On the contrary, the results in Table 8 further reveal that the female achievement in the productive decisions was not significant under IV Poisson but was significant and positive at the 10% level under ZIP. This result does not follow a priori expectation as it suggests that female achievement in productive decision increases the extent of food insecurity among the smallholder farmers in Nigeria. On the other hand, gender parity and female achievement in credit were negatively and positively significant at 1% levels, respectively, under IV Poisson. This shows that the extent of food insecurity among the farming households declines with gender parity and rises with female achievement in credit. This implies that the level of food insecurity reduces when women are equally
empowered to the men in their households vis-à-vis 5DE, however, the pressure to pay the loan may put a strain on the women’s ability to provide for home consump-tion, thereby impairing the household food security level. These findings, however, contradict that of Adjimoti and Kwadzo [1] who found that households that have access to credit are more likely to be food-secure than their counterparts without credit access.
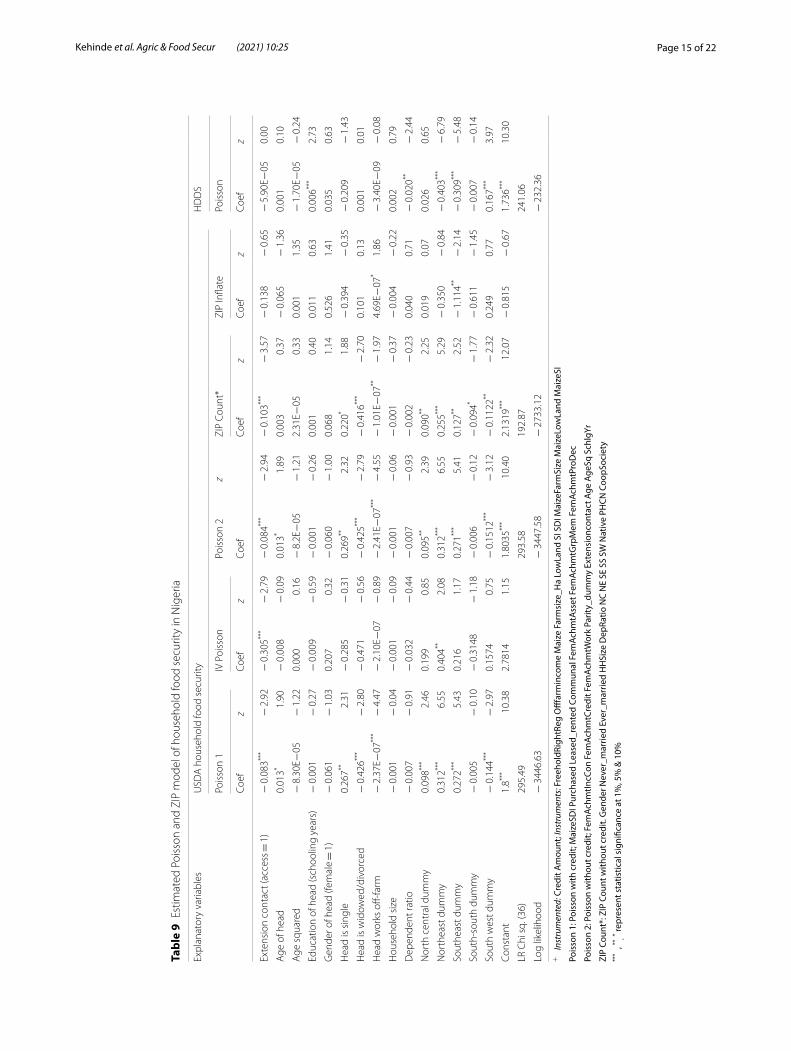
Socio‑demographic factors and severity of household food insecurityThe IV Poisson and ZIP—Count (Poisson part) of the estimated ZIP model provide evidence with respect to the influence of various socio-demographic variables on the severity of household food insecurity. Results in respect to the influence of socio-demographic character-istics—access to extension services, age, education, gen-der, a dummy variable for a household head that is single, off-farm activities, as well as dummies for north central, northeast, southeast, south-south, and southwest GPZs are found in Table 9. Two and Nine out of the 15 socio-demographic variables were associated with significant coefficients in the IV Poisson and ZIP count (severity of food insecurity) models, respectively.
The coefficient of access to extension contact was nega-tive and significant at a 1% level across the two models. This shows that the extent of food insecurity among farming households declines with having access to extension services. This implies that access to extension services will give greater opportunity to farmers in hav-ing access to improved input and crop production tech-niques that will later translate into larger farm output. The result agrees with the findings of Kehinde et al. [33] who found that access to extension services is inversely related to severity of food insecurity.
However, the coefficient of the household head that is single is positive and significant at 10%. This shows that being a single household head will increase the extent of food insecurity among the farming household in the study area. The evidence with respect to household head that is widowed/divorced is significantly negative at a 1% level, though we expect this variable to be positive because the high dependency ratio is severe mainly on the head who are either widowed or unmarried.
The evidence with respect to the household head that works off-farm shows that the coefficient of the house-hold head that works off-farm is significantly negative at the 5% level. This shows that the extent of food inse-curity reduces when a household head participates in an off-farm activity, indicating that cash earnings from off-farm activities increase the households’ ability to with-stand the extent of food insecurity. Farming households are therefore encouraged to engage in multiple livelihood
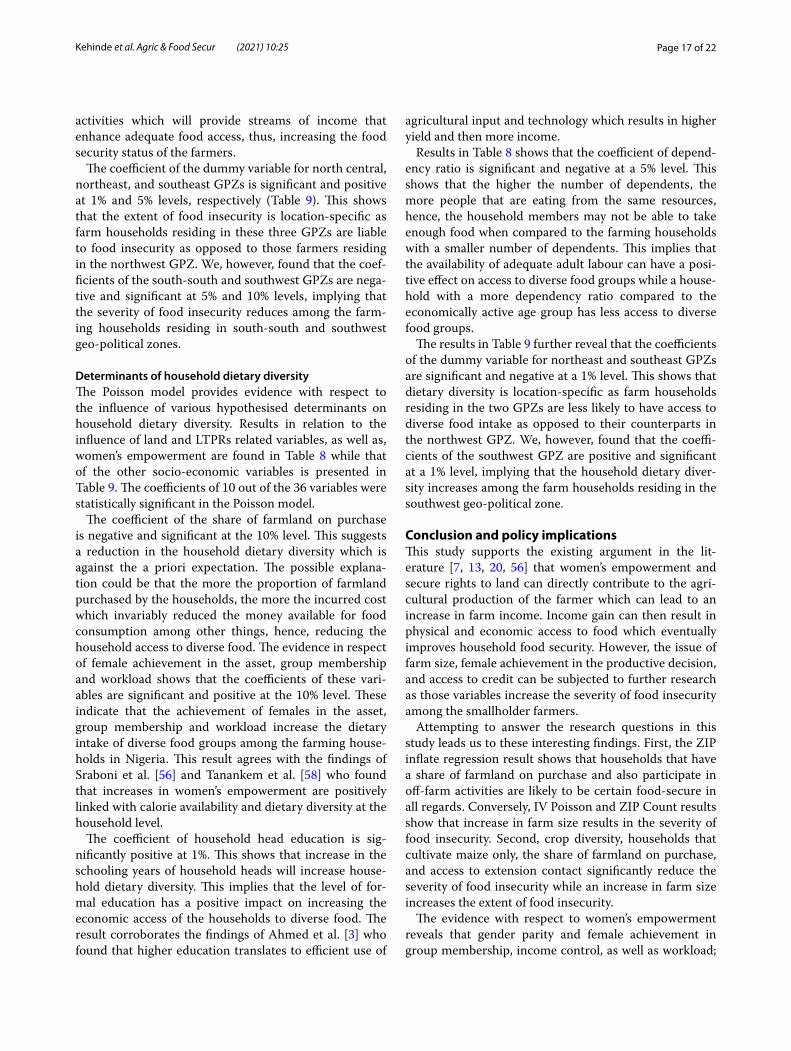
Page 17 of 22Kehinde et al. Agric & Food Secur (2021) 10:25
activities which will provide streams of income that enhance adequate food access, thus, increasing the food security status of the farmers.
The coefficient of the dummy variable for north central, northeast, and southeast GPZs is significant and positive at 1% and 5% levels, respectively (Table 9). This shows that the extent of food insecurity is location-specific as farm households residing in these three GPZs are liable to food insecurity as opposed to those farmers residing in the northwest GPZ. We, however, found that the coef-ficients of the south-south and southwest GPZs are nega-tive and significant at 5% and 10% levels, implying that the severity of food insecurity reduces among the farm-ing households residing in south-south and southwest geo-political zones.
Determinants of household dietary diversityThe Poisson model provides evidence with respect to the influence of various hypothesised determinants on household dietary diversity. Results in relation to the influence of land and LTPRs related variables, as well as, women’s empowerment are found in Table 8 while that of the other socio-economic variables is presented in Table 9. The coefficients of 10 out of the 36 variables were statistically significant in the Poisson model.
The coefficient of the share of farmland on purchase is negative and significant at the 10% level. This suggests a reduction in the household dietary diversity which is against the a priori expectation. The possible explana-tion could be that the more the proportion of farmland purchased by the households, the more the incurred cost which invariably reduced the money available for food consumption among other things, hence, reducing the household access to diverse food. The evidence in respect of female achievement in the asset, group membership and workload shows that the coefficients of these vari-ables are significant and positive at the 10% level. These indicate that the achievement of females in the asset, group membership and workload increase the dietary intake of diverse food groups among the farming house-holds in Nigeria. This result agrees with the findings of Sraboni et al. [56] and Tanankem et al. [58] who found that increases in women’s empowerment are positively linked with calorie availability and dietary diversity at the household level.
The coefficient of household head education is sig-nificantly positive at 1%. This shows that increase in the schooling years of household heads will increase house-hold dietary diversity. This implies that the level of for-mal education has a positive impact on increasing the economic access of the households to diverse food. The result corroborates the findings of Ahmed et al. [3] who found that higher education translates to efficient use of
agricultural input and technology which results in higher yield and then more income.
Results in Table 8 shows that the coefficient of depend-ency ratio is significant and negative at a 5% level. This shows that the higher the number of dependents, the more people that are eating from the same resources, hence, the household members may not be able to take enough food when compared to the farming households with a smaller number of dependents. This implies that the availability of adequate adult labour can have a posi-tive effect on access to diverse food groups while a house-hold with a more dependency ratio compared to the economically active age group has less access to diverse food groups.
The results in Table 9 further reveal that the coefficients of the dummy variable for northeast and southeast GPZs are significant and negative at a 1% level. This shows that dietary diversity is location-specific as farm households residing in the two GPZs are less likely to have access to diverse food intake as opposed to their counterparts in the northwest GPZ. We, however, found that the coeffi-cients of the southwest GPZ are positive and significant at a 1% level, implying that the household dietary diver-sity increases among the farm households residing in the southwest geo-political zone.
Conclusion and policy implicationsThis study supports the existing argument in the lit-erature [7, 13, 20, 56] that women’s empowerment and secure rights to land can directly contribute to the agri-cultural production of the farmer which can lead to an increase in farm income. Income gain can then result in physical and economic access to food which eventually improves household food security. However, the issue of farm size, female achievement in the productive decision, and access to credit can be subjected to further research as those variables increase the severity of food insecurity among the smallholder farmers.
Attempting to answer the research questions in this study leads us to these interesting findings. First, the ZIP inflate regression result shows that households that have a share of farmland on purchase and also participate in off-farm activities are likely to be certain food-secure in all regards. Conversely, IV Poisson and ZIP Count results show that increase in farm size results in the severity of food insecurity. Second, crop diversity, households that cultivate maize only, the share of farmland on purchase, and access to extension contact significantly reduce the severity of food insecurity while an increase in farm size increases the extent of food insecurity.
The evidence with respect to women’s empowerment reveals that gender parity and female achievement in group membership, income control, as well as workload;
Page 18 of 22Kehinde et al. Agric & Food Secur (2021) 10:25
reduce the severity of food insecurity among the farm-ing households in Nigeria. We, however, discover that the female achievement in the productive decision and credit increases the severity of food insecurity among the small-holder farmers. Third, the analyses reveal that education of the household head, female achievement in the asset; group membership, and workload are the major factors that positively influenced household dietary diversity.
Arising from the abovementioned empirical findings, the paper concludes that adoption of climate-smart practices, such as improved agronomic practices, water management, tillage and residue management, inte-grated nutrient management, and agroforestry, will help both the maize and rice farmers to overcome the issue of marginal farmlands. Government and relevant agencies
should intensify the promotion of crop and livelihood diversification among the smallholder farmers especially to those currently less diversified to improve their food security status. In the same vein, the extension agents should be adequately funded and trained for prospective professional attributes to allow for effective extension services delivery. Finally, policies targeted at improving women’s access to productive resources should be put in place to enhance the household food security status in Nigeria.
AppendixSee Tables 10, 11, 12
Table 10 The 18-households food security questions as adapted. Source: USDA Guide (2000)S/N Questions/statements N S O
1 We were worried our food would run out before we got money to buy more
2 The food we bought just didn’t last and we didn’t have money to get more
3 We couldn’t afford to eat balanced diet
4* We relied on only a few kinds of low-cost food to feed the children
5* We couldn’t feed the chil-dren a balanced meal
6* The children were not eating enough because we just couldn’t afford enough food
7 Did some adults ever have to eat less than you felt you should eat because there wasn’t enough money to buy food?
Yes() No()
8 How often did this happen in the last 12 months?
9 Did some adults ever had to eat less than you felt you should eat because there wasn’t enough money for food
Yes () No()
10 Were some members ever hungry but didn’t eat because you couldn’t afford enough food?
Yes () No()
11 Did some members ever lose weight within the last 12 months because there wasn’t enough food?
Yes () No()
Page 19 of 22Kehinde et al. Agric & Food Secur (2021) 10:25
N Never, S Sometimes, O Often* Not applicable to households without children
Table 10 (continued)
S/N Questions/statements N S O
12 Were there ever a time within the last 12 months that some adults could not eat for a whole day because there wasn’t enough money to buy food
Yes () No()
13 How often did this happen in the last 12 months?
14* Did you ever have to cut the size of some of the children’s meals within the last 12 months because there wasn’t enough money to buy food?
Yes () No()
15* Did any of the children ever skip meals because there wasn’t enough money for food within the last 12 months because there wasn’t enough money to buy food?
Yes () No()
16* How often did this happen in the last 12 months?
17* In the last 12 months, were the children ever hungry but you just couldn’t afford more food?
Yes () No()
18* In the last 12 months, did any of the children ever not eat for a whole day because there wasn’t enough money for food?
Yes () No()
Table 11 USDA food security classification
USDA (2016)
Status Number of affirmative responses
Households with children Households without children
High food security 0–2 0–2
Marginal food security 3–7 3–5
Low food security 8–12 6–8
Very low food security 13–18 9–10
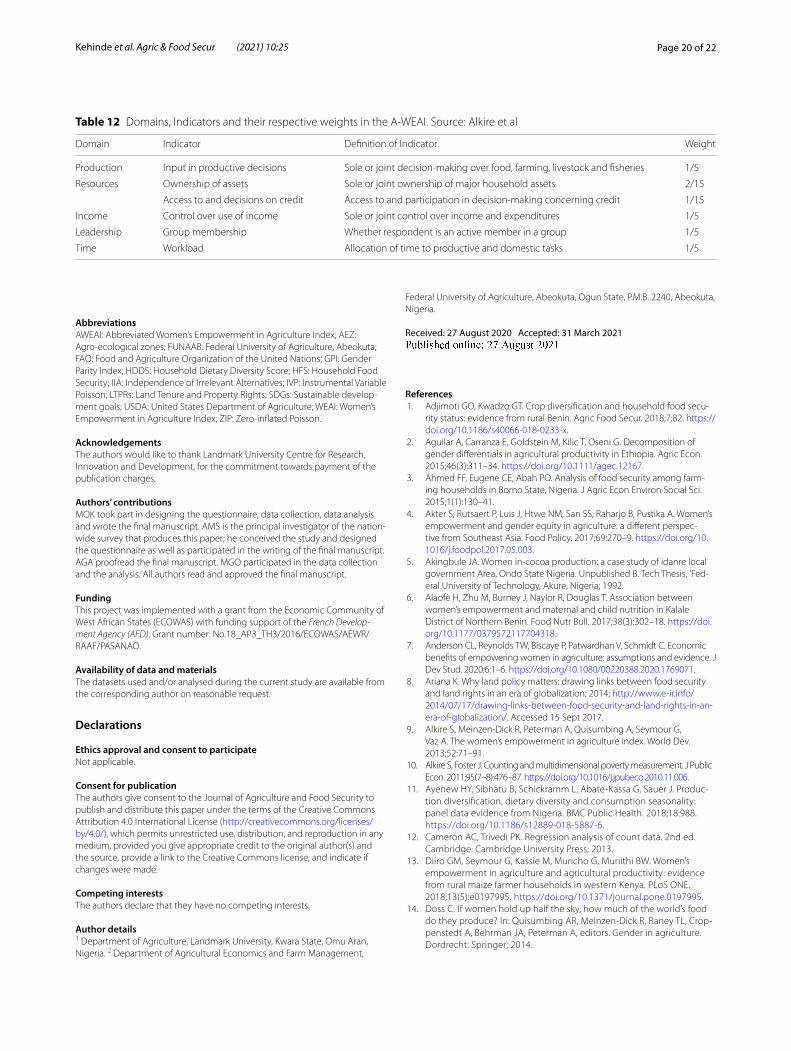
Page 20 of 22Kehinde et al. Agric & Food Secur (2021) 10:25
AbbreviationsAWEAI: Abbreviated Women’s Empowerment in Agriculture Index; AEZ: Agro-ecological zones; FUNAAB: Federal University of Agriculture, Abeokuta; FAO: Food and Agriculture Organization of the United Nations; GPI: Gender Parity Index; HDDS: Household Dietary Diversity Score; HFS: Household Food Security; IIA: Independence of Irrelevant Alternatives; IVP: Instrumental Variable Poisson; LTPRs: Land Tenure and Property Rights; SDGs: Sustainable develop-ment goals; USDA: United States Department of Agriculture; WEAI: Women’s Empowerment in Agriculture Index; ZIP: Zero-inflated Poisson.
AcknowledgementsThe authors would like to thank Landmark University Centre for Research, Innovation and Development, for the commitment towards payment of the publication charges.
Authors’ contributionsMOK took part in designing the questionnaire, data collection, data analysis and wrote the final manuscript. AMS is the principal investigator of the nation-wide survey that produces this paper; he conceived the study and designed the questionnaire as well as participated in the writing of the final manuscript. AGA proofread the final manuscript. MGO participated in the data collection and the analysis. All authors read and approved the final manuscript.
FundingThis project was implemented with a grant from the Economic Community of West African States (ECOWAS) with funding support of the French Develop-ment Agency (AFD). Grant number: No.18_AP3_TH3/2016/ECOWAS/AEWR/RAAF/PASANAO.
Availability of data and materialsThe datasets used and/or analysed during the current study are available from the corresponding author on reasonable request.
Declarations
Ethics approval and consent to participateNot applicable.
Consent for publicationThe authors give consent to the Journal of Agriculture and Food Security to publish and distribute this paper under the terms of the Creative Commons Attribution 4.0 International License (http:// creat iveco mmons. org/ licen ses/ by/4. 0/), which permits unrestricted use, distribution, and reproduction in any medium, provided you give appropriate credit to the original author(s) and the source, provide a link to the Creative Commons license, and indicate if changes were made.
Competing interestsThe authors declare that they have no competing interests.
Author details1 Department of Agriculture, Landmark University, Kwara State, Omu Aran, Nigeria. 2 Department of Agricultural Economics and Farm Management,
Federal University of Agriculture, Abeokuta, Ogun State, P.M.B. 2240, Abeokuta, Nigeria.
Received: 27 August 2020 Accepted: 31 March 2021
References 1. Adjimoti GO, Kwadzo GT. Crop diversification and household food secu-
rity status: evidence from rural Benin. Agric Food Secur. 2018;7:82. https:// doi. org/ 10. 1186/ s40066- 018- 0233-x.
2. Aguilar A, Carranza E, Goldstein M, Kilic T, Oseni G. Decomposition of gender differentials in agricultural productivity in Ethiopia. Agric Econ. 2015;46(3):311–34. https:// doi. org/ 10. 1111/ agec. 12167.
3. Ahmed FF, Eugene CE, Abah PO. Analysis of food security among farm-ing households in Borno State, Nigeria. J Agric Econ Environ Social Sci. 2015;1(1):130–41.
4. Akter S, Rutsaert P, Luis J, Htwe NM, San SS, Raharjo B, Pustika A. Women’s empowerment and gender equity in agriculture: a different perspec-tive from Southeast Asia. Food Policy. 2017;69:270–9. https:// doi. org/ 10. 1016/j. foodp ol. 2017. 05. 003.
5. Akingbule JA. Women in-cocoa production: a case study of idanre local government Area, Ondo State Nigeria. Unpublished B. Tech Thesis, ’Fed-eral University of Technology, Akure, Nigeria; 1992.
6. Alaofè H, Zhu M, Burney J, Naylor R, Douglas T. Association between women’s empowerment and maternal and child nutrition in Kalale District of Northern Benin. Food Nutr Bull. 2017;38(3):302–18. https:// doi. org/ 10. 1177/ 03795 72117 704318.
7. Anderson CL, Reynolds TW, Biscaye P, Patwardhan V, Schmidt C. Economic benefits of empowering women in agriculture: assumptions and evidence. J Dev Stud. 2020;6:1–6. https:// doi. org/ 10. 1080/ 00220 388. 2020. 17690 71.
8. Ariana K. Why land policy matters: drawing links between food security and land rights in an era of globalization; 2014; http:// www.e- ir. info/ 2014/ 07/ 17/ drawi ng- links- betwe en- food- secur ity- and- land- rights- in- an- era- of- globa lizat ion/. Accessed 15 Sept 2017.
9. Alkire S, Meinzen-Dick R, Peterman A, Quisumbing A, Seymour G, Vaz A. The women’s empowerment in agriculture index. World Dev. 2013;52:71–91.
10. Alkire S, Foster J. Counting and multidimensional poverty measurement. J Public Econ. 2011;95(7–8):476–87. https:// doi. org/ 10. 1016/j. jpube co. 2010. 11. 006.
11. Ayenew HY, Sibhatu B, Schickramm L, Abate-Kassa G, Sauer J. Produc-tion diversification, dietary diversity and consumption seasonality: panel data evidence from Nigeria. BMC Public Health. 2018;18:988. https:// doi. org/ 10. 1186/ s12889- 018- 5887-6.
12. Cameron AC, Trivedi PK. Regression analysis of count data. 2nd ed. Cambridge: Cambridge University Press; 2013.
13. Diiro GM, Seymour G, Kassie M, Muricho G, Muriithi BW. Women’s empowerment in agriculture and agricultural productivity: evidence from rural maize farmer households in western Kenya. PLoS ONE. 2018;13(5):e0197995. https:// doi. org/ 10. 1371/ journ al. pone. 01979 95.
14. Doss C. If women hold up half the sky, how much of the world’s food do they produce? In: Quisumbing AR, Meinzen-Dick R, Raney TL, Crop-penstedt A, Behrman JA, Peterman A, editors. Gender in agriculture. Dordrecht: Springer; 2014.
Table 12 Domains, Indicators and their respective weights in the A-WEAI. Source: Alkire et al
Domain Indicator Definition of Indicator Weight
Production Input in productive decisions Sole or joint decision-making over food, farming, livestock and fisheries 1/5
Resources Ownership of assets Sole or joint ownership of major household assets 2/15
Access to and decisions on credit Access to and participation in decision-making concerning credit 1/15
Income Control over use of income Sole or joint control over income and expenditures 1/5
Leadership Group membership Whether respondent is an active member in a group 1/5
Time Workload Allocation of time to productive and domestic tasks 1/5
Page 21 of 22Kehinde et al. Agric & Food Secur (2021) 10:25
15. Doss C. The effects of intrahousehold property ownership on expendi-ture patterns in Ghana. J Afr Econ. 2006;15(1):149–80.
16. Doss CR, Morris ML. How does gender affect the adoption of agricul-tural innovations? The case of improved maize technology in Ghana. Agric Econ. 2000;25(1):27–39.
17. Drewnowski A, Ahlstrom Henderson S, Driscoll A, Rolls B. The dietary variety score: assessing dietary quality in healthy young and older adults. J Am Diet Assoc. 1997;97:266–71.
18. Duflo E. Women Empowerment and Economic Development. J Econ Literature. 2012;50(4):1051–79.
19. Duflo E, Udry C. Intra-household resource allocation in Cote d’Ivoire: social norms, separate accounts, and consumption choices. No. w10498. Cambridge: National Bureau of Economic Research; 2004.
20. Espinosa DK. Brief: Africa: secure land tenure: food security depends on it; 2020. http:// www. focus onland. com/ fola/ en/ count ries/ brief- africa- secure- land- tenure- food- secur ity- depen ds- on- it/. Accessed 9 Dec, 2020.
21. Eze CC, Konkwo SO, Orebiyi JS. Kadiri FA. Land tenure system, farm size, innovation and agricultural productivity in South-East Nigeria. In: Contributed paper for the agricultural economics society’s 85th annual conference held at University of Warwick 18th–20th April, 2011.
22. FAO. Guidelines for measuring household and individual dietary diver-sity, Food and Agriculture Organization of the United Nations (FAO) the Food and Nutrition Technical Assistance (FANTA) Project, Rome, Italy. 2007;
23. FAO. The State of food and agriculture. Rome: FAO; 2011. http:// www. fao. org/ docrep/ 013/ i2050e/ i2050 e00. htm. Accessed 28 Aug 2019.
24. Fapojuwo OE, Ogunnaike MG, Shittu AM, Kehinde MO, Oyawole FP. Gender gaps and adoption of climate smart practices among cereal farm households in Nigeria. Niger J Agric Econ. 2018;8(1):38–49.
25. Feder G, Feeny D. Land tenure and property rights: theory and implica-tions for development policy. World Bank Econ Rev. 1991;5(1):135–53. https:// doi. org/ 10. 1093/ wber/5. 1. 135.
26. Folbre N. The care economy in Africa: subsistence production and unpaid care. J Afr Econ. 2013;23(1):i128–56. https:// doi. org/ 10. 1093/ jae/ ejt026.
27. Greene WH. Econometric analysis. 7th ed. Hoboken: Prentice Hall; 2008. 28. Gupta S, Vemireddy V, Singh D, Pingali P. Adapting the women’s empow-
erment in agriculture index to specific country context: insights and critiques from fieldwork in India. Glob Food Sec. 2019;1(23):245–55.
29. Harper S, Zeller D, Hauzer M, Pauly D, Sumaila UR. Women and fisheries: contribu-tion to food security and local economies. Mar Policy. 2013;39:56–63.
30. Hausman JA. Specification tests in econometrics. Econometric J Econo-metric Soc. 1978;46:1251–71.
31. Hoddinott J, Haddad LJ. Does female income share influence house-hold expenditures? Evidence from CoÃte d’Ivoire. Oxf Bull Econ Stat. 1995;57(1):77–96. https:// doi. org/ 10. 1111/j. 1468- 0084. 1995. tb000 28.x.
32. Kassie M, Ndiritu SW, Stage J. What determines gender inequality in household food security in Kenya? Application of exogenous switching treatment regression. World Dev. 2014;56:153–71. https:// doi. org/ 10. 1016/j. world dev. 2013. 10. 025.
33. Kehinde MO, Shittu AM, Adewuyi SA, Osunsina IOO, Adeyonu AG. Land tenure and property rights and household food security among rice farmers in Northern Nigeria. Heliyon. 2021;7(2):e06110. https:// doi. org/ 10. 1016/j. heliy on. 2021. e06110.
34. Kilic T, Palacios-LoÂpez A, Goldstein M. Caught in a productivity trap: A distributional perspective on gender differences in Malawian agriculture. World Dev. 2015;70:416–63. https:// doi. org/ 10. 1016/j. world dev. 2014. 06. 017.
35. Laws of the Federation of Nigeria. Land Use Act, Chapter 5, Laws of the Federation of Nigeria; 2004. http:// lawni geria. com/ Lawso ftheF edera tion/ LAND- USE- ACT. html. Accessed 29 Nov 2016.
36. Malapit HJ, Kovarik C, Sproule K, Meinzen-Dick RS, Quisumbing AR. Instructional guide on the abbreviated Women’s Empowerment in Agriculture Index (A-WEAI). Washington, D.C.: International Food Policy Research Institute (IFPRI); 2020. http:// ebrary. ifpri. org/ cdm/ ref/ colle ction/ p1573 8coll2/ id/ 129719. Accessed 20 Dec 2020.
37. Manda DK, Mwakubo S. Gender and economic development in Africa: An overview. J Afr Econ. 2014;23(1):i4–17. https:// doi. org/ 10. 1093/ jae/ ejt021.
38. Mango N, Makate C, Mapemba L, Sopo M. The role of crop diversifcation in improving household food security in central Malawi Nelson. Agric Food Secur. 2018. https:// doi. org/ 10. 1186/ s40066- 018- 0160-x.
39. NBS. Annual Abstract of Statistics. Nigerian Bureau of Statistics. Federal Republic of Nigeria; 2016.
40. Obayelu OA, Osho FR. How diverse are the diets of low-income urban households in Nigeria? J Agric Food Res. 2020;2:100018. https:// doi. org/ 10. 1016/j. jafr. 2019. 100018.
41. Obayelu OA, Adepoju AO, Omirin O. Does human capital explain food insecurity status of rural households or vice-versa? Rev Agric Appl Econ. 2019;XXII(1):91–7. https:// doi. org/ 10. 15414/ raae. 2019. 22. 01. 91- 97.
42. Ogundari K. Categorizing households into different food security states in Nigeria: the socioeconomic and demographic determinants. Agric Food Econ. 2017;5(8):1–20. https:// doi. org/ 10. 1186/ s40100- 017- 0076-y.
43. Ogunnaike MG, Kehinde MO, Shittu AM. Effect of gender empowerment in agriculture on food security of farm households in Ogun State Nigeria. Ife J Agric. 2019;31(2):59–71.
44. Onyeji GN, Sanusi RA. Dietary diversity of reproductive age women in three South-Eastern States of Nigeria. Afr J Food Agric Nutr Dev. 2020;20(2):15490–508. https:// doi. org/ 10. 18697/ ajfand. 90. 18275.
45. Palacios-Lopez A, Christiaensen L, Kilic T. How much of the labor in African agriculture is provided by women? Food Policy. 2017;67:52–63. https:// doi. org/ 10. 1016/j. foodp ol. 2016. 09. 017.
46. Perez C, Jones EM, Kristjanson P, Cramer L, Thornton PK, Forch W, Barahona C. How resilient are farming households and communities to a changing climate in Africa? A gender-based perspective. Glob Environ Chang. 2015;34:95–107. https:// doi. org/ 10. 1016/j. gloen vcha. 2015. 06. 003.
47. Peterman A, Behrman J, Quisumbing A. A review of empirical evidence on gender differences in non-land agricultural inputs, technology, and services in developing countries. In: IFPRI Discussion Paper 975. Washing-ton, DC: International Food Policy Research Institute; 2010
48. Roth M. Land tenure and food security emerging implications for USG Policies and programming with contributions from Diana Fletschner /LTPRs and Food Security/LandLinks.html; 2013
49. Roth M, McCarthy N. USAID issue brief: land tenure, property rights, and economic growth in rural areas; 2013.
50. Ruel M. Is dietary diversity an indicator of food security or dietary quality? A review of measurement issues and research needs. In: IFPRI FCND discussion paper 140, November 2002.
51. Shafiq A, Hussain A, Asif M, Hwang J, Jameel A, Kanwel S. The effect of women’s empowerment on child nutritional status in Pakistan. Int J Environ Res Public Health. 2019;16(22):4499. https:// doi. org/ 10. 3390/ ijerp h1622 4499.
52. Shittu AM, Kehinde MO, Ogunnaike MG, Oyawole FP. Effects of land tenure and property rights on farm households’ willingness to accept incentives to invest in measures to combat land degradation in Nigeria. Agric Resour Econ Rev. 2018;47(2):357–87. https:// doi. org/ 10. 1017/ age. 2018. 14.
53. Shiwakoti RD, Devkota MD, Paudel R. Women’s empowerment and nutri-tional status of their children: a community-based study from villages of Bhaktapur District, Nepal. Univ J Public Health. 2017;5(1):8–16. https:// doi. org/ 10. 13189/ ujph. 2017. 050102.
54. Siddhanta A, Chattopadhyay A. Role of women’s empowerment in determining child stunting in Eastern India and Bangladesh. Soc Sci Spectr. 2017;3(1):38–51.
55. Sraboni E, Quisumbing AR, Ahmed AU. The women’s empowerment in agri-culture index: results from the 2011–2012 Bangladesh Integrated Household Survey. Project Report submitted to the US Agency for International Develop-ment. International Food Policy Research Institute, Dhaka, Bangladesh. 2013. http:// ebrary. ifpri. org/ cdm/ ref/ colle ction/ p1573 8coll2/ id/ 127504.
56. Sraboni E, Malapit HL, Quisumbing AR, Ahmed AU. Women’s empower-ment in agriculture: what role for food security in Bangladesh? World Dev. 2014;61:11–52. https:// doi. org/ 10. 1016/j. world dev. 2014. 03. 025.
57. Swindale A, Bilinsky P. Household Dietary Diversity Score (HDDS) for measurement of household food access: indicator guide (v.2). Washing-ton, D.C.: FHI 360/FANTA. 2006;
58. Tanankem BV, Efobi, UR, Atata NS. Women Empowerment and Intra-Household Dietary Diversity in Nigeria. African Governance and Development Institute, Work-ing Paper WP/16/050. 2016
59. USDA Guide. Guide to Measuring Household Food Security, Revised 2000. U.S. Department of Agriculture, Food and Nutrition Service, Alexandria VA. March, 2000
60. UN Women Watch. Women, gender equality and climate change; 2009. http:// www. un. org/ women watch/ featu re/ clima te_ change/.

Page 22 of 22Kehinde et al. Agric & Food Secur (2021) 10:25
61. Wooldridge JM. Econometric analysis of cross section and panel data. Cambridge: MIT Press; 2002.
62. Wouterse F. The role of empowerment in agricultural production: evi-dence from rural households in Niger. J Dev Stud. 2017. https:// doi. org/ 10. 1080/ 00220 388. 2017. 14087 97.
63. Zereyesus YA. Women’s empowerment in agriculture and household level health in northern Ghana: a capability approach. J Int Dev. 2017;29:899–918. https:// doi. org/ 10. 1002/ jid. 3307.
Publisher’s NoteSpringer Nature remains neutral with regard to jurisdictional claims in pub-lished maps and institutional affiliations.