Embed Size (px)
Citation preview

www.snhy.com
STIFEL CROSS SECTOR INSIGHT CONFERENCE
INVESTOR PRESENTATION
JUNE 13, 2018
© 2018 Sun Hydraulics Corporation
Wolfgang H. DangelPresident & CEO
Tricia L. FultonChief Financial Officer
www.snhy.com © 2018 Sun Hydraulics Corporation 2
Safe Harbor Statement
This presentation and oral statements made by management in connection herewith that are not historical facts are ”forward‐looking statements” within the meaning of
Section 21E of the Securities Exchange Act of 1934. Forward‐looking statements involve risks and uncertainties, and actual results may differ materially from those
expressed or implied by such statements. They include statements regarding the intent, belief or current expectations, estimates, vision or projections of Sun Hydraulics
Corporation (“Sun” or the “Company”), its directors or its officers about the Company and the industry in which it operates, and assumptions made by management, and
include among other items, (i) the Company’s strategies regarding growth, including its intention to develop new products and make acquisitions; (ii) the Company’s
financing plans; (iii) the Company’s expectations regarding our sales, expenses, gross margins and other results of operations; (iv) trends affecting the Company’s
financial condition or results of operations; (v) the Company’s ability to continue to control costs and to meet its liquidity and other financing needs; (vi) the declaration
and payment of dividends; (vii) the Company’s ability to respond to changes in customer demand domestically and internationally, including as a result of
standardization; and (viii) potential challenges relating to changes in and compliance with governmental laws and regulations affecting our U.S. and international
businesses. Although the Company believes that its expectations are based on reasonable assumptions, it can give no assurance that the anticipated results will occur.
Important factors that could cause the actual results to differ materially from those in the forward‐looking statements include, among other items, (i) the economic
cyclicality of the capital goods industry in general and the hydraulic valve and manifold industry in particular, which directly affect customer orders, lead times and sales
volume; (ii) fluctuations in global business conditions, including the impact of economic recessions in the U.S. and other parts of the world, (iii) conditions in the capital
markets, including the interest rate environment and the availability of capital; (iv) changes in the competitive marketplace that could affect the Company’s revenue
and/or costs, such as increased competition, lack of qualified engineering, marketing, management or other personnel, and increased labor and raw materials costs; (v)
risks related to the integration of the businesses of the Company and Enovation Controls; (vi) changes in technology or customer requirements, such as standardization
of the cavity into which screw‐in cartridge valves must fit, which could render the Company’s products or technologies noncompetitive or obsolete; (vii) new product
introductions, product sales mix and the geographic mix of sales nationally and internationally; and (viii) changes relating to the Company’s international sales, including
changes in regulatory requirements or tariffs, compliance with anti-corruption laws and trade laws, including export and import compliance, trade or currency
restrictions, fluctuations in exchange rates, and tax and collection issues. Further information relating to factors that could cause actual results to differ from those
anticipated is included but not limited to information under the headings Item 1. “Business,” Item 1A. “Risk Factors,” and Item 7. “Management’s Discussion and
Analysis of Financial Conditions and Results of Operations” in the Company’s Form 10‐K for the year ended December 31, 2017. The Company disclaims any intention
or obligation to update or revise forward‐looking statements, whether as a result of new information, future events or otherwise.
This presentation includes certain non-GAAP financial measures, which the Company believes are useful in evaluating our performance. You should not consider the
presentation of this additional information in isolation or as a substitute for results prepared in accordance with GAAP. The Company has provided reconciliations of
comparable GAAP to non-GAAP measures in tables found in the Supplemental Information portion of this presentation.

www.snhy.com © 2018 Sun Hydraulics Corporation 3
Global provider of innovative electronic control, display
and instrumentation solutions for recreational and off-
highway vehicles, stationary and power generation
equipment
Leading designer and manufacturer of high-performance
screw-in hydraulic cartridge valves, electro-hydraulics,
manifolds, integrated package solutions, and quick-release
hydraulics coupling solutions
Hydraulics Electronics
Founded: 1970 IPO: 1997 NASDAQ: SNHY
Market Capitalization $1.60 billion Common Shares Outstanding 31.6 million
Recent Price $50.40 Regular Annualized Dividend / Yield $0.36 / 0.71%
52 Week Range $40.82 - $70.83 Institutional Ownership 84.0%
Average trading Volume
(Trailing three months)147k Insider Ownership 10.0%
Source: Capital IQ as of June 1, 2018; Ownership as of latest filings
Growing Global Industrial Technology Leader

www.snhy.com © 2018 Sun Hydraulics Corporation 4
Vision 2025
ACHIEVE GLOBAL technology leadership IN THE
INDUSTRIAL GOODS SECTOR by 2025 WITH CRITICAL MASS
EXCEEDING $1B in sales
WHILE MAINTAINING superior profitability & financial strength.
DESIGNER AND MANUFACTURER OF INTELLIGENT SYSTEMS & CONTROLS

www.snhy.com © 2018 Sun Hydraulics Corporation 5
Megatrends Impacting Our Global Markets
Population
Growth
Urbanization &
EnvironmentProductivity &
EfficienciesAutomation Electrification &
DigitalizationEnergy Saving
Computing PowerSophistication of Safe
Machinery & EquipmentGlobalization
COMPREHEND THE THREATS & OPPORTUNITIES: ADJUST AND ALIGN
Global Needs Will Drive These Trends

www.snhy.com © 2018 Sun Hydraulics Corporation 6
High Growth, High Margin, M&A-Focused
Key Factors Driving Superior Growth and Margins
1. Leading technology positions in fast growing industrial sectors in hydraulics and intelligent controls
2. Portfolio of premium brands
3. Highly engineered product design and manufacturing capabilities
4. Global presence with “in the region, for the region” strategy
(1) Calculated as 2017 Revenue of $342.8MM divided by PF2016 Revenue of $275.3MM; PF2016 accounts for full year contribution of Enovation Controls acquisition that closed December 5, 2016
(2) See Supplemental Information for definition of Adjusted Operating Margin and reconciliation from GAAP and other disclaimers regarding non-GAAP information
(3) M&A growth driven by Electronics segment growth due to Enovation Controls acquisition
20%+Organic Revenue Growth (1)
2017
20%+Adj. Operating Margin (2)
2017
50%+M&A Revenue Growth (3)
2017

www.snhy.com © 2018 Sun Hydraulics Corporation 7
Company Overview• Privately-owned, Italy-based company that designs, manufactures and distributes a variety of quick-release hydraulic couplings for a
range of agricultural and industrial vehicles and machinery
Purchase Price• €430 million, or approximately $528(1) million, plus other charges and deductions as set forth in the Purchase Agreement, funded with
$175 million of cash and $358 million of debt
Strategic
Rationale
• Meets Long-Term Strategic Vision:
o Advances global technology leadership
o Contributes toward revenue goal of $1 billion by 2025
o Enhances superior profitability and cash flows
• Diversifies Sun:
o Strengthens end market positions in global agriculture, construction equipment, and industrial markets
o Broadens product offering and geographic footprint
o Adds manufacturing footprint in Europe
• Strengthens Technology Leadership
o Faster holds 80+ registered patents; continues to add new patents annually via strong R&D focus
o Innovative culture drives new product development
o Strong commercial and technical relationships with global OEMS
Status / Timeline• Share Purchase Agreement executed February 19th
• Closed April 5, 2018
Financial Metrics
• Revenue: 2017: $130 million(1) 2018: expecting 16%-16.5% growth
• EBITDA: 2017: ~$36 million(1) 2018: expecting ~27%-28%
• Expected Run-Rate Synergies: ~$7.5 million by 2022
(1) Faster Group’s 2017 financial results, euro converted to USD at 1.235
Acquisition of Faster Group

www.snhy.com © 2018 Sun Hydraulics Corporation 8
Smart Solutions For Demanding Applications
ELECTRONICS (~25%)HYDRAULICS (~75%)
Key Products
Brands
Key End Markets
2018 Revenue(1)$368-378MM
22.7% - 24.0% Margin
Sun designs and manufactures screw-in hydraulic cartridge valves, manifolds, and integrated fluid power packages and subsystem, while Faster is focused on
quick-release hydraulics coupling solutions.
Designs and manufactures sophisticated digital control solutions
Mobile, Industrial & Agriculture Applications Mobile, Industrial & Recreational Applications
$122-127MM
2018 Adjusted
Operating Margin(2)
(1) Guidance for 2018 as of May 7, 2018 (includes Faster since its April 5, 2018 acquisition)
(2) See Supplemental Information for definition of Adjusted Operating Income and Margin, reconciliation from GAAP and disclaimers regarding the use of non-GAAP financial measures

www.snhy.com © 2018 Sun Hydraulics Corporation 9
Strategic Execution
Evolving from best-in-class component supplier to an intelligent control system provider
De
gre
e o
fS
op
his
tic
ati
on
Path of Migration
TRADITIONAL COMPONENTS SMART COMPONENTS INTELLIGENT CONTROL SYSTEMS

www.snhy.com © 2018 Sun Hydraulics Corporation 10
$8 BTotal Hydraulic Valves Market
$2 BTotal Compact
Hydraulics
Addressable Market
Hydraulics Industry
Source: Schmitt Consulting Engineers
ADDRESSABLE MARKETS – HYDRAULICS
Automotive
$4 BTotal Couplings Market
$2 BTotal Quick Release
Couplings
Addressable Market
$25 BTotal Hydraulics Market
Material Handling
Construction
Specialized Vehicles
Marine / Offshore Factory Automation Packaging & Processing Machine Tools/Presses
Agriculture Renewable EnergyForestry Equipment

www.snhy.com © 2018 Sun Hydraulics Corporation 11
Evolving Hydraulics Product Offering to Address Hydraulics Market Demands
Increased productivity and performance
Improved safety and reliability
Shift to electrohydraulic actuation & tuning
Reduced noise, vibration and harshness
Environmental regulation
Zero leaks
Fast and convenient ways to repeatedly
connect/disconnect fluid lines
Cartridges Electro-Hydraulics
Integrated
PackagesManifolds
HYDRAULICS MARKET DRIVERSBROAD HYDRAULICS PRODUCT OFFERING
Couplings
MultiFaster

www.snhy.com © 2018 Sun Hydraulics Corporation 12
Most Complete Product Offering in Industry
Couplings
Casting Solutions
MultiFaster
Accessories & Ancillary Products
Gross Sales Contribution
Agriculture IndustrialConstruction
Full product range, leading player
High end products, leading player
Limited product offering, many niche applications
23%
48%
22%
7%

www.snhy.com © 2018 Sun Hydraulics Corporation 13
Global CVT* Hydraulics Customer Base
Loyal, long-standing channel partners growing globally, forging newrelationships
55 of 86 distributors located outside the U.S.
Strong technical capabilities in drive and control technology
40+ years40+ years 40+ years
20+ years 40+ years <10 years 40+ years
30+ years
30+ years 30+ years 20+ years
CVT HYDRAULICS DISTRIBUTORS(~80% OF HYDRAULICS SALES)
CVT HYDRAULICS OEMS(~20% OF HYDRAULICS SALES)
* Cartridge Valve Technology
www.snhy.com © 2018 Sun Hydraulics Corporation 14
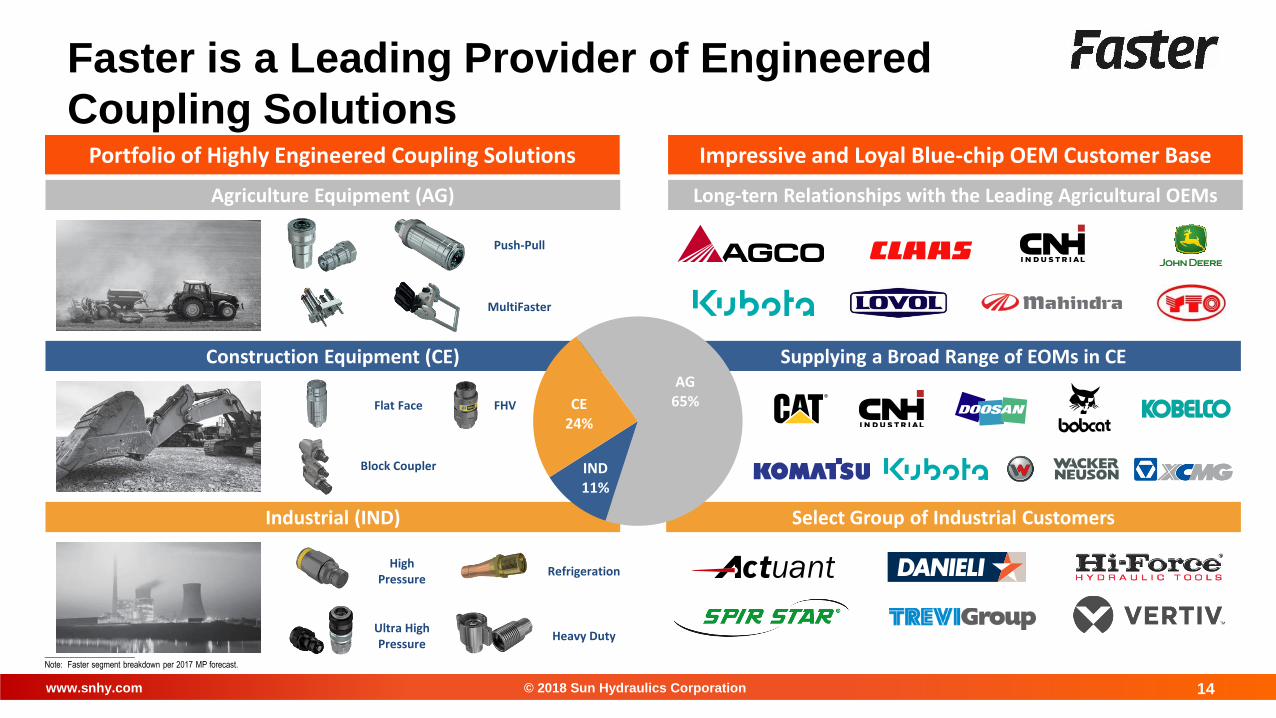
Faster is a Leading Provider of Engineered
Coupling Solutions
Supplying a Broad Range of EOMs in CE
Select Group of Industrial Customers
Push-Pull
MultiFaster
Flat Face
Block Coupler
FHV
RefrigerationHigh
Pressure
Ultra HighPressure
Heavy Duty
Portfolio of Highly Engineered Coupling Solutions Impressive and Loyal Blue-chip OEM Customer Base
Agriculture Equipment (AG)
Construction Equipment (CE)
Industrial (IND)
Long-tern Relationships with the Leading Agricultural OEMs
_____________________
Note: Faster segment breakdown per 2017 MP forecast.
AG65%
IND11%
CE24%

www.snhy.com © 2018 Sun Hydraulics Corporation 15
Military
Recreational MarineMotorcycles
Electronic Controls Industry
$3.5 BTotal Power Controls and
Vehicle TechnologiesMarket
$1.6 BRelevant Power Controls
and Vehicle Technologies Market
$900 MPower Controls
and Vehicle Technologies
Addressable Market
Source: Management EstimatesSnowmobiles
ADDRESSABLE MARKETS – ELECTRONICS
Construction Specialized Vehicles
Off-Road VehiclesPower Generation
Agriculture

www.snhy.com © 2018 Sun Hydraulics Corporation 16
Enhanced Position in Electronics through Enovation Controls Acquisition
Met Long-
Term Strategic
Vision
Diversifies Sun
Improve and expand technology offering
Offer integrated solution
Advance electrification and digitization offering across platform
New end markets in consumerand transportation
New customers include blue-chip names in powersport, off-highway and power gear
Provides entry to a highly specialized and fragmented market
Experienced engineering and technical team
Sales team with strong customer relationships and insight
Track record of new product development and technical innovation
Added Talent
Significant expansion in growing
electronics market
Strengthened new product
development capabilities
Earnings-accretive in 2017
Growth-accretive in 2017
ACQUISITION RATIONALE(1)
(1) Enovation Controls acquisition closed December 5, 2016

www.snhy.com © 2018 Sun Hydraulics Corporation 17
Creative Electronics Product Development
DEVICES /ACCESSORIESDISPLAYS & INFOTAINMENT PANELS & CONTROLLERS
Solving complex system challenges on aggressive timelines
with intense application expertise and customer focus

www.snhy.com © 2018 Sun Hydraulics Corporation 18
Products Specified on Platform Collaborative Engineering Process Deep relationships
Electronics Customer Base
Loyal, long-term partnerships with Global OEMs across multiple markets, which accounts for 90% of Electronics Revenue
VEHICLE TECHNOLOGIES (“VT”) POWER CONTROLS (“PC”)

© 2018 Sun Hydraulics Corporation
ACHIEVING OUR
VISION 2025
www.snhy.com © 2018 Sun Hydraulics Corporation 20
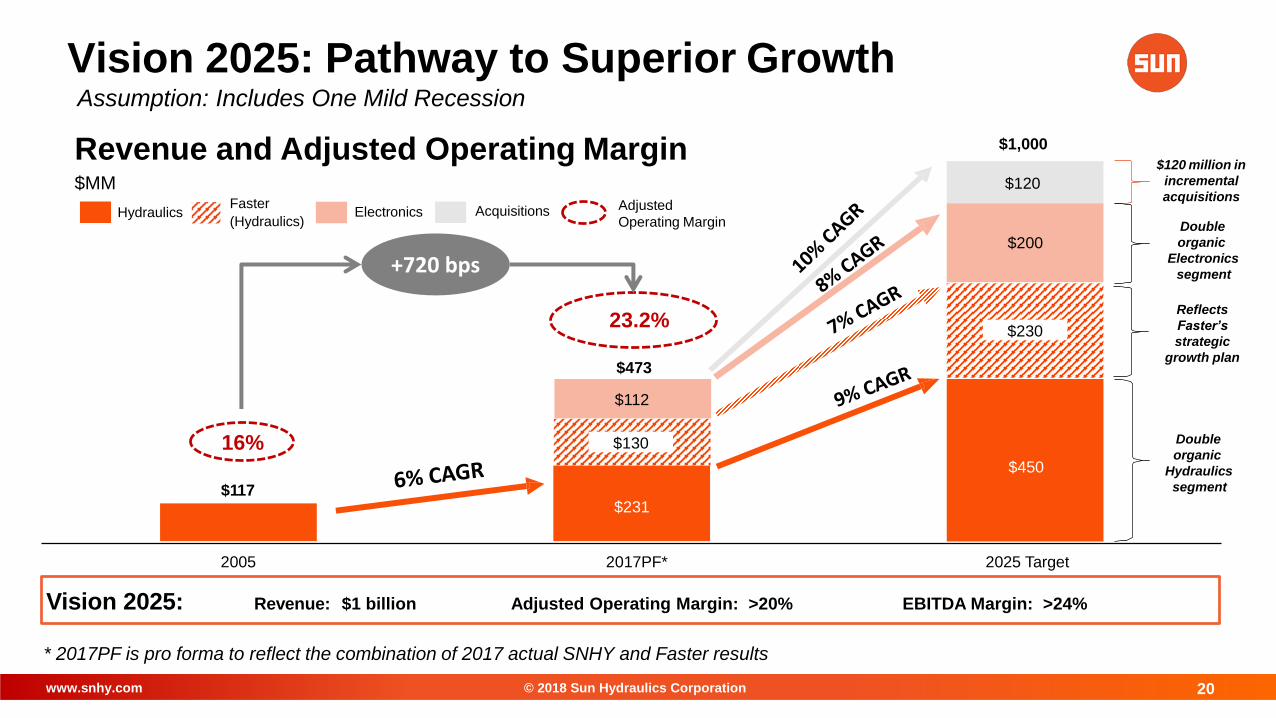
$117
$112
$200
$120
2005 2017PF* 2025 Target
Vision 2025: Pathway to Superior Growth
Revenue and Adjusted Operating Margin$MM
$1,000
$473
$231
$120 million in
incremental
acquisitions
Double
organic
Hydraulics
segment
Hydraulics Electronics Acquisitions
$450
16%
23.2%
Adjusted
Operating Margin
+720 bps
$130
$230
Double
organic
Electronics
segment
Reflects
Faster’s
strategic
growth plan
Faster
(Hydraulics)
Vision 2025: Revenue: $1 billion Adjusted Operating Margin: >20% EBITDA Margin: >24%
* 2017PF is pro forma to reflect the combination of 2017 actual SNHY and Faster results
Assumption: Includes One Mild Recession
www.snhy.com © 2018 Sun Hydraulics Corporation 21
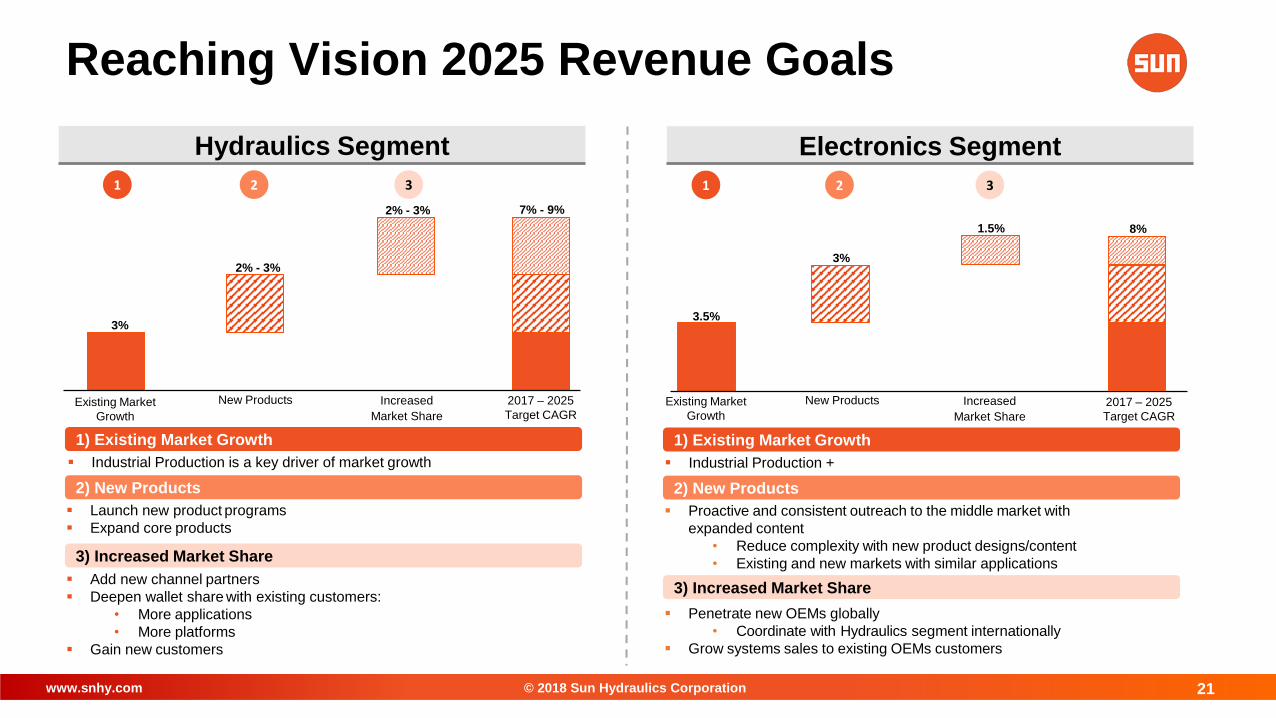
Electronics SegmentHydraulics Segment
Existing Market
Growth
New Products Increased
Market Share
2017 – 2025
Target CAGR
31 2
2% - 3%
2% - 3%
3%
7% - 9%
1) Existing Market Growth
Industrial Production is a key driver of market growth
Launch new product programs
Expand core products
Add new channel partners
Deepen wallet share with existing customers:
• More applications
• More platforms
Gain new customers
2) New Products
3) Increased Market Share
Existing Market
Growth
New Products Increased
Market Share
2017 – 2025
Target CAGR
31 2
3%
1.5%
3.5%
8%
1) Existing Market Growth
Industrial Production +
Proactive and consistent outreach to the middle market with
expanded content
• Reduce complexity with new product designs/content
• Existing and new markets with similar applications
Penetrate new OEMs globally
• Coordinate with Hydraulics segment internationally
Grow systems sales to existing OEMs customers
2) New Products
3) Increased Market Share
Reaching Vision 2025 Revenue Goals

www.snhy.com © 2018 Sun Hydraulics Corporation 22
(1) SNHY 2018 Guidance as of May 7, 2018; above is proforma for Faster for full year 2018 (2) Faster estimated 2018 revenue converted at an exchange rate of $1.235 / €1.000
2018 PF Revenue
($MM)
Enhanced
Product Offering
Broader
Geographic Reach
Greater Access to
OEMs
~$380MM - $395MM ~$150MM ~$530MM - $545MM
Pro Forma Combination Overview
Hydraulics
67%
Electronics
33%
Americas
58%
APAC
20%
EMEA
22%
Americas
52%
EMEA
29%
APAC
19%
Distributors
56%
OEMs
44%OEMs
75%
Distributors
25%
Hydraulics
100%
EMEA
57%
Americas
30%
APAC
13%
OEMs
52%Distributors
48%
(1)(2)
Hydraulics
75%
Electronics
25%
Creating a Larger & More Diversified Technology Platform
(1) (1)

www.snhy.com © 2018 Sun Hydraulics Corporation 23
Brands
Portfolio /
Technology
GOALS TARGETS INTEGRATION MODEL
• Technology leadership
• Broaden technology
offerings and capabilities
• Achieve target return
thresholds
• Increase solutions-based
offering
• Diversify end markets
• Strong management
• Solid customer relationships
• Quality products
• Culture supporting
innovation
• Lean or strong operational
capabilities
• Superior profitability
• Target revenue $50-$150
million per acquisition
• Successful on standalone
basis
• Drive innovative culture
• Keep talent and customer
relationships
• Retain brands
• Leverage engineering
expertise
• Realize synergy
opportunities
E.M. Actuation, Factory
Automation, Software or
IoT-Relevant
Linked Technologies
NEAR-TERM FOCUS MID-TERM FOCUS
Hydraulics
Cartridge Valve
Technology (CVT),
Quick Release
Couplings (QRC)
Adjacent
Hydraulics
Product Portfolio
Electronic Controls &
Instrumentation
Electronics
NEAR-TERM FOCUS
Methodology
Business Segment
Horizon
Disciplined Acquisition Strategy

© 2018 Sun Hydraulics Corporation
FINANCIAL OVERVIEW

www.snhy.com © 2018 Sun Hydraulics Corporation 25
$197 $190 $231
$265
$130
$150
$4 $7
$112
$125
$201 $197
$473
2015 2016 PF2017 PF2018
Hydraulics Faster Electronics
$47
$39
$109
$126
2015 2016 PF2017 PF2018
Significant Growth Momentum: Revenue and Margin
(1) PF2017 and PF2018 accounts for full year contribution of Faster Group acquisition that closed April 5, 2018
(2) See Supplemental Information for definition of Adjusted Operating Income and Margin, and reconciliation from GAAP and other disclaimers regarding non-GAAP information
$MM
19.6%Margin %:
Growing Revenue and Adjusted Operating Income Margin
23.0%23.6%
REVENUE (1)(2) ADJUSTED OPERATING INCOME (1)(2)
$MM$540
23.3%

www.snhy.com © 2018 Sun Hydraulics Corporation 26
Capital Allocation Focused on Growth
Total Debt / PF Adj. EBITDA (1): 2.9x
Net Debt / PF Adj. EBITDA (1): 2.7x
1) Organic Growth
2) Acquisitive Growth
3) Support Dividend
Double organically (existing businesses)
New product development
Integrate electronics and hydraulics know-how
Support product platform
Faster Group acquisition closed in April
2018 –funded with ~$175 million cash and
$358 million debt
Continue quarterly cash dividend
(1) Information as March 31, 2018, adjusted for the April 5, 2018 closing on Faster Group and new credit facilities; pro-forma adjusted EBITDA assuming a full year contribution of Faster Group; see Supplemental Information for definition of Adjusted
EBITDA, reconciliation from GAAP and disclaimers regarding the use of non-GAAP financial information
(2) Liquidity is based on actual cash and borrowing capacity as of March 31, 2018, adjusted for the April 5, 2018 closing on Faster and new credit facilities; revolving credit facility also allows for a $200 million accordion not reflected above
CAPITAL STRUCTURE(1) CAPITAL ALLOCATION PRIORITIES
$100
$258Drawn
$24 $166
$500
Term Loan Revolving CreditFacility
Cash Liquidity
$400
Drawn
Undrawn
Total RCF
$142
$MM
(2)
www.snhy.com © 2018 Sun Hydraulics Corporation 27
Commitment to Shareholder Value Creation
• Leading positions in fast growing industrial sectors of hydraulics and intelligent controls
• Portfolio of premium brands
• Highly engineered product design and manufacturing capabilities
• Proven growth strategy and execution (organic + M&A)
• Upside from future acquisitions articulated by Vision 2025: technology leadership,
target $1B sales, expanding profitability
• Best-in-class financial profile and discipline: high growth, high margins, high M&A growth
• Management team with proven track record of delivering results
1
2
3
4
5
6
7

www.snhy.com
STIFEL CROSS SECTOR INSIGHT CONFERENCE
INVESTOR PRESENTATION
JUNE 13, 2018
© 2018 Sun Hydraulics Corporation

© 2018 Sun Hydraulics Corporation
SUPPLEMENTAL INFORMATION

www.snhy.com © 2018 Sun Hydraulics Corporation 30
Culture of Innovation
Two major product launches in 2017,
including the first joint product launch
between Sun and Enovation
Planned launch of hydraulic FLeX Phases
2 & 3 in 2018
Deep pipeline of 10 new electronic products
slated for launch by the end of 2018
Planning nine 2018 QRC product launches
220+ degreed engineers
Small solutions; big results
Fast, dependable delivery
Expert technical support
Superior customer service
Technology leader
Smart product innovation
Making new connections
Emphasis on quality, reliability
+ +
Mechanical Electrical Electro-Mechanical
Full Spectrum of Technical Expertise

www.snhy.com © 2018 Sun Hydraulics Corporation 31
March 31, April 1, March 31, December 30, December 31,
2018 2017 2018 2017 2016
Sales:
Hydraulics 62,609$ 54,122$ 239,149$ 230,662$ 189,523$
Electronics 34,709 27,231 119,655 112,177 7,411
Consolidated 97,318$ 81,353$ 358,804$ 342,839$ 196,934$
Gross profit and margin:
Hydraulics 23,449$ 22,120$ 93,038$ 91,709$ 69,867$
37.5% 40.9% 38.9% 39.8% 36.9%
Electronics 14,168 12,449 48,309 46,590 2,503
40.8% 45.7% 40.4% 41.5% 33.8%
Corporate and other - (1,774) - (1,774) (1,021)
Consolidated 37,617$ 32,795$ 141,347$ 136,525$ 71,349$
38.7% 40.3% 39.4% 39.8% 36.2%
Operating income and margin:
Hydraulics 13,442$ 13,772$ 54,604$ 54,934$ 39,134$
21.5% 25.4% 22.8% 23.8% 20.6%
Electronics 7,107 6,236 18,814 17,943 (627)
20.5% 22.9% 15.7% 16.0% -8.5%
Corporate and other (3,296) (4,224) (10,458) (11,386) (4,048)
Consolidated 17,253$ 15,784$ 62,960$ 61,491$ 34,459$
17.7% 19.4% 17.5% 17.9% 17.5%
Three Months Ended Twelve Months Ended
Segment Data
($ in thousands)

www.snhy.com © 2018 Sun Hydraulics Corporation 32
Sales by Geographic Region & Segment(Unaudited) 2018 Sales by Geographic Region and Segment
($ in millions)
Q1
%
of Total
Americas:
Hydraulics 26.4$
Electronics 30.1
Consol. Americas 56.5 58%
EMEA:
Hydraulics 19.6
Electronics 2.7
Consol. EMEA 22.3 23%
APAC:
Hydraulics 16.6
Electronics 1.9
Consol. APAC 18.5 19%
Total 97.3$
2017 Sales by Geographic Region and Segment
($ in millions)
Q1
%
of Total Q2
%
of Total Q3
%
of Total Q4
%
of Total 2017
%
of Total
Americas:
Hydraulics 24.7$ 28.2$ 25.3$ 25.6$ 103.8$
Electronics 22.6 24.5 26.8 21.1 95.0
Consol. Americas 47.3 58% 52.7 59% 52.1 59% 46.7 56% 198.8 58%
EMEA:
Hydraulics 17.1 16.6 16.1 16.4 66.2
Electronics 3.0 2.6 2.9 2.4 10.9
Consol. EMEA 20.1 25% 19.2 22% 19.0 22% 18.8 22% 77.1 22%
APAC:
Hydraulics 12.3 16.0 15.2 17.1 60.6
Electronics 1.7 1.4 1.7 1.5 6.3
Consol. APAC 14.0 17% 17.4 19% 16.9 19% 18.6 22% 66.9 20%
Total 81.4$ 89.3$ 88.0$ 84.1$ 342.8$

www.snhy.com © 2018 Sun Hydraulics Corporation 33
April 1, March 31, December 31,
2018 2017 2018 2017 2016
GAAP operating income 17,253$ 15,784$ 62,960$ 61,491$ 34,459$
Acquisition-related amortization of intangible assets 1,988 2,250 8,161 8,423 1,545
Acquisition-related amortization of inventory step-up - 1,774 - 1,774 1,021
Acquisition and financing-related expenses (1) 1,197 200 2,016 1,019 1,537
Restructuring charges (2) 111 - 1,573 1,462 -
One-time operational items (3) - - 2,907 2,907 -
Non-GAAP Adjusted operating income 20,549$ 20,008$ 77,617$ 77,076$ 38,562$
GAAP operating margin 17.7% 19.4% 17.5% 17.9% 17.5%
Non-GAAP Adjusted operating margin 21.1% 24.6% 21.6% 22.5% 19.6%
(1) Includes expenses associated with the Company's acquisition and financing activities to support its strategy
(2) Includes charges to consolidate the Company's High Country Tek business into its Enovation Controls business,
$431 of which is included in cost of sales
(3) Includes standard costing adjustments; temporary workforce, material outsourcing, and freight charges to recover from
impact of Hurricane Irma; scrap and inventory issues attributable to the carve-out of Enovation Controls from its former organization
Three Months Ended
March 31, December 30,
Twelve Months Ended
Adjusted Operating Income Reconciliation
Non-GAAP Financial Measure:
Adjusted operating margin is adjusted operating income divided by sales. Adjusted operating income and adjusted operating margin are
not measures determined in accordance with generally accepted accounting principles in the United States, commonly known as GAAP.
Nevertheless, Sun believes that providing non-GAAP information such as adjusted operating income and adjusted operating margin are
important for investors and other readers of Sun's financial statements, as they are used as analytical indicators by Sun's management
to better understand operating performance. Because adjusted operating income and adjusted operating margin are non-GAAP
measures and are thus susceptible to varying calculations, adjusted operating income and adjusted operating income margin, as
presented, may not be directly comparable to other similarly titled measures used by other companies.
(Unaudited)
($ in thousands)

www.snhy.com © 2018 Sun Hydraulics Corporation 34
April 1, March 31, December 31,
2018 2017 2018 2017 2016
Net income 11,911$ 10,211$ 33,258$ 31,558$ 23,304$
Interest expense (income), net 483 625 3,639 3,781 (790)
Income tax provision 3,982 4,928 15,040 15,986 11,597
Depreciation and amortization 4,729 5,091 18,828 19,190 11,318
EBITDA 21,105 20,855 70,765 70,515 45,429
Acquisition-related amortization of inventory step-up - 1,774 - 1,774 1,021
Acquisition and financing-related expenses (1) 1,197 200 2,016 1,019 1,537
Restructuring charges (2) 111 - 1,573 1,462 -
Foreign currency forward contract loss 505 - 505 - -
One-time operational items (3) - - 2,907 2,907 -
Change in fair value of contingent consideration 402 - 9,878 9,476 -
Adjusted EBITDA 23,320$ 22,829$ 87,644$ 87,153$ 47,987$
Adjusted EBITDA margin 24.0% 28.1% 24.4% 25.4% 24.4%
(1) Includes expenses associated with the Company's acquisition and financing activities to support its strategy
(2) Includes charges to consolidate the Company's High Country Tek business into its Enovation Controls business,
$431 of which is included in cost of sales
(3) Includes standard costing adjustments; temporary workforce, material outsourcing, and freight charges to recover from
impact of Hurricane Irma; scrap and inventory issues attributable to the carve-out of Enovation Controls from its former organization
December 30,
Three Months Ended
March 31,
Twelve Months Ended
Adjusted EBITDA Reconciliation
Non-GAAP Financial Measure:
Adjusted EBITDA margin is Adjusted EBITDA divided by sales. Adjusted EBITDA and Adjusted EBITDA margin are not measures
determined in accordance with generally accepted accounting principles in the United States, commonly known as GAAP.
Nevertheless, Sun believes that providing non-GAAP information such as Adjusted EBITDA and Adjusted EBITDA margin are important
for investors and other readers of Sun's financial statements, as they are used as analytical indicators by Sun's management to better
understand operating performance. Because Adjusted EBITDA and Adjusted EBITDA margin are non-GAAP measures and are thus
susceptible to varying calculations, Adjusted EBITDA and Adjusted EBITDA margin, as presented, may not be directly comparable to
other similarly titled measures used by other companies.
(Unaudited)
($ in thousands)

www.snhy.com © 2018 Sun Hydraulics Corporation 35
April 1, March 31, December 31,
2018 2017 2018 2017 2016
Net income 11,911$ 10,211$ 33,258$ 31,558$ 23,304$
Acquisiton-related amortization of inventory step-up - 1,774 - 1,774 1,021
Acquisition and financing-related expenses (1) 1,197 200 2,016 1,019 1,537
Restructuring charges (2) 111 - 1,573 1,462 -
Foreign currency forward contract loss 505 - 505 - -
One-time operational items (3) - - 2,907 2,907 -
Change in fair value of contingent consideration 402 - 9,878 9,476 -
Tax effect of above (554) (644) (5,401) (5,491) (844)
Impact of tax reform - - 463 463 -
Adjusted net income 13,572$ 11,541$ 45,199$ 43,168$ 25,018$
Adjusted net income per diluted share 0.46$ 0.43$ 1.62$ 1.60$ 0.93$
(1) Includes expenses associated with the Company's acquisition and financing activities to support its strategy
(2) Includes charges to consolidate the Company's High Country Tek business into its Enovation Controls business,
$431 of which is included in cost of sales
(3) Includes standard costing adjustments; temporary workforce, material outsourcing, and freight charges to recover from
impact of Hurricane Irma; scrap and inventory issues attributable to the carve-out of Enovation Controls from its former organization
December 30,
Three Months Ended
March 31,
Twelve Months Ended
Adjusted Net Income Reconciliation
Non-GAAP Financial Measure:
Adjusted net income per diluted share is adjusted net income divided by diluted weighted average common shares outstanding.
Adjusted net income and adjusted net income per diluted share are not measures determined in accordance with generally accepted
accounting principles in the United States, commonly known as GAAP. Nevertheless, Sun believes that providing non-GAAP information
such as adjusted net income and adjusted net income per diluted share is important for investors and other readers of Sun's financial
statements, as they are used as analytical indicators by Sun's management to better understand operating performance. Because
adjusted net income and adjusted net income per diluted share are non-GAAP measures and are thus susceptible to varying
calculations, adjusted net income and adjusted net income per diluted share, as presented, may not be directly comparable to other
similarly titled measures used by other companies.
(Unaudited)
($ in thousands)