Embed Size (px)
DESCRIPTION
Spider charts to work with reading miscues
Citation preview

page
110
Language Arts, Volume 90 Number 2, November 2012
Karen E. Wohlwend
A New Spin on Miscue Analysis: Using Spider Charts to Web
Reading Processes
guage use, their developing sense of story, and their awareness of sounds and print.
An overview of Miscue Analysis Procedures
Miscue analysis provides a window into children’s problem solving “on the fly” as they work with text in context. Sentence-by-sentence analysis of oral reading (always informed by the child’s retelling of the text) reveals whether children are flexibly using cues from syntactic, semantic, and graphophonic systems and uncovers the hypotheses and strategies a child brings to print. (For a detailed explanation of miscue analysis theory, procedures, and strate-gies, see Goodman, Watson, and Burke, 2005.) These cues subliminally prompt the reader to ask themselves questions:
• Syntactic cues come from knowledge of syntax or how words fit together in a sentence: Does this sound like the language I use?
• Semantic cues are clues that a reader fits together to understand the text’s meaning: Does this make sense, given what I know so far?
• Graphophonic cues help a reader decode printed or written forms on the page: Does this look or sound like other phonetic or graphic patterns or words I know?
Learning to Conduct Miscue Analyses
As a teacher educator, I regularly face the chal-lenge of helping preservice teachers in my early literacy methods classes untangle the complexities of the reading process and interpret the rich data they collect through a range of kid-watching assess-
A spider chart, a standard feature in a widely available spreadsheet application, puts a new spin on a venerable reading assess-
ment—miscue analysis (Goodman, Watson, & Burke, 1987)—by quickly generating visual dis-plays of reading processes. Also known as radar charts, spider charts are webs that put reading assessment data points in relationship to each other, providing a way to quickly visualize how well read-ers are noticing and coordinating complex linguistic systems during the process of constructing meaning for a text. This article demonstrates the usefulness of spider charts in illustrating how readers—in this case, emergent readers in kindergarten and early primary grades—coordinate various kinds of tex-tual cues as they learn to read. An interactive ver-sion of the spider chart in this article can be found at http://e339blog.blogspot.com/2012/01/visualiz-ing-reading-processes-with.html.
Complexity and reading Cueing Systems Miscue analysis offers an in-depth picture of read-ing that captures more complexity than other infor-mal reading inventories, such as running records that assess word accuracy of oral reading and suggest an instructional level. In miscue analysis, teachers record miscues in oral reading and analyze individual miscues, but they use this data to con-sider how the three cueing systems interact. The focus is on the unfolding meaning making with a text rather than on word-by-word accuracy. To do this, teachers must consider how individual readers are simultaneously pulling together multiple threads as they coordinate all their linguistic resources: their knowledge of familiar cultural patterns of lan-
A548_Nov2012_LA.indd 110 10/3/12 11:47 AM

page
111
Karen E. Wohlwend | A New Spin on Miscue Analysis: Using Spider Charts to Web Reading Processes
Language Arts, Volume 90 Number 2, November 2012
For example, a miscue with some graphophonic similarity might have one word part, such as a beginning letter or word part, that is similar to the corresponding printed word in the book (e.g., a child reads beast when the printed word is bunny, so the substitution and the word in the book start with the same letter but share no other letters). We calculate the percentage for graphophonic similar-ity by counting the substitutions that have at least some graphophonic similarity (e.g., one or more word parts similar to the corresponding word in the book), then dividing this number by the total num-ber of substitutions.
Some Signs That a Reader Is Using Syntactic Cues
• Makes no miscues
• Makes substitution, omission, or insertion miscues that fit conventional word order
• Substitutes the same part of speech (e.g., a noun for a noun)
• Substitutes words that, while not conventional, fit the child’s developing understanding of rules for language and grammar (e.g., goed for went)
Some Signs That a Reader Is Using Semantic Cues
• Makes no miscues
• Makes substitution, omission, or insertion miscues that retain the sense of the sentence (even if the miscues do not look or sound like the original words)
• Self-corrects miscues that don’t make sense
Some Signs That a Reader Is Using Grapho-phonic Cues
• Makes no miscues
• Makes miscues that look and/or sound similar to words in the text
The goal is to understand how flexibly and effi-ciently the reader is integrating all the cues to pre-dict, confirm, or discard hypotheses while making
ments (Owocki & Goodman, 2002). In one read-ing assessment, our elementary preservice teachers conduct a miscue analysis in which they listen to a K–2 student read and retell an unfamiliar book. In preparation for this assessment, we work through video samples in class together as they learn to code oral readings.
During videos of children reading, we observe children’s literacy practices and record miscues on a copy of the printed pages in the child’s book, a procedure common to many informal reading inventories. In miscue analysis, however, individ-ual single-word miscues are not tallied to calculate word accuracy of oral reading in order to determine an instructional level or a match for a leveled book. Instead, miscue analysis proceeds at the sentence level; that is, we evaluate each coded sentence in the recorded reading by asking three questions (Good-man, Watson, & Burke, 2005; Owocki & Goodman, 2002):
1. Is the sentence syntactically acceptable? (Does the child’s reading sound like language?)
2. Is the sentence semantically acceptable? (Does the child’s reading make sense?)
3. Do the miscues in the sentence change the meaning of the sentence in relation to the book/story/article? (Does the reading change the meaning of the sentence in a way that mat-ters in the whole text?)
Each question produces a percentage of accept-ability by dividing the total number of acceptable sentences by the total number of sentences in the passage: 1) the percentage for all Yes answers to question 1; 2) the percentage for all Yes answers for question 2; and 3) the percentage of all No answers for question 3. We then return to the individual word miscues and analyze only the substitution miscues to see if each substituted word is similar (e.g., has matching letters or sounds) to its corre-sponding word in the passage. To do this, we ask a fourth question:
4. Are the miscues graphophonically similar to the text?
A548_Nov2012_LA.indd 111 10/3/12 11:47 AM

page
112
Karen E. Wohlwend | A New Spin on Miscue Analysis: Using Spider Charts to Web Reading Processes
Language Arts, Volume 90 Number 2, November 2012
ond and third questions can depend upon the pre-vious question. For example, a sentence that does not sound like language (question 1) often does not make sense (question 2); thus, the percentage of syn-tactically acceptable sentences is often equal to or greater than the percentage of semantically accept-able sentences. Similarly, a child’s reading can make sense (question 2) and change the meaning of the sentence (question 3), as in the substitution of work for wolf in “the night Max wore his wolf suit . . .”; in other words, “the night Max wore his work suit” makes sense but changes the meaning. But a nonsen-sical reading of a (sensible) sentence automatically changes its meaning, as in “the night Max wore his wollof suit”; thus the semantically acceptable per-centage will usually be equal to or greater than the percentage of sentences with no meaning change.
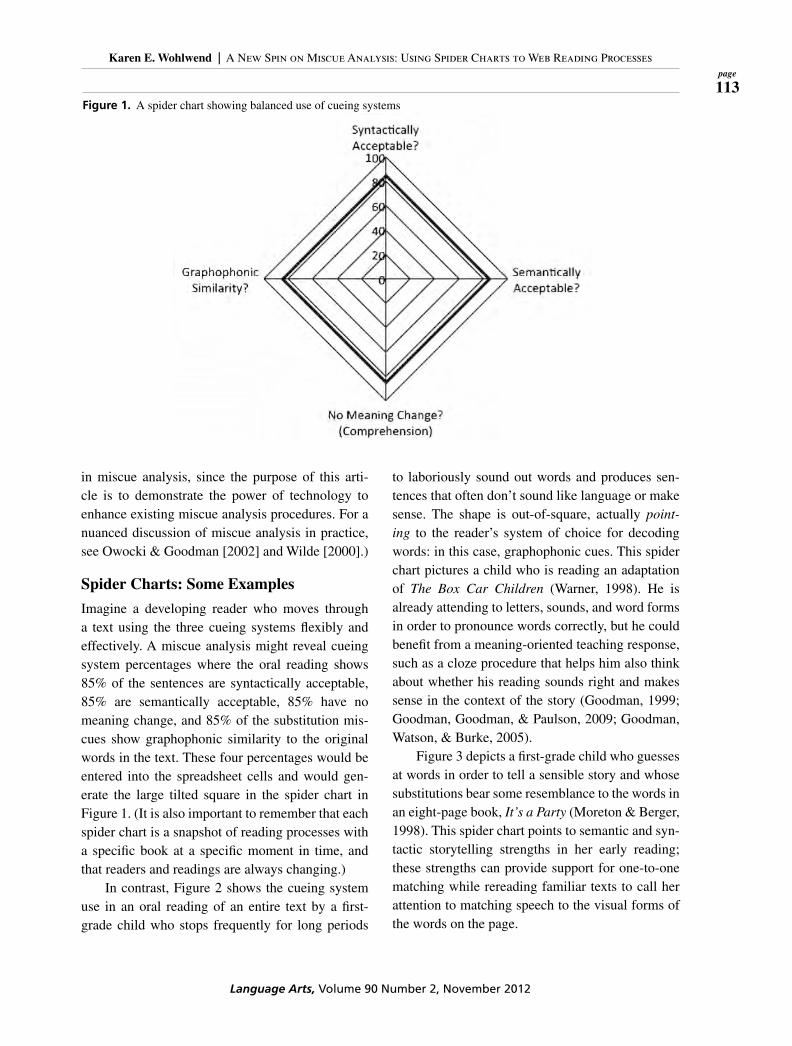
Shape Tells the Story
Much complexity can be conveyed in an instant through the shape and size of the figure on the spi-der chart. The shape matters: square-like shapes (like Figure 1) indicate attention to and coordina-tion of all three cueing systems; irregular or trian-gular shapes indicate greater attention to one cueing system over another. And the size matters. Larger squares indicate more proficient reading (on a given text); smaller shapes indicate more emergent read-ing, with many miscues and interruptions in read-ing and meaning construction. It is important to note here that the size and shape of spider charts must always be considered in relation to a particular reader’s development, the difficulty of the text, the strategies apparent in the transcript of the oral read-ing, the completeness of the retelling, and so on. A chart that points away from graphophonics, for example, can convey one child’s emergent under-standing of letter–sound relationships. Alternately, a chart from another child’s more proficient read-ing and strong use of prediction strategies, where one graphophonically dissimilar word is substituted for another without changing meaning (e.g., “a” for “the”), indicates that child is competently making meaning. (The brief discussion and examples in this article only hint at the depth of thinking involved
meaning with a text. During this process, teachers are also learning something about reading strate-gies, as Owocki and Goodman (2002) point out:
The ultimate goal of miscue analysis is to help teachers learn to listen to children read with educated miscue ears, to thoughtfully evaluate miscues and use miscue analysis to discover readers’ strategies, which include • monitoring reading in order to construct a
meaningful text
• predicting or making educated guesses that make sense based on prior knowledge and comprehending of the text
• confirming and self-correcting miscues that do not make sense using grammar and phonic cues
• reading without overly long hesitations and pauses
• omitting words or substituting non-words to keep reading
• using pictures and illustrations selectively (p. 63)
Visualizing reading-in-use through Spider ChartsIn the process of teaching miscue analysis to pre-service teachers, I frequently found that when I asked them to interpret the four percentages in their miscue analyses, they became preoccupied with determining whether each individual percentage
was above or below some arbitrary minimum score. As a result, they tended to focus on accuracy of read-ing and interpreted a low percentage as an indicator of student deficit instead
of seeing it in context. To respond to this, I looked for a way to refocus their attention on reading-in-use and to display their results so they could visual-ize the relationships among the three cueing sys-tems. Spider charts provided a handy visual tool that is accessible and relatively simple.
A spider chart generates a web-like pattern that shows data points in relationship to each other. In miscue analysis, the four percentages produce a square-like pattern when the three systems are in a somewhat balanced relationship. One influencing factor to note is that in miscue analysis, the sec-
Much complexity can be
conveyed in an instant through
the shape and size of the figure
on the spider chart.
A548_Nov2012_LA.indd 112 10/3/12 11:47 AM
page
113
Karen E. Wohlwend | A New Spin on Miscue Analysis: Using Spider Charts to Web Reading Processes
Language Arts, Volume 90 Number 2, November 2012
to laboriously sound out words and produces sen-tences that often don’t sound like language or make sense. The shape is out-of-square, actually point-ing to the reader’s system of choice for decoding words: in this case, graphophonic cues. This spider chart pictures a child who is reading an adaptation of The Box Car Children (Warner, 1998). He is already attending to letters, sounds, and word forms in order to pronounce words correctly, but he could benefit from a meaning-oriented teaching response, such as a cloze procedure that helps him also think about whether his reading sounds right and makes sense in the context of the story (Goodman, 1999; Goodman, Goodman, & Paulson, 2009; Goodman, Watson, & Burke, 2005).
Figure 3 depicts a first-grade child who guesses at words in order to tell a sensible story and whose substitutions bear some resemblance to the words in an eight-page book, It’s a Party (Moreton & Berger, 1998). This spider chart points to semantic and syn-tactic storytelling strengths in her early reading; these strengths can provide support for one-to-one matching while rereading familiar texts to call her attention to matching speech to the visual forms of the words on the page.
in miscue analysis, since the purpose of this arti-cle is to demonstrate the power of technology to enhance existing miscue analysis procedures. For a nuanced discussion of miscue analysis in practice, see Owocki & Goodman [2002] and Wilde [2000].)
Spider Charts: Some Examples
Imagine a developing reader who moves through a text using the three cueing systems flexibly and effectively. A miscue analysis might reveal cueing system percentages where the oral reading shows 85% of the sentences are syntactically acceptable, 85% are semantically acceptable, 85% have no meaning change, and 85% of the substitution mis-cues show graphophonic similarity to the original words in the text. These four percentages would be entered into the spreadsheet cells and would gen-erate the large tilted square in the spider chart in Figure 1. (It is also important to remember that each spider chart is a snapshot of reading processes with a specific book at a specific moment in time, and that readers and readings are always changing.)
In contrast, Figure 2 shows the cueing system use in an oral reading of an entire text by a first-grade child who stops frequently for long periods
Figure 1. A spider chart showing balanced use of cueing systems
A548_Nov2012_LA.indd 113 10/3/12 11:47 AM

page
114
Karen E. Wohlwend | A New Spin on Miscue Analysis: Using Spider Charts to Web Reading Processes
Language Arts, Volume 90 Number 2, November 2012
attempted to unsuccessfully sound out each word. However, when the preservice teacher encour-aged her to read the pictures in the same text, this kindergartner invented a sensible narrative that fit the illustrations. Figure 5 displays her strength in
We have also used two spider charts to show multiple aspects of cueing system use for an indi-vidual reader. A very young child’s reading of an eight-page text (Baby Food by Dunn, 1996) with three words per page looked like Figure 4 when she
Figure 2. Reading focused on graphophonic cues
Miscue Analysis Percentages %
Syntactically Acceptable? 70
Semantically Acceptable? 65
No Meaning Change? 60
Graphophonic Similarity? 100
Figure 3. Reading focused on syntactic and semantic cues
Miscue Analysis Percentages %
Syntactically Acceptable? 86
Semantically Acceptable? 86
No Meaning Change? 57
Graphophonic Similarity? 50
A548_Nov2012_LA.indd 114 10/3/12 11:47 AM

page
115
Karen E. Wohlwend | A New Spin on Miscue Analysis: Using Spider Charts to Web Reading Processes
Language Arts, Volume 90 Number 2, November 2012
Figure 4. Reading print: A young child’s first reading focused on graphophonic cues
Miscue Analysis Percentages (reading the Print)
%
Syntactically Acceptable? 14
Semantically Acceptable? 0
No Meaning Change? 0
Graphophonic Similarity? 86
Figure 5. Reading illustrations: The same young child’s second reading of the same book focused on syntactic and seman-tic cues
Miscue Analysis Percentages (reading the Pictures)
%
Syntactically Acceptable? 85
Semantically Acceptable? 85
No Meaning Change? 71
Graphophonic Similarity? 0
was much stronger when compared to her limited ability to use graphophonic cues, suggesting that picture reading could make a good foundation for sustaining reading as she develops further knowl-edge about print. Together, the two charts show a
picture-reading, her use of corresponding seman-tic cues in the illustrations, and syntactic cues that linked to her knowledge of book language.
The contrast between the two charts shows that her use of semantic and syntactic cueing systems
A548_Nov2012_LA.indd 115 10/3/12 11:47 AM


page
117
Karen E. Wohlwend | A New Spin on Miscue Analysis: Using Spider Charts to Web Reading Processes
Language Arts, Volume 90 Number 2, November 2012
(phonemic awareness, phonics, fluency, vocabulary, and comprehension), there is increasing consensus among literacy scholars that this approach to read-ing is partial, overemphasizes constrained skills (e.g., letter recognition in Paris, 2005), and under-emphasizes comprehension (Cassidy & Loveless, 2011; Dooley, 2010). In light of growing aware-ness of the ineffectiveness of DIBELS (Allington & Pearson, 2011) and other assessments that reduce reading to a narrow set of skills that can be easily tested, it’s time to revisit and revitalize more com-plex measures of reading processes that capture how readers coordinate information from print and image with knowledge of cultural language patterns and the ongoing construction of meaning.
referencesAllington, R., & Pearson, P. D. (2011). The casualities of
policy on early literacy development. Language Arts, 89, 70–74.
Cassidy, J., & Loveless, D. J. (2011). Taking our pulse in a time of uncertainty: Results of the 2012 what’s hot, what’s not literacy survey. Reading Today, 29(2), 16–20.
Davenport, M. R., & Lauritzen, C. (2002). Inviting reflection on reading through over the shoulder miscue analysis. Language Arts, 80, 109–118.
Dooley, C. M. (2010). Young children’s approaches to books: The emergence of comprehension. The Reading Teacher, 64(2), 120–130. doi: 10.1598/RT.64.2.4
Dunn, T. (1996). Baby food. Syndey, Australia: Scholastic.
Freeman, D. E., & Freeman, Y. S. (2000). Teaching reading in the multilingual classrooms. Portsmouth, NH: Heinemann.
Goodman, D. (1999). The reading detective club: Solving the mysteries of reading, a teacher’s guide. Portsmouth, NH: Heinemann.
Goodman, K. S., Goodman, Y. M., & Paulson, E. J. (2009). Beyond word recognition: How retrospective and future perspectives on miscue analysis can inform our teaching. In J. V. Hoffman & Y. M. Goodman (Eds.), Changing literacies for changing times: An historical perspective on the future of reading research, public policy, and classroom practices (pp. 146–161). New York, NY: Routledge.
Goodman, Y. M., Watson, D., & Burke, C. (1987). Reading miscue inventory: Alternative procedures. New York, NY: Richard C. Owen.
with far less explanation from me than needed with previous classes who conducted similar assess-ments. Students’ spontaneous comments in their reflections on the assignment showed that this visual display was helpful: “This assignment was a really great way to put together all the parts of teaching reading” and “It helped me put the ideas together in an organized way.” Although this article focuses on the use of spider charts with children in K–1 primary grades, it is likely that spider charts could also effectively show relationships among cueing systems for readers in intermediate grades or for English Language Learners; keep in mind, however, that those students may use quite different reading strategies than kindergarten and first-grade readers.
The ability to quickly visualize a student’s coordination of reading cueing systems has the potential to help preservice and inservice teachers
• make decisions about appropriate teaching responses to strengthen readers’ flexible strategy use.
• create a mental model to conceptualize how readers coordinate strategies, adding “miscue eyes” to Owocki and Goodman’s (2002) notion of “miscue ears”—in other words, to cultivate a meaning-focused disposition to reading and to develop an ability to use informal miscue analysis in “over-the-shoulder miscue analysis” (Davenport & Lauritzen, 2002).
• communicate student learning to interested parents and administrators.
• show policymakers that reading is much more than discrete skills or test score answers.
Visualization tools like spider charts provide much-needed ways of demonstrating that reading is dynamic meaning production that requires respon-sive teachers who provide just-enough and just-in-time support for learners who are constantly making on-the-spot decisions to flexibly coordinate a com-plex set of systems. After a decade of reading policy driven by the National Reading Panel’s five pillars
A548_Nov2012_LA.indd 117 10/3/12 11:47 AM

page
118
Karen E. Wohlwend | A New Spin on Miscue Analysis: Using Spider Charts to Web Reading Processes
Language Arts, Volume 90 Number 2, November 2012
Warner, G. C. (1998). The magic show mystery. Morton Grove, IL: Albert Whitman.
Wilde, S. (2000). Miscue analysis made easy: Building on student strengths. Portsmouth, NH: Heinemann.
Author’s Note
I am grateful to Carolyn Burke and Dorothy Menosky for their insightful questions and helpful responses to an early draft of this paper.
Goodman, Y. M., Watson, D. J., & Burke, C. L. (2005). Reading miscue inventory: From evaluation to instruction. Portsmouth, NH: Heinemann.
Moreton, D., & Berger, S. (1998). It’s a party. New York, NY: Scholastic.
Owocki, G., & Goodman, Y. M. (2002). Kidwatching: Documenting children’s literacy development. Portsmouth, NH: Heinemann.
Paris, S. G. (2005). Reinterpreting the development of reading skills. Reading Research Quarterly, 40, 184–202. doi: 10.1598/RRQ.40.2.3
Karen Wohlwend is an assistant professor of Literacy, Culture, and Language Education in the School of Education at Indiana University, Bloomington, and can be reached at [email protected].
2013 Call for Promising Researcher Award
Established in 1970 and given by the NCTE Standing Committee on Research, the Promising Researcher Award competition is open to individuals who have completed dissertations, theses, or initial, indepen-dent studies after the dissertations between December 1, 2010, and January 31, 2013. Studies entered into competition should be related to the teaching of English or the language arts (e.g., language develop-ment, literature, composition, teacher education/professional development, linguistics, etc.) and should have employed a recognized research approach (e.g., historical, ethnographic, interpretive, experimental, etc.). In recognition of the fact that the field has changed in recent years, the Committee on Research invites entries from a variety of scholarly perspectives.
Candidates must submit a manuscript based on their research. Manuscripts should be written in for-mat, style, and length appropriate for submission to a research journal such as Research in the Teaching of English, College Composition and Communication, Curriculum Inquiry, Teaching and Teacher Education, or Anthropology and Education. Manuscripts usually range from 25–50 double-spaced, typewritten pages.
Manuscripts should be sent to: Felisa Mann ([email protected]); subject line should read: Promising Researcher Award 2013. Manuscripts must be received on or before March 1, 2013. For more information, see www.ncte.org/second/awards/pra.
A548_Nov2012_LA.indd 118 10/3/12 11:47 AM