Embed Size (px)
Citation preview
Unraveling the diverse nature of service quality in a sharing economy: A social exchange theory perspective of Airbnb accommodation
Constantinos-Vasilios PriporasDepartment of Marketing, Branding & Tourism, Middlesex University, Business School,
Williams Building, Hendon Campus, The Burroughs, London NW4 4BT, England, United Kingdom
Nikolaos StylosDepartment for Marketing, Innovation, Leisure and Enterprise, University of Wolverhampton
Business School, University of Wolverhampton, United Kingdom
Roya RahimiDepartment for Marketing, Innovation, Leisure and Enterprise, University of Wolverhampton
Business School, University of Wolverhampton, United Kingdom
Lakshmi Narasimhan VedanthachariDepartment of Marketing, Branding & Tourism, Middlesex University, Business School,
Williams Building, Hendon Campus, The Burroughs, London NW4 4BT, England, United Kingdom
Abstract Purpose- This study investigates customers’ perceptions of the service quality facets of Airbnb
accommodation using social exchange theory as a suitable conceptual framework to explain
aspects of interactivity between guests and hosts.
Design/methodology/approach- A self-administered questionnaire consisting of 25
accommodation- specific service quality attributes, structured according to Akbaba’s (2006)
measurement scale and based on the service quality hierarchical conceptualization described by
Brady and Cronin (2001) and Cronin and Taylor (1992), was distributed to Airbnb international
guests visiting Phuket, Thailand. The sample was chosen through a two-stage sampling process
and the PLS-SEM technique was used for data analysis.
Findings- The results showed that convenience and assurance are critical contributors to the
measurement of service quality in remote Airbnb lodgings. The findings further revealed that
Airbnb guests are mainly interested in lodgings which have access to certain tourist sights, and in
easily accessible information and efficient resolution of problems during their stay. We also 1
found that guests greatly value the convenience and flexibility offered by Airbnb, and that they
particularly appreciate the warm hospitality provided by the hosts. Finally, Airbnb guests have
very low expectations of the amenities and services available at the lodgings.
Research limitations/implications-Airbnb is one of the most well-known examples of
hospitality in the sharing economy and results cannot be generalized to similar accommodation
providers in sharing economies. Despite the appropriateness of using the measurement tool
provided by Akbaba (2006), it is only one option among others for measuring service quality.
Practical implications- The current study can assist hosts in gaining better knowledge of guests’
decision making processes and in designing effective marketing strategies by focusing on guests’
requirements in terms of service quality. The effective use of competitive strengths and the
prioritization of business resources would potentially enhance guests’ positive experiences at the
accommodation and at the destination.
Originality/value-Limited numbers of studies have focused on the sharing economy and
hospitality and in particular on Airbnb and this is the first study with a focus on service quality
issues in terms of Airbnb accommodation.
Keywords: Sharing economy, Airbnb, Service quality, Social Exchange Theory
Paper type: Research paper
2
1. Introduction
The sharing economy is an emerging phenomenon facilitated through online platforms, (Heo,
2016; Richardson, 2015), in which broad segments of the population can collaboratively make
use of under-utilized inventory via monetary exchange sharing (Zervas et al., 2014). Over the
past few years, the sharing economy has developed quite rapidly in different ways, from free to
commercial, amateur to professional, and local to global (Shuford, 2015). In the tourism and
hospitality sector the rise of the sharing economy is particularly evident (Ert et al., 2016; Heo,
2016; Richard and Cleveland, 2016) and it is predicted that the challenges and changes for
traditional hospitality and hospitality in general will be significant in the foreseeable future
(Cheng, 2016; Guttentag, 2015; Oskam and Boswijk, 2016; Richard and Cleveland, 2016; Sigala,
2014).
The most well-known example of the sharing economy in the hospitality industry is the
Airbnb online business model (Ert et al., 2016; Oskam and Boswijk, 2016; Richardson, 2015). In
the last few years, Airbnb has rapidly emerged in the hospitality industry. In 2014 it averaged
425,000 guests per night and more than 155 million guests in total per year- which is about 22%
more than Hilton International (Price Waterhouse Coopers, 2015).
The service experience at Airbnb, like other parts of the hospitality industry, is perceived
more as an experience than a utilitarian transaction (Johns et al., 1997). Service quality has been
recognized as an important theme in the service industries and particularly in the hospitality
sector (Dedeoglu and Demirer, 2015; Wilkins et al., 2007) and as an essential factor for the
survival of hospitality providers. It plays an important role in customer satisfaction and in the
ultimate outcomes such as loyalty, commitment and repurchase intention (Akbaba, 2006; Chen
and Chen, 2014; Cronin and Taylor, 1992, Hu and Juwaheer, 2009; Petrick, 2004; Wilkins et al.,
3

2007). Accommodation providers operate in a highly competitive business environment (Yang et
al., 2011) and an excellent quality of service is imperative for their success, since it reflects their
standard and creates a positive image of their product and service (Mohsin and Lockyer, 2010).
Given the importance of service quality for companies, the purpose of this study is to
explore service quality in the sharing economy and in particular Airbnb accommodation from the
guests’ point of view. In order to do so, first, service quality is conceptualized as a multifaceted,
hierarchical construct to reflect the fact that “customers form their service quality perceptions on
the basis of an evaluation of performance at multiple levels and ultimately combine these
evaluations to arrive at an overall service quality perception” (Brady and Cronin, 2001, p. 37).
Second, the research examines the service quality perceptions of Airbnb guests as formulated by
their aggregate evaluations of the five-factor hospitality-specific model proposed by Akbaba
(2006). Third, it seeks to unravel the relative influence that each of the five facets has on overall
service quality perceptions in an attempt to offer deeper insights regarding priorities setting for a
high quality Airbnb lodging experience.
This study contributes to the hospitality discipline and in particular extends our
knowledge of the sharing economy and particular of Airbnb accommodation in the following
ways. First, since the exploration of marketing in the sharing economy is in its infancy (Hellwig
et al., 2015; Chen, 2016; Heo, 2016), and since there is a lack of empirical studies on Airbnb
accommodation, this study responds to relevant calls (Chen, 2016; Guttentag, 2015; Heo, 2016;
Tussyadiah, 2016). Second, the current study is the first to explore service quality issues in
Airbnb accommodation. Mohsin and Lockyer (2010) assert that service quality continues to be an
issue to debate and research and Dedeoglu and Demirer (2015) assert that studies on service
quality which focus on the hotel industry are limited. Richard and Cleveland (2016) support this
4
view by pointing out the need for more research on service quality from the consumers’ point of
view given the new reality (sharing economy) of the hospitality industry. Moreover, Rauch et al.
(2015) mentioned that most of these studies explore service quality in upscale (4-star) and luxury
(5-star) hotels and more studies which focus on other hotel/accommodation segments are needed.
The exchange process in service encounters is a dynamic process, due to the evolving interaction
between service providers and their customers. Accommodation providers have an opportunity to
offer the quality that customers are looking for and to offer a memorable service, thereby
increasing the likelihood of that customer returning (Mitchell and Lewis, 1990; Rahimi and
Kozak, 2016; Rahimi and Gunlu, 2016; Shostack, 1977). Hence the current study, seeks to
explore customers’ perceptions of service quality facets in Airbnb accommodation, using
Akbaba’s (2006) proposed scale and the lens of Social Exchange Theory (SET). Third, it
investigates the topic in Thailand, one of the most popular tourist destinations worldwide
(UNWTO, 2015) where studies on hospitality are limited (i.e. Kang et al., 2015; Narangajavana
and Hu, 2008). Finally, our findings could be of value to both academics and practitioners and
could serve as reference for future studies within the online network hospitality field and
particularly for the Airbnb accommodation sector (Germann Molz, 2011).
2. Literature review
2.1. Sharing Economy and Airbnb
While “sharing” is an old concept (Belk, 2010, 2014), the sharing economy, also known as the
Peer to Peer (P2P) or collaborative economy (Tussydiah, 2016), is a contemporary phenomenon
(Hellwig et al., 2015; Tussyadiah, 2016). It emerged in the past few years with the development
of the internet (Belk, 2014) and it was driven by economic and societal factors (Botsman and
5
Rogers, 2011; Tussyadiah and Pesonen, 2016), technological advancements (i.e. smart phones),
the global economic downturn which created a need for economic benefits (i.e., less spending and
cheaper prices for guests), the need for social connection, and a greater awareness of
environmental issues (Botsman and Rogers, 2010; Gansky, 2010).
Scholars from different disciplines provide various definitions and terminologies for the
sharing economy concept (Belk, 2014; Richardson, 2015; Tussyadiah, 2016) but there is no
agreement on a universal definition (Dredge and Gyimothy, 2015). However, Richardson (2015)
by examining various definitions of the sharing economy concluded that Airbnb has three key
elements of the sharing economy: 1) the company is paradigmatic in offering an online
‘platform’: a digital intermediary that reduces the costs of connecting a diverse array of potential
consumers and producers; 2) it is peer-to-peer. This means that Airbnb ‘hosts’ are also
‘travelers’, or more generally that client and service provider are (theoretically) interchangeable;
3) Airbnb is access-based: it is premised upon the ability to buy access to (rather than ownership
of) a resource or service (in this case, hospitable space) for a period of time.
Airbnb is the most prominent example of the sharing economy in hospitality and it is
becoming an important player in the hospitality sector (Ert et al., 2016; Oskam and Boswijk,
2016; Richardson, 2015). Airbnb was listed in the world’s 50 most innovative companies by Fast
Company Organization in 2013 (Carr, 2013) and since its formation in 2008 has significantly
increased its sales volume and expanded considerably. Today, Airbnb has a global presence and
reaches over 34,000 cities in 190 countries. Valued at an estimated $10 billion, it is worth more
than major hotel corporations (Shuford, 2015). For Guttentag (2015) Airbnb has been successful
because it offers access to low-cost accommodation and direct interaction with the local
community, while Oskam and Boswijk (2016) assert that it has been successful because of the
6
authenticity of the P2P contact in the accommodation experience, and the economic benefits for
both hosts and guests. Thus, social interaction is of paramount importance in the Airbnb business
model and greatly affects guests’ experiences and level of satisfaction, as it is described in SET.
In other words, satisfaction and perception of service quality within the sharing economy context
are the result of social interactions and reciprocity and not the outcome of personal internal
processing, as it is outlined in SET (Choo and Petrick, 2014; Emerson, 1976).
According to Ikkala and Lampinen (2015), there are two main styles of hosting through
Airbnb. The first one is called remote hospitality for hosting situations wherein the host is not
physically sharing the home (or other property he or she manages) with the guest. Here, the
interaction with the guest is typically limited to messages exchanged through the Airbnb service,
e-mail, SMS contact, phone calls, and the occasional quick encounters in which the keys to the
apartment are handed over and final details of the stay are discussed. The second one is labeled
on-site hospitality where the host is physically present and sharing the apartment with the guest.
An example of this is renting out a spare bedroom or one’s living room.
2.2. Service Quality and Social Exchange Theory
Service quality has been receiving attention from researchers since the 1970s due to the
ground breaking articles published by Gronoos (1982), Lehtinen and Lehtinen (1982), Lewis and
Booms (1983), and Sasser et al. (1978). These studies highlighted the complexities associated
with evaluating service quality; the contribution of service process delivery on service outcomes
which results in the perception of service quality. Social exchange theory proposes that social
behavior is the result of an exchange process (Emerson, 1976; Skidmore, 1975) and interpersonal
interactions include exchanges of resources. Satisfaction is primarily influenced by the economic
7
and social outcomes of these exchanges. Therefore, service quality and its perceptions can be
influenced by different internal processes and interpersonal variables. According to Sierra and
McQuitty (2005), in the case of a close interaction between a service employee and a customer,
the manner in which the service is performed is often more important than what is actually
delivered (Ozment and Morash, 1994). In social exchange, for which customers and employees
perceive some degree of shared responsibility, and the success or failure of the outcome produces
an emotional response (Sierra and McQuitty, 2005).
Existing service quality measurement methods can be broadly classified into incident
based or attribute based methods (Stauss and Weinlich, 1977). Incident based techniques classify
events or critical events into satisfactory or unsatisfactory customer experiences in service
contact situations. Attribute based techniques tend to provide a global view of quality by
capturing customer perceptions of quality through a structured questionnaire. Service quality
literature received widespread attention after the seminal work by Parasuraman et al. (1988)
wherein they proposed the gap model and developed SERVQUAL (an attribute based technique)
as a tool for measuring service quality. They suggested three underlying themes after reviewing
the previous work on services: 1) service quality is more difficult for the consumer to evaluate
than the quality of goods, 2) service quality perceptions result from a comparison of consumer
expectations with actual service performance, and 3) quality evaluations are not made solely on
the outcome of service; they also involve evaluations of the process of service delivery
(Parasuraman et al., 1985).
They defined service quality as “a global judgment, or attitude, relating to the superiority
of the service” (Parasuraman et al., 1988, p.16). Asbonterg et al. (1996) undertook a critical
review of SERVQUAL by reviewing the core SERVQUAL scale, the tests for validity, reliability
8
and identified past SERVQUAL studies that measured service quality in a variety of settings
(Healthcare, retail, banking, fast food restaurants etc.). They concluded that SERVQUAL scores
well for reliability face validity and concurrent validity but found little proof for convergent
validity. Seth et al. (2004) undertook a comprehensive review of service quality models and
identified 19 different service quality models. Upon evaluation they concluded that service
quality models have evolved and highlight the changes from conventional to IT based services.
Further research has established the role of service quality as the antecedent for customer
satisfaction and customer satisfaction as an antecedent to loyalty. Hallowell (1996) identified the
relationship that exists between customer satisfaction and loyalty and customer loyalty and
profitability. Storbacka et al. (1994) provided a comprehensive framework that links service
quality, customer satisfaction and customer retention, and company profitability. Given its
importance, it can be argued that service quality plays a critical role in gaining a competitive
advantage.
2.3. Service Quality in Lodging Industry
In order to enhance customer satisfaction, organizations tend to adopt a service
standardization approach in order to provide uniform service quality. However, demand for
services in hotels are clustered around a specific time of the day or months of a year, making it
difficult to provide a uniform service experience. Moreover, there are some aspects of service
such as friendliness, helpfulness etc. which are difficult to standardize. Sierra and McQuitty
(2005) mentioned that service employees’ performance is critical for the success/failure of the
service exchange (Bowen, 1990; Levitt, 1981; Puay et al., 1999), and employees’ behaviors and
9
attitudes can influence a customer’s perception of the quality of that service (Brady and Cronin,
2001).
The importance of service quality in the lodging industry is well documented (e.g.
Akbaba, 2006; Wu and Ko, 2013; Yang et al., 2011). In the hospitality context, there are
numerous empirical studies examining and conceptualizing the construct of service quality
(Briggs et al., 2007). Johns and Lee-Ross (1996) propose the use of free response questionnaires
and term it as a ‘profile accumulation technique’. Other scholars proposed service quality
instruments specifically for the hospitality sector based on SERVQUAL. For example, Knutson
et al. (1990), developed LODGSERV, a model developed for the Lodging industry. This model is
based on the five original SERVQUAL dimensions and contains 26 items. Getty and Thompson
(1994) designed the LODGQUAL instrument which contained only three dimensions i.e.
Tangibles, reliability and contact. Mei et al. (1999) developed the HOLSERV model containing
27 items, a 7-point scale with three dimensions i.e. employees (behavior and appearance),
tangibles and reliability. Getty and Getty (2003) developed the “Lodging Quality Index” (LQI)–a
45 item measurement tool containing tangibility, reliability, responsiveness, confidence and
communication. This instrument was validated by Ladhari (2010) by applying it to the context of
Canadian tourists. The service quality literature in the lodging industry asserts that the evaluation
of service quality is multidimensional, (Ekinci, 2002) and that the recommended factors could not
be generic (Akbaba, 2006) since some of these can be different in different hotel settings (i.e.,
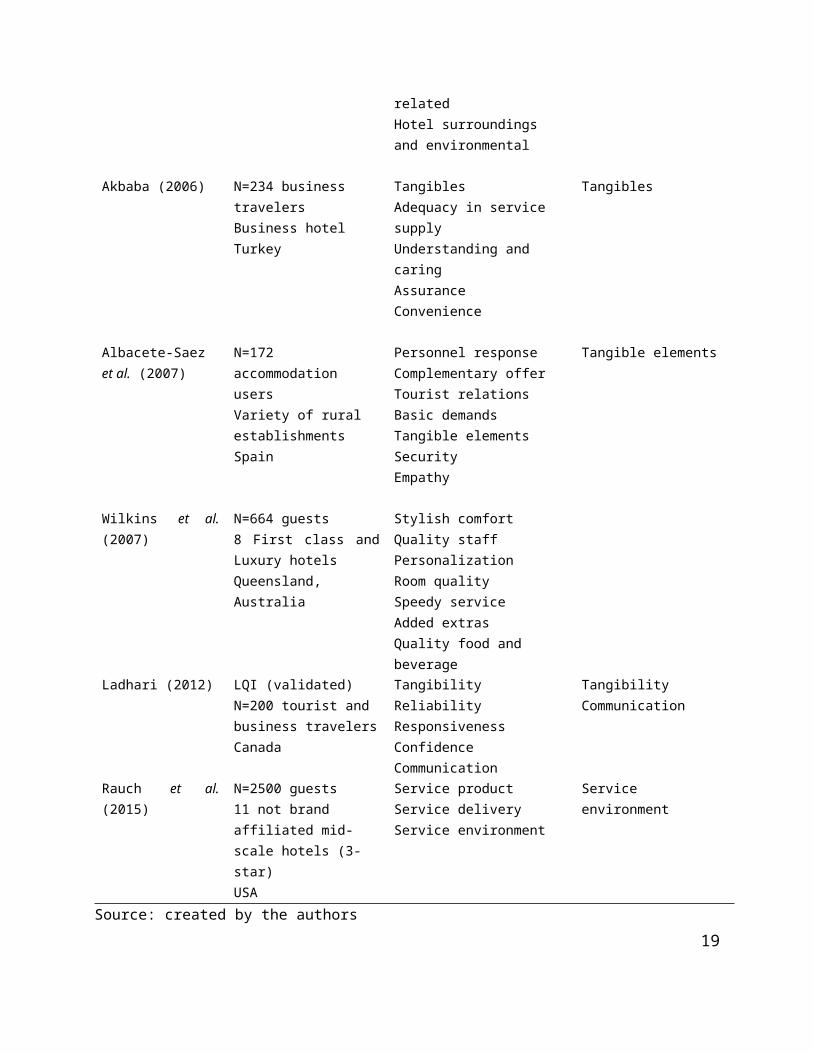
resort hotels, business hotels, motels) and cultures (Yang et al., 2011). Table 1 provides a
summary of some of the major research studies on service quality measurement that focused on
the hotel industry.
10
Table 1 Summary of the main studies on service quality measurement in the hotel industry.
Authors Sample Dimensions of service quality Customer’s EmphasisKnutson et al. (1990) LODGSERV Model
N=200 adults/hotel usersUSAHotels/motels (unidentified stars)
TangiblesReliabilityResponsivenessAssuranceEmpathy
Reliability
Akan (1995) N=228 guests4 & 5star hotelsIstanbul, Turkey
Courtesy and competence of the personnelCommunications and transactionsTangiblesKnowing and understanding the customerAccuracy and speed of serviceSolutions to problemsAccuracy of hotel reservations
Courtesyand Competence of the personnel.
Juwaheer (2004) N=410 international touristsDifferent categories of beach hotelsMauritius
ReliabilityAssuranceExtra room amenitiesStaff communication and additionalamenities soughtRoom attractiveness and décorEmpathyStaff outlook and accuracyFood and service relatedHotel surroundings and environmental
Reliability
Akbaba (2006) N=234 business travelersBusiness hotelTurkey
TangiblesAdequacy in service supplyUnderstanding and caringAssuranceConvenience
Tangibles
Albacete-Saez et al. (2007)
N=172 accommodation usersVariety of rural establishmentsSpain
Personnel responseComplementary offerTourist relationsBasic demandsTangible elementsSecurityEmpathy
Tangible elements
11

Wilkins et al. (2007) N=664 guests8 First class and Luxury hotelsQueensland, Australia
Stylish comfortQuality staffPersonalizationRoom qualitySpeedy serviceAdded extrasQuality food and beverage
Ladhari (2012) LQI (validated)N=200 tourist and business travelersCanada
TangibilityReliabilityResponsivenessConfidenceCommunication
TangibilityCommunication
Rauch et al. (2015) N=2500 guests11 not brand affiliated mid-scale hotels (3-star)USA
Service productService deliveryService environment
Service environment
Source: created by the authors
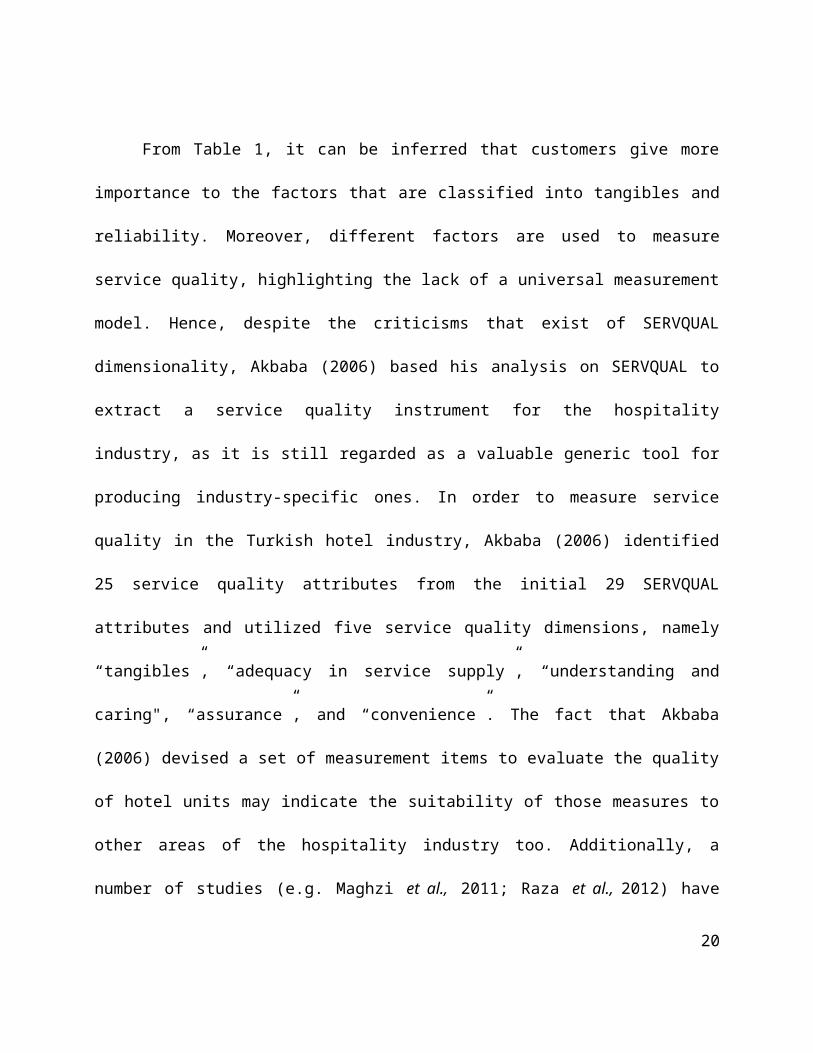
From Table 1, it can be inferred that customers give more importance to the factors that
are classified into tangibles and reliability. Moreover, different factors are used to measure
service quality, highlighting the lack of a universal measurement model. Hence, despite the
criticisms that exist of SERVQUAL dimensionality, Akbaba (2006) based his analysis on
SERVQUAL to extract a service quality instrument for the hospitality industry, as it is still
regarded as a valuable generic tool for producing industry-specific ones. In order to measure
service quality in the Turkish hotel industry, Akbaba (2006) identified 25 service quality
attributes from the initial 29 SERVQUAL attributes and utilized five service quality dimensions,
namely “tangibles”, “adequacy in service supply”, “understanding and caring", “assurance”, and
“convenience”. The fact that Akbaba (2006) devised a set of measurement items to evaluate the
quality of hotel units may indicate the suitability of those measures to other areas of the
hospitality industry too. Additionally, a number of studies (e.g. Maghzi et al., 2011; Raza et al.,
2012) have used Akbaba’s scale in different countries, following the original or devising
12
modified versions of it, to measure service quality in hotels. Echoing the views of Akbaba
(2006), this research will adopt his recommendations on measuring guests’ service quality
perceptions in Airbnb accommodation, while employing Cronin and Taylor’s (1992)
conceptualization of service quality formulation to overcome the critique regarding the
weaknesses of SERVQUAL implementation.
The theoretical support for the use of performance-based only measures of service quality
is provided in the relevant literature, demonstrating that perceived service quality is best
conceptualized as an attitude (Brady, Cronin & Brand, 2002; Churchill & Suprenant, 1982). The
attitude-based operationalization of service quality developed by Cronin & Taylor (1992) was
based on both the theoretical and empirical evidence that the performance-only service quality
instrument “outperforms the disconfirmation-based SERVQUAL scale…” (Brady et al., 2002; p.
18). Then, although Cronin and Taylor (1992) question both the theoretical basis and the five-
component structure of SERVQUAL, they still make use of the 22 performance items proposed
by Parasuraman et al. (1988) to define service quality, as validated and supported by the relevant
development procedures. In this vein, though we do not apply the expectations-and-performance
perceptions of Akbaba’s scale, we do make use of the perception measurement items suggested,
as per the recommendations of Cronin and Taylor (1992).
Taken together, we expect that the tangibles, adequacy in service supply, understanding
and caring, assurance and convenience, which originate from Akbaba’s scale, may have some
impact on the service quality perceptions of Airbnb guests. This is further supported by the fact
that hospitality services are generally based on a set of processes carried out by a variety of
tangible items that aim to create favorable guest experiences. Therefore, based on the
recommendations provided in the published literature the following hypothesis will be examined:
13
H1: The five facets have significant and positive effects on shaping Airbnb guests’ overall
perceptions of service quality.
3. Methodology
3.1 Data collection process
All lodgings involved in the survey were of the remote hospitality type and we focused
only on whole apartments rented out. The lodgings were chosen through a two stage sampling
process. In the first, Airbnb accommodation was identified using the web search facility.
Accommodation (Quality, amenities, location and price range) was chosen by applying the
following filters: House type = apartments / flats, Location = Phuket, price range: less than £45
per day. Regarding quality criterion, the property description and pictures were used to assess the
quality of the property. Based on these search criteria the Airbnb online platform returned 400
apartments listed in a random order, with the number of bedrooms per apartment varying from 1
to 4, although the majority of them were of one or two bedrooms only. All apartments were
considered to be in the same category based on the facilities offered (e.g. furniture, electric
appliances and support services). Then, based on the search results, the first eighty 1-2 bedroom
apartments listed due to the randomness generated by Airbnb search engine were chosen and
their hosts were contacted to seek permission to undertake this research. Finally, fifty-six hosts
gave permission to undertake this research.
The required data were collected via a self-administered multi-item structured
questionnaire in Phuket, during March 6-20, 2015. Four appropriately-trained field researchers
were recruited in order to secure a reliable data collection process. A total number of 301
prospective participants were approached and 265 agreed to fill out the questionnaire distributed
to them the day before their departure date. This date varied according to their return flights to
14

their home countries (spread almost uniformly throughout the seven days of the week). In this
way the largest possible portion of respondents’ experience was captured and at the same time
they were provided with enough time to complete the survey. The respondents handed in their
responses during check out, between 12:00 and 15:00 hours. The questionnaire included
questions aimed at obtaining behavioral information regarding Airbnb usage and demographic
details. In order to measure the contributing factors or dimensions of service quality, the 25 items
suggested by Akbaba (2006) were used, whereas the overall service quality perception of Airbnb
guests was measured by the three-item scale proposed by Taylor and Baker (1994). The last
section’s questions explored tourists’ demographic details. To test the items of the questionnaire
a pilot study was carried out, which only resulted in improvements in the questionnaire format.
The survey questionnaire was pre-tested on 30 visitors during March 2-3, 2015 and after few
grammar amendments it was ready for final distribution. In total, a non-probability sample of 217
international English speaking tourists in Thailand resulted from this process. Of those, 3 cases
representing guest perceptions of 3-4 bedroom apartments were excluded to create a pool of data
focusing on guests staying in 1-2 bedroom apartments only. Nonetheless, a thorough examination
of the data after inputting it into SPSS revealed 12 cases that seemed to have an extreme response
style; these cases were removed to avoid distortion of the data quality and the final results.
Consequently, the final usable sample consists of 202 in total.
3.2 Data preparation for analysis
In designing and conducting the main study, we took several steps to eliminate potential
errors (Davidshofer and Murphy, 2005). In particular, a) we ensured that only Airbnb guests
participated so as to reduce the coverage error (Groves, 2004), and b) we achieved a 76.22% final
(202/265) response rate, which suggests that the non-response error is not an issue (Johnson and
15
Owens, 2003). Then, possible measurement errors were prevented through a balanced
formulation of measurement scales (5-point Likert scales). Acquiescence was controlled by
avoiding any usage of vague or ambiguous wording (Knowles and Condon, 1999) and midpoint
responding was also taken into account during the construction of the questionnaire by including
an extra point of response to the 5-point Likert scale, namely “0 = I don’t know/I cannot reply”
(Baumgartner and Steenkamp, 2001).
Sample size considerations were taken into account according to Hair et al. (2011) and
Cohen’s (1992) recommendations. The minimum sample size was determined based on a
statistical power of 80%, with minimum R2 equal to 0.25, the maximum number of arrows
pointing to a latent variable (i.e. overall service quality) is 5, and at a 1% level of significance.
The a-priori minimum sample size estimation was 98. As the final usable sample collected
through the survey was 202 respondents, it can be safely concluded that the minimum sample
size requirements were satisfied.
A series of research actions was applied to enhance the content validity and reliability of
the measurements. The potential dangers of response bias were treated through specific
procedures before, during and after data collection by a) providing a convenient setting for the
respondents, thus reducing situational pressure (Paulhus, 1991) and b) shuffling the order of the
questions for half of the questionnaires distributed (Danaher and Haddrell, 1996).
It is well known that studies examining the relationships among behavioral constructs
using self-reported data (e.g. survey questionnaires) could be affected by common method bias
(MacKenzie and Podsakoff, 2012). Thus, a common latent factor (CLF) was introduced to check
the common variance among all observed variables (Williams et al., 2010). This was performed
16
by comparing the standardized regression weights among the model constructs before and after
introducing CLF (Sreekumar Nair and Ladha, 2014).
Regarding normality of the data, Esposito-Vinzi et al. (2010) suggested that for sample
sizes larger than 200, the multivariate normality assumption is relaxed via an asymptotic
distribution-free estimation offered by PLS algorithm. Nevertheless, to draw safe conclusions
about it, both univariate and multivariate normality were assessed. The results provided in
Appendix B show that univariate normality of the dataset should not be considered as an issue,
since both skewness and kurtosis were within acceptable limits for all indicators as proposed in
the literature (Thode, 2002). Similarly, multivariate normality was examined by checking for
outliers via Cook’s distance (CD). The analysis did not indicate any outliers that could have a
significant impact, as in all cases CD was found to be less than 1 (Stevens, 1984).
3.3 Demographic profile
In the total sample of 202 tourists, 51.5% were male and 48.5% were female, out of which
34.1% were 26-35 years old, 31.2% were 36-45 years old, and 19.8% were 18-25 years old.
Concerning their occupation, 41% were private sector employees, 15.2% students and 14.8%
entrepreneurs. In terms of their educational level, 48.5% had a bachelor’s degree, 28.7% had a
high school diploma, and 13.9% had vocational training qualifications. Concerning their marital
status, 63.3% were married, while 34.6% were single. Regarding the tourists’ area of residence,
44.5% of respondents came from Asia, 22.8% from Europe, 18.8% from the Middle East, and
12.9% from the USA. 89.1% of the tourists had already used service apartments provided by
Airbnb, and the highest rate of usage was 3 to 4 times per year (57.4%) Finally, more than half of
the respondents (51.5%) spent as much as £501 to £600 for staying in Airbnb service apartments,
followed by those who paid between £401 and £500 (26.7%).
17

4. Results
A sequence of data analysis steps was taken in order to safely attain the goals of this
study. First, missing values analysis (MVA) was employed to deal with any missing data. The
results of MVA indicated that missing values are completely random (χ2 = 65.353, df = 94, Sig. =
0.989) (Little, 1988).
During data analysis three distinct actions were taken through implementation of the PLS-
SEM technique to guarantee the best possible statistical outputs (Loureiro and González, 2008).
First, construct reliability and validity were examined; secondly, a factor analysis was employed
in order to prune the indicators that make a small contribution to explaining the latent constructs;
finally, a path analysis with bootstrap generation was implemented to check on the significance
of the relationships between the five facets and the overall perception of service quality.
The factorial scheme of SmartPLS 3.0 was used to conduct a confirmatory factor analysis
(CFA) (Esposito-Vinzi et al., 2010) in order to explicitly specify the pattern of loadings of the
measurement items on the latent constructs in the model. Based on the results obtained from CFA
in the outer model, the convergent validity, discriminant validity, and reliability of all the
multiple-item scales were assessed against the guidelines published in previous literature (Hair et
al., 2010). Internal consistency, composite reliability and average variance extracted (AVE) were
used as measures of reliability and validity, respectively. Cronbach’s alpha values were found to
vary between 0.933 and 0.978, while composite reliability values ranged from 0.957 to 0.982,
both satisfying the condition for alpha, CR>0.70 (Bagozzi and Kimmel, 1995; Hair et al., 2010;)
and AVE values ranged from 0.866 to 0.901, which is higher than the cut-off value of 0.5
(p<0.01) (Fornell and Larcker, 1981). As shown in Table 2. Discriminant validity is checked
18
through comparing the AVE value of each construct to the square of the correlations between that
same construct with the rest of the latent variables.
Shared variance may lead to relationship inflation between independent and dependent
variables (Lindell and Whitney, 2001). To test for common method variance a PLS common
method bias test was employed (Podsakoff et al., 2003). A common method factor was included
in the model which linked all indicators of the theoretical constructs. As a result, all CLF factor
loadings were non-significant at a 0.05 level of significance and the indicators’ variances
obtained were essentially greater than their method variances. The average substantively variance
of the indicators was 0.64, whereas the average method-related variance was equal to 0.013,
resulting to a ratio of 49:1, respectively. Consequently, it is reasonable to conclude that common
method variance should not create serious problems for the validity of our results.
Table 3 presents the square root of AVE in the diagonal, whereas the rest of the values
correspond to the correlations for each pair of constructs. As an outcome, the correlation
coefficients for the inter-constructs were found in all cases to be smaller than the square root of
AVE for each construct. The variance inflation factor (VIF) values were also processed in
SmartPLS 3.0 and found to range between 2.867 and 3.284. Consequently, multicollinearity
should not be of concern for this study since all values are lower than the cut-off value of 3.3 (Ali
et al., 2016) and essentially lower than the ceiling of 10.0 (Altinay et al., 2016). Moreover,
coefficient of determination (R2), effect size (f2) and predictive relevance (Q2) values are
important for quantifying the predictive capabilities of the structural model. The quality heuristic
criteria that were employed show that the model is of high predictive power. The resulting R2
adjusted value for service quality is 0.811 or 81.1%, which shows a substantial effect (>0.75)
according to Henseler et al. (2009); thus, the degree of variance explained for service quality is
19
very high. Then, the changes in R2 value when exogenous variables are omitted from the model
are provided by the f2 effect size; as shown in Table 4, convenience and assurance represent
medium effects, whereas tangibles, understanding & caring, as well as adequacy in service
supply have small ones. Finally, using the blindfolding procedure for executing the Stone-Geisser
test with an omission distance D=7, we conclude that the proposed model has high predictive
relevance for the service quality construct, since Q2=0.700>0 (Hair et al., 2014).
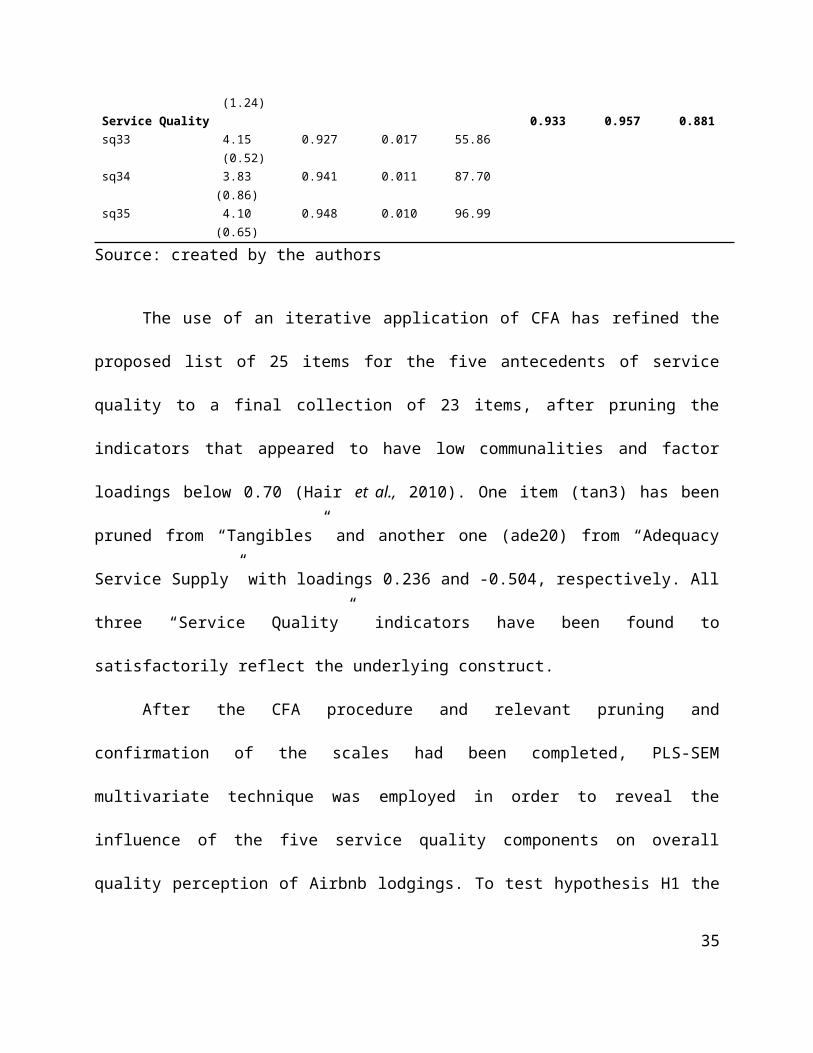
Table 2: Assessment of the final measurement modelConstructs/ Items
Mean (SD) Loadings Std. Error T-statistic Cronbach’s alpha
CR AVE
Tangibles 0.971 0.978 0.897tan4 2.86 (1.05) 0.959 0.005 189.67tan5 3.37 (1.22) 0.957 0.004 230.16tan6 2.76 (1.23) 0.939 0.008 108.86tan7 2.84 (1.02) 0.910 0.008 105.99tan8 2.71 (1.03) 0.971 0.004 276.76Convenience 0.933 0.957 0.882con14 3.07 (1.22) 0.909 0.012 76.38con26 3.79 (1.03) 0.952 0.006 159.82con27 3.74 (0.87) 0.956 0.005 201.02Assurance 0.963 0.973 0.901ass22 3.95 (0.99) 0.970 0.004 251.67ass23 4.08 (0.96) 0.959 0.005 206.17ass24 3.52 (1.12) 0.917 0.009 103.62ass25 3.16 (1.05) 0.951 0.007 129.01Understanding & Caring 0.961 0.970 0.866und15 3.59 (0.87) 0.932 0.010 89.67und17 2.71 (0.98) 0.935 0.009 97.72und18 3.89 (1.12) 0.905 0.010 89.62und19 3.56 (1.09) 0.960 0.004 259.64und21 2.86 (1.10) 0.921 0.010 88.99Adequacy Service Supply 0.978 0.982 0.901ade9 3.85 (0.65) 0.903 0.012 74.22ade10 3.22 (0.88) 0.952 0.005 195.32ade11 3.37 (1.17) 0.963 0.004 214.89ade12 3.38 (1.20) 0.955 0.005 194.37ade13 2.99 (1.27) 0.963 0.004 228.64ade16 3.06 (1.24) 0.956 0.006 166.52Service Quality 0.933 0.957 0.881sq33 4.15 (0.52) 0.927 0.017 55.86sq34 3.83 (0.86) 0.941 0.011 87.70sq35 4.10 (0.65) 0.948 0.010 96.99
Source: created by the authors
20
The use of an iterative application of CFA has refined the proposed list of 25 items for the
five antecedents of service quality to a final collection of 23 items, after pruning the indicators
that appeared to have low communalities and factor loadings below 0.70 (Hair et al., 2010). One
item (tan3) has been pruned from “Tangibles” and another one (ade20) from “Adequacy Service
Supply” with loadings 0.236 and -0.504, respectively. All three “Service Quality” indicators have
been found to satisfactorily reflect the underlying construct.
After the CFA procedure and relevant pruning and confirmation of the scales had been
completed, PLS-SEM multivariate technique was employed in order to reveal the influence of the
five service quality components on overall quality perception of Airbnb lodgings. To test
hypothesis H1 the inner model illustrated in Figure 1 was developed. The significance of the
paths was tested using regression weights and t-statistics (Table 2) to calculate the corresponding
p-values, based on a bootstrapping technique readily available from SmartPLS 3.0.
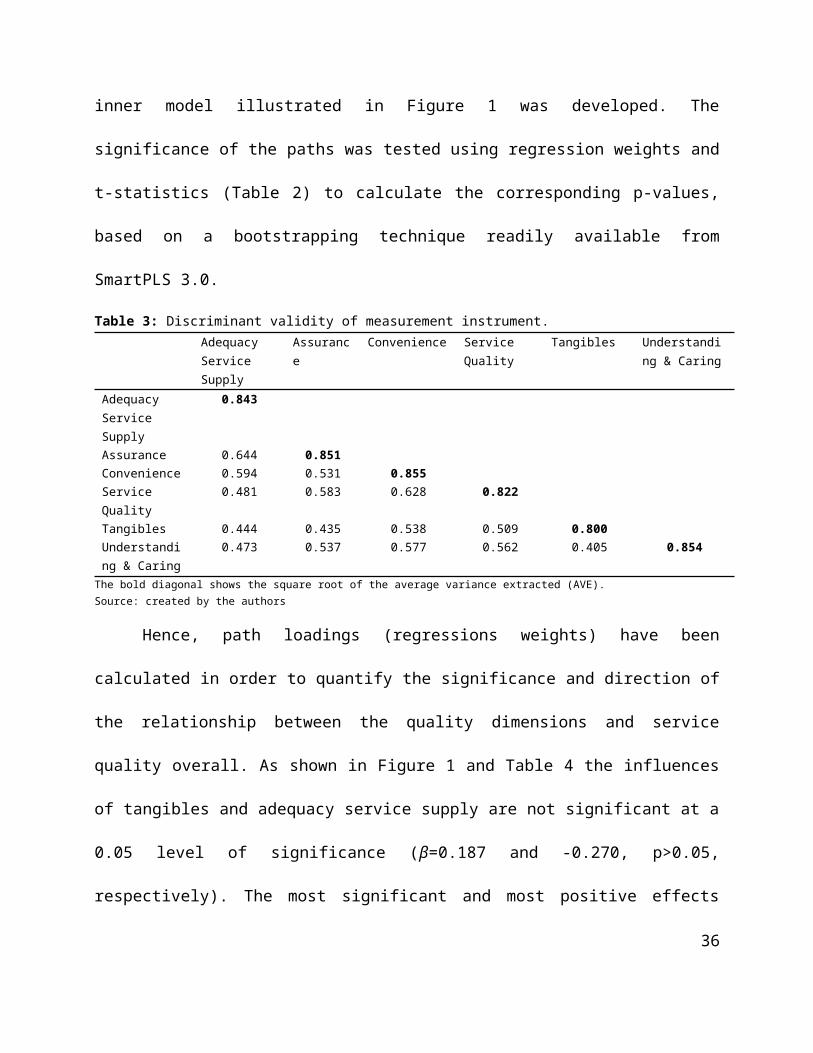
Table 3: Discriminant validity of measurement instrument.Adequacy Service Supply
Assurance Convenience Service Quality
Tangibles Understanding & Caring
Adequacy Service Supply
0.843
Assurance 0.644 0.851Convenience 0.594 0.531 0.855Service Quality 0.481 0.583 0.628 0.822Tangibles 0.444 0.435 0.538 0.509 0.800Understanding & Caring
0.473 0.537 0.577 0.562 0.405 0.854
The bold diagonal shows the square root of the average variance extracted (AVE). Source: created by the authors
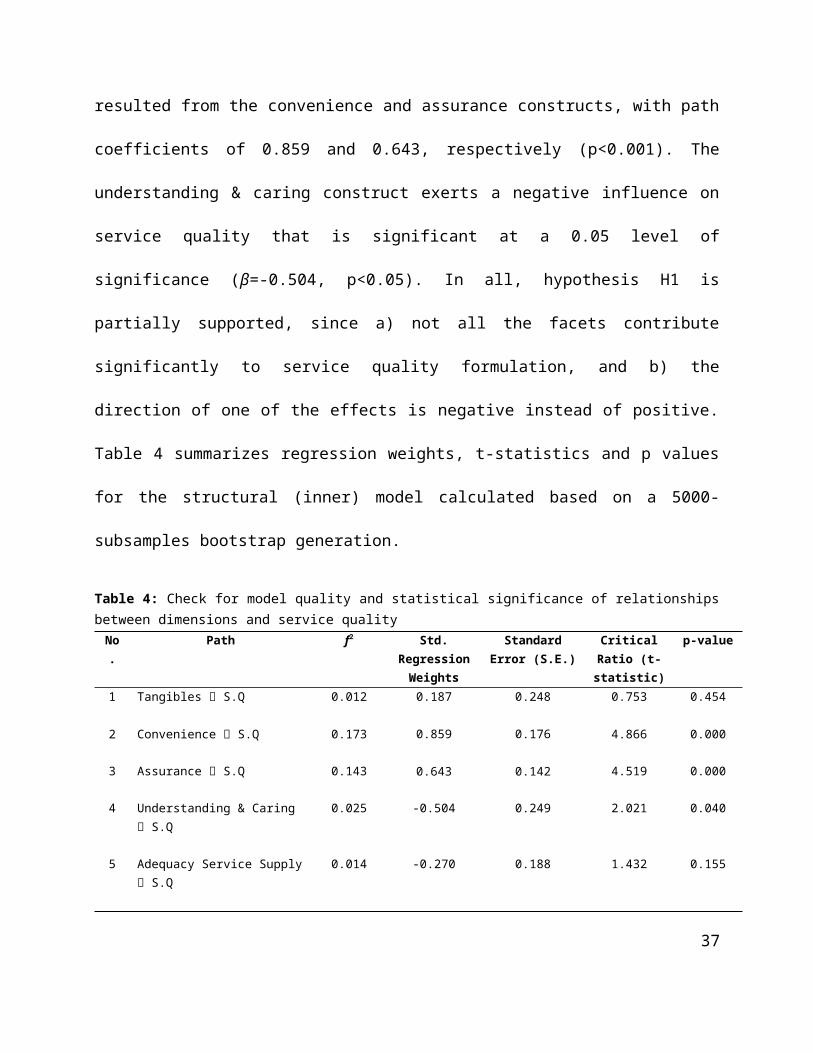
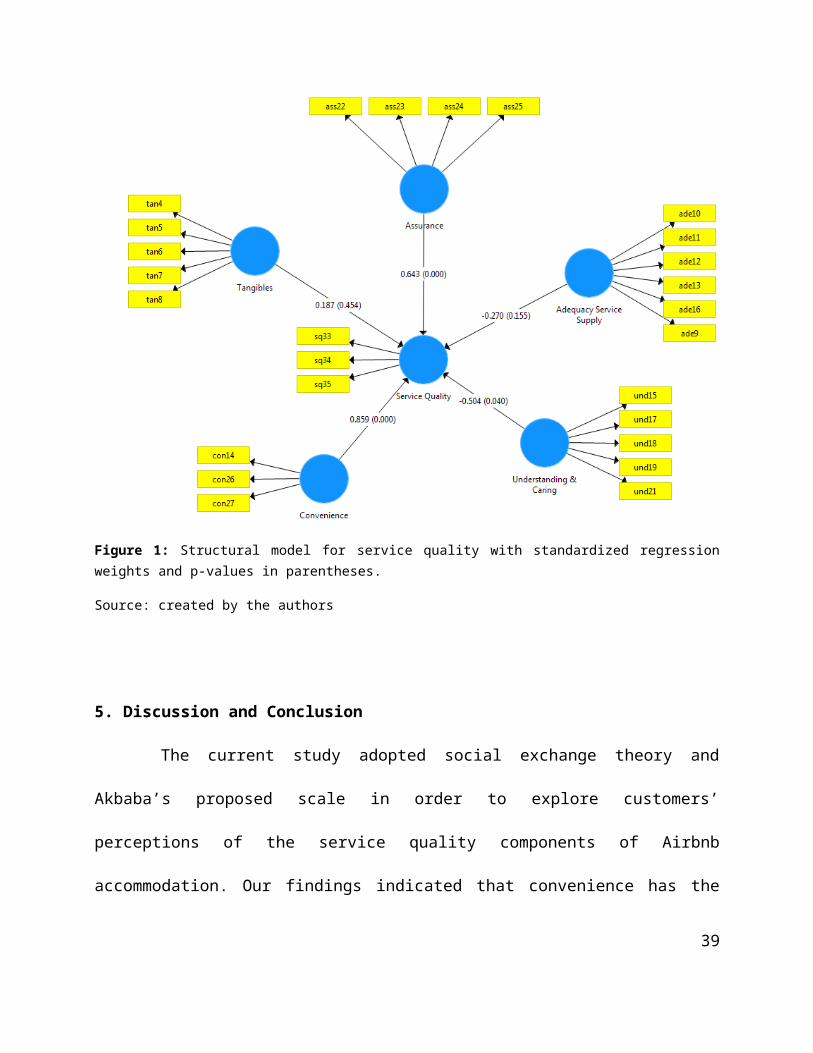
Hence, path loadings (regressions weights) have been calculated in order to quantify the
significance and direction of the relationship between the quality dimensions and service quality
overall. As shown in Figure 1 and Table 4 the influences of tangibles and adequacy service
supply are not significant at a 0.05 level of significance (β=0.187 and -0.270, p>0.05,
21
respectively). The most significant and most positive effects resulted from the convenience and
assurance constructs, with path coefficients of 0.859 and 0.643, respectively (p<0.001). The
understanding & caring construct exerts a negative influence on service quality that is significant
at a 0.05 level of significance (β=-0.504, p<0.05). In all, hypothesis H1 is partially supported,
since a) not all the facets contribute significantly to service quality formulation, and b) the
direction of one of the effects is negative instead of positive. Table 4 summarizes regression
weights, t-statistics and p values for the structural (inner) model calculated based on a 5000-
subsamples bootstrap generation.
Table 4: Check for model quality and statistical significance of relationships between dimensions and service qualityNo. Path f2 Std. Regression
WeightsStandard Error
(S.E.)Critical Ratio
(t-statistic)p-value
1 Tangibles S.Q 0.012 0.187
0.859
0.643
0.248
0.176
0.142
0.753 0.454
2 Convenience S.Q 0.173 4.866 0.000
3 Assurance S.Q 0.143 4.519 0.000
4 Understanding & Caring S.Q 0.025 -0.504 0.249 2.021 0.040
5 Adequacy Service Supply S.Q 0.014 -0.270 0.188 1.432 0.155
Source: created by the authors
22
Figure 1: Structural model for service quality with standardized regression weights and p-values in parentheses.
Source: created by the authors
5. Discussion and Conclusion
The current study adopted social exchange theory and Akbaba’s proposed scale in order
to explore customers’ perceptions of the service quality components of Airbnb accommodation.
Our findings indicated that convenience has the highest relative importance among the service
quality factors included in Akbaba’s measurement scale. The results showed that Airbnb guests
are mainly interested in lodging which has access to certain tourist sights, and in how easy it is to
23
acquire information and how efficiently problems can be resolved during their stay. Assurance
has been ranked as the most important contributor to service quality in various studies of the
hotel industry (i.e., Blešić et al., 2014; Juwaheer and Ross, 2003), while in the study by Knutson
et al. (1990) it ranked second in the hierarchy of importance for evaluating service quality, thus
supporting our findings (see Table 1). Adequacy in service supply is a factor that appears only in
Akbaba’s setting for service quality, which incorporates items related to reliability and
responsiveness according to SERVQUAL dimensionality. This factor’s influence on service
quality perception is not significant, due to the difference between the Airbnb service mix and
that of hotels. Different guest priorities and behavioral changes (Tussyadiah and Pesonen, 2015),
as well as the absence of employed personnel to serve guests’ needs during their stay are deemed
to be distinctive Airbnb traits (Lampinen and Cheshire, 2016). Although, the tangibles dimension
has been reported to be a very important service quality contributor in previous studies (Akbaba,
2006, Ladhari, 2012), it does not exert a significant effect on Airbnb service quality perceptions.
This finding confirms that household equipment and furniture are not of high importance
in formulating Airbnb service quality perceptions (Guttentag, 2015), whereas it is the most
important one in the case of hotel accommodation (Ladhari, 2012). Thus, guests choose Airbnb
accommodation not due to the quality of fixtures, but to experience a more authentic local
experience which is offered at affordable prices (Guttentag, 2015: Richardson, 2015). However,
hotels are run by professionals and guests expect an impersonal ‘corporate’ type experience.
Finally, utilization of PLS-SEM technique showed that understanding and caring have a
significant effect on service quality, a factor which is also significant in the case of hotels. This
last finding reveals guests’ desire to deal with courteous landlords who will offer a pleasant stay
and some minimum services, e.g. in case there is any failure of household equipment that needs
24

to be fixed. At the indicators level of analysis, all items of the service quality measurement model
tested have factor loadings above 0.90. Among these items, the ones that make the highest
contribution to their respective factors are “atmosphere and equipment comfortable and
appropriate” (tan8, 0.975), “provision of services at promised times” (ade13, 0.969),
“understanding the specific needs of guests” (und19, 0.960), “convenient operating hours”
(ass22, 0.971), “reaching information” (con27, 0.960), and “the quality of Airbnb services is…”
(sq35, 0.954). The importance of service quality in the accommodation business, regardless of the
scale used to measure it, has been supported in several studies (i.e., Akbaba, 2006; Juwaheer and
Ross, 2003; Saleh and Ryan, 1991).
5.1 Theoretical Implications
Acknowledging the vital role tourists’ service quality perceptions play in the
accommodation business, and taking into account the development and growing popularity of
emerging business models in the hospitality industry such as Airbnb (Bocken, 2015; Guttentag,
2015; Symons, 2013), this study delineated the factors that influence service quality in social
networking type lodgings. Thus, the current investigation goes one step further in capturing
guests’ service quality perceptions by illustrating the integration of digital technologies in
transforming a traditional sector of the tourism product. This transformation is merely driven by
the social environment dynamics that are reflected in the relationships built between Airbnb hosts
and guests. These dynamics could potentially lead to loyalty and commitment, thus making SET
a proper explanatory framework (Choo and Petrick, 2014; Wayne et al., 1997).
From a theoretical prism, the current study offers some important theoretical insights. It
examined the service quality concept in the sharing economy context and particularly in Airbnb
accommodation, where empirical findings are scant. In addition to indicating the significant and
25
non-significant factors influencing the formation of overall quality perceptions, this study
explored the relative importance of the factors, thus resulting to a specific ranking of them. The
findings indicated that among the five service quality factors, ‘convenience’ and ‘assurance’
followed by ‘understanding and caring’ have been indicated by the respondents as the most
critical contributors to their service quality perceptions of Airbnb two-bedroom flats. Most items
supporting measurement of these three factors are mainly related to maintaining the functional
aspects of accommodation high standards, implying that guests would possibly place less
importance on the tangible elements of the lodging itself and more on using the Airbnb flat as a
springboard to discover the destination. Our findings confirmed the manifold structure of the
service quality construct, as well as the interactive nature of service quality perceptions, thus
corroborating the applicability of SET in theoretically supporting the operationalization of the
service quality concept in Airbnb accommodation. The social interactions between guests and
hosts seem to play a decisive role in shaping overall service quality perceptions.
The contribution of this study in unraveling the complex nature of service quality in
Airbnb accommodation is of utmost importance. From a consumer standpoint, the services
provided by the specific Airbnb lodgings, are perceived as quite distinctive to those of hotels and
are potentially associated with different expectations and different kinds of service evaluation by
guests (Tussyadiah, 2016). In a similar vein, although travelers’ motives for using the Airbnb
business model are merely financial, it has been argued that they are very much interested in
developing meaningful social interactions with their hosts (Tussyadiah and Pesonen, 2015). Thus,
in the area of social networking hospitality a household approach instead of a corporate one
seems to be particularly valued by those guests who are in constant search of authentic
experiential services (Symons, 2013). This could partly explain why tangibles are not considered
26
to be significant for guests’ evaluation of service quality when considering the Airbnb rented
flats. This observation implies that guests perceive their stay in Airbnb lodgings as a pivotal part
of their holistic travel experience, due to the flexible, friendly and practical style of Airbnb
accommodation.
5.2 Managerial Implications
Since service quality has a significant effect on guests’ satisfaction and retention, as well
as on lodgings’ financial performance and competitive advantage (Chen and Chen, 2014; Stylos
and Vassiliadis, 2015; Wu and Ko, 2013; Yang et al., 2011), the current research study has some
key managerial implications for networking hospitality and one-to-two-bedroom Airbnb flats in
particular. Hence, in addition to its theoretical importance, this study sought to offer valuable
advice to hospitality practitioners interested in Airbnb. Focusing on apartments with the selected
set of attributes makes our findings of interest to hosts listing apartments for rental in similar
tourism destinations. Thus, managers and hosts of this specific type of accommodation would
potentially benefit from prioritizing the implementation of the Airbnb-specific service quality
factors into their marketing activities (Kamenidou et al., 2009).
Specifically, given that convenience is a critical quality factor, hosts in cooperation with
Airbnb managers need to have a customer complaints management system in place e.g. in the
form of user-friendly software. Furthermore, it is of utmost importance to facilitate guests’ access
to the Airbnb lodging at any time by providing an online information package to avoid confusion
and disappointment, especially when trying to locate it for the first time. In relation to assurance,
it does not come as a surprise that guests are particularly interested in getting some form of
affirmation that the lodgings’ furniture, equipment and household supplies are in good condition.
Information regarding the safety of the areas or neighborhoods surrounding the lodgings should
27
also be included in the information provided to prospective guests through the Airbnb platform.
In a similar vein, it is likely that the existence of any additional lodging safety features such as
integrated security systems (intrusion detectors, alarms and other electronics) would be positively
evaluated by prospective guests in selecting the right lodging for their needs. Furthermore,
information about any sophisticated safeguard features at the Airbnb lodgings should also be well
provided in the Airbnb listings.
Regarding the ‘understanding and caring’ factor of service quality, Airbnb hosts should
treat their guests in a friendly manner. This could possibly motivate tourists to select an Airbnb
lodging instead of a hotel room/suite. For example, contacting the guests after a reservation has
been made to ask about individual needs, arrangements and preferences upon their arrival at the
lodging would be viewed as outstandingly hospitable behavior. Moreover, hosts should be keen
to enable their guests to have an unforgettable experience during their stay at the Airbnb lodgings
and the tourist destination. This could happen in various ways, such as offering their guests hints
and tips about sightseeing, restaurant options, and smart transportation. This would potentially
help the guests make optimum use of their time spent at the tourist destination, as well as increase
the value/money rate. Overall, the findings of our study could assist hosts of Airbnb flats in
better understanding how each of the service quality dimensions can contribute to a pleasant
experience, which in turn would possibly affect intention to revisit the same lodgings, as well as
intention to recommend (e.g. positive word of mouth).
5.3. Limitations and Future Research
Although the study revealed meaningful results and provides some important insights into
the current literature, it is not without limitations. Airbnb is the largest network for renting
private properties to tourists, but it is not the only one. Despite the appropriateness of using the
28
measurement tool provided by Akbaba (2006), it is not the only tool for measuring service
quality. Ladhari (2009) identified SERVQUAL as the most useful instrument for service‐quality
research. In this vein, the current study used Akbaba’s (2006) model which is based on
SERVQUAL. Similar studies can be done with other types of service quality instruments and the
results might be different in different contexts with different models. Therefore, the
aforementioned findings should be cross-validated using other measurement instruments, such as
LQI. Also, it would be useful to examine the service quality dimensions of lodgings rented
through the social networking industry with respect to locations other than Thailand. Moreover,
future research should include lodgings promoted by various social networking channels. This
research has set the path for further studies in the service quality domain. Further research could
be conducted on other types of Airbnb accommodation such as on-site hospitality, since this
research focused only on remote hospitality. Furthermore, future studies on service quality in the
hospitality industry could aim to compare guests’ experience at Airbnb accommodation with their
experience at hotels. Finally, forthcoming research studies could consider other factors such as
the location of the flat and particular amenities, and also explore Airbnb hosts and guests’
perceptions of service quality.
References
Akan, P. (1995), “Dimensions of service quality: a study in Istanbul”, Managing Service Quality:
An International Journal, Vol. 5 No. 6, pp. 39-43.
Akbaba, A. (20060, “Measuring service quality in the hotel industry: A study in a business hotel
in Turkey”, International Journal of Hospitality Management, Vol. 25 No. 2, pp.170-192.
29
Albacete-Saez, C.A., Fuentes-Fuentes, M.M. and Lloréns-Montes, F.J. (2007), “Service quality
measurement in rural accommodation”, Annals of Tourism Research, Vol. 34 No. 1, pp.
45-65.
Ali, F., Amin, M. and Cobanoglu, C. (2016), “An integrated model of service experience,
emotions, satisfaction, and price acceptance: an empirical analysis in the Chinese
hospitality industry”, Journal of Hospitality Marketing & Management, Vol. 25 No. 4, pp.
449-475.
Altinay, L., Paraskevas, A. and Jang, S.S. (2016), Planning Research in Hospitality and Tourism.
2nd ed., Routledge.
Bagozzi, R. and Kimmel, S.K. (1995), “A comparison of leading theories for the prediction of
goal-directed behaviours”, British Journal of Social Psychology, Vol. 34 No. 4, pp. 437-
461.
Baumgartner, H. and Steenkamp, J-B.E.M. (2001), “Response styles in marketing research: A
cross-national investigation”, Journal of Marketing Research, Vol. 38 No. 2, pp.143–156.
Belk, R. (2010), “Sharing”, Journal of Consumer Research, Vol. 36 No. 5, pp.715– 734.
Belk, R. (2014), “You are what you can access: Sharing and collaborative consumption online”,
Journal of Business Research, No. 67 No. 8, pp. 1595-1600.
Blešić, I., Popov-Raljić, J., Uravić, L., Stankov, U., Đeri, L., Pantelić, M. and Armenski, T.
(2014), “An importance-performance analysis of service quality in spa hotels”, Economic
Research-Ekonomska Istraživanja, Vol. 27 No. 1, pp. 483-495.
Bocken, N.M.P. (2015). Sustainable venture capital–catalyst for sustainable start-up success?.
Journal of Cleaner Production, 108, 647-658.
30
Botsman, R. and Rogers, R. (2010), What is Mine is Yours: The Rise of Collaborative
Consumption. Harper Business, New York.
Briggs, S., Sutherland, J. and Drummond, S. (2007), “Are hotels serving quality? An exploratory
study of service quality in the Scottish hotel sector”, Tourism Management, Vol. 28 No.
4, pp. 1006-1019.
Brady, M.K. and Cronin Jr, J.J. (2001), “Some new thoughts on conceptualizing perceived
service quality: a hierarchical approach”, Journal of Marketing, Vol. 65 No. 3, pp. 34-49.
Brady, M. K., Cronin, J. J., & Brand, R. R. (2002). Performance-only measurement of service
quality: a replication and extension. Journal of Business Research, 55(1), 17-31.
Buttle, F. (1996), “SERVQUAL: Review, critique, research agenda”, European Journal of
Marketing, Vol. 30 No. 1, pp. 8-32.
Carr, A., 2013. Airbnb by the numbers: 85% of users inactives? Fast Company, Retrieved from
http://www.fastcompany.com/1835654/airbnb-numbers-85-users-inactive Accessed April
1st, 2014].
Caruana, A. (2002), “Service loyalty: The effects of service quality and the mediating role of
customer satisfaction”, European Journal of Marketing, Vol. 36 Vol. 7/8, pp.811 – 828.
Chen, W-J. and Chen, Mi-L. (2014), “Factors affecting the hotel's service quality: Relationship
marketing and corporate image”. Journal of Hospitality Marketing & Management, Vol.
23 No. 1, pp. 77-96.
Cheng, M. (2016), “Sharing economy: A review and agenda for future research”, International
Journal of Hospitality Management, Vol. 57, pp. 60-70.
Choo, H. and Petrick, J.F. (2014), “Social interactions and intentions to revisit for agritourism
service encounters”, Tourism Management, Vol. 40, pp. 372-381.
31
Chua, B.L., Lee, S., Goh, B. and Han, H. (2015), “Impacts of cruise service quality and price on
vacationers’ cruise experience: Moderating role of price sensitivity”, International
Journal of Hospitality Management, Vol. 44, 131-145.
Churchill Jr, G. A., & Surprenant, C. (1982). An investigation into the determinants of customer
satisfaction. Journal of Marketing Research, 491-504.
Cohen, J. (1988), Statistical Power Analysis for the Behavioral Sciences, 2nd ed. Lawrence
Erlbaum, Hillsdale, NJ.
Cohen, J. (1992). A power primer. Psychological bulletin, 112(1), 155-159.
Cronin Jr, J.J. and Taylor, S.A. (1992), “Measuring service quality: a reexamination and
extension”, Journal of Marketing, Vol. 56 No. 3, pp. 55-68.
Danaher, P.J. and Haddrell, V. (1996), “A comparison of question scales used for measuring
customer satisfaction”, International Journal of Service Industry Management”, Vol. 7
No. 4, pp. 4-26.
Davidshofer, C.O. and Murphy, K.R. (2005), Psychological Testing: Principles and Applications
6th ed., Pearson/Prentice, Upper Saddle River, NJ.
Dedeoglu, B.B. and Demirer, H. (2015), “Differences in service quality perceptions of
stakeholders in the hotel industry”, International Journal of Contemporary Hospitality
Management, Vol. 27 No. 1, pp.130-146.
Dredge, D. and Gyimóthy, S. (2015), “The collaborative economy and tourism: Critical
perspectives, questionable claims and silenced voices”, Tourism Recreation
Research, Vol. 40 No. 3, pp. 286-302.
32

Ekinci, Y. (2002), “A review of theoretical debates on the measurement of service quality:
Implications for hospitality research”, Journal of Hospitality & Tourism Research, Vol.
26 No. 3, pp.199-216.
Emerson, R.M. (1976), “Social exchange theory”, Annual Review of Sociology, Vol. 2, pp. 335-
362.
Ert, E., Fleischer, A. and Magen, N. (2016), “Trust and reputation in the sharing economy: The
role of personal photos in Airbnb”, Tourism Management, Vol. 55, pp. 62-73.
Esposito-Vinzi, V., Trinchera, L. and Amato, S. (2010), “PLS path modeling: From foundations
to recent developments and open issues for model assessment and improvement”, in
Vincenzo Esposito-V., Chin, W.W., Henseler, J., Wang, H., (Eds.), Handbook of Partial
Least Squares: Concepts, Methods and Applications. Springer-Verlag, Berlin, pp. 47-82.
Fornell, C. and Larcker, D. F. (1981), “Evaluating structural equation models with unobservable
variables and measurement error”, Journal of Marketing Research, Vol. 18 No. 1, pp. 39-
50.
Gansky, L. (2010), The Mesh: Why the Future of Business is Sharing, Penguin Group, New
York.
Germann Molz, J. (2011), “CouchSurfing and network hospitality: ‘It’s not just about the
furniture”, Hospitality and Society, Vol. 1 No. 3, pp. 215–225.
Germann Molz, J. (2014), “Toward a network hospitality”, First Monday, Vol. 19 No. 3,
available at: http://ojs-prod-lib.cc.uic.edu/ojs/index.php/fm/article/view/4824/3848.
Getty, J.M. and Getty, R.L. (2003), “Lodging quality index (LQI): assessing customers'
perceptions of quality delivery”, International Journal of Contemporary Hospitality
Management, Vol. 15 No. 2, pp. 94-104.
33

Getty, J.M. and Thompson, K.N. (1994), “A procedure for scaling perceptions of lodging
quality”, Journal of Hospitality Research, Vol. 18 No. 2, pp. 75-96.
Grönroos, C. (1982), “An applied service marketing theory”, European Journal of Marketing,
Vol. 16 No 7, pp. 30-41.
Groves, R.M. (2004), Survey Errors and Survey Costs, John Wiley & Sons, New York.
Guttentag, D. (2015), “Airbnb: disruptive innovation and the rise of an informal tourism
accommodation sector”, Current Issues in Tourism, Vol. 18 No. 12, pp. 1192-1217.
Hair, J. F., Ringle, C. M. and Sarstedt, M. (2011), “PLS-SEM: Indeed a silver bullet”, Journal of
Marketing Theory and Practice, Vol. 19 No. 2, pp.139-152.
Hair Jr, J. F., Hult, G. T. M., Ringle, C. and Sarstedt, M. (2014), A Primer on Partial Least
Squares Structural Equation Modeling (PLS-SEM), Sage, Thousand Oaks, CA.
Hair, J.F.Jr., Black, W.C., Babin, B.J. and Anderson, R.E. (2010), Multivariate Data Analysis,
7th ed., Pearson Prentice Hall, Upper Saddle River, NJ.
Hellwig, K., Morhart, F., Girardin, F. and Hauser, M. (2015, “Exploring different types of
sharing: A proposed segmentation of the market for “sharing” businesses”, Psychology &
Marketing, Vol. 32 No. 9, pp. 891-906.
Henseler, J., Ringle, C.M. and Sinkovics, R.R. (2009), “The use of partial least squares path
modeling in international marketing”, Advances in International Marketing, Vol. 20, pp.
277-320.
Heo, C. Y. (2016), “Sharing economy and prospects in tourism research”, Annals of Tourism
Research, Vol. 58, pp.166-170.
34
Hinkin, T.R., Tracey, J.B. and Enz, C.A. (1997), “Scale construction: Developing reliable and
valid measurement instruments”, Journal of Hospitality & Tourism Research, Vol. 21 No.
1, pp. 100-120.
Hu, H. H., Kandampully, J. and Juwaheer, T. D. (2009), “Relationships and impacts of service
quality, perceived value, customer satisfaction, and image: an empirical study”, The
Service Industries Journal, Vol.29 No 2, pp. 111-125.
Ikkala, T. and Lampinen, A. (2015), “Monetizing network hospitality: Hospitality and
sociability in the context of Airbnb”, In Proceedings of the 18th ACM Conference on
Computer Supported Cooperative Work & Social Computing, pp. 1033-1044.
Johns, N. and Lee-Ross, D. (1995), “Profile accumulation: a quality assessment technique for
hospitality SMEs”, in Teare, R. and Armistead C. (eds), Services Management: New
Directions and Perspectives, Cassell, London, pp. 101–104.
Johns, N., Lee-Ross, D. and Ingram, H. (1997), “A study of service quality in small hotels and
guesthouses”, Progress in Tourism and Hospitality Research, Vol. 3 No. 4, pp. 351-363
Johnson, T. and Owens, L. (2003), “Survey response rate reporting in the professional literature”,
in 58th Annual Meeting of the American Association for Public Opinion Research,
Nashville, TN, USA, pp. 127–133.
Juwaheer, D.T. (2004), “Exploring international tourists' perceptions of hotel operations by using
a modified SERVQUAL approach-a case study of Mauritius”, Managing Service Quality:
An International Journal, Vol. 14 No. 5, pp. 350-364.
Juwaheer, T.D. and Ross, D.L. (2003), “A study of hotel guest perceptions in Mauritius”,
International Journal of Contemporary Hospitality Management, Vol. 15 No. 2, pp.105-
115.
35
Kamenidou, I., Balkoulis, N. and Priporas, C.V. (2009), “Hotel business travellers satisfaction
based on service quality: A segmentation approach in inner city five-star hotels”,
International Journal of Leisure and Tourism Marketing, Vol. 1 No. 2, pp. 152-172.
Kandampully, J., Juwaheer, T. D. and Hu, H-H. (2011), “The influence of a hotel firm’s quality
of service and image and its effect on tourism customer loyalty”, International Journal of
Hospitality & Tourism Administration, Vol. 12 No. 1, pp. 21–42.
Kang, J.S., Chiang, C.F., Huangthanapan, K. and Downing, S. (2015), “Corporate social
responsibility and sustainability balanced scorecard: The case study of family-owned
hotels”, International Journal of Hospitality Management, Vol. 48, pp. 124-134.
Knowles, E.S. and Condon, C.A. (1999), “Why people say "yes": A dual-process theory of
acquiescence”, Journal of Personality and Social Psychology, Vol. 77 No. 2, pp. 379-386.
Knutson, B., Stevens, P., Wullaert, C., Patton, M. and Yokoyama, F. (1990), LODGSERV: A
service quality index for the lodging industry”, Journal of Hospitality & Tourism
Research, Vol. 14 No. 2, pp. 277-284.
Kostagiolas, P., Korfiatis, N., Kourouthanasis, P., & Alexias, G. (2014). Work-related factors
influencing doctors search behaviors and trust toward medical information resources.
International Journal of Information Management, 34(2), 80-88.
Ladhari, R. (2009), “Service quality, emotional satisfaction, and behavioural intentions: a study
in the hotel industry”, Managing Service Quality, Vol. 19 No. 3, pp. 308-331.
Ladhari, R. (2012), “The lodging quality index: an independent assessment of validity and
dimensions”, International Journal of Contemporary Hospitality Management, Vol. 24
No. 4, pp. 628-652.
36
Lampinen, A. and Cheshire, C. (2016), Hosting via Airbnb: Motivations and financial assurances
in monetized network hospitality. In Proceedings of the 2016 CHI Conference on Human
Factors in Computing Systems, pp. 1669-1680.
Lehtinen, U. and Lehtinen, J. R. (1982), Service quality: a study of quality dimensions, Service
Management Institute.
Lewis, B.R. and Mitchell, V.W. (1990), “Defining and measuring the quality of customer
service”, Marketing Intelligence & Planning, Vol. 8 No. 6, pp. 11-17.
Lewis, R. C. and Booms, B. H. (1983), “The marketing aspects of service quality”, Emerging
Perspectives on Services Marketing, Vol. 65 No. 4, pp. 99-107.
Lindell, M. K. and Whitney, D.J. (2001), “Accounting for common method variance in cross-
sectional research designs”, Journal of Applied Psychology, Vol. 86 No. 1, pp. 114-121.
Loureiro, S.M.C. and González, F.J.M. (2008), “The importance of quality, satisfaction, trust,
and image in relation to rural tourist loyalty”, Journal of Travel & Tourism Marketing,
Vol. 25 No. 2, 117–136.
MacKenzie, S.B. and Podsakoff, P.M. (2012), “Common method bias in marketing: causes,
mechanisms, and procedural remedies”, Journal of Retailing, Vol. 88 No. 4, pp. 542-555.
Maghzi, A., Abbaspour, B., Eskandarian, M. and Hamid, A.B.A. (2011), “Brand trust in hotel
industry: Influence of service quality and customer satisfaction”, in 2nd International
Conference on Business, Economics and Tourism Management, Singapore, pp. 42-26.
Markovic, S. and Raspor, S. (2010), “Measuring perceived service quality using SERVQUAL: A
case study of the Croatian hotel industry”, Management, Vol. 5 No. 3, pp. 195-209.
37

Mohsin, A. and Lockyer, T. (2010), “Customer perceptions of service quality in luxury hotels in
New Delhi, India: an exploratory study”, International Journal of Contemporary
Hospitality Management, Vol. 22 No. 2, pp. 160-173.
Narangajavana, Y. and Hu, B. (2008), “The relationship between the hotel rating system, service
quality improvement, and hotel performance changes: A canonical analysis of hotels in
Thailand”, Journal of Quality Assurance in Hospitality & Tourism, Vol. 9 No. 1, pp. 34-
56.
Oskam, J. and Boswijk, A. (2016), “Airbnb: the future of networked hospitality businesses”,
Journal of Tourism Futures, Vol. 2 No. 1, pp. 22-42.
Ozment, J. and Morash, E.A. (1994), “The augmented service offering for perceived and actual
service quality”, Journal of the Academy of Marketing Science, Vol. 22 No. 4, pp. 352-
363.
Parasuraman, A., Zeithaml, V.A., and Berry, L.L. (1985), “A conceptual model of service quality
and its implications for future research”, Journal of Marketing, Vol. 49 No. 4, pp. 41-50.
Parasuraman, A., Zeithaml, V.A., and Berry, L.L. (1988), “SERVQUAL: A multiple item scale
for measuring consumer perceptions of service quality”, Journal of Retailing, Vol. 64
No. 1, pp. 12-40.
Paulhus, D. (1991), “Measurement and control of response bias”, in Robinson, J., Shaver, P.R.,
Wrightsman, L.S. (Eds.), Measures of Personality and Social Psychological Attitudes,
Vol. 1Academic Press, New York, pp. 17–59.
Petrick, J. F. (2004), “The roles of quality, value, and satisfaction in predicting cruise passengers’
behavioral intentions”, Journal of Travel Research, Vol. 42 No. 4, pp. 397-407.
Podsakoff, P.M., MacKenzie, S.B., Lee, J-Y., and Podsakoff, N.P. (2003), Common method
38
biases in behavioral research: A critical review of the literature and recommended
remedies”, Journal of Applied Psychology, Vol. 88 No. 5, pp. 879-903.
PriceWaterhouseCoopers. (2015), The Sharing Economy. Consumer Intelligence Series, available
at: https://www.pwc.com/us/en/industry/entertainment-media/publications/consumer-
intelligence-series/assets/pwc-cis-sharing-economy.pdf.
Rahimi, R. and Gunlu, E. (2016), “Implementing customer relationship management (CRM) in
hotel industry from organizational culture perspective: case of a chain hotel in the UK”,
International Journal of Contemporary Hospitality Management, Vol. 28 No. 1, pp. 89-
112.
Rahimi, R. and Kozak, M. (2016), “Impact of customer relationship management on customer
satisfaction: The case of a budget hotel chain”, Journal of Travel & Tourism Marketing,
pp. 1-12.
Rauch, D.A., Collins, M.D., Nale, R.D., and Barr, P.B. (2015), “Measuring service quality in
mid-scale hotels”, International Journal of Contemporary Hospitality Management, Vol.
27 No .1, pp. 87-106.
Raza, M.A., Siddiquei, A.N., Awan, H.M. and Bukhari, K. (2012), “Relationship between service
quality, perceived value, satisfaction and revisit intention in hotel industry”,
Interdisciplinary Journal of Contemporary Research in Business, Vol. 4 No. 8, pp. 788-
805.
Renganathan, R. (2011), “Service quality in hospitality services: Gap model and factor analysis”,
European Journal of Social Sciences, Vol. 26 No. 2, pp. 159–175.
Richard, B. and Cleveland, S. (2016), “The future of hotel chains branded marketplaces driven by
the sharing economy”, Journal of Vacation Marketing, doi:1356766715623827.
39
Richardson, L. (2015), “Performing the sharing economy”, Geoforum, Vol. 67, pp. 121-129.
Saleh, F. and Ryan, C. (1991), “Analysing service quality in the hospitality industry using the
SERVQUAL model”, Service Industries Journal, Vol. 11 No. 3, pp. 324-345.
Sasser, W.E., Olsen, R.P. and Wyckoff, D.D. (1978), Management of Service Operations: Text,
Cases, and Readings. Allyn & Bacon.
Shostack, G.L. (1977), “Breaking free from product marketing”, Journal of Marketing, Vol.41
No. 2, pp. 73-80.
Shuford, J. (2015), “Hotel, motel, holiday inn and peer-to-peer rentals: The sharing economy,
North Carolina and the constitution”, North Carolina Journal of Law & Technology,
Online edition, Vol. 16, pp. 301-337.
Sierra, J.J. and McQuitty, S. (2005), “Service providers and customers: social exchange theory
and service loyalty”, Journal of Services Marketing, Vol. 19 No. 6, pp. 392-400.
Sigala, M. (2014), “Collaborative commerce in tourism: implications for research and
industry”, Current Issues in Tourism, doi.org/10.1080/13683500.2014.982522.
Sivadas, E. and Baker‐Prewitt, J.L. (2000), “An examination of the relationship between service
quality, customer satisfaction, and store loyalty”, International Journal of Retail &
Distribution Management, Vol. 28 No. 2, pp.73-82.
Skidmore, W. (1975), Theoretical Thinking in Sociology, Cambridge University Press, London.
Solnet, D.J., Paulsen, N. and Cooper, C. (2010), “Decline and turnaround: A literature review and
proposed research agenda for the hotel sector”, Current Issues in Tourism, Vol. 13 No. 2,
pp. 139-159.
Sreekumar Nair, A. and Ladha, R. (2014), “Determinants of non-economic investment goals
among Indian investors”, Corporate Governance, Vol. 14 No. 5, pp. 714-727.
40
Stylos, N. and Vassiliadis, C. (2015), “Differences in sustainable management between four-and
five-star hotels regarding the perceptions of three-pillar-sustainability”, Journal of
Hospitality Marketing & Management, Vol. 24 No. 8, pp. 791-825
Symons, M. (2013). “The rise of the restaurant and the fate of hospitality”, International Journal
of Contemporary Hospitality Management, Vol. 25 No. 2, pp. 247-263.
Taylor, S.A. and Baker, T.L. (1994), “An assessment of the relationship between service quality
and customer satisfaction in the formation of consumers’ purchase intentions”, Journal of
Retailing, Vol. 70 No. 2, pp. 163–78.
Tussyadiah, I.P. and Pesonen, J. (2015), “Impacts of peer-to-peer accommodation use on travel
patterns”, Journal of Travel Research, doi: 0047287515608505.
Tussyadiah, I.P. (2016), “Factors of satisfaction and intention to use peer-to-peer
accommodation”, International Journal of Hospitality Management, Vol. 55, pp. 70-80.
Tussyadiah, I.P. and Pesonen, J. (2016), “Drivers and barriers of peer-to-peer accommodation
stay–an exploratory study with American and Finnish travelers”, Current Issues in
Tourism, doi: /10.1080/13683500.2016.1141180
UNWTO. (2015), UNWTO Tourism Highlights, 2015 Edition, http://mkt.unwto.org. Accessed
Feb 15, 2016.
Wayne, S.J., Shore, L.M. and Liden, R.C. (1997), “Perceived organizational support and leader-
member exchange: A social exchange perspective”, Academy of Management Journal,
Vol. 40 No. 1, pp. 82-111.
Williams, L.J., Hartman, N. and Cavazotte, F. (2010), “Method variance and marker variables: A
review and comprehensive CFA marker technique”, Organizational Research Methods,
Vol. 13 No. 3, pp. 477-514.
41
Wilkins, H., Merrilees, B. and Herington, C. (2007), “Towards an understanding of total service
quality in hotels”, International Journal of Hospitality Management, Vol. 26 No. 4, pp.
840-853.
Wu, H.C. and Ko, Y.J. (2013), “Assessment of service quality in the hotel industry”, Journal of
Quality Assurance in Hospitality & Tourism, Vol. 14 No. 3, pp. 218-244.
Yang, C.C., Jou, Y.T., and Cheng, L.Y. (2011), “Using integrated quality assessment for hotel
service quality”, Quality & Quantity, Vol. 45 No. 2, pp. 349-364.
Zervas, G., Proserpio, D. and Byers, J. (2014), The rise of the sharing economy: Estimating the
impact of Airbnb on the hotel industry. Boston U. School of Management Research Paper,
(2013-16).
42
Appendix A. Measurement items for study constructs
Construct Measurement itemsTangibles Food and beverages served (tan3)(Strongly disagree [1] – Strongly agree [5])
Adequate capacity (tan4)
Modern looking equipment (tan5)The equipment of the lodging works properly (tan6)Materials associated with the services are adequate and sufficient (tan7)Atmosphere and equipment comfortable and appropriate (tan8)
Adequacy Service Supply Providing the services as they were promised (ade9)(Strongly disagree [1] – Strongly agree [5])
Performing the services right the first time (ade10)
Airbnb owners are always willing to serve (ade11)Airbnb owners are always available when needed (ade12)Provision of services at promised times (ade13)Consistency in services (ade16)Providing prompt service (ade20)
Understanding & Caring Flexibility in services (und15)(Strongly disagree [1] – Strongly agree [5])
Providing assistance in other required areas (und17)
Treating guests in a friendly manner (und18)Understanding the specific needs of guests (und19)Individualized attention (und21)
Assurance Convenient operating hours (ass22)(Strongly disagree [1] – Strongly agree [5])
Providing a safe and secure place (ass23)
Instilling confidence in guests (ass24)Occupational knowledge of Airbnb owners (ass25)
Convenience Resolving guest complaints (con14)(Strongly disagree [1] – Strongly agree [5])
Ease of access to the lodging (con26)
Reaching information (con27)Service Quality I believe that the general quality of Airbnb services is low (sq33)(Strongly disagree [1] – Strongly agree [5]
Overall, I consider Airbnb services to be excellent (sq34)
or Poor [1] – Excellent [5]) The quality of Airbnb services is generally __________ (sq35)
Source: created by the authors
43
Appendix B. Skewness and Kurtosis measures for the indicators
N Skewness Kurtosis
Statistic Statistic Std. Error Statistic Std. Error
tan4 202 -.268 .172 -.717 .342
tan5 202 -.606 .172 -.565 .342
tan6 202 .114 .172 -.733 .342
tan7 202 .264 .172 -.535 .342
tan8 202 .166 .172 -.677 .342
con14 202 -.392 .172 .419 .342
con26 202 .115 .172 -.632 .342
con27 202 -.622 .172 -.593 .342
ass22 202 -.140 .172 -.710 .342
ass23 202 -.017 .172 -.670 .342
ass24 202 -.278 .172 -.550 .342
ass25 202 -.170 .172 -.738 .342
und15 202 -.226 .172 -.814 .342
und17 202 .117 .172 -.393 .342
und18 202 -.536 .172 .774 .342
und19 202 -.639 .172 -.344 .342
und21 202 .036 .172 -.644 .342
ade9 202 -.726 .172 .656 .342
ade10 202 -.654 .172 .515 .342
ade11 202 -.699 .172 .264 .342
ade12 202 -.288 .172 -.341 .342
44
ade13 202 -.543 .172 -.344 .342
ade16 202 -.647 .172 .420 .342
sq33 202 -.474 .172 .749 .342
sq34 202 -.522 .172 .693 .342
sq35 202 -.609 .172 .845 .342
Source: created by the authors
45


![Draft Thesis Preface November 2002 - Home - …wlv.openrepository.com/wlv/bitstream/2436/315320/10/8... · Web viewGat, Azar [2000], British Army Theory and the Rise of the Panzer](https://img.pdfslide.us/doc/110x75/5b1d37147f8b9ab06b8b659f/draft-thesis-preface-november-2002-home-wlv-web-viewgat-azar-2000-british.jpg)