Embed Size (px)
Citation preview

Wiz Usage/Help Guide
1
Contents1 Overview 3
2 Navigating within Wiz 32.1 General Structure . . . . . . . . . . . . . . . . . . . . . . . . . . . . . . . . . 32.2 Request a Password . . . . . . . . . . . . . . . . . . . . . . . . . . . . . . . 4
3 Usage 43.1 Uploading Data . . . . . . . . . . . . . . . . . . . . . . . . . . . . . . . . . . 4
3.1.1 Formatting Data to Upload . . . . . . . . . . . . . . . . . . . . . . . 43.2 Clearing Data . . . . . . . . . . . . . . . . . . . . . . . . . . . . . . . . . . . 53.3 Plotting Data . . . . . . . . . . . . . . . . . . . . . . . . . . . . . . . . . . . 5
3.3.1 Categorical Data . . . . . . . . . . . . . . . . . . . . . . . . . . . . . 53.4 Graph Controls . . . . . . . . . . . . . . . . . . . . . . . . . . . . . . . . . . 5
3.4.1 Linear/Log . . . . . . . . . . . . . . . . . . . . . . . . . . . . . . . . 63.4.2 Edit Axes Limits . . . . . . . . . . . . . . . . . . . . . . . . . . . . . 63.4.3 Edit Axes Titles . . . . . . . . . . . . . . . . . . . . . . . . . . . . . 63.4.4 Clickable Points . . . . . . . . . . . . . . . . . . . . . . . . . . . . . 63.4.5 More On-Graph Controls . . . . . . . . . . . . . . . . . . . . . . . . 73.4.6 Export plot . . . . . . . . . . . . . . . . . . . . . . . . . . . . . . . . 7
3.5 Data Filtering . . . . . . . . . . . . . . . . . . . . . . . . . . . . . . . . . . . 83.5.1 Export Plot Data . . . . . . . . . . . . . . . . . . . . . . . . . . . . . 9
4 More Help 9
2
1 OverviewThis guide will help users of Wiz understand some of the functionality of Wiz by workingthrough some of the examples.
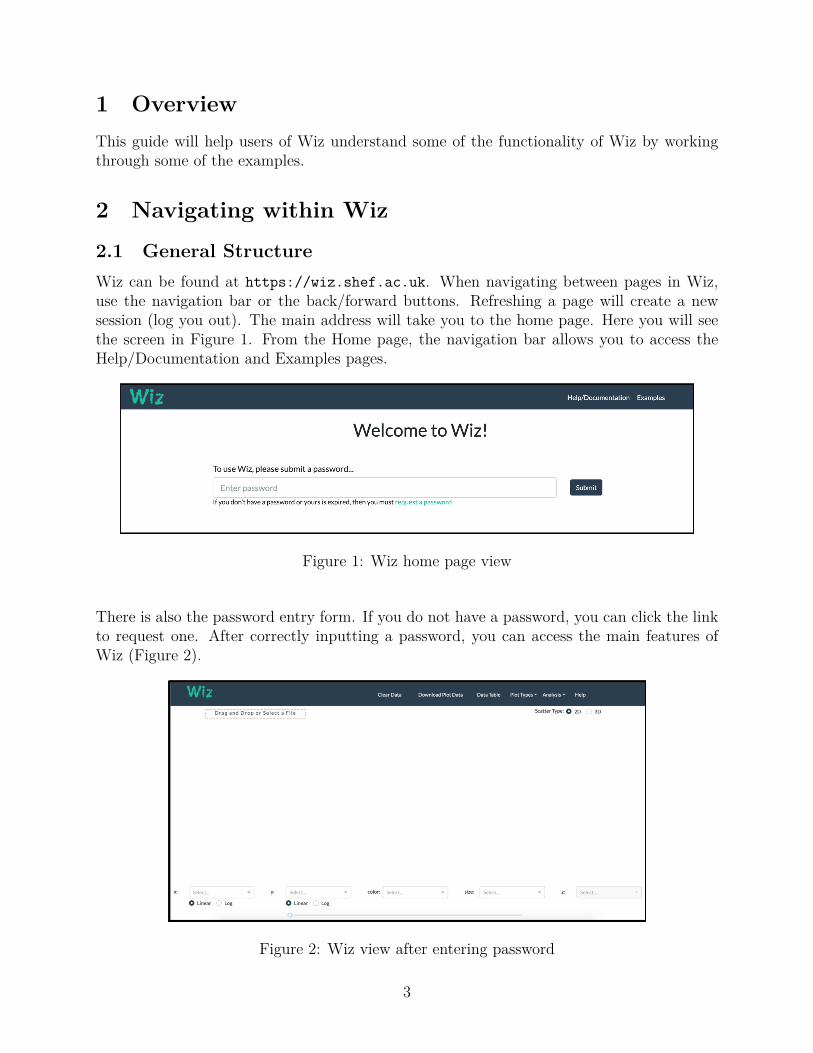
2 Navigating within Wiz2.1 General StructureWiz can be found at https://wiz.shef.ac.uk. When navigating between pages in Wiz,use the navigation bar or the back/forward buttons. Refreshing a page will create a newsession (log you out). The main address will take you to the home page. Here you will seethe screen in Figure 1. From the Home page, the navigation bar allows you to access theHelp/Documentation and Examples pages.
Figure 1: Wiz home page view
There is also the password entry form. If you do not have a password, you can click the linkto request one. After correctly inputting a password, you can access the main features ofWiz (Figure 2).
Figure 2: Wiz view after entering password
3
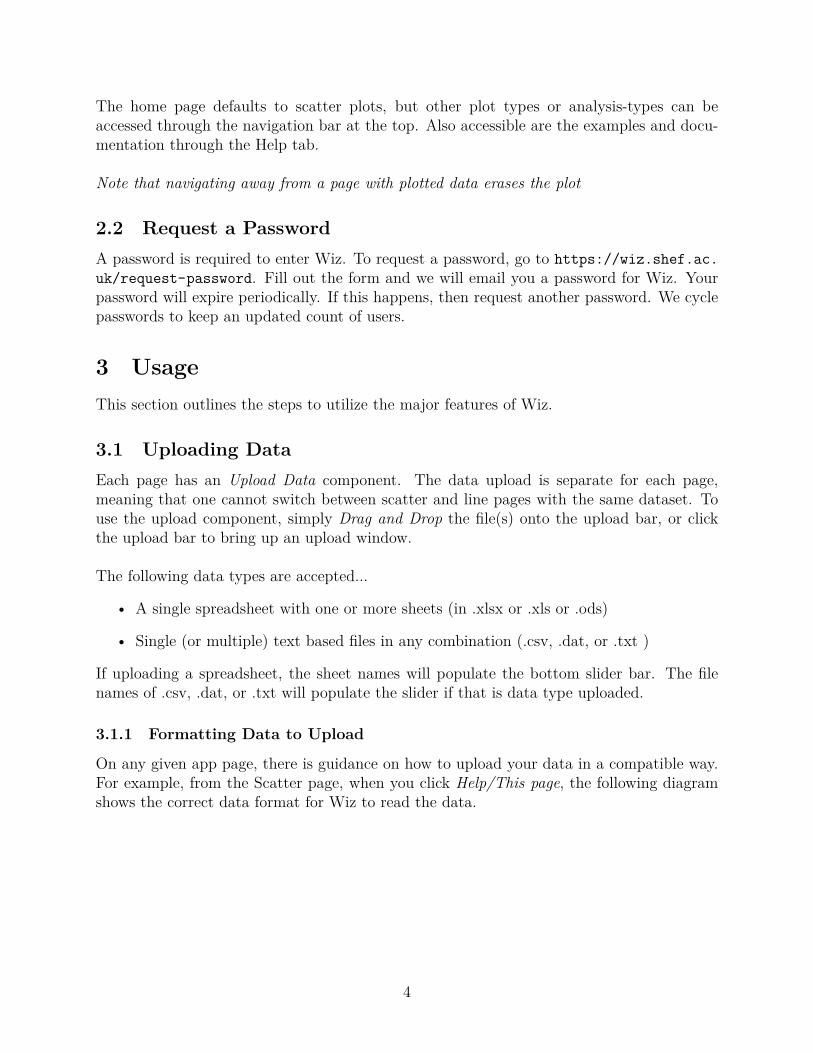
The home page defaults to scatter plots, but other plot types or analysis-types can beaccessed through the navigation bar at the top. Also accessible are the examples and docu-mentation through the Help tab.
Note that navigating away from a page with plotted data erases the plot
2.2 Request a PasswordA password is required to enter Wiz. To request a password, go to https://wiz.shef.ac.uk/request-password. Fill out the form and we will email you a password for Wiz. Yourpassword will expire periodically. If this happens, then request another password. We cyclepasswords to keep an updated count of users.
3 UsageThis section outlines the steps to utilize the major features of Wiz.
3.1 Uploading DataEach page has an Upload Data component. The data upload is separate for each page,meaning that one cannot switch between scatter and line pages with the same dataset. Touse the upload component, simply Drag and Drop the file(s) onto the upload bar, or clickthe upload bar to bring up an upload window.
The following data types are accepted...
• A single spreadsheet with one or more sheets (in .xlsx or .xls or .ods)
• Single (or multiple) text based files in any combination (.csv, .dat, or .txt )
If uploading a spreadsheet, the sheet names will populate the bottom slider bar. The filenames of .csv, .dat, or .txt will populate the slider if that is data type uploaded.
3.1.1 Formatting Data to Upload
On any given app page, there is guidance on how to upload your data in a compatible way.For example, from the Scatter page, when you click Help/This page, the following diagramshows the correct data format for Wiz to read the data.
4
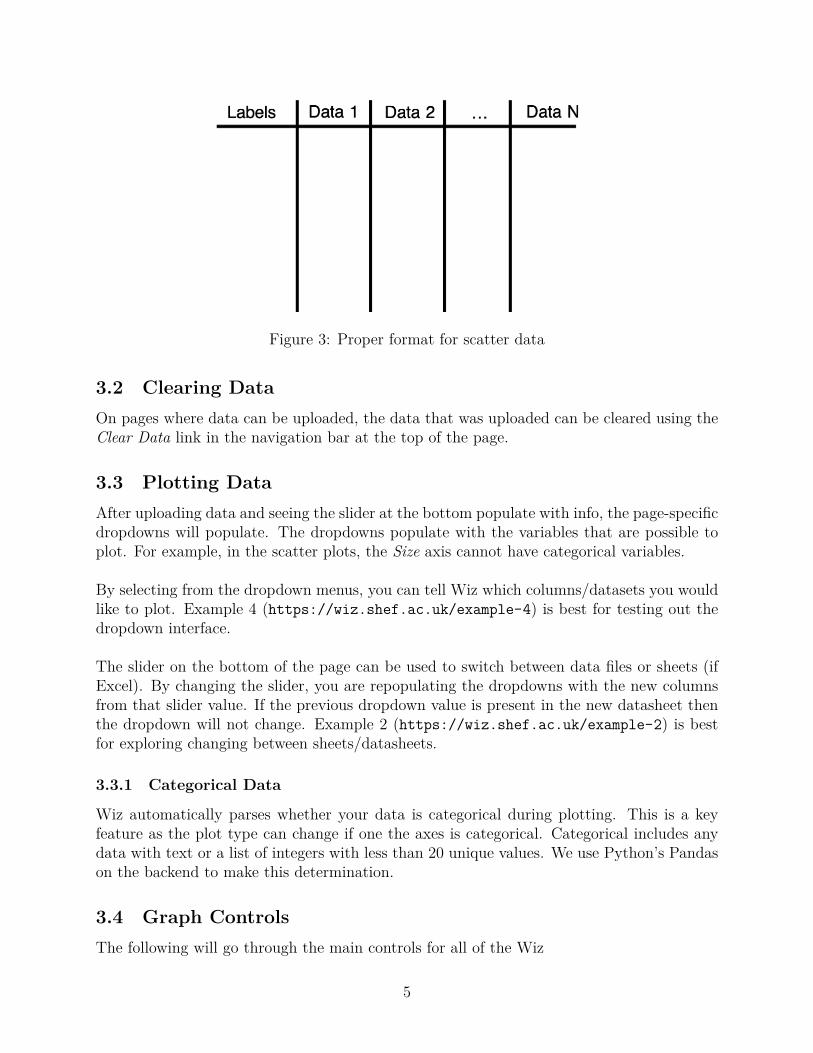
Figure 3: Proper format for scatter data
3.2 Clearing DataOn pages where data can be uploaded, the data that was uploaded can be cleared using theClear Data link in the navigation bar at the top of the page.
3.3 Plotting DataAfter uploading data and seeing the slider at the bottom populate with info, the page-specificdropdowns will populate. The dropdowns populate with the variables that are possible toplot. For example, in the scatter plots, the Size axis cannot have categorical variables.
By selecting from the dropdown menus, you can tell Wiz which columns/datasets you wouldlike to plot. Example 4 (https://wiz.shef.ac.uk/example-4) is best for testing out thedropdown interface.
The slider on the bottom of the page can be used to switch between data files or sheets (ifExcel). By changing the slider, you are repopulating the dropdowns with the new columnsfrom that slider value. If the previous dropdown value is present in the new datasheet thenthe dropdown will not change. Example 2 (https://wiz.shef.ac.uk/example-2) is bestfor exploring changing between sheets/datasheets.
3.3.1 Categorical Data
Wiz automatically parses whether your data is categorical during plotting. This is a keyfeature as the plot type can change if one the axes is categorical. Categorical includes anydata with text or a list of integers with less than 20 unique values. We use Python’s Pandason the backend to make this determination.
3.4 Graph ControlsThe following will go through the main controls for all of the Wiz
5
3.4.1 Linear/Log
On certain app pages, there are toggle buttons to change the x- and y-axis between linearand log scaling. Simply click one or the other to switch between. Note that attemptingto switch to log for an unsuitable data-type (categorical/negative) will not switch the axisscale.
3.4.2 Edit Axes Limits
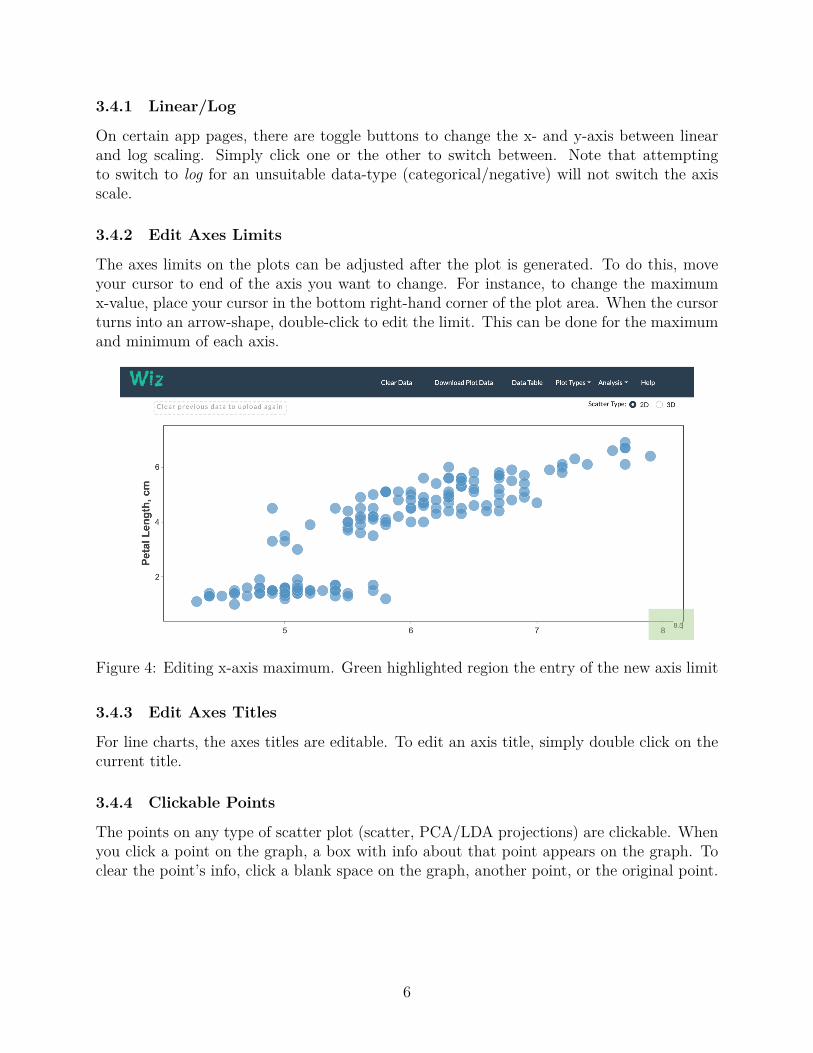
The axes limits on the plots can be adjusted after the plot is generated. To do this, moveyour cursor to end of the axis you want to change. For instance, to change the maximumx-value, place your cursor in the bottom right-hand corner of the plot area. When the cursorturns into an arrow-shape, double-click to edit the limit. This can be done for the maximumand minimum of each axis.
Figure 4: Editing x-axis maximum. Green highlighted region the entry of the new axis limit
3.4.3 Edit Axes Titles
For line charts, the axes titles are editable. To edit an axis title, simply double click on thecurrent title.
3.4.4 Clickable Points
The points on any type of scatter plot (scatter, PCA/LDA projections) are clickable. Whenyou click a point on the graph, a box with info about that point appears on the graph. Toclear the point’s info, click a blank space on the graph, another point, or the original point.
6
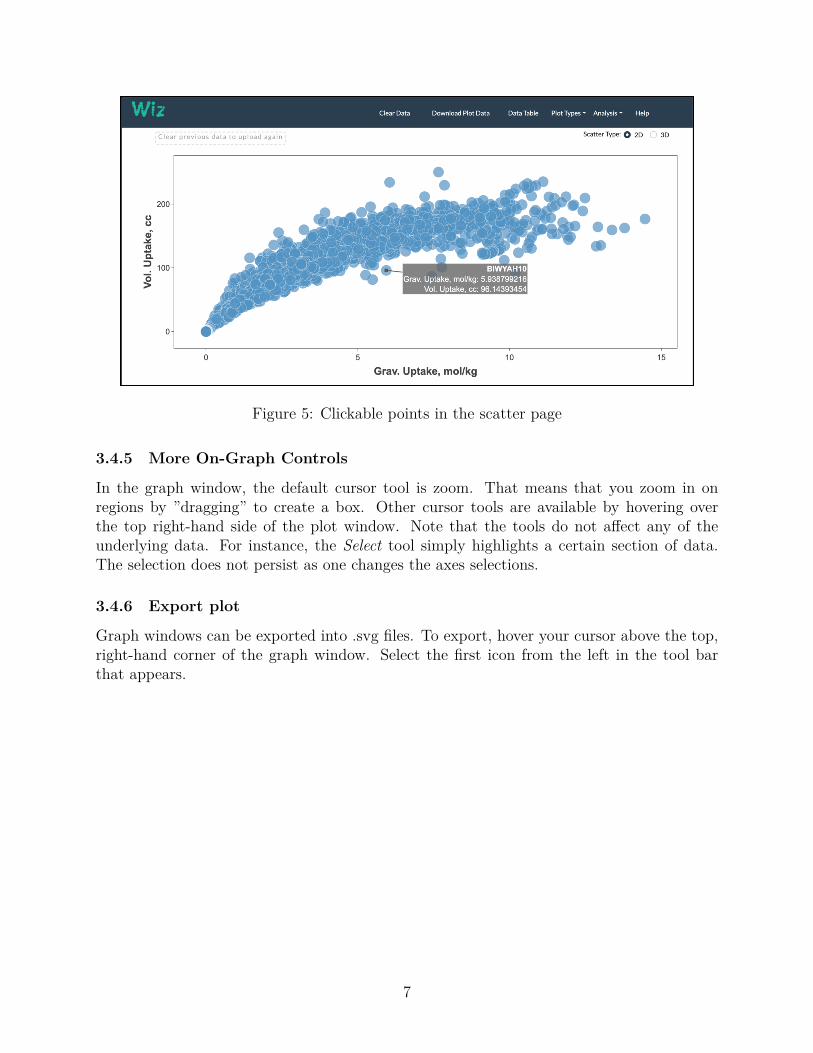
Figure 5: Clickable points in the scatter page
3.4.5 More On-Graph Controls
In the graph window, the default cursor tool is zoom. That means that you zoom in onregions by ”dragging” to create a box. Other cursor tools are available by hovering overthe top right-hand side of the plot window. Note that the tools do not affect any of theunderlying data. For instance, the Select tool simply highlights a certain section of data.The selection does not persist as one changes the axes selections.
3.4.6 Export plot
Graph windows can be exported into .svg files. To export, hover your cursor above the top,right-hand corner of the graph window. Select the first icon from the left in the tool barthat appears.
7
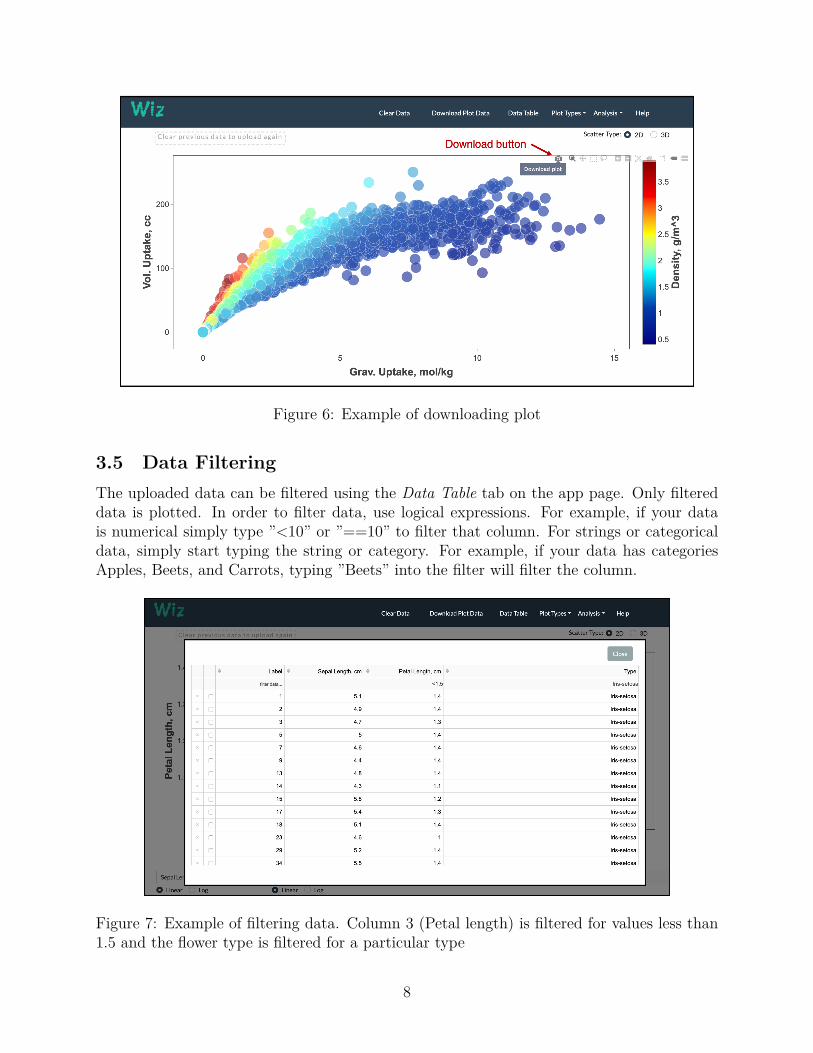
Figure 6: Example of downloading plot
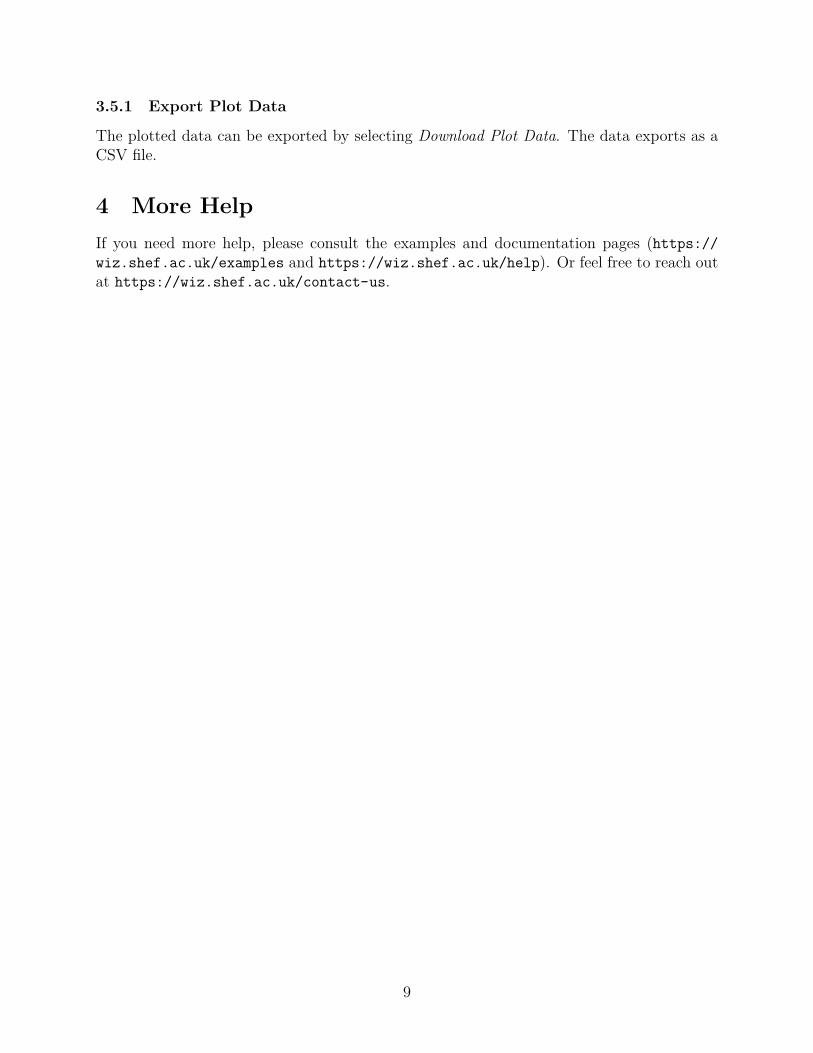
3.5 Data FilteringThe uploaded data can be filtered using the Data Table tab on the app page. Only filtereddata is plotted. In order to filter data, use logical expressions. For example, if your datais numerical simply type ”<10” or ”==10” to filter that column. For strings or categoricaldata, simply start typing the string or category. For example, if your data has categoriesApples, Beets, and Carrots, typing ”Beets” into the filter will filter the column.
Figure 7: Example of filtering data. Column 3 (Petal length) is filtered for values less than1.5 and the flower type is filtered for a particular type
8
3.5.1 Export Plot Data
The plotted data can be exported by selecting Download Plot Data. The data exports as aCSV file.
4 More HelpIf you need more help, please consult the examples and documentation pages (https://wiz.shef.ac.uk/examples and https://wiz.shef.ac.uk/help). Or feel free to reach outat https://wiz.shef.ac.uk/contact-us.
9