Embed Size (px)
DESCRIPTION
witty et al. full article.
Citation preview
1026 VOLUME 32 NUMBER 10 OCTOBER 2014 nature biotechnology
A rt i c l e s
The epicardium is essential for proper development of the heart and plays an important role in cardiac recovery during disease. Studies in model organisms have demonstrated that these effects are mediated either through the generation of epicardial-derived cell populations that participate in formation of the heart or through the secretion of paracrine factors by the epicardium that influence the development and proliferation of other cell types in the heart including cardiomyo-cytes. Given their pivotal role in normal development and disease, the epicardium and derivative cell types will have to be included as essential components of engineered heart tissue that is generated to assess drug responses and to model disease in vitro. Additionally, the ability of epicardial cells to regulate cardiomyocyte proliferation during development can be exploited to develop new strategies for replacing or regenerating functional myocardium for the treatment of cardiovascular disease. The generation of unlimited numbers of human pluripotent stem cell (hPSC)-derived epicardial cells through the approach described in this study provides an unprecedented opportunity to develop these applications.
The adult heart is composed of three distinct cell populations—the inner endocardium, the center myocardium and the outer epicardium—which arise during specific stages of embryonic development. The endocardial and myocardial lineages are specified during the earliest stage of cardiac development in a structure known as the cardiac crescent1. The bi-lineage crescent subsequently fuses to form the heart tube, which undergoes chamber specification and looping, giving rise to the four-chambered heart. The epicardium develops during
the looping stage and is derived from a distinct structure known as the proepicardial organ, which lies proximal to the heart along the septum transversum2. As the proepicardial organ buds off from the septum transversum, it migrates to and envelopes the heart to form an outer epithelial layer, the epicardium, at approximately embryonic day (E) 9.5 of mouse development3. The epicardium then undergoes an epithelial-to-mesenchymal transition (EMT) in response to various signals, including TGFβ1 (refs. 4,5), Wnt6, retinoic acid (RA)6, FGF7 and PDGF8, to give rise to cardiac fibroblasts and coronary vascular smooth muscle cells that invade the myocardial layer and contrib-ute to the structural and vascular populations of the developing heart. These fibroblasts and vascular smooth muscle cells, known as epicardial-derived cells (EPDCs), constitute a substantial proportion of the non-cardiomyocyte population within the myocardial layer9. In addition to generating these cell types, the epicardium also supports the rapid proliferation of ventricular cardiomyocytes through the production of paracrine factors, including IGF and RA10. This rapid, stage-specific expansion is essential for the generation of compact ventricular myocardium.
At the molecular level, the developing epicardium can be distin-guished from the myocardium and endocardium by expression of the transcription factors WT1 (ref. 11) and TBX18 (ref. 12) and of the aldehyde dehydrogenase enzyme retinaldehyde dehydrogenase 2 (ALDH1A2), required for the conversion of retinol to retinoic acid13,14. The expression of these genes defines the fetal stage of epicardial development, as their levels decrease with maturation.
Generation of the epicardial lineage from human pluripotent stem cellsAlec D Witty1,2, Anton Mihic1,3–5, Roger Y Tam6–8, Stephanie A Fisher6–8, Alexander Mikryukov1, Molly S Shoichet1,6–9, Ren-Ke Li1,3–5, Steven J Kattman1,11 & Gordon Keller1,2,10
The epicardium supports cardiomyocyte proliferation early in development and provides fibroblasts and vascular smooth muscle cells to the developing heart. The epicardium has been shown to play an important role during tissue remodeling after cardiac injury, making access to this cell lineage necessary for the study of regenerative medicine. Here we describe the generation of epicardial lineage cells from human pluripotent stem cells by stage-specific activation of the BMP and WNT signaling pathways. These cells display morphological characteristics and express markers of the epicardial lineage, including the transcription factors WT1 and TBX18 and the retinoic acid–producing enzyme ALDH1A2. When induced to undergo epithelial-to-mesenchymal transition, the cells give rise to populations that display characteristics of the fibroblast and vascular smooth muscle lineages. These findings identify BMP and WNT as key regulators of the epicardial lineage in vitro and provide a model for investigating epicardial function in human development and disease.
1McEwen Centre for Regenerative Medicine, University Health Network, Toronto, Ontario, Canada. 2Department of Medical Biophysics, University of Toronto, Toronto, Ontario, Canada. 3Heart and Stroke Richard Lewar Centre of Excellence in Cardiovascular Research, University of Toronto, Toronto, Ontario, Canada. 4Toronto General Research Institute, Toronto, Ontario, Canada. 5Department of Surgery, University of Toronto, Toronto, Ontario, Canada. 6The Donnelly Centre for Cellular and Biomolecular Research, Toronto, Ontario, Canada. 7Department of Chemical Engineering and Applied Chemistry, University of Toronto, Toronto, Ontario, Canada. 8Institute of Biomaterials and Biomedical Engineering, University of Toronto, Toronto, Ontario, Canada. 9Department of Chemistry, University of Toronto, Toronto, Ontario, Canada. 10Princess Margaret Cancer Centre, Toronto, Ontario, Canada. 11Present address: Cellular Dynamics International, Madison, Wisconsin, USA. Correspondence should be addressed to G.K. ([email protected]).
Received 14 March; accepted 25 July; published online 21 September 2014; doi:10.1038/nbt.3002
npg
© 2
014
Nat
ure
Am
eric
a, In
c. A
ll rig
hts
rese
rved
.
nature biotechnology VOLUME 32 NUMBER 10 OCTOBER 2014 1027
A rt i c l e s
In the adult epicardium, myocardial infarction leads to upregulation of these genes, cell proliferation and EMT, suggesting that the epi-cardium is involved in the remodeling process following infarct15,16. Lineage-tracing studies have provided evidence that this activated epicardium generates new cardiomyocytes along with fibroblasts and vascular smooth muscle cells, indicating that it may contrib-ute to the development of new myocardium17–19. However, the extent to which an epicardium-to-cardiomyocyte transition occurs is unclear.
Our understanding of epicardial lineage development and function is derived almost entirely from studies on model organisms, as access to fetal human heart tissue is limited. Studies with epicardium isolated from the adult human heart show that the cells rapidly undergo EMT in culture, preventing detailed studies on the epithelial cell popula-tion20. The generation of epicardium in vitro from hPSCs would over-come issues of accessibility and provide an unlimited source of human cells for functional studies in vitro and in experimental models in vivo. In this study, we have addressed this issue and demonstrate that the combination of BMP and WNT signaling promotes the generation of a WT1+TBX18+ epicardial cell-like population at the expense of cardiomyocytes from PDGFRA+ mesoderm. Following passage, these cells mature and form epithelial-like sheets with tight junctions as demonstrated by the expression of ZONA OCCULEDENS-1 (ZO1). Along with ZO1, the cells upregulate expression of ALDH1A2 and exhibit aldehyde dehydrogenase activity, an indication of their abil-ity to synthesize retinoic acid. Finally, we show that when induced with TGFB1 and bFGF, the epicardial-like cells undergo EMT and give rise to cells that display characteristics of smooth muscle cells and fibroblasts.
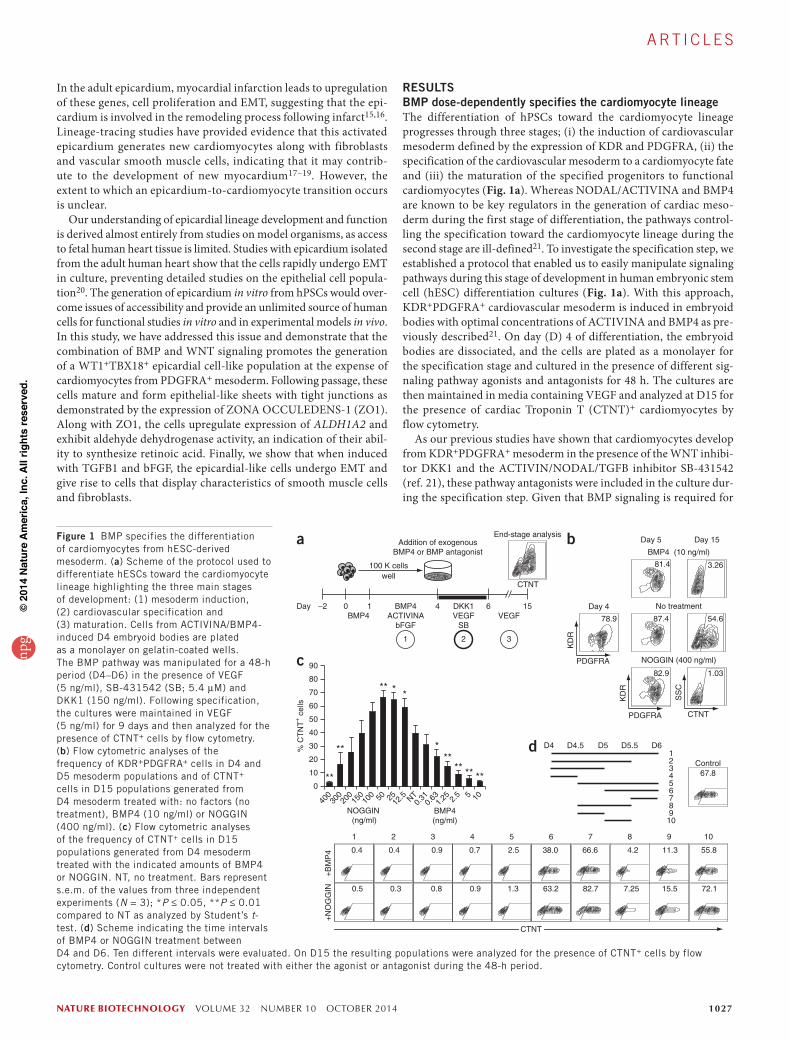
RESULTSBMP dose-dependently specifies the cardiomyocyte lineageThe differentiation of hPSCs toward the cardiomyocyte lineage progresses through three stages; (i) the induction of cardiovascular mesoderm defined by the expression of KDR and PDGFRA, (ii) the specification of the cardiovascular mesoderm to a cardiomyocyte fate and (iii) the maturation of the specified progenitors to functional cardiomyocytes (Fig. 1a). Whereas NODAL/ACTIVINA and BMP4 are known to be key regulators in the generation of cardiac meso-derm during the first stage of differentiation, the pathways control-ling the specification toward the cardiomyocyte lineage during the second stage are ill-defined21. To investigate the specification step, we established a protocol that enabled us to easily manipulate signaling pathways during this stage of development in human embryonic stem cell (hESC) differentiation cultures (Fig. 1a). With this approach, KDR+PDGFRA+ cardiovascular mesoderm is induced in embryoid bodies with optimal concentrations of ACTIVINA and BMP4 as pre-viously described21. On day (D) 4 of differentiation, the embryoid bodies are dissociated, and the cells are plated as a monolayer for the specification stage and cultured in the presence of different sig-naling pathway agonists and antagonists for 48 h. The cultures are then maintained in media containing VEGF and analyzed at D15 for the presence of cardiac Troponin T (CTNT)+ cardiomyocytes by flow cytometry.
As our previous studies have shown that cardiomyocytes develop from KDR+PDGFRA+ mesoderm in the presence of the WNT inhibi-tor DKK1 and the ACTIVIN/NODAL/TGFB inhibitor SB-431542 (ref. 21), these pathway antagonists were included in the culture dur-ing the specification step. Given that BMP signaling is required for
Figure 1 BMP specifies the differentiation of cardiomyocytes from hESC-derived mesoderm. (a) Scheme of the protocol used to differentiate hESCs toward the cardiomyocyte lineage highlighting the three main stages of development: (1) mesoderm induction, (2) cardiovascular specification and (3) maturation. Cells from ACTIVINA/BMP4-induced D4 embryoid bodies are plated as a monolayer on gelatin-coated wells. The BMP pathway was manipulated for a 48-h period (D4–D6) in the presence of VEGF (5 ng/ml), SB-431542 (SB; 5.4 µM) and DKK1 (150 ng/ml). Following specification, the cultures were maintained in VEGF (5 ng/ml) for 9 days and then analyzed for the presence of CTNT+ cells by flow cytometry. (b) Flow cytometric analyses of the frequency of KDR+PDGFRA+ cells in D4 and D5 mesoderm populations and of CTNT+ cells in D15 populations generated from D4 mesoderm treated with: no factors (no treatment), BMP4 (10 ng/ml) or NOGGIN (400 ng/ml). (c) Flow cytometric analyses of the frequency of CTNT+ cells in D15 populations generated from D4 mesoderm treated with the indicated amounts of BMP4 or NOGGIN. NT, no treatment. Bars represent s.e.m. of the values from three independent experiments (N = 3); *P ≤ 0.05, **P ≤ 0.01 compared to NT as analyzed by Student’s t-test. (d) Scheme indicating the time intervals of BMP4 or NOGGIN treatment between D4 and D6. Ten different intervals were evaluated. On D15 the resulting populations were analyzed for the presence of CTNT+ cells by flow cytometry. Control cultures were not treated with either the agonist or antagonist during the 48-h period.
1 2 3 4 5 6 7 8 9 10
CTNT
+N
OG
GIN
+B
MP
4 0.4 0.4 0.9 0.7 2.5 38.0 66.6 4.2 11.3 55.8
0.5 0.3 0.8 0.9 1.3 63.2 82.7 7.25 15.5 72.1
D4 D4.5 D5 D5.5 D612345678910
Control67.8
d
b3.26
54.6
1.0382.9
87.4
81.4
78.9
BMP4 (10 ng/ml)
No treatment
NOGGIN (400 ng/ml)
Day 5 Day 15
KD
R
PDGFRA CTNT
SS
C
Day 4
KD
R
PDGFRA
30020
015
010
0 50 2512
.5 NT0.
310.
631.
25 2.5 5 1040
0
c
0
10
20
30
40
50
60
70
80
90
% C
TN
T+ c
ells
NOGGIN (ng/ml)
BMP4(ng/ml)
* *
*
**
**
**
**
**** **
a
–2 0 1BMP4
BMP4ACTIVINA
bFGF
DKK1VEGF
SBVEGF
4 6 15
Addition of exogenousBMP4 or BMP antagonist
100 K cellswell
End-stage analysis
Day
CTNT
1 32
npg
© 2
014
Nat
ure
Am
eric
a, In
c. A
ll rig
hts
rese
rved
.
1028 VOLUME 32 NUMBER 10 OCTOBER 2014 nature biotechnology
A rt i c l e s
cardiovascular development from mesoderm in the early embryo22, and can modulate cardiomyocyte development from hPSC-derived cardiac progenitor cells21, we focused our initial effort on further exploring the role of this pathway in the specification of the car-diovascular lineage. Manipulation of the pathway had a profound effect on cardiogenesis, as addition of BMP4 or the BMP-specific inhibitor NOGGIN during this 48-h window completely blocked cardiomyocyte development as shown by the lack of CTNT+ cells at D15 (Fig. 1b). The generation of KDR+PDGFRA+ mesoderm at D5 of differentiation was not affected by these manipulations. The lack of cardiomyocyte development was not due to an increase in cell death as similar numbers of cells were detected in each group at D15 (Supplementary Fig. 1a). To investigate the requirement for BMP signaling during the specification of cardiomyocytes, we carried out a titration of NOGGIN and BMP4 between D4 and D6 of differentia-tion. A clear dose dependency for BMP signaling was observed, with optimal cardiomyocyte specification occurring in cultures treated with levels of NOGGIN ranging from 12.5 to 50 ng/ml (Fig. 1c). Some interexperiment variation was observed with respect to the optimal NOGGIN concentrations required for the specification of cardiomyocytes and for blocking cardiogenesis. This variation typi-cally coincided with lot changes in reagents (data not shown).
To define in more detail the temporal aspects of cardiomyocyte specification, we manipulated BMP signaling at different 12-h inter-vals between D4 and D6 of differentiation (Fig. 1d; top panel, intervals 1–10). The untreated control cultures underwent efficient cardio-myocyte specification, as indicated by the high proportion of CTNT+ cells detected at D15. The inhibitory effects of BMP4 and NOGGIN were most pronounced when these factors were added between D4 and D5 of culture (groups 1–5, 8, 9). If addition of the BMP agonist or antagonist was delayed to D5 or beyond, cardiomyocytes were detected in the resulting cultures (groups 6, 7 and 10). Addition of the agonist and antagonist for a 12-h period during the D4–5 time frame was sufficient to inhibit cardiomyocyte development (groups 4, 8 and 9). Taken together these findings demonstrate that an optimal concentration of BMP4 is required for cardiomyocyte specification at D4 of differentiation and that the duration of this BMP-dependent stage is ~24 h.
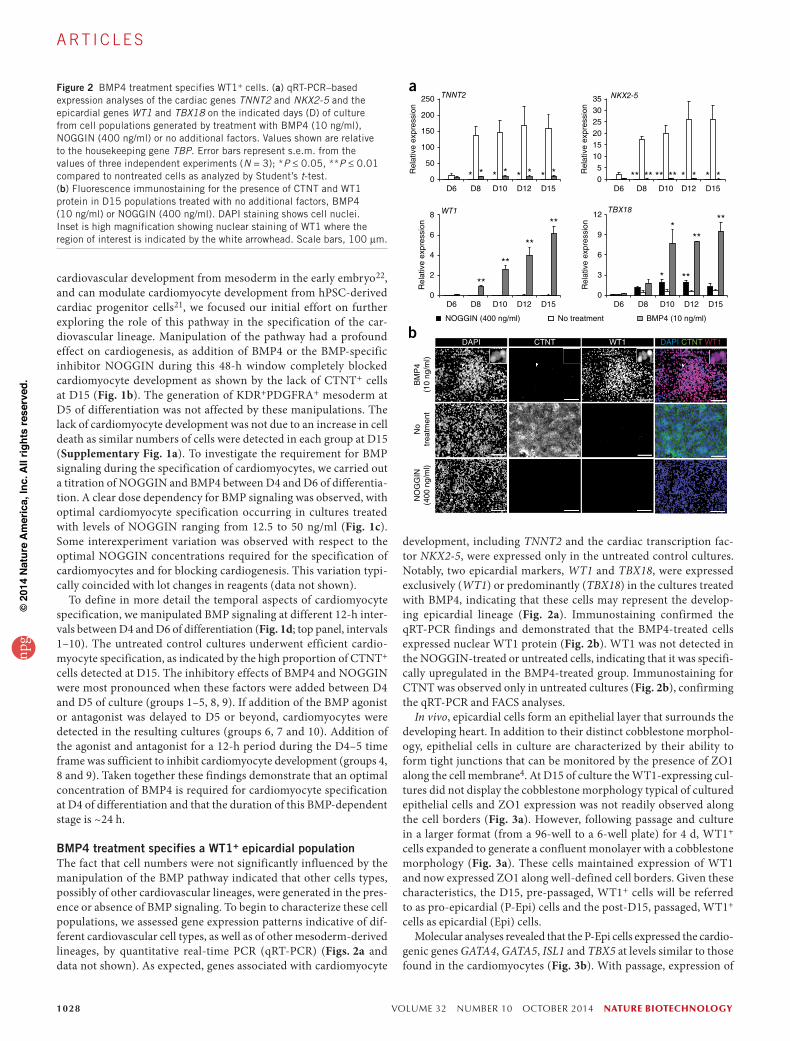
BMP4 treatment specifies a WT1+ epicardial populationThe fact that cell numbers were not significantly influenced by the manipulation of the BMP pathway indicated that other cells types, possibly of other cardiovascular lineages, were generated in the pres-ence or absence of BMP signaling. To begin to characterize these cell populations, we assessed gene expression patterns indicative of dif-ferent cardiovascular cell types, as well as of other mesoderm-derived lineages, by quantitative real-time PCR (qRT-PCR) (Figs. 2a and data not shown). As expected, genes associated with cardiomyocyte
development, including TNNT2 and the cardiac transcription fac-tor NKX2-5, were expressed only in the untreated control cultures. Notably, two epicardial markers, WT1 and TBX18, were expressed exclusively (WT1) or predominantly (TBX18) in the cultures treated with BMP4, indicating that these cells may represent the develop-ing epicardial lineage (Fig. 2a). Immunostaining confirmed the qRT-PCR findings and demonstrated that the BMP4-treated cells expressed nuclear WT1 protein (Fig. 2b). WT1 was not detected in the NOGGIN-treated or untreated cells, indicating that it was specifi-cally upregulated in the BMP4-treated group. Immunostaining for CTNT was observed only in untreated cultures (Fig. 2b), confirming the qRT-PCR and FACS analyses.
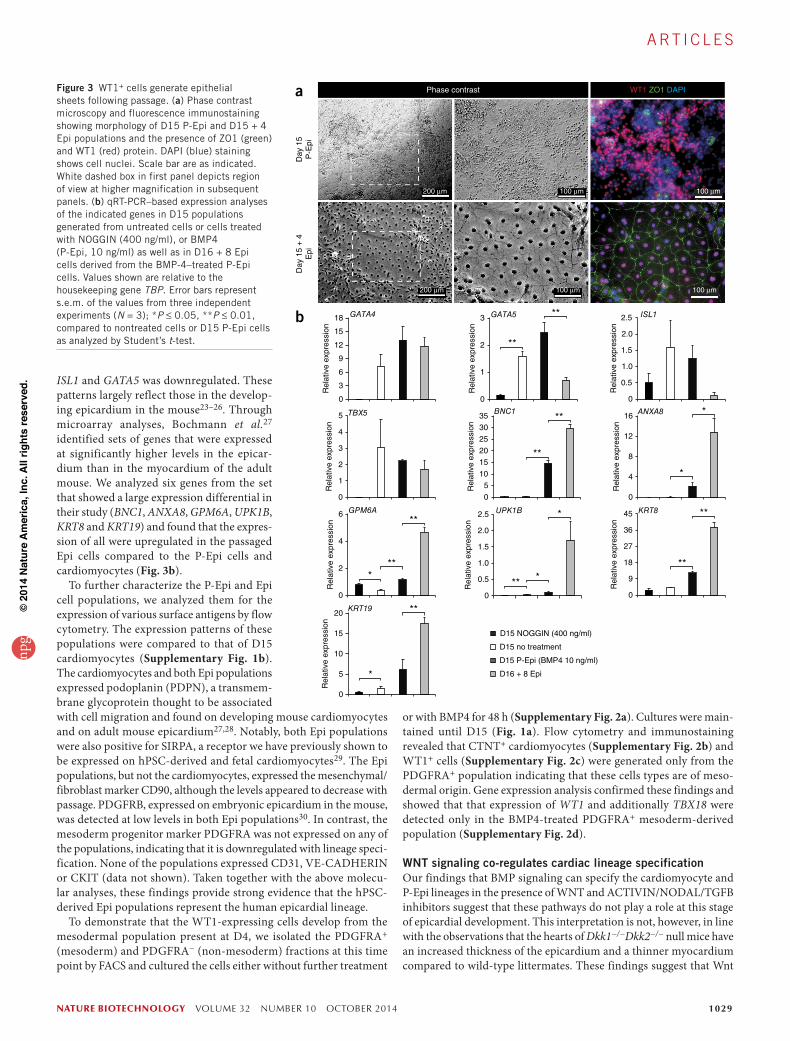
In vivo, epicardial cells form an epithelial layer that surrounds the developing heart. In addition to their distinct cobblestone morphol-ogy, epithelial cells in culture are characterized by their ability to form tight junctions that can be monitored by the presence of ZO1 along the cell membrane4. At D15 of culture the WT1-expressing cul-tures did not display the cobblestone morphology typical of cultured epithelial cells and ZO1 expression was not readily observed along the cell borders (Fig. 3a). However, following passage and culture in a larger format (from a 96-well to a 6-well plate) for 4 d, WT1+ cells expanded to generate a confluent monolayer with a cobblestone morphology (Fig. 3a). These cells maintained expression of WT1 and now expressed ZO1 along well-defined cell borders. Given these characteristics, the D15, pre-passaged, WT1+ cells will be referred to as pro-epicardial (P-Epi) cells and the post-D15, passaged, WT1+ cells as epicardial (Epi) cells.
Molecular analyses revealed that the P-Epi cells expressed the cardio-genic genes GATA4, GATA5, ISL1 and TBX5 at levels similar to those found in the cardiomyocytes (Fig. 3b). With passage, expression of
BM
P4
(10
ng/m
l)N
otr
eatm
ent
NO
GG
IN(4
00 n
g/m
l)
bCTNT WT1 DAPI CTNT WT1
D6 D8 D10 D12 D1505
101520253035
Rel
ativ
e ex
pres
sion
NKX2-5
****** ******
D6 D8 D10 D12 D150
3
6
9
12
Rel
ativ
e ex
pres
sion
TBX18
*
***
**
**
D6 D8 D10 D12 D150
2
4
6
8
Rel
ativ
e ex
pres
sion
WT1
**
**
**
**
DAPI
BMP4 (10 ng/ml)NOGGIN (400 ng/ml) No treatment
TNNT2
D6 D8 D10 D12 D150
50
100
150
200
250
Rel
ativ
e ex
pres
sion
****** **
aFigure 2 BMP4 treatment specifies WT1+ cells. (a) qRT-PCR–based expression analyses of the cardiac genes TNNT2 and NKX2-5 and the epicardial genes WT1 and TBX18 on the indicated days (D) of culture from cell populations generated by treatment with BMP4 (10 ng/ml), NOGGIN (400 ng/ml) or no additional factors. Values shown are relative to the housekeeping gene TBP. Error bars represent s.e.m. from the values of three independent experiments (N = 3); *P ≤ 0.05, **P ≤ 0.01 compared to nontreated cells as analyzed by Student’s t-test. (b) Fluorescence immunostaining for the presence of CTNT and WT1 protein in D15 populations treated with no additional factors, BMP4 (10 ng/ml) or NOGGIN (400 ng/ml). DAPI staining shows cell nuclei. Inset is high magnification showing nuclear staining of WT1 where the region of interest is indicated by the white arrowhead. Scale bars, 100 µm.
npg
© 2
014
Nat
ure
Am
eric
a, In
c. A
ll rig
hts
rese
rved
.
nature biotechnology VOLUME 32 NUMBER 10 OCTOBER 2014 1029
A rt i c l e s
ISL1 and GATA5 was downregulated. These patterns largely reflect those in the develop-ing epicardium in the mouse23–26. Through microarray analyses, Bochmann et al.27 identified sets of genes that were expressed at significantly higher levels in the epicar-dium than in the myocardium of the adult mouse. We analyzed six genes from the set that showed a large expression differential in their study (BNC1, ANXA8, GPM6A, UPK1B, KRT8 and KRT19) and found that the expres-sion of all were upregulated in the passaged Epi cells compared to the P-Epi cells and cardiomyocytes (Fig. 3b).
To further characterize the P-Epi and Epi cell populations, we analyzed them for the expression of various surface antigens by flow cytometry. The expression patterns of these populations were compared to that of D15 cardiomyocytes (Supplementary Fig. 1b). The cardiomyocytes and both Epi populations expressed podoplanin (PDPN), a transmem-brane glycoprotein thought to be associated with cell migration and found on developing mouse cardiomyocytes and on adult mouse epicardium27,28. Notably, both Epi populations were also positive for SIRPA, a receptor we have previously shown to be expressed on hPSC-derived and fetal cardiomyocytes29. The Epi populations, but not the cardiomyocytes, expressed the mesenchymal/fibroblast marker CD90, although the levels appeared to decrease with passage. PDGFRB, expressed on embryonic epicardium in the mouse, was detected at low levels in both Epi populations30. In contrast, the mesoderm progenitor marker PDGFRA was not expressed on any of the populations, indicating that it is downregulated with lineage speci-fication. None of the populations expressed CD31, VE-CADHERIN or CKIT (data not shown). Taken together with the above molecu-lar analyses, these findings provide strong evidence that the hPSC-derived Epi populations represent the human epicardial lineage.
To demonstrate that the WT1-expressing cells develop from the mesodermal population present at D4, we isolated the PDGFRA+ (mesoderm) and PDGFRA− (non-mesoderm) fractions at this time point by FACS and cultured the cells either without further treatment
or with BMP4 for 48 h (Supplementary Fig. 2a). Cultures were main-tained until D15 (Fig. 1a). Flow cytometry and immunostaining revealed that CTNT+ cardiomyocytes (Supplementary Fig. 2b) and WT1+ cells (Supplementary Fig. 2c) were generated only from the PDGFRA+ population indicating that these cells types are of meso-dermal origin. Gene expression analysis confirmed these findings and showed that that expression of WT1 and additionally TBX18 were detected only in the BMP4-treated PDGFRA+ mesoderm-derived population (Supplementary Fig. 2d).
WNT signaling co-regulates cardiac lineage specificationOur findings that BMP signaling can specify the cardiomyocyte and P-Epi lineages in the presence of WNT and ACTIVIN/NODAL/TGFB inhibitors suggest that these pathways do not play a role at this stage of epicardial development. This interpretation is not, however, in line with the observations that the hearts of Dkk1−/−Dkk2−/− null mice have an increased thickness of the epicardium and a thinner myocardium compared to wild-type littermates. These findings suggest that Wnt
Figure 3 WT1+ cells generate epithelial sheets following passage. (a) Phase contrast microscopy and fluorescence immunostaining showing morphology of D15 P-Epi and D15 + 4 Epi populations and the presence of ZO1 (green) and WT1 (red) protein. DAPI (blue) staining shows cell nuclei. Scale bar are as indicated. White dashed box in first panel depicts region of view at higher magnification in subsequent panels. (b) qRT-PCR–based expression analyses of the indicated genes in D15 populations generated from untreated cells or cells treated with NOGGIN (400 ng/ml), or BMP4 (P-Epi, 10 ng/ml) as well as in D16 + 8 Epi cells derived from the BMP-4–treated P-Epi cells. Values shown are relative to the housekeeping gene TBP. Error bars represent s.e.m. of the values from three independent experiments (N = 3); *P ≤ 0.05, **P ≤ 0.01, compared to nontreated cells or D15 P-Epi cells as analyzed by Student’s t-test.
D15 NOGGIN (400 ng/ml)
D15 no treatment
D15 P-Epi (BMP4 10 ng/ml)
D16 + 8 Epi
0
4
8
12
16
Rel
ativ
e ex
pres
sion
ANXA8 *
*
0
2
4
6
Rel
ativ
e ex
pres
sion
GPM6A**
***
0
0.5
1.0
1.5
2.0
2.5
Rel
ativ
e ex
pres
sion
UPK1B
** *
*
0
9
18
27
36
45
Rel
ativ
e ex
pres
sion
KRT8 **
**
0
5
10
15
20
Rel
ativ
e ex
pres
sion
KRT19 **
*
b
0
3
6
9
12
15
18R
elat
ive
expr
essi
onGATA4
0
0.5
1.0
1.5
2.0
2.5
Rel
ativ
e ex
pres
sion
ISL1
0
1
2
3
Rel
ativ
e ex
pres
sion
GATA5
**
**
0
5
10
15
20
25
30
35
Rel
ativ
e ex
pres
sion
BNC1
**
**
0
1
2
3
4
5
Rel
ativ
e ex
pres
sion
TBX5
a WT1 ZO1 DAPIPhase contrast
200 µm
Day
15
P-E
piD
ay 1
5 +
4E
pi
200 µm 100 µm
100 µm 100 µm
100 µm
npg
© 2
014
Nat
ure
Am
eric
a, In
c. A
ll rig
hts
rese
rved
.
1030 VOLUME 32 NUMBER 10 OCTOBER 2014 nature biotechnology
A rt i c l e s
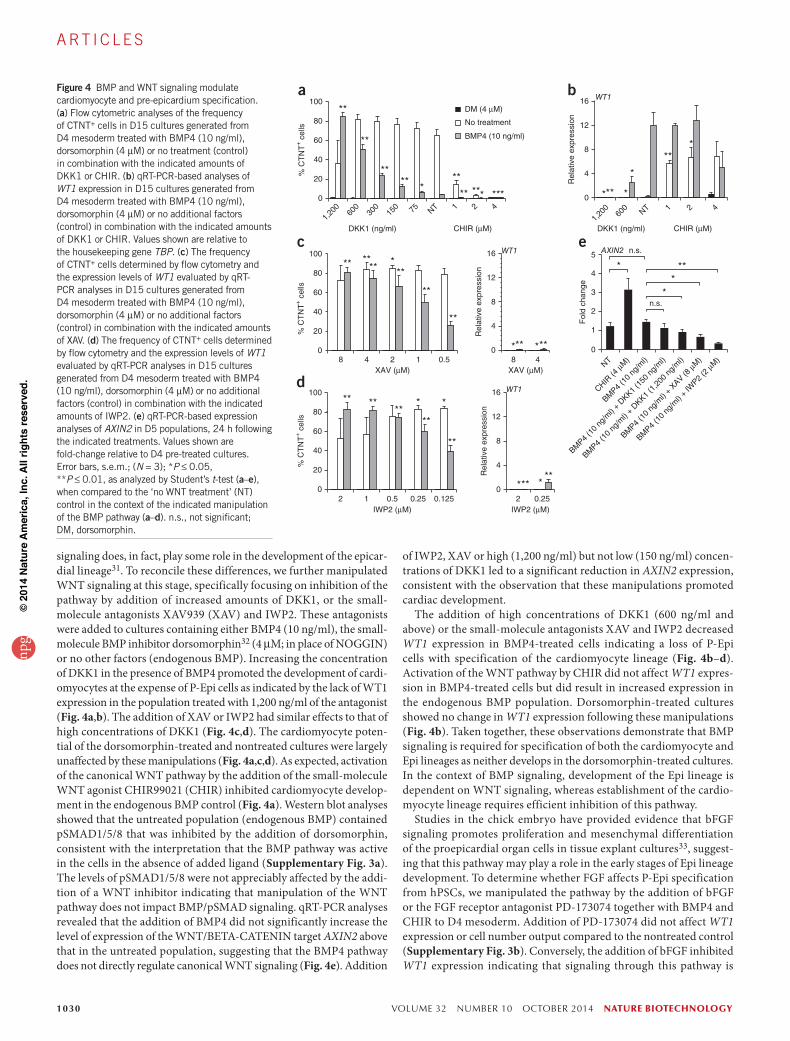
signaling does, in fact, play some role in the development of the epicar-dial lineage31. To reconcile these differences, we further manipulated WNT signaling at this stage, specifically focusing on inhibition of the pathway by addition of increased amounts of DKK1, or the small-molecule antagonists XAV939 (XAV) and IWP2. These antagonists were added to cultures containing either BMP4 (10 ng/ml), the small- molecule BMP inhibitor dorsomorphin32 (4 µM; in place of NOGGIN) or no other factors (endogenous BMP). Increasing the concentration of DKK1 in the presence of BMP4 promoted the development of cardi-omyocytes at the expense of P-Epi cells as indicated by the lack of WT1 expression in the population treated with 1,200 ng/ml of the antagonist (Fig. 4a,b). The addition of XAV or IWP2 had similar effects to that of high concentrations of DKK1 (Fig. 4c,d). The cardiomyocyte poten-tial of the dorsomorphin-treated and nontreated cultures were largely unaffected by these manipulations (Fig. 4a,c,d). As expected, activation of the canonical WNT pathway by the addition of the small-molecule WNT agonist CHIR99021 (CHIR) inhibited cardiomyocyte develop-ment in the endogenous BMP control (Fig. 4a). Western blot analyses showed that the untreated population (endogenous BMP) contained pSMAD1/5/8 that was inhibited by the addition of dorsomorphin, consistent with the interpretation that the BMP pathway was active in the cells in the absence of added ligand (Supplementary Fig. 3a). The levels of pSMAD1/5/8 were not appreciably affected by the addi-tion of a WNT inhibitor indicating that manipulation of the WNT pathway does not impact BMP/pSMAD signaling. qRT-PCR analyses revealed that the addition of BMP4 did not significantly increase the level of expression of the WNT/BETA-CATENIN target AXIN2 above that in the untreated population, suggesting that the BMP4 pathway does not directly regulate canonical WNT signaling (Fig. 4e). Addition
of IWP2, XAV or high (1,200 ng/ml) but not low (150 ng/ml) concen-trations of DKK1 led to a significant reduction in AXIN2 expression, consistent with the observation that these manipulations promoted cardiac development.
The addition of high concentrations of DKK1 (600 ng/ml and above) or the small-molecule antagonists XAV and IWP2 decreased WT1 expression in BMP4-treated cells indicating a loss of P-Epi cells with specification of the cardiomyocyte lineage (Fig. 4b–d). Activation of the WNT pathway by CHIR did not affect WT1 expres-sion in BMP4-treated cells but did result in increased expression in the endogenous BMP population. Dorsomorphin-treated cultures showed no change in WT1 expression following these manipulations (Fig. 4b). Taken together, these observations demonstrate that BMP signaling is required for specification of both the cardiomyocyte and Epi lineages as neither develops in the dorsomorphin-treated cultures. In the context of BMP signaling, development of the Epi lineage is dependent on WNT signaling, whereas establishment of the cardio-myocyte lineage requires efficient inhibition of this pathway.
Studies in the chick embryo have provided evidence that bFGF signaling promotes proliferation and mesenchymal differentiation of the proepicardial organ cells in tissue explant cultures33, suggest-ing that this pathway may play a role in the early stages of Epi lineage development. To determine whether FGF affects P-Epi specification from hPSCs, we manipulated the pathway by the addition of bFGF or the FGF receptor antagonist PD-173074 together with BMP4 and CHIR to D4 mesoderm. Addition of PD-173074 did not affect WT1 expression or cell number output compared to the nontreated control (Supplementary Fig. 3b). Conversely, the addition of bFGF inhibited WT1 expression indicating that signaling through this pathway is
Figure 4 BMP and WNT signaling modulate cardiomyocyte and pre-epicardium specification. (a) Flow cytometric analyses of the frequency of CTNT+ cells in D15 cultures generated from D4 mesoderm treated with BMP4 (10 ng/ml), dorsomorphin (4 µM) or no treatment (control) in combination with the indicated amounts of DKK1 or CHIR. (b) qRT-PCR-based analyses of WT1 expression in D15 cultures generated from D4 mesoderm treated with BMP4 (10 ng/ml), dorsomorphin (4 µM) or no additional factors (control) in combination with the indicated amounts of DKK1 or CHIR. Values shown are relative to the housekeeping gene TBP. (c) The frequency of CTNT+ cells determined by flow cytometry and the expression levels of WT1 evaluated by qRT-PCR analyses in D15 cultures generated from D4 mesoderm treated with BMP4 (10 ng/ml), dorsomorphin (4 µM) or no additional factors (control) in combination with the indicated amounts of XAV. (d) The frequency of CTNT+ cells determined by flow cytometry and the expression levels of WT1 evaluated by qRT-PCR analyses in D15 cultures generated from D4 mesoderm treated with BMP4 (10 ng/ml), dorsomorphin (4 µM) or no additional factors (control) in combination with the indicated amounts of IWP2. (e) qRT-PCR-based expression analyses of AXIN2 in D5 populations, 24 h following the indicated treatments. Values shown are fold-change relative to D4 pre-treated cultures. Error bars, s.e.m.; (N = 3); *P ≤ 0.05, **P ≤ 0.01, as analyzed by Student’s t-test (a–e), when compared to the ‘no WNT treatment’ (NT) control in the context of the indicated manipulation of the BMP pathway (a–d). n.s., not significant; DM, dorsomorphin.
2 0.250
4
8
12
16
Rel
ativ
e ex
pres
sion
WT1
* *****
IWP2 (µM)
d
2 1 0.5 0.25 0.1250
20
40
60
80
100
% C
TN
T+ c
ells
IWP2 (µM)
****
**
* *** **
XAV (µM)
WT1
8 40
4
8
12
16
Rel
ativ
e ex
pres
sion
** ****
c
XAV (µM)
**
**
8 4 2 1 0.50
20
40
60
80
100
% C
TN
T+ c
ells
**** **
***
a
0
20
40
60
80
100
% C
TN
T+ c
ells
DKK1 (ng/ml) CHIR (µM)
DM (4 µM)
***
******
**
**
*
**
*
**
No treatment
BMP4 (10 ng/ml)
1,20
060
030
015
0 75 NT 21 4
b16
CHIR (µM)
0
4
8
12
Rel
ativ
e ex
pres
sion
DKK1 (ng/ml)
WT1
*
*
**
**
**
1,20
060
0 NT 21 4
e
0
1
2
3
4
5
Fol
d ch
ange
AXIN2
**
*
**
n.s.
n.s.
NT
BMP4
(10
ng/m
l) +
DKK1 (1
,200
ng/
ml)
BMP4
(10
ng/m
l) +
DKK1 (1
50 n
g/m
l)
BMP4
(10
ng/m
l)
CHIR (4
µM)
BMP4
(10
ng/m
l) +
IWP2
(2 µM
)
BMP4
(10
ng/m
l) +
XAV (8 µM
)
npg
© 2
014
Nat
ure
Am
eric
a, In
c. A
ll rig
hts
rese
rved
.
nature biotechnology VOLUME 32 NUMBER 10 OCTOBER 2014 1031
A rt i c l e s
detrimental to the development of the P-Epi lineage (Supplementary Fig. 3b). Cell numbers were not affected by the addition of bFGF, suggesting that signaling through this pathway promoted the develop-ment of an alternative cell lineage.
Based on the inclusion of VEGF during culture, we wanted to determine whether this signaling pathway affects epicardial line-age specification and maturation. Notably, the D15 P-Epi popula-tion expressed KDR (Supplementary Fig. 3c), suggesting that this population may respond to VEGF signaling. Removal of VEGF from the specification step or during the following 9 d of culture had no detrimental effect on D15 KDR expression, WT1 expression or total cell output, indicating that it is not required for establishment of the lineage (Supplementary Fig. 3c,d). The majority of passaged Epi cells maintained expression of KDR, however, addition of VEGF during the culture of the Epi population resulted in a reduction in the number cells generated 8 d later (Supplementary Fig. 3e,f). The reduction in cell number was not associated with maturation along the endothelial lineage, however, as the cells did not upregulate CD31 (Supplementary Fig. 3e).
Given the above findings, for the remaining experiments in this study cardiomyocytes were generated by the addition of BMP4 and XAV or IWP2 to D4 mesoderm whereas the combination of BMP4 and CHIR was used to induce the Epi lineage. Cells treated with the BMP inhibitor dorsomorphin were used as the noncardiomyo-cyte, non-Epi, control population. With this approach it was possi-ble to generate Epi cells from other hPSC lines, including a human, fibroblast-derived, induced PSC line (Sendai hiPSC) and the hESC line H7 (Supplementary Fig. 4a,b). The protocol used for Epi develop-ment from the HES2 hESCs was also used for the second hESC line H7. For the Sendai hiPSC line we shortened the mesoderm induction
stage by 1 d (D1–3), as we have previously shown that the kinetics of differentiation is accelerated in some iPSCs21.
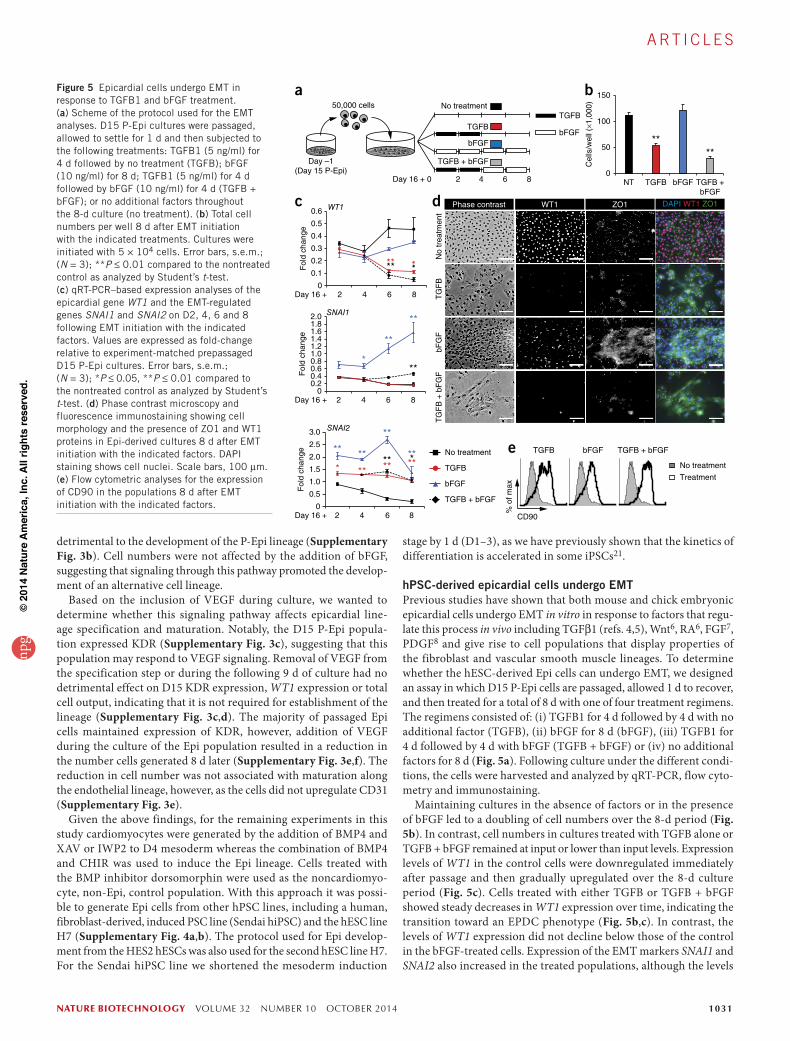
hPSC-derived epicardial cells undergo EMTPrevious studies have shown that both mouse and chick embryonic epicardial cells undergo EMT in vitro in response to factors that regu-late this process in vivo including TGFβ1 (refs. 4,5), Wnt6, RA6, FGF7, PDGF8 and give rise to cell populations that display properties of the fibroblast and vascular smooth muscle lineages. To determine whether the hESC-derived Epi cells can undergo EMT, we designed an assay in which D15 P-Epi cells are passaged, allowed 1 d to recover, and then treated for a total of 8 d with one of four treatment regimens. The regimens consisted of: (i) TGFB1 for 4 d followed by 4 d with no additional factor (TGFB), (ii) bFGF for 8 d (bFGF), (iii) TGFB1 for 4 d followed by 4 d with bFGF (TGFB + bFGF) or (iv) no additional factors for 8 d (Fig. 5a). Following culture under the different condi-tions, the cells were harvested and analyzed by qRT-PCR, flow cyto-metry and immunostaining.
Maintaining cultures in the absence of factors or in the presence of bFGF led to a doubling of cell numbers over the 8-d period (Fig. 5b). In contrast, cell numbers in cultures treated with TGFB alone or TGFB + bFGF remained at input or lower than input levels. Expression levels of WT1 in the control cells were downregulated immediately after passage and then gradually upregulated over the 8-d culture period (Fig. 5c). Cells treated with either TGFB or TGFB + bFGF showed steady decreases in WT1 expression over time, indicating the transition toward an EPDC phenotype (Fig. 5b,c). In contrast, the levels of WT1 expression did not decline below those of the control in the bFGF-treated cells. Expression of the EMT markers SNAI1 and SNAI2 also increased in the treated populations, although the levels
b
NT TGFB bFGF TGFB +bFGF
0
50
100
150
Cel
ls/w
ell (
×1,0
00)
****
No treatment
Treatment
CD90
TGFB bFGF TGFB + bFGFe
% o
f max
a
Day –1(Day 15 P-Epi)
Day 16 + 0
50,000 cells No treatment
TGFB
bFGF
TGFB + bFGF
2 4 6 8
TGFB
bFGF
No treatment
TGFB
bFGF
TGFB + bFGF
2 4 6 80
0.1
0.2
0.3
0.4
0.5
0.6
Fol
d ch
ange
WT1c
**** **
Day 16 +
2 4 6 80
0.5
1.0
1.5
2.0
2.5
3.0
Fol
d ch
ange
SNAI2
*
** **
**
**
*********
Day 16 +
2 4 6 80
0.20.40.60.81.01.21.41.61.82.0
Fol
d ch
ange
SNAI1
*
**
**
**
Day 16 +
d Phase contrast WT1 ZO1 DAPI WT1 ZO1
No
trea
tmen
tT
GF
BbF
GF
TG
FB
+ b
FG
F
Figure 5 Epicardial cells undergo EMT in response to TGFB1 and bFGF treatment. (a) Scheme of the protocol used for the EMT analyses. D15 P-Epi cultures were passaged, allowed to settle for 1 d and then subjected to the following treatments: TGFB1 (5 ng/ml) for 4 d followed by no treatment (TGFB); bFGF (10 ng/ml) for 8 d; TGFB1 (5 ng/ml) for 4 d followed by bFGF (10 ng/ml) for 4 d (TGFB + bFGF); or no additional factors throughout the 8-d culture (no treatment). (b) Total cell numbers per well 8 d after EMT initiation with the indicated treatments. Cultures were initiated with 5 × 10⁴ cells. Error bars, s.e.m.; (N = 3); **P ≤ 0.01 compared to the nontreated control as analyzed by Student’s t-test. (c) qRT-PCR–based expression analyses of the epicardial gene WT1 and the EMT-regulated genes SNAI1 and SNAI2 on D2, 4, 6 and 8 following EMT initiation with the indicated factors. Values are expressed as fold-change relative to experiment-matched prepassaged D15 P-Epi cultures. Error bars, s.e.m.; (N = 3); *P ≤ 0.05, **P ≤ 0.01 compared to the nontreated control as analyzed by Student’s t-test. (d) Phase contrast microscopy and fluorescence immunostaining showing cell morphology and the presence of ZO1 and WT1 proteins in Epi-derived cultures 8 d after EMT initiation with the indicated factors. DAPI staining shows cell nuclei. Scale bars, 100 µm. (e) Flow cytometric analyses for the expression of CD90 in the populations 8 d after EMT initiation with the indicated factors.
npg
© 2
014
Nat
ure
Am
eric
a, In
c. A
ll rig
hts
rese
rved
.
1032 VOLUME 32 NUMBER 10 OCTOBER 2014 nature biotechnology
A rt i c l e s
varied depending on the cytokine combina-tion. TGFB, TGFB + bFGF and bFGF all led to increases in SNAI2 expression, whereas only bFGF induced the expression of SNAI1 (Fig. 5c). The recent findings by Casanova et al.34 demonstrating that SNAI1 is dispen-sable for epicardial EMT may explain why its expression levels did not change in the TGFB-treated cultures. Immunostaining illustrated that ZO1 was lost from cell borders and possibly internalized following TGFB or bFGF treatment (Fig. 5d). Expression of WT1 seen by immunostaining was consist-ent with transcript expression determined by qRT-PCR. The most significant change in WT1 and ZO1 staining was observed in TGFB + bFGB–treated cells, although they were largely morphologically indistinguish-able from those treated with only TGFB. Flow cytometry showed that cells in all groups had upregulated the mesenchymal marker CD90 compared to the untreated control (Fig. 5e), supporting the interpreta-tion that TGFB and bFGF had initiated EMT. Taken together, these findings indicate that the Epi cells were capable of undergoing EMT following activation of the TGFB and bFGF pathways and provide further evidence that they represent the in vitro equivalent of the developing epicardium.
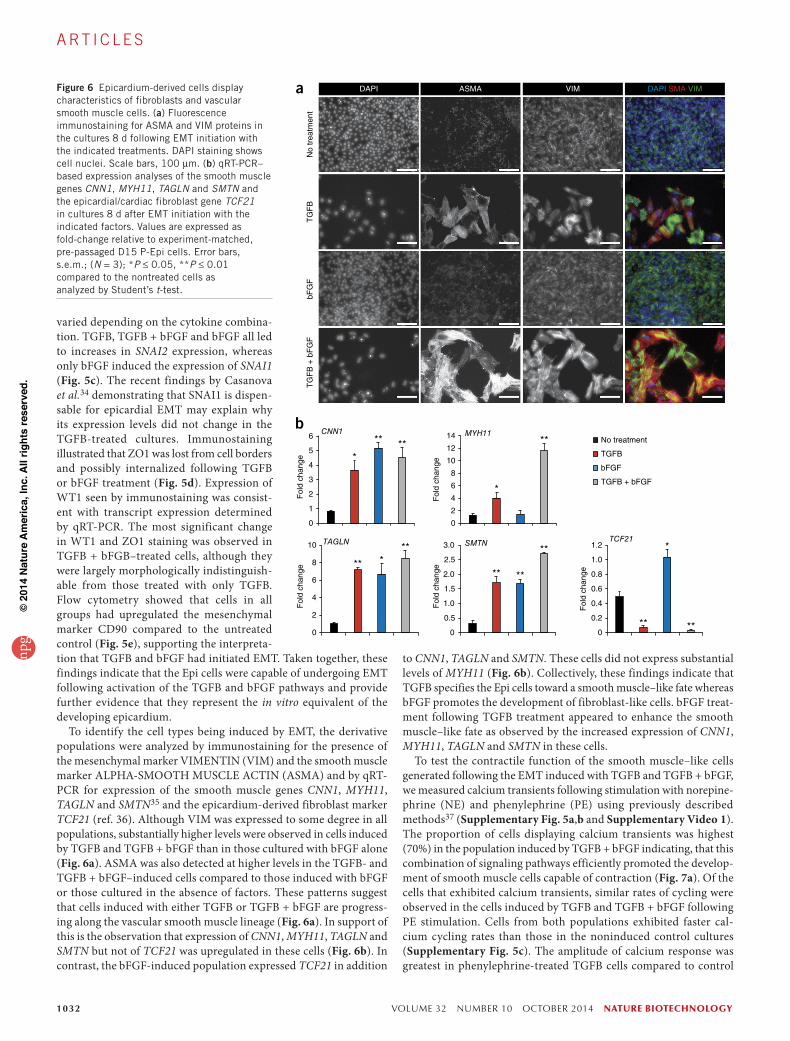
To identify the cell types being induced by EMT, the derivative populations were analyzed by immunostaining for the presence of the mesenchymal marker VIMENTIN (VIM) and the smooth muscle marker ALPHA-SMOOTH MUSCLE ACTIN (ASMA) and by qRT-PCR for expression of the smooth muscle genes CNN1, MYH11, TAGLN and SMTN35 and the epicardium-derived fibroblast marker TCF21 (ref. 36). Although VIM was expressed to some degree in all populations, substantially higher levels were observed in cells induced by TGFB and TGFB + bFGF than in those cultured with bFGF alone (Fig. 6a). ASMA was also detected at higher levels in the TGFB- and TGFB + bFGF–induced cells compared to those induced with bFGF or those cultured in the absence of factors. These patterns suggest that cells induced with either TGFB or TGFB + bFGF are progress-ing along the vascular smooth muscle lineage (Fig. 6a). In support of this is the observation that expression of CNN1, MYH11, TAGLN and SMTN but not of TCF21 was upregulated in these cells (Fig. 6b). In contrast, the bFGF-induced population expressed TCF21 in addition
to CNN1, TAGLN and SMTN. These cells did not express substantial levels of MYH11 (Fig. 6b). Collectively, these findings indicate that TGFB specifies the Epi cells toward a smooth muscle–like fate whereas bFGF promotes the development of fibroblast-like cells. bFGF treat-ment following TGFB treatment appeared to enhance the smooth muscle–like fate as observed by the increased expression of CNN1, MYH11, TAGLN and SMTN in these cells.
To test the contractile function of the smooth muscle–like cells generated following the EMT induced with TGFB and TGFB + bFGF, we measured calcium transients following stimulation with norepine-phrine (NE) and phenylephrine (PE) using previously described methods37 (Supplementary Fig. 5a,b and Supplementary Video 1). The proportion of cells displaying calcium transients was highest (70%) in the population induced by TGFB + bFGF indicating, that this combination of signaling pathways efficiently promoted the develop-ment of smooth muscle cells capable of contraction (Fig. 7a). Of the cells that exhibited calcium transients, similar rates of cycling were observed in the cells induced by TGFB and TGFB + bFGF following PE stimulation. Cells from both populations exhibited faster cal-cium cycling rates than those in the noninduced control cultures (Supplementary Fig. 5c). The amplitude of calcium response was greatest in phenylephrine-treated TGFB cells compared to control
**
No treatment
TGFB
bFGF
TGFB + bFGF
b
No
trea
tmen
tT
GF
BbF
GF
TG
FB
+ b
FG
F
DAPI ASMA VIM DAPI SMA VIMa
0
1
2
3
4
5
6
Fol
d ch
ange
CNN1
*
** **
0
2
4
6
8
10
12
14F
old
chan
geMYH11
*
**
0
2
4
6
8
10
Fol
d ch
ange
TAGLN
***
**
0
0.5
1.0
1.5
2.0
2.5
3.0
Fol
d ch
ange
SMTN
**
**
**
0
0.2
0.4
0.6
0.8
1.0
1.2
Fol
d ch
ange
TCF21*
**
Figure 6 Epicardium-derived cells display characteristics of fibroblasts and vascular smooth muscle cells. (a) Fluorescence immunostaining for ASMA and VIM proteins in the cultures 8 d following EMT initiation with the indicated treatments. DAPI staining shows cell nuclei. Scale bars, 100 µm. (b) qRT-PCR–based expression analyses of the smooth muscle genes CNN1, MYH11, TAGLN and SMTN and the epicardial/cardiac fibroblast gene TCF21 in cultures 8 d after EMT initiation with the indicated factors. Values are expressed as fold-change relative to experiment-matched, pre-passaged D15 P-Epi cells. Error bars, s.e.m.; (N = 3); *P ≤ 0.05, **P ≤ 0.01 compared to the nontreated cells as analyzed by Student’s t-test.
npg
© 2
014
Nat
ure
Am
eric
a, In
c. A
ll rig
hts
rese
rved
.
nature biotechnology VOLUME 32 NUMBER 10 OCTOBER 2014 1033
A rt i c l e s
cultures (Supplementary Fig. 5d). Finally, the duration of calcium transients following phenylephrine-treatment was longer in the TGFB + bFGF–induced cells than in those treated with TGFB or those in the control population (Supplementary Fig. 5e). Taken together these findings demonstrate that induction of the Epi cells with the combination of TGFB + bFGF promotes the development of smooth muscle cells capable of responding to agonists that result in increased calcium handling.
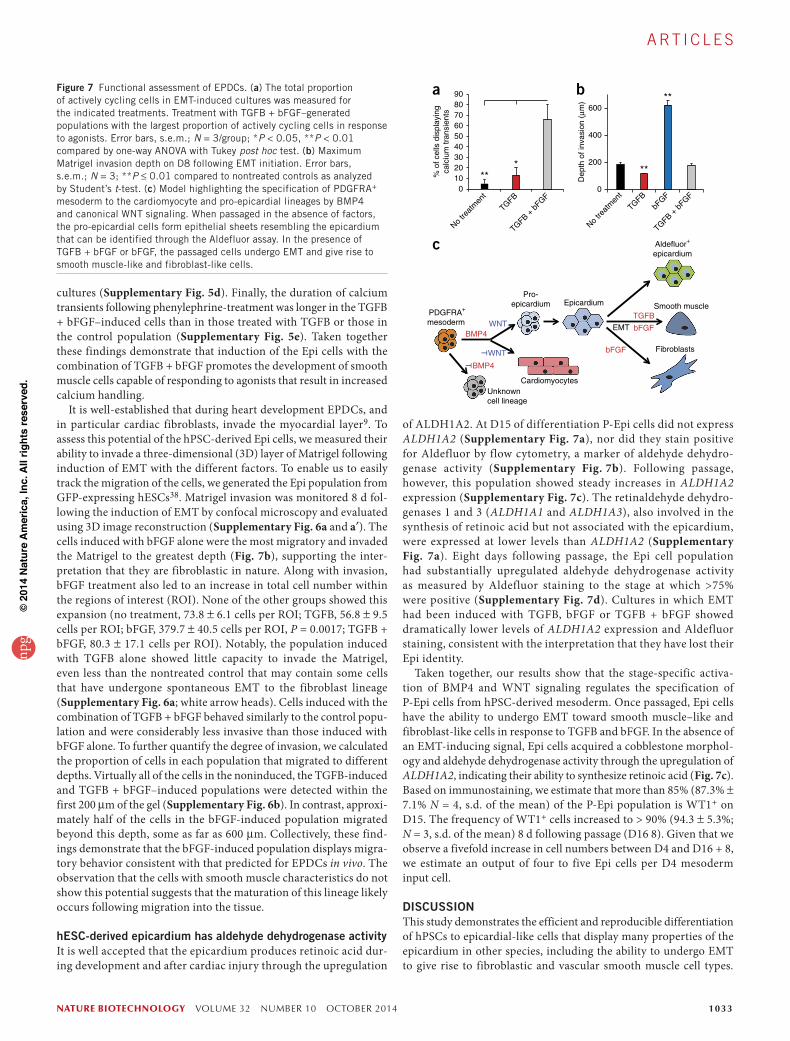
It is well-established that during heart development EPDCs, and in particular cardiac fibroblasts, invade the myocardial layer9. To assess this potential of the hPSC-derived Epi cells, we measured their ability to invade a three-dimensional (3D) layer of Matrigel following induction of EMT with the different factors. To enable us to easily track the migration of the cells, we generated the Epi population from GFP-expressing hESCs38. Matrigel invasion was monitored 8 d fol-lowing the induction of EMT by confocal microscopy and evaluated using 3D image reconstruction (Supplementary Fig. 6a and a′). The cells induced with bFGF alone were the most migratory and invaded the Matrigel to the greatest depth (Fig. 7b), supporting the inter-pretation that they are fibroblastic in nature. Along with invasion, bFGF treatment also led to an increase in total cell number within the regions of interest (ROI). None of the other groups showed this expansion (no treatment, 73.8 ± 6.1 cells per ROI; TGFB, 56.8 ± 9.5 cells per ROI; bFGF, 379.7 ± 40.5 cells per ROI, P = 0.0017; TGFB + bFGF, 80.3 ± 17.1 cells per ROI). Notably, the population induced with TGFB alone showed little capacity to invade the Matrigel, even less than the nontreated control that may contain some cells that have undergone spontaneous EMT to the fibroblast lineage (Supplementary Fig. 6a; white arrow heads). Cells induced with the combination of TGFB + bFGF behaved similarly to the control popu-lation and were considerably less invasive than those induced with bFGF alone. To further quantify the degree of invasion, we calculated the proportion of cells in each population that migrated to different depths. Virtually all of the cells in the noninduced, the TGFB-induced and TGFB + bFGF–induced populations were detected within the first 200 µm of the gel (Supplementary Fig. 6b). In contrast, approxi-mately half of the cells in the bFGF-induced population migrated beyond this depth, some as far as 600 µm. Collectively, these find-ings demonstrate that the bFGF-induced population displays migra-tory behavior consistent with that predicted for EPDCs in vivo. The observation that the cells with smooth muscle characteristics do not show this potential suggests that the maturation of this lineage likely occurs following migration into the tissue.
hESC-derived epicardium has aldehyde dehydrogenase activityIt is well accepted that the epicardium produces retinoic acid dur-ing development and after cardiac injury through the upregulation
of ALDH1A2. At D15 of differentiation P-Epi cells did not express ALDH1A2 (Supplementary Fig. 7a), nor did they stain positive for Aldefluor by flow cytometry, a marker of aldehyde dehydro-genase activity (Supplementary Fig. 7b). Following passage, however, this population showed steady increases in ALDH1A2 expression (Supplementary Fig. 7c). The retinaldehyde dehydro-genases 1 and 3 (ALDH1A1 and ALDH1A3), also involved in the synthesis of retinoic acid but not associated with the epicardium, were expressed at lower levels than ALDH1A2 (Supplementary Fig. 7a). Eight days following passage, the Epi cell population had substantially upregulated aldehyde dehydrogenase activity as measured by Aldefluor staining to the stage at which >75% were positive (Supplementary Fig. 7d). Cultures in which EMT had been induced with TGFB, bFGF or TGFB + bFGF showed dramatically lower levels of ALDH1A2 expression and Aldefluor staining, consistent with the interpretation that they have lost their Epi identity.
Taken together, our results show that the stage-specific activa-tion of BMP4 and WNT signaling regulates the specification of P-Epi cells from hPSC-derived mesoderm. Once passaged, Epi cells have the ability to undergo EMT toward smooth muscle–like and fibroblast-like cells in response to TGFB and bFGF. In the absence of an EMT-inducing signal, Epi cells acquired a cobblestone morphol-ogy and aldehyde dehydrogenase activity through the upregulation of ALDH1A2, indicating their ability to synthesize retinoic acid (Fig. 7c). Based on immunostaining, we estimate that more than 85% (87.3% ± 7.1% N = 4, s.d. of the mean) of the P-Epi population is WT1+ on D15. The frequency of WT1+ cells increased to > 90% (94.3 ± 5.3%; N = 3, s.d. of the mean) 8 d following passage (D16 8). Given that we observe a fivefold increase in cell numbers between D4 and D16 + 8, we estimate an output of four to five Epi cells per D4 mesoderm input cell.
DISCUSSIONThis study demonstrates the efficient and reproducible differentiation of hPSCs to epicardial-like cells that display many properties of the epicardium in other species, including the ability to undergo EMT to give rise to fibroblastic and vascular smooth muscle cell types.
a b
c
Smooth muscle
Fibroblasts
Aldefluor+
epicardium
EMT
Cardiomyocytes
Pro- epicardium
PDGFRA+
mesoderm WNT
WNT
T
BMP4
Epicardium
TGFB
bFGF
bFGF
BMP4
T
Unknown cell lineage
0102030405060708090
% o
f cel
ls d
ispl
ayin
gca
lciu
m tr
ansi
ents
***
No tre
atm
ent
TGFB
TGFB + b
FGF0
200
400
600
Dep
th o
f inv
asio
n (µ
m)
**
**
No tre
atm
ent
TGFBbF
GF
TGFB + b
FGF
Figure 7 Functional assessment of EPDCs. (a) The total proportion of actively cycling cells in EMT-induced cultures was measured for the indicated treatments. Treatment with TGFB + bFGF–generated populations with the largest proportion of actively cycling cells in response to agonists. Error bars, s.e.m.; N = 3/group; *P < 0.05, **P < 0.01 compared by one-way ANOVA with Tukey post hoc test. (b) Maximum Matrigel invasion depth on D8 following EMT initiation. Error bars, s.e.m.; N = 3; **P ≤ 0.01 compared to nontreated controls as analyzed by Student’s t-test. (c) Model highlighting the specification of PDGFRA+ mesoderm to the cardiomyocyte and pro-epicardial lineages by BMP4 and canonical WNT signaling. When passaged in the absence of factors, the pro-epicardial cells form epithelial sheets resembling the epicardium that can be identified through the Aldefluor assay. In the presence of TGFB + bFGF or bFGF, the passaged cells undergo EMT and give rise to smooth muscle-like and fibroblast-like cells.
npg
© 2
014
Nat
ure
Am
eric
a, In
c. A
ll rig
hts
rese
rved
.
1034 VOLUME 32 NUMBER 10 OCTOBER 2014 nature biotechnology
A rt i c l e s
Our approach will enable future studies aimed at establishing the role of epicardial cells in cardiomyocyte growth and differentiation in vitro and in repair after cardiac injury in vivo. Access to stage-specific pro-genitors has enabled us to identify the BMP and canonical WNT path-ways as key regulators of cardiomyocyte and epicardial specification from cardiogenic mesoderm (Fig. 7c). Our findings show an absolute requirement for BMP signaling for the generation of both lineages as neither develops when the pathway is inhibited. In the presence of BMP signaling, the decision to differentiate toward the cardio-myocyte or epicardial lineages is mediated by the canonical WNT pathway. The cardiomyocyte fate is specified in the absence of WNT signaling, whereas the epicardial lineage is generated by activation of the WNT pathway. Our data also suggest that these pathways act independently, as the levels of pSMAD1/5/8 were not affected by inhi-bition of WNT, and AXIN2 expression did not increase following the addition of BMP4. One interpretation of these findings is that these pathways act sequentially, with BMP inducing a WNT-responsive population that displays both epicardial and cardiomyocyte potential. Whether or not these pathways do indeed act sequentially remains to be determined.
In contrast to the BMP and WNT pathways, bFGF and NODAL/ACTIVIN signaling do not play a role in epicardial specification, as the lineage can be initiated in the presence of antagonists of both pathways. In fact, FGF signaling between D4 and D6 of differentia-tion does not appear to be compatible with epicardial specification as addition of bFGF at this stage blocked development of the lineage. Kruithof et al.33 have provided evidence that bFGF signaling promotes proliferation and mesenchymal differentiation of proepicardial organ cells in chick tissue explant cultures. These findings are not necessar-ily contradictory to ours, as the stage of development assayed in their study is likely most similar to the D15 P-Epi cells that we identified, a stage considerably later than the D4 mesoderm. In this regard, their observation that bFGF promotes mesenchymal differentiation is con-sistent with our findings that signaling through this pathway induces EMT in the hESC-derived Epi cells.
A pivotal role for BMP signaling in cardiac specification shown here is consistent with findings from studies in the mouse that demonstrate a block in heart development following the conditional knockout of Bmpr1a in cells expressing Mesp1-cre22. Additionally, the observa-tion that inhibition of WNT signaling is required for specification of the cardiomyocyte lineage is in line with a large number of stud-ies showing that stage-specific inhibition of the pathway is required for cardiogenesis in vivo and in hPSC differentiation cultures39–41. A specific requirement for this pathway in the specification of epi-cardial fate is supported by in vivo studies showing that the hearts of mice lacking the Wnt inhibitors Dkk1 and Dkk2 have a thicker epicardium and thinner myocardium compared to wild-type litter-mates. The efficient generation of epicardial lineage cells, even in the presence of endogenous levels of WNT signaling or suboptimal concentrations of DKK1 shown here, provides an explanation for the strict stage-specific requirement for inhibiting this pathway for gener-ating cardiomyocytes and suggests that under suboptimal conditions cultures may be contaminated with epicardial cells or EPDCs.
Similar to the epicardium in vivo, the hPSC-derived epicardial cells can undergo EMT in vitro and give rise to cells that display characteris-tics of fibroblasts and vascular smooth muscle cells. Cardiac fibroblasts are necessary for proper cardiomyocyte alignment42, electrical propa-gation43 and extracellular matrix deposition42. They are also one of the primary cell types involved during cardiac remodeling follow-ing injury16. Given the function of these cells in vivo, it is likely that they will play an important role in the development of engineered
heart tissue constructs designed to create functional myocardium in vitro. In addition, as the epicardium is the primary source of coronary vascular smooth muscle cells, it is possible that the smooth muscle–like cells generated from the hESC-derived epicardial cells do represent this population. Access to these cells from epicardial pro-genitors could have clinical implications as alterations in the function of the vascular smooth muscle population is thought to be important in the development of atherosclerotic plaques44,45. The generation of patient-specific smooth muscle cells through this approach will provide a model system to study the early changes associated with atherosclerosis and cardiovascular disease.
In summary, the findings presented here identify critical signaling pathways that regulate the specification of the cardiomyocyte and epi-cardial lineages from hPSC-derived mesoderm. With these insights, it is now possible to efficiently generate epicardial lineage cells from hPSCs, enabling us to define, in detail, their role in cardiac develop-ment, proliferation and maturation in vitro. Additionally, it will now be possible to investigate their function following transplantation into experimental animals in vivo, similar to the strategy used to test the effect of adult heart–derived EPDCs46,47.
METHODSMethods and any associated references are available in the online version of the paper.
Note: Any Supplementary Information and Source Data files are available in the online version of the paper.
AcKnoWLeDGMenTSWe thank T. Araki and B. Neel (Ontario Cancer Institute, Toronto) for providing the Sendai hiPSC line, O. El-Mounayri and M. Husain for their advice on epithelial-to-mesenchymal transition, Mark Gagliardi for his assistance in the culture of hESC-derived epicardial cells and the Sick Kids/UHN Flow Cytometry Facility for their assistance with cell sorting. We thank members of the Keller laboratory for their advice on the studies and comments on the manuscript. This work was supported by the Canadian Institute of Health Research (MOP-84524; MOP-119507; MOP-106538; CPG-127793), the Natural Sciences and Engineering Research Council of Canada (CHRPJ 446379-13) and the US National Institutes of Health (5U01 HL100405). This work was funded in part by VistaGen Therapeutics, Inc.
AUTHoR conTRIBUTIonSA.D.W. contributed to designing the study, designing and performing experiments, analyzing the data, and writing and editing the manuscript. A.M. contributed to designing, performing and analyzing experiments concerning calcium imaging, and editing the manuscript. R.Y.T. contributed to designing, performing and analyzing experiments concerning Matrigel invasion. S.A.F. contributed to designing, performing and analyzing experiments concerning Matrigel invasion. A.M. contributed data acquisition concerning cell quantification and editing the manuscript. M.S.S. contributed to designing experiments concerning Matrigel invasion. R.-K.L. contributed to designing experiments concerning calcium imaging. S.J.K. contributed to designing the study and editing the manuscript. G.K. contributed to designing the study, writing and editing the manuscript.
coMPeTInG FInAncIAL InTeReSTSThe authors declare competing financial interests: details are available in the online version of the paper.
reprints and permissions information is available online at http://www.nature.com/reprints/index.html.
1. DeRuiter, M.C., Poelmann, R.E., VanderPlas-de Vries, I., Mentink, M.M. & Gittenberger-de Groot, A.C. The development of the myocardium and endocardium in mouse embryos. Fusion of two heart tubes? Anat. Embryol. (Berl.) 185, 461–473 (1992).
2. Limana, F., Capogrossi, M.C. & Germani, A. The epicardium in cardiac repair: from the stem cell view. Pharmacol. Ther. 129, 82–96 (2011).
3. Komiyama, M., Ito, K. & Shimada, Y. Origin and development of the epicardium in the mouse embryo. Anat. Embryol. (Berl.) 176, 183–189 (1987).
npg
© 2
014
Nat
ure
Am
eric
a, In
c. A
ll rig
hts
rese
rved
.
nature biotechnology VOLUME 32 NUMBER 10 OCTOBER 2014 1035
A rt i c l e s
4. Austin, A.F., Compton, L.A., Love, J.D., Brown, C.B. & Barnett, J.V. Primary and immortalized mouse epicardial cells undergo differentiation in response to TGFbeta. Dev. Dyn. 237, 366–376 (2008).
5. Bax, N.A. et al. In vitro epithelial-to-mesenchymal transformation in human adult epicardial cells is regulated by TGFbeta-signaling and WT1. Basic Res. Cardiol. 106, 829–847 (2011).
6. von Gise, A. et al. WT1 regulates epicardial epithelial to mesenchymal transition through beta-catenin and retinoic acid signaling pathways. Dev. Biol. 356, 421–431 (2011).
7. Morabito, C.J., Dettman, R.W., Kattan, J., Collier, J.M. & Bristow, J. Positive and negative regulation of epicardial-mesenchymal transformation during avian heart development. Dev. Biol. 234, 204–215 (2001).
8. Smith, C.L., Baek, S.T., Sung, C.Y. & Tallquist, M.D. Epicardial-derived cell epithelial-to-mesenchymal transition and fate specification require PDGF receptor signaling. Circ. Res. 108, e15–e26 (2011).
9. Lie-Venema, H. et al. Origin, fate, and function of epicardium-derived cells (EPDCs) in normal and abnormal cardiac development. ScientificWorldJournal 7, 1777–1798 (2007).
10. Christoffels, V. Regenerative medicine: muscle for a damaged heart. Nature 474, 585–586 (2011).
11. Moore, A.W., McInnes, L., Kreidberg, J., Hastie, N.D. & Schedl, A. YAC complementation shows a requirement for Wt1 in the development of epicardium, adrenal gland and throughout nephrogenesis. Development 126, 1845–1857 (1999).
12. Haenig, B. & Kispert, A. Analysis of TBX18 expression in chick embryos. Dev. Genes Evol. 214, 407–411 (2004).
13. Moss, J.B. et al. Dynamic patterns of retinoic acid synthesis and response in the developing mammalian heart. Dev. Biol. 199, 55–71 (1998).
14. Xavier-Neto, J., Shapiro, M.D., Houghton, L. & Rosenthal, N. Sequential programs of retinoic acid synthesis in the myocardial and epicardial layers of the developing avian heart. Dev. Biol. 219, 129–141 (2000).
15. Huang, G.N. et al. C/EBP transcription factors mediate epicardial activation during heart development and injury. Science 338, 1599–1603 (2012).
16. Lepilina, A. et al. A dynamic epicardial injury response supports progenitor cell activity during zebrafish heart regeneration. Cell 127, 607–619 (2006).
17. Cai, C.L. et al. A myocardial lineage derives from Tbx18 epicardial cells. Nature 454, 104–108 (2008).
18. Zhou, B. et al. Epicardial progenitors contribute to the cardiomyocyte lineage in the developing heart. Nature 454, 109–113 (2008).
19. Smart, N. et al. De novo cardiomyocytes from within the activated adult heart after injury. Nature 474, 640–644 (2011).
20. van Tuyn, J. et al. Epicardial cells of human adults can undergo an epithelial-to-mesenchymal transition and obtain characteristics of smooth muscle cells in vitro. Stem Cells 25, 271–278 (2007).
21. Kattman, S.J. et al. Stage-specific optimization of activin/nodal and BMP signaling promotes cardiac differentiation of mouse and human pluripotent stem cell lines. Cell Stem Cell 8, 228–240 (2011).
22. Klaus, A., Saga, Y., Taketo, M.M., Tzahor, E. & Birchmeier, W. Distinct roles of Wnt/beta-catenin and Bmp signaling during early cardiogenesis. Proc. Natl. Acad. Sci. USA 104, 18531–18536 (2007).
23. Watt, A.J., Battle, M.A., Li, J. & Duncan, S.A. GATA4 is essential for formation of the proepicardium and regulates cardiogenesis. Proc. Natl. Acad. Sci. USA 101, 12573–12578 (2004).
24. MacNeill, C., French, R., Evans, T., Wessels, A. & Burch, J.B. Modular regulation of cGATA-5 gene expression in the developing heart and gut. Dev. Biol. 217, 62–76 (2000).
25. Ma, Q., Zhou, B. & Pu, W.T. Reassessment of Isl1 and Nkx2–5 cardiac fate maps using a Gata4-based reporter of Cre activity. Dev. Biol. 323, 98–104 (2008).
26. Liu, J. & Stainier, D.Y. Tbx5 and Bmp signaling are essential for proepicardium specification in zebrafish. Circ. Res. 106, 1818–1828 (2010).
27. Bochmann, L. et al. Revealing new mouse epicardial cell markers through transcriptomics. PLoS ONE 5, e11429 (2010).
28. Mahtab, E.A. et al. Cardiac malformations and myocardial abnormalities in podoplanin knockout mouse embryos: correlation with abnormal epicardial development. Dev. Dyn. 237, 847–857 (2008).
29. Dubois, N.C. et al. SIRPA is a specific cell-surface marker for isolating cardiomyocytes derived from human pluripotent stem cells. Nat. Biotechnol. 29, 1011–1018 (2011).
30. Mellgren, A.M. et al. Platelet-derived growth factor receptor beta signaling is required for efficient epicardial cell migration and development of two distinct coronary vascular smooth muscle cell populations. Circ. Res. 103, 1393–1401 (2008).
31. Phillips, M.D., Mukhopadhyay, M., Poscablo, C. & Westphal, H. Dkk1 and Dkk2 regulate epicardial specification during mouse heart development. Int. J. Cardiol. 150, 186–192 (2011).
32. Yu, P.B. et al. Dorsomorphin inhibits BMP signals required for embryogenesis and iron metabolism. Nat. Chem. Biol. 4, 33–41 (2008).
33. Kruithof, B.P. et al. BMP and FGF regulate the differentiation of multipotential pericardial mesoderm into the myocardial or epicardial lineage. Dev. Biol. 295, 507–522 (2006).
34. Casanova, J.C., Travisano, S. & de la Pompa, J.L. Epithelial-to-mesenchymal transition in epicardium is independent of Snail1. Genesis 51, 32–40 (2013).
35. Cheung, C., Bernardo, A.S., Trotter, M.W., Pedersen, R.A. & Sinha, S. Generation of human vascular smooth muscle subtypes provides insight into embryological origin-dependent disease susceptibility. Nat. Biotechnol. 30, 165–173 (2012).
36. Acharya, A. et al. The bHLH transcription factor Tcf21 is required for lineage-specific EMT of cardiac fibroblast progenitors. Development 139, 2139–2149 (2012).
37. El-Mounayri, O. et al. Serum-free differentiation of functional human coronary-like vascular smooth muscle cells from embryonic stem cells. Cardiovasc. Res. 98, 125–135 (2013).
38. Yang, L. et al. Human cardiovascular progenitor cells develop from a KDR+ embryonic-stem-cell-derived population. Nature 453, 524–528 (2008).
39. Lian, X. et al. Robust cardiomyocyte differentiation from human pluripotent stem cells via temporal modulation of canonical Wnt signaling. Proc. Natl. Acad. Sci. USA 109, E1848–E1857 (2012).
40. Ueno, S. et al. Biphasic role for Wnt/beta-catenin signaling in cardiac specification in zebrafish and embryonic stem cells. Proc. Natl. Acad. Sci. USA 104, 9685–9690 (2007).
41. David, R. et al. MesP1 drives vertebrate cardiovascular differentiation through Dkk-1-mediated blockade of Wnt-signalling. Nat. Cell Biol. 10, 338–345 (2008).
42. Weeke-Klimp, A. et al. Epicardium-derived cells enhance proliferation, cellular maturation and alignment of cardiomyocytes. J. Mol. Cell. Cardiol. 49, 606–616 (2010).
43. Gaudesius, G., Miragoli, M., Thomas, S.P. & Rohr, S. Coupling of cardiac electrical activity over extended distances by fibroblasts of cardiac origin. Circ. Res. 93, 421–428 (2003).
44. de la Cuesta, F. et al. Deregulation of smooth muscle cell cytoskeleton within the human atherosclerotic coronary media layer. J. Proteomics 82, 155–165 (2013).
45. Jonasson, L., Holm, J., Skalli, O., Bondjers, G. & Hansson, G.K. Regional accumulations of T cells, macrophages, and smooth muscle cells in the human atherosclerotic plaque. Arteriosclerosis 6, 131–138 (1986).
46. Winter, E.M. et al. Preservation of left ventricular function and attenuation of remodeling after transplantation of human epicardium-derived cells into the infarcted mouse heart. Circulation 116, 917–927 (2007).
47. Winter, E.M. et al. A new direction for cardiac regeneration therapy: application of synergistically acting epicardium-derived cells and cardiomyocyte progenitor cells. Circ Heart Fail 2, 643–653 (2009).
npg
© 2
014
Nat
ure
Am
eric
a, In
c. A
ll rig
hts
rese
rved
.
nature biotechnology doi:10.1038/nbt.3002
ONLINE METHODShPSC culture maintenance and differentiation. hESCs and hiPSCs were maintained as previously described21,38,48. The hESC lines HES2 and H7 were obtained from WiCell and were determined to be mycoplasma negative by The Hospital for Sick Children Department of Paediatric Laboratory Medicine (Toronto, Canada). Sendai hiPSCs were kindly provided by Toshi Araki and Ben Neel (Ontario Cancer Institute, Toronto, Canada) and determined to be mycoplasma negative by qRT-PCR (Agilent Technologies MycoSensor qPCR Assay Kit, cat. no. 302109). Briefly, hESCs were maintained on irradiated mouse embryonic fibroblast feeders (MEFs) and feeder-depleted by passage onto plates coated with Matrigel (VWR, cat. no. 354230) for 2 d. On day 0, hESCs were dissociated and embryoid bodies were generated in StemPro-34 media (Life Technologies, cat. no. 10640019) in the presence of recombinant human (rh)BMP4 (0.5 ng/ml, R&D, cat. no. 314-BP). After 24 h, embryoid bodies were cultured in StemPro-34 supplemented with rhBMP4 (3 ng/ml), rhACTIVINA (2 ng/ml, R&D, cat. no. 338-AC), and rhbFGF (5 ng/ml, R&D, cat. no. 233-FB) to induce mesoderm formation. On day 4 of differentiation (day 3 for hiPSCs as indicated in Supplementary Fig. 3b), embryoid bod-ies were dissociated using TrypLE (Invitrogen) and plated in monolayer on gelatin-coated plates at 1 × 10⁵ cells per well in StemPro-34 supplemented with rhDKK1 (150 ng/ml, R&D, cat. no. 5439-DK/CF), the ACTIVIN/NODAL inhibitor SB-431542 (5.4 µM, Sigma, cat. no. S-4317) and rhVEGF (5 ng/ml) unless otherwise indicated. On day 6, media was changed to StemPro-34 sup-plemented with rhVEGF (5 ng/ml) and cultures were maintained in this media until day 15 of differentiation with media changes every 2 d. For experiments involving WNT signaling, CHIR-99021 (Stemgent, cat. no. 04-004), XAV-939 (R&D, cat. no. 3748 or IWP2 (R&D, cat. no. 3533) were used at the indicated concentrations. For experiments involving the inhibition of FGF signaling, PD-173074 (Tocris, cat. no. 3044) was used at 100 µM.
Monolayer passage and EMT induction. At day 15, WT1+ monolayers were lifted off of the plate by treatment with collagenase B (Roche, cat. no. 11088831001) for 1 h. Monolayers were then harvested and dissociated with TrypLE and washed with IMDM. Dissociated cells were plated on Matrigel-coated plates at a density of 5 × 10⁴ cells per well in StemPro-34 supplemented with the ROCK inhibitor Y-27632 dihydrochloride hydrate (Toronto Research Chemicals, cat. no. Y100500). After 24 h, media was changed to StemPro-34 and treated with rhTGFB1 (R&D, cat. no. 240-B) and rhbFGF as indicated. Media was changed every 2 d until analysis.
Flow cytometry and cell sorting. For cell-surface antigens, staining was carried out in PBS with 3% FCS. For intracellular antigens, staining was carried out on cells fixed with 4% paraformaldehyde in PBS. Staining was done in PBS with 3% FCS and 0.5% saponin (Sigma). Cells were stained at a concentration of 2.5 × 10⁶ cells/ml with anti-KDR- APC (R&D Systems, cat. no. FAB357A; 1:10) and anti-PDGFRA– PE (R&D Systems, cat. no. 556002; 1:20), anti-SIRPA–PE-Cy7 (clone SE5A5; BioLegend; 1:500), anti-Podoplanin-PE (BioLegend, cat. no. 3377008, 1:200), anti-CD90-APC (BD Pharmingen, cat. no. 559869, 1:2,000), anti-PDGFRβ-PE (BD Pharmingen, cat. no. 558821, 1:200), anti-CD31-PE (BD Pharmingen, cat. no. 555446, 1:10), anti-CTNT (clone 13-11; Thermo NeoMarkers; 1:400), goat anti-mouse IgG–APC (BD, cat. no. 550826; 1:200). Cells assayed for Aldefluor (STEMCELL Technologies) were prepared based on manufacturer’s instructions. Incubation with the Aldefluor reagent was 45 min. Stained cells were analyzed on an LSRII flow cytometer (BD Biosciences). For FACS, the cells were sorted at a concentration of 106 cells/ml in IMDM/5% FCS using a FACSAriaTMII (BD Biosciences) cell sorter (SickKids-UHN Flow Cytometry Facility). Data were analyzed using FlowJo software (Treestar).
Immunostaining and microscopy. Immunostaining was performed as previously described29 using the following primary antibodies: mouse anti-CTNT (Thermo NeoMarkers, clone 13-11; 1:100), rabbit anti-WT1 (Abcam Epitomics, cat. no. ab89901, 1:100), mouse anti-ZO1 (Invitrogen, cat. no. 33-8100, 1:100), rabbit anti-alpha-Smooth Muscle Actin (Abcam, cat. no. ab5694, 1:100) and mouse anti-Vimentin (Sigma-Aldrich, cat. no. V6630, 1:100). Secondary antibodies used were: donkey anti-rabbit IgG-Cy3 (Jackson ImmunoResearch, cat. no. 711-165-152; 1:300), donkey anti-mouse IgG-Alexa 488 (Invitrogen, cat. no. A21202; 1:300). DAPI (Life Technologies, SlowFade
Gold) was used to counterstain nuclei. The stained cells were visualized using a fluorescence microscope (Leica CTR6000) and images captured using the Leica Application Suite software.
Quantitative real-time PCR. qRT-PCR was performed as previously reported29,49. Total RNA was prepared with the RNAqueous-Micro Kit (Ambion) and treated with RNase-free DNase (Ambion). RNA (500 ng to 1 µg) was reverse transcribed into cDNA using random hexamers and Oligo(dT) with Superscript III Reverse Transcriptase (Invitrogen). qPCR was performed on a MasterCycler EP RealPlex (Eppendorf) using QuantiFast SYBR Green PCR Kit (Qiagen). Expression levels were normalized to the housekeep-ing gene TATA box binding protein (TBP). Primer sequences are listed in Supplementary Table 1.
Western blot analysis. D4 cells were harvested and treated with the indicated reagents for 30 min. Nuclear protein extracts were harvested using the NE-Per Nuclear and Cytoplasmic Extraction Kit (Thermo Scientific, cat. no. 78835) according to manufacturers instructions. Lysates were separated by SDS-PAGE gel and transferred to PVDF membranes for immunoblotting. Immunoblots were incubated with anti-pSMAD1/5/8 (1:1,000, Cell Signaling, cat. no. 9516) and anti-Beta-actin (1:1,000, Cell Signaling, cat. no. 3700) overnight at 4 °C. Immunoblots were performed using infrared fluorescence-conjugated secondary antibodies and analyzed using the Odyssey infrared imaging system (LiCor Biotechnology).
Calcium imaging. Cells were grown to near confluence on 8-well glass chamber slides coated with Matrigel and treated according to the EMT assay. Calcium imagining was performed as previously described37. Cells were incubated with 5 µM of the membrane permeable calcium dye Fluo 4-a.m. (Invitrogen) and 0.1% (w/v) Plurionic F-127 (Invitrogen) for 35 min at 37 °C. Cells were washed with Tyrode’s solution consisting of 140 mM NaCl, 4 mM KCl, 2 mM CaCl2, 1 mM MgCl2, 10 mM HEPES, 10 mM glucose pH 7.4. Calcium imaging was performed using an Olympus FV1000 con-focal microscope with an excitation at 488 nm at 0.5% power to reduce photobleaching. Images were continuously acquired at a resolution of 512 × 512 pixels using a 40× objective and were stitched together into a continuous sequence over a 12-min period. All recordings were performed using the same excitation and acquisition settings. Each recording consisted of 4-min baseline and by equivalent 4-min recording periods following the addition of 20 µM of norepinephrine (NE, Sigma) and 15 µM of phenylephrine (PE, Sigma). These agonists were prepared from stock concentrations and diluted in Tyrode’s buffer. Three independent experiments were performed for each condition, and within each field of view, ROIs corresponding to the cyto-plasmic area of independent cells were analyzed. Representative ROIs dem-onstrate the arbitrary fluorescence signal (F) generated as an average pixel intensity for the ROI over the course of the 12-min recording, normalized by dividing the average ROI intensity during the first minute of noncalcium cycling baseline (F/F0). The proportion of cycling cells was determined after counting cells that exhibited at least one calcium transient and dividing by the total number of cells in the field of view. The frequency response was calculated by counting the number of cycles during each 4-min stage of the 12-min recording with a normalized fluorescence intensity (F/F0) greater than 1.5. The summed total of the frequency response for each group repre-sents the average number of cycles for all actively cycling cells analyzed for each group and is expressed in number of cycles per minute. The duration of calcium cycling for all active ROIs was manually calculated by determining the number of frames during which a calcium cycle spiked above baseline. The result was multiplied by the frame duration of 1.109 s. Calcium cycle duration was only measured for cycles that occurred at the start of the 4-min period corresponding to the addition of NE or PE. All data represent three independent experiments, with n = 6–10 cells/field, and data expressed as mean ± s.e.m. *P ≤ 0.05, **P ≤ 0.01 compared by one-way ANOVA with Tukey post hoc test.
Matrigel invasion assay. Growth factor reduced BD Matrigel (BD Sciences) was thawed overnight at 4 °C and 40 µl/well was added to a 96-well plate. The plates were then centrifuged at 600 r.p.m. for 5 min at room temperature,
npg
© 2
014
Nat
ure
Am
eric
a, In
c. A
ll rig
hts
rese
rved
.
nature biotechnologydoi:10.1038/nbt.3002
followed by a 30-min incubation at 37 °C. Epicardial cells derived from the HES2-GFP hESC line38 were seeded on the gels at a density of 15,000 cells/well with 150 µl/well of StemPro-34 media, and maintained at 37 °C/5% CO2. After 24 h, media was changed to StemPro-34 and treated with rhTGFB1 and rhbFGF. The media was changed every 2 d thereafter. After 8 d, cells were imaged using confocal microscopy (Olympus). High resolution Z-stack images were taken with a 1-µm step size. For quantification of cell number and migration, Z-stacks of each gel were imaged with a 10-µm step size, and analyzed using Imaris BitPlane software. Four ROIs (317.5 µm × 317.5 µm each) within each gel were used for quantification of migration, with the dis-tance between the highest and lowest cell taken as the migration distance per ROI. The average of the four ROIs was taken as the migration distance
per gel, with a total of four gels per treatment group. The experiment was repeated with three independent cell batches for accuracy.
Statistical analysis. All data represents three biological replicates or more unless otherwise indicated in the figure legend. Error bars represent s.e.m. and two-tailed Student’s t-tests were performed for all analyses unless otherwise indicated in the figure legend.
48. Kennedy, M., D’Souza, S.L., Lynch-Kattman, M., Schwantz, S. & Keller, G. Development of the hemangioblast defines the onset of hematopoiesis in human ES cell differentiation cultures. Blood 109, 2679–2687 (2007).
49. Clarke, R.L. et al. The expression of Sox17 identifies and regulates haemogenic endothelium. Nat. Cell Biol. 15, 502–510 (2013).
npg
© 2
014
Nat
ure
Am
eric
a, In
c. A
ll rig
hts
rese
rved
.