Embed Size (px)
Citation preview
CENTRE FOR NEWFOUNDLAND ST\JO\ES
TOTAL OF 10 PAGES ONLY MAY BE XEROXED
(Without Author's Permission)


Morphological and Magnetic Characterization of Electrodeposited Magnetite
St. John's
by
Shawn Michael Edward Chatman
A Thesis Submit t ed in Partial Fulfilment of
t he Requirements for t he Degree of
Masters of Science
Department of Physics and Physical Oceanography
Memorial University of Newfoundland
September , 2005 Newfoundland

ll
Abstract
This thesis describes the synthesis, structure, morphology, and magnetic prop
erty relations of electrodeposited magnetite. Thin film magnetite was synthesized
on polycrystalline brass or Au/ Cr/glass substrates using an aqueous electrodepo
sition t echnique. Magnetite formation in electrolytes (containing KCH3 COO and
Fe(S0 4)2(NH4)2) required t emperatures between 60°C and 85°C, and deposition po
t entials between -0.300 V and 0.575 V or galvanostatic current densities between
50 f..lA/cm2 and 88 f..lA/cm2 Magnet ite crystallites had an oct ahedral habit when
grown from electrolyt es with low acetate concent rations, and a more rounded mor
phology when grown from acetate-enriched electrolytes . Magnetic hysteresis studies
show t hat magnetit e grown wit h lower acet ate concentrations displays monotoni
cally increasing coercivity (100- 300 Oe), and monotonically decreasing square ness
(80-35%), with increasing over pot ent ial. In contrast , magnetite grown from acetate
enriched electrolytes had a much lower squareness ( rv 25%) and coercivity ( rv 50 Oe).
This evidence suggests that potent ial and electrolyte composition can be adjusted to
change domain behaviour from pseudo-single domain type (for low over potentials and
low acetate concentrations) to multi-domain ty pe (for eit her high overpotent ials or
high acetate concentration).
Magnetic hysteresis data also show that an exchange bias is present in samples

Ill
containing both magnetite and iron oxide hydroxides. A preliminary study has shown
that it is d ifficult to electrodeposit distinct bilayers of magnetite and the antiferro
magnetic iron hydroxide goethite (a-FeOOH).

lV
Acknowledgements
I would like to sincerely thank Dr. Kristin Poduska for all the t ime, effort , and
patience during the completion of this thesis. Wit hout her generous contribution t his
thesis would never have been written.
I would like to thank Adam J . G. Noel for his cont ribution, as he synthesized
some of the samples analyzed here. I would like to t hank t he following people for
instrument time and data collection: Dr. John Shirokoff of t he Faculty of Engineering
and Applied Science (X-ray d iffraction), Dr. Lawrence Thompson and Dr. Martin
Lemaire of the Chemistry Department (SQUID magnet ometry) , Dr. Joe Hodych and
Mr. Raymond Patzold of the Depart ment of Eart h Sciences (ballistic magnetometer
and much advice), and Dr. Ted Monchesky of the Physics Department at Dalhousie
University for the use of t heir XPS and magnet ometry facilit ies. I would also like to
thank the following people for letting me use their instruments: Dr. Roger Mason
and Mrs. Helen Gillespie of t he Department of Earth Sciences for the use of t heir
XRD facilit ies, and Mrs. Lisa Lee and the Biology Department fo r the use of t heir
SEM and EDX facilities.
I would like to thank Dr. Todd Andrews and Chris Young of t he Department of
Physics and Physical Oceanography for t heir cooperation and work during Brillouin
Spectroscopy studies.

v
I would also like to thank my mother and father for all their patience, t ime, and
help. I would a lso like to thank my family and friends, inside and out of the Physics
Department, for all t heir help and support .

Contents
1 Introduction
2 Theory 2.1 Electrodeposit ion . ..... . . . .. .
2.1.1 Reduction/ Oxidation Reactions 2.1.2 Metal Oxide Electrodeposition .
2.2 Magnetism .. . .. . . . 2.2.1 Ferromagnetism .. . 2.2.2 Ferrimagnetism . . . 2.2.3 Antiferromagnet ism . 2.2.4 Exchange Anisotropy
3 Experimental Methods 3.1 Synthesis . . . . .
3.1.1 Apparatus .. 3.1.2 Procedure . .
3.2 Analysis Techniques 3.2.1 X-Ray Diffraction . 3.2.2 Scanning Electron Microscopy 3.2.3 Energy Dispersive X-Ray Analysis. 3.2.4 Magnetometry . ... . . . 3.2.5 Atomic Force Microscopy . . .. .
4 Influencing Morphology and Magnetism 4. 1 Confirming Phase Composition . .. .. . .... . 4.2 Tuning Structure With Applied Potential . . ... . 4.3 Modifying Electrolyte to Affect Deposition Kinetics
4.3.1 Ammonium Concentration 4.3.2 Acetate Concent rat ion
4.4 Magnetic Characterization . . . .
Vl
1
7 7 7
12 15 15 22 24 24
29 29 29 32 34 34 43 45 47
48
50 51 55 57 58 59 63

4.4.1 4.4.2 4.4.3
Verwey Transition . . . . . Saturation Magnetization Hysteresis . . . . . . . . .
5 Electrodeposited Iron Oxide Composite Materials 5.1 Hysteresis Loop Shifts .. .. .. . . 5.2 Preparation of Multi-Phase Deposits
6 Conclusions 6. 1 Conclusions 6.2 Future Studies .
Bibliography
Vll
63 65 66
70 70 72
76 76 79
84

Vlll
List of Tables
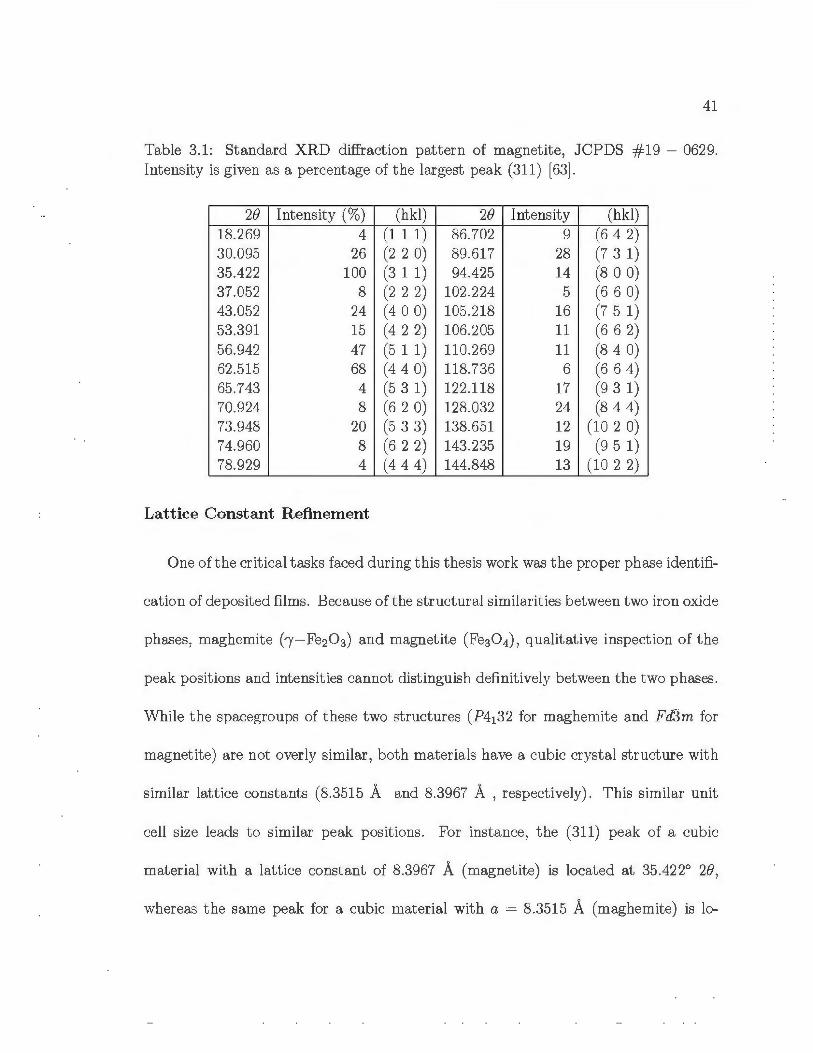
3.1 Standard XRD diffraction pattern of magnetite, JCPDS # 19- 0629. Intensity is given as a percentage of the largest peak (311) [63] . . . . 41
5.1 Summary of deposition conditions for two-phase exchange biased samples. Goet hite deposit ion occurred at - 0.300 V (varying times), while magnetite deposit ion occurred at - 0.375 V (20 minutes). T he electrolyte, containing 0.01 M Fe(S04)2(NH4) 2 ·6H20 + 0.04 M KCH3 COOH, and was maintained at 80°C. . . . . . . . . . . . . . . . . . . . . . . 75

List of Figures
1.1 The inverse spinel crystal structure of Fe30 4 , magnetit e. Oxygen sit es can be seen in red , t etrahedral Fe sites in green, and octahedral Fe
lX
sites in grey. . . . . . . . . . . . . . . . . . . . . . . . . . . . . . . . . 3
2.1 Cyclic voltammogram (CV) of the gold/gold oxide redox couple. This CV shows t he current response recorded when a potential is swept across a polycryst alline Au working electrode in rv 0.01 M H2S04 (pH 1.7) at 50 mV /s. The broad peak above 1.0 V is due to t he oxidation of gold at the surface of the working electrode. The peak near 0.8 V is due to the reduction of the gold oxide. . . . . . . . . . . . . . . . . . 11
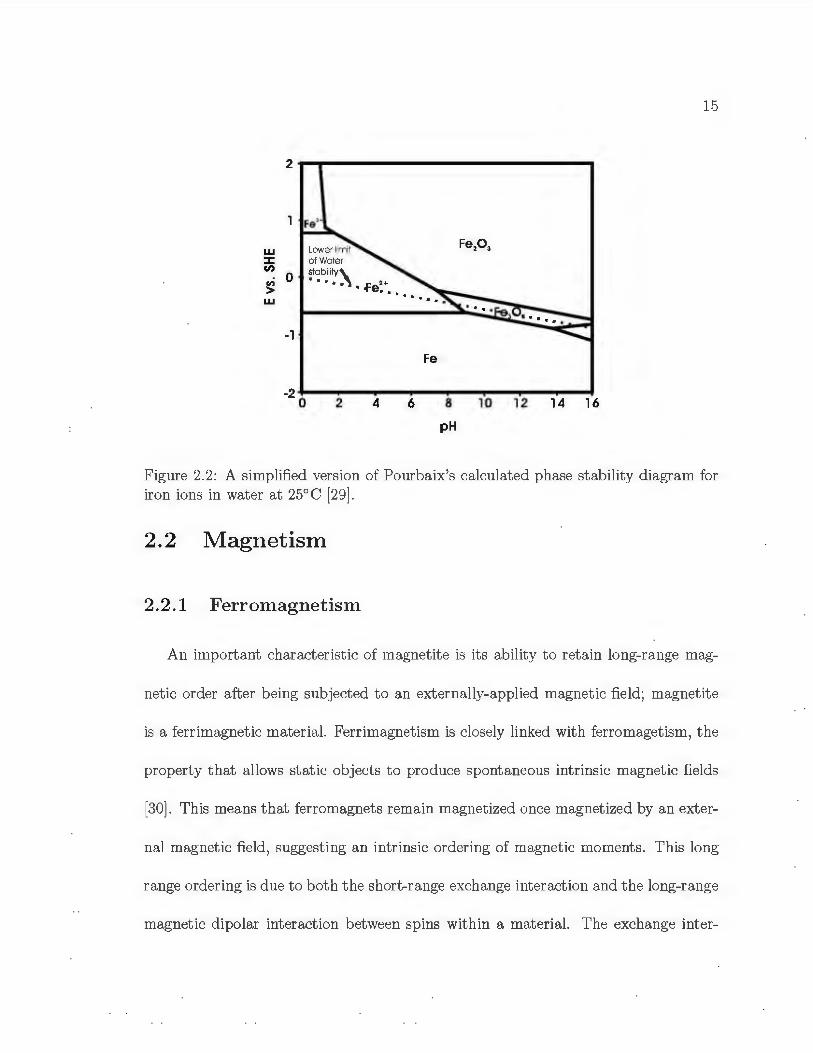
2.2 A simplified version of Pourbaix's calculated phase stability diagram for iron ions in water at 25°C [29]. . . . . . . . . . . . . . . . . . . . . 15
2.3 A schematic representation of domains in a ferromagnetic material. The arrows show the magnet izat ion direction in each different domain. Modified from Blundell [30] . . . . . . . . . . . . . . . . . . . . . . . . 17
2.4 This diagram shows the same domains seen in Figure 2.3 under the influence of an externally applied magnetic field, H. Notice t he unidi-rectional orientation. . . . . . . . . . . . . . . . . . . . . . . . . . . . 18
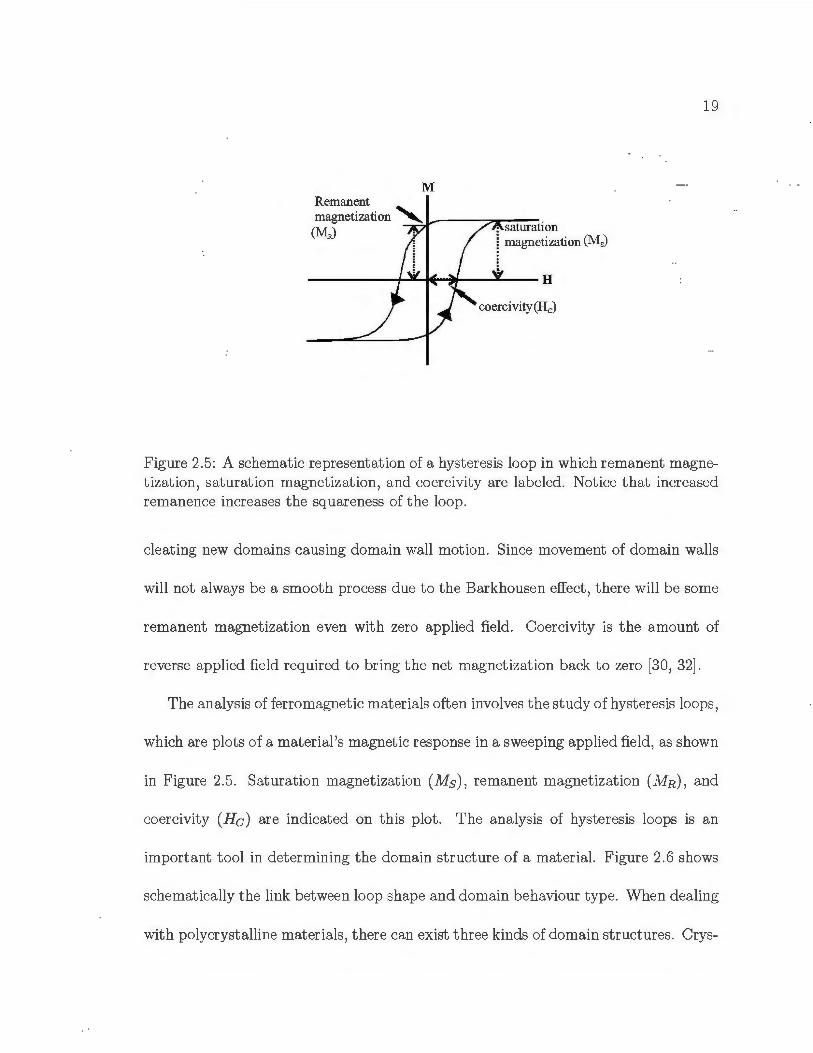
2.5 A schematic representation of a hysteresis loop in which remanent magnet ization , saturation magnetization, and coercivity are labeled . No-t ice t hat increased remanence increases the squareness of the loop. . . 19
2.6 Schematic d iagram of the typical hysteresis response exhibited by single domain, multi-domain, and pseudo-single domain crystallites . . . . . . 20
2. 7 Spin cancellation associated wit h the Fe3+ ions in t he octahedral and tetrahedral sites . The result is a ferrimagnetic material in which the net magnetic response can be attributed solely to t he spin of t he Fe2+ ions in t he octahedral sites. Adapted from Kittel [8] . . . . . . . . . . 23

2.8 Schematic diagram of a system containing both ferromagnetic and antiferromagnetic mat erials under an applied magnetic field , H, and cooled/grown below the Neel t emperature. Notice that t he axis of
X
magnetization is the same for both materials. . . . . . . . . . . . . . 25 2.9 Schematic d iagram of a schematic hyst eresis loop d isplaying exchange
bias. Not ice t he shift of the loop along t he horizontal applied field (H) axis. T he exchange field, HE' is t he average of coercivit ies Hc1 and Hc2 . 27
3.1 Schematic d iagram of t he setup used for the electrodeposition of magnetite during t his thesis. This is a practical adaptation of a t raditional setup, as described by Bard and Faulkner [20] . . . . . . . . . . . . . 31
3.2 Schematic illustration of the Von Laue reradiator formulation. Adapted from Ashcroft and Mermin [62] . . . . . . . . . . . . . . . . . . . . . . 35
3.3 Two-dimensional representation of the Ewald construct sphere. T he two vect ors, k and k' , satisfy the Laue condition and would lead to constructive interference. Adapted from Ashcroft and Mermin [62]. 37
3.4 Diagram showing t he equivalence of the Laue rereadiator formulation of X-ray scattering wit h reflect ion from a Bragg plane. The dashed line represents a Bragg plane perpendicular to K , k , and k '. . . . . . 39
3.5 Diagram showing a typical X-ray diffractometer. . . . . . . . . . . . . 40 3.6 Scanning electron micrograph of the brass shimstock used as a sub
strate for the deposition of magnetite. The rolling direction is indicated in this image. . . . . . . . . . . . . . . . . . . . . . . . . . . . . . . . 44
3. 7 A representative energy dispersive X-ray (EDX) energy spectrum. Peaks from copper and zinc peaks in this spectra are due t o the brass substrate, while gold peaks are due to the evaporated gold used to increase the conductivity of the films for SEM imaging. The iron peaks are due to the deposit ed magnetite. Oxygen is not seen here because its atomic number is too low to be detected by our system. . . . . . . . . . . . . 46
4. 1 Indexed XRD diffraction pattern from a t hin film of magnetite prepared by potentiostatic deposition at -0.375 V. Peaks resulting from the brass substrate are marked with an aster isk (*) . T he observed Bragg reflections are excellent mat ches with those expected for mag-netite, JCPDS # 19-0629 [63]. . . . . . . . . . . . . . . . . . . . . . . 53
4.2 Applied deposition pot ential vs. t ime for a sample prepared galvanostatically at 50 ~-tA/cm2 . Wit hin t he first 15 seconds of deposition, the applied potential stabilizes to a potential at which magnetite is electrodeposited, and no significant variation in potential is observed over 15 - 90 minutes of deposition. . . . . . . . . . . . . . . . . . . . . . . 53

4.3 Scanning electron micrographs of magnetite deposited potentiostatically ( -0.350 V for 30 minutes) and galvanost atically (+50 J.LA for 30 minutes). Octahedral cryst allite habits, circled in red, are observed in samples prepared by eit her method. Energy dispersive X-ray analysis (EDX) was carried out on these samples in order to verify that no
Xl
contaminants were present. . . . . . . . . . . . . . . . . . . . . . . . . 54 4.4 Linear sweep voltammogram of 0.01 M Fe(S04)2(NH4)2 · 6H2 0 + 0.04
M KCH3COOH at 1 m V js. The circled center region indicates the potentials at which magnetit e can be deposited. In the region more negative than these potentials, no deposit is seen. In the region more positive than this, goethite (r-FeOOH) forms . . . . . . . . . . . . . . 57
4.5 Scanning electron micrograph of magnetite deposited potentiostatically ( - 0.4 75 V for 25 minutes) from electrolyte cont aining 2.0 M acetate. More rounded crystallite habits are observed in samples prepared from electrolyt es with higher acetate concentrations . . . . . . . . . . . . . . 62
4.6 Indexed XRD diffraction pattern from a t hin film of magnetite prepared by potentiostatic deposition at -0.4 75 V from an acetate-enriched electrolyte. Peaks resulting from the gold substrate are marked with an ast erisk (*). The observed Bragg reflections are excellent matches with those expected for magnetite, JCPDS # 19-0629 [63]. . . . . . . 62
4. 7 The t emperature dependence of the saturation magnetization of a sample of electrodeposited magnetite (deposited potentiostatically at -0.375 V for 30 minutes) . The magnetization was recorded after the sample was cooled both without a magnetic field (ZFC) and in a magnetic field (FC) . The magnetization reaches a maximum at the Verwey temperature (115 K). . . . . . . . . . . . . . . . . . . . . . . . . . . . 64
4.8 Representative magnetic hysteresis loops obtained from potent iostaticallydeposited samples at -0.325 V (a) , -0.350 V (b), and -0.425 V (c) . The loops shown in (a) and (b) are from deposits prepared with electrolyt es with 0. 04 M acetate, while the loop in (c) is from a deposit prepared from an electrolyt e containing 2 M acet ate. . . . . . . . . . 67
4.9 Magnetic coercivity plotted as a function of overpotential shows a strong t rend of increasing coercivity with increasing overpotential. All coercivity data were obtained with a field applied in t he in-plane orientation. The overpotentials are calculated relative to t he pH-dependent Nernst reversible potent ial for t he Fe2+ / Fe3+ redox reaction (-0.630 V vs. Ag/ AgCl). . . . . . . . . . . . . . . . . . . . . . . . . . . . . . . . 68
4. 10 Hysteresis loop squareness plotted as a function of overpotent ial shows a strong trend of decreasing squareness with increasing overpot ential. The overpotentials are calculated relative to t he pH-dependent Nernst reversible potent ial for t he Fe2+ / Fe3+ redox reaction (-0.630 V vs. Ag/ AgCl) . . . . . . . . . . . . . . . . . . . . . . . . . . . . . . . . 69

Xll
5.1 This hysteresis loop shows clear exchange bias wit h a positive shift along t he x (applied field) axis of about 10%. . . . . . . . . . . . . . 72
5.2 Indexed XRD pattern of a sample pot entiostatically deposited at -0.300 V for 30 minutes. Peaks from the gold substrate are marked with an asterisk(*). This diffraction pattern is an excellent match with that of goethite ('r-FeOOH), JCPDS #29-0713 [63]. . . . . . . . . . . . . . . 73
5.3 SEM micrograph displaying a mixed phase deposit where both goethite (diamond-shaped) and magnetite (octahedral) can be seen. This sam-ple was prepared galvanostatically at 50 J.LA/cm2 for 45 minutes. . . . 74

1
Chapter 1
Introduction
In the race to make faster, cheaper , and better microelectronic devices, such as
nonvolat ile random access memory (RAM) and high-density recordable media [1],
researchers have been reviewing the electronic, magnetic, and mechanical properties
of many types of materia ls. Magnetite (Fe30 4), as a half-metal, has garnered some
of this attention [2, 3]. Half-metals have only one occupied spin band at t he Fermi
level, so conduction is completely spin dependent [4, 5] . T his characteristic is of
use in micro-electronic components such as spin valves and giant magnetoresistive
(GMR) devices where a magnetic field is used to control t he flow of electrons t hrough
their intrinsic spin. This t hesis describes t he synthesis , morphological attr ibutes, and
magnetic properties of magnetite prepared by electrochemical deposit ion.
Known historically as lodestone, magnetite is a ferrite material that has long been
the subject of materials science research [6]. Ferrites are iron oxide based materials

2
with t he chemical formula MO·Fe2 0 3 , where M is the 2+ ion Fe, Ni, Co, Cu, Zn,
Mg, Pb, Cd, and Sn.1 Magnetite has the cubic inverse spinel structure (space group
F&m) , which is characterized by 32 cubic closed packed sites per unit cell with 24
interstitial sites (8 t etrahedral and 16 octahedral) . In magnetite, t he cubic closed
packed sites are occupied by oxygen atoms, while the tetrahedral sites are filled with
Fe3+ ions and the octahedral sit es accommodate Fe2+ and Fe3+ ions , as shown in Fig-
ure 1.1 [8]. This mixture of 2+ and 3+ ions allows magnetite to exhibit its int eresting
magnetic and electronic propert ies. Based solely on exchange interactions within and
between the sublattices of magnetite's structure, an antiparallel spin alignment would
be expect ed. However , there exist s a parallel alignment within each sublattice, and
an anti parallel alignment between sublattices. In essence, the spins of the Fe3+ ions in
the octahedral site cancel out the antiparallel spins of the 3+ ions in t he tetrahedral
sites. Consequent ly, the spins of t he Fe2+ ions in t he octahedral sit es are the only
ones t hat contribute to t he net magnetization of magnetite. This results in a net
ferrimagnetic moment as well as spin polarization at t he Fermi level [1] .
Traditionally, t hin film magnetite has been synthesized with ultrahigh vacuum
(UHV) techniques which typically involve high temperature deposit ion and anneal-
ing. Examples of such UHV techniques include laser ablation [9], electron beam
evaporation [10], inductive melt ing [11], and molecular beam epitaxy [12]. Collec-
tively, t hese methods can be applied to a vast range of elements and compounds,
1 If sufficient crystal lattice vacancies are present to maintain the charge balance, the 3+ ions Co, Mn, Cr, Al, V, and Mo can be subst ituted forM. T his is also true for the 4+ ions V, Ti, Mo, and Sn, as well as the Mo5+ ion [7].

8.396A
Ocfahedral Site Fe
8 Te1rahedral Site Fe
8 0Xygen
3
Figure 1.1: T he inverse spinel crystal structure of Fe30 4 , magnetite. Oxygen sites can be seen in red , t etrahedral Fe sites in green, and octahedral Fe sit es in grey.
and they can yield very high sample purit ies. However, instrumentation required for
UHV sample preparation is typically very expensive t o purchase and operate . Along
wit h high cost s, fi lms formed in UHV cannot be deposited upon complex substrate
morphologies due to shadowing, and they can have non-uniform t hicknesses over large
areas due to the directional plumes inherent in laser beam ablation and molecular
beam epitaxy systems.
This thesis focuses on magnetite fi lms prepared by electrodeposition, a low-cost,
low-temperature synthesis technique that requires no annealing. Electrodeposition
uses electron transfer to form deposits, usually of met als and metal oxides, on the
surface of a conducting substrate (electrode) . By using high purity reagents and ul-
trapure water , electrodeposition can yield very high purity samples using deposit ions
4
near room t emperature and wit hout annealing. This is an important advantage of
electrodeposition, since many of t he subst rates used in microelectronics decompose at
high temperatures. GaAs and Si become unst able at "' 500°C and "' 900°C, respec
tively, so t echniques which require high synt hesis t emperatures or annealing temper
atures t o form magnetite are not feasible. Thus, electrodeposit ion's low-temperature
sample preparation is a major advantage over techniques t hat require high t empera
ture synthesis or annealing.
Cost and temperature are not t he only attributes of electrodeposited magnetite.
Electrodeposit ion also has many adjustable parameters, similar to UHV techniques,
including substrate t ype, deposit ion potential, and electrolyte composition. Further
more, it has been found t hat film crystallinity, grain size, and grain orientation are
some of the characteristics t hat can be controlled by varying deposition conditions
such as deposit ion potent ial, temperature, and electrolyt e pH [13, 14, 15, 16]. Pre
vious studies into t he electrodeposition of magnet it e has been mainly undertaken by
two research groups. J ay A. Switzer 's research group (University of Missouri-Rolla)
has focused on the epitaxial electrodeposit ion of magnetite onto single crystal sub
strates, and t he magnetoresistance of such films [2, 3]. Masanori Abe's group (Tokyo
Instit ute of Technology) has studied t he bulk-like properties of electrodeposited thin
films of magnetite [7, 17, 18]. Abe's group has created a body of work on electrode
posited magnetite focused on the effects of synthesis conditions on deposit ion rate,
crystallinity, and sat uration magnetization, while Switzer 's group has investigated

5
the effects of magnetite deposition on single crystalline substrates and has done pre
liminary investigations of magneto resistance. However , device applications will also
require studies into the sensit ivity of magnetite's hysteresis response, which is the
subject of this thesis.
As with any technique, electrodeposition does have some disadvantages. There is
a possibility of side reactions occurring that could be detrimental t o electrodeposit ion,
such as t he in situ formation of other iron species while attempting magnetite depo
sition [18], or fouling of electrodes. Overall, the advantage of using a low cost, low
temperature technique to deposit magnetite can outweigh t he disadvantages. Conse
quently, electrodeposition has the potential to be a viable option in the synt hesis of
thin film magnet ite.
The goal of t his t hesis is t o characterize t he magnetic propert ies of magnetite syn
thesized electrochemically on polycryst alline substrates. Specifically, the effect of film
morphology on magnetic response will be explored. A study of t he influence of grain
size, morphology, and boundary interactions on the magnetic response of thin film
magnetite is particularly important to linking deposition condit ions wit h magnetic
responses favourable to spintronic device applicat ions. As well, t his investigation was
performed on polycrystalline substrates so t hat t he reduced cost of such substrates
can be weighed against any associat ed adverse influence due to such substrates. The
electrosynt hesis of magnetite could offer an economical opt ion for preparing thin
film spintronic devices. Studying the relation between deposition conditions, film

6
morphology, and magnetic response is the first step towards controlled t ailoring of
film properties. This thesis will first focus on ident ifying viable electrodeposition
conditions for magnetite, including applied potential/current, pH, ionic species, and
deposition t emperature. Next, this thesis explores the relations between t hese de
position conditions and the result ing morphologies and magnetic responses of the
electrodeposits. In particular, this thesis work relates hyst eresis loop squareness and
coercivity with specific deposit ion condit ions and morphologies. These relations show
a link between the electrolyte composition and/ or applied potent ial and t he magnetic
domain structure of electrodeposited samples . This correlated study of the synthesis,
morphology, and magnetic properties of thin film magnetit e lays a solid foundation
that could lead t o a more in depth analysis of electrodeposited magnetite for spin
tronic applications. The ability to tailor t he magnetic and electronic properties of a
material is valuable t o the high-technology industry, where the reliable tailoring of
materials is essential to manufacturing high quality microelectronic components.

7
Chapter 2
Theory
While t he magnetic study of thin ferromagnetic fi lms is firmly rooted in the physics
of magnetic mater ials, other areas of science must be employed to fully ana lyze the
synt hesis-structure-property relat ions. T he study of electrodeposited magnetite is no
except ion to this. Not only were theories regarding magnetism in thin films utilized
in this study, but the theories behind electrodeposition and metal oxide formation
were also considered.
2.1 Electrodeposition
2.1.1 R eduction/Oxidation R eactions
The electrochemical synt hesis of a material relies on an intimate link between elec
tron transfer and cryst allite formation. This t ransfer of electrons occurs at t he surface

8
of an electrode submersed in an electrolyte. A major portion of the current response
in such reactions is due to the oxidation or reduction of an active species within a
solution, which is t ypically proportional t o the concentration of the active species
within solution [1 9] . The type of reactions characteristically involved in electrochem
ical synthesis are reduction/oxidation (redox) reactions. The reduction or oxidation
of a chemical species is defined by whether said species gains or loses electrons in the
reaction, respectively. Such reactions can be written as a redox couple,
(2.1)
where 0 is the oxidized species, R is t he reduced species, and n is t he number of
electrons transferred per reaction . Each redox reaction has a standard potential,
Eo, that d ictates the potential required for electron transfer. At pot entials more
negative than Eo, the reduction of 0 is more favourable (reductive reaction), while
at potent ia ls more positive than Eo, t he oxidation of R is more favourable (oxidative
reaction). Reactions that follow this rule are called faradaic processes [19, 20].
The standard potential of an electrochemical reaction is measured according to
the potential difference between the working electrode, at which t he reaction occurs,
and a reference electrode. In t he lit erature, many authors report standard potentials
against t he standard hydrogen electrode (SHE), which is the standard potential of
the redox reaction of hydrogen gas and H+. The SHE is t he accepted benchmark
for reference electrodes. Ot her reference electrodes, such as t he Ag/ AgCl electrode,

9
are measured relative to this. This thesis will report against the Ag/ AgCl pot ential
unless otherwise noted (an Ag/ AgCl reference electrode is +0.1767 V vs. SHE at
In real systems, the potential which defines oxidation and reduction can shift from
Eo, depending on the concent rations of t he active species in solution. T he Nernst
equation quantifies this shift:
E = Eo+ RTln Co (O,t) . nF CR (O, t)
(2.2)
Here R is the universal gas constant (8.314 JK- 1mol-1), T is the t emperature in
Kelvin, and F is the Faraday constant (94,487 Coulombs). Co(O, t) and CR(O, t)
are the concentrations of oxidized and reduced species at the surface of the electrode,
respect ively. Not ice that if Co (O, t) and CR (O, t) are equal, the Nernst pot ent ial will
equal the standard potential.
A straightforward example of a redox process is t he reduction-oxidation of iron
metal (Fe0) and the iron ion (Fe2+), for which the standard pot ent ial is - 0.440 V vs.
SHE [22].
(2.3)
At potentials more negat ive t han - 0.440 V vs. SHE, t he formation of the reduced
species (Fe0) is more favourable, while at potentials more positive than -0.440 V vs.
SHE, t he formation of the oxidized species (Fe2+) is more favourable.
10
If a redox reaction occurs at a high enough rate that it can be considered in
thermodynamic equilibrium as the potential is swept, it is considered a reversible
reaction. Such a system can theoretically be reduced and oxidized an infinite number
of times without adverse affect (no loss of 0 orR). Cyclic voltammograms (CV) can
be used to study redox reactions more ext ensively. T hese plots relate response current
t o the applied pot ent ial as the working electrode potential is ramped linearly between
two potentials. Changes in current indicate a surface or electrolyte reaction. Current
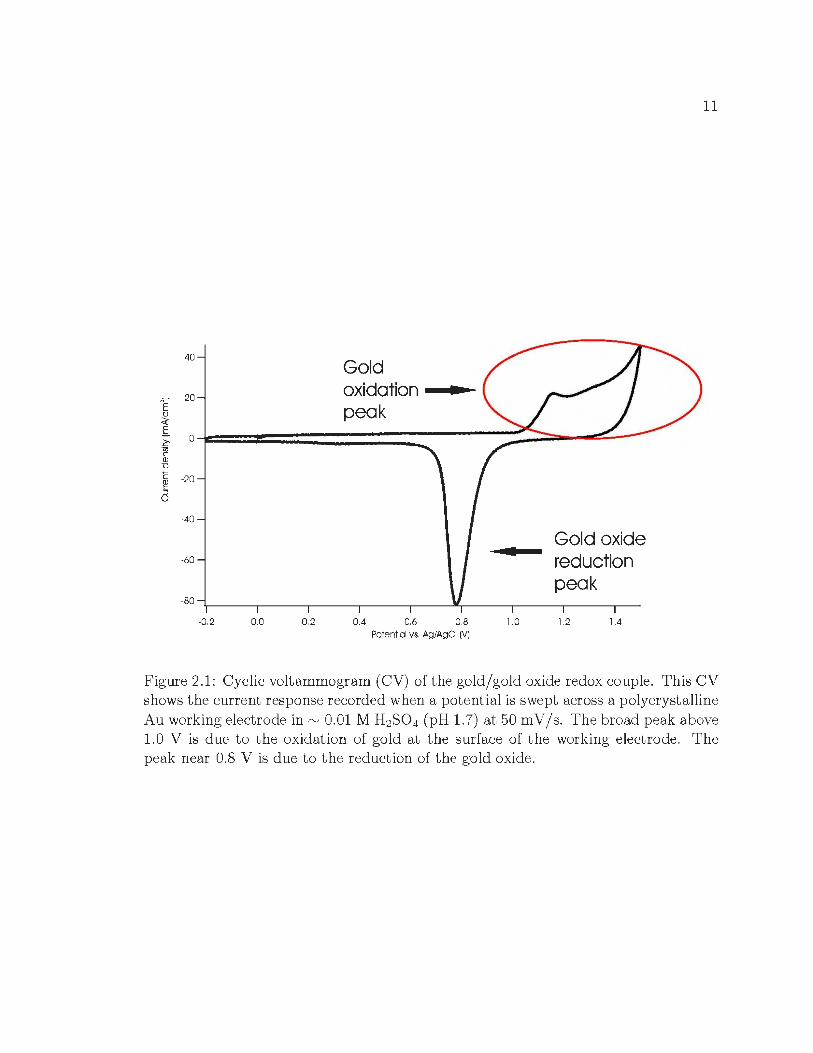
peaks can be seen in t he CV shown in Figure 2.1, wherein the positive (anod ic) current
peak is indicative of gold oxidation at the surface of t he working electrode, while the
negative (cathodic) current peak is due to the reduction of the formed oxide, Au2 0 3 ,
back t o Au. Because gold oxidizes at relatively posit ive potentials, and is inert at
more negative potentials where metal redox reactions of interest take place, it is widely
used as a working or counter electrode in electrodeposition experiments. Notice that
the oxidation peak for this system is broader than the reduction peak. This is due
t o the oxidation of gold occurring at different crystal faces of t he polycrystalline
working electrode. The high scan speed of t he cyclic voltammogram (50 m V / s) can
also broaden both reduction and oxidation current peaks.
Along wit h peak position , CVs can also be used to determine the amount of
electron t ransfer during a given process by calculating the area under a current peak
[19, 20] . In F igure 2.1 , t he area under t he gold reduction peak will equal the area
under t he gold oxidation peak because t he same number of electrons t ransfered in
11
40 Gold oxidation • 20 NE peak u
<t £
0 ?-·u;
ill "0
c (I)
'= -20
::J 0
-40
Gold oxide -60 reduction
peak -80
-0.2 0.0 0.2 0.4 0.6 0.8 1.0 1.2 1.4 Potential vs. Ag/AgCI (V)
Figure 2.1: Cyclic voltammogram (CV) of the gold/ gold oxide redox couple. This CV shows the current response recorded when a potential is swept across a polycryst alline Au working electrode in "' 0.01 M H2S0 4 (pH 1.7) at 50 mV /s. The broad peak above 1.0 V is due to the oxidation of gold at t he surface of the working electrode. The peak near 0.8 V is due to the reduction of the gold oxide.
12
the oxidation reaction will be transfered back in the reduction reaction . If multiple
processes occur at a given potential, extracting accurat e values of transferred charge
can be complicated. For example, t he evolution of hydrogen in aqueous solutions due
to water hydrolysis occurs at - 0.828 V SHE, which would interfere with accurate
charge count ing during iron metal deposit ion [22].
2.1.2 M etal Oxide Electrodeposition
In contrast to simple redox, there are other electrochemical reactions of interest
that occur during electrodeposition, and are much more complicated to quantify. For
example, metal oxide deposit ion can involve the formation of in situ intermediate
species. The electrochemical synt hesis of metal oxides can be achieved by several
different t echniques, such as electromigration of reactant species, electrolysis of fused
salts, electrogeneration of base by cathodic reduction, alternate current synthesis, or
anodic oxidation. The first t echnique, electromigration of reactant species, utilizes a
potential d ifference between a counter electrode and a host lattice (working electrode)
to int ercalate guest ions into the lattice to form metal oxides [23]. Electrolysis of fused
salts involves the anodic oxidation or cathodic reduction of metal oxide containing
low-melt ing salt s at the surface of an electrode to make single crystal metal oxides.
These single crystals can be collect ed after t he electrolyte has been washed away.
Cathodic reduction requires t he production of a basic species at the surface of an
electrode t o form in situ met al ions and metal complexes in solution or at the surface

13
of the working electrode. Therese et al. previously reviewed this t echnique and report
many of the met al oxides t hat can be synthesized and some of t heir applications
[13]. Switzer et al. have used this t echnique previously t o synthesize eerie oxide
powders [24]. Therese et al. have also reviewed alternate current t echniques, which
use galvanost atic currents stepped between two separate values to deposit multi-layer
systems. To dat e, only Switzer 's group has used t his technique successfully, using
stepped currents t o electrosynthesize composit ionally-modulat ed t hallium lead oxide
thin film superlattices [25]. The final t echnique, anodic oxidation, is t he most relevant
t o our study of electrodeposited magnetite.
During anodic oxidation synthesis, a met al or lower oxidation met al ion is oxidized
t o a higher oxidation st at e using an anodic current. T he pH of the aqueous electrolyte
used for this type of synt hesis is very important. The lower oxidation state must be
st able while the higher oxidation state will form a hydroxide. This technique is
particularly well suited to deposit ing ferrites, such as magnetite [2, 3, 18]. Abe and
Tamaura pioneered t he use of anodic oxidation to electrosynt hesize t hin film ferr ites
in the early 1980's [17], but t he exact mechanism of magnetite formation is still not
complet ely understood. To form magnetite, Fe2+ and Fe3+ are hydrolyzed to FeOH+
and FeOH2+ adsorbed on the surface of t he working electrode. Anodic current is t hen
used as an oxid izing agent to convert some of t he FeOH+ t o FeOH2+ at the surface
of t he electrode, leading to magnetite formation:

14
(2.4)
It is easy to see that this react ion is not a simple redox reaction, but rather is a
series of reactions assisted by the anodic oxidation of Fe2+ to Fe3+ . Consequently,
once magnetite has been deposited, t he Fe3+ within t he deposited t hin film cannot
be reduced back to Fe2+ merely by changing the pot ent ial. This proposed mechanism
has not been confirmed; there is no evidence of t he formation of the FeOH+ and
FeO H2+ precursors. However , this synthesis approach has been used recently to form
high quality magnetite electrodeposit s utilizing flow t hrough cells [18, 26], spray-spin
coating [17, 27] or epitaxially using single cryst al substrat es [2, 3, 28].
The choices of pot ential and temperat ure ranges for magnetite electrodeposition
explored in this thesis were guided by the theoretical t hermodynamic calculations of
the stability of magnetite and iron ions in water. The phase stability of magnetite and
other phases of iron oxide can be found in a calculat ed pH-potent ial phase stability
(Pourbaix) diagram. A simplified version of Pourbaix's diagram for iron and it s
oxides and hydroxides at 25°C can be seen in Figure 2.2. Magnetite is stable over
the pot ential range - 0.500 V to - 0.300 V vs. Ag/ AgCl, and the pH range 5.5-8.5 at
25°C. Since this Pourbaix phase plot is based only on t hermodynamic phase stability
of iron ions in water , the actual pH and potent ia l regions for magnetite stability can
be altered wit h the addition of buffering and/or complexing agents (such as potassium
acet ate) , to t he syst em.
15
2~~--------------------------~
Fe'
w Fe20 3
::I: en stability~
~ 0 " . .. . .. f 2+
.. e .. ... w • Ill ...
-1
Fe
-2 0 2 4 6 8 10 12 14 16
pH
Figure 2.2: A simplified version of Pourbaix's calculated phase stability diagram for iron ions in water at 25° C [ 29 ].
2.2 Magnetism
2. 2.1 Ferromagnetism
An important characteristic of magnetite is its ability to retain long-range mag-
netic order after being subjected to an externally-applied magnetic field; magnetite
is a ferrimagnetic material. Ferrimagnetism is closely linked with ferromagetism, the
property that allows static objects to produce spontaneous intrinsic magnetic fields
[30] . This means that ferromagnet s remain magnetized once magnetized by an exter-
nal magnetic field, suggesting an intrinsic ordering of magnetic moments. This long
range ordering is due to both t he short-range exchange interaction and t he long-range
magnetic dipolar interaction between spins within a material. The exchange inter-

16
action can be treated as a magnetic field and is called the exchange field , Bg The
exchange coupling in ferromagnetic materials may be as high as 103 T and falls off ex
ponent ially with distance, while the dipolar coupling strength is t ypically a thousand
times less t han this but falls off with the inverse cube of distance [8, 30].
A domain consists of a localized area of a material wherein the spins of unpaired
electrons are all a ligned with their neighbours. The existence of domains is strongly
related t o t he relative strengths and ranges of t he exchange and dipolar interactions.
It is costly in dipolar energy for a material t o be uniformly magnetized. To reduce
dipolar energy, it is favourable for a ferromagnetic material to form domains with
different spin orientations. While this will increase the exchange energy at the domain
boundaries (domain walls), this is only applicable over a very short length scale near
the boundaries. The dipolar energy, on the other hand , will decrease across the
whole mat erial , thereby reducing the tot a l energy of t he system. A two-dimensional
representation of domains in a ferromagnetic material can be seen in Figure 2.3 [31].
When an external magnetic field is applied to a ferromagnetic material, it becomes
energetically favourable for more of the unpaired electron spins to align with the
applied field, as shown in Figure 2.4. As a result, the domains t hat are aligned
with the ext ernal field will reduce the overall energy of t he system. An alignment
transition occurs at the domain walls; domains that are t he most closely aligned with
the applied field will expand as t he spins from the edges of neighbouring domains align.
The result is domain wall motion as aligned domains grow and un-aligned domains

17
Figure 2.3: A schematic representation of domains in a ferromagnet ic material. The arrows show the magnetization direction in each different domain. Modified from Blundell [30].
shrink. Domain wall motion in ferromagnets typically occurs in small discont inuous
st eps (Barkhousen effect) due to domain wall pinning by strains, surfaces, and crystal
impurities [30].
The net magnetization of a ferromagnetic material is dependent upon t he strength
of t he applied magnetic field: the magnetization will increase in an increasing mag-
netic field unt il a limit ing magnetization is reached. At this limiting magnetization
(saturation), all spins are aligned with the applied field.
Ferromagnetic behaviour is seen only at temperatures below the material's fer-
romagnetic ordering temperature (Curie), Tc. Above this temperature, thermal ex-
citat ions within the material are great enough to disrupt the long-range alignment
of t he spins. Consequent ly, a ferromagnetic material will behave as a paramagnetic
material at t emperatures above T c [30, 31]. The maximum saturation magnetization
of a ferromagnet decreases as t emperature increases approaching Tc . This t emper-

18
Increasing Applied Field
-------------------------------------------~
H
Figure 2.4: This diagram shows t he same domains seen in Figure 2.3 under t he influence of an externally applied magnetic field, H. Notice t he unidirectional orientation.
ature dependence follows the Curie-Weiss law, Eqn 2.5, which relates t he magnetic
susceptibility (Xm), t he ability to be magnetized by an applied field, of a material to
t emperature.
c M = XmH = Tc - TH . (2.5)
Here C is t he curie const ant, M is the sample magnetization, H is t he applied mag-
netic field.
While saturation magnet ization is an intrinsic property of a ferromagnetic rna-
t erial, other magnetic characteristics such as coercivity and remanent magnetization
can be strongly affect ed by defect s wit hin t he materia l. Once an applied magnetic
field is removed, a ferromagnetic material st ill retains a "memory" of its fully mag-
net ized state. However, t his remaining (remanent) magnet ization will often be lower
than t he saturation magnetizat ion. Thermal energy can randomize some spins, nu-
M
saturation magnetization (Ms)
19
Figure 2.5: A schematic representation of a hysteresis loop in which remanent magnetization, saturat ion magnetization, and coercivity are labeled. Notice t hat increased remanence increases the squareness of t he loop.
cleating new domains causing domain wall motion. Since movement of domain walls
will not always be a smooth process due to t he Barkhousen effect, t here will be some
remanent magnet ization even wit h zero applied field. Coercivity is t he amount of
reverse applied field required to bring the net magnetization back to zero [30, 32].
The analysis of ferromagnetic materials often involves t he study of hysteresis loops,
which are plot s of a material's magnetic response in a sweeping applied fie ld , as shown
in F igure 2.5. Saturation magnetization (Ms), remanent magnetization (MR), and
coercivity (He) are indicated on t his plot. The analysis of hysteresis loops is an
important tool in determining the domain structure of a material. F igure 2.6 shows
schematically t he link between loop shape and domain behaviour type. When dealing
wit h polycrystalline materials, t here can exist t hree kinds of domain structures. Crys-

······· Pseudo-single M --Single Domain - Multi-domainr---
1 I I I I I I I I I
20
H
Figure 2.6: Schematic diagram of the typical hyst eresis response exhibited by single domain, multi-domain, and pseudo-single domain cryst allites.
tallites that contain only one domain (single-domain crystallites) are typically seen
when t he grain size is too small to accommodate domain walls [33] . In magnetite,
this type of domain structure is often seen with a grain size of 80 nm and below.
Single-domain crystallites d isplay high squareness and high coercivity because t heir
larger domain size require higher applied fields to magnetize and demagnetize. Since
there is only one domain per crystallite in these types of cryst allites, domain wall
motion does not occur. The magnetization will remain in its original direction unt il
the strength of the applied field is large enough to flip t he domain orientation. In a
hysteresis loop this would look like a rectangle, as shown in F igure 2.6
Multi-domain crystallites are typically seen in mat erials with larger grain sizes,
typically > 20 J-tm in magnetite. Multi-domain crystallites show lower coercivities
21
because the magnetization of these materials ut ilizes domain wall motion to align
domains. Compared to a single domain crystallite, it is energetically easier for the
domain walls to shift than it is for a whole domain t o flip. Consequently, it requires
less energy to demagnetize material composed of multi-domain crystallites. Result
ingly, thermal excitation can disrupt domain order more easily, which leads to lower
remanent magnetization and squareness in multi-domain materials.
The third domain structure, pseudo-single domain , shows a mixture of single
domain and multi-domain magnetic responses, and occurs in multi-domain crystallites
near the lower size limit (0. 1 - 20 J-lm in magnetite) [34]. In such materials, mult iple
domains act in unison to simulate t he remanence characteristics of single-domain
crystallites , but display t he low coercivity of multi-domain crystallites. This is due
t o the fact that it is still energetically favourable to have domain walls to lower the
dipolar energy, but since the crystallites are smaller t han multi-domain crystallites ,
the reduction of dipolar energy does not outweigh t he exchange coupling.
While it is possible to infer magnetic domain structure from hysteresis behaviour,
domains can also be observed directly. The traditional method to observe domains
is the Bitter method, which involves observing ferromagnetic colloids t hat gather at
domain walls with optical microscopy or with the unaided eye [35]. More modern
experimental techniques for direct domain observation include synchrotron-radiation
X-ray topography [36], Kerr effect microscopy [37], and scanning magnetic force mi
croscopy (MFM) [38, 39]. MFM and Kerr effect microscopy applied to magnetite will

22
be addressed in Chapter 2 and Chapter 6, respectively.
2. 2. 2 Ferrimagnetism
To explore t he difference between ferromagnetic and ferrimagnetic mater ials , the
geometric arrangements of atoms with unpaired electron spin must be considered.
Magnetite is a ferrite with an inverse spinel structure containing both Fe3+ and Fe2+
ions, with spin states of S = ~ and S = 2, respectively. If it is assumed t hat all
the ions in the formula unit of magnet ite contribut ed t o the magnetite moment (two
Fe3+ ions and one Fe2+ ion), then t he total spin magnetic moment would be 14
Bohr magnetons1 . (J-l B) per formula unit. Magnetometer studies have shown that
t he actual spin magnetic moment per formula unit for magnetite to be 4.07 J-lB [41],
which corresponds to the cont ribut ion by only the Fe2+ ions [8, 40, 42]. It t urns out
that there is a structural reason for only observing the Fe2+ contribut ion, and it is
directly related to magnetite's designation as a ferr imagnetic material.
Ferrimagnet ism stems from t he uneven magnit udes of antiparallel aligned mag-
net ic moments between t he sublattices of a crystal structure. In magnet it e, as men-
tioned in Chapter 1, there are 24 iron ions per primitive unit cell with eight Fe3+ ions
in the t etrahedral sit es and eight in t he octahedral sites . These two sets of Fe3+ ions
have magnetic moment s t hat are aligned ant iparallel, which result s in a net zero con-
1T he Bohr magneton is a const ant that almost equals t he spin magnet ic moment of an unpaired electron [8]. While intuit ively it seems that the number of Bohr magnetons should be integral, this is often not the case. Non-integral spin magnet ic moment values can be due to other influences such as spin-orbit interact ion contributing a magnetic moment, as in the case of magnetite, or conduction electron magnetization from t he paramagnetic nucleus of an atom [8 , 40]

octahedral sites
tetrahedral sites
S=5/2
Fe3+ S=5/2
23
ttHHtt
Figure 2. 7: Spin cancellation associated with the Fe3+ ions in t he octahedral and t etrahedral sites. The result is a ferr imagnetic material in which t he net magnetic response can be attributed solely to t he spin of the Fe2+ ions in the octahedral sites. Adapted from Kittel [8]
tribution to t he magnetization of magnetite. The remaining eight Fe2+ ions occupy
half of the 16 octahedral sites, and only t heir magnetic moments contribute t o the
net ferrimagnetic response [8]. This can be seen schematically in Fig 2. 7. Ferrimag-
nets behave like ferromagnets in hysteresis response, but they have a lower saturation
magnetization t han would be expect ed from a pure ferromagnet.
Like ferromagnet s, ferrimagnet s exhibit long range magnetic order only at temper-
atures below a critical ordering (Curie) temperature. For magnetite, the Curie tern-
perature is well above room temperature (858 K) [33]. As temperature is decreased
below Tc, the saturation magnetization will increase following the Curie-Weiss law.
This results in a saturation magnetization of 46 emu/ g at 773 K [43], 92 emu/ g at
room temperature [8], and 90 emu/g at 15 K [44] . The anomalous decrease in the

24
saturation magnetization of magnetite in the low-temperature regime ( < 120 K) is
due t o a structural transition which will be discussed in more detail in Chapter 4.
2.2.3 Antiferromagnetism
Antiferromagnetism is related t o ferrimagnetism in that it requires two ant i
parallel-aligned sublattices in a material. Antiferromagnetism occurs when the mag
netic contributions from each sublatt ice is exactly equal, and consequently t here is
no net magnetization. This ordering occurs below a crit ical (Neel) temperature. As
with ferromagnetic and ferrimagnetic materials, an external field is required to align
the magnetic moments of t he unpaired spins. T he antiparrallel alignment of such
a material will be along the direction of t he externally applied field, similar t o the
alignment of ferromagnet s and ferrimagnet s.
Antiferromagnet s are of special interest in this thesis because t he electrode position
studies herein show condit ions for synthesizing, along with magnetite, other iron
oxides and iron hydroxides. At least two of t hese materials, hematit e ( a -Fe2 0 3) and
goethite (a-FeOO H), are antiferromagnetic and can be used wit h magnet ite to elicit
exchange anisotropy behaviour.
2. 2.4 Exchange Anisotropy
Exchange anisotropy, a lso called exchange bias, was first discovered in 1957 by
Meiklejohn and Bean while studying t he magnetic properties of cobalt cooled to

25
H
Antiferromagnetic Ferromagnetic
Figure 2.8: Schematic diagram of a system containing both ferromagnetic and antiferromagnetic materials under an applied magnetic field , H, and cooled/ grown below the Neel temperature. Notice t hat t he axis of magnetization is the same for both materials.
77 K in the presence of a strong magnetic field [45] . They noticed a unidirectional
displacement of their hysteresis loops along t he applied field axis. Upon further study,
they found that this displacement was linked to the amount of cobalt oxide (CoO)
formed on the surface of a compact of fine cobalt particles. They surmised that this
effect was due to t he ferromagnetic/antiferromagnetic interaction between the Co and
CoO layers. Further study by Jacobs and Bean, and later by Neel, confirmed this
interaction [46, 47]. They recognized that t his interaction can be used to increase
the coercive force of a material, similar to the way strain, crystalline anisotropy, and
shape anisotropy had been used in the past .
Exchange bias requires an interface between antiferromagnetic and ferromagnetic

26
materials. In the simplest case, t his interface is between two well-defined (often t hin)
layers of the two different materia ls. The application of a magnetic field will align
the spins of t he ferromagnet along the d irection of t he magnetic field , as is usual
for a ferromagnet at temperatures below Tc. As t he system is cooled or grown
at temperatures below the Neel temperature of the antiferromagnet, the magnetic
moments of the unpaired spins will align in the ant iparallel order [48]. The spin
alignment in t he resultant layered system will be comparable to the schematic diagram
in Figure 2.8. When the magnetic field is removed, ordering will remain in the
direction of t he applied field. Both t he layers will still be aligned t ogether , but
it is important to note t hat t he antiferromagnetic layer will contribute nothing to
the saturation magnetization of t his system. The result is a magnetization in one
direction, as with a normal ferromagnet . If a magnetic field is now applied in the
opposit e direction of the original applied field, t here will be a coercive anisotropy.
Physically, this means the material will be easier t o magnetize in one direction t han
in the other [49] .
If t his system is t hen subjected to a hysteresis study, a shifted loop will be found,
as shown schematically in Figure 2.9. This exchange bias, named for t he non-zero
centering of the associated hysteresis loops, is due t o the alignment of the ant ifer
romagnetic magnetic moment pairs . The alignment of t hese pairs will "pin" the
ferromagnetic layer in t he d irection of t he or iginal applied magnetic field [45, 46] .
The exchange bias of a system is characterized by t hree coercive fields: Hc1, Hc2,

. I I I
:
M
H.
27
H
Figure 2. 9: Schematic diagram of a schematic hysteresis loop displaying exchange bias. Notice the shift of the loop along t he horizontal applied field (H) axis. The exchange field , HE' is t he average of coercivities Hcl and Hc2.
and HE- The first two fields are the left and right coercive fields, and are defined by
the applied field intercepts of a hysteresis loop. Hc1 is of specific interest because it
defines the magnitude of the applied field needed t o flip the magnetization direction.
HE is the exchange bias field, which is t he magnitude of t he loop shift along the
applied field axis [46].
In order to ta ilor magnetic response in exchange biased systems, t here is much
ongoing research in this field . Some of the current topics of interest include dynamic
magnetic anisotropy at the onset of exchange bias [50], Mont e Carlo simulations of
iron-containing bilayers [51], non-applied field cooling induced exchange bias [52],
exchange bias in dot arrays [53], and ferromagnetic/ antiferromagnetic mult ilayers
[54]. T he materials used in these studies include [Ptj Co]-IrMn mult ilayers [55], Fe-

28
FeF2 dot arrays [53], Fe/MnF2 films [56], Pt/ Co multilayers [52], FeF2 / Fe bilayers
[51], and NiFe/Ir Mn layers [50].
Exchange anisotropy in magnetite-containing systems has not been extensively
studied. Gatel et al. have studied the exchange anisotropy of Fe30 4/Ni0 bilayers
grown epitaxially on single crysta l MgO (OOl ) and Ah03 (0001) in UHV condit ions
[57] . Del Bianco et al. have studied t he exchange bias of iron nanoparticles embedded
in a matrix of magnetite and maghemite [58]. Magnetite/ cobalt oxide superlattices
have been studied by ljiri et al. [59] . The exchange bias caused by the oxidation of
nanoparticles iron during annealing in an iron/ nickel compact has also been studied
recent ly [ 60 ].

29
Chapter 3
Experimental Methods
3.1 Synthesis
The electrodeposit ion of t hin film magnetite involves a simple procedure using
an electrolyte and a potentiostatjfunct ion generator /computer setup. T he procedure
uses some basic principles from electrochemistry along wit h some practical consider
ations.
3.1.1 Apparatus
The first consideration was t he electrochemical cell, which was modified exten
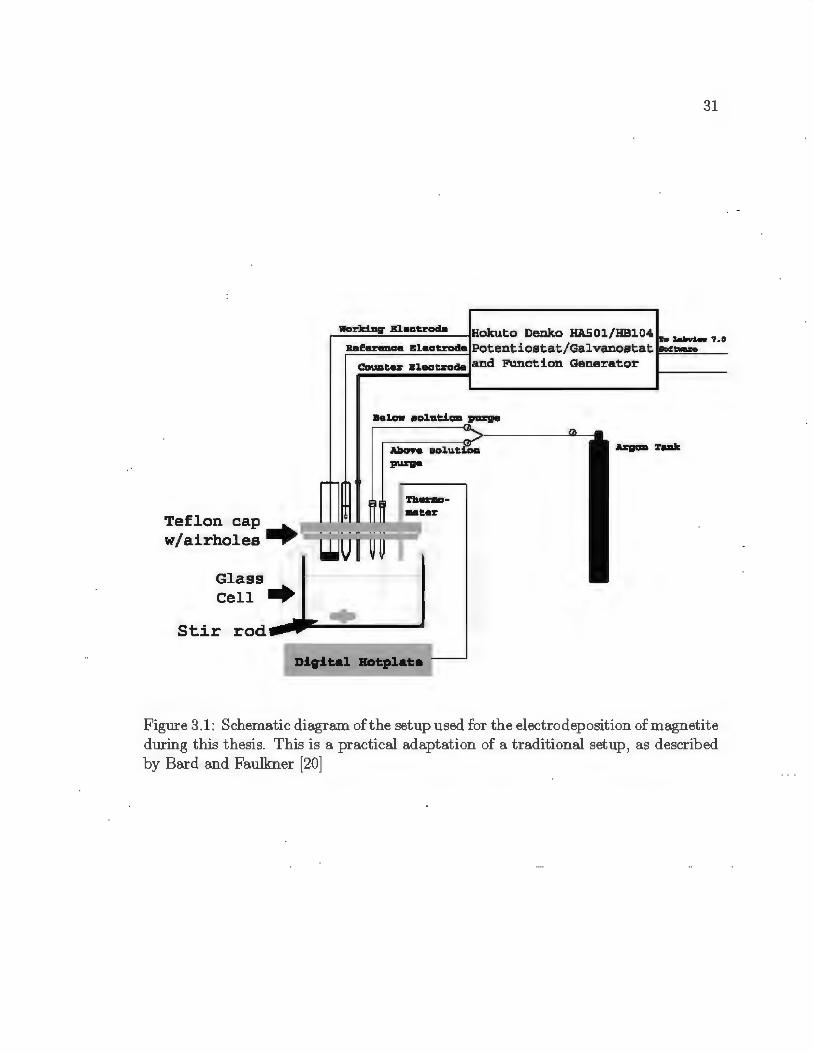
sively throughout t he first few mont hs of use. This cell can be seen in F igure 3.1,
and consists of a glass bottom and a Teflon top with seven holes to accommodate
an Ag/ AgCl reference electrode, working electrode, counter (auxiliary) electrode, t wo

30
argon purge t ubes, a K-type thermocouple, and an external t emperat ure probe. Com
parable t o ground in electronics , t he reference electrode is used to measure t he po
t ential of the working electrode (WE) . T he reference electrode (RE) is a special type
of electrode which maintains a constant pot entia l under the small current t hat is
needed to make electrochemical measurements. The working electrode (substrate) is
the electrode at which the reaction of int erest occurs, while a complimentary chemical
reaction occurs at the counter (auxiliary) electrode ( CE). A gold wire 2.1 mm t hick
was used as the counter electrode. Temperature control was maintained within ± 5°C
wit h a F isher Scientific Isot emp digital hotplate/stirrer with external temperature
probe.
A galvanost at j pot entiost at (Hokuto Denko HA 501, HA104) controlled t he po
t ential and current of the electrochemical cell in either of two modes. In pot entia
st at ic mode, the pot entia l between the reference electrode and t he working electrode
was controlled by regulating t he current flow between t he working electrode and t he
count er electrode. In galvanost atic mode, the current bet ween t he working electrode
and the count er electrode was cont rolled by governing t he potent ial between t he
working electrode and the reference electrode.
The analog current and potential data were digitized using a National Instruments
BNC 2090 input connected t o a National Inst ruments NI 6502E analog/ digital con
verter board in a desktop P C. The data were recorded with a virt ual instrument (VI)
written in t he National Instruments Labview 7.0 language by Bizzotto et al. [61] and
Glass Cell ..
Digital HOtplat e
31
Figure 3.1: Schematic diagram of the setup used for the electrodeposition of magnetite during this thesis. This is a practical adaptation of a traditional setup, as described by Bard and Faulkner [20]
32
modified by t he Poduska research group.
3.1.2 Procedure
Either polycrystalline brass or polycrystalline gold were used as the working elec
trode for the experiments reported here. The polycrystalline brass was common
shimstock acquired from in-house supply storage. Due t o the cold-rolling manufac
turing technique, it had unidirectional striations. The polycrystalline gold (1250 A,
Erie Scientific) was vapour deposited on chromium (400 A), which had been vapour
deposited on glass slides. The flatness was < 40 p,m deviation across the diagonal of
a standard sized slide (25. 10 ± 0.38 mm x 75.36 ± 0.38 mm).
Pretreatment was necessary to remove any contaminants present on the surface
of the substrates . The brass shimstock was sanded, cut into disks, and dipped in
concentrated ( 40%) HCl immediately before use, while t he glass slides were cut into
squares (7 mm x 7 mm) and kept in concentrat ed (96%) H2S0 4 .
Magnetite deposition was based on a procedure reported by Nishimura et al. [18]
and later refined by Sorensen et al. [2]. The reaction is based upon the oxidation of
Fe2+ ions at t he surface of t he working electrode, which occurs at - 0.630 V vs SHE
in solutions at pH 6.5 and near 80°C:
(3.1)
When synthesized galvanostatically, magnetite was formed using a constant current

33
of either 50,uA · cm- 2 or 88 ,uA · cm- 2 . Potentiostatic experiments were performed
over a range of potentials from -0.200 V to -0.550 V.
A variety of electrolytes were utilized when forming thin films. Three different
concentrations (0.04 M, 1.0 M, and 2.0 M) of potassium acetate (KCH3 COOH) were
used in conjunction with iron salt (0.01 M Fe(S04) 2 (NH4)2 · 6H20 ). The pH values
of these electrolytes were 6.0, 8.25, and 8.5 respectively. Electrolytes were prepared
using ACS quality reagent salts purchased from EM Scientific, as well as nanopure
water from a Barnstead Nanopure filter system (18.2 MO · em).
The procedure for deposit ion was as follows. The working electrode, counter
electrode, reference electrode, stirrer , and argon purge were all inserted into the elec
trolyte before heating. The counter electrode was kept in concentrated sulphuric acid
beforehand in order to reduce t he chance of contamination, and was rinsed before use.
The cell was then heated to the desired temperature (70°C t o 95°C) before any depo
sit ion was started. While heating t he electrolyte, a cyclic voltammogram ( CV) was
recorded ( -0.500 V to 0.100 V at 50 m V / s) to confirm t he integrity of the electrical
connection in the cell, and also to check for electrolyte or substrate contamination.
The iron salt was added to the solut ion after t he target temperature was reached
in order to reduce the formation of iron oxides and iron hydroxides prior t o deposit ion.
Monitoring was necessary during deposit ion because bubbles formed on the working
electrode at high temperatures. Bubbles were removed using a jet of in situ electrolyte
from a pipette. Deposit ion t imes of 10 to 90 minutes led to deposits on the order of
34
100 nm to 1000 nm in thickness. These t hickness values were obtained by assuming
the isotropy of crystallite d imensions and from weighing data. Due t o the inherent
uncertainty in these measurements, it is more helpful to use these measurements to
confirm the order of magnitude of film thickness. After deposition, the sample was
removed from the solution, rinsed wit h N anopure wat er immediat ely, then dried wit h
argon gas in order t o reduce the format ion of ex situ iron oxides and iron hydroxides.
3. 2 Analysis Techniques
Various analysis t echniques were performed on t he electrodeposited t hin fi lms in
order t o extract information on phase ident ity, cryst allite habit, cryst allite size, lattice
const ants, deposit morphology, and magnetic hyst eresis response.
3.2.1 X-Ray Diffraction
One of the main analyt ical techniques used in crystallographic characterization
is X-Ray Diffraction (XRD), which can enable phase ident ificat ion, lattice const ant
determinat ion, and part icle size estimations. The principles of XRD analysis can
be explained using the Von Laue formulation of scatt ering [8, 62]. The Von Laue
formulation assumes a crystal t o be composed of many microscopic objects (atoms),
placed on the sites R of a Bravais lattice. Each of t hese atoms reradiates in all
directions t he radiation incident upon t hem. From t his system, sharp peaks will only

35
k k
k'
k'
d cose'=-d•n'
Figure 3 .2: Schematic illustration of the Von Laue reradiator formulation. Adapt ed from Ashcroft and Mermin [62].
be seen at angles and wavelengths where constructive interference between scattered
waves of neighbouring atoms occurs.
To satisfy the conditions for constructive interference, consider an X-ray of wavevec-
t or k = 21rfi / A incident upon two scatterers separated by a vect or d. Here, ii is t he
direction and A the wavelength of the incident radiat ion. This geometry can be seen
in Figure 3.2. The wavevector scattered from t hese part icles can be described by
the complimentary wavevector k' = 27fn 1 / A. The path difference between the two
wavevect ors is d · (ii - ii') . Constructive interference will occur when t he path differ-
ence is an integra l number of wavelengths:
d · (k - k') = 27fm, (3.2)

36
where m in an integer. When applied to the complete Bravais lattice, t his relation
can be expressed as:
R · (k - k') = 21rm (3.3)
Or equivalently:
ei(k' - k) R = 1 (3.4)
When this relation is compared with t he characterization of t he reciprocal lattice,
the Laue formulation can be defined. The reciprocal lattice is defined by t he set of
wavevect ors, K , satisfying the relation eiKR = 1. From this, the Laue condition states
that construct ive interference will occur provided that the change in wave vect or,
K = k ' - k, is a vector of the reciprocal latt ice [62]. Consequently, any incident
X-ray wavevector that satisfies t his condition will satisfy the required constructive
int erference condition.
To do a complete analysis of a crystal structure, it is necessary to consider incident
light over a range of wavevectors k. This can easily be visualized using the geometric
Ewald construction as shown in Figure 3.3. An incident wavevector k drawn in k
space with its origin on an atom, and a sphere (3D) or circle (2D) is drawn with its
center at t he tip of k. There will be incident directions of k for which there exists a
k' that satisfies the Laue condition. For t he polycryst alline deposits studied in this
thesis, grains of many different orientations are present. This ensures an isotropic

37
•
. 6. . . . K yL· ..
. . X
Figure 3.3: Two-dimensional representation of the Ewald construct sphere. T he two vectors1 k and k' 1 satisfy the Laue condition and would lead to constructive interference. Adapted from Ashcroft and Mermin [62].
distribution of K over the Ewald construction sphere. By moving the X-ray source
relative to the plane of the sample1 all k' can be analyzed.
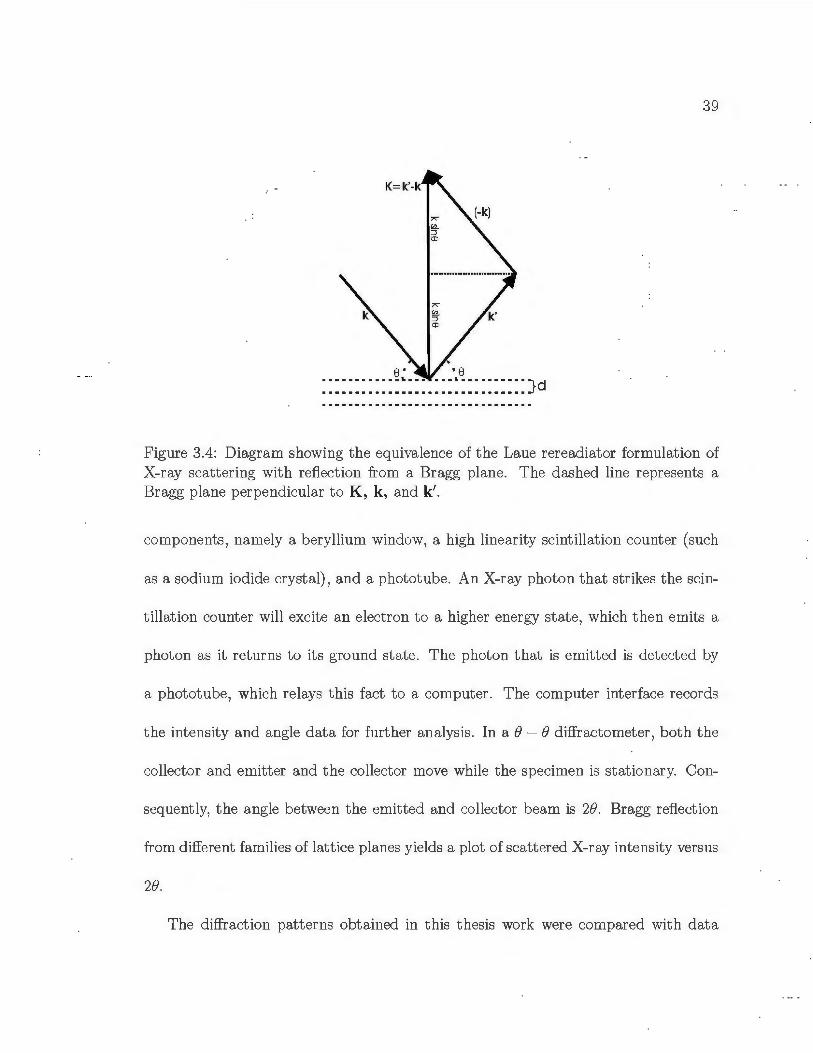
The equivalence of the Von Laue formulation with the Bragg formulation can
be explained using Figure 3.4. The Bragg formulation relates the constructive in-
terference of incident and scattered radiation to the the path difference of two rays
reflecting from parallel atomic planes in a crystalline materials spaced a distance d
apart. The incident and scattered rays1 k and k' 1 make the same angle () wit h a plane
perpendicular to K 1 which allows the scattering to be viewed as Bragg reflection.
By definition1 K is an integral multiple of the reciprocal lattice vector K 0 , There-
fore the magnitude of K can be written:

21m K = nKo= d .
Figure 3.4 also shows that K = 2k sin e. When substituted into Eqn 3.5 ,
nn ksine = d .
38
(3.5)
(3.6)
Since k = 2n /A, we can see t hat Eqn 3.6 can be transformed into t he Bragg reflection
condition:
n>. = 2dsine. (3.7)
To find the scattering angle due to a specific family of lattice planes, t he unit cell
dimensions are required . For cubic crystal structures, the spacing d depends on the
cubic lattice constant a:
(3.8)
XRD data for this t hesis was collected on a Rigaku D / MAX 2200PC e - () Pow-
der Diffractometer . In its simplest form, an X-ray diffractometer is composed of
three components: an X-ray source , a specimen, and a collector, as shown schemat-
ically in Figure 3.5 . The X-ray source emits Cu-Ka (18 kV, 40 rnA max) radiation
at 1.5418 A wit h a graphite monochromator . These X-ray photons reflect off of a
specimen and are collect ed by a detector . The detector is typically a collection of
39
e· ·e ............ ~... . ..•.......... }d ····-·····-------------········
Figure 3.4: Diagram showing the equivalence of the Laue rereadiator formulation of X-ray scattering with reflection from a Bragg plane. The dashed line represent s a Bragg plane perpendicular to K, k, and k'.
components, namely a beryllium window, a high linearity scintillation counter (such
as a sodium iodide crystal), and a phototube. An X-ray photon that strikes the scin-
tillation counter will excite an electron to a higher energy state, which then emits a
photon as it returns to its ground state. The photon that is emitt ed is detected by
a phototube, which relays t his fact t o a computer . The computer interface records
the intensity and angle data for further analysis . In a B - B diffractometer , both the
collector and emitter and the collector move while the specimen is st ationary. Con-
sequently, t he angle between t he emitted and collector beam is 2B. Bragg reflection
from different families of lattice planes yields a plot of scattered X-ray intensity versus
2B.
The diffraction patterns obtained in this t hesis work were compared wit h data

40
F igure 3.5: Diagram showing a typical X-ray d iffractomet er.
from the J oint Committee for Powder Diffraction St ud ies (J CPDS) , a d atabase of
experimentally det ermined X-ray d iffraction pat terns of over 160, 000 cryst alline rna-
t erials [63] . To confirm the presence of magnetite, or other phases of iron-containing
compounds, the intensit y and peak positions of experimentally collected data were
compared against possible mat ches from the JCPDS database, such as t he one for
magnetite shown in Table 3.1. T he peak positions and intensit ies are used to confirm
t he material ident ity, and possible preferred orientation. For example, a magnetite
film that is made up of cryst a llites of predominantly (220) orientation should have a
(220) peak intensity greater than t he 26% that is seen in a randomly oriented sample
[63] . P referred orientation in a sample could be due to epitaxial growth , or other
influences in deposit formation or preparation.
41
Table 3.1: Standard XRD diffract ion pattern of magnetite, JCPDS # 19 - 0629. Intensity is given as a percentage of t he largest peak (311) [63].
2() Intensity (%) (hkl) 2() Intensity (hkl) 18.269 4 (1 1 1) 86.702 9 (6 4 2) 30.095 26 (2 2 0) 89.617 28 (7 3 1) 35.422 100 (3 1 1) 94.425 14 (8 0 0) 37.052 8 (2 2 2) 102.224 5 (6 6 0) 43.052 24 (4 0 0) 105.218 16 (7 5 1) 53.391 15 (4 2 2) 106.205 11 (6 6 2) 56.942 47 (5 1 1) 110.269 11 (8 4 0) 62.515 68 (4 4 0) 118.736 6 (6 6 4) 65.743 4 (5 3 1) 122.118 17 (9 3 1) 70.924 8 (6 2 0) 128.032 24 (8 4 4) 73.948 20 (5 3 3) 138.651 12 (10 2 0) 74.960 8 (6 2 2) 143.235 19 (9 5 1) 78.929 4 (4 4 4) 144.848 13 (10 2 2)
Lattice Constant Refinem ent
One of t he critical tasks faced during t his t hesis work was the proper phase identifi-
cation of deposited films. Because of t he structural similarities between two iron oxide
phases, maghemit e (ry- Fe20 3) and magnet ite (Fe3 0 4), qualitative inspection of the
peak posit ions and intensit ies cannot distinguish definitively between the two phases.
While t he spacegroups of these two structures (P4132 for maghemite and F&m for
magnetit e) are not overly similar, both materials have a cubic crystal structure with
similar lattice constants (8.3515 A and 8.3967 A , respect ively). T his similar unit
cell size leads to similar peak posit ions. For instance, the (311) peak of a cubic
material with a lattice constant of 8.3967 A (magnetite) is located at 35.422° 2B,
whereas t he same peak for a cubic material with a = 8.3515 A (maghemite) is lo-

42
cated at 35.630° 28. This difference is difficult t o discern accurately by eye, so a
quantitative least-square refinement of lattice constants based on peak posit ions is
more informative.
Lattice parameter-refinement was performed using two freely-available programs.
A Windows based program, Powder4 [64], was used in conjunction with the XRD data
files t o reduce noise using Savitsky-Golay smoothing, remove the background due to
the plasticine used for mounting, and ident ify peak positions. The peak positions and
intensities had t o be verified manually since the automated routines are not perfect .
Secondly, the DOS based program, Prozski [65], was used as a front-end and
organizer for various other cryst allographic programs for lattice refinement . LATCON
[66], a sub-program of Prozski, calculates the lattice paramet ers from user supplied
peak positions using a simple non-iterative linear least squares fit of t he data designed
by D. Schwarzenbach et al. [67, 68]. Since the program suggests typically 5 - 10
possible unit cells t hat fits one or all input peaks this program requires a great amount
of user inter action.
Peak Broadening
Ot her useful information obtained from XRD data comes from measuring peak
broadening. From the Scherrer formula, Eqn 3.9, it is easy to calculate the average
cryst al size.

0.9>.. t = --
B cos eB
43
(3.9)
Here, t is the average crystallite size, ).. is the wavelength of the incident X-rays, B
is the width of the peak at half maximum intensity in 2(:), and eB is the 2(:) value
for the peak in question. This technique was derived by Scherrer in 1918 to explain
the broadening of peaks of crystallites rv 100 A in diamet er [69] . However, t here
are other contributing factors that influence the width of a diffraction peak . These
include imprecise specimen displacement, non-flat or rough specimens, non parallel
X-ray beam, or sample transparency.
3.2.2 Scanning Electron Microscopy
One of t he two t echniques that were used t o analyze t he morphology of deposited
samples was scanning electron microscopy (SEM) . SEM is a common imaging t ool
that employs the reflection of a beam of focused electrons off the surface of a sample
[70] . A thermionic or field-emission cathode is typically used as the electron source for
such a microscope. The beam of electrons are accelerated by a potential difference
between the cathode and t he sample/anode. The beam diamet er is in the 10 nm
range, which limits t he magnification power of scanning electron microscopes.
A Hitachi 8570 scanning electron microscope was used exclusively to produce
micrographs for this thesis. The image is displayed on a video display in a raster
scan that is synchronous with a scan across a sample, and captured photographically,

Roll ing Direction
Scratch
44
Figure 3.6: Scanning electron micrograph of the brass shimstock used as a subst rate for the deposition of magnetite. The rolling direction is indicated in this image.
as shown in Figure 3.6. These images, while reminiscent of an aerial photo, do
not necessarily provide an accurate topographical representation . The gradient of
the grayscale is based on two main charact eristics: atomic number and conduction .
Materials that conduct bet ter or have higher atomic numbers appear lighter, while
less conducting or lower atomic number materials appear darker. Even t hough the
conductivity of the films play an important role, atomic mass plays a greater role.
The SEM micrographs were analyzed for crystallite homogeneity, crystallite size and
habit. Magnification of lOOO x to 30000x, corresp onding to scans of 2 J..Lm t o 50J..Lm
respectively, were typically used for these analyses .

45
3.2.3 Energy Dispersive X-Ray Analysis
In conjunction with SEM, energy-dispersive X-ray (EDX) analysis was used to
determine t he elemental composition of electrodeposits. In particular, this technique
was used to confirm the presence of iron in electrodeposited samples and to confirm the
absence of contaminant elements. EDX systems are commonly incorporated into SEM
instruments [70, 71]. An electron beam, the beam utilized by the SEM, is focused on
a sample, and facilitates t he release of an X-ray photon from a sample. The energy of
the X-ray ejected is dependent upon the type of atoms in the sample. In a typical EDX
spectrometer , t his photon will then pass t hough a beryllium window onto a lithium
drifted silicon detector. This silicon detector is a p-i -n (p-type, intrinsic, n-type)
semiconductor, reverse biased , and must be cooled with liquid nit rogen. The electron
beam focused on the sample causes t he ejection of an electron, and t he creation of
an electron-hole pair in the sample. The vacancy left by the ejected electron will be
filled by an electron from a higher shell. To balance t he energy loss of this electron,
an X-ray will be emitted. The detector can determine t he energy of the X-ray and the
quanta of X-rays emitted from a sample. The data is t hen recorded and displayed by
a computer system, and are compared against known X-ray energies for all elements.
Data acquisit ion is very fast, usually requiring less than two minutes to collect enough
data to clearly dist inguish constituent elements. A Tracor Northern EDX was used
in t his thesis work, and an example of an EDX spectrum can be seen in Figure 3.7.
With this particular system , it was not possible to identify atoms with atomic weights

l(o;-6.40 I< V
II
. --~
0 1(~ -7 .0 ~~ l(eV I ~ ~6 ll It,_ r-w ~ ml~~,~ I. II II II II ln1
0 2 3 4 5 6 7 8 9 10
Energy (KeY)
46
Figure 3.7: A representative energy dispersive X-ray (EDX) energy spectrum. Peaks from copper and zinc peaks in this spectra are due to the brass substrate, while gold peaks are due to the evaporated gold used to increase the conductivity of the films for SEM imaging. The iron peaks are due to the deposited magnetite. Oxygen is not seen here because its atomic number is too low to be detected by our syst em .
below t hat of sodium.
There are two main limitations of EDX that are of concern in the synthesis of iron
oxides. The first is that it can not distinguish the ionic st at e of atoms, therefore can
not distinguish between iron oxide phases. 1 Secondly, the data peaks are n ot weight-
normalized and so do not directly sh ow relative amounts of atoms in a sample. It is
possible to do a semi-quantitative analysis of these peak area, but this is a process that
requires a standard sample with a precisely known composition. Therefore, EDX was
used only to qualitatively determine the elemental composition of samples, in order
to detect any contamination of the magnetite t hin films.
1X-ray photoelectron spectroscopy (XPS) can be used to distinguish the ionic st ate of Fe in different coordination environments. A preliminary XPS study of electrodeposited samples was undertaken but will not b e described in this thesis .
47
3.2.4 Magnetometry
The magnetic response of electrodeposited t hin magnetite films is one of the main
interests of this thesis. A Quantum Designs MPMS SQUID (Superconducting Quan
tum Interference Device) magnetometer was ut ilized for the collection of most of the
hysteresis data. To measure a magnetic response, a sample is placed within the mag
netometer and subjected an applied magnetic field, H . This magnetic field is supplied
by electromagnets driven by either alternating current (AC) imposed on a direct cur
rent (DC), or a direct current alone. To measure the effect that these magnetic fields
have on samples, t he magnetic response is det ected by superconducting pickup coils,
which experience an induced electric field caused by the changing magnetic field from
the sample. In t he DC method, t he sample is either vibrat ed or t ranslated t o vary the
magnetic field, while in the AC method, the fluctuations in the applied field induces
an oscillating sample response which generates an electr ic field in t he coil. A SQUID
was used because t he sensitivity of a SQUID is high enough t o detect a magnetic field
from weakly magnetized or thin samples.
Magnetization data were collect ed between 50 K and room temperature with a
maximum applied field of 1000 Oe. Dat a collected with t he on-site SQUID magne
t omet er were confirmed with data recorded with a similar device operated by Dr.
T. Monchesky at Dalhousie University. Since room temperature hysteresis data was
of primary interest, an attempt was made to use a magnetomet er designed to mea
sure the room temperature hysteresis response of ore samples. T his magnetometer

48
utilized an applied magnetic field oscillating at 60 Hz and a copper pickup coil. Unfor
tunately, it was not sensitive enough to detect a signal from thin and small("" 100 p,g)
electrodeposit ed samples.
3.2.5 Atomic Force Microscopy
Anot her powerful tool in t he analysis of t hin films is Atomic Force Microscopy
(AFM) , a type of scanning probe microscopy. The instrument used for AFM st udies
was a Asylum Research MFP3D, which a llows different modes of scanned proximity
probe microscopy. Both of these modes use a silicon cantilever t o image samples. A
laser is reflected off the back of the cant ilever into a photodiode det ector to detect
changes in tip deflection as t he t ip is scanned across t he surface of a sample. A
feedback loop is used to adjust the height of t he sample to maintain t he force between
the cantilever and t he sample. This technique is done in a raster-scan pattern, and
the resulting deflection information is displayed on a computer monitor.
The first type used in this thesis work utilized scanning force microscopy (SFM)
wit h a silicon tip. This technique can be used to det ermine the morphology, homo
geneity, and preferred cryst al habit , similar to SEM micrographs. The advantage of
an AFM is that it can also provide real height data, it can be performed in liquids,
and it does not depend upon sample conductivity or elemental composition. How
ever , rough surfaces are hard t o image with an AFM because of t he inability of the
cantilever to adjust to large height jumps at high scan rates. This technique is also

49
slower and requires more training than for SEM operation. For instance, the col
lection time of an analog SEM micrograph is approximately two minutes, while the
collection t ime for a 512 pixel x 512 pixel AFM image is approximately 25 minutes.
Another mode of operation mentioned in this t hesis is Magnetic Force Microscopy
(MFM). This technique uses a magnetized Co /Cr coated silicon t ip of known mag
netization direction to raster-scan a surface. The deflection of a cantilever equipped
with a magnetized tip will be affected by t he magnetic attraction or repulsion due to
the interactions with a magnetized sample. This can allow t he study of the domain
structure of a material, including domain shape, size, and direction. Like AFM, exces
sive surface roughness can be detrimental to MFM studies. Both the SFM and MFM
studies described here were performed in with an oscillating cantilever (AC-mode).
MFM analysis will be mentioned further in Chapter 6.

50
Chapter 4
Influencing Morphology and
Magnetism
In order to investigat e the interplay between deposit ion condit ions and magnetic
properties of electrodeposited magnetite, several related studies were undert aken.
The electrochemical synthesis of magnet it e was explored and confirmed by comparing
deposit structures (from X-ray diffraction data) with known structural characteristics
of magnetite . The morphologies of magnetite electrodeposits were investigat ed in
order to relate crystallite habit t o deposition conditions. Finally, the morphology
and synthesis conditions of electrodeposited films were correlat ed wit h changes in the
magnetic hysteresis response.

51
4.1 Confirming Phase Composition
Magnetite electrodeposits were obtained using an electrolyte consisting of 0.04
M KCH3COO + 0.01 M Fe(S0 4) 2 (NH4)2 · 6H20 (pH ~ 6.5), which has been used
by other groups t o synthesize epitaxial magnetite thin films on single crystal gold
[2]. Unless otherwise noted, this electrolyte will be considered the st andard used in
t his thesis. Films were deposited potentiostatically on polycrystalline brass and gold
substrates at potent ials between - 0.250 V and -0.450 V. Magnetite deposition was
typically attempted for 10- 90 minutes at temperatures ranging from 70- 90°C.
The first step in confirming that magnetite deposition was occurring was t he visual
inspection of deposited films. Deposit colour is an important factor in determining
phase ident ity because colour is indicative of different phases of iron oxides and iron
hydroxides. Magnetite and ry-Fe20 3 (maghemite) are t he two black iron oxide phases
of int erest, while a::-Fe20 3 (hematite) and a:: - FeOOH (goethite) are two reddish iron
containing species of interest. At temperatures below 75°C, no deposit could be
grown, while at t emperatures above 85°C water evaporation caused b ubbles to form
on t he working electrode disrupting the growth of t he films. Black deposits were found
at potentials ranging from - 0.325 V to -0.450 V, while red films were deposited at
more positive potent ials ( - 0.250 V t o - 0.325 V) . F ilms deposited between - 0.325 V
and - 0.300 V were often a mixture of red and black deposit s. Temperature was not
a factor in the colour of deposited films.
X-ray diffract ion (XRD) was utilized to confirm the presence of magnetite in

52
the deposited black films, and to identify any preferred crystallite orientation. The
peak positions of experimental patterns were compared with known XRD patterns for
magnetite, as shown in Figure 4.1 . These XRD phase analyses showed that magnetite
could be deposited over a 125 mV potential window ( -0.325 V to - 0.450 V). Lattice
constant refinements using LATCON on three to six Bragg reflection peaks showed
that the cubic lattice constant of these electrodeposited films was 8.396± 0.009 A. T his
value is in agreement with the accepted latt ice constant of magnetite, 8.397 A ( JCPDS
# 1 9-0629) [ 63]. Additionally, all hkl reflections observed were allowed by magnetite's
Fd3m spacegroup. It should be noted that XRD data confirmed the presence of
magnetite in deposits prepared on both polycrystalline brass shimst ock and (111)
t extured Au/ Or/glass substrat es. The XRD data were also inspected qualitatively
for preferred orientation, by comparing the relative peak heights of experimental
diffraction patterns with the relative peak heights of magnetite's standard diffraction
pattern. However , overlap from deposit peaks and peaks from t he substrate make a
quantitative determination of preferred orientation difficult .
As mentioned in Chapter 3 , galvanost atic methods were a lso utilized to synt hesize
magnetite. XRD analysis confirmed t hat magnetite could be deposited on brass and
gold substrates at current densit ies between 50 ~-tA/cm2 and 88 ~-tA /cm2 . A plot of
pot ential versus time during a typical galvanostatic deposit ion can be seen in Figure
4.2 . After an initial period of rapid current drift, t he potential stabilizes to a value
between - 0.450 V and - 0.325 V, where magnetite deposit ion occurs.

~
en 0.. ..s ~ ·c;; c 2 c
* 4000 (311 )
3000
(400)
* 2000
1000 (220] *
(333)
~ ~ J
10 20 30 40 50 60 70 80 90 100
2e (degrees)
53
Figure 4.1: Indexed XRD d iffraction pattern from a thin film of magnetite prepared by potentiostatic deposit ion at -0.375 V . Peaks resulting from t he brass substrate are marked with an asterisk (*). The observed Bragg reflections are excellent matches with those expected for magnetite, JCPDS # 19-0629 [63].
0
-0.1
~ -0.2 Cii
~ -0.3 0 n.
-0.4
-0.5
0 20 40 60
Time (s)
80 100
Figure 4.2: Applied deposit ion potential vs. t ime for a sample prepared galvanostatically at 50 !lA/cm2
. Within t he first 15 seconds of deposition, the applied pot ential stabilizes to a potential at which magnet it e is electrodeposited, and no significant variation in potential is observed over 15 - 90 minutes of deposition.

Potenti ostati c
Octahedral Crystallite
54
Galvanostatic
Figure 4.3: Scanning electron micrograph s of magnetite deposited potentiostatically ( - 0.350 V for 30 minutes) and galvanostatically (+50 J.kA for 30 minutes) . Octahedral crystallite habits, circled in red, are observed in samples prepared by either method. Energy dispersive X-ray analysis (EDX) was carried out on these samples in order to verify th at no contaminants were present .
Scanning electron micr oscopy (SEM) sh owed that films, prepared either p ot en -
tiostatically or galvanostatically, were comprised of crystallites with an octahedral
habit for deposition times less than 30 minutes. Crystallites with this sh ap e indicate
faster gr owth along the (100) directions and slower gr owth along the (111) directions.
Films that were deposited over longer periods, such as 0.5- 1.0 hours, formed faceted
aggregate crystallites of the aforementioned octahedral habit , as shown in Figure 4.3.
As well as revealing crystallite morphology, SEM was also used to study t h e hom o-
geneity and grain size of deposited films. SEM microgr aphs revealed films consisting
of a bed of smaller ( < 150 nm) crystallites with an even distribution of larger ( > 200
nm) aggregate crystallites. Crystallite habit variations were con sistent over t he entire
dep osition area (0.4 cm 2), with an average crystallite size on th e order of 100 nm esti-

55
mated by visual inspection of SEM micrographs. XRD peak broadening calculations
suggest our deposits contain crystallite sizes in the range of 50 - 150 nm. St udies by
others in the field of magnet ite electrodeposit ion do not address t he issue of cryst allite
size directly, but magnetite crystallit es with octahedral habits have been prepared by
Peulon et al. on polycryst alline gold and synthesized from electrolytes containing
NaCl , FeCb , and 1-methyl-imidazole [72]. Cubic crystallites were seen by Zhang et
al. in magnetite electrodeposit s prepared on polycryst alline substrates using an al
t ernating current technique in an electrolyte containing iron sulfate and ammonium
acetate [73]. Triangular prism crystallit es have been observed for Fe30 4 electrode
posited on single crystal Au(111) , Au (llO), and Au(100) substrates by Nikiforov et
al. [3].
4.2 Tuning Structure With Applied Potential
Outside of t he potent ial region for magnetite deposition ( -0.325 V to -0.450
V) , other phases of iron oxide were deposited. XRD data from deposits prepared at
- 0.300 V to - 0.325 V often indicated t he presence of 1 -Fe2 0 3 (maghemite) . Lattice
const ant refinement on t hree t o six Bragg reflection peaks yields a cubic lattice,
with a = 8.360 ± 0.009 A which corresponds well wit h t he cubic lattice const ant
for maghemite (8.3515 A, J CPDS # 39 - 1346). At pot entials more positive t han
- 0.300 V, XRD data confirms t he presence of goethite (o:-FeOOH), a red material
often used as a pigment [74]. Using LATCON for lattice refinement on six Bragg
56
reflect ion peaks, t he orthorhombic lattice constants of the deposited goethite were
found to be a = 4.60 ± 0.01 A, b = 9.93 ± 0.01 A and c = 3.024 ± 0.01 A, which
is in agreement with the accepted values of a = 4.608 A, b = 9.956 A, and c =
3.0215 A (JCPDS# 29 - 013). Since maghemite and goethite contain only Fe3+ ions,
whereas magnetite has a Fe2+ / Fe3+ ionic mixture, it is reasonable to find these phases
at more positive (more oxid izing) potentials.
Linear sweep voltammetry was used to investigate the current response versus
applied potential over the whole deposit ion range. The potential was swept from
- 0.550 V to - 0.100 V at 1 m V /s and the current response was recorded, as shown
in F igure 4.4. At potent ials more negative than -0.450 V, t his sweep displays a
large cathodic current due t o hydrogen evolut ion in the electrolyte. In t he range
linked with magnetite and maghemite deposit ion (-0.450 V to -0.300 V), the current
response shows less noise than t he current response seen at more positive potentials .
At potentials above - 0.300 V, a substantially more noisy current trace can be seen,
which is consist ent wit h deposits of the less electrically-conductive goethite. Linear
sweep voltammetry was performed using both of the polycrystalline substrates, and
there was no obvious d ifference between substrates.

57
1000
800
1: 600 (.)
:a: Depo~tion
2o 400 d mognetite
~ "iii
200 c: Q)
0 "E 0 Q)
~ -200 0
-400 No deposition
-600 -0.5 -0.4 -0.3 -0.2 -0.1
Potential (V)
Figure 4.4: Linear sweep volt ammogram of 0.01 M Fe(S04)2(NH4)2 · 6H20 + 0.04 M KCH3 COOH at 1 m V / s. The circled center region indicates the pot entials at which magnetite can be deposited. In the region more negative than t hese pot entials, no deposit is seen . In the region more positive than this, goethite ('y-FeOOH) forms.
4. 3 Modifying Electrolyte to Affect Deposition Ki-
netics
The t emperatures (> 70°C) required t o deposit magnetite from aqueous elec-
trolytes causes some practical problems with t he deposit ion of magnetite. Bubbles
that form at these t emperatures can cause uneven film t hicknesses across electrode-
posited samples, and rapid evaporation of the electrolyte changes t he electrolyt e mo-
larity during deposition. The studies outlined in t he next t wo sections were att empted
in order t o reduce the temperature required for magnetite electrodeposit ion.

58
4.3.1 Ammonium Concentration
Previous studies of the affect of ammonium ions and the corresponding pH change
on t he formation of magnetite have shown interesting results with respect to deposi
tion rate and temperature. During investigations into t he effect of ammonia (NH3 ) to
change the pH of electrolytes for magnetite electrodeposition, Nishimura et al. found
that the synthesis of magnetite occurred at its maximum rate for an ammonium ion
concentration of 14.8 mM (pH = 7.5) at 80°C [18]. Above and below this concen
tration magnetite formed more slowly. They also found that t he maximum rate of
magnetite deposition at 24°C occurred with a lower concentration of ammonium, 11.8
mM (pH = 8.4). At both temperatures, magnetite formation slowed for ammonium
concentrations higher and lower than optimum. In electrolytes with a pH greater
than 8.4, t his decrease in deposition rate was attributed t o t he formation of iron
hydroxides such as Fe(OH) 2 and Fe(OH)J within solution.
The effect of ammonium (NHt) ions was investigated on magnetit e deposition by
using 0.1 M ammonium acetate (NH4CH3COO) + 0.01 M ammonium iron sulfate
(pH 6.7) . Using this electrolyte increased the ratio of ammonium ions (0. 12 M) to
iron ions (0.01 M) relative to our standard electrolyt e (0.02 M NHt to 0.01 M Fe2+).
This increase in ammonium allowed a change in the concentration of ionic species
within the solution, without a subst antial change in the pH of the electrolyte much
(pH 6.7, compared to pH 6.5 for the standard electrolyte).
No magnetite films could be deposited from electrolytes with this drastically in-

59
creased ammonium concentration. At pot entials more positive than - 0.275 V, reddish
films consist ent in appearance with goethite were found, while at potentials more neg
ative than - 0.275 V, no films formed. At the other extreme, using an electrolyte with
no ammonium ions (0.01 M Fe(S04)·7H2 0 + 0.04 M KCH3COO, with pH 7), mag-
netite films were deposited successfully. Deposition rates using this electrolyte were
comparable t o those from the standard electrolyte. Consequently, very high levels of
ammonium (relative to Fe2+) suppressed t he formation of magnetit e, while a lack of
ammonium was not detrimental t o the formation of magnetite. In situ formation of
iron hydroxide did not occur with either ammonium concent ration because electrolyte
pH was always below 8.4. Another cause could be the formation of in situ iron(II)
ammonia complexes seen in high ammonium concentration solutions [75].
4.3.2 Acetate Concentration
A more successful attempt to reduce t he t emperature required for magnetite de
position involved using higher concentrations of pot assium acetate, which serves as
a complexing agent . When utilizing eit her 1.0 M or 2.0 M KCH3 COO along wit h
0.01 M Fe(S04)2(NH4) 2 · 6H20 , electrolyte pH increased t o more basic values of 8.25
and 8.5, respectively. The upper potent ial limit for magnetite formation was shifted
from - 0.300 V (0.04 M acetate) to - 0.375 V with the 1.0 M acet ate. A shift to more
negative potentials wit h increasing pH is predicted by the Nernst equation [19], but
given t he complexity of t his system and t he lack of buffering, a quant itative analy-

60
sis is not prudent . Qualitatively, it is easy to see t hat t he change is pH shifted the
potential window in the predict ed direction. The potent ial window for magnetite is
much larger (200 m V) for the increased acetate concentration, with a lower pot ential
limit of - 0.575 V.
One of the most start ling differences between the standard and acetate-enriched
electrolyte was the increased deposit ion rate. Samples deposit ed for ten minutes
from the 1.0 M acetate electrolytes were of comparable thickness (""' 100 nm) as
those deposited for 30 minutes from the 0.04 M acet ate electrolytes. When the acetate
concentration was increased to 2.0 M, the deposition rate did not cont inue to increase.
The pot ential windows for magnetite deposition from t he 2.0 M acetate elec
trolytes ( - 0.425 V to - 0.525 V) were comparable to t hat for t he 0.04 M acetate
solution: 100 m V, but shifted more negative due t o pH. Maghemite formation some
times occurred at the more posit ive end of this range ( - 0.425 V to - 0.475 V). Red
deposits, indicative of goethite, formed at potentials more posit ive t han those for
magnetite, while no deposits were formed at potentials more negative t han -0.525
V.
The relation between acetate ion concent ration and deposit ion temperature was
also studied. Magnetite could be deposited at lower temperatures , as low as 60°C,
wit h t he 1.0 M and 2.0 M acetate solutions than with t he 0.04 M acetate solut ion.
The concentration of acetate was not increased above 2.0 M because such electrolytes
would have a pH above 8.5, which would cause problematic in situ formation of iron

61
hydroxide.
Dramatic morphological differences were observed for samples deposited from
acetate-enriched electrolyt es. Rounded crystallites, as shown in Figure 4.5, were
deposited over a potential range of -0.425 V to -0.550 V . These deposits were con
firmed to be magnetite by XRD data, as shown in Figure 4.6, by comparison with
the JCPDS powder diffraction fi le [63]. Lattice constant refinement performed on
these samples found a lattice constant of 8.39 ± 0.02 A, which is consistent wit h
magnetite's accepted cubic lattice constant (8.3967 A).
The results reported here indicate that an increase in acetate ion concentration is
not detrimental to the formation of magnetite, but rather increases deposit ion rate.
This increased deposit ion rate leads to more poorly formed , rounded crystallites.
Data from ammonium and acetate concentration studies suggest that differences in
deposition rate can be attributed largely to pH differences in the electrolytes. pH
d id increase wit h higher acetate concentrations, and shifted t he potential deposition
window in a manner consist ent with t he pH-potential phase stability of magnetite, as
shown in Figure 2.2. A complet e study would have included adjustments t o keep the
pH constant (through t he addit ion of H2S04 or KOH) while the supporting ion con
centrat ion was varied, but t he intent of this section was to observe t he general effect
of both ammonium and acetate concentrat ion on the electrodeposition of magnetite
and so such a study was not completed.

62
Figure 4.5: Scanning electron micrograph of magnetite deposited potentiostatically ( -0.4 75 V for 25 minutes) from electrolyte containing 2.0 M acetate. More rounded crystallite habits are observed in samples prepared from electrolytes with higher acetate concentrations.
*substrate
400
(nnn)magnetite *
300
~ c ::J
?: 200 g fi <>:_
100
0
20 30 40 50 60 70 80 29 (Degrees)
Figure 4 .6: Indexed XRD diffraction pattern from a t hin film of magnetite prepared by potentiostatic deposition at - 0.475 V from an acetate-enriched electr olyte. Peaks resulting from t he gold substrate are marked wit h an asterisk (*) . The observed Bragg r eflections are excellent matches with t hose exp ected for magnetite, J CPDS # 19-0629 [63].

63
4.4 Magnetic Characterization
4.4.1 Verwey Transition
Magnetite undergoes an order/ disorder transit ion when cooled below 120 K. This
Verwey transition is characterized by a spontaneous lattice symmetry change coupled
with an electrical conductivity change [40], and is due t o an electronic change within
the iron ion sublattices of magnetit e. At temperatures above Tv, t he Fe2+ valence
electrons resonate between the 2+ ions and 3+ ions on the octahedral lattice sites,
resulting in good electrical conduction (rv 0.01 (Dcm)-1) [40, 76]. At t emperatures
below Tv there is a structural change (from cubic spacegroup Fd3m to monoclinic
space group Cc), and t herefore t he Fe2+ valence electrons are not as free to conduct
because they are more strongly bound to the Fe2+ ions [76]. For bulk magnetite, Tv
is 120 - 125 K [40, 77], but it can occur at lower temperatures for smaller particles
(100 K) [78], in thin fi lms (70 K) [79], or in strained films [80, 81].
Verwey transit ions were confirmed in our electrodeposited samples by observing
the magnetization versus temperature behaviour, as shown in 4.7. To observe this
behaviour , the samples were cooled t o 50 K in the absence of an applied field. Then
an external magnetic fie ld was applied as the sample was heated back to room tem
perature and the magnetization was measured (zero field cooled (ZFC) procedure).
Then the sample was cooled t o 50 K wit h t he applied field present, and the mag
net ization was recorded as the sample was heat ed back t o room t emperature again

64
• • • •zFc • • • • •Fe 2.94x10'3 • s • :::!: • l!!. • • • • c • • • • 0 2.92 • • ~ • • • • • ~ • c • • C) 2.90 • • 0 :::!:
2.88
80 100 120 140 160 180 Temperature (K)
Figure 4.7: The temperature dependence of t he saturation magnetization of a sample of electrodeposited magnetite (deposited pot entiostatically at -0.375 V for 30 minutes). The magnetization was recorded after the sample was cooled bot h without a magnetic field (ZFC) and in a magnetic field (FC). The magnetization reaches a maximum at the Verwey t emperature (115 K).
(field cooled (FC) procedure). A signature of t he phase t ransition appears as a peak
in magnetization at t he Verwey temperature, Tv, near 115 K.
In this t hesis, samples deposited in the potent ial range of -0.300 V to -0.450 V
showed a Verwey transit ion near 115 K, slight ly lower t han that of bulk magnetite,
as seen in Figure 4. 7. T he presence of a Verwey t ransit ion is known to be highly
sensitive to impurit ies, with even very low levels leading to a complete suppression
of t he transition; magnetite with as litt le as 2.2% imputit ies has not shown a Verwey
transit ion [82] . Therefore, t he presence of a t ransit ion in electrodeposied samples is
strongly indicative of high purity magnetite deposits .

65
4.4.2 Saturation Magnetization
Because saturation magnetization is an intrinsic property of a material , the sat
uration magnetization per mass is not expected to differ bet ween samples. However ,
due t o the low mass of electrodeposited samples (rv 100 p,g) quantit ative det ermi
nations of Ms proved t o be difficult in these studies. T he masses of the t hin films
were found by comparing the mass of the substrate and sample to the mass of t he
substrate alone, after dissolving the deposit in HCl. In many instances, t he mass of
water adsorbed from the air onto the samples was greater t han the mass of t he sam
ple. To eva porate the surface adsorbed wat er , t he samples were baked at ~ 50°C for
25 minutes before weighing, in an attempt to reduce uncertainty t o t hat associated
with the microbalance (±10 p,g) . Even after heating to reduce adsorbed water, satu
ration magnet izations in t his t hesis work were found to be suspiciously lower (5 - 30
emu/g) than the accepted theoretical value of 92 emu/ g. Greatly reduced saturation
magnetizations have been seen by Liu et al. in polycrystalline magnetite t hin films
(5 - 1100 nm) deposited by magnetron sputtering; for film thicknesses below 80 nm,
saturation magnetizations were less t han ha lf the accepted value. This reduced satu
ration magnetizat ion was attr ibuted to an a ntiferromagnetic coupling between grain
boundaries [83].
Given that XRD and t emperature-dependent magnetization dat a provide strong
evidence for t he presence of magnetite in electrodeposited fi lms, t he discrepancies in
saturation magnetization values are likely due to weighing inaccuracies or possib le

66
grain boundary interactions. As a result, hysteresis loops in this thesis are displayed
in t erms of percent magnetization relative to saturation magnetization.
4.4.3 Hysteresis
In order to gain information about domain structure differences among magnetite
electrodeposits, magnetic hysteresis behaviours, including coercivity and squareness,
were studied. Hysteresis loops were t aken on deposited films using either in-plane or
perpendicular-to-plane applied magnetic fields, at 298 K, with a maximum applied
field of 1000 Oe. Representative hysteresis data can be seen in Figure 4.8.
Hyst eresis data show that there were no differences between in-plane or perpendicular-
to-plane magnetic response in coercivity, squareness, or sat urat ion magnetization.
This suggests that the deposited films are magnetically bulk-like, even if they are on
the order of 100 nm or less, and t hat t here is no significant influence by t he substrate
on cryst allite growth. SEM, XRD, and AFM results indicat ed t hat t here were no
substrate-dependent cryst allite morphologies or cryst allite orientations.
The electrodeposited magnetite samples from this thesis work displayed coercivi
ties on the order of 100 Oe, which is consistent wit h the range of coercivit ies reported
for magnetite films deposited by other methods. Coercivit ies for synt hesized mag
netite can be as low as tens of Oersted for thin films (0.5 - 1.0 p,m) [73], or up to
rv 600 Oe for thick films [84] or naturally occurring magnetite [34].
An interesting trend was observed between coercivity and deposit ion potential.

67
'la) .:ff" I
f ~ !
-100
"Tb) •
ll I
1
c 0
~ N :; c 0) -100 <ll 2 "Tc) .. z:· 1
:::!: 0
-100 -1000 -500 0 500 1000
Applied field (Oe}
Figure 4.8: Representative magnetic hyst eresis loops obt ained from potent iost aticallydeposited samples at -0.325 V (a), - 0.350 V (b) , and -0.425 V (c) . The loops shown in (a) and (b) are from deposits prepared with electrolytes with 0.04 M acetate, while the loop in (c) is from a deposit prepared from an electrolyte containing 2 M acetate.
Figure 4.9 shows coercivity versus overpotential, which is t he potent ial greater t han
the Nernst reversible pot ential for the Fe2+ / Fe3+ redox reaction ( - 0.630 vs. Ag/ AgCl).
Larger coercivities were seen at more positive overpotentials. This indicates that po-
t ential can be used to influence the domain structure of magnetite films. Lower
coercivities signify t he presence of smaller domain sizes in films deposited at lower
overpot entials, while higher coercivities would indicat e the presence of comparatively
larger domains.
Squareness data, shown in Figure 4.10, underscore this link between overpot ential
and domain behaviour . Samples deposited in t he standard solution at - 0.375 V
( overpotent ial of + 0.1 96 V) had a squareness of 0.79±0.03 M8 . Squarenesses as low as
~ 0.35 Ms were found in films deposited at at higher overpotent ials ( + 0.246 V). The

350 - o -45 min depositions
300 -E>- 30 min depositions ~··A ·· Gatvanosfatic deposits
QJ 250 £ f 200
() 2M acetate d3positions
·~ ______..El •
~ 150 ~ _e; .... u ----- ··
100
50
0 0.18 0.2 0 .22
0
0
Overpotential (V)
.... -~ .. ··
0.24
68
0.26
Figure 4.9: Magnetic coercivity plotted as a function of overpotential shows a strong trend of increasing coercivity with increasing overpotent ial. All coercivity data were obtained with a field applied in the in-plane orientation. The overpotentials are calculated relative to the pH-dependent Nernst reversible potent ial for t he Fe2+ / Fe3+ redox reaction (-0.630 V vs. Ag/ AgCl).
increase in sq uareness along with the decrease in coercivity (and vice versa) indicates
that films deposited at lower overpotentials have pseudo-single magnetite domains
while films formed at higher overpotentials are made of multi-domain crystallit es .
This trend suggests the domain behaviour , and hence coercivity, of magnetite can be
altered with applied potent ial alone.
Electrolyte composit ion can have an even larger impact on the magnetite hysteresis
response of magnetite deposits. Along wit h t he morphological changes shown earlier ,
Figure 4.8( c) shows that the squarenesses of hyst eresis loops of samples deposited
using electrolytes containing 2.0 M acetat e are much less t han t hose of magnetite
deposited from electrolytes containing 0.04 M acetate solution. The squareness of
approximately 0.25 Ms and coercivity of rv 100 Oe is indicative of films composed

69
-o- 45 min depositions
1.0 ----Q- 30 min depositions · --A- - Galvanostatic deposits
0.8
~ "' ~ 0.6
~ c
0.4 !!!
t 0 2M acetate depositions
.. ::-.. :: .. ::-.. : .: .. ::.:----~ ···············i ~
" ::> g
0.2
0.0
0.19 0.20 0.21 0.22 0.23 0.24 0.25 Overpotentlal M
Figure 4.10: Hysteresis loop squareness plotted as a function of overpotential shows a strong trend of decreasing squareness with increasing overpotential. The overpotentials are calculated relative to the pH-dependent Nernst reversible potential for the Fe2+ /Fe3+ redox reaction (-0.630 V vs. Ag/ AgCl).
of multi-domain crystallites. Thus, by changing t he concentration of complexing
agent , it is possible to synthesize magnetite films t hat display multi-domain crystallite
behaviour .
70
Chapter 5
Electrodeposited Iron Oxide
Composite Materials
5.1 Hysteresis Loop Shifts
While studying hysteresis data collected from magnet ometry studies) it was ev-
ident t hat some hysteresis loops recorded at room temperature were shifted along
the horizontal axis. This shift was found to be on the order of 10 Oe) or rv 10% of
the coercivity of t he samples) as shown in F igure 5.1. This shift was accent uated at
t emperatures near t he Verwey transition (80-130 K). 1
As mentioned in Section 2.2.4) a horizontal shift in hysteresis loops is indicative of
an exchange bias between ferromagnetic and antiferromagnetic materials. This shift
1Samples for these t emperature dependent studies were prepared by us and measured by Norman Deschamps and Dr. Ted Monchevsky at Dalhousie University

71
is due to a pinning of the ferromagnetic layer by the antiferromagnetic layer when the
antiferromagnetjferromagnet ic system is cooled or grown below the Neel and Curie
t emperatures of the two materials, respectively. Another possible explanation for
this shift is the constant instrument remanance field (±10 Oe) associated with the
magnet ometers used to collect hysteresis data. However, the fact t hat the coercivity
shifts were t emperature dependent near the Verwey temperature suggests that the
bias seen in the electrodeposited samples is not likely an instrument related artifact.
A review of the deposit ion procedure used in this thesis suggested a possible
source of a multi-phase product t hat could lead to exchange bias behaviour. For
some samples, t he working electrode was held at 0 V for upwards of ten seconds
while the iron salt was added to the solution. This applied potent ial would not lead
to magnetite deposition, but rather an antiferromagnetic iron hydroxide, o;-FeOOH
(goethite). This was confirmed by noting t hat very t hin red films were sometimes left
on the surface of the working electrode after dissolving t he magnetite in HCl. Such
deposits were too thin to yield appreciable XRD peaks. F ilms prepared while the
potential was set to more negative, magnetite-forming potentials ( -0.375 V) while the
iron salt was added d id not show evidence of exchange bias, nor were t here red deposits
remaining on the working electrode after magnetite dissolut ion. Therefore, under the
former deposition conditions, it is possible to form a two-phase ferrimagnetic and
antiferromagnetic deposit that could display exchange bias behaviour.

72
100
r::::: 0
50 :0::: c :S G)
0 r::::: C) c ~ ~ 0
-50
-1 000 -500 0 500 1000 Applied Field (Oe)
Figure 5.1: This hysteresis loop shows clear exchange bias wit h a positive shift along the x (applied field) axis of about 10%.
5 .2 Preparat ion of M ult i-Phase Deposits
In an attempt t o intent ionally creat e exchange biased electrodeposits, samples
were prepared using a potential step t echnique, wherein the potential applied across
the cell was st epped between values corresponding to the different deposition pot en-
tials of magnetite and goethite. Results presented in Chapter 4 show t hat magnetite
forms at - 0.375 V, and X-ray diffraction data from deposits prepared at -0.300 V
confirm the presence of goethite only, as can be seen in Figure 5.2 . The goal was to
deposit distinct layers of each material.
An electrolyte containing 0.01 M Fe(S04) 2 (NH4)2 · 6H20 + 0.04 M KCH3 COOH,
the standard electrolyte, was used to synthesize all deposits in t hese experiments.

* (lll )
4000
~ ·c: 3000 :J
c 0 -= 2000 :0 ~
1000
0
20 30 40
(221 )
50 Angle 29
60
• Goethite *Gold
70 80
73
Figure 5.2: Indexed XRD pattern of a sample potentiostatically deposited at -0.300 V for 30 minutes. Peaks from t he gold substrate are marked with an asterisk(*) . This diffraction pattern is an excellent match with that of goethite (r-FeOOH), JCPDS # 29-0713 [63].
Deposition conditions are summarized in Table 5.1. The deposition time at -0.375
V (for magnetite formation) was kept constant t hroughout t hese experiments at 20
minutes, while the deposition time at - 0.300 V (for goethite formation) was varied
from 10 minutes to 15 seconds. The potentia l step sequence was also varied in an
attempt to form the bilayer in either order.
X-ray diffraction data of t hese potential st ep samples confirmed the presence of
both magnetite and goethite in all cases. However, visual inspection showed that
most of the depositions did not yield distinct layers, but rather a mixture of red-
dish goethite and black magnetite. SEM micrographs, such as Figure 5.3, show the
morphology of such two-phase fi lm on the micrometer scale. In most samples, both
phases were visible even t hough goethite was deposited first. The except ion was when

Diamond-snactea Goefhife Crysfallife
Ocfahedral Magnefife Crysfal
74
Figure 5.3: SEM micrograph displaying a mixed phase deposit where both goethite (diamond-shaped) and magnetit e (octahedral) can be seen. This sample was prepared galvanostatically at 50 p,Ajcm2 for 45 minutes.
the deposition of magnetite was attempted prior to the deposition of goethit e. In this
case, there was no visually obvious goethite deposit , yet XRD data confirmed the
presence of this phase.
Due to circumstances beyond our control, magnetic hyst eresis data of these sam-
ples has yet to be recorded. To reduce the possibility of false loop shifts due to
instrumental remanent fields inside the magnetomet er , these future measurements
will involve quenching the magnet's remanence field to :::; 0.5 Oe prior to each mag-
netization measurement at each applied field value. As soon as the instrumentation
becomes available t o perform these studies a fuller exploration will be made.

75
Table 5.1: Summary of deposit ion condit ions for two-phase exchange biased samples. Goethite deposition occurred at - 0.300 V (varying t imes), while magnetite deposition occurred at -0.375 V (20 minutes). The electrolyte, containing 0.01 M Fe(S04)2(NH4)2 · 6H20 + 0.04 M KCH3COOH, and was maintained at 80°C.
Sample Number Phase Deposited Length of Deposit First Goethite Deposit ion (s) Appearance
1 Goethite 600 Uniform reddish black mixture
2 Goethite 300 Uniform dark reddish black
mixture 3 Magnetite 300 Uniform black 4 Goethite 180 Separate red and
black sections 5 Goethite 60 Mostly black,
reddish at center 6 Goethite 15 Uniform black
76
Chapter 6
Conclusions
6.1 Conclusions
Magnetite has shown promise as a material that could be ut ilized in t he new age
of microelectronic and spintronic applications, because it is a highly spin-polarized
material with good conduct ivity and a wide operational t emperature range. In order
for magnetit e to t ruly become a viable opt ion for the manufacturers of spintronic
devices, it must be cost efficient t o synthesize it in high quality / high quant it y forms
that perform well in spintronic devices. This thesis work lays t he groundwork for a
complet e characterization to d iscover whet her electrodeposit ed magnetit e is suited to
these applications. This thesis describes the synthesis-structure-magnetic response
relations of magnet ite prepared by a cost efficient electrodeposition t echnique, and
has found it suitable for extended studies into t he spin-polarization and exchange

77
bias, both of which are important attributes for spintronic applications.
It was found that thin film magnetite can be electrodeposited on polycrystalline
brass and gold substrates from an electrolyte with different iron:acetate rat ios at
temperatures between 75°C and 85°C. Potentiostatic deposition from standard elec
trolyte ( acetate: iron ratio=4) yields magnetite over a relat ively narrow potent ial range
(150 m V) , while galvanostatic formation of magnetite requires current densities rv 40
J.-LA/ cm2. The resulting magnetite films contained oct ahedral crystallites . Outside
of these pot ential/current ranges, either different iron oxide phases formed (positive
potentials) or no deposit formed (negative potentials).
Magnetic hyst eresis studies showed that the deposition pot ential affects magnetic
response. Magnetic coercivities increased monotonically and the squarenesses de
creased with increasing overpotent ial. This suggests that samples prepared closer
t o magnetite's Nernst potential exhibit pseudo-single domain behaviour and mult i
domain behaviour is displayed by samples prepared at higher overpot ent ials.
During experiments designed to reduce the deposit ion temperature, magnetite
with a dramatically different magnetic response was formed . Using acetate-enriched
electrolytes (acetate to Fe2+ ratios of 100- 200), magnetite was synt hesized at t emper
atures as low as 60°C. However, the magnetite films deposited with these electrolytes
also formed more rounded crystallit es. This lead to drast ically different magnetic
coercivities ( < 100 Oe) and squarenesses (~ 25%) relative t o deposits prepared with
the standard electrolyte. These magnetic responses also indicate that mult i-domain

78
crystallites can be formed using these acetate-enriched electrolytes.
The dependence of ammonium concentration on magnetite deposition was investi
gated by utilizing electrolytes with ammonium:iron ratios of 0 - 10. Results suggests
that the presence of high levels of ammonium in solution blocks t he formation of
magnetite, perhaps by reducing the buffering ability of the acetate ions. Increased
ammonia concentration has previously been linked with reduced magnetite formation
through an associated increase in pH above 8.4 [18], but t his is not the case in this
study because the pH of the electrolyte used here was always below 8.4. The in
situ format ion of iron(II) ammonia complexes could also be the cause of t his reduced
magnetite formation [75] .
Evidence of exchange anisotropy (of~ 10 % of He) was found during the elec
trodeposition of magnetite. Antiferromagnetic goethite is suspected t o have been
deposited in conjunction with magnetite on some samples, leading to a preliminary
study of electrodeposited magnetite with an associated exchange bias due to the
co-deposition of goethite. Early results in samples prepared to show intent ional ex
change bias have suggested t hat it is challenging to deposit well defined layers of
the two materials. On-going studies in t his area address the possibility of adjust
ing the magnitude of t he exchnage bias by varying the relative amounts magnetite
(ferrimagnetic) and goethite (antiferromagnet ic) components within the deposit.

79
6. 2 Future Studies
The work done in this thesis, while laying important groundwork to help under
stand synthesis-structure- property relations for electrodeposited magnetite, has also
brought up some interesting questions that can stimulate further in-depth studies.
Many of these issues relate to gaining a better understanding of crystallite growth
during electrodeposit ion, assessing t he spin-dependent electron transport of electrode
posited magnetite, or stem from the discovery of exchange bias within layers of elec
trodeposited magnetit e. Many of the studies proposed here use an atomic force
microscope as the main analysis tool, which is a recent addit ion to the capabilities of
the Poduska Research Group laboratory.
Brillouin spectroscopy is one of t he t echniques that can be used to explore the
spin-dependent properties of magnetite. Preliminary Brillouin studies, performed in
conjunction with Dr . Todd Andrews, were undertaken on electrodeposited magnetite
samples during the completion of this t hesis. These studies have found the surface
Raleigh wave velocity of the electrodeposited samples (3218±98 ms- 1) to be consist ent
with t he accepted value for magnet ite (3200 ms-1 , [85]) . Furt her study of magnon
creation in magnetite is being planned . Magnon creation at temperatures approaching
the Verwey t emperature, in a variable applied magnetic field , and in films of varying
thickness are some of the topics that could be covered in such a study.
In order to understand t he magnetic domain structure of electrodeposited mag
net it e, it would be advantageous to st udy bow magnetit e cryst allites nucleat e and

80
grow. In situ (in electrolyte) atomic force microscopy would reveal how magnetite
cryst allites, and other iron oxide and hydroxide species, nucleat e and grow on the
surface of a substrate during electrodeposition. Before such a study can be con
ducted, some practical considerations must be addressed. Due to t he small volume
of the AFM-compatible electrochemical cells (~ 1 mL), the deposit ion temperature
for magnetite must be reduced in order t o combat evaporation problems/challenges.
A solution must be also be found to suppress precipit ate formation during t he depo
sition of magnetite. In this thesis work, this suppression was achieved by de-gassing
the electrolyte wit h argon. However, the bubbling of argon would be incredibly dis
ruptive t o AFM imaging. A proposed solution to this is the use of a flow t hrough
cell or a different electrolyte. If these obst acles were overcome, in situ AFM would
be a powerful analysis technique for studying electrodeposited magnetite. This could
be especially useful in studying the formation of goethite / magnetite composites de
scribed in Chapter 5.
Atomic force microscopy imaging of magnetite samples as they are dissolved in
dilut e acid could also provide data on the grain structure of electrodeposited samples.
Such a study may not involve t he problems of de-gassing, stirring, and heating, but
would require a controllable way t o ramp t he pH of an aqueous solut ion without
dissolving t he sample too quickly, or sat urating the solution so t hat t he magnetite
dissolut ion does not stop. By choosing an acid t hat dissolves magnetite and not
goet hite, or vice versa, t his t echnique could also show the heterogeneity of species

81
and grain boundaries of a composite materia l. HCl, H2S04 , and HN03 all show
promise in this regard because when composite samples are dissolved in these acids,
a layer of reddish goethite is left behind.
A complete magnetic force microscopy (MFM) study of electrodeposited samples
would also provide direct assessment of the domain structure ferromagnetic samples,
as well as identify boundaries between phases in magnetite/ goethite composite ma
terials. Along with imaging across the t op surface of a sample, MFM could also be
performed on a cross section of magnetite to yield domain structure information as
a funct ion of thickness as well. A preliminary MFM study has been undertaken,
but deposit roughness was too large to give meaningful MFM images. This deposit
roughness problem must be solved before MFM experiments could supply any useful
data. In situ (in electrolyte) MFM may also be possible, but signal to noise ratios
are substantially reduced while imaging in fluid.
The surface magneto-opt ic Kerr effect (SMOKE) t echnique, which uses the change
in polarization of a laser beam reflected off the surface of a magnetized sample (Kerr
Effect) to probe the average magnetic propert ies of a thin film , could also be a possible
t echnique to determine magnetic response of magnetite films. Along with providing
magnetic response, t his t echnique is less costly than SQUID magnetometry, requires
less time, and can also provide spatially-resolved magnetic response. Unfortunately,
t his t echnique is limited in resolution to the width of the t he laser source, which limits
detection of t he domain structure in electrodeposit ed magnetite samples.

82
Computer simulations could be beneficial to gain a better understanding of the
role of exchange bias in samples containing both electrodeposited magnet ite and
antiferromagnetic iron-containing compounds. Micromagnetic modeling would be
an appropriate approach because it considers the free energy (including magnetic
anisotropy energy, ferromagnetic exchange energy, magnetoelastic energy, magneto
static energy, and magnetic potential energy) of a material, and models magnetic
domain structure and response to an applied field [86]. With this t echnique, t he fer
romagnetic/antiferromagnetic interfaces between magnetite and goethite could likely
be modeled to link exchange bias seen during this thesis work with possible grain and
domain arrangements.
Ultimately, the study of t he magnet oresistance of electrodeposited magnetite sam
ples is of interest when checking for t he 100% spin-polarization desired for spin
tronic devices [87]. Sorenson et al. have found a spin-polarization of rv 40% in
electrodeposited magnetite [2], even t hough magnetite ore is know to have 100%
spin-polarization [88]. The standard four-terminal analysis method for magnetore
sistance, where four t erminals (two for current transfer and two to measure voltage)
are attached to a t hin film and t he resistance is measured as a a function of applied
magnetic field and temperature [89], could be used to test the magnet it e samples
electrodeposited here. This type of analysis could provide data on any relationship
that may exist between deposition condit ions/morphology and changes in the spin
polarization of electrodeposited magnetite. Preliminary investigations, using instru-

83
mentation in Dr. M. A. White's labratory at Dalhousie University, are in progress
While magnetite is a common and well known material, a complete characteriza
tion has yet t o be performed that encompasses all its magnetit e's propert ies . As new
t echnologies (such as spintronic applications) and new techniques are invented and
discovered, the existing data on many mat erials must be expanded to address t heir
role in these new areas of science. Therefore, a study that considers magnetite 's use
as a spintronic device must be undertaken in order to more fully character ize t his
material. If t he aforementioned studies could be complet ed, magnetite could prove
t o be very useful in microelectronic applications.
84
Bibliography
[1] Prinz, G. A. Science 1998, 282, 1660.
[2] Sorenson , T. A.; Morton, S. A. ; Waddill , G. D. ; Swit zer , J. A. Journal of the
American Chemical Society 2002, 124, 7604-7609.
[3] Nikiforov, M. P.; Vertegel, A. A.; Shumsky, M. G. ; Switzer , J. A. Advanced
Materials 2000, 12, 1351-1353.
[4] Zhang, Z.; Satpathy, S. Physical Review B 1991 , 44, 13319-13331.
[5] Anisimov, V. I. ; Elfimov, I. S. Physical R eview B 1996, 54, 4387-4390.
[6] Mills, A. A. Annals of Science 2004, 61, 273-319.
[7] Abe, M. ; Tamura, Y . Japan ese Journal of Applied Physics 1983, 22, 1 511-1513.
[8] Kittel, C . Introduction to Solid State Physics; John Wiley and Sons Inc.: New
York , Seventh ed. ; 1996.
[9] Kennedy, R. J .; Stampe, P. A. Journal of Physics D: Applied Physics 1999, 32,
16-21.
85
[10] Dedkov, Y. S.; Fonin , M.; Vyalikh, D. V .; Hauch, J. 0. ; Molodtsov, S. L.;
RUdiger, U.; Gi.intherodt, G. Physical R eview B 2004, 70, 073405.
[11] Wright, J . P .; Attfield , J.P. ; Radaelli , P. G. Physical R eview Letters 2001, 87,
266401.
[12] Margulies, D . T.; Parker, F. T. ; Rudee, M. L. ; Spada, F . E.; Chapman, J . N.;
Aitchison, P. R. ; Berkowitz, A. E. Physical Review Letters 1997, 79, 5162-5165.
[13] Therese, G . H . A. ; Kamath, P. V. Chemisty of Materials 2000, 12, 11 95-1204.
[14] Peulon, S.; Lincot, D. Journal of the Electrochemical Society 1998, 145, 864-874 .
[15] Datta, M.; Landolt , D. Electrochimica Acta 2000, 45, 2535-58.
[16] Penner, R. M. Journal of Physical Chemistry B - Condensed Phase 2002, 106,
3339-53.
[17] Abe, M.; Tamaura, Y.; Oishi , M. ; Saitoh, T. ; Itoh , T. ; Gomi , M. IEEE
Transactions On Magnetics 1987, 55, 3432-3434.
[18] Nishimura, K.; Kitamoto, Y .; Abe, M. IEEE Transactions On Magnetics 1999,
35, 3043-3045.
[19] Wang, J . Analytical Electrochemistry; Wiley-VCH: New York, Second ed.; 2000.
[20] Bard, A. J. ; Faulkner , L. R. Electrochemical Methods: Fundamentals and Ap
plications; John Wiley and Sons Inc .: New York, Second ed .; 2001.
86
[21] lves, D. J. G.; J anz, G. J . Reference Electrodes: Theory and Practice; Academic
Press: New York, 1961.
[22] Petrucci, R. H.; Harwood , W . S. General Chemistry: Principles and Modern
Applications; Macmillan Pubplishing Company: New York, Sixth ed.; 1989.
[23] Schollhorn, R. Angewandte Chemie International Edition English 1980, 19, 983-
1003.
[24] Switzer , J. A. American Ceramic Society Bulletin 1987, 66, 1521-24.
[25] Switzer , J. A.; Shane, M. J .; Phillips, R. J . Science 1990, 247, 444-446.
[26] Oh, C.-Y .; Oh, J .-H .; Ko, T . IEEE Transactions On Magnetics 2002, 38,
3018-3020.
[27] Hai, T .. H. ; Van , H. T. B. ; Phong, T . C .; Abe, M. Physica - Section B 2003,
327, 194-198.
[28] Switzer , J . A.; Liu, R. ; Bohannan, E. W. ; Ernst, F. Journal of Physical Chem
istry B - Condensed Phase 2002, 106, 12369-12372.
[29] Pourbaix, M. Atlas of Electrochemical Equilibria in Aqueous Solutions; Pergamon
Press: New York, 1966.
[30] Blundell , S. Magnetism in Condensed Matter; Oxford Masters Series in Con
densed Matter Physics Oxford University Press: Oxford, 2001.

87
[31] Griffiths , D. J. Introduction to Electrodynamics; Prentice Hall: Upper Saddle
River, Third ed. ; 1999.
[32] O'handley, R. C. Modern Magnetic Materials : Principles and Applications;
Wiley-lnterscience: New York, 2000.
[33] Cullity, B. D. Introduction to Magnetic Materials; Addison-Wesley: Reading,
Massachusetts, 1972.
[34] Hodych, J. P. Earth an d Planetary Science Letters 1996, 142, 523-533.
[35] Szmaja, W. Physica Status Solidi (a) 2002, 194, 315-330.
[36] Medrano, C.; Schlenker, M.; Baruchel, J.; Espeso, J.; Miyamoto, Y. Physical
R eview B 1999, 59, 1185-11 95.
[37] Ambatiello, A.; Fabian, K. ; Hoffmann, V. Physics of the Earth and Planetary
Interiors 1999, 112, 55-80.
[38] Pan, Q.; Pokhil, T . G.; Moskowitz, B. M. Journal of Applied Physics 2002, 91,
5945-5950.
[39] Pokhil , T. G.; Moskowitz, B. M. Journal of Geophysical Research - Part B -
Solid Earth 1997, 102, 22681-94.
[40] Walz, F. Journal of Physics: Condensed Matter 2002, 14, R285-R340.
[41] Weiss, P.; Forrer, R. Annals de Physique 1929, 10, 279-374.

88
[42] Voogt , F. C.; Palstra, T. T. M.; Niesen, L.; Rogojanu, 0 . C .; J ames, M. A. ;
Hibma, T . Physical Review B 1998, 57, R8107-R8110.
[43] Dunlop, D. J. R eports on Progress in Physics 1990, 53, 707-792.
[44] Ozdemir, 6.; Dunlop, D. J. ; Moskowitz, B. M. Earth and Planetary Science
Letters 2002, 194, 343-358.
[45] Meiklejohn, W . H.; Bean, C. P. Physical R eview 1957, 105, 904-913.
[46] Stamps, R. L. Journal of Physics D: Applied Physics 2000, 33, R247-R268.
[47] J acobs, I. S.; Bean, C. P. Magnetism: A Teatise on Modem Theory and Mate
rials; volume III Academic Press: New York, 1966.
[48] Nogues , J .; Leighton, C.; Schuller , I. K. Physical R eview B 2000, 61, 1315-17.
[49] Craik , D. J .; Tebble, R. S. Ferromagnetism and Ferromagnetic Domains; vol
ume IV of Selected Topics in Solid State Physics John Wiley and Sons Inc.: New
York, 1965.
[50] McCord, J .; Mattheis, R. ; Elefant, D. Physical R eview B 2004, 70, 094420.
[51] Lederman, D. ; Ramlrez, R. ; Kiwi, M. Physical R eview B 2004, 70, 184422.
[52] Sort , J .; Popa, A.; Rodmacq, B. ; Dieny, B. Physical R eview B 2004, 70, 174431.
[53] Eisenmenger, J .; Li, Z.-P.; Macedo, W. A. A.; Schuller, I. K. Physical R eview
Letters 2005, 94, 057203-1-4.
89
[54] Scholten, G.; Usadel, K. D. ; Nowak, U. Physical R eview B 2005, 71 , 064413.
[55] Sort, J .; Baltz, V.; Garcia, F.; Rodmacq, B. ; Dieny, B. Physical R eview B
2005, 71 , 054411.
[56] Macedo, W. A. A.; Sahoo, B.; Kuncser , V.; Eisenmenger, J .; Felner, 1. ;
Nogues, J. ; Liu, K. ; Keune, W .; Schuller , I. K. Physical R eview B 2004,
70, 224414.
[57] Gatel, C .; Snoeck, E.; Serin, V. ; Fert , A. The European Journal of Physics B
2005, 45, 157-168.
[58] Bianco, L. D.; Fior ani, D. ; Testa, A. M. ; Bonetti, E .; Signorini, L. Physical
R eview B 2004, 70, 052401.
[59] ljiri , Y. ; Borchers, J . A. ; Erwin, R. W. ; Lee, S.-H. ; van der Zaag, P. J. ;
Wolf, R. M. Physical R eview Letters 1998, 80, 608-611.
[60] Loffier , J. F .; Meier , J . P.; Doudin , B. ; Ansermet, J .-P. ; Wagner , W. Physical
R eview B 1998, 57, 2915-2924.
[61] Bizzotto, D. World Wide Web: www.chem.ubc.ca/personneljfaculty / bizzotto/,
Last accessed July 2005.
[62] Ashcroft, N. W. ; Mermin, N. D. Solid State Physics; Brooks/ Cole Thomas
Learning: Austalia, 1976.

90
[63] Joint Commission on Powder Diffraction Standards - International Centre for
Diffraction Data, "Powder Diffraction File", 2003.
[64] Dragoe, N. "Powder4 software", World Wide Web:
http: / jwww.ccp14.ac.uk/ ccpj web-mirrors/ ndragoe/ , Last accessed July 2005.
[65] Lasocha, W.; Lewinski, K. "Prozski", World Wide Web, Last accessed Fall 2003.
[66] Schwarzenbach, D. ''LATCON: Program for the LS-refinement of Lattice Con
stants" , 1975.
[67] Schwarzenbach, D.; Abrahams, S.C. ; Flack , H. D.; Gonschorek, W. ; Hahn, T. ;
Huml, K. ; Marsh , R. E.; Prince, E.; Robertson , B. E.; Wilson , J . S. R. A.
J. C. Acta Cryrstaollgraphica 1989, A45, 63-75.
[68] Schwarzenbach, D.; Abrahams, S. C.; F lack , H. D. ; Prince, E.; Wilson, A.
J. C. Acta Cryrstaollgraphica 1995, A51, 565-569.
[69] Azaroff, L. V.; Buerger , M. J . The Powder M ethod in X -ray Crystallography;
McGraw-Hill: New York, 1958.
[70] Goldstein, J . 1. ; Newbury, D. E.; Echlin , P.; Joy, D. C.; Fiori, C. ; Lifshin, E.
Scanning Electron Microscopy and X -Ray Microanalysis: A Text fo r Biologists,
Materials Scientists, and Geologists; Plenum Press: New York, 1981.
[71] Reimer, L. Scanning Electron Microscopy; Springer Series in Optical Sciences
Springer-Verlag: Berlin, 1985.

91
[72] Peulon, S. ; Antony, H. ; Legrand, L.; Chausse, A. Electrochimica A cta 2004,
49, 2891-2899.
[73] Zhang, Q .; Itoh, T.; Abe, M. IEEE Transactions On Magnetics 1994, 30,
4900-4902.
[74] Lemaire, B. J.; Davidson, P.; Ferre, J.; Jamet, J . P.; Panine, P.; Dozov, 1. ;
Jolivet , J. P. Physical Review Letters 2002, 88, 125507-1-4.
[75] Mironov, V. E.; Pashkov, G . L. ; Stupko, T. V.; Pavlovskaya, Z. A. Russian
Journal of Inorganic Chemistry 1994, 39, 1611-1614.
[76] Tarnawski , Z. ; Wiechec, A.; Madej , M.; Nowak, D. ; Owoc, D. ; Kr6l, G. ;
K:~,kol, Z. ; Kolwicz-Chodak, L.; Kozlowski, A.; Dawid, T . Acta Physica Polonica
A 2004, 106, 771-775.
[77] Garda, J. ; Subfas, G. Journal of Physics: Condensed Matter 2004, 16, R1 45-
R178.
[78] Poddar, P. ; Fried , T. ; Markovich, G.; Sharoni, A.; Katz, D.; Wizansky, T .;
Millo, 0 . Europhysics Letters 2003, 64, 98-103.
[79] Zeise, M. ; Blythe, H. Journal of Physics: Condensed Matter 2000, 12, 13-28.
[80] Lindley, R. A. ; Sena, S. P.; Blythe, H. J. ; Gehring, G. A. Journal de Physique
IV - France 1997, 7, C1-617-618.

92
[81] Sena, S. P.; Lindley, R. A.; Blythe, H. J .; Sauer, C .; Al-Karafji , M. ;
Gehring, G. A. Journal of Magnetism and Magnetic Materials 1997, 176, 111-
126.
[82] Yang, J . B. ; Zhou, X. D. ; Yelon, W. B. ; J ames, W. J. ; Cai, Q. ; Gopalakrish
nan, K. V.; Malik, S. K. ; Sun, X. C .; Nikles, D. E. Journal of Applied Physics
2004, 95, 7540-42.
[83] Liu, H.; Jiang, E. Y.; Zheng, R. K. ; Bai, H. L. Physica Status Solidi (a) 2004,
201, 739-744.
[84] Margulies, D. T .; Parker, F . T .; Spada, F . E.; Goldman, R. S.; Li, J .; Sin
clair, R. ; Berkowitz, A. E. Physical R eview B 1996, 53, 9175-9187.
[85] Seikh, M. M. ; Narayana, C.; Metcalf, P. ; Honig, J .; Sood, A. K. Phys. R ev. B
2005, 71, 174106-1-6.
[86] Dahlberg, E. D.; Zhu, J .-G. Physics Today 1995, 34-40.
[87] Wolf, S. A.; Awschalom, D. D.; Buhrman, R. A. ; Daughton, J. M.; von
Molnar, S. ; Roukes, M. L.; Chtchelkanova, A. Y. ; Treger , D. M. Science 2001 ,
294, 1488-1495.
[88] Alvarado, S. F .; Eib, W.; Meier , F .; Pierce, D. T.; Sattler , K.; Siegmann, H. C.;
Remeika, J . P. Physical R eview Letters 1975, 34, 319-322.

93
[89] Cheetham, A. K.; Day, P. Solid State Chemistry: Techn iques; Oxford University
Press: Oxford, 1987.