Embed Size (px)
Citation preview

2 0 1 4 A N N U A L R E P O R T

With the all-new 2015 COLO RADO , Chevrolet has reinvented the midsize pickup and earned recognition as Motor Trend’s 2015 Truck of the Year.

3
CUSTOMERS AT THE CENTER
At today’s GM, we put the customer at the center of everything
we do … customers like Bailey, who’s featured on our cover.
Her passion is riding and caring for her horses, Allegra and
Karma. She also loves her 2015 Chevrolet Colorado. But you
don’t have to take our word for it …
“To me, horseback riding isn’t just a hobby. It’s a lifestyle —
one I’ve loved for as long as I can remember. And I love
the way my Colorado fits that lifestyle. It’s eye-catching.
It’s dependable. And the four-wheel drive makes Chicago
snowstorms seem like any other day. It has space for
passengers, but it also gives me plenty of space for horse
supplies. Most importantly, I’m able to tow my ‘girls.’
“Chevys run in my family. My dad has a ’66 Corvette Stingray
and a 2002 Camaro — both red — and he’s always said he
wanted me to be a Chevy girl. And when I was little, my
trainer had an old Chevy and I can still remember to this
day telling my parents that someday I’d own one. Now I do!
“I’ve worked hard and earned everything I’ve got. I always
have … it’s how my folks raised me. And so have my horses.
More than once over the years, Allegra has fought back
from injuries and we’ve won competitions together.”
All around the world, we take pride in creating vehicles that
fit people’s lives … that meet their needs … that take them
where they want to go.
And it starts with putting customers at the center of it all,
working hard to earn their loyalty. For life.

4
LEADING THE WAY
The spirit of innovation and a passion for performance
are at the heart of every Chevrolet. For the customer, that
means our cars, trucks and crossovers combine engaging
performance, world-class safety features, head-turning
designs and purposeful technology — all while offering
great value.
From Detroit to São Paulo … from Los Angeles to New Delhi
to Shanghai and beyond … Chevrolet offers customers a
vehicle that meets their lifestyle — everything from the
Chevy Spark minicar and the best-selling Cruze midsize
sedan, to the longest-lasting, most dependable Chevy
Silverado full-size pickup and the iconic Corvette Stingray.
Chevy achieved nearly 4.8 million global sales and earned
more awards than any other manufacturer in 2014. And
our product lineup will become even fresher in 2015 as
the brand launches several key new vehicles — including
Camaro, Malibu, Spark and Volt.
Meanwhile, we’re continuing to build on the global success
of vehicles like the Trax, which is winning over customers in
the fast-growing small SUV market in China and the United
States. Or the Onix subcompact, which has the highest
resale value in Brazil, according to an AutoInforme survey.
In market after market, all around the world, Chevrolet is
a brand powered by design and innovation for the everyday
consumer. Whether it’s integrating Siri into our small cars,
or the corner-step rear bumper on Colorado, we’re leading
the way in giving our customers solutions that make their
lives better.

5
The all-new 2 0 1 5 CHEVROLET TRAX isn’t just any small SUV. With an array of street-smart features and technologies, it’s a new breed of SUV designed especially for city life.

6
The 2015 CADI L L AC CT S — pictured here against the Shanghai skyline — is just one of the models leading Cadillac’s rebirth as a true global luxury brand.

7
INSPIRING PASSION AND LOYALTY
We see it over and over again: Customers
who buy our brands car after car … from a
first car for college … to a crossover for toting
a growing family … to a luxury model that’s a
well-earned reward for career goals achieved.
And we’re determined to keep it that way.
Consider, for example, the Cadillac brand.
Over the years, it represented the very pinnacle
of American automotive achievement. The
word “Cadillac” itself became a synonym for
the highest standard in class, regardless of
industry or product category.
In today’s changing marketplace, Cadillac
is reclaiming that standard, as it undergoes
a global transformation. We’re challenging
our competitors head-on, with cars that can
beat their very best. These are vehicles at
the forefront of performance and technology
... bristling with expressive designs and
exhilarating driving dynamics.
Nowhere is that more true than in China.
It’s now our second-largest market, and
growing fast. Our assembly plant in China
began producing its second model, the ATS-L,
in 2014 and we expect a second China plant
to come online in 2015.
Meanwhile, Cadillac continues to launch
exciting new models, like its new top-of-the-
range car, the 2016 Cadillac CT6. In addition
to using advanced techniques for lighter weight
and more efficient performance, this new luxury
sedan will also deliver new technologies that
enhance safety and connectivity.
Around the world, this is a brand — 112-years-
young — that’s reinventing itself. And it’s just
one example of our commitment to deliver
brands that inspire passion and loyalty.
The word “Cadillac” itself has become a synonym for the highest standard in class, regardless of industry or product category.

8
SUCCESS BUILT ON QUALITY
AND EXCELLENCE
Earning customers for life begins with an intense focus
on those customers … from designers and engineers who
listen and respond to their feedback on their car, truck or
crossover, and seek their input in focus groups on future
vehicles … to production workers who always have the
customer in mind in their zero-defect mentality and their
passion to build the best vehicles we’ve ever offered.
That’s part of the spirit behind GM’s resurgence in Europe,
where our Opel/Vauxhall team is launching a major product
offensive that aims to deliver 27 new models and 17 new
engines by 2018. It’s being led by models like the Opel Corsa
and ADAM, which are attracting a large and loyal following —
and earning award after award in the process. Meanwhile,
the brand-new Karl subcompact is generating quite a buzz.
We’re backing this growing success with an aggressive,
multibillion dollar investment program, including a
245 million euro investment to prepare Opel’s assembly
plant in Rüsselsheim, Germany, to produce a new flagship
SUV. We’ll invest more than a half-billion euro in engine
and transmission plants in Rüsselsheim and Kaiserslautern,
Germany, and Tychy, Poland, enabling Opel/Vauxhall to
provide even more fuel-efficient engines and transmissions
for customers throughout Europe.
And that’s just one example of our commitment to invest
in our products … our people … our future.

9
At Opel/Vauxhall, the commitment and craftsmanship of employees like Gero and his team are taking hold. For the second year in a row, we’ve grown market share — actually increasing our share in more than 12 different markets.

10
The built-in 4G LTE connection in the 2014 BUICK E NCORE offers drivers advances in a wide range of in-vehicle communications and entertainment capabilities.

11
A TASTE OF TOMORROW ... TODAY
Across all our brands, as we work to develop new vehicle
technologies, we’re imagining a world where cars never crash
… where they communicate with each other, with the roads
beneath them, and with the world around them … where our
cars actually do the driving. It’s all part of our vision of how
the future of transportation will change our customers’ lives.
But some elements of that future are already here. We
offer the most vehicles with 4G LTE connectivity by OnStar
that turns your car into your most powerful and interactive
mobile device. That includes an available built-in Wi-Fi
hotspot that keeps you and your passengers seamlessly
connected to people, music, news, movies and more. It
gives your passengers the freedom to recreate their world
inside your vehicle while you navigate the world beyond it.
And with such active safety technologies as adaptive cruise
control, side blind zone warning and automatic park assist,
we’re making the driving experience easier and more
enjoyable, while making it much safer.
Meanwhile, we’re continuing to expand the frontiers of clean,
sustainable electric vehicle technology with new models
like the next-generation Chevy Volt and an all-new next-
generation electric vehicle based on the Bolt EV concept.
For us, it’s all about translating breakthrough technologies
into vehicles and experiences people love.
12
STRENGTHENING OUR COMMUNITIES
Building cars people love is just part of what
we do at GM. We also build relationships that
reach out into the communities where we live
and work. GM, our employee team and the
General Motors Foundation are on the front
lines of our efforts to make those communities
better — from our United Way partnership
to providing scholarships and mentoring
students, to building houses and refurbishing
schools through our plant city grant program,
to educating parents on child safety through
our work with Safe Kids Worldwide.
And we’re doing it on a global scale. As the
founding sponsor of the One World Play Project,
Chevrolet is committed to providing 1.5 million
ultra-durable footballs (soccer balls) to youth
in war-stricken zones, refugee camps, disaster
areas and other underprivileged communities
around the world.
GM China is working to reduce vehicle-
related child injuries and raise public
awareness of child safety in and around
vehicles with the recent launch of Safe Kids
China. To date 13,000 children and their
families have benefited from the program.
As part of our commitment to STEM education,
GM is a founding sponsor of the FIRST®
Robotics Competition (FRC®), supporting
hundreds of teams and thousands of students
around the world. In Mexico, for example,
GM employees mentor seven teams, and our
company sponsors part of the competition
in which all 39 Mexican teams participate.
Meanwhile, GM India has joined with some
local schools to help support the basic
educational needs of children in underprivileged
communities, and we’re also actively involved
in promoting child vehicle safety awareness.
In Colombia, GM South America’s Pacto Motor
program provides young adults from families
with the most serious financial need the
technical and vocational education and training
for a career in automotive service and repair.
From the cars we design and build to the
customers we serve to the community needs
we meet, we are all in with giving our best each
and every day. You’ll see in the following pages
what our spirit and determination accomplished
in a pivotal year for our company.

13
Children in Myanmar experience the power of play, courtesy of Chevrolet’s One World Play Project. Photo: OWPP/Sonderman

14
General Motors Chief Executive Officer Mary T. Barra with the advanced-technology luxury sedan, the all-new 2016 CADILLAC CT6 — fresh from its global debut at the 2015 New York Auto Show.

15
TO OUR STOCKHOLDERS
2014 was a defining year for GM.
The extraordinary challenges we faced with the ignition switch recall and additional
recalls were the ultimate test of our team and our priorities. As we faced these
challenges, we demonstrated our recently refined core values. We confronted our
problems and acknowledged our shortcomings. It was a very difficult year in many
ways, but we are a stronger company because of the way we responded to the crisis.
As the situation unfolded, we were guided
by two principles. First, do the right thing
for those who were affected by the switch
failures; and second, accept responsibility
for our mistakes and commit to doing
everything within our power to prevent
this problem from ever happening again.
In a global meeting with all GM employees last
June, I told them I never want anyone in the
company to put what happened behind them.
This experience must be permanently etched
in our memories because we never want it to
happen again. To fulfill this promise, we made
a public commitment to become the industry
leader in safety. We have made progress on this
promise, but understand there is more to do.
The demands of the recalls were significant.
At the same time, we felt strongly that we
couldn’t use this situation as an excuse for
a disappointing year financially. Successful
businesses find a way to perform, regardless
of the challenges they face. Our performance
wasn’t perfect, but we delivered solid returns.
As I reflect on this past year, I am most proud of
the men and women of General Motors. Under
difficult circumstances, they demonstrated their
character, determination, and commitment to
our customers.
Earlier this year, Consumer Reports named the 2 014 BUICK REGAL its top sports sedan, as Buick set its second consecutive annual global sales record. Sales in 2014 reached nearly 1.2 million vehicles, including more than 900,000 in China.

16
In 2014, we earned net income to common
stockholders of $2.8 billion, including recall-
related costs. Absent special items, net income
would have been $5.2 billion. Turning to EBIT-
adjusted results, we earned $6.5 billion, which
included $2.8 billion in recall-related expenses.
Net revenue increased by about $500 million
to $155.9 billion. Our adjusted automotive free
cash flow was $3.1 billion. These results are
important because this is the first year since
2010 that the company met its target for core
operating financial performance.
The results of 2014 are illustrative of what GM
can do as we become more sharply focused.
Among the year’s many highlights:
• Our China joint ventures delivered record
sales, market share and earnings.
• In North America, through the end of 2014
we delivered six consecutive quarters, year
over year, of improved core operating EBIT-
adjusted margins. Market share held steady
despite the impact of recalls.
• In Europe, Opel/Vauxhall enjoyed its second
consecutive year of sales and share growth.
• In South America, we posted a small
loss, but even as conditions became more
challenging, the team finished the year
with three consecutive, quarter to quarter,
improved EBIT-adjusted results.
• GM Financial continues to contribute to
solid earnings.
Looking to 2015 and beyond, we have made
company-wide changes so we are more attuned
to the needs and expectations of customers.
We are more united as a leadership team in
our purpose and direction. And we are putting
concrete strategies and plans in place that will
help us achieve our goal of becoming the most
valued automotive company.
2015 OP EL C ORSA

17
I believe we will see more changes in the
automotive sector in the next five years
than we have seen in the last 50. We are
on the verge of a revolution in personal
transportation. Vehicles will become
dramatically safer, more fuel efficient and
cleaner than anyone thought possible even
a few years ago. The impact on the industry,
communities around the globe and hundreds
of millions of consumers will be profound.
I have been in this industry my entire career
and this is by far the most exciting time I have
experienced. The competition is fierce. The
technological advances are dramatic and
regulatory changes are far reaching. But the
opportunity to build the next generation of cars,
trucks and crossovers that will improve millions
of lives is incredibly motivating to all of us at
GM. Our mission at GM is to be the industry
leader in this era of transformative change.
As we add the latest technology to vehicles, we
will remain focused on our customers. We want
to earn customers for life. We want customers
to know that they can count on GM for industry
leading quality, safety and reliability, as well as
for translating breakthrough technologies into
vehicles and experiences that they love. Most
importantly, we want customers to know that,
in partnership with our dealers, they will be
valued and respected throughout their entire
ownership experience.
Accountability is the foundation for any
organization’s success. A company, like an
individual, becomes known for whether or
not it keeps its word. More than anything
else, we want people to know that GM can
be counted on to act with integrity, to keep
its commitments and honor its relationships
with all stakeholders. Financially, we will
work to make prudent investments for the
future while delivering strong results in the
short term. We will continue to expand our
efforts to strengthen our brands and better
serve the needs and desires of our customers.
One great example of our ability to lead is
the new Chevrolet Colorado and GMC Canyon
midsized pickups. Many industry experts
believed the midsized truck segment was
dead. It had shrunk significantly over the last
decade or so, and most manufacturers had
dropped out of the segment.
Yet after listening carefully to customers,
and relying on our own instincts, we saw an
opportunity. We concluded there was demand
for an all-new, midsized truck, and we put a
plan in place to meet this need. It was not an
easy call, but it was the right one. The trucks
The competition is fierce. Our mission at GM is to be the industry leader in this era of transformative change.

18
have received rave reviews and numerous
awards, including Motor Trend’s Truck of the
Year and Autoweek’s Best of the Best Truck.
We have 10 distinct brands around the globe
and we are working to strengthen each of
them to inspire passion and loyalty in the
markets they serve.
A critical component of GM’s business plan is
to restore Cadillac to a position of leadership
in the global luxury segment. We took a
significant step late last year by establishing
Cadillac as a separate business inside General
Motors. The brand experienced a 5 percent
sales increase in 2014, led by a 47 percent
increase in sales in China and the resounding
success of the new Escalade.
The luxury segment is an important part of
the auto business today, and it’s going to be
even more important over the next decade.
By 2020, the luxury segment is expected to
expand globally by 35 percent or more. To take
advantage of this rising tide of sales, we are
investing heavily in new product for Cadillac.
Over the next five years, we intend to launch
eight new models, several of which will be new
segments for the brand.
Another element of our strategy for Cadillac is
to position the brand as the flagship for industry
leading technology. In the 2017 model year, we
plan to introduce vehicle-to-vehicle connectivity
and Super Cruise, a GM developed system
that allows drivers in certain circumstances
to operate the vehicle without touching the
steering wheel or pedals.
It will take time to see results, but we have
confidence that, as we execute our strategy,
Cadillac sales will grow over the next few years.
Chevrolet performed well in 2014, with sales up
4 percent in the U.S. The new Silverado, Tahoe
and Suburban had great sales momentum and
they each gained market share. Chevrolet also
had record sales in China, and it retained its
market leadership in South America.
With more than 70 million customers around
the world, Chevrolet is one of the best
positioned auto brands in the industry. Our
challenge is to better leverage Chevrolet’s
extraordinary assets so it can continue to
grow in the U.S., while expanding rapidly in
China, Brazil and other developing markets.
An example of Chevrolet’s potential is the
all-new Trax, a small crossover that competes
in one of the fastest-growing segments in the
To take advantage of this rising tide of sales, we are investing heavily in new product for Cadillac. Over the next five years, we intend to launch eight new models, several of which will be new segments for the brand.
19
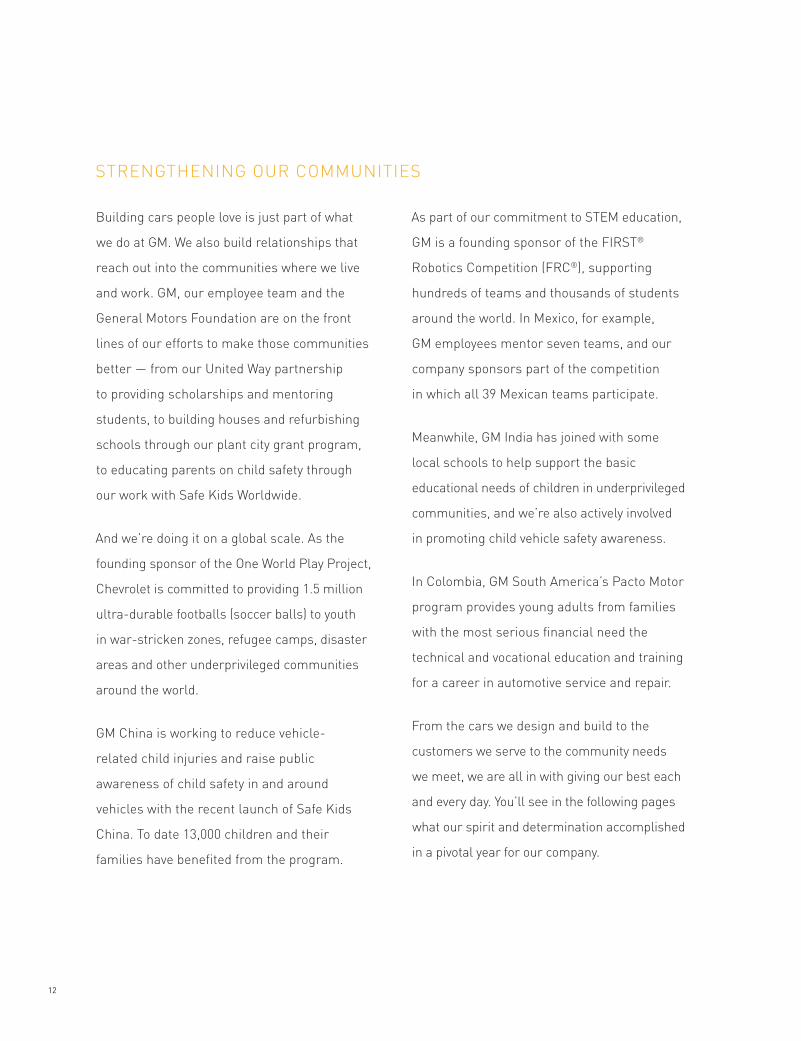
U.S. and China. Following the Trax, we have a
full pipeline of strong new products launching
over the next 12 months. Starting late this year,
we will launch new versions of the Malibu and
Equinox, which compete in two of the world’s
largest vehicle segments. All-new versions
of the Spark, Volt and Camaro will also make
their debuts.
Opel/Vauxhall continues to execute its plan
for growth and profitability. With successful
products such as Mokka and ADAM, Opel/
Vauxhall delivered sales of nearly 1.1 million
last year. This was the second year in a row
Opel/Vauxhall gained market share. To keep
our momentum going, we launched the fifth
generation of the Corsa in early 2015. The
new Karl small car and Astra will follow later
this year. Astra and Corsa represent about
half of Opel/Vauxhall’s volume.
Rebuilding Opel has taken resolve, discipline
and a lot of hard work. We believe we have
the right plan, a strong leadership team and a
company-wide commitment to Opel’s future.
Buick continues to be a style leader and a
core component of our growth strategy in
China. With sales of nearly 1.2 million in 2014,
including more than 900,000 in China, Buick is
a great example of how GM’s global scale can
be leveraged to produce value for stockholders.
Buick is also a great example of the quality
of our vehicles and the strength of our dealer
network. Consumer rating organizations, such
as J.D. Power and Associates and Consumer
Reports, consistently rank Buick among the
top automotive brands for reliability and
dealer service.
The GMC brand is defined as Professional
Grade — a commitment to premium materials,
purposeful design and advanced technology in
every vehicle. We are enhancing our marketing
efforts and exploring a number of ways to
further expand GMC’s product offerings. Going
The all-new 2 0 1 6 CHEVY MALIBU

20
The all-new 2016 BUICK E NVISION
forward, we will continue to invest in the brand
because of GMC’s strong brand identity and
growth potential.
GM Financial is another critical part of our
growth strategy. As we expand our ability to
offer customers financing and leasing, it is an
important resource for fulfilling our ambition of
earning lifetime relationships with customers.
GM Financial currently operates in 19 countries
that account for approximately 80 percent of
GM’s sales. Now that it is the exclusive lease
provider for Chevrolet, Buick, GMC and Cadillac,
GM Financial’s growth and profitability should
increase substantially.
Across all of our brands, we are leading the
industry in connectivity. Our commitment to
offer 4G LTE and OnStar on a global basis is
creating a significant competitive advantage
for GM. In North America, we installed 4G LTE
on more than 30 models — 16 Chevrolet,
4 Buick, 6 GMC and 5 Cadillac — by far the most
in the industry. Our service includes a built-
in Wi-Fi hot spot capable of connecting up to
seven devices. It also enhances the connection
to OnStar, making it the best in-vehicle safety
system available from any manufacturer.
We are accelerating the integration of OnStar
and 4G LTE in China and Europe as well.
OnStar launched in China in 2009, and today
it is the largest telematics provider in the
country with more than 850,000 subscribers.
Later this year we expect to begin offering
4G LTE on select Cadillac models in China.
Opel/Vauxhall will launch OnStar with 4G LTE
capabilities in 13 European markets this year,
with no additional roaming charges. OnStar will
be available across the Opel/Vauxhall car range,
and interactions with our advisors, in-vehicle
voice prompts, the radio display and mobile
app will be in the customers’ chosen language.

21
With these services, we are making sure our
customers have more than just a great vehicle,
they have a great ownership experience.
The electrification of the automobile is an
important part of our future as well. On this
front, we are making rapid and dramatic
progress. Consumers have purchased more
than 75,000 Volts, and we know two things from
their collective experience. First, owners love
the vehicle. The Volt’s customer satisfaction
ratings are among the highest in the industry.
Second, they rarely buy gasoline. The typical
Volt customer is averaging about 100 miles per
gallon, which translates to a fill-up about once
a month.
Building on our experience with the first
generation Volt, we revealed a second-
generation model and a new electric concept
car at the North American International Auto
Show in January. The concept vehicle, known as
the Bolt EV, is an all-electric vehicle that will go
200 miles on a charge and cost roughly $30,000.
Following a positive response from consumers,
we recently confirmed we will build the car in
our Orion Assembly facility near Detroit.
As we consider the progress of the last few
years, we believe we are on track to meet
our 2016 financial targets, which include
10 percent EBIT-adjusted margins in North
America, profitability in Europe, sustained
strong margins in China and continued
progress in emerging markets.
In addition, in February we announced our
intent to increase the second quarter dividend
on our common stock by 20 percent to 36 cents
per share. And, in March we announced a
capital allocation framework that provides
for reinvestment in the business, maintains
an investment grade balance sheet and
anticipates the return of all available free cash
flow to stockholders, including a $5-billion
share buyback.
During 2015, we expect to sell more than
1,000 new vehicles per hour, 24 hours a day.
This adds up to nearly 10 million vehicles, the
most in our history. I look at this extraordinary
volume as 10 million opportunities to prove
what kind of company we are. I believe we
are stronger than we were a year ago. I also
believe we will continue to gain strength this
year and in the years ahead.
Respectfully,
MARY T. BARRAChief Executive Officer
April 24, 2015
Today’s Chevy Volt customers average about 100 miles per gallon, which should be even better with the all-new 2 0 1 6 CHEVROLET VOLT .
22
FINANCIAL CONTENTS
21 Vehicle Sales and Net Revenue
22 Board and Management Team
24 Reconciliation of Non-GAAP Measures
27 Market for Registrant’s Common Equity and Related Stockholder Matters
28 Selected Financial Data
29 Management’s Discussion and Analysis of Financial Condition and Results of Operations
59 Quantitative and Qualitative Disclosures About Market Risk
66 Financial Statements and Supplementary Data
66 Consolidated Income Statements
67 Consolidated Statements of Comprehensive Income
68 Consolidated Balance Sheets
69 Consolidated Statements of Cash Flows
70 Consolidated Statements of Equity
71 Notes to Consolidated Financial Statements
134 Disclosure Controls and Procedures
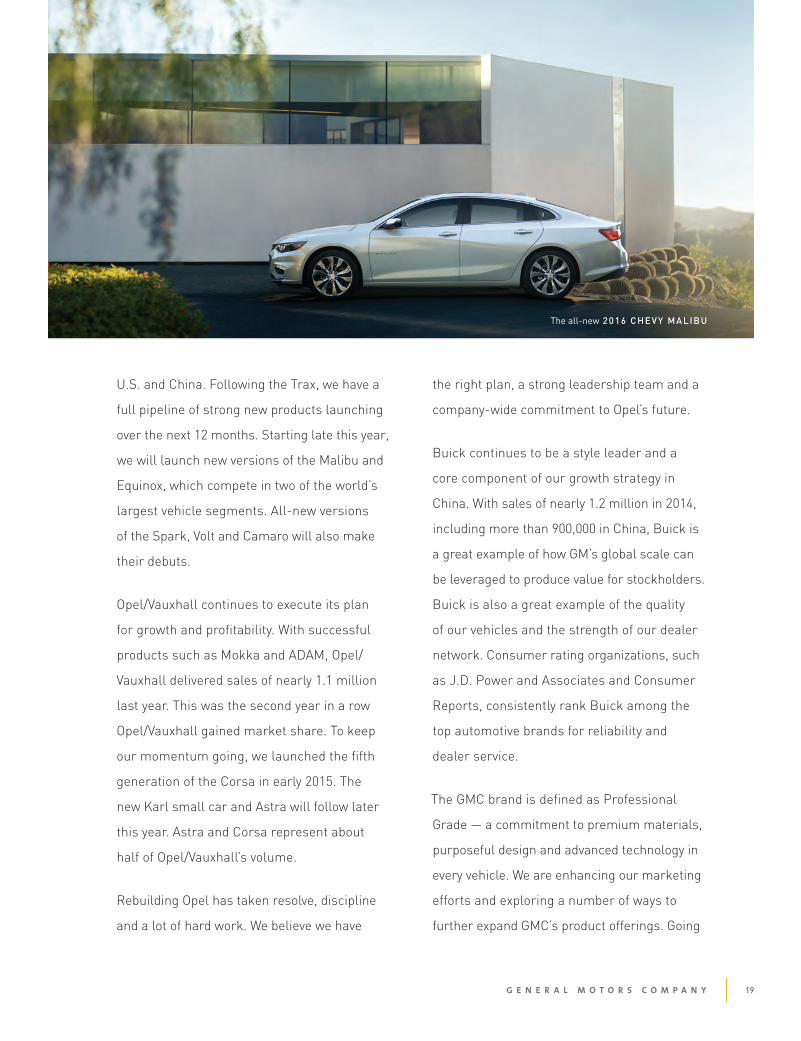
HIGHLIGHTS
Source: Bloomberg
CUMULATIVE VALUE OF $100 INVESTMENT THROUGH DECEMBER 31, 2014
11/18/2010 2010 2011 2012 2013 2014
$100 $111.70 $ 61.42 $ 87.36 $123.85 $109.51
$100 $106.94 $109.20 $126.68 $167.71 $190.66
$100 $104.10 $ 87.40 $108.68 $144.26 $138.00
General Motors Company
Dow Jones Automobiles & Parts Titans 30 Index
S&P 500 Stock Index
WORLDWIDE NET SALES & REVENUE
$156B
NET INCOME ATTRIBUTABLE TO COMMON STOCKHOLDERS
$2.8B
$1.65DILUTED EARNINGS PER COMMON SHARE
COMPARISON OF CUMULATIVE TOTAL RETURN
$ 200
$ 180
$ 160
$ 140
$ 120
$ 100
$ 80
$ 60
$ 40
NOV 2010
DEC2010
DEC2011
DEC2012
DEC2013
DEC2014

23
VEHICLE SALES AND NET REVENUE
(in millions, except units per share & employment) 2013 2014
VEHICLE SALES, INCLUDING JOINT VENTURES - (OOO’S UNITS)
GMNA 3,234 3,413
GME 1,393 1,256
GMIO 4,058 4,378
GMSA 1,037 878
Worldwide Vehicle Sales 9,722 9,925
FINANCIAL RESULTS
Worldwide Net Sales & Revenue $ 155,427 $ 155,929
Earnings Before Interest and Income Taxes - Adjusted* $ 8,578 $ 6,494
Net Income Attributable to Common Stockholders $ 3,770 $ 2,804
Diluted Earnings Per Common Share $ 2.38 $ 1.65
AUTOMOTIVE LIQUIDITY & KEY OBLIGATIONS
AVAILABLE AUTOMOTIVE LIQUIDITYCash and Marketable Securities $ 27,919 $ 25,202
Credit Facilities 10,404 12,026
Total Available Automotive Liquidity $ 38,323 $ 37,228
KEY AUTOMOTIVE OBLIGATIONSDebt $ 7,137 $ 9,410
Underfunded U.S. Pension 7,314 10,901
Total Automotive Obligations $ 14,451 $ 20,311
ADJUSTED AUTOMOTIVE FREE CASH FLOW
Operating Cash Flow $ 11,021 $ 10,132
Less: Capital Expenditures (7,549 (7,039
Adjustments 225 53
Adjusted Automotive Free Cash Flow $ 3,697 $ 3,146
EMPLOYMENT - YEAR END (000’S)
GMNA 109 110
GME 37 37
GMIO 36 33
GMSA 31 29
GM Financial 6 7
Worldwide Employment 219 216
*Includes GM Financial on an Earnings Before Tax (EBT)-adjusted basis
))

24
BOARD OF DIRECTORS As of April 1, 2015
Beginning on left:
KATHRYN MARINELLOSenior Advisor, Ares Management LLC, Joined Board 07/10/09
JOSEPH ASHTONRetired Vice President, United Auto Workers, Joined Board 08/11/14
CAROL STEPHENSONRetired Dean, Ivey Business School, Univ. of Western Ontario, Joined Board 07/24/09
ERROLL DAVIS Retired, Superintendent for Atlanta Public Schools, Joined Board 07/10/09
THEODORE SOLSOChairman of the Board, General Motors Company and Retired Chairman and Chief Executive Officer, Cummins Inc., Joined Board 06/12/12
MARY BARRAChief Executive Officer, General Motors Company, Joined Board 01/15/14
MICHAEL MULLENRetired Chairman, Joint Chiefs of StaffJoined Board 02/01/13
JAMES MULVARetired Chairman and Chief Executive Officer, ConocoPhillips, Joined Board 06/12/12
THOMAS SCHOEWERetired Executive Vice President and Chief Financial Officer, Wal-Mart Stores, Inc., Joined Board 11/14/11
PATRICIA RUSSOFormer Chief Executive Officer, Alcatel-Lucent S.A., Joined Board 07/24/09
STEPHEN GIRSKYPresident, S. J. Girsky & Company, Joined Board 07/10/09
Not Pictured:
E. NEVILLE ISDELLRetired Chairman and Chief Executive Officer, The Coca-Cola Company, Joined Board 07/10/09
LINDA GOODENRetired Executive Vice President, Information Systems & Global Solutions, Lockheed Martin CorporationJoined Board 02/05/15
Above: The General Motors Board of
Directors enjoyed a preview of the
CHEVROLET BOLT EV CONCEPT CAR,
as it debuted at the 2015 North American
International Auto Show in Detroit. Based
on an equally enthusiastic response from
consumers, GM has committed to build
a production version at its Orion, Mich.,
assembly facility. The next generation
electric vehicle based on the Bolt EV
concept will have more than 200 miles
of range — translating to more trips to
work, school or the market on a single
charge. The Bolt EV concept is a true
game-changer. It’s a more affordable
pure electric option — an EV for everyone.
And it’s packed with the kind of innovation
that raises the bar for electric vehicles
around the globe.

25
MANAGEMENT TEAM As of April 1, 2015
MARY BARRAChief Executive Officer
DAN AMMANNPresident
JAIME ARDILAExecutive Vice President & President, South America
ALAN BATEYExecutive Vice President & President, North America
DAN BERCESenior Vice President & President and Chief Executive Officer, GM Financial
ALICIA BOLER-DAVISSenior Vice President, Global Connected Customer Experience
TONY CERVONESenior Vice President, Global Communications
JIM DELUCAExecutive Vice President, Global Manufacturing
JOHAN DE NYSSCHENExecutive Vice President & President, Cadillac
BOB FERGUSONSenior Vice President, Global Public Policy
CRAIG GLIDDENExecutive Vice President & General Counsel
STEFAN JACOBYExecutive Vice President & President, GM International
GRACE LIEBLEINVice President, Global Quality
VICTORIA MCINNISVice President, Tax and Audit
RANDY MOTTSenior Vice President, Global Information Technology & Chief Information Officer
KARL-THOMAS NEUMANNExecutive Vice President & President, EuropeChairman of the Management Board of Opel Group GmbH
JOHN QUATTRONESenior Vice President, Global Human Resources
NIHARIKA TASKAR RAMDEVVice President, Finance & Treasurer
MARK REUSSExecutive Vice President, Global Product Development, Purchasing & Supply Chain
BOB SHROSBREEActing Secretary
CHUCK STEVENSExecutive Vice President & Chief Financial Officer
TOM TIMKOVice President, Controller & Chief Accounting Officer
MATT TSIENExecutive Vice President & President, GM China
ED WELBURNVice President, Global Design

26
GENERAL MOTORS COMPANY AND SUBSIDIARIES RECONCILIATION OF NON-GAAP MEASURES The accompanying Letter to Stockholders includes earnings before interest and taxes adjusted for special items (EBIT-adjusted) and Adjusted
automotive free cash flow which are not prepared in accordance with Accounting Principles Generally Accepted in the United States of America (U.S.
GAAP) and have not been audited or reviewed by GM’s independent auditors. EBIT-adjusted and Adjusted automotive free cash flow are considered
non-GAAP measures.
Management believes these non-GAAP measures provide meaningful supplemental information regarding GM’s operating results and liquidity
because they exclude amounts that management does not consider when assessing and measuring operational and financial performance.
Management believes these measures allow it to readily view operating trends, perform analytical comparisons and benchmark performance
between periods and among geographic regions. GM believes these non-GAAP measures are useful in allowing for greater transparency of GM’s
core operations and they are therefore used by management in its financial and operational decision-making.
While management believes that these non-GAAP measures provide useful information, they are not operating measures under U.S. GAAP, and
there are limitations associated with their use. GM’s calculation of these non-GAAP measures may not be completely comparable to similarly titled
measures of other companies due to potential differences between companies in their method of calculation. As a result, the use of these non-GAAP
measures has limitations and should not be considered in isolation from, or as a substitute for, other measures such as Net income or Net income
attributable to common stockholders. Due to these limitations, these non-GAAP measures are used as a supplement to U.S. GAAP measures.
The following table summarizes the reconciliation of EBIT-adjusted to its most comparable U.S. GAAP measure (dollars in millions):
(a) GM’s automotive operations’ interest income and interest expense are recorded centrally in Corporate.
(b) GM Financial amounts represent income before income taxes.
In the year ended December 31, 2013, adjustments to automotive free cash flow included the following:
• Accrued interest on the prepayment of the Health Care Trust notes of $154 million;
• Pension contributions of $71 million related to the previously announced annuitization of the U.S. salaried pension plan.
In the year ended December 31, 2014, adjustments to automotive free cash flow included the following:
• Pension contributions of $53 million related to the previously announced annuitization of the U.S. salaried pension plan.
In the year ended December 31, 2013, special items for EBIT-adjusted included the following:
• Impairment charges of property and intangible assets of $774 million in GMIO;• Costs related to our plans to cease mainstream distribution of Chevrolet brand
in Europe of $621 million in GMIO, and $15 million in GM Financial;• Gain related to reversal of GM Korea wage litigation accrual of $577 million in
GMIO;• Gain on sale of equity investment in Ally Financial of $483 million in Corporate;
• Goodwill impairment charges of $442 million in GMIO;• Venezuela currency devaluation loss of $162 million in GMSA;• Gain on sale of equity investment in PSA of $152 million in GME;• Noncontrolling interests related to redemption of the GM Korea mandatorily
redeemable preferred shares of $67 million in GMIO;• Pension settlement charges of $56 million in GMNA;• Charges related to PSA product development agreement of $49 million
in GMNA; and• Income related to various insurance recoveries of $35 million.
In the year ended December 31, 2014, special items for EBIT-adjusted included the following:
• Catch-up adjustment related to the change in estimate for recall campaigns of $874 million in GMNA;
• Venezuela currency devaluation loss of $419 million in GMSA;• Charge related to the funding of the ignition switch recall compensation
program of $400 million in Corporate;• Asset impairment charges in Russian subsidiaries of $245 million in GME;• Asset impairment charges in Thailand subsidiary of $158 million in GMIO;• Goodwill impairment charges of $120 million in GMSA;• Charges related to flood damage, net of insurance recoveries,
of $101 million in GMNA; and• Other charges of $10 million.
2013 2014
OPERATING SEGMENTS
GMNA(a) $ 7,461 $ 6,603
GME(a) (869 (1,369
GMIO(a) 1,255 1,222
GMSA(a) 327 (180
GM Financial(b) 898 803
Total operating segments(b) 9,072 7,079
Corporate and eliminations (494 (585
EBIT-ADJUSTED (B) 8,578 6,494
Special items (805 (2,327
Automotive interest income 246 211
Automotive interest expense (334 (403
Gain (loss) on extinguishment of debt (212 202
Net income (loss) attributable to noncontrolling interests (15 69
Income Before Income Taxes $ 7,458 $ 4,246
) )
)
) )
) )
) )
)
)
GMIO;

GENERAL MOTORS COMPANY AND SUBSIDIARIES
Market Information
Shares of our common stock have been publicly traded since November 18, 2010 when our common stock was listed and begantrading on the New York Stock Exchange and the Toronto Stock Exchange. The following table summarizes the quarterly priceranges of our common stock based on high and low prices from intraday trades on the New York Stock Exchange, the principalmarket on which the stock is traded:
Years Ended December 31,
2014 2013
High Low High Low
First quarter . . . . . . . . . . . . . . . . . . . . . . . . . . . . . . . . . . . . . . . . . . . . . . . . . . . . . . . . . . . . $ 41.06 $ 33.57 $ 30.68 $ 26.19Second quarter . . . . . . . . . . . . . . . . . . . . . . . . . . . . . . . . . . . . . . . . . . . . . . . . . . . . . . . . . $ 37.18 $ 31.70 $ 35.49 $ 27.11Third quarter . . . . . . . . . . . . . . . . . . . . . . . . . . . . . . . . . . . . . . . . . . . . . . . . . . . . . . . . . . . $ 38.15 $ 31.67 $ 37.97 $ 33.41Fourth quarter . . . . . . . . . . . . . . . . . . . . . . . . . . . . . . . . . . . . . . . . . . . . . . . . . . . . . . . . . . $ 35.45 $ 28.82 $ 41.85 $ 33.92
Holders
At January 28, 2015 we had a total of 1.6 billion issued and outstanding shares of common stock held by 420 holders of record.
Dividends
Since our formation, we had not paid any dividends on our common stock through the year ended December 31, 2013. Beginning inthe first quarter of 2014 our Board of Directors declared, and we paid, quarterly dividends on common stock in the amount of $0.30per share. It is anticipated that dividends on our common stock will continue to be declared and paid quarterly. However our paymentof dividends in the future, if any, will be determined by our Board of Directors and will be paid out of funds legally available for thatpurpose. Our payment of dividends in the future will depend on business conditions, our financial condition, earnings, liquidity andcapital requirements and other factors.
* * * * * * *
27

GENERAL MOTORS COMPANY AND SUBSIDIARIES
Selected Financial Data
Selected financial data is summarized in the following table (dollars in millions except per share amounts):
At and for the Years Ended December 31,
2014 2013 2012 2011 2010
Income Statement Data:Total net sales and revenue . . . . . . . . . . . . . . . . . . . . . . . . . . . . . . . . . $ 155,929 $ 155,427 $ 152,256 $ 150,276 $ 135,592Income from continuing operations (a) . . . . . . . . . . . . . . . . . . . . . . . . $ 4,018 $ 5,331 $ 6,136 $ 9,287 $ 6,503Net income attributable to stockholders . . . . . . . . . . . . . . . . . . . . . . . $ 3,949 $ 5,346 $ 6,188 $ 9,190 $ 6,172Net income attributable to common stockholders (b) . . . . . . . . . . . . . $ 2,804 $ 3,770 $ 4,859 $ 7,585 $ 4,668Basic earnings per common share (c) . . . . . . . . . . . . . . . . . . . . . . . . . $ 1.75 $ 2.71 $ 3.10 $ 4.94 $ 3.11Diluted earnings per common share (c) . . . . . . . . . . . . . . . . . . . . . . . . $ 1.65 $ 2.38 $ 2.92 $ 4.58 $ 2.89Dividends declared per common share . . . . . . . . . . . . . . . . . . . . . . . . $ 1.20 $ — $ — $ — $ —Balance Sheet Data:Total assets (d) . . . . . . . . . . . . . . . . . . . . . . . . . . . . . . . . . . . . . . . . . . . $ 177,677 $ 166,344 $ 149,422 $ 144,603 $ 138,898Automotive notes and loans payable . . . . . . . . . . . . . . . . . . . . . . . . . . $ 9,410 $ 7,137 $ 5,172 $ 5,295 $ 4,630GM Financial notes and loans payable (d) . . . . . . . . . . . . . . . . . . . . . $ 37,431 $ 29,046 $ 10,878 $ 8,538 $ 7,032Series A Preferred Stock (b) . . . . . . . . . . . . . . . . . . . . . . . . . . . . . . . . $ — $ 3,109 $ 5,536 $ 5,536 $ 5,536Series B Preferred Stock (e) . . . . . . . . . . . . . . . . . . . . . . . . . . . . . . . . . $ — $ 4,855 $ 4,855 $ 4,855Equity (f) . . . . . . . . . . . . . . . . . . . . . . . . . . . . . . . . . . . . . . . . . . . . . . . $ 36,024 $ 43,174 $ 37,000 $ 38,991 $ 37,159
(a) In the year ended December 31, 2014 we recorded charges of approximately $2.9 billion in Automotive cost of sales related to recall campaignsand courtesy transportation, a catch-up adjustment of $0.9 billion recorded in the three months ended June 30, 2014 related to the change inestimate for recall campaigns and a charge of $0.4 billion related to the ignition switch recall compensation program. In the year endedDecember 31, 2012 we recorded Goodwill impairment charges of $27.1 billion, the reversal of deferred tax valuation allowances of $36.3billion in the U.S. and Canada, pension settlement charges of $2.7 billion and General Motors Europe (GME) long-lived asset impairmentcharges of $5.5 billion.
(b) In December 2014 we redeemed all of the remaining shares of our Series A Preferred Stock for $3.9 billion, which reduced Net incomeattributable to common stockholders by $0.8 billion. In September 2013 we purchased 120 million shares of our Series A Preferred Stock heldby the UAW Retiree Medical Benefits Trust (New VEBA) for $3.2 billion, which reduced Net income attributable to common stockholders by$0.8 billion.
(c) In the years ended December 31, 2012 and 2011 we used the two-class method for calculating earnings per share as the Series B Preferred Stockwas a participating security. Refer to Note 22 to our consolidated financial statements for additional detail.
(d) General Motors Financial Company, Inc. (GM Financial) acquired Ally Financial Inc.’s (Ally Financial) international operations in Europe andLatin America in the year ended December 31, 2013.
(e) In December 2013 all of our Series B Preferred Stock automatically converted into 137 million shares of our common stock.(f) In December 2012 we purchased 200 million shares of our common stock for a total of $5.5 billion, which directly reduced stockholder’s equity
by $5.1 billion and we recorded a charge to earnings of $0.4 billion.
* * * * * * *
28

GENERAL MOTORS COMPANY AND SUBSIDIARIES
Management’s Discussion and Analysis of Financial Condition and Results of Operations
Basis of Presentation
This Management’s Discussion and Analysis of Financial Condition and Results of Operations (MD&A) should be read inconjunction with the accompanying consolidated financial statements.
In the three months ended March 31, 2014 we changed our managerial and financial reporting structure to reclassify the results ofour Russian subsidiaries previously reported in our General Motors International Operations (GMIO) segment to our GME segment.We have retrospectively revised the segment presentation for all periods presented.
Non-GAAP Measures
Management uses earnings before interest and taxes (EBIT)-adjusted to review the operating results of our automotive segmentsbecause it excludes interest income, interest expense and income taxes and includes certain additional adjustments. GM Financial usesincome before income taxes-adjusted because management believes interest income and interest expense are part of operating resultswhen assessing and measuring the operational and financial performance of the segment. Examples of adjustments to EBIT and GMFinancial’s income before income taxes include certain impairment charges related to goodwill, other long-lived assets andinvestments; certain gains or losses on the settlement/extinguishment of obligations; and gains or losses on the sale of non-coreinvestments. Refer to Note 25 to our consolidated financial statements for our reconciliation of these non-GAAP measures to the mostdirectly comparable financial measure under U.S. GAAP.
Management uses adjusted free cash flow to review the liquidity of our automotive operations. We measure adjusted free cash flow ascash flow from operations less capital expenditures adjusted for management actions, primarily related to strengthening our balance sheet,such as accrued interest on prepayments of debt and voluntary contributions to employee benefit plans. Refer to the “Liquidity” section ofMD&A for our reconciliation of this non-GAAP measure to the most directly comparable financial measure under U.S. GAAP.
Management uses these non-GAAP measures in its financial and operational decision making processes, for internal reporting andas part of its forecasting and budgeting processes as they provide additional transparency of our core operations. These measuresallow management to view operating trends, perform analytical comparisons and benchmark performance between periods and amonggeographic regions.
Our calculation of these non-GAAP measures may not be comparable to similarly titled measures of other companies due topotential differences between companies in the method of calculation. As a result the use of these non-GAAP measures has limitationsand should not be considered in isolation from, or as a substitute for, related U.S. GAAP measures.
Overview
Our strategic plan includes several major initiatives that we anticipate will help us achieve 9% to 10% margins on an EBIT-adjustedbasis (EBIT-adjusted margins, calculated as EBIT-adjusted divided by Net sales and revenue) by early next decade: (1) earncustomers for life by developing a strong product pipeline, leading the industry in quality and safety and delivering on ourcommitments; (2) lead the industry in product design, with our light-weighting and mixed material body structures and in leadingedge technology, including the launch of 4G LTE in China and expansion of OnStar, LLC to Europe; (3) grow our brands, particularlythe Cadillac brand in the U.S. and China; (4) continue our growth in China; (5) continue our growth of GM Financial as our captiveautomotive financing company; and (6) deliver core operating efficiencies by institutionalizing Operational Excellence. Our financialtargets include the following:
• Expected EBIT-adjusted and EBIT-adjusted margins improving in all automotive segments in 2015 due primarily to thefollowing anticipated trends: (1) an approximately 3% increase in global industry vehicle sales; (2) improved mix of full-sizeSport Utility Vehicles (SUVs) and full-size pick-up trucks; and (3) lower overall restructuring costs; partially offset by(4) higher marketing and engineering costs; and (5) unfavorable foreign currency effects;
29

GENERAL MOTORS COMPANY AND SUBSIDIARIES
• Anticipated adjusted automotive free cash flow will be relatively flat in 2015 compared to 2014;
• Forecasted consolidated EBIT-adjusted margins of 9% to 10% by the 2020s;
• Expected EBIT-adjusted margins of 10% in General Motors North America (GMNA) in 2016, which we anticipate will bedriven by product launches, disciplined pricing and a focus on fixed costs;
• An anticipated return to profitability in GME in 2016 driven by investments in our product portfolio, a revised brand strategyand reducing material, development and production costs assuming Europe does not suffer another recession;
• Expected continued improvement of our results in GMIO (excluding the results of our China joint ventures (China JVs))through our emerging market product portfolio, improvements in brand strategy and dealer networks, cost structure andsourcing over the medium term;
• Continued strong net income margins at our China JVs, with plans to invest approximately $14 billion in China through 2018and increase vehicle sales volumes by nearly 40% by 2018;
• Expected continued improvement of our core operations in General Motors South America (GMSA) through product launchesand material and logistics optimization, with a long-term objective of single digit EBIT-adjusted margins; and
• An anticipated increase of GM Financial’s support of the sale of new GM vehicles around the world through a comprehensivesuite of financing products, including continuing on the path towards full global captive capability.
Automotive Summary and Outlook
Our consolidated Net income decreased from $5.3 billion to $4.0 billion. Notwithstanding this decrease we had strong financialresults in 2014 excluding the impact of recall campaign and courtesy transportation charges. Performance of GMNA met ourexpectations, while GME and GMIO outperformed our expectations. However, we experienced weaker performance in GMSA due tothe challenging environment in Venezuela, Brazil and Argentina.
As more fully described in the “GM North America” section of MD&A we recorded charges of approximately $2.9 billion inAutomotive cost of sales relating to recall campaigns and courtesy transportation in the year ended December 31, 2014, of which over86% was recorded in GMNA.
In the three months ended June 30, 2014 we announced the creation of a compensation program (the Program) to compensateaccident victims who died or suffered physical injury (or their families) as a result of a faulty ignition switch related to the 2.6 millionvehicles recalled under the Ignition Switch Recall. Refer to the “GM North America” section of MD&A for additional information onthe Ignition Switch Recall. It is important to our company that we reach everyone through this Program who has been impacted. TheProgram is being administered by an independent program administrator. The independent administrator has established a protocolthat defines the eligibility requirements to participate in the Program. There is no cap on the amount of payments that can be made toclaimants under the Program.
In the three months ended June 30, 2014 we recorded $0.4 billion in Automotive selling, general and administrative expense inCorporate which represents our best estimate of amounts that may be paid under the Program. The amount was treated as anadjustment for EBIT-adjusted reporting purposes. However, it is reasonably possible that the liability could exceed our recordedamount by approximately $0.2 billion. The most significant estimates affecting the amount recorded include the number ofparticipants that have eligible claims related to death and physical injury, which also contemplates the severity of injury, the length ofhospital stays and related compensation amounts and the number of people who actually elect to participate in the Program. Ourestimate is subject to significant uncertainties, as programs of this nature are highly unusual and each eligible claim will have a uniqueunderlying fact pattern. While we do not anticipate material changes to our current estimate, it is possible that material changes could
30

GENERAL MOTORS COMPANY AND SUBSIDIARIES
occur if actual eligible claims and the related compensation amounts differ from this estimate. The Program accepted claims fromAugust 1, 2014 through January 31, 2015. Payments to eligible claimants began in the fourth quarter 2014 and will continue throughthe first half of 2015. Accident victims (or their families) could choose not to participate in the Program and pursue litigation againstus. At January 30, 2015 the Program has received 3,810 claims and the independent program administrator has determined 128 claimsto be eligible for payment under the Program. Remaining claims are either under review, deficient awaiting further documentation ordeemed ineligible. Based on currently available information we believe our accrual at December 31, 2014 is adequate to cover theestimated costs under the Program. At January 30, 2015 we have paid $93 million to eligible claimants under the Program. Accidentvictims that accept a payment under the Program agree to settle all claims against GM related to the accident.
We analyze the results of our automotive business through our four geographically-based segments:
GMNA
Automotive industry volume has continued to grow in North America. In 2014 U.S. industry light vehicle sales for the calendaryear were 16.5 million units, up from 15.6 million units in 2013. In January 2015 we announced that we expect 2015 industry lightvehicle sales to be between 16.5 and 17.0 million units.
In the year ended December 31, 2014 our U.S. retail vehicle sales increased at a rate approximately 0.7 percentage points less thanindustry sales. As a result, our U.S. market share decreased by 0.1 percentage points. U.S. market share for both Chevrolet andCadillac decreased, while GMC and Buick increased.
GMNA continued to generate increases in average transaction prices (ATP) in U.S. According to J.D. Power PIN estimates, in theyear ended December 31, 2014 we achieved record ATP in the U.S. on the strength of new products such as large pick-ups and SUVs.Contributing to the record ATP, our U.S. incentive spending as a percentage of ATP increased by 0.1 percentage points, whileindustry spending increased by 0.4 percentage points compared to the prior year.
The first deliveries of the new 2015 Chevrolet Colorado and GMC Canyon mid-size pick-ups occurred in September 2014. Wehave announced plans to add a third shift at our Wentzville, Mo. assembly plant in early 2015 to meet expected demand for both mid-size pick-ups and full-size vans.
Customer safety and satisfaction were the major reasons for the recall of approximately 36 million vehicles announced during 2014.These recalls included: (1) approximately 2.6 million vehicles to repair ignition switches that could result in a loss of electrical powerunder certain circumstances that may prevent front airbags from deploying in the event of a crash (accident victims who died orsuffered physical injury associated with these vehicles (or their families) may be eligible to participate in a compensation program, asmore fully described in Note 17 to our consolidated financial statements) and to fix ignition lock cylinders that could allow removal ofthe ignition key while the engine is running, leading to possible rollaway or crash; (2) approximately 1.9 million vehicles to replaceeither the power steering motor, the steering column, the power steering motor control unit or a combination of the steering columnand the power steering motor control unit as the electric power steering could fail under certain circumstances; (3) approximately1.3 million vehicles prone to non-deployment of the side impact restraints if vehicles are not serviced when the Service Air Bagwarning light is illuminated; (4) approximately 2.7 million vehicles to modify the brake lamp wiring harness that could have corrosiondevelop due to micro-vibration; (5) approximately 1.5 million vehicles to replace front safety lap belt cables that could fatigue andseparate over time; (6) approximately 1.4 million vehicles to replace the shift cable that could wear out over time resulting inmismatches of the gear position indicated by the shift lever; (7) approximately 12.1 million vehicles to rework or replace ignition keysbecause the ignition switch may move out of the “run” position which may impact power steering and power braking and, dependingon timing of the key movement relative to the activation of the sensing algorithm of a crash event, may result in airbags notdeploying; (8) approximately 1.1 million vehicles to repair a loose battery cable that could impact vehicle warning systems;(9) approximately 0.7 million vehicles to repair ignition mechanisms where the ignition key could be pulled out while the vehicle is inthe run position; (10) approximately 0.6 million vehicles to replace the wave plate in all vehicles with 6T70 and 6T75 transmissionswhich could crack under certain circumstances; and (11) approximately 10.1 million vehicles for other matters. In the three and sixmonths ended June 30, 2014 we recorded charges of approximately $1.1 billion and $2.4 billion primarily for the estimated costs of
31

GENERAL MOTORS COMPANY AND SUBSIDIARIES
parts and labor to repair these vehicles and for courtesy transportation. The cost of the vehicles recalled in the six months endedDecember 31, 2014 were comprehended in the June 30, 2014 catch-up adjustment of $0.9 billion associated with a change in estimatefor previously sold vehicles. Refer to Note 1 and Note 13 to our consolidated financial statements for more detail related to the catch-up adjustment. Total Net sales and revenue for GMNA have increased for the year ended December 31, 2014 as compared to prioryear by 6.4%. It is difficult to determine the impact, if any, on current or future Net sales and revenue due to our recent recall activity.Of the approximately 36 million vehicles subject to recall, approximately 63% of the vehicles and 65% of the costs involve vehicleswe no longer produce or sell. We began repairing vehicles in early April 2014 and we have produced sufficient parts to have theability to repair all vehicles impacted by the Ignition Switch Recall. Refer to the “GM North America” section of MD&A foradditional information on all of the recalls we announced in 2014.
In the year ending December 31, 2015 we expect an increase in EBIT-adjusted and EBIT-adjusted margins due primarily to: (1) aslight increase in U.S. industry vehicle sales; and (2) full year production of full-size SUVs; partially offset by (3) increasedengineering and marketing costs.
The International Union, United Automobile, Aerospace and Agriculture Implement Workers of America (UAW) contract weentered into in September 2011 expires in September 2015.
GME
The automotive industry conditions in Europe remain challenging due to economic uncertainty resulting from weak gross domesticgrowth, high unemployment and vehicle production overcapacity. Despite such conditions, automotive industry sales to retail andfleet customers began to improve in the three months ended December 31, 2013 compared to the corresponding period in 2012. Thistrend continued in 2014 with industry sales to retail and fleet customers of 19 million vehicles representing a 1.8% increase comparedto the corresponding period in 2013.
Our European operations are benefiting from this trend and continue to show signs of improvement underscored by furtherimprovement in our Opel and Vauxhall market share in the year ended December 31, 2014, which builds on our first market shareincrease in 14 years in 2013. This market share increase was partially driven by the success of the recently launched Opel Mokka.
We continue to implement various strategic actions to strengthen our operations and increase our competitiveness. The key actionsinclude investments in our product portfolio including the next generation Opel Astra and Corsa, a revised brand strategy andreducing material, development and production costs, including restructuring activities. The success of these actions will depend on acombination of our ability to execute and external factors which are outside of our control.
We continue to assess additional strategic actions across the region as a result of significant volume pricing and foreign exchangepressures in certain markets, which may result in additional restructuring or rationalization actions. These actions, if implemented,may result in impairment and other charges. The determination of the amount of these charges is subject to significant uncertainty andhighly dependent on finalization of our strategic assessments.
Our restructuring activities include our effort to rationalize our manufacturing footprint in GME whereby we reached agreementwith the labor union in Germany to terminate all vehicle and transmission production at our Bochum, Germany facility at the end of2014. Affected employees are eligible for a voluntary restructuring separation program. Restructuring charges were recordedprimarily through the end of 2014. Refer to Note 19 to our consolidated financial statements for additional information.
In the year ended December 31, 2014 we performed a strategic assessment of our Russian operations as a result of a significantdeterioration in sales volumes due to challenging market conditions and deterioration in the Russian Ruble. Our review indicated thatthe existing long-lived assets and certain investments in our Russian operations were not recoverable. As a result we recordedimpairment charges of $0.2 billion in Automotive cost of sales which was treated as an adjustment for EBIT-adjusted reportingpurposes. Industry and economic conditions in Russia remain volatile and we continue to evaluate and execute various strategicactions to improve our operations in a difficult environment.
32

GENERAL MOTORS COMPANY AND SUBSIDIARIES
We expect the European automotive industry to continue to moderately improve and we expect to be profitable in GME in 2016.
In the year ending December 31, 2015 we expect an increase in EBIT-adjusted and EBIT-adjusted margins due primarily to:(1) lower restructuring costs; partially offset by (2) higher engineering, marketing and depreciation and amortization cost.
GMIO
We are addressing many of the challenges in our GMIO operations and continue to strategically assess the manner in which weoperate in certain countries within GMIO. In 2013 we announced the withdrawal of the Chevrolet brand from Western and CentralEurope and the ceasing of manufacturing and significant reduction of engineering operations in Australia by 2017 and incurredimpairment and other charges in 2013 and 2014. We continue to execute these plans and within the financial impact that we projected.As we continue to assess our performance throughout the region, additional restructuring and rationalization actions may be requiredand may be material.
In the three months ended December 31, 2014 due to a significant decrease in domestic sales driven by political unrest and a lack ofconsumer confidence domestically as well as ongoing weakness and trade challenges in several export markets we performed arecoverability test of our real and personal property assets in our Thailand operations. As a result we recorded impairment charges of$0.2 billion in Automotive cost of sales which was treated as an adjustment for EBIT-adjusted reporting purposes.
To address the significant industry, market share, pricing and foreign exchange pressures in the region, we continue to focus onproduct portfolio enhancements, manufacturing footprint rationalization, increased local sourcing of parts, cost structure reductions, aswell as brand and dealer network improvements which we expect to favorably impact the region over the medium term. However,with the significant reduction in wholesale volumes and forward pricing pressures, we tested certain long-lived assets for impairmentand additional testing may occur in the near term. Determining whether long-lived assets need to be tested for impairment, whetherrecorded amounts are recoverable and the estimate of impairment and other charges, if any, is subject to significant uncertainty andhighly dependent on finalization of our strategic assessments.
In the year ending December 31, 2015 we expect an increase in EBIT-adjusted and EBIT-adjusted margins due primarily to:(1) improved profitability at our China JVs; (2) a flat to slight increase in industry vehicle sales; (3) improved product mix in theMiddle East; and (4) improved cost performance; partially offset by (5) higher restructuring costs.
In China we are expecting an increase in industry vehicle sales with a modest increase in market share coupled with new vehiclelaunches and a full year of the 2014 launches.
GMSA
In the three months ended March 31, 2014 we recorded devaluation charges of $0.4 billion related to a change in the exchange ratewe use for remeasuring our Venezuelan subsidiaries’ non-U.S. Dollar denominated monetary assets and liabilities from the Venezuelaofficial exchange rate to the rate determined by an auction process conducted by Venezuela’s Complementary System of ForeignCurrency Administration (SICAD I). In addition to currency controls already in place the Venezuelan government announced pricingcontrols that, taken with other initiatives, require us to closely monitor and consider our ability to maintain a controlling financialinterest in our Venezuelan subsidiaries. Refer to the “GM South America” section of MD&A for additional information.
In the year ended December 31, 2014 we recorded a net gain on extinguishment of debt of $0.2 billion primarily related toprepayment of unsecured debt in Brazil.
Based on the results of our annual goodwill impairment tests we recorded goodwill impairment charges of $0.1 billion in the yearended December 31, 2014 which was treated as an adjustment for EBIT-adjusted reporting purposes.
33

GENERAL MOTORS COMPANY AND SUBSIDIARIES
In the year ending December 31, 2015 we expect an increase in EBIT-adjusted and EBIT-adjusted margins due primarily to: (1) aslight improvement in market share primarily in Brazil; (2) improved product and country mix; and (3) improved pricing; partiallyoffset by (4) higher marketing, labor, material and logistics costs. Continued foreign currency volatility will also affect our results in2015.
Corporate
On December 31, 2014 we redeemed all of our shares of Series A Preferred Stock outstanding at a redemption price equal to theaggregate liquidation amount, including accumulated dividends, of $3.9 billion. The difference of $0.8 billion between the carryingamount and the consideration paid was recorded as a reduction to Net income attributable to common stockholders.
At December 31, 2014 our European businesses had deferred tax asset valuation allowances of $4.9 billion. As a result of thechanges in our European operating structure and improving financial performance in certain jurisdictions, we are experiencingpositive evidence trends in certain operations. If these operations generate profits and taxable income in the future, it is reasonablypossible our conclusion regarding the need for full valuation allowances could change, resulting in the reversal of significant portionsof the valuation allowances. In the quarter in which significant valuation allowances are reversed, we will record a material tax benefitreflecting the reversal, which could result in lower than expected or negative effective tax rate for both the quarter and full year.
Automotive Financing — GM Financial Summary and Outlook
GM Financial is currently seeking to expand its prime lending programs in North America and anticipates that prime lending willbecome an increasing percentage of the consumer portfolio balance over time. We believe that offering a comprehensive suite offinancing products will generate incremental sales of our vehicles, drive incremental GM Financial earnings and help support oursales throughout economic cycles. GM Financial completed the acquisitions of Ally Financial’s automotive finance and financialservices businesses in Europe and Latin America during 2013. On January 2, 2015 GM Financial completed its acquisition of AllyFinancial’s 40% equity interest in SAIC-GMAC Automotive Finance Company Limited (SAIC-GMAC) in China. The aggregatepurchase price was approximately $1.0 billion, subject to certain post-closing adjustments. Also on January 2, 2015 GM Financialsold a 5% equity interest in SAIC-GMAC to Shanghai Automotive Group Finance Company Ltd. (SAICFC), a current shareholder ofSAIC-GMAC, for proceeds of approximately $120 million, subject to certain post-closing adjustments. As a result of thesetransactions GM indirectly owns 45% of SAIC-GMAC.
In January 2015 we announced GM Financial will become the exclusive U.S. lease provider for Buick-GMC dealers in February2015 and is targeting March 2015 for Cadillac dealers. U.S. lease exclusivity with Chevrolet dealers is under consideration.
In the year ending December 31, 2015 we expect income before income taxes-adjusted to remain consistent with 2014 because ournear-term financial results will be impacted by additional provisions on loan losses and interest expense resulting from the growth ofthe business.
Consolidated Results
We review changes in our results of operations under four categories: volume, mix, price and other. Volume measures the impact ofchanges in wholesale vehicle volumes driven by industry volume, market share and changes in dealer stock levels. Mix measures theimpact of changes to the regional portfolio due to product, model, trim, country and option penetration in current year wholesalevehicle volumes. Price measures the impact of changes related to Manufacturer’s Suggested Retail Price and various sales allowances.Other includes primarily: (1) material and freight; (2) costs including manufacturing, engineering, advertising, administrative andselling and policy and warranty expense; (3) foreign exchange; and (4) non-vehicle related automotive revenues and costs as well asequity income or loss from our nonconsolidated affiliates.
34

GENERAL MOTORS COMPANY AND SUBSIDIARIES
Total Net Sales and Revenue
Years Ended December 31, Variance Due To
2014 2013Favorable/
(Unfavorable) % Volume Mix Price Other
(Dollars in millions) (Dollars in billions)
GMNA . . . . . . . . . . . . . . . . . . . . . . . . . . . . . . . . $101,199 $ 95,099 $ 6,100 6.4% $ 1.3 $ 1.2 $ 3.4 $ 0.3GME . . . . . . . . . . . . . . . . . . . . . . . . . . . . . . . . . . 22,235 21,962 273 1.2% $ 0.2 $ 0.7 $ — $ (0.5)GMIO . . . . . . . . . . . . . . . . . . . . . . . . . . . . . . . . . 14,392 18,411 (4,019) (21.8)% $ (4.6) $ 0.4 $ 0.7 $ (0.4)GMSA . . . . . . . . . . . . . . . . . . . . . . . . . . . . . . . . 13,115 16,478 (3,363) (20.4)% $ (2.4) $ 0.1 $ 1.1 $ (2.1)Corporate and eliminations . . . . . . . . . . . . . . . . 151 142 9 6.3% $ —
Automotive . . . . . . . . . . . . . . . . . . . . . . . . . . . . 151,092 152,092 (1,000) (0.7)% $ (5.6) $ 2.3 $ 5.1 $ (2.8)GM Financial . . . . . . . . . . . . . . . . . . . . . . . . . . . 4,837 3,335 1,502 45.0% $ 1.5
Total net sales and revenue . . . . . . . . . . . . . . . . $155,929 $155,427 $ 502 0.3% $ (5.6) $ 2.3 $ 5.1 $ (1.3)
Years Ended December 31, Variance Due To
2013 2012Favorable/
(Unfavorable) % Volume Mix Price Other
(Dollars in millions) (Dollars in billions)
GMNA . . . . . . . . . . . . . . . . . . . . . . . . . . . . . . . . $ 95,099 $ 89,910 $ 5,189 5.8% $ 1.7 $ 1.3 $ 1.9 $ 0.3GME . . . . . . . . . . . . . . . . . . . . . . . . . . . . . . . . . . 21,962 23,055 (1,093) (4.7)% $ (1.1) $ — $ (0.2) $ 0.2GMIO . . . . . . . . . . . . . . . . . . . . . . . . . . . . . . . . . 18,411 20,588 (2,177) (10.6)% $ (0.8) $ (0.2) $ (0.5) $ (0.7)GMSA . . . . . . . . . . . . . . . . . . . . . . . . . . . . . . . . 16,478 16,700 (222) (1.3)% $ — $ 0.6 $ 0.9 $ (1.7)Corporate and eliminations . . . . . . . . . . . . . . . . 142 42 100 n.m. $ 0.1
Automotive . . . . . . . . . . . . . . . . . . . . . . . . . . . . 152,092 150,295 1,797 1.2% $ (0.2) $ 1.7 $ 2.2 $ (1.9)GM Financial . . . . . . . . . . . . . . . . . . . . . . . . . . . 3,335 1,961 1,374 70.1% $ 1.4
Total net sales and revenue . . . . . . . . . . . . . . . . $155,427 $152,256 $ 3,171 2.1% $ (0.2) $ 1.7 $ 2.2 $ (0.5)
n.m. = not meaningful
Refer to the regional sections of the MD&A for additional information.
Automotive Cost of Sales
Years Ended December 31, Variance Due To
2014 2013Favorable/
(Unfavorable) % Volume Mix Other
(Dollars in millions) (Dollars in billions)
GMNA . . . . . . . . . . . . . . . . . . . . . . . . . . . . . . . . . . . . . . . $ 89,371 $ 81,404 $ (7,967) (9.8)% $ (0.8) $ (0.9) $ (6.2)GME . . . . . . . . . . . . . . . . . . . . . . . . . . . . . . . . . . . . . . . . . 21,712 20,824 (888) (4.3)% $ (0.1) $ (0.5) $ (0.3)GMIO . . . . . . . . . . . . . . . . . . . . . . . . . . . . . . . . . . . . . . . . 14,009 17,599 3,590 20.4% $ 3.7 $ (0.5) $ 0.4GMSA . . . . . . . . . . . . . . . . . . . . . . . . . . . . . . . . . . . . . . . . 12,736 15,221 2,485 16.3% $ 1.9 $ (0.2) $ 0.8Corporate and eliminations . . . . . . . . . . . . . . . . . . . . . . . . 254 (123) (377) n.m. $ (0.4)
Total automotive cost of sales . . . . . . . . . . . . . . . . . . . . . $138,082 $134,925 $ (3,157) (2.3)% $ 4.7 $ (2.0) $ (5.8)
n.m. = not meaningful
35
GENERAL MOTORS COMPANY AND SUBSIDIARIES
Years Ended December 31, Variance Due To
2013 2012Favorable/
(Unfavorable) % Volume Mix Other
(Dollars in millions) (Dollars in billions)
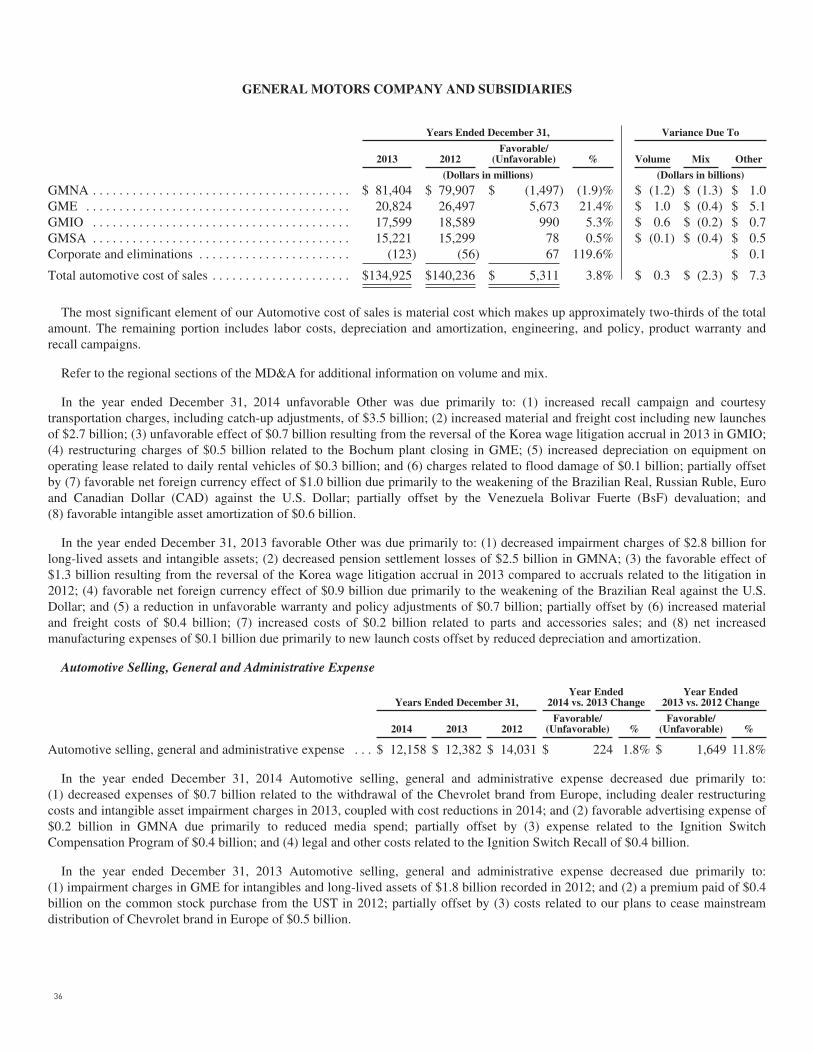
GMNA . . . . . . . . . . . . . . . . . . . . . . . . . . . . . . . . . . . . . . . $ 81,404 $ 79,907 $ (1,497) (1.9)% $ (1.2) $ (1.3) $ 1.0GME . . . . . . . . . . . . . . . . . . . . . . . . . . . . . . . . . . . . . . . . 20,824 26,497 5,673 21.4% $ 1.0 $ (0.4) $ 5.1GMIO . . . . . . . . . . . . . . . . . . . . . . . . . . . . . . . . . . . . . . . 17,599 18,589 990 5.3% $ 0.6 $ (0.2) $ 0.7GMSA . . . . . . . . . . . . . . . . . . . . . . . . . . . . . . . . . . . . . . . 15,221 15,299 78 0.5% $ (0.1) $ (0.4) $ 0.5Corporate and eliminations . . . . . . . . . . . . . . . . . . . . . . . (123) (56) 67 119.6% $ 0.1
Total automotive cost of sales . . . . . . . . . . . . . . . . . . . . . $134,925 $140,236 $ 5,311 3.8% $ 0.3 $ (2.3) $ 7.3
The most significant element of our Automotive cost of sales is material cost which makes up approximately two-thirds of the totalamount. The remaining portion includes labor costs, depreciation and amortization, engineering, and policy, product warranty andrecall campaigns.
Refer to the regional sections of the MD&A for additional information on volume and mix.
In the year ended December 31, 2014 unfavorable Other was due primarily to: (1) increased recall campaign and courtesytransportation charges, including catch-up adjustments, of $3.5 billion; (2) increased material and freight cost including new launchesof $2.7 billion; (3) unfavorable effect of $0.7 billion resulting from the reversal of the Korea wage litigation accrual in 2013 in GMIO;(4) restructuring charges of $0.5 billion related to the Bochum plant closing in GME; (5) increased depreciation on equipment onoperating lease related to daily rental vehicles of $0.3 billion; and (6) charges related to flood damage of $0.1 billion; partially offsetby (7) favorable net foreign currency effect of $1.0 billion due primarily to the weakening of the Brazilian Real, Russian Ruble, Euroand Canadian Dollar (CAD) against the U.S. Dollar; partially offset by the Venezuela Bolivar Fuerte (BsF) devaluation; and(8) favorable intangible asset amortization of $0.6 billion.
In the year ended December 31, 2013 favorable Other was due primarily to: (1) decreased impairment charges of $2.8 billion forlong-lived assets and intangible assets; (2) decreased pension settlement losses of $2.5 billion in GMNA; (3) the favorable effect of$1.3 billion resulting from the reversal of the Korea wage litigation accrual in 2013 compared to accruals related to the litigation in2012; (4) favorable net foreign currency effect of $0.9 billion due primarily to the weakening of the Brazilian Real against the U.S.Dollar; and (5) a reduction in unfavorable warranty and policy adjustments of $0.7 billion; partially offset by (6) increased materialand freight costs of $0.4 billion; (7) increased costs of $0.2 billion related to parts and accessories sales; and (8) net increasedmanufacturing expenses of $0.1 billion due primarily to new launch costs offset by reduced depreciation and amortization.
Automotive Selling, General and Administrative Expense
Years Ended December 31,Year Ended
2014 vs. 2013 ChangeYear Ended
2013 vs. 2012 Change
2014 2013 2012Favorable/
(Unfavorable) %Favorable/
(Unfavorable) %
Automotive selling, general and administrative expense . . . $ 12,158 $ 12,382 $ 14,031 $ 224 1.8% $ 1,649 11.8%
In the year ended December 31, 2014 Automotive selling, general and administrative expense decreased due primarily to:(1) decreased expenses of $0.7 billion related to the withdrawal of the Chevrolet brand from Europe, including dealer restructuringcosts and intangible asset impairment charges in 2013, coupled with cost reductions in 2014; and (2) favorable advertising expense of$0.2 billion in GMNA due primarily to reduced media spend; partially offset by (3) expense related to the Ignition SwitchCompensation Program of $0.4 billion; and (4) legal and other costs related to the Ignition Switch Recall of $0.4 billion.
In the year ended December 31, 2013 Automotive selling, general and administrative expense decreased due primarily to:(1) impairment charges in GME for intangibles and long-lived assets of $1.8 billion recorded in 2012; and (2) a premium paid of $0.4billion on the common stock purchase from the UST in 2012; partially offset by (3) costs related to our plans to cease mainstreamdistribution of Chevrolet brand in Europe of $0.5 billion.
36

GENERAL MOTORS COMPANY AND SUBSIDIARIES
Income Tax Expense (Benefit)
Years Ended December 31,Year Ended
2014 vs. 2013 ChangeYear Ended
2013 vs. 2012 Change
2014 2013 2012Favorable/
(Unfavorable) %Favorable/
(Unfavorable) %
Income tax expense (benefit) . . . . . . . . . . . . . . . . . $ 228 $ 2,127 $(34,831) $ 1,899 89.3% $ 36,958 n.m.
n.m. = not meaningful
In the year ended December 31, 2014 income tax expense decreased due primarily to a decrease in pre-tax income related to U.S.recall-related costs, a reduction in pre-tax losses in jurisdictions with full valuation allowances and other tax expense favorable items.
In the year ended December 31, 2013 income tax expense increased due primarily to the deferred tax asset valuation allowancereversal of $36.3 billion in the U.S. and Canada that occurred in 2012.
Refer to Note 18 to our consolidated financial statements for additional information related to our income tax expense (benefit).
GM North America
Years Ended December 31,Year Ended
2014 vs. 2013 Change Variance Due To
2014 2013Favorable/
(Unfavorable) % Volume Mix Price Other
(Dollars in millions) (Dollars in billions)
Total net sales and revenue . . . . . . . . . . . . . $ 101,199 $ 95,099 $ 6,100 6.4% $ 1.3 $ 1.2 $ 3.4 $ 0.3EBIT-adjusted . . . . . . . . . . . . . . . . . . . . . . . $ 6,603 $ 7,461 $ (858) (11.5)% $ 0.4 $ 0.3 $ 3.4 $ (5.0)
(Vehicles in thousands)
Wholesale vehicle sales . . . . . . . . . . . . . . . . 3,320 3,276 44 1.3%
Years Ended December 31,Year Ended
2013 vs. 2012 Change Variance Due To
2013 2012Favorable/
(Unfavorable) % Volume Mix Price Other
(Dollars in millions) (Dollars in billions)
Total net sales and revenue . . . . . . . . . . . . . $ 95,099 $ 89,910 $ 5,189 5.8% $ 1.7 $ 1.3 $ 1.9 $ 0.3EBIT-adjusted . . . . . . . . . . . . . . . . . . . . . . . $ 7,461 $ 6,470 $ 991 15.3% $ 0.5 $ — $ 1.9 $ (1.4)
(Vehicles in thousands)
Wholesale vehicle sales . . . . . . . . . . . . . . . . 3,276 3,207 69 2.2%
GMNA Total Net Sales and Revenue
In the year ended December 31, 2014 Total net sales and revenue increased due primarily to: (1) favorable vehicle pricing related to full-size pick-ups and full-size SUVs; (2) increased wholesale volumes due to full-size pick-ups, full-size SUVs and the Chevrolet Colorado,Corvette and Malibu, partially offset by decreases of the Chevrolet Impala, Captiva and Cruze; (3) favorable mix due to full-size pick-ups,full-size SUVs and the Chevrolet Corvette and Impala; and (4) favorable Other of $0.3 billion due primarily to increased operating leaserevenue related to daily rental vehicles sold with guaranteed repurchase obligations and increased parts and accessories sales, partially offsetby unfavorable foreign currency effect related primarily to the weakening of the CAD and Mexican Peso against the U.S. Dollar.
In the year ended December 31, 2013 Total net sales and revenue increased due primarily to: (1) favorable vehicle pricing related torecent vehicle launches such as the Chevrolet Silverado and GMC Sierra; (2) increased wholesale volumes due to increased industrydemand and successful recent vehicle launches such as the Buick Encore, Cadillac ATS, Chevrolet Silverado and Spark and GMC Sierra;and (3) favorable vehicle mix related to improving market segments containing higher revenue vehicles including crossovers and trucks.
37

GENERAL MOTORS COMPANY AND SUBSIDIARIES
GMNA EBIT-Adjusted
The most significant factors which influence GMNA’s profitability are industry volume (primarily U.S. seasonally adjusted annualrate) and market share. While not as significant as industry volume and market share, another factor affecting profitability is therelative mix of vehicles (cars, trucks, crossovers) sold. Variable profit is a key indicator of product profitability. Variable profit isdefined as revenue less material cost, freight, the variable component of manufacturing expense, and policy and warranty expense.Vehicles with higher selling prices generally have higher variable profit. Trucks, crossover vehicles and cars sold in the U.S. currentlyhave a variable profit of approximately 160%, 90% and 40% respectively of our portfolio on a weighted-average basis.
In the year ended December 31, 2014 EBIT-adjusted decreased due primarily to: (1) unfavorable Other of $5.0 billion due primarilyto an increase in recall campaign actions and recall related charges of $2.3 billion, increased material and freight costs including newlaunches of $2.8 billion, and increased engineering expense of $0.5 billion, partially offset by increased daily rental vehicles sold withguaranteed repurchase obligations and reduced advertising expenses; partially offset by (2) favorable vehicle pricing related to full-size pick-ups and full-size SUVs; (3) increased wholesale volumes due to full-size pick-ups, full-size SUVs and the ChevroletColorado, Corvette and Malibu, partially offset by decreases of the Chevrolet Impala, Captiva and Cruze; and (4) favorable mix due tofull-size pick-ups, full-size SUVs and the Chevrolet Corvette and Impala.
In the year ended December 31, 2013 EBIT-adjusted increased due primarily to: (1) favorable vehicle pricing related to recent vehiclelaunches such as the Chevrolet Silverado and GMC Sierra; and (2) increased wholesale volumes due to increased industry demand andsuccessful recent vehicle launches such as the Buick Encore, Cadillac ATS and Chevrolet Silverado; partially offset by (3) unfavorableOther of $1.4 billion due primarily to increased material and freight costs including new launches of $1.1 billion, increasedmanufacturing expense including new launches of $0.3 billion, increased engineering expense of $0.3 billion and increased depreciationand amortization expense of $0.2 billion, partially offset by a reduction in unfavorable warranty and policy adjustments of $0.6 billion.
Recall Campaigns
In the year ended December 31, 2014 we experienced a significant increase in the number of vehicles subject to recall in NorthAmerica resulting in incremental charges for the estimated costs of parts and labor to repair these vehicles and courtesy transportationfor certain recalls. There were approximately 36 million vehicles subject to recalls announced during this period. This includedapproximately 10 million vehicles subject to multiple recalls and reflects the results of our ongoing comprehensive safety review,additional engineering analysis and our overall commitment to customer satisfaction.
In the three months ended March 31, 2014 we announced a recall to repair ignition switches in vehicles that we are no longerproducing that under certain circumstances could result in a loss of electrical power that may prevent front airbags from deploying in theevent of a crash. It was originally estimated that approximately 800,000 vehicles were equipped with ignition switches needing repair.These vehicles include model years 2005–2007 Chevrolet Cobalt, 2007 Pontiac G5 and 2005–2006 Pursuit. In the three months endedDecember 31, 2013 we recorded approximately $40 million in Automotive cost of sales to cover the repairs as these costs wereconsidered probable and estimable at that time. In the three months ended March 31, 2014 we expanded this recall by approximately1.8 million additional vehicles for the same issue. These vehicles, consisting of model years 2008–2010 Chevrolet Cobalt, model years2006–2011 HHR, model years 2008–2010 Pontiac G5, model years 2006–2010 Solstice, model years 2003–2007 Saturn ION and modelyears 2007–2010 Sky, were not included in the initial recall. In the three months ended March 31, 2014 we recorded approximately $90million in Automotive cost of sales to repair these vehicles and approximately $270 million in Automotive cost of sales to providecourtesy transportation to owners of affected vehicles. These recalls, relating to ignition switches, are collectively referred to as the“Ignition Switch Recall.” Refer to Note 17 to our consolidated financial statements for litigation associated with the Ignition SwitchRecall. A second repair was added to these vehicles as a result of the comprehensive review described below to fix ignition lock cylindersthat could allow removal of the ignition key while the engine is running, leading to possible rollaway or crash. In the three months endedMarch 31, 2014 we recorded approximately $320 million in Automotive cost of sales to repair ignition lock cylinders.
In response to these developments we conducted an in-depth review of the Ignition Switch Recall and our overall recall processes. Wehired a former U.S. Attorney to conduct an internal investigation of the Ignition Switch Recall and to provide recommendations to improve
38

GENERAL MOTORS COMPANY AND SUBSIDIARIES
our recall processes. Pursuant to the investigation a report was provided to us in the three months ended June 30, 2014. The investigationreport made a series of recommendations in eight major areas. We intend to act or have acted on each of the recommendations. Afterreviewing the investigation report, we made a number of personnel decisions. Fifteen individuals identified in the investigation report areno longer with the Company. Five additional individuals were disciplined. Prior to the receipt of the investigation report we began theprocess of adding over 100 new safety investigators and related specialists in North America alone allowing us to bolster capacity andcapability in identifying potential emerging issues and conducting product investigations, launched a Speak Up for Safety programencouraging employees to report potential safety issues quickly and restructured the safety decision-making process to raise safety issues tothe highest levels of the Company. These measures are in addition to our creation and appointment of a new Global Vice President ofVehicle Safety responsible for the safety development of our vehicle systems, confirmation and validation of safety performance, as wellas post-sale safety activities, including recalls and the creation of a new Global Product Integrity organization within Global ProductDevelopment with the goal of executing the highest levels of safety performance across all of our vehicles.
Enhancements have also been incorporated through an ongoing process of continuous improvement into the Safety and FieldInvestigation process to facilitate consistency in post-decision customer actions. Improved investigative and consumer facingprocesses and standards are also being implemented globally to facilitate rapid and efficient sharing of information across regionalteams and markets to aid decision making. Another estimated 100 technical resources have been added globally in support of therevised alignment and process.
We are also actively engaging customers and servicing vehicles affected by the Ignition Switch Recall. We notified affectedcustomers to schedule an appointment with their dealers as replacement parts are available. We began repairing vehicles in early Aprilusing parts that have undergone end-of-line quality inspection for performance of six critical operating parameters. We have producedsufficient parts to have the ability to repair all vehicles impacted by the ignition switch and ignition cylinder recalls. ThroughJanuary 30, 2015 we have repaired approximately 59% of the 2.6 million vehicles subject to recall.
As a result of the Ignition Switch Recall senior leadership initiated a comprehensive review and engineering analysis to identify anyadditional issues which could potentially result in safety or satisfaction concerns for our customers. As part of our normal process andas a result of these reviews we announced the following additional recall campaigns in 2014:
• In the three months ended March 31, 2014 approximately 1.9 million vehicles were recalled to replace either the powersteering motor, the steering column, the power steering motor control unit or a combination of the steering column and thepower steering motor control unit as the electric power steering could fail under certain circumstances — model years 2004–2006, 2008–2009 Chevrolet Malibu, model years 2004–2006 Malibu Maxx, model years 2006–2010 HHR, model years 2005–2010 Cobalt, model years 2008–2009 Saturn Aura, model years 2003–2007 ION, model years 2007–2010 Pontiac G5, modelyears 2005–2006, 2008–2009 G6 and model years 2005–2006 Pursuit and G4. We recorded approximately $340 million inAutomotive cost of sales to repair these vehicles.
• In the three months ended March 31, 2014 approximately 1.3 million vehicles were recalled that are prone to non-deploymentof the side impact restraints if vehicles are not serviced when the Service Air Bag warning light is illuminated — model years2008–2013 Buick Enclave and GMC Acadia, model years 2009–2013 Chevrolet Traverse and model years 2008–2010 SaturnOutlook. We recorded approximately $185 million in Automotive cost of sales to repair these vehicles.
• In the three months ended June 30, 2014 approximately 2.7 million vehicles were recalled to modify the brake lamp wiringharness that could have corrosion develop due to micro-vibration — model years 2004–2012 Chevrolet Malibu, model years2004–2007 Malibu Maxx, model years 2005–2010 Pontiac G6 and model years 2007–2010 Saturn Aura. We recordedapproximately $90 million in Automotive cost of sales to repair these vehicles.
• In the three months ended June 30, 2014 approximately 1.5 million vehicles were recalled to replace front safety lap belt cablesthat could fatigue and separate over time — model years 2009–2014 Buick Enclave, Chevrolet Traverse, GMC Acadia and modelyears 2009–2010 Saturn Outlook. We recorded approximately $80 million in Automotive cost of sales to repair these vehicles.
39

GENERAL MOTORS COMPANY AND SUBSIDIARIES
• In the three months ended June 30, 2014 approximately 1.4 million vehicles were recalled to replace the shift cable that couldwear out over time resulting in mismatches of the gear position indicated by the shift lever — model years 2004–2008Chevrolet Malibu, model years 2004–2007 Malibu Maxx, model years 2007-2008 Saturn Aura, model years 2013–2014Cadillac ATS, model year 2014 CTS and model years 2005–2008 Pontiac G6. We recorded approximately $150 million inAutomotive cost of sales to repair these vehicles.
• In the three months ended June 30, 2014 approximately 12.1 million vehicles were recalled to rework or replace ignition keysbecause the ignition switch may move out of the “run” position which may impact power steering and power braking. Thetiming of the key movement relative to the activation of the sensing algorithm of a crash event may result in airbags notdeploying — model years 2005–2009 Buick Allure and Lacrosse, model year 2004 Regal LS/GS, model years 2006–2011Lucerne, model years 1997–2005 Chevrolet Malibu, model years 2000-2007 Monte Carlo, model years 2010–2014 Camaro,model years 2000–2014 Impala, model years 1998–2002 Oldsmobile Intrigue, model years 1999–2004 Alero, model years1999–2005 Pontiac Grand Am, model years 2004–2008 Grand Prix, model years 2004–2006 Cadillac SRX, model years2003–2014 CTS, model years 2000–2005 Deville and model years 2006–2011 DTS. We recorded approximately $325 millionin Automotive cost of sales to repair these vehicles.
• In the three months ended March 31, 2014 and June 30, 2014 five and 17 recalls were announced covering approximately1.2 million and 4.0 million vehicles related to safety, customer satisfaction and other matters. We recorded approximately $70million and $450 million in Automotive cost of sales to repair these vehicles in the three months ended March 31, 2014 andJune 30, 2014. None of these announced recalls were individually significant.
In total we recorded approximately $1.3 billion and $1.1 billion for the above-described actions in the three months endedMarch 31, 2014 and June 30, 2014.
In the six months ended December 31, 2014 we announced the following recalls related to safety, customer satisfaction and othermatters, the costs of which are comprehended in the June 30, 2014 catch-up adjustment of $874 million associated with a change inestimate for previously sold vehicles:
• Approximately 1.1 million vehicles were recalled to repair a loose battery cable that could impact vehicle warning systems andloss of power steering assist — model years 2011-2014 Chevrolet Cruze.
• Approximately 0.7 million vehicles were recalled to repair ignition mechanisms where the ignition key could be pulled outwhile the vehicle is in the run position — model years 2004-2007 Saturn Vue, model years 2005-2006 Chevrolet Equinox,model year 2006 Pontiac Torrent.
• Approximately 0.6 million vehicles were recalled to replace the wave plate in all vehicles with 6T70 and 6T75 transmissionswhich could crack under certain circumstances — model years 2007-2009 GMC Acadia, Pontiac G6, Saturn Aura andOutlook, model years 2008-2009 Buick Enclave, Chevrolet Equinox and Malibu, Pontiac Torrent, Saturn Vue, model year2009 Chevrolet Traverse.
• Approximately 5.7 million vehicles were announced under 20 additional recalls, none of which were individually significant.
40

GENERAL MOTORS COMPANY AND SUBSIDIARIES
The following table summarizes the activity for customer satisfaction campaigns, safety recalls, non-compliance recalls and specialcoverage in GMNA, including courtesy transportation (dollars in millions):
2014 2013
Balance at January 1 . . . . . . . . . . . . . . . . . . . . . . . . . . . . . . . . . . . . . . . . . . . . . . . . . . . . . . . . . . . . . . . . . . . . . . . . $ 761 $ 851Additions . . . . . . . . . . . . . . . . . . . . . . . . . . . . . . . . . . . . . . . . . . . . . . . . . . . . . . . . . . . . . . . . . . . . . . . . . . . . . . . . . 1,333 115Payments . . . . . . . . . . . . . . . . . . . . . . . . . . . . . . . . . . . . . . . . . . . . . . . . . . . . . . . . . . . . . . . . . . . . . . . . . . . . . . . . . (110) (115)Adjustments to prior periods . . . . . . . . . . . . . . . . . . . . . . . . . . . . . . . . . . . . . . . . . . . . . . . . . . . . . . . . . . . . . . . . . . (19) 11
Balance at March 31 . . . . . . . . . . . . . . . . . . . . . . . . . . . . . . . . . . . . . . . . . . . . . . . . . . . . . . . . . . . . . . . . . . . . . . . . 1,965 862Additions . . . . . . . . . . . . . . . . . . . . . . . . . . . . . . . . . . . . . . . . . . . . . . . . . . . . . . . . . . . . . . . . . . . . . . . . . . . . . . . . . 1,151 128Payments . . . . . . . . . . . . . . . . . . . . . . . . . . . . . . . . . . . . . . . . . . . . . . . . . . . . . . . . . . . . . . . . . . . . . . . . . . . . . . . . . (329) (132)Adjustments to prior periods . . . . . . . . . . . . . . . . . . . . . . . . . . . . . . . . . . . . . . . . . . . . . . . . . . . . . . . . . . . . . . . . . . 691 (8)
Balance at June 30 . . . . . . . . . . . . . . . . . . . . . . . . . . . . . . . . . . . . . . . . . . . . . . . . . . . . . . . . . . . . . . . . . . . . . . . . . 3,478 850Additions . . . . . . . . . . . . . . . . . . . . . . . . . . . . . . . . . . . . . . . . . . . . . . . . . . . . . . . . . . . . . . . . . . . . . . . . . . . . . . . . . 163 51Payments . . . . . . . . . . . . . . . . . . . . . . . . . . . . . . . . . . . . . . . . . . . . . . . . . . . . . . . . . . . . . . . . . . . . . . . . . . . . . . . . . (637) (130)Adjustments to prior periods . . . . . . . . . . . . . . . . . . . . . . . . . . . . . . . . . . . . . . . . . . . . . . . . . . . . . . . . . . . . . . . . . . 52 (21)
Balance at September 30 . . . . . . . . . . . . . . . . . . . . . . . . . . . . . . . . . . . . . . . . . . . . . . . . . . . . . . . . . . . . . . . . . . . . . 3,056 750Additions . . . . . . . . . . . . . . . . . . . . . . . . . . . . . . . . . . . . . . . . . . . . . . . . . . . . . . . . . . . . . . . . . . . . . . . . . . . . . . . . . 133 119Payments . . . . . . . . . . . . . . . . . . . . . . . . . . . . . . . . . . . . . . . . . . . . . . . . . . . . . . . . . . . . . . . . . . . . . . . . . . . . . . . . . (542) (117)Adjustments to prior periods . . . . . . . . . . . . . . . . . . . . . . . . . . . . . . . . . . . . . . . . . . . . . . . . . . . . . . . . . . . . . . . . . . 82 9
Balance at December 31 . . . . . . . . . . . . . . . . . . . . . . . . . . . . . . . . . . . . . . . . . . . . . . . . . . . . . . . . . . . . . . . . . . . . . $ 2,729 $ 761
Adjustments to prior periods in the three months ended June 30, 2014 included: (1) a catch-up adjustment associated with a changein estimate for previously sold vehicles of $874 million; partially offset by (2) adjustments of approximately $95 million for courtesytransportation as a result of greater part availability and fewer customers utilizing courtesy transportation than originally estimated;and (3) approximately $80 million for costs originally estimated separately for ignition switches and ignition lock cylinders that arenow being shipped and repaired at the same time resulting in reduced costs. Based on the per vehicle part and labor cost, number ofvehicles impacted and the expected number of vehicles to be repaired we believe the amounts recorded are adequate to cover the costsof these recall campaigns.
Adjustments to prior periods in the three months ended September 30, 2014 included an additional catch-up adjustment to ourchange in estimate for previously sold vehicles, which was partially offset by a change in estimate on a previously announced specificrecall action due to reduced costs for both parts and labor. On a net basis, recall campaign and courtesy transportation adjustments forour previously sold vehicles increased approximately $52 million in the three months ended September 30, 2014.
Adjustments to prior periods in the three months ended December 31, 2014 included an additional catch-up adjustment to ourchange in estimate for previously sold vehicles. On a net basis, recall campaign and courtesy transportation adjustments for ourpreviously sold vehicles increased approximately $82 million in the three months ended December 31, 2014.
The Ignition Switch Recall has led to various governmental investigations and inquiries including a subpoena from the U.S.Attorney for the Southern District of New York, and investigations by Congress, the Securities and Exchange Commission (SEC) andvarious state attorneys general. In addition the Ignition Switch Recall and the other recalls described above have resulted in a numberof claims and lawsuits. Refer to Note 17 to our consolidated financial statements for additional information.
41

GENERAL MOTORS COMPANY AND SUBSIDIARIES
GM Europe
GME Total Net Sales and Revenue and EBIT (Loss)-Adjusted
Years Ended December 31,Year Ended
2014 vs. 2013 Change Variance Due To
2014 2013Favorable/
(Unfavorable) % Volume Mix Price Other
(Dollars in millions) (Dollars in billions)
Total net sales and revenue . . . . . . . . . . $ 22,235 $ 21,962 $ 273 1.2% $ 0.2 $ 0.7 $ — $ (0.5)EBIT (loss)-adjusted . . . . . . . . . . . . . . . $ (1,369) $ (869) $ (500) (57.5)% $ — $ 0.2 $ — $ (0.7)
(Vehicles in thousands)
Wholesale vehicle sales . . . . . . . . . . . . . 1,172 1,163 9 0.8%
Years Ended December 31,Year Ended
2013 vs. 2012 Change Variance Due To
2013 2012Favorable/
(Unfavorable) % Volume Mix Price Other
(Dollars in millions) (Dollars in billions)
Total net sales and revenue . . . . . . . . . . $ 21,962 $ 23,055 $ (1,093) (4.7)% $ (1.1) $ — $ (0.2) $ 0.2EBIT (loss)-adjusted . . . . . . . . . . . . . . . $ (869) $ (1,949) $ 1,080 55.4% $ (0.1) $ (0.3) $ (0.2) $ 1.7
(Vehicles in thousands)
Wholesale vehicle sales . . . . . . . . . . . . . 1,163 1,231 (68) (5.5)%
GME Total Net Sales and Revenue
In the year ended December 31, 2014 Total net sales and revenue increased due primarily to: (1) favorable vehicle mix due toincreased sales of higher priced vehicles; and (2) increased wholesale volumes associated with higher demand primarily for theMokka across the region and the Corsa and Insignia in Germany, Spain, United Kingdom, Italy and Poland, partially offset bydecreases across the Russian portfolio and lower demand for the Astra primarily in Germany, United Kingdom and Turkey; partiallyoffset by (3) unfavorable Other of $0.5 billion due primarily to net foreign currency effect related to the weakening of the RussianRuble against the U.S. Dollar, partially offset by the strengthening of the British Pound against the U.S. Dollar.
In the year ended December 31, 2013 Total net sales and revenue decreased due primarily to: (1) decreased wholesale volumesassociated with lower demand of the Astra, Corsa and Meriva in France, Italy, Russia and the Netherlands and across the RussianChevrolet portfolio, partially offset by higher demand for the Mokka and Adam across the region due to a weak European economy;and (2) unfavorable vehicle pricing primarily resulting from increased incentive support associated with difficult market conditions;partially offset by (3) favorable Other of $0.2 billion due primarily to favorable net foreign currency effect.
GME EBIT (Loss)-Adjusted
In the year ended December 31, 2014 EBIT (loss)-adjusted increased due primarily to: (1) unfavorable Other of $0.7 billion dueprimarily to restructuring related charges of $0.5 billion, net foreign currency effect of $0.3 billion due primarily to weakening of theRussian Ruble against the U.S. Dollar, partially offset by the strengthening of the British Pound against the U.S. Dollar, andunfavorable net effect of changes in the fair value of an embedded foreign currency derivative asset of $0.1 billion associated with along-term supply agreement, partially offset by decreased material and freight costs of $0.2 billion; partially offset by (2) favorablenet vehicle mix due to higher proportion of higher priced vehicles.
In the year ended December 31, 2013 EBIT (loss)-adjusted decreased due primarily to: (1) favorable Other of $1.7 billion dueprimarily to decreased manufacturing costs of $0.7 billion mainly resulting from decreased depreciation expense because of assetimpairments in December 2012 which decreased the depreciable base, decreased engineering expenses of $0.4 billion, decreasedmaterial and freight costs of $0.4 billion and a favorable net effect of changes in the fair value of an embedded foreign currency
42

GENERAL MOTORS COMPANY AND SUBSIDIARIES
derivative asset of $0.2 billion associated with a long-term supply agreement; partially offset by (2) unfavorable net vehicle mix dueto decreased sales of higher priced vehicles; (3) unfavorable vehicle pricing; and (4) decreased wholesale volumes.
GM International Operations
Focus on Chinese Market
We view the Chinese market as important to our global growth strategy and are employing a multi-brand strategy, led by our Buickand Chevrolet brands. In the coming years we plan to increasingly leverage our global architectures to increase the number ofnameplates under the Buick, Chevrolet and Cadillac brands in China and continue to grow our business under the Baojun and Wulingbrands. We operate in the Chinese market through a number of joint ventures and maintaining good relations with our joint venturepartners, which are affiliated with the Chinese government, is an important part of our China growth strategy.
The following tables summarize certain key operational and financial data for the China JVs (dollars in millions, vehicles inthousands):
Years Ended December 31,
2014 2013 2012
Total wholesale vehicles (a) . . . . . . . . . . . . . . . . . . . . . . . . . . . . . . . . . . . . . . . . . . . . . . . . . . . . . 3,613 3,239 2,909Market share . . . . . . . . . . . . . . . . . . . . . . . . . . . . . . . . . . . . . . . . . . . . . . . . . . . . . . . . . . . . . . . . . 14.8% 14.2% 14.6%Total net sales and revenue . . . . . . . . . . . . . . . . . . . . . . . . . . . . . . . . . . . . . . . . . . . . . . . . . . . . . . $ 43,853 $ 38,767 $ 33,364Net income . . . . . . . . . . . . . . . . . . . . . . . . . . . . . . . . . . . . . . . . . . . . . . . . . . . . . . . . . . . . . . . . . . . $ 4,312 $ 3,685 $ 3,198
(a) Including vehicles exported to markets outside of China.
December 31, 2014 December 31, 2013
Cash and cash equivalents . . . . . . . . . . . . . . . . . . . . . . . . . . . . . . . . . . . . . . . . . . . . . . . . . . . . . . . . . $ 6,176 $ 6,606Debt . . . . . . . . . . . . . . . . . . . . . . . . . . . . . . . . . . . . . . . . . . . . . . . . . . . . . . . . . . . . . . . . . . . . . . . . . . $ 151 $ 151
GMIO Total Net Sales and Revenue and EBIT-Adjusted
Years Ended December 31,Year Ended
2014 vs. 2013 Change Variance Due To
2014 2013Favorable/
(Unfavorable) % Volume Mix Price Other
(Dollars in millions)
Total net sales and revenue . . . . . . . . . . $ 14,392 $ 18,411 $ (4,019) (21.8)% $ (4.6) $ 0.4 $ 0.7 $ (0.4)EBIT-adjusted . . . . . . . . . . . . . . . . . . . . $ 1,222 $ 1,255 $ (33) (2.6)% $ (0.9) $ (0.1) $ 0.4 $ 0.6
(Vehicles in thousands)
Wholesale vehicle sales . . . . . . . . . . . . . 655 921 (266) (28.9)%
Years Ended December 31,Year Ended
2013 vs. 2012 Change Variance Due To
2013 2012Favorable/
(Unfavorable) % Volume Mix Price Other
(Dollars in millions) (Dollars in billions)
Total net sales and revenue . . . . . . . . . . $ 18,411 $ 20,588 $ (2,177) (10.6)% $ (0.8) $ (0.2) $ (0.5) $ (0.7)EBIT-adjusted . . . . . . . . . . . . . . . . . . . . $ 1,255 $ 2,538 $ (1,283) (50.6)% $ (0.3) $ (0.4) $ (0.3) $ (0.3)
(Vehicles in thousands)
Wholesale vehicle sales . . . . . . . . . . . . . 921 957 (36) (3.8)%
43

GENERAL MOTORS COMPANY AND SUBSIDIARIES
GMIO Total Net Sales and Revenue
The vehicle sales of our China JVs and of GM India prior to September 1, 2012, the date we consolidated GM India, are notrecorded in Total net sales and revenue. The results of our nonconsolidated joint ventures are recorded in Equity income.
In the year ended December 31, 2014 Total net sales and revenue decreased due primarily to: (1) decreased wholesale volumesprimarily related to discontinuing sales of the Chevrolet Spark, Aveo, Cruze, Captiva and Orlando in Europe and lower sales of olderversion SUVs and trucks (including the Tahoe, Yukon, Suburban, Sierra, and Silverado) and other carlines (such as the Acadia andTraverse) ahead of the new full-size truck introduction in the Middle East and lower sales of the Chevrolet Colorado, Sonic,Trailblazer, Cruze and Captiva in Thailand; and (2) unfavorable Other of $0.4 billion due primarily to unfavorable net foreigncurrency effect of $0.3 billion driven by the weakening of the Australian Dollar, South African Rand, Thai Baht and Indian Rupeeagainst the U.S. Dollar and decreased sales of components, parts and accessories of $0.1 billion; partially offset by (3) favorablevehicle pricing due primarily to sales of new full-size trucks (including the Tahoe, Suburban, Yukon, Escalade, Sierra and Silverado)in the Middle East and lower sales incentive offered on Chevrolet vehicles in Europe; and (4) favorable mix due primarily to animproved sales portfolio of the Malibu and Trax in Korea and the Tahoe and Yukon in the Middle East.
In the year ended December 31, 2013 Total net sales and revenue decreased due primarily to: (1) decreased wholesale volumes dueprimarily to lower sales of the Optra, Yukon, Colorado, Captiva, Sail and Aveo in the Middle East and lower sales of the ChevroletOrlando, Captiva, Cruze, Aveo and Spark in Europe partially offset by an increase from the consolidation of GM India effectiveSeptember 2012 resulting in an additional 57,000 wholesale vehicle sales (or 6.0%) in 2013; (2) unfavorable vehicle pricing due toincreased incentive support associated with strong competition, including an increase of $0.2 billion in Europe as a result of ourdecision to withdraw the Chevrolet Brand from Europe, an increase of $0.2 billion in the Middle East due to the competition on SUVsand trucks such as the Yukon, Tahoe, Suburban, Sierra and Silverado and increases of $0.1 billion in GM Holden, Ltd. (Holden) andAssociation of South East Asian Nations (ASEAN) for the Colorado, Captiva, Commodore, Trailblazer and Sonic; (3) unfavorablevehicle mix primarily in ASEAN due to a higher proportion of the lower priced Spin and a lower proportion of the higher pricedColorado; and (4) Other of $0.7 billion due primarily to unfavorable net foreign currency effect due to the weakening of theAustralian Dollar, South African Rand and Egyptian Pound against the U.S. Dollar of $0.4 billion and decreased sales of components,parts and accessories of $0.3 billion.
GMIO EBIT-Adjusted
In the year ended December 31, 2014 EBIT-adjusted decreased due primarily to: (1) decreased net wholesale volumes primarilyrelated to discontinuing sales of the Chevrolet Spark, Aveo, Cruze, Captiva and Orlando in Europe and lower sales of older versionSUVs and trucks and other carlines ahead of the new full-size truck introduction in the Middle East and Colorado, Sonic, Trailblazer,Cruze and Captiva in Thailand; and (2) unfavorable net vehicle mix due primarily to higher cost of the Commodore and Colorado inAustralia, partially offset by (3) favorable vehicle pricing due primarily to sales of new full-size trucks in the Middle East; and(4) favorable Other of $0.6 billion due primarily to favorable engineering cost of $0.3 billion, a decrease in selling, general andadvertising expense of $0.3 billion due primarily to the withdrawal of Chevrolet brand in Europe in 2013, favorable equity incomefrom China JVs of $0.3 billion, and favorable manufacturing costs and depreciation of $0.2 billion, partially offset by unfavorablerecall programs of $0.1 billion, a decrease in sales of components parts and accessories of $0.1 billion, tooling impairment charges of$0.1 billion related to the Sonic in Thailand, the Aveo in Korea and the Spin in Indonesia, and unfavorable net foreign currency effectof $0.1 billion.
In the year ended December 31, 2013 EBIT-adjusted decreased due primarily to: (1) unfavorable net vehicle mix primarily in theMiddle East due to deteriorated sales portfolio from the Yukon, Captiva, Optra and Australian markets due to deteriorated salesportfolio from high margin vehicles such as the Cruze; (2) unfavorable vehicle pricing excluding $0.2 billion sales incentive related towithdrawal of the Chevrolet brand from Europe; (3) unfavorable net wholesale volumes; and (4) Other of $0.3 billion due primarily tounfavorable manufacturing costs of $0.4 billion, unfavorable net foreign currency effect of $0.2 billion, and a decrease in sales ofcomponents, parts and accessories of $0.2 billion, partially offset by favorable material and freight cost of $0.3 billion, and increasedequity income, net of tax of $0.2 billion, from our interest in the increased net income of our China JVs.
44

GENERAL MOTORS COMPANY AND SUBSIDIARIES
GM South America
Venezuelan Operations
Our Venezuelan subsidiaries’ functional currency is the U.S. Dollar because of the hyperinflationary status of the Venezuelaneconomy.
Effective February 13, 2013 the Venezuelan government set the official fixed exchange rate of the Bolivar Fuerte at BsF 6.3 to$1.00 from BsF 4.3 to $1.00. The devaluation resulted in a charge of $0.2 billion recorded in Automotive cost of sales in the threemonths ended March 31, 2013 from the remeasurement of our Venezuelan subsidiaries’ non-U.S. Dollar denominated monetary assetsand liabilities. The remeasurement charge was treated as an adjustment for EBIT-adjusted reporting purposes.
Effective March 31, 2014 we changed the exchange rate we use for remeasuring our Venezuelan subsidiaries’ non-U.S. Dollardenominated monetary assets and liabilities from the Venezuela official exchange rate to the rate determined by an auction processconducted by Venezuela’s SICAD I because we believe the SICAD I rate is the most representative rate to be used forremeasurement. At March 31, 2014 the SICAD I exchange rate was BsF 10.7 to $1.00. The devaluation resulted in a charge of $0.4billion recorded in Automotive cost of sales in the three months ended March 31, 2014. The remeasurement charge in the threemonths ended March 31, 2014 was treated as an adjustment for EBIT-adjusted reporting purposes. In August 2014 the Venezuelangovernment announced the SICAD I rate as the official rate for the automotive industry going forward and clarified BsF 6.3 to $1.00as the official rate for pre-existing debt settlements. Gains on pre-existing debt settlements at more favorable rates than the SICAD Iexchange rate will not be recognized until collection is assured. At December 31, 2014 the SICAD I exchange rate was BsF 12.0 to$1.00 and we recorded an insignificant net devaluation loss in Automotive costs of sales in the nine months ended December 31,2014. The non-U.S. Dollar denominated assets and liabilities of our Venezuelan subsidiaries may be impacted by periodic auctions inSICAD I rates which may have a material impact on the results of operations in Venezuela in future periods. Based on ourDecember 31, 2014 non-U.S. Dollar denominated net monetary assets a charge of less than $0.1 billion would result for every 10%devaluation of the BsF from the SICAD I exchange rate of BsF 12.0 to $1.00 in the period of devaluation.
The Venezuelan government has foreign exchange control regulations that make it difficult to convert BsF to U.S. Dollar and affectour Venezuelan subsidiaries’ ability to pay non-BsF denominated obligations and to pay dividends. The total amounts pendinggovernment approval for settlement in U.S. Dollar at December 31, 2014 and December 31, 2013 were BsF 3.5 billion (equivalent to$0.5 billion) and BsF 3.7 billion (equivalent to $0.6 billion). These amounts include dividend requests in the amount of BsF 0.7 billion(equivalent to $0.1 billion) that have been pending from 2007. At December 31, 2014 we continued to consolidate our Venezuelansubsidiaries because recent developments, including participation in SICAD I auctions for new orders in August 2014, settlements ofpreexisting debt in October and November 2014 and execution of a labor agreement in November 2014 resulted in increases inproduction in the three months ended December 31, 2014. Our Venezuelan subsidiaries’ net assets were $0.5 billion at December 31,2014, including non-U.S. Dollar denominated net monetary assets of $0.5 billion. At December 31, 2014 other consolidated entitieshad receivables from our Venezuelan subsidiaries of $0.4 billion.
In January 2014 the Venezuela government enacted a law limiting sale prices and establishing a maximum margin of 30% above adefined cost structure. Because the Venezuela government is still determining the application of certain aspects of this law it isunclear based on the current regulations how this new law may affect our current vehicle and parts and accessories sale pricingstructure. These regulations, when considered with the foreign currency exchange regulations, high inflation, governmental policiesnegatively impacting our ability to implement labor force reductions and obtain vehicle imports licenses, the recent downward trendin the price of oil and other circumstances in Venezuela, may impact our ability to fully benefit from and maintain our controllingfinancial interest in our Venezuelan subsidiaries. The financial impact on our operations in Venezuela of these events and associatedongoing restrictions are uncertain. If a determination is made in the future that we no longer maintain a controlling financial interest,we may incur a charge, based on current exchange rates, of up to $0.9 billion.
45

GENERAL MOTORS COMPANY AND SUBSIDIARIES
GMSA Total Net Sales and Revenue and EBIT (Loss)-Adjusted
Years Ended December 31,Year Ended
2014 vs. 2013 Change Variance Due To
2014 2013Favorable/
(Unfavorable) % Volume Mix Price Other
(Dollars in millions) (Dollars in billions)
Total net sales and revenue . . . . . . . . . . $ 13,115 $ 16,478 $ (3,363) (20.4)% $ (2.4) $ 0.1 $ 1.1 $ (2.1)EBIT (loss)-adjusted . . . . . . . . . . . . . . . $ (180) $ 327 $ (507) n.m. $ (0.5) $ (0.1) $ 1.1 $ (1.0)
(Vehicles in thousands)
Wholesale vehicle sales . . . . . . . . . . . . 886 1,053 (167) (15.9)%
n.m. = not meaningful
Years Ended December 31,Year Ended
2013 vs. 2012 Change Variance Due To
2013 2012Favorable/
(Unfavorable) % Volume Mix Price Other
(Dollars in millions) (Dollars in billions)
Total net sales and revenue . . . . . . . . . . $ 16,478 $ 16,700 $ (222) (1.3)% $ — $ 0.6 $ 0.9 $ (1.7)EBIT-adjusted . . . . . . . . . . . . . . . . . . . . $ 327 $ 457 $ (130) (28.4)% $ — $ 0.3 $ 0.9 $ (1.3)
(Vehicles in thousands)
Wholesale vehicle sales . . . . . . . . . . . . . 1,053 1,050 3 0.3%
GMSA Total Net Sales and Revenue
In the year ended December 31, 2014 Total net sales and revenue decreased due primarily to: (1) decreased wholesale volumes inBrazil associated with lower demand of the Chevrolet Celta, Classic and Agile and decreases across the portfolios in Argentina andVenezuela caused by difficult economic conditions; and (2) unfavorable Other of $2.1 billion due primarily to unfavorable net foreigncurrency effect due to the strengthening of the U.S. Dollar against all currencies across the region; partially offset by (3) favorablevehicle pricing primarily due to high inflation in Argentina and Venezuela.
In the year ended December 31, 2013 Total net sales and revenue decreased due primarily to: (1) unfavorable Other of $1.7 billiondue primarily to unfavorable net foreign currency effect due to the strengthening of the U.S. Dollar against the Brazilian Real andArgentinian Peso and the devaluation of the Venezuelan Bolivar of $1.9 billion, partially offset by increased revenue from parts andaccessories sales of $0.1 billion; partially offset by (2) favorable vehicle pricing primarily due to high inflation in Venezuela andArgentina; and (3) favorable vehicle mix due to increased sales of the Chevrolet Trailblazer, Captiva and S-10 in Brazil and theChevrolet Orlando and Tahoe in Venezuela.
GMSA EBIT (Loss)-Adjusted
In the year ended December 31, 2014 GMSA had EBIT (loss)-adjusted compared to EBIT-adjusted in the year ended December 31,2013 due primarily to: (1) decreased wholesale volumes in Brazil associated with lower demand of the Chevrolet Celta, Classic andAgile and decreases across the portfolios in Argentina and Venezuela caused by difficult economic conditions; and (2) unfavorableOther of $1.0 billion due to unfavorable net foreign currency effect due to the strengthening of the U.S. Dollar against all currenciesacross the region; partially offset by (3) favorable vehicle pricing primarily due to high inflation in Argentina and Venezuela.
In the year ended December 31, 2013 EBIT-adjusted decreased due primarily to: (1) unfavorable Other of $1.3 billion due primarily tounfavorable net foreign currency effect as a result of the strengthening of the U.S. Dollar against the Brazilian Real and Argentinian Peso andthe devaluation of the Venezuelan Bolivar of $1.1 billion, increased selling, general and administrative expense due primarily to a decreasein contingency reserves of $0.1 billion in the corresponding period of 2012 due to the resolution of certain items at amounts lower thanpreviously expected, and a gain of $50 million on the purchase of GMAC de Venezuela CA in the corresponding period of 2012; partially
46

GENERAL MOTORS COMPANY AND SUBSIDIARIES
offset by (2) favorable vehicle pricing effect primarily driven by high inflation in Venezuela and Argentina; and (3) favorable net vehicle mixdue to increased sales of the Chevrolet Trailblazer, Captiva and S-10 in Brazil and the Chevrolet Orlando and Tahoe in Venezuela.
GM Financial
Years Ended December 31,Year Ended
2014 vs. 2013 ChangeYear Ended
2013 vs. 2012 Change
2014 2013 2012 Amount % Amount %
(Dollars in millions)
Total revenue . . . . . . . . . . . . . . . . . . . . . . . . . . . . . . $ 4,854 $ 3,344 $ 1,961 $ 1,510 45.2% $ 1,383 70.5%Provision for loan losses . . . . . . . . . . . . . . . . . . . . . $ 604 $ 475 $ 304 $ 129 27.2% $ 171 56.3%Income before income taxes-adjusted . . . . . . . . . . . $ 803 $ 898 $ 744 $ (95) (10.6)% $ 154 20.7%
(Dollars in billions)
Average debt outstanding . . . . . . . . . . . . . . . . . . . . $ 32.2 $ 21.0 $ 9.5 $ 11.2 53.3% $ 11.5 121.1%Effective rate of interest paid . . . . . . . . . . . . . . . . . 4.4% 3.4% 3.0% 1.0% 0.4%
GM Financial Revenue
In the year ended December 31, 2014 Total revenue increased due primarily to: (1) increased finance charge income of $0.9 billiondue to the acquisition of Ally Financial international operations; and (2) increased leased vehicle income of $0.5 billion due to a largerlease portfolio.
In the year ended December 31, 2013 Total revenue increased due primarily to: (1) increased finance charge income of $1.0 billiondue to the acquisition of Ally Financial international operations and increased loan originations; and (2) increased leased vehicleincome of $0.3 billion due to a larger lease portfolio.
GM Financial Income Before Income Taxes-Adjusted
In the year ended December 31, 2014 Income before income taxes-adjusted decreased due primarily to: (1) increased interest expensesof $0.7 billion due to higher average debt outstanding and effective rate of interest paid; (2) increased operating expenses of $0.4 billiondue to the acquisition of Ally Financial international operations; (3) increased leased vehicle expenses of $0.4 billion due to a larger leaseportfolio; and (4) increased provision for loan losses of $0.1 billion; partially offset by (5) increased revenue of $1.5 billion.
In the year ended December 31, 2013 Income before income taxes-adjusted increased due primarily to: (1) increased revenue of$1.4 billion; partially offset by (2) increased provision for loan losses; (3) increased interest expenses of $0.4 billion; (4) increasedoperating expenses of $0.4 billion; and (5) increased leased vehicle expenses of $0.2 billion. These changes are due primarily to theacquisition of the Ally Financial international operations.
Liquidity and Capital Resources
Liquidity Overview
We believe that our current level of cash and cash equivalents, marketable securities and availability under our revolving creditfacilities will be sufficient to meet our liquidity needs. We expect to have substantial cash requirements going forward which we planto fund through total available liquidity and cash flows generated from operations. We also maintain access to the capital markets,which may provide an additional source of liquidity. Our future uses of cash, which may vary from time to time based on marketconditions and other factors, are centered around three objectives: (1) reinvest in our business; (2) continue to strengthen our balancesheet; and (3) return cash to stockholders. Our known future material uses of cash include, among other possible demands: (1) capitalexpenditures of approximately $9.0 billion as well as payments for engineering and product development activities; (2) paymentsassociated with recently announced vehicle recalls and the Program of approximately $1.2 billion; (3) payments to service debt and
47

GENERAL MOTORS COMPANY AND SUBSIDIARIES
other long-term obligations, including contributions to non-U.S. pension plans and U.S. non-qualified plans of approximately $1.2billion; (4) payments for previously announced restructuring activities of approximately $1.0 billion; (5) acquiring Ally Financial’sequity interests in SAIC-GMAC of approximately $1.0 billion (acquisition completed in January 2015); and (6) dividend payments onour common stock that are declared by our Board of Directors.
Our liquidity plans are subject to a number of risks and uncertainties, including those described in Item 1A. Risk Factors section ofthis 2014 Form 10-K, some of which are outside our control. Macroeconomic conditions could limit our ability to successfullyexecute our business plans and therefore adversely affect our liquidity plans and compliance with certain covenants. Refer to Note 14to our consolidated financial statements for the discussion of our financial and operational covenants.
Recent Management Initiatives
We continue to monitor and evaluate opportunities to strengthen our balance sheet and competitive position over the long term.These actions may include opportunistic payments to reduce our long-term obligations while maintaining minimal automotivefinancial leverage as well as the possibility of acquisitions, dispositions and strategic alliances that we believe would generatesignificant advantages and substantially strengthen our business. These actions may include additional loans, investments with ourjoint venture partners or the acquisitions of certain operations or ownership stakes in outside businesses. These actions may negativelyimpact our liquidity in the short term including the payments related to our recent recalls and the related litigation.
In October 2014 we amended our two primary revolving credit facilities, increasing our aggregate borrowing capacity from $11.0billion to $12.5 billion. These facilities consist of a three-year, $5.0 billion facility and a five-year, $7.5 billion facility. Both facilitiesare available to the Company as well as certain wholly-owned subsidiaries, including GM Financial. The three-year, $5.0 billionfacility allows for borrowings in U.S. Dollars and other currencies and includes a GM Financial borrowing sub-limit of $2.0 billion, aletter of credit sub-facility of $1.6 billion and a Brazilian Real sub-facility of $0.3 billion. The five-year, $7.5 billion facility allowsfor borrowings in U.S. Dollars and other currencies and includes a GM Financial borrowing sub-limit of $2.0 billion, a letter of creditsub-limit of $0.5 billion and a Brazilian Real sub-facility of $0.2 billion.
In November 2014 we issued $2.5 billion in aggregate principal amount of senior unsecured notes. In December 2014 we usedproceeds from the issuance of these notes plus available cash to redeem all of the remaining outstanding shares of our Series APreferred Stock for a total price of $3.9 billion which was equal to their aggregate liquidation amount, including accumulateddividends. The redemption reduced Net income attributable to common stockholders by $0.8 billion.
In the year ended December 31, 2014 GM Financial issued $3.5 billion, Euro 500 million and CAD 400 million in aggregateprincipal amount on senior unsecured notes. In January 2015 GM Financial issued $2.25 billion in aggregate principal amount ofsenior unsecured notes comprising $1.0 billion of 3.15% notes due in January 2020, $1.0 billion of 4.0% notes due in January 2025and $250 million of floating rate notes due in January 2020.
Automotive
Available Liquidity
Total available liquidity includes cash, cash equivalents, marketable securities and funds available under revolving credit facilities.The amount of available liquidity is subject to intra-month and seasonal fluctuations and includes balances held by various businessunits and subsidiaries worldwide that are needed to fund their operations.
We manage our liquidity primarily at our treasury centers as well as at certain of our significant consolidated overseas subsidiaries.Available liquidity held within North America and at our regional treasury centers represented approximately 87% of our availableliquidity at December 31, 2014. A portion of our available liquidity includes amounts deemed indefinitely reinvested in our foreignsubsidiaries. We have used and will continue to use other methods including intercompany loans to utilize these funds across ourglobal operations as needed.
48

GENERAL MOTORS COMPANY AND SUBSIDIARIES
Our cash equivalents and marketable securities balances are primarily denominated in U.S. Dollars and include investments in U.S.government and agency obligations, foreign government securities, time deposits and corporate debt securities. Our investmentguidelines, which we may change from time to time, prescribe certain minimum credit worthiness thresholds and limit our exposuresto any particular sector, asset class, issuance or security type. Substantially all of our current investments in debt securities are with A/A2 or better rated issuers.
We use credit facilities as a mechanism to provide additional flexibility in managing our global liquidity and to fund workingcapital needs at certain of our subsidiaries. The total size of our credit facilities was $12.6 billion and $11.2 billion at December 31,2014 and 2013 which consisted primarily of the revolving credit facilities previously disclosed. We did not borrow against our twoprimary facilities, but had amounts in use under the letter of credit sub-facility of $0.5 billion at December 31, 2014. At December 31,2014 GM Financial had access to the revolving credit facilities, but did not borrow against them. In September 2014 the collateralpreviously securing these revolving credit facilities was released upon obtaining an investment grade corporate rating from bothMoody’s Investor Service (Moody’s) and Standard & Poor’s (S&P).
The following table summarizes our automotive available liquidity (dollars in billions):
December 31, 2014 December 31, 2013
Cash and cash equivalents . . . . . . . . . . . . . . . . . . . . . . . . . . . . . . . . . . . . . . . . . . . . . . . . . . . . . . . . . $ 16.0 $ 18.9Marketable securities . . . . . . . . . . . . . . . . . . . . . . . . . . . . . . . . . . . . . . . . . . . . . . . . . . . . . . . . . . . . 9.2 9.0
Available liquidity . . . . . . . . . . . . . . . . . . . . . . . . . . . . . . . . . . . . . . . . . . . . . . . . . . . . . . . . . . . . . . . 25.2 27.9Available under credit facilities . . . . . . . . . . . . . . . . . . . . . . . . . . . . . . . . . . . . . . . . . . . . . . . . . . . . 12.0 10.4
Total automotive available liquidity . . . . . . . . . . . . . . . . . . . . . . . . . . . . . . . . . . . . . . . . . . . . . . . . . $ 37.2 $ 38.3
The following table summarizes the changes in our automotive available liquidity (dollars in billions):
Year Ended2014 vs. 2013
Change
Operating cash flow . . . . . . . . . . . . . . . . . . . . . . . . . . . . . . . . . . . . . . . . . . . . . . . . . . . . . . . . . . . . . . . . . . . . . . . . . . . . . . . . $ 10.1Capital expenditures . . . . . . . . . . . . . . . . . . . . . . . . . . . . . . . . . . . . . . . . . . . . . . . . . . . . . . . . . . . . . . . . . . . . . . . . . . . . . . . . (7.0)Issuance of senior unsecured notes . . . . . . . . . . . . . . . . . . . . . . . . . . . . . . . . . . . . . . . . . . . . . . . . . . . . . . . . . . . . . . . . . . . . . 2.5Redemption of Series A Preferred Stock . . . . . . . . . . . . . . . . . . . . . . . . . . . . . . . . . . . . . . . . . . . . . . . . . . . . . . . . . . . . . . . . (3.9)Dividends paid (excluding charge related to redemption of Series A Preferred Stock) . . . . . . . . . . . . . . . . . . . . . . . . . . . . . (2.4)Increase in available credit facilities . . . . . . . . . . . . . . . . . . . . . . . . . . . . . . . . . . . . . . . . . . . . . . . . . . . . . . . . . . . . . . . . . . . . 1.6Effect of foreign currency . . . . . . . . . . . . . . . . . . . . . . . . . . . . . . . . . . . . . . . . . . . . . . . . . . . . . . . . . . . . . . . . . . . . . . . . . . . . (1.1)Capital contribution to GM Financial for the acquisition of Ally Financial’s equity interest in SAIC-GMAC . . . . . . . . . . (0.7)Other . . . . . . . . . . . . . . . . . . . . . . . . . . . . . . . . . . . . . . . . . . . . . . . . . . . . . . . . . . . . . . . . . . . . . . . . . . . . . . . . . . . . . . . . . . . . (0.2)
Total change in automotive available liquidity . . . . . . . . . . . . . . . . . . . . . . . . . . . . . . . . . . . . . . . . . . . . . . . . . . . . . . . . . . . $ (1.1)
49

GENERAL MOTORS COMPANY AND SUBSIDIARIES
Cash Flow
The following tables summarize automotive cash flows from operating, investing and financing activities (dollars in billions):
Years Ended December 31, Year Ended2014 vs. 2013
Change
Year Ended2013 vs. 2012
Change2014 2013 2012
Operating ActivitiesNet income . . . . . . . . . . . . . . . . . . . . . . . . . . . . . . . . . . . . . . . . . . . . . . . . . . . . $ 3.5 $ 4.7 $ 5.6 $ (1.2) $ (0.9)Depreciation, amortization and impairments . . . . . . . . . . . . . . . . . . . . . . . . . . 6.3 7.6 38.5 (1.3) (30.9)Pension & OPEB activities . . . . . . . . . . . . . . . . . . . . . . . . . . . . . . . . . . . . . . . (0.9) (0.8) (0.5) (0.1) (0.3)Working capital . . . . . . . . . . . . . . . . . . . . . . . . . . . . . . . . . . . . . . . . . . . . . . . . (1.6) (0.5) (0.7) (1.1) 0.2Equipment on operating leases . . . . . . . . . . . . . . . . . . . . . . . . . . . . . . . . . . . . (1.9) (1.0) 0.4 (0.9) (1.4)Accrued liabilities and other liabilities . . . . . . . . . . . . . . . . . . . . . . . . . . . . . . 6.0 0.7 1.0 5.3 (0.3)Deferred tax valuation allowance release in the U.S. and Canada . . . . . . . . . — — (36.3) — 36.3Other . . . . . . . . . . . . . . . . . . . . . . . . . . . . . . . . . . . . . . . . . . . . . . . . . . . . . . . . (1.3) 0.3 1.6 (1.6) (1.3)
Automotive cash flows from operating activities . . . . . . . . . . . . . . . . . . . . . . $ 10.1 $ 11.0 $ 9.6 $ (0.9) $ 1.4
In the year ended December 31, 2014 the change in accrued liabilities and other liabilities was due primarily to recalls and deposits fromrental car companies. The change in other was primarily related to deferred tax benefit in 2014 compared to deferred tax expense in 2013.
In the year ended December 31, 2013 the change in depreciation, amortization and impairments was due primarily to goodwillimpairment in GMNA of $26.4 billion and property impairment in GME of $3.7 billion recorded in 2012. The change in Other wasprimarily related to gain on sale of our investment in Ally Financial and changes in our investment in Peugeot S.A. (PSA).
Years Ended December 31, Year Ended2014 vs. 2013
Change
Year Ended2013 vs. 2012
Change2014 2013 2012
Investing ActivitiesCapital expenditures . . . . . . . . . . . . . . . . . . . . . . . . . . . . . . . . . . . . . . . . . . . . $ (7.0) $ (7.5) $ (8.1) $ 0.5 $ 0.6Liquidations (acquisitions) of marketable securities, net . . . . . . . . . . . . . . . . (0.4) 0.1 6.9 (0.5) (6.8)Sale of our investment in Ally Financial . . . . . . . . . . . . . . . . . . . . . . . . . . . . . — 0.9 — (0.9) 0.9Other . . . . . . . . . . . . . . . . . . . . . . . . . . . . . . . . . . . . . . . . . . . . . . . . . . . . . . . . 0.2 0.4 0.5 (0.2) (0.1)
Automotive cash flows from investing activities . . . . . . . . . . . . . . . . . . . . . . $ (7.2) $ (6.1) $ (0.7) $ (1.1) $ (5.4)
In the years ended December 31, 2014 and 2013 the change in marketable securities was primarily a result of rebalancing ourinvestment portfolio between marketable securities and cash and cash equivalents as part of liquidity management in the normalcourse of business.
50

GENERAL MOTORS COMPANY AND SUBSIDIARIES
Years Ended December 31, Year Ended2014 vs. 2013
Change
Year Ended2013 vs. 2012
Change2014 2013 2012
Financing ActivitiesIssuance of senior unsecured notes . . . . . . . . . . . . . . . . . . . . . . . . . . . . . . . . . $ 2.5 $ 4.5 $ — $ (2.0) $ 4.5Prepayment of Canadian Health Care Trust (HCT) notes (principal) . . . . . . . — (1.1) — 1.1 (1.1)Early redemption of GM Korea preferred stock . . . . . . . . . . . . . . . . . . . . . . . — (0.7) (0.7) 0.7 —Redemption and purchase of Series A Preferred Stock . . . . . . . . . . . . . . . . . . (3.9) (3.2) — (0.7) (3.2)Purchase of Common Stock . . . . . . . . . . . . . . . . . . . . . . . . . . . . . . . . . . . . . . . (0.2) — (5.1) (0.2) 5.1Dividends paid (excluding charge related to redemption and purchase of
Series A Preferred Stock) . . . . . . . . . . . . . . . . . . . . . . . . . . . . . . . . . . . . . . (2.4) (0.9) (0.9) (1.5) —Other . . . . . . . . . . . . . . . . . . . . . . . . . . . . . . . . . . . . . . . . . . . . . . . . . . . . . . . . (0.1) — (0.4) (0.1) 0.4
Automotive cash flows from financing activities . . . . . . . . . . . . . . . . . . . . . . $ (4.1) $ (1.4) $ (7.1) $ (2.7) $ 5.7
In the year ended December 31, 2014 the change in dividends paid was due primarily to payments for common stock dividends.
In the year ended December 31, 2013 the change in other was due primarily to net activity of debt facilities held by certain of ourforeign subsidiaries, primarily in GMIO and GMSA.
Adjusted Free Cash Flow
The following table summarizes adjusted free cash flow (dollars in billions):
Years Ended December 31,
2014 2013 2012
Operating cash flow . . . . . . . . . . . . . . . . . . . . . . . . . . . . . . . . . . . . . . . . . . . . . . . . . . . . . . . . . . . . . . . . . . . $ 10.1 $ 11.0 $ 9.6Less: capital expenditures . . . . . . . . . . . . . . . . . . . . . . . . . . . . . . . . . . . . . . . . . . . . . . . . . . . . . . . . . . . . . . (7.0) (7.5) (8.0)Adjustments . . . . . . . . . . . . . . . . . . . . . . . . . . . . . . . . . . . . . . . . . . . . . . . . . . . . . . . . . . . . . . . . . . . . . . . . . — 0.2 2.7
Adjusted free cash flow . . . . . . . . . . . . . . . . . . . . . . . . . . . . . . . . . . . . . . . . . . . . . . . . . . . . . . . . . . . . . . . . $ 3.1 $ 3.7 $ 4.3
Adjustments to free cash flow included: (1) pension contributions related to the previously announced annuitization of the U.S.salaried pension plan in August 2014 and March 2013 of $0.1 billion; (2) accrued interest on the prepayment of the HCT notes of $0.2billion in October 2013; and (3) voluntary contributions to the U.S. salaried pension plan for the purchase of annuity contracts of $2.3billion and the premium paid to purchase our common stock from the United States Department of the Treasury of $0.4 billion inDecember 2012.
51

GENERAL MOTORS COMPANY AND SUBSIDIARIES
Status of Credit Ratings
We receive ratings from four independent credit rating agencies: DBRS Limited, Fitch Ratings (Fitch), Moody’s and S&P. DBRSLimited, Moody’s and S&P currently rate our corporate credit at investment grade while Fitch currently rates our corporate credit atnon-investment grade. The following table summarizes our credit ratings at January 30, 2015:
CorporateRevolving Credit
Facilities Senior Unsecured Outlook
DBRS Limited . . . . . . . . . BBB (low) BBB (low) N/A StableFitch . . . . . . . . . . . . . . . . . BB+ BB+ BB+ PositiveMoody’s . . . . . . . . . . . . . . Investment Grade Baa3 Ba1 StableS&P . . . . . . . . . . . . . . . . . BBB- BBB- BBB- Stable
Rating actions taken by each of the credit rating agencies from January 1, 2014 through January 30, 2015 were as follows:
DBRS Limited: Assigned revolving credit facilities rating of BBB (low) in October 2014.
Fitch: Assigned a rating of BB+ to our senior unsecured notes issued in November 2014. Assigned revolving credit facilities ratingof BB+ in October 2014.
Moody’s: Assigned a rating of Ba1 to our senior unsecured notes issued in November 2014. Assigned revolving credit facilitiesrating of Baa3 in October 2014.
S&P: Assigned a rating of BBB- to our senior unsecured notes issued in November 2014. Assigned revolving credit facilities ratingof BBB- in October 2014. Upgraded our corporate rating and senior unsecured rating to an investment grade rating of BBB- fromBB+ and revised their outlook to Stable from Positive in September 2014.
Improving credit ratings provides us with greater financial flexibility and a lower cost of borrowing. Additionally the collateralformerly pledged to our revolving credit facilities was released in conjunction with achieving investment grade status from bothMoody’s and S&P.
Automotive Financing — GM Financial
Liquidity Overview
GM Financial’s primary sources of cash are finance charge income, leasing income, servicing fees, net distributions from secureddebt, secured and unsecured debt borrowings and collections and recoveries on finance receivables. GM Financial’s primary uses ofcash are purchases of finance receivables and leased vehicles, funding of commercial finance receivables, business acquisitions,repayment of secured and unsecured debt, funding credit enhancement requirements for secured debt, operating expenses and interestcosts. GM Financial continues to monitor and evaluate opportunities to optimize its liquidity position and the mix of its debt.
Available Liquidity
The following table summarizes GM Financial’s available liquidity (dollars in billions):
December 31, 2014 December 31, 2013
Cash and cash equivalents . . . . . . . . . . . . . . . . . . . . . . . . . . . . . . . . . . . . . . . . . . . . . . . . . . . . . . . . . $ 3.0 $ 1.1Borrowing capacity on unpledged eligible assets . . . . . . . . . . . . . . . . . . . . . . . . . . . . . . . . . . . . . . . 4.8 1.6Borrowing capacity on committed unsecured lines of credit . . . . . . . . . . . . . . . . . . . . . . . . . . . . . . 0.5 0.6
Available liquidity . . . . . . . . . . . . . . . . . . . . . . . . . . . . . . . . . . . . . . . . . . . . . . . . . . . . . . . . . . . . . . . $ 8.3 $ 3.3
52
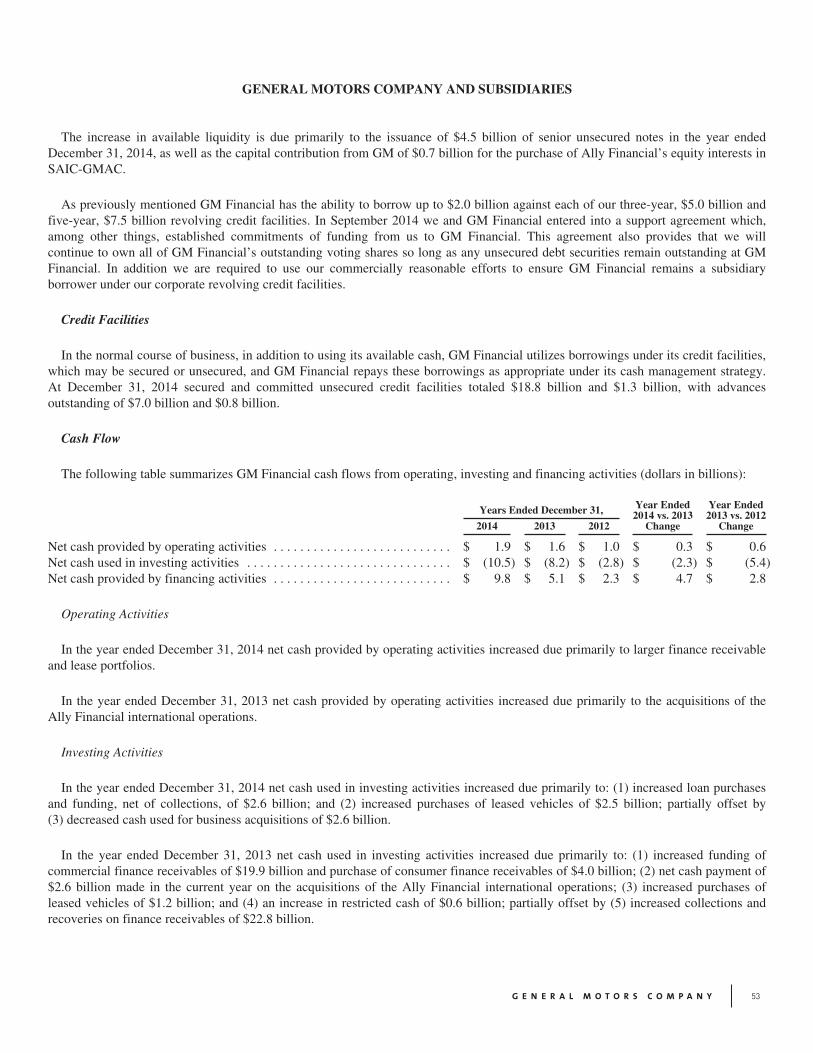
GENERAL MOTORS COMPANY AND SUBSIDIARIES
The increase in available liquidity is due primarily to the issuance of $4.5 billion of senior unsecured notes in the year endedDecember 31, 2014, as well as the capital contribution from GM of $0.7 billion for the purchase of Ally Financial’s equity interests inSAIC-GMAC.
As previously mentioned GM Financial has the ability to borrow up to $2.0 billion against each of our three-year, $5.0 billion andfive-year, $7.5 billion revolving credit facilities. In September 2014 we and GM Financial entered into a support agreement which,among other things, established commitments of funding from us to GM Financial. This agreement also provides that we willcontinue to own all of GM Financial’s outstanding voting shares so long as any unsecured debt securities remain outstanding at GMFinancial. In addition we are required to use our commercially reasonable efforts to ensure GM Financial remains a subsidiaryborrower under our corporate revolving credit facilities.
Credit Facilities
In the normal course of business, in addition to using its available cash, GM Financial utilizes borrowings under its credit facilities,which may be secured or unsecured, and GM Financial repays these borrowings as appropriate under its cash management strategy.At December 31, 2014 secured and committed unsecured credit facilities totaled $18.8 billion and $1.3 billion, with advancesoutstanding of $7.0 billion and $0.8 billion.
Cash Flow
The following table summarizes GM Financial cash flows from operating, investing and financing activities (dollars in billions):
Years Ended December 31, Year Ended2014 vs. 2013
Change
Year Ended2013 vs. 2012
Change2014 2013 2012
Net cash provided by operating activities . . . . . . . . . . . . . . . . . . . . . . . . . . . $ 1.9 $ 1.6 $ 1.0 $ 0.3 $ 0.6Net cash used in investing activities . . . . . . . . . . . . . . . . . . . . . . . . . . . . . . . $ (10.5) $ (8.2) $ (2.8) $ (2.3) $ (5.4)Net cash provided by financing activities . . . . . . . . . . . . . . . . . . . . . . . . . . . $ 9.8 $ 5.1 $ 2.3 $ 4.7 $ 2.8
Operating Activities
In the year ended December 31, 2014 net cash provided by operating activities increased due primarily to larger finance receivableand lease portfolios.
In the year ended December 31, 2013 net cash provided by operating activities increased due primarily to the acquisitions of theAlly Financial international operations.
Investing Activities
In the year ended December 31, 2014 net cash used in investing activities increased due primarily to: (1) increased loan purchasesand funding, net of collections, of $2.6 billion; and (2) increased purchases of leased vehicles of $2.5 billion; partially offset by(3) decreased cash used for business acquisitions of $2.6 billion.
In the year ended December 31, 2013 net cash used in investing activities increased due primarily to: (1) increased funding ofcommercial finance receivables of $19.9 billion and purchase of consumer finance receivables of $4.0 billion; (2) net cash payment of$2.6 billion made in the current year on the acquisitions of the Ally Financial international operations; (3) increased purchases ofleased vehicles of $1.2 billion; and (4) an increase in restricted cash of $0.6 billion; partially offset by (5) increased collections andrecoveries on finance receivables of $22.8 billion.
53

GENERAL MOTORS COMPANY AND SUBSIDIARIES
Financing Activities
In the year ended December 31, 2014 net cash provided by financing activities increased due primarily to: (1) increased borrowingsunder secured and unsecured debt of $5.6 billion; and (2) repayment of debt to Ally Financial of $1.4 billion in 2013, with no relatedactivity in 2014; partially offset by (3) increased debt repayment of $2.8 billion.
In the year ended December 31, 2013 net cash provided by financing activities increased due primarily to: (1) increased borrowingsunder secured and unsecured debt of $14.0 billion; partially offset by (2) increased debt repayment of $9.7 billion; and (3) therepayment of $1.4 billion in certain debt assumed as part of the acquisitions of the Ally Financial international operations.
Off-Balance Sheet Arrangements
We do not currently utilize off-balance sheet securitization arrangements. All trade or financing receivables and related obligationssubject to securitization programs are recorded on our consolidated balance sheets at December 31, 2014 and 2013.
Contractual Obligations and Other Long-Term Liabilities
We have minimum commitments under contractual obligations, including purchase obligations. A purchase obligation is defined as anagreement to purchase goods or services that is enforceable and legally binding on us and that specifies all significant terms, including: fixedor minimum quantities to be purchased; fixed, minimum, or variable price provisions; and the approximate timing of the transaction. Otherlong-term liabilities are defined as long-term liabilities that are recorded on our consolidated balance sheet. Based on this definition, thefollowing table includes only those contracts which include fixed or minimum obligations. The majority of our purchases are not included inthe table as they are made under purchase orders which are requirements based and accordingly do not specify minimum quantities.
The following table summarizes aggregated information about our outstanding contractual obligations and other long-termliabilities at December 31, 2014 (dollars in millions):
Payments Due by Period
2015 2016-2017 2018-2019 2020 and after Total
Automotive debt . . . . . . . . . . . . . . . . . . . . . . . . . . . . . . . . . . . . . . . . . . $ 323 $ 252 $ 1,599 $ 6,949 $ 9,123Automotive Financing debt . . . . . . . . . . . . . . . . . . . . . . . . . . . . . . . . . 14,491 16,432 4,526 2,000 37,449Capital lease obligations . . . . . . . . . . . . . . . . . . . . . . . . . . . . . . . . . . . . 180 433 110 245 968Automotive interest payments (a) . . . . . . . . . . . . . . . . . . . . . . . . . . . . 447 882 732 5,093 7,154Automotive Financing interest payments (b) . . . . . . . . . . . . . . . . . . . . 955 1,171 322 199 2,647Postretirement benefits (c) . . . . . . . . . . . . . . . . . . . . . . . . . . . . . . . . . . 235 25 — — 260Contractual commitments for capital expenditures . . . . . . . . . . . . . . . 252 — — — 252Operating lease obligations . . . . . . . . . . . . . . . . . . . . . . . . . . . . . . . . . 295 355 205 148 1,003Other contractual commitments:
Material . . . . . . . . . . . . . . . . . . . . . . . . . . . . . . . . . . . . . . . . . . . . . . 856 975 116 238 2,185Marketing . . . . . . . . . . . . . . . . . . . . . . . . . . . . . . . . . . . . . . . . . . . . . 979 659 235 101 1,974Rental car repurchases . . . . . . . . . . . . . . . . . . . . . . . . . . . . . . . . . . . 6,008 — — — 6,008Other . . . . . . . . . . . . . . . . . . . . . . . . . . . . . . . . . . . . . . . . . . . . . . . . . 536 563 365 901 2,365
Total contractual commitments (d) . . . . . . . . . . . . . . . . . . . . . . . . . . . $ 25,557 $ 21,747 $ 8,210 $ 15,874 $ 71,388
Non-contractual postretirement benefits (e) . . . . . . . . . . . . . . . . . . . . . $ 168 $ 752 $ 749 $ 10,827 $ 12,496
(a) Amounts include automotive interest payments based on contractual terms and current interest rates on our debt and capital lease obligations.Automotive interest payments based on variable interest rates were determined using the interest rate in effect at December 31, 2014.
(b) GM Financial interest payments were determined using the interest rate in effect at December 31, 2014 for floating rate debt and the contractualrates for fixed rate debt. GM Financial interest payments on floating rate tranches of the securitization notes payable were converted to a fixedrate based on the floating rate plus any expected hedge payments.
54

GENERAL MOTORS COMPANY AND SUBSIDIARIES
(c) Amounts include other postretirement employee benefits (OPEB) payments under the current U.S. contractual labor agreements through 2015and Canada labor agreements through 2016. These agreements are generally renegotiated in the year of expiration. Amounts do not includepension funding obligations, which are discussed under the caption “Critical Accounting Estimates — Pensions.”
(d) Amounts do not include future cash payments for long-term purchase obligations and other accrued expenditures (unless specifically listed inthe table above) which were recorded in Accounts payable or Accrued liabilities at December 31, 2014.
(e) Amounts include all expected future payments for both current and expected future service at December 31, 2014 for OPEB obligations forsalaried employees and hourly OPEB obligations extending beyond the current North American union contract agreements. Amounts do notinclude pension funding obligations, which are discussed under the caption “Critical Accounting Estimates — Pensions.”
The table above does not reflect product warranty and related liabilities of $9.6 billion and unrecognized tax benefits of $1.9 billiondue to the uncertainty regarding the future cash outflows associated with these amounts.
Critical Accounting Estimates
Accounting estimates are an integral part of the consolidated financial statements. These estimates require the use of judgments andassumptions that affect the reported amounts of assets and liabilities, the disclosure of contingent assets and liabilities at the date ofthe financial statements and the reported amounts of revenues and expenses in the periods presented. We believe that the accountingestimates employed are appropriate and the resulting balances are reasonable; however, due to the inherent uncertainties in makingestimates actual results could differ from the original estimates, requiring adjustments to these balances in future periods. Refer toNote 2 to our consolidated financial statements for our significant accounting policies related to our critical accounting estimates.
Pensions
Our defined benefit pension plans are accounted for on an actuarial basis, which requires the selection of various assumptions,including an expected long-term rate of return on plan assets, a discount rate, mortality rates of participants and expectation ofmortality improvement. The expected long-term rate of return on U.S. plan assets that is utilized in determining pension expense isderived from periodic studies, which include a review of asset allocation strategies, anticipated future long- term performance ofindividual asset classes, risks using standard deviations and correlations of returns among the asset classes that comprise the plans’asset mix. While the studies give appropriate consideration to recent plan performance and historical returns, the assumptions areprimarily long-term, prospective rates of return.
In December 2014 an investment policy study was completed for the U.S. pension plans. The study resulted in new target assetallocations being approved for the U.S. pension plans with resulting changes to the expected long-term rate of return on assets. Theweighted-average long-term rate of return on assets decreased from 6.5% at December 31, 2013 to 6.4% at December 31, 2014.
Another key assumption in determining net pension expense is the assumed discount rate used to discount plan obligations. Weestimate this rate for U.S. plans using a cash flow matching approach, which uses projected cash flows matched to spot rates along ahigh quality corporate yield curve to determine the present value of cash flows to calculate a single equivalent discount rate.
Mortality assumptions for participants in our U.S. pension plans incorporate future mortality improvements from tables publishedby the Society of Actuaries (SOA). We periodically review the mortality experience of our U.S. pension plans’ participants againstthese assumptions. In the three months ended December 31, 2014 the SOA issued new mortality and mortality improvement tablesthat raise life expectancies and thereby indicate the amount of estimated aggregate benefit payments to our U.S. pension plans’participants is increasing. We have incorporated the new SOA mortality and mortality improvement tables into our December 31,2014 measurement of our U.S. pension plans’ benefit obligations. The change in these assumptions had the effect of increasing theDecember 31, 2014 U.S. pension plans’ obligations by $2.2 billion.
Significant differences in actual experience or significant changes in assumptions may materially affect the pension obligations.The effects of actual results differing from assumptions and the changing of assumptions are included in unamortized net actuarialgains and losses that are subject to amortization to expense over future periods. The unamortized pre-tax actuarial gain (loss) on our
55

GENERAL MOTORS COMPANY AND SUBSIDIARIES
pension plans was $(4.6) billion and $1.4 billion at December 31, 2014 and 2013. The change is due primarily to the decrease indiscount rates and the change in mortality assumptions partially offset by actual asset returns in excess of assumed returns.
The underfunded status of the U.S. pension plans increased by $3.6 billion in the year ended December 31, 2014 to $10.9 billion atDecember 31, 2014 due primarily to: (1) an unfavorable effect of $5.9 billion from a decrease in discount rates; (2) an unfavorableeffect of $2.2 billion from an increase in life expectancies, resulting in an increase in the benefit obligations; and (3) interest andservice cost of $3.3 billion; partially offset by (4) a favorable effect of $7.3 billion from actual returns on plan assets.
The following table illustrates the sensitivity to a change in certain assumptions for the pension plans, holding all other assumptionsconstant (dollars in millions):
U.S. Plans Non-U.S. Plans
Effect on 2015PensionExpense
Effect onDecember 31,
2014 PBO
Effect on 2015PensionExpense
Effect onDecember 31,
2014 PBO
25 basis point decrease in discount rate . . . . . . . . . . . . . . . . . . . . . . . . . . . . . . -$ 100 +$ 2,080 +$ 49 +$ 94625 basis point increase in discount rate . . . . . . . . . . . . . . . . . . . . . . . . . . . . . . +$ 70 -$ 2,020 -$ 19 -$ 89225 basis point decrease in expected rate of return on assets . . . . . . . . . . . . . . +$ 150 N/A +$ 35 N/A25 basis point increase in expected rate of return on assets . . . . . . . . . . . . . . . -$ 150 N/A -$ 35 N/A
Pursuant to the labor contract with the UAW, which expires in September 2015, a benefit unit represents the calculated pensionpayment associated with a specific benefit plan type. The following data illustrates the sensitivity of changes in pension expense andpension obligation due to changes in future benefit units based on the last remeasurement of the U.S. hourly pension plan atDecember 31, 2014 (dollars in millions):
Effect on 2015Pension Expense
Effect on December 31,2014 PBO
One percentage point increase in benefit units . . . . . . . . . . . . . . . . . . . . . . . . . . . . . . . . . . . . . . . +$ 85 +$ 263One percentage point decrease in benefit units . . . . . . . . . . . . . . . . . . . . . . . . . . . . . . . . . . . . . . . -$ 83 -$ 255
We are subject to a variety of U.S. federal rules and regulations which govern the manner in which we fund and administer our U.S.pension plans. Certain of these rules and regulations allow plan sponsors funding relief for U.S. pension plans through the applicationof higher funding interest rates. As a result, utilizing current assumptions, we expect no significant mandatory contributions to ourU.S. qualified pension plans for the next five years. We also maintain pension plans for employees in a number of countries outsidethe U.S. which are subject to local laws and regulations. Except for Canada and the United Kingdom, most non-U.S. pension laws andregulations do not have specific funding requirements.
Refer to Note 15 to our consolidated financial statements for additional information on pension contributions, investment strategiesand long-term rate of return, weighted-average discount rate, the change in benefit obligation and related plan assets and future netbenefit payments. Refer to Note 2 to our consolidated financial statements for a discussion of the inputs used to determine fair valuefor each significant asset class or category.
Valuation of Deferred Tax Assets
The ability to realize deferred tax assets depends on the ability to generate sufficient taxable income within the carryback orcarryforward periods provided for in the tax law for each applicable tax jurisdiction. The assessment regarding whether a valuationallowance is required or should be adjusted is based on an evaluation of possible sources of taxable income and also considers allavailable positive and negative evidence factors. Our accounting for deferred tax consequences represents our best estimate of futureevents. Changes in our current estimates, due to unanticipated market conditions or events, could have a material effect on our abilityto utilize deferred tax assets. If law is enacted that reduces the U.S. statutory rate, we would record a significant reduction to the netdeferred tax assets and related increase to income tax expense in the period that includes the enactment date of the tax rate change.
56

GENERAL MOTORS COMPANY AND SUBSIDIARIES
Sales Incentives
The estimated effect of sales incentives to dealers and end customers is recorded as a reduction of Automotive net sales and revenue,and in certain instances, as an increase to Automotive cost of sales, at the later of the time of sale or announcement of an incentiveprogram to dealers. There may be numerous types of incentives available at any particular time, including a choice of incentives for aspecific model. Incentive programs are generally brand specific, model specific or sales region specific and are for specified time periods,which may be extended. Significant factors used in estimating the cost of incentives include the volume of vehicles that will be affectedby the incentive programs offered by product, product mix, the rate of customer acceptance of any incentive program and the likelihoodthat an incentive program will be extended, all of which are estimated based on historical experience and assumptions concerningcustomer behavior and future market conditions. When an incentive program is announced, the number of vehicles in dealer inventoryeligible for the incentive program is determined and a reduction of Automotive net sales and revenue or increase to Automotive cost ofsales is recorded in the period in which the program is announced. If the actual number of affected vehicles differs from this estimate, orif a different mix of incentives is actually paid, the reduction in Automotive net sales and revenue or increase to Automotive cost of salesfor sales incentives could be affected. There are a multitude of inputs affecting the calculation of the estimate for sales incentives and anincrease or decrease of any of these variables could have a significant effect on recorded sales incentives.
Policy, Product Warranty and Recall Campaigns
We have historically accrued estimated costs related to recall campaigns in GMNA when they are probable and reasonablyestimable, which typically occurs once it is determined a specific recall campaign is needed and announced. During the three monthsended June 30, 2014, following the significant increase in the number of vehicles subject to recall in GMNA, the results of ourongoing comprehensive safety review, additional engineering analysis, the creation of a new Global Product Integrity organization,the appointment of a new Global Vice President of Vehicle Safety responsible for the safety development of our vehicle systems andour overall commitment to customer satisfaction, we accumulated sufficient historical data in GMNA to support the use of anactuarial-based estimation technique for recall campaigns. As such we now accrue at the time of vehicle sale in GMNA the costs forrecall campaigns. In the three months ended June 30, 2014 we recorded a catch-up adjustment of $0.9 billion in Automotive cost ofsales to adjust the estimate for recall costs for previously sold vehicles. The change in estimate was treated as an adjustment for EBIT-adjusted reporting purposes. In the other regions, there is not sufficient historical data to support the application of an actuarial-basedestimation technique and the estimated costs will continue to be accrued at the time when they are probable and reasonably estimable,which typically occurs once it is determined a specific recall campaign is needed and announced.
The estimates related to policy and product warranties are established using historical information on the nature, frequency andaverage cost of claims of each vehicle line or each model year of the vehicle line and assumptions about future activity and events.When little or no claims experience exists for a model year or a vehicle line, the estimate is based on comparable models. Theestimates related to recall campaigns accrued at the time of vehicle sale are established by applying a frequency times severityapproach that considers the number of recall events, the number of vehicles per recall event, the assumed number of vehicles that willbe brought in by customers for repair (take rate) and the cost per vehicle for each recall event. Estimates contemplate the nature,frequency and magnitude of historical events with consideration for changes in future expectations. Costs associated with campaignsnot accrued at the time of vehicle sale are estimated based on the per unit part and labor cost, number of units impacted and the takerate. Depending on part availability and time to complete repairs we may, from time-to-time, offer courtesy transportation at no costto our customers. These estimates are re-evaluated on an ongoing basis and based on the best available information, revisions aremade when necessary. We consider trends of claims and take action to improve vehicle quality and minimize claims.
In the six months ended June 30, 2014 we recorded charges of $2.5 billion for recall campaigns and courtesy transportation that have beenseparately announced and $0.9 billion related to the catch-up adjustment associated with a change in estimate. The catch-up adjustment andestimated amount accrued at the time of a vehicle sale for recall campaigns is most sensitive to the estimated number of recall events, thenumber of vehicles per recall event, the take rate, and the cost per vehicle for each recall event. The estimated cost of a recall campaign thatis accrued on an individual basis is most sensitive to our estimated assumed take rate that is primarily developed based on our historical takerate experience. We believe the amounts recorded are adequate to cover the costs of these recall campaigns. A 10% increase in the estimatedtake rate for specifically announced recall campaigns would increase the estimated cost by approximately $0.2 billion.
57

GENERAL MOTORS COMPANY AND SUBSIDIARIES
Actual experience could differ from the amounts estimated requiring adjustments to these liabilities in future periods. Due to theuncertainty and potential volatility of the factors contributing to developing estimates, changes in our assumptions could materiallyaffect our results of operations.
Forward-Looking Statements
In this report and in reports we subsequently file and have previously filed with the SEC on Forms 10-K and 10-Q and file orfurnish on Form 8-K, and in related comments by our management, we use words like “anticipate,” “appears,” “approximately,”“believe,” “continue,” “could,” “designed,” “effect,” “estimate,” “evaluate,” “expect,” “forecast,” “goal,” “initiative,” “intend,”“may,” “objective,” “outlook,” “plan,” “potential,” “priorities,” “project,” “pursue,” “seek,” “should,” “target,” “when,” “would,” orthe negative of any of those words or similar expressions to identify forward-looking statements that represent our current judgmentabout possible future events. In making these statements we rely on assumptions and analyses based on our experience and perceptionof historical trends, current conditions and expected future developments as well as other factors we consider appropriate under thecircumstances. We believe these judgments are reasonable, but these statements are not guarantees of any events or financial results,and our actual results may differ materially due to a variety of important factors, both positive and negative. These factors, which maybe revised or supplemented in subsequent reports on SEC Forms 10-Q and 8-K, include among others the following:
• Our ability to realize production efficiencies and to achieve reductions in costs as a result of our restructuring initiatives andlabor modifications;
• Our ability to maintain quality control over our vehicles and avoid material vehicle recalls and the cost and effect on ourreputation and products;
• Our ability to maintain adequate liquidity and financing sources including as required to fund our planned significantinvestment in new technology;
• Our ability to realize successful vehicle applications of new technology;
• Shortages of and increases or volatility in the price of oil, including as a result of political instability in the Middle East andAfrican nations;
• Our ability to continue to attract customers, particularly for our new products, including cars and crossover vehicles;
• Availability of adequate financing on acceptable terms to our customers, dealers, distributors and suppliers to enable them tocontinue their business relationships with us;
• The ability of our suppliers to deliver parts, systems and components without disruption and at such times to allow us to meetproduction schedules;
• Our ability to manage the distribution channels for our products;
• Our ability to successfully restructure our European and consolidated international operations and the health of the Europeaneconomy;
• The continued availability of both wholesale and retail financing from Ally Financial and its affiliates and other financecompanies in markets in which we operate to support our ability to sell vehicles, which is dependent on those entities’ abilityto obtain funding and their continued willingness to provide financing;
• Our continued ability to develop captive financing capability, including GM Financial;
58

GENERAL MOTORS COMPANY AND SUBSIDIARIES
• Overall strength and stability of the automotive industry, both in the U.S. and in global markets;
• Changes in economic conditions, commodity prices, housing prices, foreign currency exchange rates or political stability inthe markets in which we operate;
• Significant changes in the competitive environment, including the effect of competition and excess manufacturing capacity inour markets, on our pricing policies or use of incentives and the introduction of new and improved vehicle models by ourcompetitors;
• Significant changes in economic, political and market conditions in China, including the effect of competition from newmarket entrants, on our vehicle sales and market position in China;
• Changes in the existing, or the adoption of new, laws, regulations, policies or other activities of governments, agencies and similarorganizations particularly laws, regulations and policies relating to vehicle safety including recalls, and, including where suchactions may affect the production, licensing, distribution or sale of our products, the cost thereof or applicable tax rates;
• Costs and risks associated with litigation and government investigations including those related to our recent recalls;
• Significant increases in our pension expense or projected pension contributions resulting from changes in the value of planassets, the discount rate applied to value the pension liabilities or mortality or other assumption changes; and
• Changes in accounting principles, or their application or interpretation, and our ability to make estimates and the assumptionsunderlying the estimates, which could have an effect on earnings.
We caution readers not to place undue reliance on forward-looking statements. We undertake no obligation to update publicly orotherwise revise any forward-looking statements, whether as a result of new information, future events or other factors that affect thesubject of these statements, except where we are expressly required to do so by law.
* * * * * * *
Quantitative and Qualitative Disclosures About Market Risk
Automotive
The overall financial risk management program is under the responsibility of the Chief Financial Officer with support from theFinancial Risk Council which reviews and, where appropriate, approves strategies to be pursued to mitigate these risks. The FinancialRisk Council comprises members of our management and functions under the oversight of the Audit Committee and Finance Committee,committees of the Board of Directors. The Audit Committee and Finance Committee assist and guide the Board of Directors in itsoversight of our financial and risk management strategies. A risk management control framework is utilized to monitor the strategies,risks and related hedge positions in accordance with the policies and procedures approved by the Financial Risk Council. Our riskmanagement policy intends to protect against risk arising from extreme adverse market movements on our key exposures.
The following analyses provide quantitative information regarding exposure to foreign currency exchange rate risk and interest raterisk. Sensitivity analysis is used to measure the potential loss in the fair value of financial instruments with exposure to market risk. Themodels used assume instantaneous, parallel shifts in exchange rates and interest rate yield curves. For options and other instruments withnonlinear returns, models appropriate to these types of instruments are utilized to determine the effect of market shifts. There are certainshortcomings inherent in the sensitivity analyses presented, due primarily to the assumption that interest rates change in a parallel fashionand that spot exchange rates change instantaneously. In addition the analyses are unable to reflect the complex market reactions thatnormally would arise from the market shifts modeled and do not contemplate the effects of correlations between foreign currency pairs oroffsetting long-short positions in currency pairs which may significantly reduce the potential loss in value.
59

GENERAL MOTORS COMPANY AND SUBSIDIARIES
Foreign Currency Exchange Rate Risk
We have foreign currency exposures related to buying, selling and financing in currencies other than the functional currencies ofthe operations. At December 31, 2014 our most significant foreign currency exposures were the Euro/U.S. Dollar, Euro/British Pound,U.S. Dollar/South Korean Won and U.S. Dollar/Mexican Peso. Derivative instruments such as foreign currency forwards, swaps andoptions are used primarily to hedge exposures with respect to forecasted revenues, costs and commitments denominated in foreigncurrencies. At December 31, 2014 such contracts had remaining maturities of up to 23 months.
At December 31, 2014 and 2013 the net fair value liability of financial instruments with exposure to foreign currency risk was $0.9billion and $1.0 billion. This presentation utilizes a population of foreign currency exchange derivatives, embedded derivatives andforeign currency denominated debt and excludes the offsetting effect of foreign currency cash, cash equivalents and other assets. Thepotential loss in fair value for such financial instruments from a 10% adverse change in all quoted foreign currency exchange rateswould be $0.2 billion at December 31, 2014 and 2013.
We are exposed to foreign currency risk due to the translation and remeasurement of the results of certain international operationsinto U.S. Dollars as part of the consolidation process. Fluctuations in foreign currency exchange rates can therefore create volatility inthe results of operations and may adversely affect our financial condition.
The following table summarizes the amounts of automotive foreign currency translation and transaction and remeasurement losses(dollars in millions):
Years Ended December 31,
2014 2013
Foreign currency translation losses recorded in Accumulated other comprehensive loss . . . . . . . . . . . . . . $ 19 $ 729Losses resulting from foreign currency transactions and remeasurements recorded in earnings . . . . . . . . $ 430 $ 352
Interest Rate Risk
We are subject to market risk from exposure to changes in interest rates related to certain financial instruments, primarily debt,capital lease obligations and certain marketable securities. At December 31, 2014 and 2013 we did not have any interest rate swappositions to manage interest rate exposures in our automotive operations. At December 31, 2014 and 2013 the fair value liability ofdebt and capital leases was $9.8 billion and $6.8 billion. The potential increase in fair value resulting from a 10% decrease in quotedinterest rates would be $0.4 billion and $0.3 billion at December 31, 2014 and 2013.
At December 31, 2014 and 2013 we had marketable securities of $8.0 billion and $7.2 billion classified as available-for-sale and$1.3 billion and $1.7 billion classified as trading. The potential decrease in fair value from a 50 basis point increase in interest rateswould be insignificant at December 31, 2014 and 2013.
Automotive Financing — GM Financial
Interest Rate Risk
Fluctuations in market interest rates can affect GM Financial’s gross interest rate spread, which is the difference between:(1) interest earned on finance receivables; and (2) interest paid on debt, and could be affected by changes in interest rates. Typicallyconsumer finance receivables purchased by GM Financial bear fixed interest rates and are funded by variable or fixed rate debt.Commercial finance receivables originated by GM Financial bear variable interest rates and are funded by variable rate debt. Thevariable rate debt is subject to adjustments to reflect prevailing market interest rates. To help mitigate interest rate risk or mismatchedfunding, GM Financial may employ hedging strategies to lock in the interest rate spread.
60

GENERAL MOTORS COMPANY AND SUBSIDIARIES
Fixed interest rate receivables purchased by GM Financial are pledged to secure borrowings under its credit facilities. Amountsborrowed under these credit facilities bear interest at variable rates that are subject to frequent adjustments to reflect prevailing marketinterest rates. To protect the interest rate spread within each credit facility, GM Financial is contractually required to enter into interestrate cap agreements in connection with borrowings under its credit facilities.
In GM Financial’s securitization transactions it can transfer fixed rate finance receivables to securitization trusts that, in turn, selleither fixed rate or floating rate securities to investors. Derivative financial instruments, such as interest rate swaps and caps, are usedto manage the gross interest rate spread on the floating rate transactions.
GM Financial had interest rate swaps and caps in asset positions with notional amounts of $3.8 billion and $3.8 billion and interestrate swaps and caps in liability positions with notional amounts of $7.4 billion and $5.5 billion at December 31, 2014 and 2013. Thefair value of these derivative financial instruments was insignificant.
The following table summarizes GM Financial’s interest rate sensitive assets and liabilities, excluding derivatives, by year ofexpected maturity and the fair value of those assets and liabilities at December 31, 2014 (dollars in millions):
2015 2016 2017 2018 2019 Thereafter Fair Value
AssetsConsumer finance receivables
Principal amounts . . . . . . . . . . . . . . . . . . . . . . $ 10,440 $ 7,336 $ 4,551 $ 2,308 $ 968 $ 382 $ 25,541Weighted-average annual percentage rate . . . . 10.26% 10.45% 10.56% 10.82% 11.04% 11.21%
Commercial finance receivablesPrincipal amounts . . . . . . . . . . . . . . . . . . . . . . $ 7,333 $ 79 $ 69 $ 87 $ 76 $ 51 $ 7,565Weighted-average annual percentage rate . . . . 6.17% 4.63% 4.41% 4.36% 4.38% 4.67%
LiabilitiesSecured Debt:
Credit facilitiesPrincipal amounts . . . . . . . . . . . . . . . . . . . . $ 4,532 $ 1,593 $ 757 $ 141 $ 17 $ — $ 6,991Weighted-average interest rate . . . . . . . . . . 4.36% 5.92% 6.34% 8.63% 8.87% —%
Securitization notesPrincipal amounts . . . . . . . . . . . . . . . . . . . . $ 7,348 $ 5,703 $ 3,596 $ 1,190 $ 354 $ — $ 18,237Weighted-average interest rate . . . . . . . . . . 1.94% 1.86% 2.04% 2.50% 3.06% —%
Unsecured Debt:Senior notes
Principal amounts . . . . . . . . . . . . . . . . . . . . $ — $ 1,000 $ 2,795 $ 1,250 $ 1,405 $ 2,000 $ 8,707Weighted-average interest rate . . . . . . . . . . —% 2.75% 3.56% 4.65% 2.80% 4.33%
Credit facilities and other unsecured debtPrincipal amounts . . . . . . . . . . . . . . . . . . . . $ 2,611 $ 881 $ 107 $ 85 $ 84 $ — $ 3,772Weighted-average interest rate . . . . . . . . . . 10.33% 9.70% 5.64% 5.14% 5.14% —%
61

GENERAL MOTORS COMPANY AND SUBSIDIARIES
The following table summarizes GM Financial’s interest rate sensitive assets and liabilities, excluding derivatives, by year ofexpected maturity and the fair value of those assets and liabilities at December 31, 2013 (dollars in millions):
2014 2015 2016 2017 2018 Thereafter Fair Value
AssetsConsumer finance receivables
Principal amounts . . . . . . . . . . . . . . . . . . . . . . . . $ 9,576 $ 6,642 $ 4,162 $ 2,050 $ 820 $ 290 $ 22,652Weighted-average annual percentage rate . . . . . 10.76% 10.97% 11.17% 11.73% 12.28% 12.80%
Commercial finance receivablesPrincipal amounts . . . . . . . . . . . . . . . . . . . . . . . . $ 5,731 $ 22 $ 25 $ 94 $ 117 $ 6 $ 6,016Weighted-average annual percentage rate . . . . . 6.82% 4.73% 4.59% 4.50% 7.40% 5.69%
LiabilitiesSecured Debt:
Credit facilitiesPrincipal amounts . . . . . . . . . . . . . . . . . . . . . . $ 6,297 $ 1,699 $ 796 $ 224 $ 19 $ — $ 8,995Weighted-average interest rate . . . . . . . . . . . . 4.95% 6.39% 6.39% 8.17% 8.34% —%
Securitization notesPrincipal amounts . . . . . . . . . . . . . . . . . . . . . . $ 5,218 $ 4,084 $ 2,321 $ 1,114 $ 348 $ — $ 13,175Weighted-average interest rate . . . . . . . . . . . . 1.91% 2.12% 2.40% 2.71% 2.88% —%
Unsecured Debt:Senior notes
Principal amounts . . . . . . . . . . . . . . . . . . . . . . $ — $ — $ 1,000 $ 1,000 $ 1,250 $ 750 $ 4,106Weighted-average interest rate . . . . . . . . . . . . —% —% 2.75% 4.75% 4.65% 4.25%
Credit facilities and other unsecured debtPrincipal amounts . . . . . . . . . . . . . . . . . . . . . . $ 2,108 $ 706 $ 90 $ — $ 76 $ — $ 2,972Weighted-average interest rate . . . . . . . . . . . . 9.68% 8.82% 6.48% —% 5.64% —%
GM Financial estimates the realization of finance receivables in future periods using discount rate, prepayment and credit lossassumptions similar to its historical experience. Credit facilities and securitization notes payable amounts have been classified basedon expected payoff. Senior notes and convertible senior notes principal amounts have been classified based on maturity.
Foreign Currency Exchange Rate Risk
GM Financial is exposed to foreign currency risk due to the translation and remeasurement of the results of certain internationaloperations, primarily those acquired from Ally Financial in 2013, into U.S. Dollars as part of the consolidation process. Fluctuationsin foreign currency exchange rates can therefore create volatility in the results of operations and may adversely affect GM Financial’sfinancial condition.
GM Financial’s policy is to finance receivables and lease assets with debt in the same currency. When a different currency is usedGM Financial typically uses foreign currency swaps to convert substantially all of its foreign currency debt obligations to the localcurrency of the receivables and lease assets to minimize any impact to earnings.
GM Financial had foreign currency swaps in asset positions with notional amounts of $1.6 billion and $1.7 billion and in liabilitypositions with notional amounts of $1.1 billion and $2.1 billion at December 31, 2014 and 2013. The fair value of these derivativefinancial instruments was insignificant.
62

GENERAL MOTORS COMPANY AND SUBSIDIARIES
The following table summarizes the amounts of GM Financial’s foreign currency translation and transaction and remeasurementlosses (dollars in millions):
Years Ended December 31,
2014 2013
Foreign currency translation gains (losses) recorded in Accumulated other comprehensive loss . . . . . . . . . . . $ (430) $ 11Gains (losses) resulting from foreign currency transactions and remeasurements recorded in earnings . . . . . . $ (170) $ 151Gains (losses) resulting from foreign exchange swaps recorded in earnings . . . . . . . . . . . . . . . . . . . . . . . . . . . 163 (149)
Net gains (losses) resulting from foreign currency exchange recorded in earnings . . . . . . . . . . . . . . . . . . . . . . $ (7) $ 2
* * * * * * *
63

REPORT OF INDEPENDENT REGISTERED PUBLIC ACCOUNTING FIRM
General Motors Company, its Directors, and Stockholders:
We have audited the internal control over financial reporting of General Motors Company and subsidiaries (the Company) as ofDecember 31, 2014, based on the criteria established in Internal Control — Integrated Framework (2013) issued by the Committee ofSponsoring Organizations of the Treadway Commission. The Company’s management is responsible for maintaining effectiveinternal control over financial reporting and for its assessment of the effectiveness of internal control over financial reporting,included in the accompanying Management’s Report on Internal Control over Financial Reporting. Our responsibility is to express anopinion on the Company’s internal control over financial reporting based on our audit.
We conducted our audit in accordance with the standards of the Public Company Accounting Oversight Board (United States).Those standards require that we plan and perform the audit to obtain reasonable assurance about whether effective internal controlover financial reporting was maintained in all material respects. Our audit included obtaining an understanding of internal control overfinancial reporting, assessing the risk that a material weakness exists, testing and evaluating the design and operating effectiveness ofinternal control based on the assessed risk, and performing such other procedures as we considered necessary in the circumstances.We believe that our audit provides a reasonable basis for our opinion.
A company’s internal control over financial reporting is a process designed by, or under the supervision of, the company’s principalexecutive and principal financial officers, or persons performing similar functions, and effected by the company’s board of directors,management, and other personnel to provide reasonable assurance regarding the reliability of financial reporting and the preparationof financial statements for external purposes in accordance with generally accepted accounting principles. A company’s internalcontrol over financial reporting includes those policies and procedures that (1) pertain to the maintenance of records that, inreasonable detail, accurately and fairly reflect the transactions and dispositions of the assets of the company; (2) provide reasonableassurance that transactions are recorded as necessary to permit preparation of financial statements in accordance with generallyaccepted accounting principles, and that receipts and expenditures of the company are being made only in accordance withauthorizations of management and directors of the company; and (3) provide reasonable assurance regarding prevention or timelydetection of unauthorized acquisition, use, or disposition of the company’s assets that could have a material effect on the financialstatements.
Because of the inherent limitations of internal control over financial reporting, including the possibility of collusion or impropermanagement override of controls, material misstatements due to error or fraud may not be prevented or detected on a timely basis.Also, projections of any evaluation of the effectiveness of the internal control over financial reporting to future periods are subject tothe risk that the controls may become inadequate because of changes in conditions, or that the degree of compliance with the policiesor procedures may deteriorate.
In our opinion, the Company maintained, in all material respects, effective internal control over financial reporting as ofDecember 31, 2014, based on the criteria established in Internal Control — Integrated Framework (2013) issued by the Committee ofSponsoring Organizations of the Treadway Commission.
We have also audited, in accordance with the standards of the Public Company Accounting Oversight Board (United States), theconsolidated financial statements as of and for the year ended December 31, 2014 of the Company and our report dated February 4,2015 expressed an unqualified opinion on those financial statements.
Detroit, MichiganFebruary 4, 2015
64

REPORT OF INDEPENDENT REGISTERED PUBLIC ACCOUNTING FIRM
General Motors Company, its Directors, and Stockholders:
We have audited the accompanying Consolidated Balance Sheets of General Motors Company and subsidiaries (the Company) asof December 31, 2014 and 2013, and the related Consolidated Statements of Income, Comprehensive Income, Cash Flows and Equityfor each of the three years in the period ended December 31, 2014. These financial statements are the responsibility of the Company’smanagement. Our responsibility is to express an opinion on the financial statements based on our audits.
We conducted our audits in accordance with the standards of the Public Company Accounting Oversight Board (United States).Those standards require that we plan and perform the audit to obtain reasonable assurance about whether the financial statements arefree of material misstatement. An audit includes examining, on a test basis, evidence supporting the amounts and disclosures in thefinancial statements. An audit also includes assessing the accounting principles used and significant estimates made by management,as well as evaluating the overall financial statement presentation. We believe that our audits provide a reasonable basis for ouropinion.
In our opinion, such consolidated financial statements present fairly, in all material respects, the financial position of GeneralMotors Company and subsidiaries at December 31, 2014 and 2013, and the results of their operations and their cash flows for each ofthe three years in the period ended December 31, 2014, in conformity with accounting principles generally accepted in the UnitedStates of America.
We have also audited, in accordance with the standards of Public Company Accounting Oversight Board (United States), theCompany’s internal control over financial reporting as of December 31, 2014, based on the criteria established in Internal Control —Integrated Framework (2013) issued by the Committee of Sponsoring Organizations of the Treadway Commission and our reportdated February 4, 2015 expressed an unqualified opinion on the Company’s internal control over financial reporting.
Detroit, MichiganFebruary 4, 2015
65

Financial Statements and Supplementary Data
GENERAL MOTORS COMPANY AND SUBSIDIARIES
CONSOLIDATED INCOME STATEMENTS(In millions, except per share amounts)
Years Ended December 31,
2014 2013 2012
Net sales and revenueAutomotive . . . . . . . . . . . . . . . . . . . . . . . . . . . . . . . . . . . . . . . . . . . . . . . . . . . . . . . . . . . . . $ 151,092 $ 152,092 $ 150,295GM Financial . . . . . . . . . . . . . . . . . . . . . . . . . . . . . . . . . . . . . . . . . . . . . . . . . . . . . . . . . . . . 4,837 3,335 1,961
Total . . . . . . . . . . . . . . . . . . . . . . . . . . . . . . . . . . . . . . . . . . . . . . . . . . . . . . . . . . . . . . . . . . . 155,929 155,427 152,256
Costs and expensesAutomotive cost of sales (Note 13) . . . . . . . . . . . . . . . . . . . . . . . . . . . . . . . . . . . . . . . . . . . 138,082 134,925 140,236GM Financial operating and other expenses . . . . . . . . . . . . . . . . . . . . . . . . . . . . . . . . . . . . 4,039 2,448 1,207Automotive selling, general and administrative expense . . . . . . . . . . . . . . . . . . . . . . . . . . 12,158 12,382 14,031Goodwill impairment charges (Note 10) . . . . . . . . . . . . . . . . . . . . . . . . . . . . . . . . . . . . . . . 120 541 27,145
Total costs and expenses . . . . . . . . . . . . . . . . . . . . . . . . . . . . . . . . . . . . . . . . . . . . . . . . . . . 154,399 150,296 182,619
Operating income (loss) . . . . . . . . . . . . . . . . . . . . . . . . . . . . . . . . . . . . . . . . . . . . . . . . . . 1,530 5,131 (30,363)Automotive interest expense . . . . . . . . . . . . . . . . . . . . . . . . . . . . . . . . . . . . . . . . . . . . . . . . . . 403 334 489Interest income and other non-operating income, net (Note 20) . . . . . . . . . . . . . . . . . . . . . . . 823 1,063 845Gain (loss) on extinguishment of debt (Note 14) . . . . . . . . . . . . . . . . . . . . . . . . . . . . . . . . . . 202 (212) (250)Equity income (Note 8) . . . . . . . . . . . . . . . . . . . . . . . . . . . . . . . . . . . . . . . . . . . . . . . . . . . . . . 2,094 1,810 1,562
Income (loss) before income taxes . . . . . . . . . . . . . . . . . . . . . . . . . . . . . . . . . . . . . . . . . . . . . 4,246 7,458 (28,695)Income tax expense (benefit) (Note 18) . . . . . . . . . . . . . . . . . . . . . . . . . . . . . . . . . . . . . . . . . 228 2,127 (34,831)
Net income . . . . . . . . . . . . . . . . . . . . . . . . . . . . . . . . . . . . . . . . . . . . . . . . . . . . . . . . . . . . . . . 4,018 5,331 6,136Net (income) loss attributable to noncontrolling interests . . . . . . . . . . . . . . . . . . . . . . . . . . . . (69) 15 52
Net income attributable to stockholders . . . . . . . . . . . . . . . . . . . . . . . . . . . . . . . . . . . . . . . $ 3,949 $ 5,346 $ 6,188
Net income attributable to common stockholders . . . . . . . . . . . . . . . . . . . . . . . . . . . . . . . $ 2,804 $ 3,770 $ 4,859
Earnings per share (Note 22)Basic
Basic earnings per common share . . . . . . . . . . . . . . . . . . . . . . . . . . . . . . . . . . . . . . . . . . . . $ 1.75 $ 2.71 $ 3.10Weighted-average common shares outstanding . . . . . . . . . . . . . . . . . . . . . . . . . . . . . . . . . 1,605 1,393 1,566
DilutedDiluted earnings per common share . . . . . . . . . . . . . . . . . . . . . . . . . . . . . . . . . . . . . . . . . . $ 1.65 $ 2.38 $ 2.92Weighted-average common shares outstanding . . . . . . . . . . . . . . . . . . . . . . . . . . . . . . . . . 1,687 1,676 1,675
Reference should be made to the notes to consolidated financial statements.
66
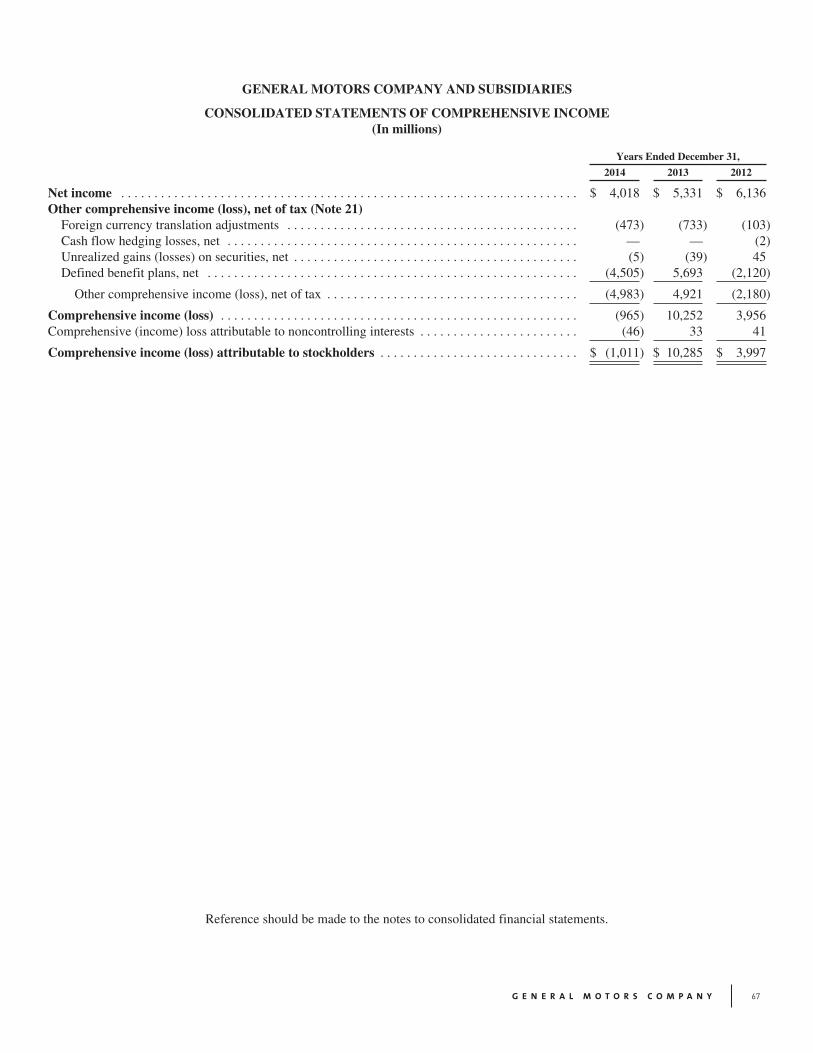
GENERAL MOTORS COMPANY AND SUBSIDIARIES
CONSOLIDATED STATEMENTS OF COMPREHENSIVE INCOME(In millions)
Years Ended December 31,
2014 2013 2012
Net income . . . . . . . . . . . . . . . . . . . . . . . . . . . . . . . . . . . . . . . . . . . . . . . . . . . . . . . . . . . . . . . . . . . . . $ 4,018 $ 5,331 $ 6,136Other comprehensive income (loss), net of tax (Note 21)
Foreign currency translation adjustments . . . . . . . . . . . . . . . . . . . . . . . . . . . . . . . . . . . . . . . . . . . . (473) (733) (103)Cash flow hedging losses, net . . . . . . . . . . . . . . . . . . . . . . . . . . . . . . . . . . . . . . . . . . . . . . . . . . . . . — — (2)Unrealized gains (losses) on securities, net . . . . . . . . . . . . . . . . . . . . . . . . . . . . . . . . . . . . . . . . . . . (5) (39) 45Defined benefit plans, net . . . . . . . . . . . . . . . . . . . . . . . . . . . . . . . . . . . . . . . . . . . . . . . . . . . . . . . . (4,505) 5,693 (2,120)
Other comprehensive income (loss), net of tax . . . . . . . . . . . . . . . . . . . . . . . . . . . . . . . . . . . . . . (4,983) 4,921 (2,180)
Comprehensive income (loss) . . . . . . . . . . . . . . . . . . . . . . . . . . . . . . . . . . . . . . . . . . . . . . . . . . . . . . (965) 10,252 3,956Comprehensive (income) loss attributable to noncontrolling interests . . . . . . . . . . . . . . . . . . . . . . . . (46) 33 41
Comprehensive income (loss) attributable to stockholders . . . . . . . . . . . . . . . . . . . . . . . . . . . . . . $ (1,011) $ 10,285 $ 3,997
Reference should be made to the notes to consolidated financial statements.
67

GENERAL MOTORS COMPANY AND SUBSIDIARIES
CONSOLIDATED BALANCE SHEETS(In millions, except per share amounts)
December 31, 2014 December 31, 2013
ASSETSCurrent Assets
Cash and cash equivalents . . . . . . . . . . . . . . . . . . . . . . . . . . . . . . . . . . . . . . . . . . . . . . . . . . . . . . . . . . . . . . . $ 18,954 $ 20,021Marketable securities (Note 4) . . . . . . . . . . . . . . . . . . . . . . . . . . . . . . . . . . . . . . . . . . . . . . . . . . . . . . . . . . . . 9,222 8,972Restricted cash and marketable securities (Note 4) . . . . . . . . . . . . . . . . . . . . . . . . . . . . . . . . . . . . . . . . . . . . 1,338 1,247Accounts and notes receivable (net of allowance of $340 and $344; Note 2) . . . . . . . . . . . . . . . . . . . . . . . . 9,078 8,535GM Financial receivables, net (Note 5)($11,134 and $10,001 at VIEs; Note 12) . . . . . . . . . . . . . . . . . . . . . 16,528 14,278Inventories (Note 6) . . . . . . . . . . . . . . . . . . . . . . . . . . . . . . . . . . . . . . . . . . . . . . . . . . . . . . . . . . . . . . . . . . . . 13,642 14,039Equipment on operating leases, net (Note 7) . . . . . . . . . . . . . . . . . . . . . . . . . . . . . . . . . . . . . . . . . . . . . . . . . 3,564 2,398Deferred income taxes (Note 18) . . . . . . . . . . . . . . . . . . . . . . . . . . . . . . . . . . . . . . . . . . . . . . . . . . . . . . . . . . 9,760 10,349Other current assets . . . . . . . . . . . . . . . . . . . . . . . . . . . . . . . . . . . . . . . . . . . . . . . . . . . . . . . . . . . . . . . . . . . . 1,584 1,662
Total current assets . . . . . . . . . . . . . . . . . . . . . . . . . . . . . . . . . . . . . . . . . . . . . . . . . . . . . . . . . . . . . . . . . . . . . 83,670 81,501Non-current Assets
Restricted cash and marketable securities (Note 4) . . . . . . . . . . . . . . . . . . . . . . . . . . . . . . . . . . . . . . . . . . . . 935 829GM Financial receivables, net (Note 5)($11,583 and $11,216 at VIEs; Note 12) . . . . . . . . . . . . . . . . . . . . . 16,006 14,354Equity in net assets of nonconsolidated affiliates (Note 8) . . . . . . . . . . . . . . . . . . . . . . . . . . . . . . . . . . . . . . 8,350 8,094Property, net (Note 9) . . . . . . . . . . . . . . . . . . . . . . . . . . . . . . . . . . . . . . . . . . . . . . . . . . . . . . . . . . . . . . . . . . . 27,743 25,867Goodwill (Note 10) . . . . . . . . . . . . . . . . . . . . . . . . . . . . . . . . . . . . . . . . . . . . . . . . . . . . . . . . . . . . . . . . . . . . . 1,427 1,560Intangible assets, net (Note 11) . . . . . . . . . . . . . . . . . . . . . . . . . . . . . . . . . . . . . . . . . . . . . . . . . . . . . . . . . . . 4,983 5,668GM Financial equipment on operating leases, net (Note 7)($4,595 and $1,803 at VIEs; Note 12) . . . . . . . 7,060 3,383Deferred income taxes (Note 18) . . . . . . . . . . . . . . . . . . . . . . . . . . . . . . . . . . . . . . . . . . . . . . . . . . . . . . . . . . 25,414 22,736Other assets . . . . . . . . . . . . . . . . . . . . . . . . . . . . . . . . . . . . . . . . . . . . . . . . . . . . . . . . . . . . . . . . . . . . . . . . . . . 2,089 2,352
Total non-current assets . . . . . . . . . . . . . . . . . . . . . . . . . . . . . . . . . . . . . . . . . . . . . . . . . . . . . . . . . . . . . . . . . 94,007 84,843
Total Assets . . . . . . . . . . . . . . . . . . . . . . . . . . . . . . . . . . . . . . . . . . . . . . . . . . . . . . . . . . . . . . . . . . . . . . . . . . . . $ 177,677 $ 166,344
LIABILITIES AND EQUITYCurrent Liabilities
Accounts payable (principally trade) . . . . . . . . . . . . . . . . . . . . . . . . . . . . . . . . . . . . . . . . . . . . . . . . . . . . . . . $ 22,529 $ 23,621Short-term debt and current portion of long-term debt (Note 14) . . . . . . . . . . . . . . . . . . . . . . . . . . . . . . . . .
Automotive . . . . . . . . . . . . . . . . . . . . . . . . . . . . . . . . . . . . . . . . . . . . . . . . . . . . . . . . . . . . . . . . . . . . . . . . . 500 564GM Financial ($10,502 and $10,088 at VIEs; Note 12) . . . . . . . . . . . . . . . . . . . . . . . . . . . . . . . . . . . . . . 14,488 13,594
Accrued liabilities (Note 13) . . . . . . . . . . . . . . . . . . . . . . . . . . . . . . . . . . . . . . . . . . . . . . . . . . . . . . . . . . . . . 28,184 24,633
Total current liabilities . . . . . . . . . . . . . . . . . . . . . . . . . . . . . . . . . . . . . . . . . . . . . . . . . . . . . . . . . . . . . . . . . . 65,701 62,412Non-current Liabilities
Long-term debt (Note 14)Automotive . . . . . . . . . . . . . . . . . . . . . . . . . . . . . . . . . . . . . . . . . . . . . . . . . . . . . . . . . . . . . . . . . . . . . . . . . 8,910 6,573GM Financial ($12,292 and $9,330 at VIEs; Note 12) . . . . . . . . . . . . . . . . . . . . . . . . . . . . . . . . . . . . . . . 22,943 15,452
Postretirement benefits other than pensions (Note 15) . . . . . . . . . . . . . . . . . . . . . . . . . . . . . . . . . . . . . . . . . . 6,229 5,897Pensions (Note 15) . . . . . . . . . . . . . . . . . . . . . . . . . . . . . . . . . . . . . . . . . . . . . . . . . . . . . . . . . . . . . . . . . . . . . 23,788 19,483Other liabilities (Note 13) . . . . . . . . . . . . . . . . . . . . . . . . . . . . . . . . . . . . . . . . . . . . . . . . . . . . . . . . . . . . . . . . 14,082 13,353
Total non-current liabilities . . . . . . . . . . . . . . . . . . . . . . . . . . . . . . . . . . . . . . . . . . . . . . . . . . . . . . . . . . . . . . 75,952 60,758
Total Liabilities . . . . . . . . . . . . . . . . . . . . . . . . . . . . . . . . . . . . . . . . . . . . . . . . . . . . . . . . . . . . . . . . . . . . . . . . . 141,653 123,170Commitments and contingencies (Note 17)Equity (Note 21)
Series A preferred stock, $0.01 par value . . . . . . . . . . . . . . . . . . . . . . . . . . . . . . . . . . . . . . . . . . . . . . . . . . . . — 3,109Common stock, $0.01 par value . . . . . . . . . . . . . . . . . . . . . . . . . . . . . . . . . . . . . . . . . . . . . . . . . . . . . . . . . . . 16 15Additional paid-in capital . . . . . . . . . . . . . . . . . . . . . . . . . . . . . . . . . . . . . . . . . . . . . . . . . . . . . . . . . . . . . . . . 28,937 28,780Retained earnings . . . . . . . . . . . . . . . . . . . . . . . . . . . . . . . . . . . . . . . . . . . . . . . . . . . . . . . . . . . . . . . . . . . . . . 14,577 13,816Accumulated other comprehensive loss . . . . . . . . . . . . . . . . . . . . . . . . . . . . . . . . . . . . . . . . . . . . . . . . . . . . . (8,073) (3,113)
Total stockholders’ equity . . . . . . . . . . . . . . . . . . . . . . . . . . . . . . . . . . . . . . . . . . . . . . . . . . . . . . . . . . . . . . . 35,457 42,607Noncontrolling interests . . . . . . . . . . . . . . . . . . . . . . . . . . . . . . . . . . . . . . . . . . . . . . . . . . . . . . . . . . . . . . . . . 567 567
Total Equity . . . . . . . . . . . . . . . . . . . . . . . . . . . . . . . . . . . . . . . . . . . . . . . . . . . . . . . . . . . . . . . . . . . . . . . . . . . 36,024 43,174
Total Liabilities and Equity . . . . . . . . . . . . . . . . . . . . . . . . . . . . . . . . . . . . . . . . . . . . . . . . . . . . . . . . . . . . . . . $ 177,677 $ 166,344
Reference should be made to the notes to consolidated financial statements.
68

GENERAL MOTORS COMPANY AND SUBSIDIARIES
CONSOLIDATED STATEMENTS OF CASH FLOWS(In millions)
Years Ended December 31,
2014 2013 2012
Cash flows from operating activitiesNet income . . . . . . . . . . . . . . . . . . . . . . . . . . . . . . . . . . . . . . . . . . . . . . . . . . . . . . . . . . . . . . . . . . . . . . . . . . . . $ 4,018 $ 5,331 $ 6,136Depreciation, amortization and impairment charges . . . . . . . . . . . . . . . . . . . . . . . . . . . . . . . . . . . . . . . . . . . . 7,238 8,041 38,762Foreign currency remeasurement and transaction losses . . . . . . . . . . . . . . . . . . . . . . . . . . . . . . . . . . . . . . . . . 437 350 117Amortization of discount and issuance costs on debt issues . . . . . . . . . . . . . . . . . . . . . . . . . . . . . . . . . . . . . . 181 114 188Undistributed earnings of nonconsolidated affiliates and gains on investments . . . . . . . . . . . . . . . . . . . . . . . (301) (92) (179)Pension contributions and OPEB payments . . . . . . . . . . . . . . . . . . . . . . . . . . . . . . . . . . . . . . . . . . . . . . . . . . . (1,315) (1,458) (3,759)Pension and OPEB expense, net . . . . . . . . . . . . . . . . . . . . . . . . . . . . . . . . . . . . . . . . . . . . . . . . . . . . . . . . . . . . 439 638 3,232(Gains) losses on extinguishment of debt . . . . . . . . . . . . . . . . . . . . . . . . . . . . . . . . . . . . . . . . . . . . . . . . . . . . . (202) 212 250Provision (benefit) for deferred taxes . . . . . . . . . . . . . . . . . . . . . . . . . . . . . . . . . . . . . . . . . . . . . . . . . . . . . . . . (574) 1,561 (35,561)Change in other operating assets and liabilities (Note 26) . . . . . . . . . . . . . . . . . . . . . . . . . . . . . . . . . . . . . . . . 244 (1,326) 630Other operating activities . . . . . . . . . . . . . . . . . . . . . . . . . . . . . . . . . . . . . . . . . . . . . . . . . . . . . . . . . . . . . . . . . (107) (741) 789
Net cash provided by operating activities . . . . . . . . . . . . . . . . . . . . . . . . . . . . . . . . . . . . . . . . . . . . . . . . . . . . . 10,058 12,630 10,605Cash flows from investing activities
Expenditures for property . . . . . . . . . . . . . . . . . . . . . . . . . . . . . . . . . . . . . . . . . . . . . . . . . . . . . . . . . . . . . . . . . (7,091) (7,565) (8,068)Available-for-sale marketable securities, acquisitions . . . . . . . . . . . . . . . . . . . . . . . . . . . . . . . . . . . . . . . . . . . (7,636) (6,754) (4,650)Trading marketable securities, acquisitions . . . . . . . . . . . . . . . . . . . . . . . . . . . . . . . . . . . . . . . . . . . . . . . . . . . (1,518) (3,214) (6,234)Available-for-sale marketable securities, liquidations . . . . . . . . . . . . . . . . . . . . . . . . . . . . . . . . . . . . . . . . . . . 6,874 3,566 10,519Trading marketable securities, liquidations . . . . . . . . . . . . . . . . . . . . . . . . . . . . . . . . . . . . . . . . . . . . . . . . . . . 1,881 6,538 7,267Acquisition of companies, net of cash acquired . . . . . . . . . . . . . . . . . . . . . . . . . . . . . . . . . . . . . . . . . . . . . . . . (53) (2,623) (44)Proceeds from sale of business units/investments, net of cash disposed . . . . . . . . . . . . . . . . . . . . . . . . . . . . . — 896 18Increase in restricted cash and marketable securities . . . . . . . . . . . . . . . . . . . . . . . . . . . . . . . . . . . . . . . . . . . . (839) (984) (661)Decrease in restricted cash and marketable securities . . . . . . . . . . . . . . . . . . . . . . . . . . . . . . . . . . . . . . . . . . . 515 1,107 1,526Purchase of finance receivables . . . . . . . . . . . . . . . . . . . . . . . . . . . . . . . . . . . . . . . . . . . . . . . . . . . . . . . . . . . . (14,744) (10,838) (6,122)Principal collections and recoveries on finance receivables . . . . . . . . . . . . . . . . . . . . . . . . . . . . . . . . . . . . . . 10,860 7,555 4,007Purchases of leased vehicles, net . . . . . . . . . . . . . . . . . . . . . . . . . . . . . . . . . . . . . . . . . . . . . . . . . . . . . . . . . . . (4,776) (2,254) (1,050)Proceeds from termination of leased vehicles . . . . . . . . . . . . . . . . . . . . . . . . . . . . . . . . . . . . . . . . . . . . . . . . . 533 217 59Other investing activities . . . . . . . . . . . . . . . . . . . . . . . . . . . . . . . . . . . . . . . . . . . . . . . . . . . . . . . . . . . . . . . . . 296 (9) (72)
Net cash used in investing activities . . . . . . . . . . . . . . . . . . . . . . . . . . . . . . . . . . . . . . . . . . . . . . . . . . . . . . . . . (15,698) (14,362) (3,505)Cash flows from financing activities
Net increase (decrease) in short-term debt . . . . . . . . . . . . . . . . . . . . . . . . . . . . . . . . . . . . . . . . . . . . . . . . . . . . 391 156 (247)Proceeds from issuance of debt (original maturities greater than three months) . . . . . . . . . . . . . . . . . . . . . . . 31,373 28,041 9,036Payments on debt (original maturities greater than three months) . . . . . . . . . . . . . . . . . . . . . . . . . . . . . . . . . . (19,524) (20,191) (7,377)Payments to purchase stock . . . . . . . . . . . . . . . . . . . . . . . . . . . . . . . . . . . . . . . . . . . . . . . . . . . . . . . . . . . . . . . (3,277) (2,438) (5,098)Dividends paid (including charge related to redemption and purchase of Series A Preferred Stock) . . . . . . . (3,165) (1,687) (939)Other financing activities . . . . . . . . . . . . . . . . . . . . . . . . . . . . . . . . . . . . . . . . . . . . . . . . . . . . . . . . . . . . . . . . . (123) (150) (116)
Net cash provided by (used in) financing activities . . . . . . . . . . . . . . . . . . . . . . . . . . . . . . . . . . . . . . . . . . . . . 5,675 3,731 (4,741)Effect of exchange rate changes on cash and cash equivalents . . . . . . . . . . . . . . . . . . . . . . . . . . . . . . . . . . . . . . (1,102) (400) (8)
Net increase (decrease) in cash and cash equivalents . . . . . . . . . . . . . . . . . . . . . . . . . . . . . . . . . . . . . . . . . . . . . . (1,067) 1,599 2,351Cash and cash equivalents at beginning of period . . . . . . . . . . . . . . . . . . . . . . . . . . . . . . . . . . . . . . . . . . . . . . . . 20,021 18,422 16,071
Cash and cash equivalents at end of period . . . . . . . . . . . . . . . . . . . . . . . . . . . . . . . . . . . . . . . . . . . . . . . . . . . $ 18,954 $ 20,021 $ 18,422
Significant Non-cash ActivityInvesting Cash Flows
Non-cash property additions . . . . . . . . . . . . . . . . . . . . . . . . . . . . . . . . . . . . . . . . . . . . . . . . . . . . . . . . . . . . . . . $ 3,313 $ 3,224 $ 3,879Financing Cash Flows
Mandatory conversion of Series B Preferred Stock into common stock (Note 21) . . . . . . . . . . . . . . . . . . . . . $ 4,854
Reference should be made to the notes to consolidated financial statements.
69

GENERAL MOTORS COMPANY AND SUBSIDIARIES
CONSOLIDATED STATEMENTS OF EQUITY(In millions)
Series APreferred
Stock
Series BPreferred
Stock
Common Stockholders’
NoncontrollingInterests
TotalEquity
CommonStock
AdditionalPaid-inCapital
RetainedEarnings
AccumulatedOther
ComprehensiveLoss
Balance January 1, 2012 . . . . . . . . . . . . . . . . . . . . . . . . . . . . $ 5,536 $ 4,855 $ 16 $ 26,391 $ 7,183 $ (5,861) $ 871 $ 38,991Net income . . . . . . . . . . . . . . . . . . . . . . . . . . . . . . . . . . . . . . . — — — — 6,188 — (52) 6,136Other comprehensive loss . . . . . . . . . . . . . . . . . . . . . . . . . . . . — — — — — (2,191) 11 (2,180)Purchase and retirement of common stock . . . . . . . . . . . . . . . — — (2) (2,652) (2,455) — — (5,109)Exercise of common stock warrants . . . . . . . . . . . . . . . . . . . . — — — 5 — — — 5Stock based compensation . . . . . . . . . . . . . . . . . . . . . . . . . . . — — — 89 — — — 89Conversion of Series B Preferred Stock into common
stock . . . . . . . . . . . . . . . . . . . . . . . . . . . . . . . . . . . . . . . . . . — — — 1 — — — 1Cash dividends on Series A Preferred Stock and cumulative
dividends on Series B Preferred Stock . . . . . . . . . . . . . . . . — — — — (859) — — (859)Dividends declared or paid to noncontrolling interest . . . . . . — — — — — — (80) (80)Other . . . . . . . . . . . . . . . . . . . . . . . . . . . . . . . . . . . . . . . . . . . . — — — — — — 6 6
Balance December 31, 2012 . . . . . . . . . . . . . . . . . . . . . . . . . 5,536 4,855 14 23,834 10,057 (8,052) 756 37,000Net income . . . . . . . . . . . . . . . . . . . . . . . . . . . . . . . . . . . . . . . — — — — 5,346 — (15) 5,331Other comprehensive income . . . . . . . . . . . . . . . . . . . . . . . . . — — — — — 4,939 (18) 4,921Purchase and cancellation of Series A Preferred Stock . . . . . (2,427) — — — — — — (2,427)Exercise of common stock warrants . . . . . . . . . . . . . . . . . . . . — — — 3 — — — 3Stock based compensation . . . . . . . . . . . . . . . . . . . . . . . . . . . — — — 75 — — — 75Mandatory conversion of Series B Preferred Stock into
common stock . . . . . . . . . . . . . . . . . . . . . . . . . . . . . . . . . . . — (4,855) 1 4,854 — — — —Cash dividends paid on Series A Preferred Stock, charge
related to purchase of Series A Preferred Stock anddividends on Series B Preferred Stock . . . . . . . . . . . . . . . . — — — — (1,587) — — (1,587)
Dividends declared or paid to noncontrolling interest . . . . . . — — — — — — (82) (82)Other . . . . . . . . . . . . . . . . . . . . . . . . . . . . . . . . . . . . . . . . . . . . — — — 14 — — (74) (60)
Balance December 31, 2013 . . . . . . . . . . . . . . . . . . . . . . . . . 3,109 $ — 15 28,780 13,816 (3,113) 567 43,174
Net income . . . . . . . . . . . . . . . . . . . . . . . . . . . . . . . . . . . . . . . — — — 3,949 — 69 4,018Other comprehensive loss . . . . . . . . . . . . . . . . . . . . . . . . . . . . — — — — (4,960) (23) (4,983)Redemption and cancellation of Series A Preferred Stock . . . (3,109) — — — — — (3,109)Purchase of common stock . . . . . . . . . . . . . . . . . . . . . . . . . . . — — (85) (83) — — (168)Exercise of common stock warrants . . . . . . . . . . . . . . . . . . . . — 1 38 — — — 39Stock based compensation . . . . . . . . . . . . . . . . . . . . . . . . . . . — — 206 (17) — — 189Cash dividends paid on Series A Preferred Stock and charge
related to redemption of Series A Preferred Stock . . . . . . . — — — (1,160) — — (1,160)Cash dividends paid on common stock . . . . . . . . . . . . . . . . . — — — (1,928) — — (1,928)Dividends declared or paid to noncontrolling interests . . . . . — — — — — (73) (73)Other . . . . . . . . . . . . . . . . . . . . . . . . . . . . . . . . . . . . . . . . . . . . — — (2) — — 27 25
Balance December 31, 2014 . . . . . . . . . . . . . . . . . . . . . . . . . $ — $ 16 $ 28,937 $ 14,577 $ (8,073) $ 567 $ 36,024
Reference should be made to the notes to consolidated financial statements.
70

GENERAL MOTORS COMPANY AND SUBSIDIARIES
NOTES TO CONSOLIDATED FINANCIAL STATEMENTS
Note 1. Nature of Operations and Basis of Presentation
General Motors Company was incorporated as a Delaware corporation in 2009. We design, build and sell cars, trucks andautomobile parts worldwide. We also provide automotive financing services through GM Financial. We analyze the results of ourbusiness through the following segments: GMNA, GME, GMIO, GMSA and GM Financial. Nonsegment operations are classified asCorporate. Corporate includes certain centrally recorded income and costs, such as interest, income taxes and corporate expendituresand certain nonsegment specific revenues and expenses.
As discussed in Note 13 we announced recalls of approximately 42 million vehicles and recorded charges of approximately $2.9billion in Automotive cost of sales relating to recall campaigns and courtesy transportation in the year ended December 31, 2014 andas discussed in Note 17 we announced the creation of a compensation program related to faulty ignition switches on certain vehiclesand recorded a charge of $400 million in the three months ended June 30, 2014.
Principles of Consolidation
The consolidated financial statements are prepared in conformity with U.S. GAAP. All intercompany balances and transactionshave been eliminated in consolidation. Certain prior year amounts were reclassified to conform to our current year presentation. In thethree months ended March 31, 2014 we changed our managerial and financial reporting structure to reclassify the results of ourRussian subsidiaries previously reported in our GMIO segment to our GME segment. We have retrospectively revised the segmentpresentation for all periods presented. Refer to Note 25 for additional information on our segment reporting.
We consolidate entities that we control due to ownership of a majority voting interest and we consolidate variable interest entities(VIEs) when we have variable interests and are the primary beneficiary. We continually evaluate our involvement with VIEs todetermine when these criteria are met. Our share of earnings or losses of nonconsolidated affiliates is included in our consolidatedoperating results using the equity method of accounting when we are able to exercise significant influence over the operating andfinancial decisions of the affiliate. We use the cost method of accounting if we are not able to exercise significant influence over theoperating and financial decisions of the affiliate.
Use of Estimates in the Preparation of the Financial Statements
Accounting estimates are an integral part of the consolidated financial statements. These estimates require the use of judgments andassumptions that affect the reported amounts of assets and liabilities, the disclosure of contingent assets and liabilities at the date ofthe financial statements and the reported amounts of revenues and expenses in the periods presented. We believe that the accountingestimates employed are appropriate and the resulting balances are reasonable; however, due to the inherent uncertainties in makingestimates actual results could differ from the original estimates, requiring adjustments to these balances in future periods.
Change in Accounting Estimate
We historically accrued estimated costs related to recall campaigns in GMNA when they are probable and reasonably estimable,which typically occurs once it is determined a specific recall campaign is needed and announced. During the three months endedJune 30, 2014, following the significant increase in the number of vehicles subject to recall in GMNA, the results of our ongoingcomprehensive safety review, additional engineering analysis, the creation of a new Global Product Integrity organization, theappointment of a new Global Vice President of Vehicle Safety responsible for the safety development of our vehicle systems and ouroverall commitment to customer satisfaction, we accumulated sufficient historical data in GMNA to support the use of an actuarial-based estimation technique for recall campaigns. As such we now accrue at the time of vehicle sale in GMNA the costs for recallcampaigns. Based on expanded historical data, we recorded a catch-up adjustment of $874 million in Automotive cost of sales in thethree months ended June 30, 2014 to adjust the estimate for recall costs for previously sold vehicles. In other geographical regions thehistorical claims data did not support the application of an actuarial-based model; therefore, recall campaigns are accrued whenprobable and reasonably estimable, which typically occurs once it is determined a specific recall campaign is needed and announced.
71

GENERAL MOTORS COMPANY AND SUBSIDIARIES
NOTES TO CONSOLIDATED FINANCIAL STATEMENTS — (Continued)
GM Financial
The amounts presented for GM Financial have been adjusted to include the effect of our tax attributes on GM Financial’s deferredtax positions and provision for income taxes since the date of acquisition, which are not applicable to GM Financial on a stand-alonebasis, and to eliminate the effect of transactions between GM Financial and the other members of the consolidated group.Accordingly, the amounts presented will differ from those presented by GM Financial on a stand-alone basis.
Note 2. Significant Accounting Policies
The accounting policies which follow are utilized by our automotive and automotive financing operations, unless otherwiseindicated.
Revenue Recognition
Automotive
Automotive net sales and revenue are primarily composed of revenue generated from the sale of vehicles. Vehicle sales arerecorded when title and all risks and rewards of ownership have passed to our customers. For the majority of our automotive sales thisoccurs when a vehicle is released to the carrier responsible for transporting to a dealer and when collectability is reasonably assured.Vehicle sales are recorded when the vehicle is delivered to the dealer in most remaining cases. Provisions for recurring or announceddealer and customer sales and leasing incentives, consisting of allowances and rebates, are recorded as reductions to Automotive netsales and revenue at the time of vehicle sales. All other incentives, allowances and rebates related to vehicles previously sold arerecorded as reductions to Automotive net sales and revenue when announced.
Vehicle sales to daily rental car companies with guaranteed repurchase obligations are accounted for as operating leases. Estimatedlease revenue is recorded ratably over the estimated term of the lease based on the difference between net sales proceeds and theguaranteed repurchase amount. The difference between the cost of the vehicle and estimated residual value is depreciated on astraight-line basis over the estimated term of the lease.
Automotive Financing — GM Financial
Finance charge income earned on receivables is recognized using the effective interest method for consumer financing receivables andaccrual method for commercial financing receivables. Fees and commissions (including incentive payments) received and direct costs oforiginating loans are deferred and amortized over the term of the related finance receivables using the effective interest method and areremoved from the consolidated balance sheets when the related finance receivables are sold, charged off or paid in full. Accrual offinance charge income on consumer finance receivables is generally suspended on accounts that are more than 60 days delinquent,accounts in bankruptcy and accounts in repossession. Payments received on nonaccrual loans are first applied to any fees due, then to anyinterest due and then any remaining amounts are recorded to principal. Interest accrual generally resumes once an account has receivedpayments bringing the delinquency to less than 60 days past due. Accrual of finance charge income on commercial finance receivables isgenerally suspended on accounts that are more than 90 days delinquent, upon receipt of a bankruptcy notice from a borrower, or wherereasonable doubt about the full collectability of contractually agreed upon principal and interest exist. Payments received on nonaccrualloans are first applied to principal. Interest accrual resumes once an account has received payments bringing the account fully current andcollection of contractual principal and interest is reasonably assured (including amounts previously charged-off) or, for troubled debtrestructurings (TDRs), when repayment is reasonably assured based on the modified terms of the loan.
Income from operating lease assets, which includes lease origination fees, net of lease origination costs and incentives, is recordedas operating lease revenue on a straight-line basis over the term of the lease agreement.
72

GENERAL MOTORS COMPANY AND SUBSIDIARIES
NOTES TO CONSOLIDATED FINANCIAL STATEMENTS — (Continued)
Advertising and Promotion Expenditures
Advertising and promotion expenditures, which are expensed as incurred in Automotive selling, general and administrativeexpense, were $5.2 billion, $5.5 billion and $5.4 billion in the years ended December 31, 2014, 2013 and 2012.
Research and Development Expenditures
Research and development expenditures, which are expensed as incurred in Automotive cost of sales, were $7.4 billion, $7.2 billionand $7.4 billion in the years ended December, 31 2014, 2013 and 2012.
Cash Equivalents
Cash equivalents are defined as short-term, highly-liquid investments with original maturities of 90 days or less.
Allowance for Doubtful Accounts
We record an allowance for doubtful accounts based on our best estimate of recoverability of receivables. Charges related to theallowance for doubtful accounts are recorded in Automotive selling, general and administrative expense. The following table summarizesactivity in our allowance for doubtful accounts and notes receivable related to our automotive operations (dollars in millions):
Years Ended December 31,
2014 2013 2012
Balance at beginning of period . . . . . . . . . . . . . . . . . . . . . . . . . . . . . . . . . . . . . . . . . . . . . . . . . . . . . . . . . . . $ 344 $ 311 $ 331Amounts charged (credited) to costs and expenses . . . . . . . . . . . . . . . . . . . . . . . . . . . . . . . . . . . . . . . . . . . 50 61 (10)Deductions . . . . . . . . . . . . . . . . . . . . . . . . . . . . . . . . . . . . . . . . . . . . . . . . . . . . . . . . . . . . . . . . . . . . . . . . . . (8) (24) (46)Effect of foreign currency and other . . . . . . . . . . . . . . . . . . . . . . . . . . . . . . . . . . . . . . . . . . . . . . . . . . . . . . . (46) (4) 36
Balance at end of period . . . . . . . . . . . . . . . . . . . . . . . . . . . . . . . . . . . . . . . . . . . . . . . . . . . . . . . . . . . . . . . . $ 340 $ 344 $ 311
Fair Value Measurements
A three-level valuation hierarchy, based upon observable and unobservable inputs, is used for fair value measurements. Observableinputs reflect market data obtained from independent sources, while unobservable inputs reflect market assumptions based on the bestevidence available. These two types of inputs create the following fair value hierarchy:
• Level 1 — Quoted prices for identical instruments in active markets;
• Level 2 — Quoted prices for similar instruments in active markets, quoted prices for identical or similar instruments inmarkets that are not active and model-derived valuations whose significant inputs are observable; and
• Level 3 — Instruments whose significant inputs are unobservable.
Financial instruments are transferred in and/or out of Level 1, 2 or 3 at the beginning of the accounting period in which there is achange in the valuation inputs.
Marketable Securities
We classify marketable securities as available-for-sale or trading. Various factors, including turnover of holdings and investmentguidelines, are considered in determining the classification of securities. Available-for-sale securities are recorded at fair value with
73

GENERAL MOTORS COMPANY AND SUBSIDIARIES
NOTES TO CONSOLIDATED FINANCIAL STATEMENTS — (Continued)
unrealized gains and losses recorded net of related income taxes in Accumulated other comprehensive loss until realized. Tradingsecurities are recorded at fair value with changes in fair value recorded in Interest income and other non-operating income, net. Wedetermine realized gains and losses for all securities using the specific identification method.
We measure the fair value of our marketable securities using a market approach where identical or comparable prices are availableand an income approach in other cases. If quoted market prices are not available, fair values of securities are determined using pricesfrom a pricing service, pricing models, quoted prices of securities with similar characteristics or discounted cash flow models. Theseprices represent non-binding quotes. Our pricing service utilizes industry-standard pricing models that consider various inputs. Weconduct an annual review of our pricing service. Based on our review we believe the prices received from our pricing service are areliable representation of exit prices.
An evaluation is made quarterly to determine if unrealized losses related to non-trading investments in securities are other-than-temporary. Factors considered in determining whether a loss on a marketable security is other-than-temporary include: (1) the lengthof time and extent to which the fair value has been below cost; (2) the financial condition and near-term prospects of the issuer; and(3) the intent to sell or likelihood to be forced to sell the security before any anticipated recovery.
Finance Receivables
As the result of our October 2010 acquisition of GM Financial and GM Financial’s acquisition of the Ally Financial internationaloperations, finance receivables are reported in two portfolios: pre-acquisition and post-acquisition portfolios. The pre-acquisitionfinance receivables portfolio consists of finance receivables that were considered to have had deterioration in credit quality at the timethey were acquired with the acquisitions of GM Financial or the Ally Financial international operations. The pre-acquisition portfoliowill decrease over time with the amortization of the acquired receivables. The post-acquisition finance receivables portfolio consistsof finance receivables that were considered to have had no deterioration in credit quality at the time they were acquired with theacquisition of the Ally Financial international operations and finance receivables originated since the acquisitions of GM Financialand the Ally Financial international operations. The post-acquisition portfolio is expected to grow over time as GM Financialoriginates new receivables.
Pre-Acquisition Consumer Finance Receivables
At the time of acquisitions the receivables were recorded at fair value. The pre-acquisition finance receivables were acquired at adiscount, which contains two components: a non-accretable difference and an accretable yield. The accretable yield is recorded asfinance charge income over the life of the acquired receivables.
Any deterioration in the performance of the pre-acquisition finance receivables from their expected performance will result in anincremental provision for loan losses. Improvements in the performance of the pre-acquisition finance receivables will result first inthe reversal of any incremental related allowance for loan losses and then in a transfer of the excess from the non-accretabledifference to accretable yield, which will be recorded as finance charge income over the remaining life of the receivables.
Post-Acquisition Consumer Finance Receivables and Allowance for Loan Losses
Post-acquisition finance receivables originated since the acquisitions of GM Financial and the Ally Financial internationaloperations are carried at amortized cost, net of allowance for loan losses.
The component of the allowance for consumer finance receivables that is collectively evaluated for impairment is based on astatistical calculation supplemented by management judgment. GM Financial uses a combination of forecasting models to determinethe allowance for loan losses. Factors that are considered when estimating the allowance include loss confirmation period, historicaldelinquency migration to loss, probability of default and loss given default. The loss confirmation period is a key assumption withinthe models, which represents the average amount of time from when a loss event first occurs to when the receivable is charged-off.
74

GENERAL MOTORS COMPANY AND SUBSIDIARIES
NOTES TO CONSOLIDATED FINANCIAL STATEMENTS — (Continued)
Consumer finance receivables that become classified as TDRs are separately assessed for impairment. A specific allowance isestimated based on the present value of the expected future cash flows of the receivable discounted at the loan’s original effectiveinterest rate.
Consumer finance receivables are generally charged off in the month in which the account becomes 120 days contractuallydelinquent if we have not yet recorded a repossession charge-off. A charge-off generally represents the difference between theestimated net sales proceeds and the amount of the contract, including accrued interest.
The finance receivables acquired with the Ally Financial international operations that were considered to have no deterioration incredit quality at the time of acquisition were recorded at fair value. The purchase discount will accrete to income over the life of thereceivables, based on contractual cash flows, using the effective interest method. Provisions for loan losses are charged to operationsin amounts equal to net credit losses for the period. Any subsequent deterioration in the performance of the acquired receivables willresult in an incremental provision for loan losses.
Inventory
Inventories are stated at the lower of cost or market. Market, which represents selling price less cost to sell, considers generalmarket and economic conditions, periodic reviews of current profitability of vehicles, product warranty costs and the effect of currentand expected incentive offers at the balance sheet date. Market for off-lease and other vehicles is current auction sales proceeds lessdisposal and warranty costs. Productive material, work in process, supplies and service parts are reviewed to determine if inventoryquantities are in excess of forecasted usage or if they have become obsolete.
Equipment on Operating Leases, net
Equipment on operating leases, net is reported at cost, less accumulated depreciation and impairment, net of origination fees orcosts and lease incentives. Estimated income from operating lease assets, which includes lease origination fees, net of leaseorigination costs, is recorded as operating lease revenue on a straight-line basis over the term of the lease agreement. Leased vehiclesare depreciated on a straight-line basis to an estimated residual value over the term of the lease agreements.
We have significant investments in vehicles in operating lease portfolios, which are composed of vehicle leases to retail customerswith lease terms of up to 60 months and vehicles leased to rental car companies with lease terms that average eight months or less. Weare exposed to changes in the residual values of those assets. For impairment purposes the residual values represent estimates of thevalues of the vehicles leased at the end of the lease contracts and are determined based on forecasted auction proceeds when there is areliable basis to make such a determination. Realization of the residual values is dependent on the future ability to market the vehiclesunder the prevailing market conditions. The adequacy of the estimate of the residual value is evaluated over the life of the lease andadjustments may be made to the extent the expected value of the vehicle at lease termination changes. Adjustments may be in theform of revisions to the depreciation rate or recognition of an impairment charge. Impairment is determined to exist if the expectedfuture cash flows, which include estimated residual values, are lower than the carrying amount of the vehicles leased. If the carryingamount is considered impaired an impairment charge is recorded for the amount by which the carrying amount exceeds the fair value.Fair value is determined primarily using the anticipated cash flows, including estimated residual values.
In our automotive operations when a leased vehicle is returned the asset is reclassified from Equipment on operating leases, net toInventories at the lower of cost or estimated selling price, less cost to sell. Upon disposition proceeds are recorded in Automotive net salesand revenue and costs are recorded in Automotive cost of sales. In our automotive finance operations when a leased vehicle is returned orrepossessed the asset is recorded in Other assets at the lower of cost or estimated selling price, less costs to sell. Upon disposition a gain orloss is recorded for any difference between the net book value of the leased asset and the proceeds from the disposition of the asset.
Depreciation expense and impairment charges related to Equipment on operating leases, net are recorded in Automotive cost ofsales or GM Financial operating and other expenses.
75

GENERAL MOTORS COMPANY AND SUBSIDIARIES
NOTES TO CONSOLIDATED FINANCIAL STATEMENTS — (Continued)
Valuation of Cost and Equity Method Investments
When events and circumstances warrant, investments accounted for under the cost or equity method of accounting are evaluated forimpairment. An impairment charge is recorded whenever a decline in value of an investment below its carrying amount is determinedto be other-than-temporary. Impairment charges related to equity method investments are recorded in Equity income. Impairmentcharges related to cost method investments are recorded in Interest income and other non-operating income, net.
Property, net
Property, plant and equipment, including internal use software, is recorded at cost. Major improvements that extend the useful lifeor add functionality of property are capitalized. The gross amount of assets under capital leases is included in property, plant andequipment. Expenditures for repairs and maintenance are charged to expense as incurred. We depreciate all depreciable property usingthe straight-line method. Leasehold improvements are amortized over the period of lease or the life of the asset, whichever is shorter.The amortization of the assets under capital leases is included in depreciation expense. Upon retirement or disposition of property,plant and equipment, the cost and related accumulated depreciation are removed from the accounts and any resulting gain or loss isrecorded in earnings. Impairment charges related to property are recorded in Automotive cost of sales, Automotive selling, generaland administrative expense or GM Financial operating and other expenses.
Special Tools
Special tools represent product-specific powertrain and non-powertrain related tools, dies, molds and other items used in the vehiclemanufacturing process. Expenditures for special tools are recorded at cost and are capitalized. We amortize all non-powertrain specialtools over their estimated useful lives using an accelerated amortization method. We amortize powertrain special tools over theirestimated useful lives using the straight-line method. Impairment charges related to special tools are recorded in Automotive cost ofsales.
Goodwill
Goodwill arises from the application of fresh-start reporting and acquisitions accounted for as business combinations. Goodwill istested for impairment for all reporting units on an annual basis as of October 1, or more frequently if events occur or circumstanceschange that would warrant such a review. Our reporting units are GMNA and GME and various reporting units within the GMIO,GMSA and GM Financial segments. When performing our goodwill impairment testing, the fair values of our reporting units aredetermined based on valuation techniques using the best available information, primarily discounted cash flow projections. We makesignificant assumptions and estimates, which utilize Level 3 measures, about the extent and timing of future cash flows, growth rates,market share and discount rates that represent unobservable inputs into our valuation methodologies. Our fair value estimates forannual and event-driven impairment tests assume the achievement of the future financial results contemplated in our forecasted cashflows and there can be no assurance that we will realize that value. The valuation methodologies utilized to perform our goodwillimpairment testing were consistent with those used in our application of fresh-start reporting on July 10, 2009 and in any subsequentannual or event-driven goodwill impairment tests and utilized Level 3 measures. Because the fair value of goodwill can be measuredonly as a residual amount and cannot be determined directly we calculate the implied goodwill for those reporting units failing Step 1in the same manner that goodwill is recognized in a business combination pursuant to Accounting Standards Codification (ASC) 805.
Intangible Assets, net
Intangible assets, excluding goodwill, primarily include brand names, technology and intellectual property, customer relationshipsand dealer networks. Intangible assets are amortized on a straight-line or an accelerated method of amortization over their estimateduseful lives. An accelerated amortization method reflecting the pattern in which the asset will be consumed is utilized if that patterncan be reliably determined. We consider the period of expected cash flows and underlying data used to measure the fair value of theintangible assets when selecting a useful life. Impairment charges related to intangible assets are recorded in Automotive selling,
76
GENERAL MOTORS COMPANY AND SUBSIDIARIES
NOTES TO CONSOLIDATED FINANCIAL STATEMENTS — (Continued)
general and administrative expense or Automotive cost of sales. Amortization of developed technology and intellectual property isrecorded in Automotive cost of sales. Amortization of brand names, customer relationships and our dealer networks is recorded inAutomotive selling, general and administrative expense or GM Financial operating and other expenses.
Valuation of Long-Lived Assets
The carrying amount of long-lived assets and finite-lived intangible assets to be held and used in the business are evaluated forimpairment when events and circumstances warrant. If the carrying amount of a long-lived asset group is considered impaired, a lossis recorded based on the amount by which the carrying amount exceeds fair value. Product-specific long-lived asset groups are testedfor impairment at the platform or vehicle line level and consider their geographical location. Non-product specific long-lived assetsare tested for impairment on a reporting unit basis in GMNA and GME and tested at or within our various reporting units within ourGMIO, GMSA and GM Financial segments. Fair value is determined using either the market or sales comparison approach, costapproach or anticipated cash flows discounted at a rate commensurate with the risk involved. Long-lived assets to be disposed of otherthan by sale are considered held for use until disposition. Product-specific assets may become impaired as a result of declines inprofitability due to changes in volume, pricing or costs.
Pension and OPEB Plans
Attribution, Methods and Assumptions
The cost of benefits provided by defined benefit pension plans is recorded in the period employees provide service. The cost ofpension plan amendments that provide for benefits already earned by plan participants is amortized over the expected period ofbenefit which may be: (1) the duration of the applicable collective bargaining agreement specific to the plan; (2) expected futureworking lifetime; or (3) the life expectancy of the plan participants.
The cost of medical, dental, legal service and life insurance benefits provided through postretirement benefit plans is recorded inthe period employees provide service. The cost of postretirement plan amendments that provide for benefits already earned by planparticipants is amortized over the expected period of benefit which may be: (1) the average period to full eligibility; (2) the averagelife expectancy of the plan participants; or (3) the period to the plan’s termination date for a plan which provides legal services.
An expected return on plan asset methodology is utilized to calculate future pension expense for certain significant funded benefitplans. A market-related value of plan assets methodology is also utilized that averages gains and losses on the plan assets over aperiod of years to determine future pension expense. The methodology recognizes 60% of the difference between the fair value ofassets and the expected calculated value in the first year and 10% of that difference over each of the next four years.
The discount rate assumption is established for each of the retirement-related benefit plans at their respective measurement dates. Inthe U.S. we use a cash flow matching approach that uses projected cash flows matched to spot rates along a high quality corporateyield curve to determine the present value of cash flows to calculate a single equivalent discount rate.
The benefit obligation for pension plans in Canada, the United Kingdom and Germany represents 92% of the non-U.S. pensionbenefit obligation at December 31, 2014. The discount rates for plans in Canada, the United Kingdom and Germany are determinedusing a cash flow matching approach similar to the U.S. approach.
Plan Asset Valuation
Due to the lack of timely available market information for certain investments in the asset classes described below as well as theinherent uncertainty of valuation, reported fair values may differ from fair values that would have been used had timely availablemarket information been available.
77
GENERAL MOTORS COMPANY AND SUBSIDIARIES
NOTES TO CONSOLIDATED FINANCIAL STATEMENTS — (Continued)
Cash Equivalents and Other Short-Term Investments
Money market funds and other similar short-term investment funds are valued using the net asset value per share (NAV). Prices forshort-term debt securities are received from independent pricing services or from dealers who make markets in such securities.Independent pricing services utilize matrix pricing which considers readily available inputs such as the yield or price of bonds ofcomparable quality, coupon, maturity and type as well as dealer supplied prices. Money market mutual funds which provide investorswith the ability to redeem their interests on a daily basis and for which NAVs are publicly available are classified in Level 1. Othercash equivalents and short-term investments are classified in Level 2.
Common and Preferred Stock
Common and preferred stock for which market prices are readily available at the measurement date are valued at the last reportedsale price or official closing price on the primary market or exchange on which they are actively traded and are classified in Level 1.Such equity securities for which the market is not considered to be active are valued via the use of observable inputs, which mayinclude, among others, the use of adjusted market prices last available, bids or last available sales prices and/or other observableinputs and are classified in Level 2. Common and preferred stock classified in Level 3 are those privately issued securities or otherissues that are valued via the use of valuation models using significant unobservable inputs that generally consider among others, aged(stale) pricing, earnings multiples, discounted cash flows and/or other qualitative and quantitative factors.
Fixed Income Securities
Fixed income securities are valued based on quotations received from independent pricing services or from dealers who makemarkets in such securities. Debt securities which are priced via the use of pricing services that utilize matrix pricing which considersreadily observable inputs such as the yield or price of bonds of comparable quality, coupon, maturity and type as well as dealersupplied prices, are classified in Level 2. Fixed income securities within this category that are typically priced by dealers and pricingservices via the use of proprietary pricing models which incorporate significant unobservable inputs are classified in Level 3. Theseinputs primarily consist of yield and credit spread assumptions, discount rates, prepayment curves, default assumptions and recoveryrates.
Investment Funds, Private Equity and Debt Investments and Real Estate Investments
Investments in exchange traded funds, real estate investment trusts and mutual funds, for which market quotations are generallyreadily available, are valued at the last reported sale price, official closing price or publicly available NAV (or its equivalent) on theprimary market or exchange on which they are traded and are classified in Level 1. Investments in private investment funds (includinghedge funds, private equity funds and real estate funds) are generally valued based on their respective NAV (or its equivalent), as apractical expedient to estimate fair value due to the absence of readily available market prices. Investments in private investmentfunds, which may be fully redeemed at NAV in the near-term are generally classified in Level 2. Investments in funds, which may notbe fully redeemed at NAV in the near-term, are generally classified in Level 3.
Direct investments in private equity, private debt and real estate securities are generally valued in good faith via the use of themarket approach (earnings multiples from comparable companies) or the income approach (discounted cash flow techniques), andconsider inputs such as revenue growth and gross margin assumptions, discount rates, discounts for lack of liquidity, marketcapitalization rates and the selection of comparable companies. As these valuations incorporate significant unobservable inputs theyare classified in Level 3.
Fair value estimates for private investment funds, private equity, private debt and real estate investments are provided by therespective investment sponsors or investment advisers and are subsequently reviewed and approved by management. In the eventmanagement concludes a reported NAV or fair value estimate (collectively, external valuation) does not reflect fair value or is notdetermined as of the financial reporting measurement date, we will consider whether and when deemed necessary to make an
78
GENERAL MOTORS COMPANY AND SUBSIDIARIES
NOTES TO CONSOLIDATED FINANCIAL STATEMENTS — (Continued)
adjustment at the balance sheet date. In determining whether an adjustment to the external valuation is required, we will reviewmaterial factors that could affect the valuation, such as changes to the composition or performance of the underlying investments orcomparable investments, overall market conditions, expected sale prices for private investments which are probable of being sold inthe short-term and other economic factors that may possibly have a favorable or unfavorable effect on the reported external valuation.
Derivatives
Exchange traded derivatives, such as options and futures, for which market quotations are readily available, are valued at the lastreported sale price or official closing price on the primary market or exchange on which they are traded and are classified in Level 1.Over-the-counter derivatives, including but not limited to swaps, swaptions and forwards, which are typically valued throughindependent pricing services with observable inputs are generally classified in Level 2. Swaps that are cleared by clearinghouses orexchanges are valued with the prices provided by those venues and are generally classified in Level 2. Derivatives classified in Level3 are typically valued via the use of pricing models which incorporate significant unobservable inputs. The inputs part of the modelbased valuations may include extrapolated or model-derived assumptions such as volatilities, yield and credit spread assumptions.
Job Security Programs and Extended Disability Benefits
We have job security programs to provide UAW and Unifor (combined union of the Canadian Auto Workers union and theCommunications, Energy and Paperworkers Union of Canada) employees reduced wages and continued coverage under certainemployee benefit programs depending on the employee’s classification as well as the number of years of service that the employeehas accrued. We also provide extended disability benefits for employees currently disabled and those in the active workforce who maybecome disabled in the form of income replacement, healthcare costs and life insurance premiums.
We recognize a liability for job security programs and extended disability benefits over the expected service period usingmeasurement provisions similar to those used to measure our OPEB obligations based on our best estimate of the probable liability atthe measurement date. We record actuarial gains and losses immediately in earnings.
Stock Incentive Plans
We measure and record compensation expense for all share-based payment awards based on the award’s estimated fair value whichis the fair value of our common stock on the date of grant for Restricted Stock Units (RSUs) and Performance Share Units (PSUs).For awards that do not have an accounting grant date established, the compensation cost is based on the fair value of our commonstock at the end of each reporting period. We record compensation cost for the awards on a straight-line basis over the entire vestingperiod, or for retirement eligible employees over the requisite service period. Salary stock awards granted are fully vested andnonforfeitable upon grant; therefore, compensation cost is recorded on the date of grant. The liability for stock incentive plan awardssettled in cash is remeasured to fair value at the end of each reporting period.
Policy, Product Warranty and Recall Campaigns
The estimated costs related to policy and product warranties are accrued at the time products are sold and are charged toAutomotive cost of sales. These estimates are established using historical information on the nature, frequency and average cost ofclaims of each vehicle line or each model year of the vehicle line and assumptions about future activity and events. Revisions aremade when necessary based on changes in these factors. The estimated costs related to recall campaigns are accrued at the time ofvehicle sale in GMNA and when probable and reasonably estimable in other geographical regions.
Income Taxes
The liability method is used in accounting for income taxes. Deferred tax assets and liabilities are recorded for temporarydifferences between the tax basis of assets and liabilities and their reported amounts in the consolidated financial statements using the
79

GENERAL MOTORS COMPANY AND SUBSIDIARIES
NOTES TO CONSOLIDATED FINANCIAL STATEMENTS — (Continued)
statutory tax rates in effect for the year in which the differences are expected to reverse. The effect on deferred tax assets andliabilities of a change in tax rates is recorded in the results of operations in the period that includes the enactment date under the law.
Deferred income tax assets are evaluated quarterly to determine if valuation allowances are required or should be adjusted. Weestablish valuation allowances for deferred tax assets based on a more likely than not standard. The ability to realize deferred taxassets depends on the ability to generate sufficient taxable income within the carryback or carryforward periods provided for in the taxlaw for each applicable tax jurisdiction. The assessment regarding whether a valuation allowance is required or should be adjustedalso considers all available positive and negative evidence factors. It is difficult to conclude a valuation allowance is not requiredwhen there is significant objective and verifiable negative evidence, such as cumulative losses in recent years. We utilize a rollingthree years of actual and current year results as the primary measure of cumulative losses in recent years.
Income tax expense (benefit) for the year is allocated between continuing operations and other categories of income such as Othercomprehensive income (loss). In periods in which there is a pre-tax loss from continuing operations and pre-tax income in another incomecategory, the tax benefit allocated to continuing operations is determined by taking into account the pre-tax income of other categories.
We record uncertain tax positions on the basis of a two-step process whereby: (1) we determine whether it is more likely than notthat the tax positions will be sustained based on the technical merits of the position; and (2) for those tax positions that meet the morelikely than not recognition, we recognize the largest amount of tax benefit that is greater than 50% likely to be realized upon ultimatesettlement with the related tax authority. We record interest and penalties on uncertain tax positions in Income tax expense (benefit).
Foreign Currency Transactions and Translation
The assets and liabilities of foreign subsidiaries that use the local currency as their functional currency are translated to U.S. Dollarsbased on the current exchange rate prevailing at each balance sheet date and any resulting translation adjustments are included inAccumulated other comprehensive loss. The assets and liabilities of foreign subsidiaries whose local currency is not their functionalcurrency are remeasured from their local currency to their functional currency and then translated to U.S. Dollars. Revenues andexpenses are translated into U.S. Dollars using the average exchange rates prevailing for each period presented.
Gains and losses arising from foreign currency transactions and the effects of remeasurements discussed in the preceding paragraphare recorded in Automotive cost of sales and GM Financial operating and other expenses unless related to Automotive debt, which arerecorded in Interest income and other non-operating income, net. Foreign currency transaction and remeasurement losses were $437million, $350 million and $117 million in the years ended December 31, 2014, 2013 and 2012.
Accounting Standards Not Yet Adopted
In May 2014 the Financial Accounting Standards Board issued Accounting Standards Update (ASU) 2014-09, “Revenue fromContracts with Customers” (ASU 2014-09) which requires companies to recognize revenue when a customer obtains control ratherthan when companies have transferred substantially all risks and rewards of a good or service. This update is effective for annualreporting periods beginning on or after December 15, 2016 and interim periods therein and requires expanded disclosures. We arecurrently assessing the impact the adoption of ASU 2014-09 will have on our consolidated financial statements.
Note 3. Acquisition of Businesses
Acquisition of Certain Ally Financial International Operations
In November 2012 GM Financial entered into a definitive agreement with Ally Financial to acquire 100% of the outstanding equityinterests in the top level holding companies of its automotive finance and financial services operations in Europe and Latin Americaand a separate agreement to acquire Ally Financial’s non-controlling equity interest in SAIC-GMAC, which conducts automotivefinance and other financial services in China.
80

GENERAL MOTORS COMPANY AND SUBSIDIARIES
NOTES TO CONSOLIDATED FINANCIAL STATEMENTS — (Continued)
In the year ended December 31, 2013 GM Financial completed acquisitions of Ally Financial’s European and Latin Americanautomotive finance operations for an aggregate consideration of $3.3 billion. GM Financial recorded the fair value of the assetsacquired and liabilities assumed on the acquisition dates, which consisted primarily of finance receivables and secured and unsecureddebt with the remaining amount allocated to cash, other assets and liabilities and the residual goodwill recorded of $144 million. Inthe year ended December 31, 2014 there were no significant adjustments recorded to these assets acquired or liabilities assumed. Theresults of the acquired European and Latin American automotive finance operations are included in GM Financial’s results beginningon the dates GM Financial completed each acquisition. The unaudited pro forma revenue and net income attributable to stockholdersfor the year ended December 31, 2013 had these acquisitions occurred as of January 1, 2012 would be $156.3 billion and $5.5 billion.
On January 2, 2015 GM Financial completed its acquisition of Ally Financial’s 40% equity interest in SAIC-GMAC in China. Theaggregate purchase price was approximately $1.0 billion, subject to certain post-closing adjustments. Also on January 2, 2015 GMFinancial sold a 5% equity interest in SAIC-GMAC to SAICFC, a current shareholder of SAIC-GMAC, for proceeds ofapproximately $120 million, subject to certain post-closing adjustments. The valuation of the equity interest acquired was not yetcomplete at the time of this filing on Form 10-K because it was not practicable. As a result of these transactions GM indirectly owns45% of SAIC-GMAC.
81

GENERAL MOTORS COMPANY AND SUBSIDIARIES
NOTES TO CONSOLIDATED FINANCIAL STATEMENTS — (Continued)
Note 4. Marketable Securities
The following table summarizes information regarding marketable securities (dollars in millions):
FairValueLevel
December 31, 2014 December 31, 2013
Cost Fair Value Cost Fair Value
Cash and cash equivalentsAvailable-for-sale securities
U.S. government and agencies . . . . . . . . . . . . . . . . . . . . . . . . . . . . . . . . . 2 $ 1,600 $ 1,600 $ 1,437 $ 1,437Sovereign debt . . . . . . . . . . . . . . . . . . . . . . . . . . . . . . . . . . . . . . . . . . . . . 2 774 774 515 515Money market funds . . . . . . . . . . . . . . . . . . . . . . . . . . . . . . . . . . . . . . . . . 1 2,480 2,480 1,262 1,262Corporate debt . . . . . . . . . . . . . . . . . . . . . . . . . . . . . . . . . . . . . . . . . . . . . . 2 6,036 6,036 7,598 7,598
Total available-for-sale securities . . . . . . . . . . . . . . . . . . . . . . . . . . . . . . . . . $ 10,890 10,890 $ 10,812 10,812
Trading securitiesSovereign debt . . . . . . . . . . . . . . . . . . . . . . . . . . . . . . . . . . . . . . . . . . . . . 2 431 —Corporate debt . . . . . . . . . . . . . . . . . . . . . . . . . . . . . . . . . . . . . . . . . . . . . . 2 — 25
Total trading securities . . . . . . . . . . . . . . . . . . . . . . . . . . . . . . . . . . . . . . . . . 431 25
Total marketable securities classified as cash equivalents . . . . . . . . . . . . . . 11,321 10,837Cash, cash equivalents and time deposits . . . . . . . . . . . . . . . . . . . . . . . . . . . 7,633 9,184
Total cash and cash equivalents . . . . . . . . . . . . . . . . . . . . . . . . . . . . . . . . . . $ 18,954 $ 20,021
Marketable securitiesAvailable-for-sale securities
U.S. government and agencies . . . . . . . . . . . . . . . . . . . . . . . . . . . . . . . . . 2 $ 5,957 $ 5,957 $ 5,343 $ 5,344Corporate debt . . . . . . . . . . . . . . . . . . . . . . . . . . . . . . . . . . . . . . . . . . . . . . 2 2,000 1,998 1,889 1,891
Total available-for-sale securities . . . . . . . . . . . . . . . . . . . . . . . . . . . . . . . . . $ 7,957 7,955 $ 7,232 7,235
Trading securities — sovereign debt . . . . . . . . . . . . . . . . . . . . . . . . . . . . . . 2 1,267 1,737
Total marketable securities . . . . . . . . . . . . . . . . . . . . . . . . . . . . . . . . . . . . . . $ 9,222 $ 8,972
Restricted cash and marketable securitiesAvailable-for-sale securities
Money market funds . . . . . . . . . . . . . . . . . . . . . . . . . . . . . . . . . . . . . . . . . 1 $ 1,381 $ 1,381 $ 897 $ 897Other . . . . . . . . . . . . . . . . . . . . . . . . . . . . . . . . . . . . . . . . . . . . . . . . . . . . . 2 45 46 34 35
Total marketable securities classified as restricted cash and marketablesecurities . . . . . . . . . . . . . . . . . . . . . . . . . . . . . . . . . . . . . . . . . . . . . . . . . . $ 1,426 1,427 $ 931 932
Restricted cash and cash equivalents and time deposits . . . . . . . . . . . . . . . . 846 1,144
Total restricted cash and marketable securities . . . . . . . . . . . . . . . . . . . . . . $ 2,273 $ 2,076
We are required to post cash and marketable securities as collateral as part of certain agreements that we enter into as part of ouroperations. Cash and marketable securities subject to contractual restrictions and not readily available are classified as Restricted cashand marketable securities. Restricted cash and marketable securities are invested in accordance with the terms of the underlyingagreements and include amounts related to various deposits, escrows and other cash collateral.
Sales proceeds from investments classified as available-for-sale and sold prior to maturity were $5.9 billion, $4.7 billion and $4.7billion in the years ended December 31, 2014, 2013 and 2012. Cumulative unrealized gains and losses on available-for-sale securities andnet unrealized gains and losses on trading securities were insignificant at and in the years ended December 31, 2014, 2013 and 2012.
82

GENERAL MOTORS COMPANY AND SUBSIDIARIES
NOTES TO CONSOLIDATED FINANCIAL STATEMENTS — (Continued)
The following table summarizes the amortized cost and the fair value of investments classified as available-for-sale by contractualmaturity at December 31, 2014 (dollars in millions):
Amortized Cost Fair Value
Due in one year or less . . . . . . . . . . . . . . . . . . . . . . . . . . . . . . . . . . . . . . . . . . . . . . . . . . . . . . . . . . . . . . . . $ 14,461 $ 14,461Due after one year through five years . . . . . . . . . . . . . . . . . . . . . . . . . . . . . . . . . . . . . . . . . . . . . . . . . . . . 1,951 1,950
Total contractual maturities of available-for-sale securities . . . . . . . . . . . . . . . . . . . . . . . . . . . . . . . . . . . $ 16,412 $ 16,411
Peugeot S.A.
In December 2013 we sold our seven percent investment in PSA common stock for $339 million, net of disposal costs and werecorded a net gain of $152 million in Interest income and other non-operating income, net.
At December 31, 2012 we determined that the carrying amount of our investment in PSA common stock was impaired and that theimpairment was other-than-temporary. As a result we transferred the total unrealized losses from Accumulated other comprehensiveloss to Interest income and other non-operating income, net resulting in an impairment charge of $220 million.
Note 5. GM Financial Receivables, net
The following table summarizes the components of consumer and commercial finance receivables, net (dollars in millions):
December 31, 2014 December 31, 2013
Consumer Commercial Total Consumer Commercial Total
Pre-acquisition finance receivables, outstandingamount . . . . . . . . . . . . . . . . . . . . . . . . . . . . . . . . . . . . . $ 508 $ — $ 508 $ 1,294 $ — $ 1,294
Pre-acquisition finance receivables, carrying amount . . $ 459 $ — $ 459 $ 1,174 $ — $ 1,174Post-acquisition finance receivables, net of fees . . . . . . 25,164 7,606 32,770 21,956 6,050 28,006
Finance receivables . . . . . . . . . . . . . . . . . . . . . . . . . . . . . 25,623 7,606 33,229 23,130 6,050 29,180Less: allowance for loan losses . . . . . . . . . . . . . . . . . . . . (655) (40) (695) (497) (51) (548)
GM Financial receivables, net . . . . . . . . . . . . . . . . . . . . $ 24,968 $ 7,566 $ 32,534 $ 22,633 $ 5,999 $ 28,632
Fair value of GM Financial receivables, net . . . . . . . . . . $ 33,106 $ 28,668
Allowance for loan losses classified as current at December 31, 2014 and 2013 were $529 million and $427 million.
GM Financial determines the fair value of consumer finance receivables using observable and unobservable inputs within a cashflow model. The inputs reflect assumptions regarding expected prepayments, deferrals, delinquencies, recoveries and charge-offs ofthe loans within the portfolio. The cash flow model produces an estimated amortization schedule of the finance receivables which isthe basis for the calculation of the series of cash flows that derive the fair value of the portfolio. The series of cash flows arecalculated and discounted using a weighted-average cost of capital (WACC) or current interest rates. The WACC uses unobservabledebt and equity percentages, an unobservable cost of equity and an observable cost of debt based on companies with a similar creditrating and maturity profile as the portfolio. Macroeconomic factors could affect the credit performance of the portfolio and thereforecould potentially affect the assumptions used in GM Financial’s cash flow model. A substantial majority of commercial financereceivables have variable interest rates and maturities of one year or less. Therefore, the carrying amount is considered to be areasonable estimate of fair value.
83

GENERAL MOTORS COMPANY AND SUBSIDIARIES
NOTES TO CONSOLIDATED FINANCIAL STATEMENTS — (Continued)
The following table summarizes activity for the allowance for loan losses on consumer and commercial finance receivables (dollarsin millions):
Years Ended December 31,
2014 2013 2012
Balance at beginning of period . . . . . . . . . . . . . . . . . . . . . . . . . . . . . . . . . . . . . . . . . . . . . . . . . . . . . . . . . . . $ 548 $ 351 $ 179Provision for loan losses . . . . . . . . . . . . . . . . . . . . . . . . . . . . . . . . . . . . . . . . . . . . . . . . . . . . . . . . . . . . . . . . 604 475 304Charge-offs . . . . . . . . . . . . . . . . . . . . . . . . . . . . . . . . . . . . . . . . . . . . . . . . . . . . . . . . . . . . . . . . . . . . . . . . . . (914) (643) (304)Recoveries . . . . . . . . . . . . . . . . . . . . . . . . . . . . . . . . . . . . . . . . . . . . . . . . . . . . . . . . . . . . . . . . . . . . . . . . . . . 470 362 172Effect of foreign currency . . . . . . . . . . . . . . . . . . . . . . . . . . . . . . . . . . . . . . . . . . . . . . . . . . . . . . . . . . . . . . . (13) 3 —
Balance at end of period . . . . . . . . . . . . . . . . . . . . . . . . . . . . . . . . . . . . . . . . . . . . . . . . . . . . . . . . . . . . . . . . $ 695 $ 548 $ 351
The balances and activity of the allowance for commercial loan losses were insignificant at and for the years ended December 31,2014, 2013 and 2012.
Credit Quality
Consumer Finance Receivables
GM Financial uses proprietary scoring systems that measure the credit quality of the receivables using several factors, such ascredit bureau information, consumer credit risk scores (e.g. FICO scores) and contract characteristics. In addition to GM Financial’sproprietary scoring systems GM Financial considers other individual consumer factors such as employment history, financial stabilityand capacity to pay. Subsequent to origination GM Financial reviews the credit quality of retail receivables based on customerpayment activity. At the time of loan origination substantially all of GM Financial’s international consumers have prime credit scores.At the time of loan origination many consumers in North America had sub-prime credit scores, which are defined as FICO scores ofless than 620. At December 31, 2014 and 2013, 83% and 88% of the consumer finance receivables in North America were fromconsumers with FICO scores of less than 620.
GM Financial purchases consumer finance contracts from automobile dealers without recourse, and accordingly, the dealer has noliability to GM Financial if the consumer defaults on the contract. Finance receivables are collateralized by vehicle titles and GMFinancial has the right to repossess the vehicle in the event the consumer defaults on the payment terms of the contract.
An account is considered delinquent if a substantial portion of a scheduled payment has not been received by the date such paymentwas contractually due. At December 31, 2014 and 2013 the accrual of finance charge income has been suspended on delinquentconsumer finance receivables with contractual amounts due of $682 million and $642 million. The following table summarizes thecontractual amount of delinquent contracts, which is not significantly different than the recorded investment of the consumer financereceivables (dollars in millions):
December 31, 2014 December 31, 2013
Amount
Percent ofContractualAmount Due Amount
Percent ofContractualAmount Due
31-to-60 days delinquent . . . . . . . . . . . . . . . . . . . . . . . . . . . . . . . . . . . . . . . . . . . . . . . $ 1,083 4.2% $ 952 4.1%Greater-than-60 days delinquent . . . . . . . . . . . . . . . . . . . . . . . . . . . . . . . . . . . . . . . . . 432 1.7% 408 1.7%
Total finance receivables more than 30 days delinquent . . . . . . . . . . . . . . . . . . . . . . . 1,515 5.9% 1,360 5.8%In repossession . . . . . . . . . . . . . . . . . . . . . . . . . . . . . . . . . . . . . . . . . . . . . . . . . . . . . . . 40 0.2% 41 0.2%
Total finance receivables more than 30 days delinquent or in repossession . . . . . . . . $ 1,555 6.1% $ 1,401 6.0%
84

GENERAL MOTORS COMPANY AND SUBSIDIARIES
NOTES TO CONSOLIDATED FINANCIAL STATEMENTS — (Continued)
Impaired Finance Receivables — TDRs
The following table summarizes the outstanding recorded investment for consumer finance receivables that are considered to beTDRs and the related allowance (dollars in millions):
December 31, 2014 December 31, 2013
Outstanding recorded investment . . . . . . . . . . . . . . . . . . . . . . . . . . . . . . . . . . . . . . . . . . . . . . . . . . . $ 1,234 $ 767Less: allowance for loan losses . . . . . . . . . . . . . . . . . . . . . . . . . . . . . . . . . . . . . . . . . . . . . . . . . . . . . (172) (103)
Outstanding recorded investment, net of allowance . . . . . . . . . . . . . . . . . . . . . . . . . . . . . . . . . . . . . $ 1,062 $ 664
Unpaid principal balance . . . . . . . . . . . . . . . . . . . . . . . . . . . . . . . . . . . . . . . . . . . . . . . . . . . . . . . . . . $ 1,255 $ 779
Commercial Finance Receivables
GM Financial’s commercial finance receivables consist of dealer financings, primarily for inventory purchases. A proprietarymodel is used to assign a risk rating to each dealer. A credit review of each dealer is performed at least annually and, if necessary, thedealer’s risk rating is adjusted on the basis of the review. At December 31, 2014 and 2013 the commercial finance receivables on non-accrual status were insignificant. The following table summarizes the credit risk profile by dealer grouping of the commercial financereceivables (dollars in millions):
December 31, 2014 December 31, 2013
Group I — Dealers with superior financial metrics . . . . . . . . . . . . . . . . . . . . . . . . . . . . . . . . . . . . . $ 1,050 $ 549Group II — Dealers with strong financial metrics . . . . . . . . . . . . . . . . . . . . . . . . . . . . . . . . . . . . . . 2,022 1,460Group III — Dealers with fair financial metrics . . . . . . . . . . . . . . . . . . . . . . . . . . . . . . . . . . . . . . . . 2,599 1,982Group IV — Dealers with weak financial metrics . . . . . . . . . . . . . . . . . . . . . . . . . . . . . . . . . . . . . . 1,173 1,462Group V — Dealers warranting special mention due to potential weaknesses . . . . . . . . . . . . . . . . 524 385Group VI — Dealers with loans classified as substandard, doubtful or impaired . . . . . . . . . . . . . . 238 212
$ 7,606 $ 6,050
The credit lines for Group VI dealers are typically suspended and no further funding is extended to these dealers.
Note 6. Inventories
The following table summarizes the components of Inventories (dollars in millions):
December 31, 2014 December 31, 2013
Productive material, supplies and work in process . . . . . . . . . . . . . . . . . . . . . . . . . . . . . . . . . . . . . . $ 5,380 $ 5,872Finished product, including service parts . . . . . . . . . . . . . . . . . . . . . . . . . . . . . . . . . . . . . . . . . . . . . 8,262 8,167
Total inventories . . . . . . . . . . . . . . . . . . . . . . . . . . . . . . . . . . . . . . . . . . . . . . . . . . . . . . . . . . . . . . . . $ 13,642 $ 14,039
85
GENERAL MOTORS COMPANY AND SUBSIDIARIES
NOTES TO CONSOLIDATED FINANCIAL STATEMENTS — (Continued)
Note 7. Equipment on Operating Leases, net
Automotive
Equipment on operating leases, net is composed of vehicle sales to daily rental car companies with a guaranteed repurchaseobligation. The following tables summarize information related to Equipment on operating leases, net (dollars in millions):
December 31, 2014 December 31, 2013
Equipment on operating leases . . . . . . . . . . . . . . . . . . . . . . . . . . . . . . . . . . . . . . . . . . . . . . . . . . . . . $ 3,822 $ 2,605Less: accumulated depreciation . . . . . . . . . . . . . . . . . . . . . . . . . . . . . . . . . . . . . . . . . . . . . . . . . . . . (258) (207)
Equipment on operating leases, net . . . . . . . . . . . . . . . . . . . . . . . . . . . . . . . . . . . . . . . . . . . . . . . . . . $ 3,564 $ 2,398
Years Ended December 31,
2014 2013 2012
Depreciation expense . . . . . . . . . . . . . . . . . . . . . . . . . . . . . . . . . . . . . . . . . . . . . . . . . . . . . . . . . . . . . . . $ 507 $ 218 $ 227Impairment charges . . . . . . . . . . . . . . . . . . . . . . . . . . . . . . . . . . . . . . . . . . . . . . . . . . . . . . . . . . . . . . . . . $ 155 $ 168 $ 181
Automotive Financing — GM Financial
GM Financial originates leases in the U.S. and Canada that are recorded as operating leases. A Canadian subsidiary of GMFinancial originates and sells leases to a third-party with servicing retained. The following table summarizes GM Financial equipmenton operating leases, net (dollars in millions):
December 31, 2014 December 31, 2013
GM Financial equipment on operating leases . . . . . . . . . . . . . . . . . . . . . . . . . . . . . . . . . . . . . . . . . . $ 8,268 $ 4,025Less: accumulated depreciation . . . . . . . . . . . . . . . . . . . . . . . . . . . . . . . . . . . . . . . . . . . . . . . . . . . . (1,208) (642)
GM Financial equipment on operating leases, net . . . . . . . . . . . . . . . . . . . . . . . . . . . . . . . . . . . . . . $ 7,060 $ 3,383
Depreciation expense related to GM Financial equipment on operating leases, net was $868 million, $450 million and $205 millionin the years ended December 31, 2014, 2013 and 2012.
The following table summarizes minimum rental payments due to GM Financial as lessor under operating leases (dollars inmillions):
2015 2016 2017 2018 2019
Minimum rental receipts under operating leases . . . . . . . . . . . . . . . . . . . . . . $ 1,241 $ 1,019 $ 597 $ 98 $ 5
Note 8. Equity in Net Assets of Nonconsolidated Affiliates
Nonconsolidated affiliates are entities in which an equity ownership interest is maintained and for which the equity method ofaccounting is used due to the ability to exert significant influence over decisions relating to their operating and financial affairs.
86

GENERAL MOTORS COMPANY AND SUBSIDIARIES
NOTES TO CONSOLIDATED FINANCIAL STATEMENTS — (Continued)
Sales and income of our China JVs are not consolidated into our financial statements; rather, our proportionate share of the earnings ofeach joint venture is reflected as Equity income. The following table summarizes information regarding Equity income (dollars in millions):
Years Ended December 31,
2014 2013 2012
China JVs . . . . . . . . . . . . . . . . . . . . . . . . . . . . . . . . . . . . . . . . . . . . . . . . . . . . . . . . . . . . . . . . . . . . . . . $ 2,066 $ 1,763 $ 1,521Others . . . . . . . . . . . . . . . . . . . . . . . . . . . . . . . . . . . . . . . . . . . . . . . . . . . . . . . . . . . . . . . . . . . . . . . . . . 28 47 41
Total equity income . . . . . . . . . . . . . . . . . . . . . . . . . . . . . . . . . . . . . . . . . . . . . . . . . . . . . . . . . . . . . . . $ 2,094 $ 1,810 $ 1,562
We received dividends from nonconsolidated affiliates of $1.8 billion, $1.7 billion and $1.4 billion in the years ended December 31,2014, 2013 and 2012. At December 31, 2014 and 2013 we had undistributed earnings including dividends declared but not received of$2.0 billion and $1.8 billion related to our nonconsolidated affiliates.
Investment in China JVs
The following table summarizes our direct ownership interests in China JVs:
December 31, 2014 December 31, 2013
Shanghai General Motors Co., Ltd. (SGM) . . . . . . . . . . . . . . . . . . . . . . . . . . . . . . . . . . . . . . . . . . . 50% 50%Shanghai GM Norsom Motor Co., Ltd. (SGM Norsom) . . . . . . . . . . . . . . . . . . . . . . . . . . . . . . . . . 25% 25%Shanghai GM Dong Yue Motors Co., Ltd. (SGM DY) . . . . . . . . . . . . . . . . . . . . . . . . . . . . . . . . . . 25% 25%Shanghai GM Dong Yue Powertrain (SGM DYPT) . . . . . . . . . . . . . . . . . . . . . . . . . . . . . . . . . . . . . 25% 25%SAIC-GM-Wuling Automobile Co., Ltd. . . . . . . . . . . . . . . . . . . . . . . . . . . . . . . . . . . . . . . . . . . . . . 44% 44%FAW-GM Light Duty Commercial Vehicle Co., Ltd. . . . . . . . . . . . . . . . . . . . . . . . . . . . . . . . . . . . 50% 50%Pan Asia Technical Automotive Center Co., Ltd. . . . . . . . . . . . . . . . . . . . . . . . . . . . . . . . . . . . . . . . 50% 50%Shanghai OnStar Telematics Co., Ltd. (Shanghai OnStar) . . . . . . . . . . . . . . . . . . . . . . . . . . . . . . . . 40% 40%Shanghai Chengxin Used Car Operation and Management Co., Ltd. (Shanghai Chengxin Used
Car) . . . . . . . . . . . . . . . . . . . . . . . . . . . . . . . . . . . . . . . . . . . . . . . . . . . . . . . . . . . . . . . . . . . . . . . . 33% 33%SAIC General Motors Sales Co., Ltd. (SGMS) . . . . . . . . . . . . . . . . . . . . . . . . . . . . . . . . . . . . . . . . 49% 49%
SGM is a joint venture established by Shanghai Automotive Industry Corporation (SAIC) (50%) and us (50%). SGM has interestsin three other joint ventures in China: SGM Norsom, SGM DY and SGM DYPT. These three joint ventures are jointly held by SGM(50%), SAIC (25%) and us (25%). These four joint ventures are engaged in the production, import and sale of a comprehensive rangeof products under the Buick, Chevrolet and Cadillac brands. SGM also has interests in Shanghai OnStar (20%) and ShanghaiChengxin Used Car (33%). SGM also has a 20% equity interest in SAIC-GMAC, a joint venture established by General MotorsAcceptance Corporation (now Ally Financial) (40%) and SAICFC (40%). As a result of GM Financial’s transactions on January 2,2015 GM Financial now owns 35% of SAIC-GMAC and SAICFC owns 45%.
SGMS is a joint venture established in November 2011 by SAIC (51%) and us (49%) to engage in the sales of the imported Buick,Chevrolet and Cadillac brands and the sales of automobiles manufactured by SGM.
Investment in and Summarized Financial Data of Nonconsolidated Affiliates
The following table summarizes the carrying amount of investments in nonconsolidated affiliates (dollars in millions):
December 31, 2014 December 31, 2013
China JVs . . . . . . . . . . . . . . . . . . . . . . . . . . . . . . . . . . . . . . . . . . . . . . . . . . . . . . . . . . . . . . . . . . . . . $ 8,140 $ 7,851Other investments . . . . . . . . . . . . . . . . . . . . . . . . . . . . . . . . . . . . . . . . . . . . . . . . . . . . . . . . . . . . . . . 210 243
Total equity in net assets of nonconsolidated affiliates . . . . . . . . . . . . . . . . . . . . . . . . . . . . . . . . . . $ 8,350 $ 8,094
87

GENERAL MOTORS COMPANY AND SUBSIDIARIES
NOTES TO CONSOLIDATED FINANCIAL STATEMENTS — (Continued)
At December 31, 2014 and 2013 the carrying amount of our investments in certain joint ventures exceeded our share of theunderlying net assets by $3.9 billion and $3.8 billion primarily related to goodwill from the application of fresh-start reporting andpurchase of additional interests in nonconsolidated affiliates.
The following tables present summarized financial data for nonconsolidated affiliates (dollars in millions):
December 31, 2014 December 31, 2013
China JVs Others Total China JVs Others Total
Summarized Balance Sheet DataCurrent assets . . . . . . . . . . . . . . . . . . . . . . . . . . . . . . . . . . . $ 15,442 $ 2,636 $ 18,078 $ 14,666 $ 2,234 $ 16,900Non-current assets . . . . . . . . . . . . . . . . . . . . . . . . . . . . . . . . 9,758 1,507 11,265 8,187 1,458 9,645
Total assets . . . . . . . . . . . . . . . . . . . . . . . . . . . . . . . . . . . . . $ 25,200 $ 4,143 $ 29,343 $ 22,853 $ 3,692 $ 26,545
Current liabilities . . . . . . . . . . . . . . . . . . . . . . . . . . . . . . . . $ 16,141 $ 2,179 $ 18,320 $ 14,019 $ 1,859 $ 15,878Non-current liabilities . . . . . . . . . . . . . . . . . . . . . . . . . . . . . 931 495 1,426 1,065 511 1,576
Total liabilities . . . . . . . . . . . . . . . . . . . . . . . . . . . . . . . . . . $ 17,072 $ 2,674 $ 19,746 $ 15,084 $ 2,370 $ 17,454
Non-controlling interests . . . . . . . . . . . . . . . . . . . . . . . . . . $ 1,043 $ 3 $ 1,046 $ 1,040 $ — $ 1,040
Years Ended December 31,
2014 2013 2012
Summarized Operating DataChina JVs’ net sales . . . . . . . . . . . . . . . . . . . . . . . . . . . . . . . . . . . . . . . . . . . . . . . . . . . . . . . . . . . . $ 43,853 $ 38,767 $ 33,364Others’ net sales . . . . . . . . . . . . . . . . . . . . . . . . . . . . . . . . . . . . . . . . . . . . . . . . . . . . . . . . . . . . . . . 3,171 1,830 3,963
Total net sales . . . . . . . . . . . . . . . . . . . . . . . . . . . . . . . . . . . . . . . . . . . . . . . . . . . . . . . . . . . . . . . . $ 47,024 $ 40,597 $ 37,327
China JVs’ net income . . . . . . . . . . . . . . . . . . . . . . . . . . . . . . . . . . . . . . . . . . . . . . . . . . . . . . . . . . $ 4,312 $ 3,685 $ 3,198Others’ net income (loss) . . . . . . . . . . . . . . . . . . . . . . . . . . . . . . . . . . . . . . . . . . . . . . . . . . . . . . . . 91 50 (23)
Total net income . . . . . . . . . . . . . . . . . . . . . . . . . . . . . . . . . . . . . . . . . . . . . . . . . . . . . . . . . . . . . . $ 4,403 $ 3,735 $ 3,175
Transactions with Nonconsolidated Affiliates
Nonconsolidated affiliates are involved in various aspects of the development, production and marketing of cars, trucks andautomobile parts. We purchase component parts and vehicles from certain nonconsolidated affiliates for resale to dealers. We also sellcomponent parts and vehicles to certain nonconsolidated affiliates. The following tables summarize transactions with nonconsolidatedaffiliates (dollars in millions):
Years Ended December 31,
2014 2013 2012
Automotive sales and revenue . . . . . . . . . . . . . . . . . . . . . . . . . . . . . . . . . . . . . . . . . . . . . . . . . . . . $ 2,762 $ 2,724 $ 2,572Automotive purchases, net . . . . . . . . . . . . . . . . . . . . . . . . . . . . . . . . . . . . . . . . . . . . . . . . . . . . . . . $ 311 $ 724 $ 497Interest income and other non-operating income, net . . . . . . . . . . . . . . . . . . . . . . . . . . . . . . . . . . $ 23 $ 19 $ 184Operating cash flows . . . . . . . . . . . . . . . . . . . . . . . . . . . . . . . . . . . . . . . . . . . . . . . . . . . . . . . . . . . $ 4,321 $ 3,607 $ 3,385
December 31, 2014 December 31, 2013
Accounts and notes receivable, net . . . . . . . . . . . . . . . . . . . . . . . . . . . . . . . . . . . . . . . . . . . . . . . . . . $ 706 $ 756Accounts payable . . . . . . . . . . . . . . . . . . . . . . . . . . . . . . . . . . . . . . . . . . . . . . . . . . . . . . . . . . . . . . . $ 205 $ 183
88

GENERAL MOTORS COMPANY AND SUBSIDIARIES
NOTES TO CONSOLIDATED FINANCIAL STATEMENTS — (Continued)
Note 9. Property, net
The following table summarizes the components of Property, net (dollars in millions):
Estimated Useful Lives in Years December 31, 2014 December 31, 2013
Land . . . . . . . . . . . . . . . . . . . . . . . . . . . . . . . . . . . . . . . . . . . . . . . . . . $ 1,695 $ 1,868Buildings and improvements . . . . . . . . . . . . . . . . . . . . . . . . . . . . . . . 5-40 5,236 4,971Machinery and equipment . . . . . . . . . . . . . . . . . . . . . . . . . . . . . . . . . 3-27 16,788 15,222Construction in progress . . . . . . . . . . . . . . . . . . . . . . . . . . . . . . . . . . 4,114 2,644
Real estate, plants and equipment . . . . . . . . . . . . . . . . . . . . . . . . . . . 27,833 24,705Less: accumulated depreciation . . . . . . . . . . . . . . . . . . . . . . . . . . . . . (8,067) (6,787)
Real estate, plants and equipment, net . . . . . . . . . . . . . . . . . . . . . . . 19,766 17,918Special tools, net . . . . . . . . . . . . . . . . . . . . . . . . . . . . . . . . . . . . . . . . 1-15 7,977 7,949
Total property, net . . . . . . . . . . . . . . . . . . . . . . . . . . . . . . . . . . . . . . . $ 27,743 $ 25,867
The amount of capitalized software included in Property, net was $817 million and $630 million in the years ended December 31,2014 and 2013. The amount of interest capitalized and excluded from Automotive interest expense related to Property, net was $70million, $81 million and $117 million in the years ended December 31, 2014, 2013 and 2012.
The following table summarizes depreciation, amortization and impairment charges related to Property, net (dollars in millions):
Years Ended December 31,
2014 2013 2012
Depreciation and amortization expense . . . . . . . . . . . . . . . . . . . . . . . . . . . . . . . . . . . . . . . . . . . . . . . . $ 4,187 $ 3,959 $ 3,888Impairment charges (a) . . . . . . . . . . . . . . . . . . . . . . . . . . . . . . . . . . . . . . . . . . . . . . . . . . . . . . . . . . . . 709 901 3,793
Depreciation, amortization and impairment charges . . . . . . . . . . . . . . . . . . . . . . . . . . . . . . . . . . . . . . $ 4,896 $ 4,860 $ 7,681
Capitalized software amortization expense (b) . . . . . . . . . . . . . . . . . . . . . . . . . . . . . . . . . . . . . . . . . . $ 295 $ 244 $ 209
(a) Includes impairment charges of $321 million and $179 million at GMIO and GME whose assets were written down to fair values of $85 millionand $11 million at December 31, 2014. Also includes other assets whose fair value was determined to be $0 in the years ended December 31,2014, 2013 and 2012 measured utilizing Level 3 inputs. Fair value measurements of the non-GMIO and non-GME asset group long-lived assetsutilized projected cash flows discounted at a rate commensurate with the perceived business risks related to the assets involved.
(b) Included in total depreciation, impairment charges and amortization expense.
Impairment Charges
Year Ended December 31, 2013
GMIO
As a result of our strategic assessment of GM India in response to lower than expected sales performance of our current productofferings in India, higher raw material costs, unfavorable foreign exchange rates and recent deterioration in local market conditionswe recorded impairment charges of $280 million to adjust the carrying amount of GM India’s real and personal property to fair valueof $45 million. These charges were recorded in Automotive cost of sales. We also recorded intangible asset and goodwill impairmentcharges of $103 million, for total impairment charges of $383 million. The noncontrolling interest portion of these charges was $35million based on our 90.8% ownership of GM India. Refer to Note 11 for additional information regarding the impairment ofIntangible assets, net and Note 10 for additional information regarding the impairment of Goodwill.
89

GENERAL MOTORS COMPANY AND SUBSIDIARIES
NOTES TO CONSOLIDATED FINANCIAL STATEMENTS — (Continued)
As a result of our plans to cease manufacturing and significantly reduce engineering at our GM Holden Ltd. (Holden) subsidiary inAustralia by the end of 2017 we recorded asset impairment charges of $477 million to adjust the carrying amounts of certain long-lived assets to fair value of $71 million. These charges were recorded in Automotive cost of sales. Refer to Note 19 for additionalinformation on the actions taken at Holden.
Year Ended December 31, 2012
During the fourth quarter of 2012 our European industry outlook deteriorated and our forecast of 2013 cash flows declinednotwithstanding our actions. As a result of our recoverability test of the GME asset group we recorded asset impairment charges of$3.7 billion to adjust the carrying amount of the GME real and personal property to fair value of $0.4 billion. These charges wererecorded primarily in Automotive cost of sales. We also recorded intangible asset and other long-lived asset impairment charges of$1.8 billion, for total impairment charges of $5.5 billion. Refer to Note 11 for additional information regarding the impairment ofIntangible assets, net.
Fair Value Measurements
To determine the estimated fair value of real and personal property, the cost approach, market approach and income approach wereconsidered. Under the cost approach, the determination of fair value considered the estimates of the cost to construct or purchase anew asset of equal utility at current prices with adjustments in value for physical deterioration, functional obsolescence, and economicobsolescence. Under the market approach, the determination of fair value considered the market prices in transactions for similarassets and certain direct market values based on quoted prices from brokers and secondary market participants for similar assets.Under the income approach, the determination of fair value considered the estimate of the present worth of future benefits derivedfrom ownership, usually measured through the capitalization of a specific level of income which can be derived from the subject assetwith adjustments in value for demolition costs and for the effect of an estimated holding period. Under the income approach, it wasassumed fair value could not exceed the present value of the net cash flows discounted at a rate commensurate with the level of riskinherent in the subject asset. An in-exchange premise was determined to be the highest and best use.
The following table summarizes the significant Level 3 inputs for real and personal property measurements:
Valuation Technique(s) Unobservable Input(s) Range
GM India personal property . . . . . . . . . . . . . . . . . . . . . . . . . . . . . Market approach Economic obsolescence (a) 72% - 100%Holden real property . . . . . . . . . . . . . . . . . . . . . . . . . . . . . . . . . . . Income approach Holding period (b) 0 - 3 years
Discount rate (c) 11% - 12%GME real property . . . . . . . . . . . . . . . . . . . . . . . . . . . . . . . . . . . . Market approach Demolition costs (d) 6% - 23%
Cost approach Holding period (b) 0 - 4 yearsIncome approach Discount rate (c) 11.2% - 14.5%
GME personal property . . . . . . . . . . . . . . . . . . . . . . . . . . . . . . . . Market approach Physical deterioration (e) 52% - 69%Cost approach Functional obsolescence (f) 8% - 28%
Economic obsolescence (a) 17% - 23%
(a) Represents estimated loss in asset value caused by factors external to the asset such as legislative enactments, changes in use, social change andchange in supply and demand.
(b) Represents estimated marketing period for each property which dictates the amount of property specific holding costs to be incurred such as realestate taxes.
(c) Represents the discount rate for the specific property based on local market sources and available benchmarking data.(d) Represents estimated gross cost to demolish and clear the structures on the property as a percentage of replacement cost new.(e) Represents estimated loss in asset value due to wear and tear, action of the elements and other physical factors that reduce the life and
serviceability of the asset.(f) Represents estimated loss in asset value caused by inefficiencies and inadequacies of the asset itself.
90

GENERAL MOTORS COMPANY AND SUBSIDIARIES
NOTES TO CONSOLIDATED FINANCIAL STATEMENTS — (Continued)
The personal property in our Holden asset group was determined to have a nominal fair value because of anticipated losses duringthe wind-down period and limited to no salvage value given the decline in the automotive manufacturing base in Australia.
The fair value estimates for GM India, Holden and GME real and personal property are based on a valuation premise that assumesthe assets’ highest and best use are different than their current use based on the forecasted financial results of the asset groups.
Note 10. Goodwill
The following table summarizes the changes in the carrying amounts of Goodwill (dollars in millions):
AutomotiveGM
Financial Total
Balance at January 1, 2013 . . . . . . . . . . . . . . . . . . . . . . . . . . . . . . . . . . . . . . . . . . . . . . . . . . . . . . $ 695 $ 1,278 $ 1,973Impairment charges . . . . . . . . . . . . . . . . . . . . . . . . . . . . . . . . . . . . . . . . . . . . . . . . . . . . . . . . . . . . (541) — (541)Goodwill from business combinations (a) . . . . . . . . . . . . . . . . . . . . . . . . . . . . . . . . . . . . . . . . . . 10 144 154Effect of foreign currency and other . . . . . . . . . . . . . . . . . . . . . . . . . . . . . . . . . . . . . . . . . . . . . . . (26) — (26)
Balance at December 31, 2013 . . . . . . . . . . . . . . . . . . . . . . . . . . . . . . . . . . . . . . . . . . . . . . . . . . . 138 1,422 1,560Impairment charges . . . . . . . . . . . . . . . . . . . . . . . . . . . . . . . . . . . . . . . . . . . . . . . . . . . . . . . . . . . . (120) — (120)Effect of foreign currency and other . . . . . . . . . . . . . . . . . . . . . . . . . . . . . . . . . . . . . . . . . . . . . . . (18) 5 (13)
Balance at December 31, 2014 . . . . . . . . . . . . . . . . . . . . . . . . . . . . . . . . . . . . . . . . . . . . . . . . . . . $ — $ 1,427 $ 1,427
Accumulated impairment charges at January 1, 2013 . . . . . . . . . . . . . . . . . . . . . . . . . . . . . . . . . $ (29,897) $ — $ (29,897)Accumulated impairment charges at December 31, 2013 . . . . . . . . . . . . . . . . . . . . . . . . . . . . . . $ (30,438) $ — $ (30,438)Accumulated impairment charges at December 31, 2014 . . . . . . . . . . . . . . . . . . . . . . . . . . . . . . $ (30,558) $ — $ (30,558)
(a) Refer to Note 3 for additional information concerning the acquisitions.
The total automotive Goodwill balance at December 31, 2013 was recorded in GMSA. In addition to our annual goodwillimpairment tests we performed event-driven goodwill impairment tests at various dates for certain of our reporting units in the yearsended December 31, 2013 and 2012.
GMSA
Based on the results of our annual goodwill impairment tests we recorded total Goodwill impairment charges of $120 million in theyear ended December 31, 2014. The impairment charges primarily resulted from lower forecasted profitability in Brazil resulting fromrecent deterioration in local market conditions and in Venezuela resulting from challenging local market conditions, includingunfavorable foreign exchange rates and the recent downward trend in the price of oil. At December 31, 2014 the goodwill balance was$0 for all of the reporting units in GMSA.
GMNA
Subsequent to our 2012 annual goodwill impairment test, we reversed $36.2 billion of our deferred tax asset valuation allowancesfor our GMNA reporting unit. The reversal of the deferred tax asset valuation allowances resulted in the carrying amount of ourGMNA reporting unit exceeding fair value. As a result we performed an event-driven goodwill impairment test in the three monthsended December 31, 2012 and recorded a Goodwill impairment charge of $26.4 billion. Refer to Note 18 for additional informationon the reversal of our deferred tax asset valuation allowances for our U.S. and Canadian operations.
91

GENERAL MOTORS COMPANY AND SUBSIDIARIES
NOTES TO CONSOLIDATED FINANCIAL STATEMENTS — (Continued)
GME
At the time of our 2012 annual impairment test our GME reporting unit had a negative carrying amount and because it was morelikely than not further goodwill impairment existed due to further deterioration in the business outlook for GME and increases in thefair value of estimated employee benefit obligations, we recorded Goodwill impairment charges of $590 million in the year endedDecember 31, 2012.
GMIO
Based on the results of our annual and event-driven goodwill impairment tests we recorded total Goodwill impairment charges of$541 million and $156 million in the years ended December 31, 2013 and 2012. The impairment charges primarily related to our GMKorea Company (GM Korea) and Holden reporting units. We performed event-driven goodwill impairment tests for GM Korea in2013 and 2012 as the fair value of GM Korea continued to be below its carrying amount due to ongoing economic weakness in certainmarkets to which GM Korea exports coupled with lower forecasted margins resulting from higher raw material costs and unfavorableforeign exchange rates. Furthermore in the three months ended December 31, 2013 we announced our plans to cease mainstreamdistribution of Chevrolet brand in Western and Central Europe that resulted in the impairment of the remaining goodwill. Chevroletsales in Europe are included in our GM Korea operations. We also recorded a Goodwill impairment charge in the three months endedDecember 31, 2013 associated with our GM India reporting unit resulting from lower forecasted profitability in India due to lowerthan expected sales performance of our current product offerings in India, higher raw material costs, unfavorable foreign exchangerates and deterioration in local market conditions. Refer to Note 9 for additional information on our operations in India. AtDecember 31, 2013 the goodwill balance was $0 for all of the reporting units in GMIO.
Note 11. Intangible Assets, net
The following table summarizes the components of Intangible assets, net (dollars in millions):
December 31, 2014 December 31, 2013
Gross CarryingAmount
AccumulatedAmortization
Net CarryingAmount
Gross CarryingAmount
AccumulatedAmortization
Net CarryingAmount
Technology and intellectual property . . . . . . . . $ 8,193 $ 7,744 $ 449 $ 8,210 $ 7,308 $ 902Brands . . . . . . . . . . . . . . . . . . . . . . . . . . . . . . . . 4,447 683 3,764 4,466 559 3,907Dealer network and customer relationships . . . 1,094 434 660 1,108 364 744Favorable contracts and other . . . . . . . . . . . . . . 345 331 14 345 326 19
Total amortizing intangible assets . . . . . . . . . . 14,079 9,192 4,887 14,129 8,557 5,572Nonamortizing in process research and
development . . . . . . . . . . . . . . . . . . . . . . . . . 96 96 96 96
Total intangible assets . . . . . . . . . . . . . . . . . . . . $ 14,175 $ 9,192 $ 4,983 $ 14,225 $ 8,557 $ 5,668
In December 2012 we entered into a product development agreement with PSA to collaborate on the development of certain vehicleplatforms, components and modules. As a result of this agreement, in the three months ended March 31, 2013 we acquired the rightsto certain technology and intellectual property for total consideration of $642 million. Consideration of $201 million was paid in cashin May 2013 with the remaining consideration to be paid by May 2018. The acquired rights were recorded at the present value of thetotal payments to be made as technology and intellectual property of $594 million. In December 2013 we agreed with PSA tomutually cancel development of one of the vehicle programs and reduce the amount of remaining consideration to be paid, resulting ina net charge of $49 million recorded in Automotive cost of sales in GMNA. The net charge consisted of an impairment of theassociated intellectual property of $211 million and a reduction of total consideration from $642 million to $480 million.
92

GENERAL MOTORS COMPANY AND SUBSIDIARIES
NOTES TO CONSOLIDATED FINANCIAL STATEMENTS — (Continued)
The following table summarizes the amortization expense and impairment charges related to Intangible assets, net (dollars inmillions):
Years Ended December 31,
2014 2013 2012
Amortization expense . . . . . . . . . . . . . . . . . . . . . . . . . . . . . . . . . . . . . . . . . . . . . . . . . . . . . . . . . . . . . . . $ 676 $ 1,281 $ 1,568Impairment charges . . . . . . . . . . . . . . . . . . . . . . . . . . . . . . . . . . . . . . . . . . . . . . . . . . . . . . . . . . . . . . . . . $ 16 $ 523 $ 1,755
The following table summarizes estimated amortization expense related to Intangible assets, net in each of the next five years(dollars in millions):
2015 2016 2017 2018 2019
Estimated amortization expense . . . . . . . . . . . . . . . . . . . . . . . . . . . . . . . . . . $ 332 $ 311 $ 306 $ 302 $ 205
Impairment Charges
Year Ended December 31, 2013
GMIO
As a result of our strategic assessment of GM India we recorded impairment charges of $48 million to adjust the carrying amountsof Intangible assets, net, primarily favorable contract intangibles, to fair value of $0 because of a lack of economic support associatedwith GM India’s declining operations. These charges were recorded primarily in Automotive cost of sales. Refer to Note 9 foradditional information regarding the triggering events of the impairment charges in GM India.
We recorded impairment charges of $264 million to adjust the carrying amounts of Intangible assets, net, primarily dealer networkintangibles related to the Chevrolet network in Europe, to fair value of $0 because we are winding down the dealer network in 2014and we expect to incur losses during the wind-down period. These charges were recorded in Automotive cost of sales. Refer to Note19 for additional information on the withdrawal of the Chevrolet brand from Europe.
Year Ended December 31, 2012
We adjusted the carrying amount of the GME intangible assets to fair value of $139 million and recorded asset impairment chargesof $1.8 billion at December 31, 2012. These charges were recorded primarily in Automotive selling, general and administrativeexpense. The fair value estimates for GME’s intangible assets are based on a valuation premise that assumes the assets’ highest andbest use are different than their current use due to the overall European macro-economic environment.
To determine the estimated fair value of the brand intangible assets we used the relief from royalty method which is a form of theincome approach. Under this approach revenue associated with the brand is projected over the expected remaining useful life of theasset. A royalty rate is then applied to estimate the royalty savings. The royalty rate used was based on an analysis of empirical,market-derived royalty rates for guideline intangible assets and a profit split analysis to determine a rate that is economicallysupported by GME’s forecasted profitability. The net after-tax royalty savings are calculated for each year during the remainingeconomic life of the asset and discounted to present value.
To determine the estimated fair value of the dealer network we used the cost approach with adjustments in value for theovercapacity of dealers and the sales environment in the region. We determined the fair value to be $0.
93

GENERAL MOTORS COMPANY AND SUBSIDIARIES
NOTES TO CONSOLIDATED FINANCIAL STATEMENTS — (Continued)
The following table summarizes the significant Level 3 inputs for brand intangible assets measurements:
Valuation Technique Unobservable Input(s) Percentage
Brand intangible assets . . . . . . . . . . . . . . . . . . . . . . . . . . . . . . . . . . . . . . . . . . . Income approach Long-term growth rate 0.50%Pre-tax royalty rate (a) 0.14%Discount rate (b) 21.25%
(a) Represents estimated savings realized from owning the asset or having the royalty-free right to use the asset.(b) Represents WACC adjusted for perceived business risks related to these intangible assets.
Note 12. Variable Interest Entities
Automotive Financing — GM Financial Consolidated VIEs
GM Financial uses special purpose entities (SPEs) that are considered VIEs to issue variable funding notes to third party bank-sponsored warehouse facilities or asset-backed securities to investors in securitization transactions. The debt issued by these VIEs isbacked by the cash flows related to finance receivables and leasing related assets transferred by GM Financial to the VIEs (SecuritizedAssets). GM Financial holds variable interests in the VIEs that could potentially be significant to the VIEs. GM Financial determinedthat they are the primary beneficiary of the SPEs because: (1) the servicing responsibilities for the Securitized Assets give GMFinancial the power to direct the activities that most significantly impact the performance of the VIEs; and (2) the variable interests inthe VIEs give GM Financial the obligation to absorb losses and the right to receive residual returns that could potentially besignificant. The assets and liabilities of the VIEs are included in GM Financial’s consolidated balance sheets. The following tablesummarizes the assets and liabilities related to GM Financial’s consolidated VIEs prior to intercompany eliminations (dollars inmillions):
December 31, 2014 December 31, 2013
Restricted cash . . . . . . . . . . . . . . . . . . . . . . . . . . . . . . . . . . . . . . . . . . . . . . . . . . . . . . . . . . . . . . . . . $ 1,721 $ 1,523Securitized Assets . . . . . . . . . . . . . . . . . . . . . . . . . . . . . . . . . . . . . . . . . . . . . . . . . . . . . . . . . . . . . . . $ 27,704 $ 23,584Securitization notes payable and other credit facilities . . . . . . . . . . . . . . . . . . . . . . . . . . . . . . . . . . . $ 22,794 $ 19,448
The assets of the VIEs and the restricted cash held by GM Financial serve as the sole source of repayment for the debt issued bythese entities. Restricted cash represents collections from the underlying Securitized Assets and certain reserve accounts held as creditenhancement for securitizations held by GM Financial for the benefit of the noteholders. An additional form of credit enhancement isprovided in the form of overcollateralization, whereby more loans or leases are transferred to the VIEs than the amount of asset-backed securities issued by the VIEs. GM Financial also maintains an allowance for estimated probable credit losses on securitizedreceivables. Cash pledged is invested in highly liquid securities with original maturities of 90 days or less.
Investors in the notes issued by the VIEs do not have recourse to GM Financial or its other assets, with the exception of customaryrepresentation and warranty repurchase provisions and indemnities that GM Financial provides as the servicer. GM Financial is notrequired and does not currently intend to provide additional financial support to these SPEs. While these subsidiaries are included inGM Financial’s consolidated financial statements, these subsidiaries are separate legal entities and their assets are legally owned bythem and are not available to GM Financial’s creditors.
94

GENERAL MOTORS COMPANY AND SUBSIDIARIES
NOTES TO CONSOLIDATED FINANCIAL STATEMENTS — (Continued)
Note 13. Accrued Liabilities and Other Liabilities
The following table summarizes the components of Accrued liabilities and Other liabilities (dollars in millions):
December 31, 2014 December 31, 2013
CurrentDealer and customer allowances, claims and discounts . . . . . . . . . . . . . . . . . . . . . . . . . . . . . . . . . . $ 8,035 $ 7,919Deposits primarily from rental car companies . . . . . . . . . . . . . . . . . . . . . . . . . . . . . . . . . . . . . . . . . 6,089 4,713Deferred revenue . . . . . . . . . . . . . . . . . . . . . . . . . . . . . . . . . . . . . . . . . . . . . . . . . . . . . . . . . . . . . . . . 1,622 1,276Product warranty and related liabilities . . . . . . . . . . . . . . . . . . . . . . . . . . . . . . . . . . . . . . . . . . . . . . 3,582 2,721Payrolls and employee benefits excluding postemployment benefits . . . . . . . . . . . . . . . . . . . . . . . 2,144 2,285Other . . . . . . . . . . . . . . . . . . . . . . . . . . . . . . . . . . . . . . . . . . . . . . . . . . . . . . . . . . . . . . . . . . . . . . . . . 6,712 5,719
Total accrued liabilities . . . . . . . . . . . . . . . . . . . . . . . . . . . . . . . . . . . . . . . . . . . . . . . . . . . . . . . . . . . $ 28,184 $ 24,633
Non-currentDeferred revenue . . . . . . . . . . . . . . . . . . . . . . . . . . . . . . . . . . . . . . . . . . . . . . . . . . . . . . . . . . . . . . . . $ 1,556 $ 1,249Product warranty and related liabilities . . . . . . . . . . . . . . . . . . . . . . . . . . . . . . . . . . . . . . . . . . . . . . 6,064 4,880Employee benefits excluding postemployment benefits . . . . . . . . . . . . . . . . . . . . . . . . . . . . . . . . . . 1,049 1,192Postemployment benefits including facility idling reserves . . . . . . . . . . . . . . . . . . . . . . . . . . . . . . . 1,259 1,216Other . . . . . . . . . . . . . . . . . . . . . . . . . . . . . . . . . . . . . . . . . . . . . . . . . . . . . . . . . . . . . . . . . . . . . . . . . 4,154 4,816
Total other liabilities . . . . . . . . . . . . . . . . . . . . . . . . . . . . . . . . . . . . . . . . . . . . . . . . . . . . . . . . . . . . . $ 14,082 $ 13,353
The following table summarizes activity for product warranty and related liabilities which include policy, product warranty, recallcampaigns and courtesy transportation (dollars in millions):
Years Ended December 31,
2014 2013 2012
Beginning balance . . . . . . . . . . . . . . . . . . . . . . . . . . . . . . . . . . . . . . . . . . . . . . . . . . . . . . . . . . . . . . . . $ 7,601 $ 7,633 $ 7,031Warranties issued and assumed in period — recall campaigns and courtesy transportation . . . . . . . 2,910 640 775Warranties issued and assumed in period — policy and warranty . . . . . . . . . . . . . . . . . . . . . . . . . . . 2,540 2,757 2,840Payments . . . . . . . . . . . . . . . . . . . . . . . . . . . . . . . . . . . . . . . . . . . . . . . . . . . . . . . . . . . . . . . . . . . . . . . (4,326) (3,240) (3,575)Adjustments to pre-existing warranties . . . . . . . . . . . . . . . . . . . . . . . . . . . . . . . . . . . . . . . . . . . . . . . . 1,187 49 504Effect of foreign currency and other . . . . . . . . . . . . . . . . . . . . . . . . . . . . . . . . . . . . . . . . . . . . . . . . . . (266) (238) 58
Ending balance . . . . . . . . . . . . . . . . . . . . . . . . . . . . . . . . . . . . . . . . . . . . . . . . . . . . . . . . . . . . . . . . . . . $ 9,646 $ 7,601 $ 7,633
In the year ended December 31, 2014 we recorded charges of approximately $2.9 billion in Automotive cost of sales relating torecall campaigns and courtesy transportation, of which over 86% was recorded in GMNA. The recorded charges primarily comprised:(1) approximately $680 million for 2.6 million vehicles to repair ignition switches that could result in a loss of electrical power undercertain circumstances that may prevent front airbags from deploying in the event of a crash (accident victims who died or sufferedphysical injury associated with these vehicles (or their families) may be eligible to participate in a compensation program, as morefully described in Note 17); to fix ignition lock cylinders that could allow removal of the ignition key while the engine is running,leading to possible rollaway or crash; and to provide courtesy transportation to owners of affected vehicles; partially offset byadjustments of approximately $95 million for courtesy transportation as a result of greater part availability and fewer customersutilizing courtesy transportation than originally estimated and approximately $80 million for costs originally estimated separately forignition switches and ignition lock cylinders that are now being shipped and repaired at the same time resulting in reduced costs;(2) approximately $340 million for 1.9 million vehicles to replace either the power steering motor, the steering column, the powersteering motor control unit or a combination of the steering column and the power steering motor control unit as the electric powersteering could fail under certain circumstances; (3) approximately $185 million for 1.3 million vehicles prone to non-deployment of
95

GENERAL MOTORS COMPANY AND SUBSIDIARIES
NOTES TO CONSOLIDATED FINANCIAL STATEMENTS — (Continued)
the side impact restraints if vehicles are not serviced when the Service Air Bag warning light is illuminated; (4) approximately $90million for 2.7 million vehicles to modify the brake lamp wiring harness that could have corrosion develop due to micro-vibration;(5) approximately $80 million for 1.5 million vehicles to replace front safety lap belt cables that could fatigue and separate over time;(6) approximately $150 million for 1.4 million vehicles to replace the shift cable that could wear out over time resulting inmismatches of the gear position indicated by the shift lever; (7) approximately $325 million for 12.1 million vehicles to rework orreplace ignition keys because the ignition switch may move out of the “run” position which may impact power steering and powerbraking and, depending on the timing of the key movement relative to the activation of the sensing algorithm of a crash event, mayresult in airbags not deploying; and (8) approximately $520 million for 5.2 million vehicles for other matters.
We have historically accrued estimated costs related to recall campaigns in GMNA when they are probable and reasonablyestimable, which typically occurs once it is determined a specific recall campaign is needed and announced. During the three monthsended June 30, 2014, following the significant increase in the number of vehicles subject to recall in GMNA, the results of ourongoing comprehensive safety review, additional engineering analysis, the creation of a new Global Product Integrity organization,the appointment of a new Global Vice President of Vehicle Safety responsible for the safety development of our vehicle systems andour overall commitment to customer satisfaction, we accumulated sufficient historical data in GMNA to support the use of anactuarial-based estimation technique for recall campaigns. As such, we now accrue at the time of vehicle sale in GMNA the costs forrecall campaigns. Based on the expanded historical data, we recorded a catch-up adjustment of $874 million to adjust the estimate forrecall costs for previously sold vehicles, which is included in Adjustments to pre-existing warranties in the three months endedJune 30, 2014. The estimation technique for recall campaigns takes into account our historical experience, including incident rates ofrecall campaigns. In the six months ended December 31, 2014 we announced 23 recalls covering approximately 8.1 million vehiclesrelated to safety, customer satisfaction and other matters. The costs for these recalls are comprehended in the catch-up adjustment andalso resulted in additional adjustment of approximately $200 million.
Note 14. Short-Term and Long-Term Debt
Automotive
The following table summarizes the components of our short-term and long-term debt (dollars in millions):
December 31, 2014 December 31, 2013
Secured debt . . . . . . . . . . . . . . . . . . . . . . . . . . . . . . . . . . . . . . . . . . . . . . . . . . . . . . . . . . . . . . . . . . . $ 237 $ 320Unsecured debt . . . . . . . . . . . . . . . . . . . . . . . . . . . . . . . . . . . . . . . . . . . . . . . . . . . . . . . . . . . . . . . . . 8,205 5,852Capital leases . . . . . . . . . . . . . . . . . . . . . . . . . . . . . . . . . . . . . . . . . . . . . . . . . . . . . . . . . . . . . . . . . . . 968 965
Total automotive debt (a) . . . . . . . . . . . . . . . . . . . . . . . . . . . . . . . . . . . . . . . . . . . . . . . . . . . . . . . . . $ 9,410 $ 7,137
Fair value of automotive debt . . . . . . . . . . . . . . . . . . . . . . . . . . . . . . . . . . . . . . . . . . . . . . . . . . . . . . $ 9,799 $ 6,837Available under credit facility agreements . . . . . . . . . . . . . . . . . . . . . . . . . . . . . . . . . . . . . . . . . . . . $ 12,026 $ 10,404Interest rate range on outstanding debt (b) . . . . . . . . . . . . . . . . . . . . . . . . . . . . . . . . . . . . . . . . . . . . 0.0-18.0% 0.0-19.0%Weighted-average interest rate on outstanding short-term debt (b) . . . . . . . . . . . . . . . . . . . . . . . . . 6.4% 9.0%Weighted-average interest rate on outstanding long-term debt (b) . . . . . . . . . . . . . . . . . . . . . . . . . 4.3% 3.8%
(a) Net of a $681 million and $765 million net discount at December 31, 2014 and 2013.(b) Includes coupon rates on debt denominated in various foreign currencies and interest free loans.
The fair value of debt includes $7.6 billion measured utilizing Level 1 inputs at December 31, 2014 and $2.2 billion and $6.8 billionmeasured utilizing Level 2 inputs at December 31, 2014 and 2013. The fair value of debt measured utilizing Level 1 inputs was based onquoted prices in active markets for identical instruments that a market participant can access at the measurement date. The fair value ofdebt measured utilizing Level 2 inputs was based on quoted market prices in inactive markets for identical instruments and if unavailable,a discounted cash flow model. This model utilizes observable inputs such as contractual repayment terms and benchmark yield curves,
96

GENERAL MOTORS COMPANY AND SUBSIDIARIES
NOTES TO CONSOLIDATED FINANCIAL STATEMENTS — (Continued)
plus a spread based on our senior unsecured notes that is intended to represent our nonperformance risk. We obtain the benchmark yieldcurves and yields on unsecured notes from independent sources that are widely used in the financial industry.
Revolving Credit Facilities
We received an investment grade corporate rating from Moody’s in September 2013 and from S&P in September 2014 whichallowed the release of the collateral securing our $11.0 billion revolving credit facilities under their terms.
In October 2014 we amended our two primary revolving credit facilities, increasing our aggregate borrowing capacity from $11.0billion to $12.5 billion. These facilities consist of a three-year, $5.0 billion facility and a five-year, $7.5 billion facility. Both facilitiesare available to the Company as well as certain wholly-owned subsidiaries, including GM Financial. The three-year, $5.0 billionfacility allows for borrowings in U.S. Dollars and other currencies and includes a GM Financial borrowing sub-limit of $2.0 billion, aletter of credit sub-facility of $1.6 billion and a Brazilian Real sub-facility of $305 million. The five-year, $7.5 billion facility allowsfor borrowings in U.S. Dollars and other currencies and includes a GM Financial borrowing sub-limit of $2.0 billion, a letter of creditsub-limit of $500 million and a Brazilian Real sub-facility of $195 million.
The revolving credit facilities contain representations, warranties and covenants that are typical for these types of facilities. Thefacilities also require us to maintain at least $4.0 billion in global liquidity and at least $2.0 billion in U.S. liquidity and to guaranteeany borrowings by our subsidiaries. If we fail to maintain an investment grade corporate rating from two or more of the followingcredit rating agencies: Fitch, Moody’s and S&P, we will be required to provide guarantees from certain domestic subsidiaries underthe terms of the facilities. Interest rates on obligations under the revolving credit facilities are based on prevailing annual interest ratesfor Eurodollar loans or an alternative base rate, plus an applicable margin.
Senior Unsecured Notes
In November 2014 we issued $2.5 billion in aggregate principal amount of senior unsecured notes comprising $500 million of 4.0%notes due in 2025, $750 million of 5.0% notes due in 2035 and $1.25 billion of 5.2% notes due in 2045. In September 2013 we issued$4.5 billion in aggregate principal amount of senior unsecured notes comprising $1.5 billion of 3.5% notes due in 2018, $1.5 billion of4.875% notes due in 2023 and $1.5 billion of 6.25% notes due in 2043. These notes contain terms and covenants customary of thesetypes of securities including limitations on the amount of certain secured debt we may issue.
Extinguishment of Debt
In the year ended December 31, 2014 we prepaid and retired debt obligations with a total carrying amount of $325 million andrecorded a net gain on extinguishment of debt of $202 million which primarily represented unsecured debt in Brazil. In the year endedDecember 31, 2013 we prepaid and retired debt obligations with a total carrying amount of $1.8 billion and recorded a net loss onextinguishment of debt of $212 million which primarily represented the unamortized debt discount on GM Korea mandatorilyredeemable preferred shares. In the year ended December 31, 2012 we prepaid and retired debt obligations with a total carryingamount of $514 million and recorded a net loss on extinguishment of debt of $250 million which primarily represented theunamortized debt discount on GM Korea mandatorily redeemable preferred shares.
97

GENERAL MOTORS COMPANY AND SUBSIDIARIES
NOTES TO CONSOLIDATED FINANCIAL STATEMENTS — (Continued)
Automotive Financing — GM Financial
The following table summarizes the carrying amount and fair value of debt (dollars in millions):
December 31, 2014 December 31, 2013
CarryingAmount
FairValue
CarryingAmount
FairValue
Secured debt . . . . . . . . . . . . . . . . . . . . . . . . . . . . . . . . . . . . . . . . . . . . . . . . . . . . . . . $ 25,214 $ 25,228 $ 22,073 $ 22,170Unsecured debt . . . . . . . . . . . . . . . . . . . . . . . . . . . . . . . . . . . . . . . . . . . . . . . . . . . . . 12,217 12,479 6,973 7,078
Total GM Financial debt . . . . . . . . . . . . . . . . . . . . . . . . . . . . . . . . . . . . . . . . . . . . . . $ 37,431 $ 37,707 $ 29,046 $ 29,248
The fair value of debt includes $32.8 billion and $23.0 billion measured utilizing Level 2 inputs and $4.9 billion and $6.2 billionmeasured utilizing Level 3 inputs at December 31, 2014 and December 31, 2013. The fair value of debt measured utilizing Level 2inputs was based on quoted market prices and if unavailable, quoted market prices of similar securities. For debt that has terms of oneyear or less or has been priced within the last six months, the carrying amount or par value is considered to be a reasonable estimate offair value. The fair value of debt measured utilizing Level 3 inputs was based on the discounted future net cash flows expected to besettled using current risk-adjusted rates.
Secured Debt
Most of the secured debt was issued by VIEs and is repayable only from proceeds related to the underlying pledged financereceivables and leases. Refer to Note 12 for additional information relating to GM Financial’s involvement with VIEs. Secured debtconsists of revolving credit facilities and securitization notes payable. Weighted-average interest rates are both fixed and variable,ranging from 0.35% to 13.43% at December 31, 2014.
The revolving credit facilities are expected to be repaid over periods ranging up to five years. At the end of the revolving period, ifnot renewed, the debt will amortize over a defined period. GM Financial is required to hold certain funds in restricted cash accounts toprovide additional collateral for borrowings under certain secured credit facilities. In the year ended December 31, 2014 GM Financialentered into new or renewed credit facilities with a total additional borrowing capacity of $5.5 billion.
Securitization notes payable at December 31, 2014 are due beginning in 2016 through 2022. In the year ended December 31, 2014GM Financial issued securitization notes payable of $10.7 billion with a weighted-average interest rate of 1.4% maturing on variousdates through 2022.
Unsecured Debt
Unsecured debt consists of senior notes, credit facilities and other unsecured debt. Senior notes outstanding at December 31, 2014are due beginning in 2016 through 2023 and have interest rates that range from 1.875% to 6.75%. In May 2014 GM Financial issuedCAD 400 million of 3.25% senior notes which are due in May 2017. In July 2014 GM Financial issued $1.5 billion in aggregateprincipal amount of senior notes comprising $700 million of 2.625% notes due in July 2017 and $800 million of 3.5% notes due inJuly 2019. In September 2014 GM Financial issued $2.0 billion in aggregate principal amount of senior notes comprising $750million of 3.0% notes due in September 2017 and $1.25 billion of 4.375% notes due in September 2021. In October 2014 GMFinancial issued Euro 500 million of 1.875% term notes which are due in October 2019. The notes are guaranteed by GM Financial’sprincipal operating subsidiary.
In January 2015 GM Financial issued $2.25 billion in aggregate principal amount of senior notes comprising $1.0 billion of 3.15%notes due in January 2020, $1.0 billion of 4.0% notes due in January 2025 and $250 million of floating rate notes due in January 2020.Interest rates on the floating rate notes are equal to three-month LIBOR plus an applicable margin. The notes are guaranteed by GMFinancial’s principal operating subsidiary.
98

GENERAL MOTORS COMPANY AND SUBSIDIARIES
NOTES TO CONSOLIDATED FINANCIAL STATEMENTS — (Continued)
The terms of advances on revolving credit facilities and other unsecured debt have remaining maturities of up to five years. Interestrates on credit facilities and other unsecured debt ranged from 0.98% to 13.35% at December 31, 2014.
Consolidated
Interest Expense
The following table summarizes interest expense (dollars in millions):
Years Ended December 31,
2014 2013 2012
Automotive . . . . . . . . . . . . . . . . . . . . . . . . . . . . . . . . . . . . . . . . . . . . . . . . . . . . . . . . . . . . . . . . . . . . . . . $ 403 $ 334 $ 489Automotive Financing — GM Financial . . . . . . . . . . . . . . . . . . . . . . . . . . . . . . . . . . . . . . . . . . . . . . . . 1,426 715 283
Total interest expense . . . . . . . . . . . . . . . . . . . . . . . . . . . . . . . . . . . . . . . . . . . . . . . . . . . . . . . . . . . . . . . $ 1,829 $ 1,049 $ 772
Debt Maturities
The following table summarizes contractual maturities including capital leases at December 31, 2014 (dollars in millions):
AutomotiveAutomotive
Financing (a) Total
2015 . . . . . . . . . . . . . . . . . . . . . . . . . . . . . . . . . . . . . . . . . . . . . . . . . . . . . . . . . . . . . . . . . . . . . . . . $ 503 $ 14,491 $ 14,9942016 . . . . . . . . . . . . . . . . . . . . . . . . . . . . . . . . . . . . . . . . . . . . . . . . . . . . . . . . . . . . . . . . . . . . . . . . 174 9,177 9,3512017 . . . . . . . . . . . . . . . . . . . . . . . . . . . . . . . . . . . . . . . . . . . . . . . . . . . . . . . . . . . . . . . . . . . . . . . . 511 7,255 7,7662018 . . . . . . . . . . . . . . . . . . . . . . . . . . . . . . . . . . . . . . . . . . . . . . . . . . . . . . . . . . . . . . . . . . . . . . . . 1,600 2,666 4,2662019 . . . . . . . . . . . . . . . . . . . . . . . . . . . . . . . . . . . . . . . . . . . . . . . . . . . . . . . . . . . . . . . . . . . . . . . . 109 1,860 1,969Thereafter . . . . . . . . . . . . . . . . . . . . . . . . . . . . . . . . . . . . . . . . . . . . . . . . . . . . . . . . . . . . . . . . . . . . 7,194 2,000 9,194
$ 10,091 $ 37,449 $ 47,540
(a) Secured debt, credit facilities and other unsecured debt are based on expected payoff date. Senior notes principal amounts are based on maturity.
At December 31, 2014 future interest payments on automotive capital lease obligations were $488 million. GM Financial had nocapital lease obligations at December 31, 2014.
Compliance with Debt Covenants
Several of our loan facilities, including our revolving credit facilities, require compliance with certain financial and operationalcovenants as well as regular reporting to lenders, including providing certain subsidiary financial statements. Some of GM Financial’ssecured and unsecured debt agreements also contain various covenants, including maintaining minimum financial ratios, asset qualityand portfolio performance ratios as well as limits on deferment levels. Failure to meet certain of these requirements may result in acovenant violation or an event of default depending on the terms of the agreement. An event of default may allow lenders to declareamounts outstanding under these agreements immediately due and payable, to enforce their interests against collateral pledged underthese agreements or restrict our ability or GM Financial’s ability to obtain additional borrowings. No technical defaults or covenantviolations existed at December 31, 2014.
99

GENERAL MOTORS COMPANY AND SUBSIDIARIES
NOTES TO CONSOLIDATED FINANCIAL STATEMENTS — (Continued)
Note 15. Pensions and Other Postretirement Benefits
Employee Pension and Other Postretirement Benefit Plans
Defined Benefit Pension Plans
Defined benefit pension plans covering eligible U.S. hourly employees (hired prior to October 2007) and Canadian hourlyemployees generally provide benefits of negotiated, stated amounts for each year of service and supplemental benefits for employeeswho retire with 30 years of service before normal retirement age. The benefits provided by the defined benefit pension plans coveringeligible U.S. (hired prior to January 1, 2001) and Canadian salaried employees and employees in certain other non-U.S. locations aregenerally based on years of service and compensation history. Accrual of defined pension benefits ceased on September 30, 2012 forU.S. salaried employees and on December 31, 2012 for Canadian salaried employees. There is also an unfunded nonqualified pensionplan covering primarily U.S. executives for service prior to January 1, 2007 and it is based on an “excess plan” for service after thatdate.
The funding policy for qualified defined benefit pension plans is to contribute annually not less than the minimum required byapplicable law and regulations or to directly pay benefit payments where appropriate. At December 31, 2014 all legal fundingrequirements had been met. We expect to contribute $70 million to our U.S. non-qualified plans and $1.1 billion to our non-U.S.pension plans in 2015. The following table summarizes contributions made to the defined benefit pension plans (dollars in millions):
Years Ended December 31,
2014 2013 2012
U.S. hourly and salaried . . . . . . . . . . . . . . . . . . . . . . . . . . . . . . . . . . . . . . . . . . . . . . . . . . . . . . . . . . . . $ 143 $ 128 $ 2,420Non-U.S. . . . . . . . . . . . . . . . . . . . . . . . . . . . . . . . . . . . . . . . . . . . . . . . . . . . . . . . . . . . . . . . . . . . . . . . 770 886 855
Total . . . . . . . . . . . . . . . . . . . . . . . . . . . . . . . . . . . . . . . . . . . . . . . . . . . . . . . . . . . . . . . . . . . . . . . . . . . $ 913 $ 1,014 $ 3,275
We continue to pursue various options to fund and derisk our pension plans, including continued changes to the pension assetportfolio mix to reduce funded status volatility.
Other Postretirement Benefit Plans
Certain hourly and salaried defined benefit plans provide postretirement medical, dental, legal service and life insurance to eligibleU.S. and Canadian retirees and their eligible dependents. Certain other non-U.S. subsidiaries have postretirement benefit plans,although most non-U.S. employees are covered by government sponsored or administered programs.
The following table summarizes contributions to the U.S. OPEB plans (dollars in millions):
Years Ended December 31,
2014 2013 2012
Employer contributions . . . . . . . . . . . . . . . . . . . . . . . . . . . . . . . . . . . . . . . . . . . . . . . . . . . . . . . . . . . . $ 354 $ 393 $ 432Plan participants’ contributions . . . . . . . . . . . . . . . . . . . . . . . . . . . . . . . . . . . . . . . . . . . . . . . . . . . . . . 22 29 4
Total contributions . . . . . . . . . . . . . . . . . . . . . . . . . . . . . . . . . . . . . . . . . . . . . . . . . . . . . . . . . . . . . . . . $ 376 $ 422 $ 436
Defined Contribution Plans
We have defined contribution plans for eligible U.S. salaried and hourly employees that provide discretionary matchingcontributions. Contributions are also made to certain non-U.S. defined contribution plans. We made contributions to our definedcontribution plans of $513 million, $502 million and $352 million in the years ended December 31, 2014, 2013 and 2012.
100

GENERAL MOTORS COMPANY AND SUBSIDIARIES
NOTES TO CONSOLIDATED FINANCIAL STATEMENTS — (Continued)
Significant Plan Amendments, Benefit Modifications and Related Events
U.S. Salaried Defined Benefit Life Insurance Plan
In September 2013 we amended the U.S. salaried life insurance plan effective January 1, 2014 to eliminate benefits for retirees andeligible employees retiring on or after August 1, 2009. The remeasurement, settlement and curtailment resulted in a decrease in theOPEB liability of $319 million, a decrease in the net pre-tax actuarial loss component of Accumulated other comprehensive loss of$236 million and a pre-tax gain of $83 million.
U.S. Salaried Defined Benefit Pension Plan
In the year ended December 31, 2012 we amended the salaried pension plan to cease the accrual of additional benefits effectiveSeptember 30, 2012 resulting in a curtailment of $309 million which decreased the pension liability. We divided the plan to create anew legally separate defined benefit plan primarily for active and terminated vested participants. Settlement payments of $30.6 billionwere made consisting of lump-sum pension distributions of $3.6 billion to retired salaried plan participants, group annuity contractspurchased for a total annuity premium of $25.1 billion and two separate previously guaranteed obligations of $1.9 billion were settled.These agreements unconditionally and irrevocably guarantee the full payment of all annuity payments to the participants that werereceiving payments from the plan and the insurance companies assumed all investment risk associated with the assets that weredelivered as the annuity contract premiums.
Through these transactions we have settled certain pension obligations in their entirety resulting in a pre-tax settlement loss of $2.6billion ($2.2 billion after tax) in Automotive cost of sales. The pre-tax loss is composed of existing losses in Accumulated othercomprehensive loss of $377 million and the premium paid to the insurance company of $2.1 billion. The tax benefit of $413 million iscomposed of the statutory tax benefit of $1.0 billion offset by tax expense of $596 million primarily associated with the removal ofprior period income tax allocations between Accumulated other comprehensive loss and Income tax expense (benefit).
In the year ended December 31, 2012 we provided short-term, interest-free, unsecured loans of $2.2 billion to provide the plan withincremental liquidity to pay ongoing benefits and administrative costs. Through December 31, 2013 contributions of $1.7 billion weremade from the $2.2 billion loans and the remaining amounts were repaid.
Active salaried plan participants began receiving additional contributions in the defined contribution plan in October 2012. Lump-sum pension distributions in 2013 of $430 million resulted in a pre-tax settlement gain of $128 million.
Other Remeasurements
In the three months ended December 31, 2014 the SOA issued new mortality and mortality improvement tables that raise lifeexpectancies and thereby indicate the amount of estimated aggregate benefit payments to our U.S. pension plans’ participants isincreasing. We have incorporated the new SOA mortality and mortality improvement tables into our December 31, 2014 measurementof our U.S. pension plans’ benefit obligations. The change in these assumptions had the effect of increasing the December 31, 2014U.S. pension plans’ obligations by $2.2 billion.
In September 2011 a plan which provided legal services to U.S. hourly employees and retirees was remeasured as a result of ourlabor agreement provisions which terminated the plan effective December 31, 2013. The negotiated termination has been accountedfor as a negative plan amendment resulting in a decrease in the OPEB liability and a pre-tax increase of $266 million in the priorservice credit component of Accumulated other comprehensive loss was amortized through December 31, 2013.
In March 2012 certain pension plans in GME were remeasured as part of our goodwill impairment testing, resulting in an increaseof $150 million in the pension liability and a pre-tax increase in the net actuarial loss component of Accumulated other comprehensiveloss.
101

GENERAL MOTORS COMPANY AND SUBSIDIARIES
NOTES TO CONSOLIDATED FINANCIAL STATEMENTS — (Continued)
Pension and OPEB Obligations and Plan Assets
The following table summarizes the change in benefit obligations and related plan assets (dollars in millions):
Year Ended December 31, 2014 Year Ended December 31, 2013
Pension Benefits Other Benefits Pension Benefits Other Benefits
U.S. PlansNon-U.S.
Plans U.S. PlansNon-U.S.
Plans U.S. PlansNon-U.S.
Plans U.S. PlansNon-U.S.
Plans
Change in benefit obligationsBeginning benefit obligation . . . . . . . . . . . . $ 71,480 $ 27,528 $ 5,110 $ 1,238 $ 82,110 $ 29,301 $ 6,271 $ 1,528Service cost . . . . . . . . . . . . . . . . . . . . . . . . . . 247 358 13 10 298 394 24 13Interest cost . . . . . . . . . . . . . . . . . . . . . . . . . . 3,060 1,031 218 55 2,837 1,010 217 57Amendments . . . . . . . . . . . . . . . . . . . . . . . . . — 17 — — — (4) — (4)Actuarial (gains) losses . . . . . . . . . . . . . . . . . 7,770 3,179 331 117 (7,661) (1,009) (757) (210)Benefits paid . . . . . . . . . . . . . . . . . . . . . . . . . (5,779) (1,699) (376) (50) (5,719) (1,683) (422) (53)Foreign currency translation adjustments . . . — (2,536) — (108) — (528) — (98)Curtailments, settlements and other . . . . . . . (54) 19 (7) 74 (385) 47 (223) 5
Ending benefit obligation . . . . . . . . . . . . . . . 76,724 27,897 5,289 1,336 71,480 27,528 5,110 1,238
Change in plan assetsBeginning fair value of plan assets . . . . . . . . 64,166 14,986 — — 68,085 15,541 — —Actual return on plan assets . . . . . . . . . . . . . 7,346 1,893 — — 2,107 988 — —Employer contributions . . . . . . . . . . . . . . . . . 143 770 354 48 128 886 393 51Benefits paid . . . . . . . . . . . . . . . . . . . . . . . . . (5,779) (1,699) (376) (50) (5,719) (1,683) (422) (53)Foreign currency translation adjustments . . . — (1,232) — — — (692) — —Settlements and other . . . . . . . . . . . . . . . . . . (53) (49) 22 2 (435) (54) 29 2
Ending fair value of plan assets . . . . . . . . . . 65,823 14,669 — — 64,166 14,986 — —
Ending funded status . . . . . . . . . . . . . . . . . . . $ (10,901) $ (13,228) $ (5,289) $ (1,336) $ (7,314) $ (12,542) $ (5,110) $ (1,238)
Amounts recorded in the consolidatedbalance sheets
Non-current assets . . . . . . . . . . . . . . . . . . . . . $ — $ 111 $ — $ — $ — $ 137 $ — $ —Current liabilities . . . . . . . . . . . . . . . . . . . . . (69) (383) (338) (58) (131) (379) (368) (83)Non-current liabilities . . . . . . . . . . . . . . . . . . (10,832) (12,956) (4,951) (1,278) (7,183) (12,300) (4,742) (1,155)
Net amount recorded . . . . . . . . . . . . . . . . . . . $ (10,901) $ (13,228) $ (5,289) $ (1,336) $ (7,314) $ (12,542) $ (5,110) $ (1,238)
Amounts recorded in Accumulated othercomprehensive loss
Net actuarial gain (loss) . . . . . . . . . . . . . . . . $ 452 $ (5,019) $ (859) $ (83) $ 4,747 $ (3,379) $ (542) $ 47Net prior service (cost) credit . . . . . . . . . . . . 35 (57) 16 72 38 (87) 19 91
Total recorded in Accumulated othercomprehensive loss . . . . . . . . . . . . . . . . . . $ 487 $ (5,076) $ (843) $ (11) $ 4,785 $ (3,466) $ (523) $ 138
102

GENERAL MOTORS COMPANY AND SUBSIDIARIES
NOTES TO CONSOLIDATED FINANCIAL STATEMENTS — (Continued)
The following table summarizes the total accumulated benefit obligations (ABO), the fair value of plan assets for defined benefitpension plans with ABO in excess of plan assets, and the projected benefit obligation (PBO) and fair value of plan assets for definedbenefit pension plans with PBO in excess of plan assets (dollars in millions):
December 31, 2014 December 31, 2013
U.S. Plans Non-U.S. Plans U.S. Plans Non-U.S. Plans
ABO . . . . . . . . . . . . . . . . . . . . . . . . . . . . . . . . . . . . . . . . . . . . . . . . . . . . . . . . . . $ 76,702 $ 27,425 $ 71,461 $ 27,069Plans with ABO in excess of plan assetsABO . . . . . . . . . . . . . . . . . . . . . . . . . . . . . . . . . . . . . . . . . . . . . . . . . . . . . . . . . . $ 76,702 $ 26,510 $ 71,461 $ 25,897Fair value of plan assets . . . . . . . . . . . . . . . . . . . . . . . . . . . . . . . . . . . . . . . . . . $ 65,823 $ 13,638 $ 64,166 $ 13,663Plans with PBO in excess of plan assetsPBO . . . . . . . . . . . . . . . . . . . . . . . . . . . . . . . . . . . . . . . . . . . . . . . . . . . . . . . . . . $ 76,724 $ 26,935 $ 71,480 $ 26,788Fair value of plan assets . . . . . . . . . . . . . . . . . . . . . . . . . . . . . . . . . . . . . . . . . . $ 65,823 $ 13,643 $ 64,166 $ 14,109
The following table summarizes the components of net periodic pension and OPEB expense along with the assumptions used todetermine benefit obligations (dollars in millions):
Year Ended December 31, 2014 Year Ended December 31, 2013 Year Ended December 31, 2012
Pension Benefits Other Benefits Pension Benefits Other Benefits Pension Benefits Other Benefits
U.S. PlansNon-U.S.
Plans U.S. PlansNon-U.S.
Plans U.S. PlansNon-U.S.
Plans U.S. PlansNon-U.S.
Plans U.S. PlansNon-U.S.
Plans U.S. PlansNon-U.S.
Plans
Components of expenseService cost . . . . . . . . . . . . . . . . $ 380 $ 389 $ 13 $ 10 $ 395 $ 425 $ 24 $ 13 $ 590 $ 411 $ 23 $ 16Interest cost . . . . . . . . . . . . . . . . 3,060 1,031 218 55 2,837 1,010 217 57 4,055 1,110 234 63Expected return on plan
assets . . . . . . . . . . . . . . . . . . . (3,914) (873) — — (3,562) (823) — — (5,029) (870) — —Amortization of prior service
cost (credit) . . . . . . . . . . . . . . (4) 17 (2) (14) (4) 19 (116) (14) (1) 1 (116) (12)Recognized net actuarial
loss . . . . . . . . . . . . . . . . . . . . . (91) 154 14 (6) 6 208 85 6 2 35 52 6Curtailments, settlements and
other . . . . . . . . . . . . . . . . . . . . (1) 3 — — (77) (6) (62) — 2,580 71 — 11
Net periodic expense(income) . . . . . . . . . . . . . . . . $ (570) $ 721 $ 243 $ 45 $ (405)$ 833 $ 148 $ 62 $ 2,197 $ 758 $ 193 $ 84
Weighted-averageassumptions used todetermine benefitobligations
Discount rate . . . . . . . . . . . . . . . 3.73% 3.14% 3.80% 3.99% 4.46% 4.10% 4.52% 4.71% 3.59% 3.70% 3.68% 3.97%Rate of compensation
increase (a) . . . . . . . . . . . . . . N/A 2.85% N/A 4.21% N/A 2.90% N/A 4.21% N/A 2.77% 4.50% 4.21%Weighted-average
assumptions used todetermine net expense
Discount rate . . . . . . . . . . . . . . . 4.46% 4.10% 4.52% 4.71% 3.59% 3.69% 3.69% 3.97% 4.06% 4.45% 4.24% 4.31%Expected rate of return on plan
assets . . . . . . . . . . . . . . . . . . . 6.53% 6.28% N/A N/A 5.77% 5.70% N/A N/A 6.18% 6.20% N/A N/ARate of compensation
increase (a) . . . . . . . . . . . . . . N/A 2.90% N/A 4.21% N/A 2.77% 4.50% 4.21% 4.50% 3.15% 4.50% 4.21%
(a) As a result of ceasing the accrual of additional benefits for salaried plan participants, the rate of compensation increase does not have a significant effect on our U.S. pension and OPEBplans.
U.S. pension plan service cost includes administrative expenses of $133 million, $97 million and $138 million in the years endedDecember 31, 2014, 2013 and 2012. Weighted-average assumptions used to determine net expense are determined at the beginning ofthe period and updated for remeasurements. Non-U.S. pension plan administrative expenses included in service cost wereinsignificant in the years ended December 31, 2014, 2013 and 2012.
103

GENERAL MOTORS COMPANY AND SUBSIDIARIES
NOTES TO CONSOLIDATED FINANCIAL STATEMENTS — (Continued)
Estimated amounts to be amortized from Accumulated other comprehensive loss into net periodic benefit cost in the year endingDecember 31, 2015 based on December 31, 2014 plan measurements are $295 million, consisting primarily of amortization of the netactuarial loss in the non-U.S. pension plans.
Assumptions
Investment Strategies and Long-Term Rate of Return
Detailed periodic studies conducted by outside actuaries and an internal asset management group are used to determine the long-term strategic mix among asset classes, risk mitigation strategies and the expected long-term return on asset assumptions for the U.S.pension plans. The U.S. study includes a review of alternative asset allocation and risk mitigation strategies, anticipated future long-term performance and risk of the individual asset classes that comprise the plans’ asset mix. Similar studies are performed for thesignificant non-U.S. pension plans with the assistance of outside actuaries and asset managers. While the studies incorporate datafrom recent plan performance and historical returns, the expected long-term return on plan asset assumptions are determined based onlong-term prospective rates of return.
The strategic asset mix and risk mitigation strategies for the plans are tailored specifically for each plan. Individual plans havedistinct liabilities, liquidity needs and regulatory requirements. Consequently there are different investment policies set by individualplan fiduciaries. Although investment policies and risk mitigation strategies may differ among plans, each investment strategy isconsidered to be appropriate in the context of the specific factors affecting each plan.
In setting new strategic asset mixes, consideration is given to the likelihood that the selected mixes will effectively fund the projectedpension plan liabilities, while aligning with the risk tolerance of the plans’ fiduciaries. The strategic asset mixes for U.S. defined benefitpension plans are increasingly designed to satisfy the competing objectives of improving funded positions (market value of assets equalto or greater than the present value of the liabilities) and mitigating the possibility of a deterioration in funded status.
Derivatives may be used to provide cost effective solutions for rebalancing investment portfolios, increasing or decreasing exposureto various asset classes and for mitigating risks, primarily interest rate and currency risks. Equity and fixed income managers arepermitted to utilize derivatives as efficient substitutes for traditional physical securities. Interest rate derivatives may be used to adjustportfolio duration to align with a plan’s targeted investment policy. Alternative investment managers are permitted to employleverage, including through the use of derivatives, which may alter economic exposure.
In December 2014 an investment policy study was completed for the U.S. pension plans. The study resulted in new target assetallocations being approved for the U.S. pension plans with resulting changes to the expected long-term rate of return on assets. Theweighted-average long-term rate of return on assets decreased from 6.5% at December 31, 2013 to 6.4% at December 31, 2014. Theexpected long-term rate of return on plan assets used in determining pension expense for non-U.S. plans is determined in a similarmanner to the U.S. plans.
Target Allocation Percentages
The following table summarizes the target allocations by asset category for U.S. and non-U.S. defined benefit pension plans:
December 31, 2014 December 31, 2013
U.S. Plans Non-U.S. Plans U.S. Plans Non-U.S. Plans
Equity . . . . . . . . . . . . . . . . . . . . . . . . . . . . . . . . . . . . . . . . . . . . . . . . . . . . . . . . . . . 16% 27% 19% 28%Debt . . . . . . . . . . . . . . . . . . . . . . . . . . . . . . . . . . . . . . . . . . . . . . . . . . . . . . . . . . . . . 60% 47% 58% 49%Other (a) . . . . . . . . . . . . . . . . . . . . . . . . . . . . . . . . . . . . . . . . . . . . . . . . . . . . . . . . . . 24% 26% 23% 23%
Total . . . . . . . . . . . . . . . . . . . . . . . . . . . . . . . . . . . . . . . . . . . . . . . . . . . . . . . . . . . . . 100% 100% 100% 100%
104

GENERAL MOTORS COMPANY AND SUBSIDIARIES
NOTES TO CONSOLIDATED FINANCIAL STATEMENTS — (Continued)
(a) Primarily includes private equity, real estate and absolute return strategies which mainly consist of hedge funds.
Assets and Fair Value Measurements
The following tables summarize the fair value of U.S. defined benefit pension plan assets by asset class (dollars in millions):
December 31, 2014 December 31, 2013
Level 1 Level 2 Level 3 Total Level 1 Level 2 Level 3 Total
AssetsCash equivalents and other short-term investments . . $ — $ 42 $ — $ 42 $ — $ 411 $ — $ 411Common and preferred stocks . . . . . . . . . . . . . . . . . . . 10,033 30 3 10,066 10,234 70 6 10,310Government and agency debt securities (a) . . . . . . . . — 16,143 — 16,143 — 14,971 — 14,971Corporate and other debt securities (b) . . . . . . . . . . . . — 22,725 83 22,808 — 20,647 130 20,777Investment funds (c) . . . . . . . . . . . . . . . . . . . . . . . . . . 70 910 5,221 6,201 99 1,018 5,174 6,291Private equity and debt investments (d) . . . . . . . . . . . — — 5,909 5,909 — — 6,335 6,335Real estate investments (e) . . . . . . . . . . . . . . . . . . . . . 560 2 3,608 4,170 390 4 4,127 4,521Other investments . . . . . . . . . . . . . . . . . . . . . . . . . . . . — — 65 65 — — 62 62Derivative assets . . . . . . . . . . . . . . . . . . . . . . . . . . . . . 55 313 1 369 17 157 — 174
Total assets . . . . . . . . . . . . . . . . . . . . . . . . . . . . . . . . . 10,718 40,165 14,890 65,773 10,740 37,278 15,834 63,852
LiabilitiesDerivative liabilities . . . . . . . . . . . . . . . . . . . . . . . . . . (23) (496) — (519) (22) (311) (6) (339)
Net plan assets subject to leveling . . . . . . . . . . . . . . . $10,695 $39,669 $14,890 65,254 $10,718 $36,967 $15,828 63,513
Other plan assets and liabilities (f) . . . . . . . . . . . . . . . 569 653
Net Plan Assets . . . . . . . . . . . . . . . . . . . . . . . . . . . . . $65,823 $64,166
The following tables summarize the fair value of non-U.S. defined benefit pension plan assets by asset class (dollars in millions):
December 31, 2014 December 31, 2013
Level 1 Level 2 Level 3 Total Level 1 Level 2 Level 3 Total
AssetsCash equivalents and other short-term investments . . . . . $ — $ 207 $ — $ 207 $ — $ 156 $ — $ 156Common and preferred stocks . . . . . . . . . . . . . . . . . . . . . 1,959 3 — 1,962 1,816 6 — 1,822Government and agency debt securities (a) . . . . . . . . . . . — 3,614 — 3,614 — 3,418 — 3,418Corporate and other debt securities (b) . . . . . . . . . . . . . . . — 1,986 — 1,986 — 2,475 14 2,489Investment funds (c) . . . . . . . . . . . . . . . . . . . . . . . . . . . . . 101 3,409 889 4,399 128 3,529 745 4,402Private equity and debt investments (d) . . . . . . . . . . . . . . — — 509 509 — — 430 430Real estate investments (e) . . . . . . . . . . . . . . . . . . . . . . . . 20 4 1,263 1,287 13 12 1,405 1,430Other investments . . . . . . . . . . . . . . . . . . . . . . . . . . . . . . . — — 722 722 — — 618 618Derivative assets . . . . . . . . . . . . . . . . . . . . . . . . . . . . . . . . 17 24 — 41 3 44 — 47
Total assets . . . . . . . . . . . . . . . . . . . . . . . . . . . . . . . . . . . . 2,097 9,247 3,383 14,727 1,960 9,640 3,212 14,812
LiabilitiesDerivative liabilities . . . . . . . . . . . . . . . . . . . . . . . . . . . . . — (44) — (44) (12) (56) — (68)
Net plan assets subject to leveling . . . . . . . . . . . . . . . . . . $2,097 $9,203 $3,383 14,683 $1,948 $9,584 $3,212 14,744
Other plan assets and liabilities (f) . . . . . . . . . . . . . . . . . . (14) 242
Net Plan Assets . . . . . . . . . . . . . . . . . . . . . . . . . . . . . . . . $14,669 $14,986
105

GENERAL MOTORS COMPANY AND SUBSIDIARIES
NOTES TO CONSOLIDATED FINANCIAL STATEMENTS — (Continued)
(a) Includes U.S. and sovereign government and agency issues.(b) Includes mortgage and asset-backed securities.(c) U.S. and non-U.S. Level 3 assets consist primarily of funds of hedge funds. Non-U.S. Level 2 assets consist primarily of equity and fixed
income funds.(d) Includes private equity investment funds.(e) Includes investment funds and public real estate investment trusts.(f) Cash held by the plans, net of amounts receivable/payable for unsettled security transactions and payables for investment manager fees, custody
fees and other expenses.
The following tables summarize the activity for U.S. defined benefit pension plan net assets measured at fair value using Level 3inputs (dollars in millions):
Balance atJanuary 1,
2014
Net Realized/Unrealized
Gains (Losses)
Purchases,Sales and
Settlements,Net
TransfersInto/Out
of Level 3
Balance atDecember 31,
2014
Change inUnrealized
Gains/(Losses)Attributable toAssets Held atDecember 31,
2014
Common and preferred stocks . . . . . . . . . . . . . . . . . . $ 6 $ 2 $ (5) $ — $ 3 $ —Corporate and other debt securities . . . . . . . . . . . . . . . 130 — (41) (6) 83 (4)Investment funds . . . . . . . . . . . . . . . . . . . . . . . . . . . . . 5,174 231 (184) — 5,221 208Private equity and debt investments . . . . . . . . . . . . . . 6,335 651 (1,077) — 5,909 27Real estate investments . . . . . . . . . . . . . . . . . . . . . . . . 4,127 251 (770) — 3,608 68Other investments . . . . . . . . . . . . . . . . . . . . . . . . . . . . 62 5 (2) — 65 5Derivatives, net . . . . . . . . . . . . . . . . . . . . . . . . . . . . . . (6) (4) 11 — 1 —
Total net assets . . . . . . . . . . . . . . . . . . . . . . . . . . . . . . $ 15,828 $ 1,136 $ (2,068) $ (6) $ 14,890 $ 304
Balance atJanuary 1,
2013
Net Realized/Unrealized
Gains (Losses)
Purchases,Sales and
Settlements,Net
TransfersInto/
Out ofLevel 3
Balance atDecember 31,
2013
Change inUnrealized
Gains/(Losses)Attributable toAssets Held atDecember 31,
2013
Common and preferred stocks . . . . . . . . . . . . . . . . . . $ 19 $ 3 $ (16) $ — $ 6 $ 1Corporate and other debt securities . . . . . . . . . . . . . . . 182 6 (58) — 130 (3)Investment funds . . . . . . . . . . . . . . . . . . . . . . . . . . . . . 4,959 552 (337) — 5,174 537Private equity and debt investments . . . . . . . . . . . . . . 6,400 926 (991) — 6,335 436Real estate investments . . . . . . . . . . . . . . . . . . . . . . . . 4,335 458 (666) — 4,127 190Other investments . . . . . . . . . . . . . . . . . . . . . . . . . . . . 63 (2) 1 — 62 (2)Derivatives, net . . . . . . . . . . . . . . . . . . . . . . . . . . . . . . (8) 2 — — (6) 1
Total net assets . . . . . . . . . . . . . . . . . . . . . . . . . . . . . . $ 15,950 $ 1,945 $ (2,067) $ — $ 15,828 $ 1,160
106

GENERAL MOTORS COMPANY AND SUBSIDIARIES
NOTES TO CONSOLIDATED FINANCIAL STATEMENTS — (Continued)
The following tables summarize the activity for non-U.S. defined benefit pension plan assets measured at fair value using Level 3inputs (dollars in millions):
Balance atJanuary 1,
2014
Net Realized/Unrealized
Gains (Losses)
Purchases,Sales and
Settlements,Net
TransfersInto/Outof Level 3
Effect ofForeign
Currency
Balance atDecember 31,
2014
Change inUnrealized
Gains/(Losses)Attributable toAssets Held atDecember 31,
2014
Corporate and other debt securities . . . . . . . $ 14 $ — $ (13) $ — $ (1) $ — $ —Investment funds . . . . . . . . . . . . . . . . . . . . . 745 103 111 — (70) 889 103Private equity and debt investments . . . . . . 430 100 20 — (41) 509 75Real estate investments . . . . . . . . . . . . . . . . 1,405 48 (84) — (106) 1,263 44Other investments . . . . . . . . . . . . . . . . . . . . 618 92 72 — (60) 722 76
Total assets . . . . . . . . . . . . . . . . . . . . . . . . . . $ 3,212 $ 343 $ 106 $ — $ (278) $ 3,383 $ 298
Balance atJanuary 1,
2013
Net Realized/Unrealized
Gains (Losses)
Purchases,Sales and
Settlements,Net
TransfersInto/Out of
Level 3
Effect ofForeign
Currency
Balance atDecember 31,
2013
Change inUnrealized
Gains/(Losses)Attributable toAssets Held atDecember 31,
2013
Corporate and other debt securities . . . . . . $ 5 $ 1 $ 7 $ 1 $ — $ 14 $ 1Investment funds . . . . . . . . . . . . . . . . . . . . 641 110 27 — (33) 745 112Private equity and debt investments . . . . . . 381 73 3 — (27) 430 53Real estate investments . . . . . . . . . . . . . . . 1,422 103 (57) — (63) 1,405 122Other investments . . . . . . . . . . . . . . . . . . . . 665 (10) (43) — 6 618 4
Total assets . . . . . . . . . . . . . . . . . . . . . . . . . $ 3,114 $ 277 $ (63) $ 1 $ (117) $ 3,212 $ 292
Investment Fund Strategies
Investment funds consist primarily of equity funds, fixed income funds and funds of hedge funds. Equity funds invest in U.S.common and preferred stocks as well as similar equity securities issued by companies incorporated, listed or domiciled in developedand/or emerging markets countries. Fixed income funds include investments in high quality funds and to a lesser extent, high yieldfunds. High quality fixed income funds invest in government securities, investment-grade corporate bonds and mortgage and asset-backed securities. High yield fixed income funds invest in high yield fixed income securities issued by corporations which are ratedbelow investment grade. Funds of hedge funds represent funds that invest in a portfolio of hedge funds. Fund managers typically seekto achieve their objectives by allocating capital across a broad array of funds and/or investment managers. Other investment fundsalso included in this category primarily represent multi-strategy funds that invest in broadly diversified portfolios of equity, fixedincome and derivative instruments.
Private equity and debt investments principally consist of investments in private equity and debt funds. These investments provideexposure to and benefit from long-term equity investments in private companies, including leveraged buy-outs, venture capital anddistressed debt strategies.
Real estate investments include funds that invest in entities which are principally engaged in the ownership, acquisition,development, financing, sale and/or management of income-producing real estate properties, both commercial and residential. Thesefunds typically seek long-term growth of capital and current income that is above average relative to public equity funds.
107

GENERAL MOTORS COMPANY AND SUBSIDIARIES
NOTES TO CONSOLIDATED FINANCIAL STATEMENTS — (Continued)
Significant Concentrations of Risk
The assets of the pension plans include certain private investment funds, private equity and debt securities, real estate investmentsand derivative instruments. Investment managers may be unable to quickly sell or redeem some or all of these investments at anamount close or equal to fair value in order to meet a plan’s liquidity requirements or to respond to specific events such asdeterioration in the creditworthiness of any particular issuer or counterparty.
Illiquid investments held by the plans are generally long-term investments that complement the long-term nature of pensionobligations and are not used to fund benefit payments when currently due. Plan management monitors liquidity risk on an ongoingbasis and has procedures in place that are designed to maintain flexibility in addressing plan-specific, broader industry and marketliquidity events.
The pension plans may invest in financial instruments denominated in foreign currencies and may be exposed to risks that theforeign currency exchange rates might change in a manner that has an adverse effect on the value of the foreign currency denominatedassets or liabilities. Forward currency contracts may be used to manage and mitigate foreign currency risk.
The pension plans may invest in fixed income securities for which any change in the relevant interest rates for particular securitiesmight result in an investment manager being unable to secure similar returns upon the maturity or the sale of securities. In addition,changes to prevailing interest rates or changes in expectations of future interest rates might result in an increase or decrease in the fairvalue of the securities held. Interest rate swaps and other financial derivative instruments may be used to manage interest rate risk.
Counterparty credit risk is the risk that a counterparty to a financial instrument will default on its commitment. Counterparty risk isprimarily related to over-the-counter derivative instruments used to manage risk exposures related to interest rates on long-term debtsecurities and foreign currency exchange rate fluctuations. The risk of default can be influenced by various factors including macro-economic conditions, market liquidity, fiscal and monetary policies and counterparty-specific characteristics and activities. Certainagreements with counterparties employ set-off, collateral support arrangements and other risk mitigating procedures designed toreduce the net exposure to credit risk in the event of counterparty default. Credit policies and processes are in place to manageconcentrations of counterparty risk by seeking to undertake transactions with large well-capitalized counterparties and by monitoringthe creditworthiness of these counterparties. The majority of derivatives held by the plans at December 31, 2014 were fullycollateralized and therefore, the related counterparty credit risk was significantly reduced.
Pension Funding Requirements
We are subject to a variety of U.S. federal rules and regulations, including the Employee Retirement Income Security Act of 1974,as amended and the Pension Protection Act of 2006, which govern the manner in which we fund and administer our U.S. pensionplans. The Moving Ahead for Progress in the 21st Century Act which expired on September 30, 2014 allowed plan sponsors fundingrelief for pension plans through the application of higher funding interest rates. The 2014 Highway and Transportation Funding Actextended the application of higher funding interest rates. As a result, utilizing current assumptions we expect no significant mandatorycontributions to our U.S. qualified pension plans for the next five years. We have no funding requirements for our U.S. qualified plansin 2015.
We also maintain pension plans for employees in a number of countries outside the U.S. which are subject to local laws andregulations. Except for Canada and the United Kingdom, most non-U.S. pension laws and regulations do not have specific fundingrequirements.
108

GENERAL MOTORS COMPANY AND SUBSIDIARIES
NOTES TO CONSOLIDATED FINANCIAL STATEMENTS — (Continued)
Benefit Payments
The following table summarizes net benefit payments expected to be paid in the future, which include assumptions related toestimated future employee service (dollars in millions):
Pension Benefits (a) Other Benefits
U.S. Plans Non-U.S. Plans U.S. Plans Non-U.S. Plans
2015 . . . . . . . . . . . . . . . . . . . . . . . . . . . . . . . . . . . . . . . . . . . . . . . . . . . . . . . . . . . $ 5,616 $ 1,530 $ 344 $ 592016 . . . . . . . . . . . . . . . . . . . . . . . . . . . . . . . . . . . . . . . . . . . . . . . . . . . . . . . . . . . $ 5,572 $ 1,570 $ 331 $ 632017 . . . . . . . . . . . . . . . . . . . . . . . . . . . . . . . . . . . . . . . . . . . . . . . . . . . . . . . . . . . $ 5,380 $ 1,558 $ 322 $ 612018 . . . . . . . . . . . . . . . . . . . . . . . . . . . . . . . . . . . . . . . . . . . . . . . . . . . . . . . . . . . $ 5,239 $ 1,458 $ 313 $ 632019 . . . . . . . . . . . . . . . . . . . . . . . . . . . . . . . . . . . . . . . . . . . . . . . . . . . . . . . . . . . $ 5,128 $ 1,448 $ 307 $ 652020 - 2024 . . . . . . . . . . . . . . . . . . . . . . . . . . . . . . . . . . . . . . . . . . . . . . . . . . . . . . $ 23,754 $ 7,136 $ 1,470 $ 348
(a) Benefits for most U.S. pension plans and certain non-U.S. pension plans are paid out of plan assets rather than our Cash and cash equivalents.
Note 16. Derivative Financial Instruments
Automotive
At December 31, 2014 and 2013 our derivative instruments consisted primarily of options and forward contracts primarily relatedto foreign currency, none of which were designated as hedging relationships. We had derivative instruments in asset positions withnotional amounts of $8.8 billion and $9.3 billion and liability positions with notional amounts of $953 million and $427 million atDecember 31, 2014 and 2013. The fair value of these derivative instruments was insignificant.
Automotive Financing — GM Financial
GM Financial had interest rate swaps and caps and foreign currency swaps in asset positions with notional amounts of $5.4 billionand $5.5 billion and liability positions with notional amounts of $8.5 billion and $7.6 billion at December 31, 2014 and 2013. The fairvalue of these derivative financial instruments was insignificant.
Note 17. Commitments and Contingencies
The following tables summarize information related to commitments and contingencies (dollars in millions):
December 31, 2014 December 31, 2013
LiabilityRecorded
MaximumLiability (a)
LiabilityRecorded
MaximumLiability (a)
GuaranteesThird-party commercial loans and other obligations (b) . . . . . . . . . . . . . . . . . . . . . . . . . . $ 37 $ 197 $ 51 $ 15,616Other product-related claims . . . . . . . . . . . . . . . . . . . . . . . . . . . . . . . . . . . . . . . . . . . . . . . $ 51 $ 2,458 $ 54 $ 1,317
(a) Calculated as future undiscounted payments.(b) Includes liabilities recorded of $10 million and maximum liabilities of $15.3 billion related to Ally Financial repurchase obligations at
December 31, 2013.
109

GENERAL MOTORS COMPANY AND SUBSIDIARIES
NOTES TO CONSOLIDATED FINANCIAL STATEMENTS — (Continued)
Liability Recorded
December 31, 2014 December 31, 2013
Other litigation-related liability and tax administrative matters . . . . . . . . . . . . . . . . . . . . . . . . . . . . $ 1,000 $ 1,227Product liability . . . . . . . . . . . . . . . . . . . . . . . . . . . . . . . . . . . . . . . . . . . . . . . . . . . . . . . . . . . . . . . . . $ 732 $ 690Ignition switch recall compensation program . . . . . . . . . . . . . . . . . . . . . . . . . . . . . . . . . . . . . . . . . . $ 315Credit card programs (a)
Redemption liability (b) . . . . . . . . . . . . . . . . . . . . . . . . . . . . . . . . . . . . . . . . . . . . . . . . . . . . . . . . $ 87 $ 183Deferred revenue (c) . . . . . . . . . . . . . . . . . . . . . . . . . . . . . . . . . . . . . . . . . . . . . . . . . . . . . . . . . . . $ 263 $ 295
Environmental liability . . . . . . . . . . . . . . . . . . . . . . . . . . . . . . . . . . . . . . . . . . . . . . . . . . . . . . . . . . . $ 133 $ 154Asset retirement obligations . . . . . . . . . . . . . . . . . . . . . . . . . . . . . . . . . . . . . . . . . . . . . . . . . . . . . . . $ 146 $ 159
(a) Credit card programs offer rebates that can be applied primarily against the purchase or lease of our vehicles. At December 31, 2014 and 2013qualified cardholders had rebates available, net of deferred program revenue, of approximately $2.3 billion and $2.6 billion.
(b) Recorded in Accrued liabilities.(c) Recorded in Other liabilities.
Guarantees
We provide payment guarantees on commercial loans outstanding with third parties such as dealers or rental car companies. Wedetermined the fair value ascribed to the guarantees at inception and subsequent to inception to be insignificant based on the creditworthiness of the third parties. In March 2014 a new agreement was signed with Ally Financial that removed the repurchaseobligation for vehicles invoiced after December 31, 2013. The repurchase obligation for vehicles invoiced prior to December 31, 2013was maintained until December 31, 2014 at which time repurchase obligations expired for all vehicles.
Agreements with third parties that guarantee the fulfillment of certain suppliers’ commitments and other obligations expire in 2015through 2019 or upon the occurrence of specific events or are ongoing.
In some instances certain assets of the party whose debt or performance we have guaranteed may offset, to some degree, the cost ofthe guarantee. The offset of certain of our payables to guaranteed parties may also offset certain guarantees, if triggered. If vehiclesare required to be repurchased under vehicle repurchase obligations, the total exposure would be reduced to the extent vehicles areable to be resold to another dealer.
In connection with certain divestitures of assets or operating businesses, we have entered into agreements indemnifying certainbuyers and other parties with respect to environmental conditions and other closure costs pertaining to real property we owned. Weperiodically enter into agreements that incorporate indemnification provisions in the normal course of business. It is not possible toestimate our maximum exposure under these indemnifications or guarantees due to the conditional nature of these obligations.Insignificant amounts have been recorded for such obligations as the majority of them are not probable or estimable at this time andthe fair value of the guarantees at issuance was insignificant. In addition, we indemnify dealers for certain product liability relatedclaims as subsequently discussed.
With respect to other product-related claims involving products manufactured by certain joint ventures, we believe that costsincurred are adequately covered by recorded accruals. These guarantees terminate in years ranging from 2020 to 2029.
Other Litigation-Related Liability and Tax Administrative Matters
Various legal actions, governmental investigations, claims and proceedings are pending against us including matters arising out ofalleged product defects; employment-related matters; governmental regulations relating to safety, emissions and fuel economy;product warranties; financial services; dealer, supplier and other contractual relationships; tax-related matters not recorded pursuant toASC 740, “Income Taxes” (indirect tax-related matters) and environmental matters.
110

GENERAL MOTORS COMPANY AND SUBSIDIARIES
NOTES TO CONSOLIDATED FINANCIAL STATEMENTS — (Continued)
With regard to the litigation matters discussed in the previous paragraph, reserves have been established for matters in which webelieve that losses are probable and can be reasonably estimated, the majority of which are associated with indirect tax-related mattersas well as non-U.S. labor-related matters. Indirect tax-related matters are being litigated globally pertaining to value added taxes,customs, duties, sales, property taxes and other non-income tax related tax exposures. The various non-U.S. labor-related mattersinclude claims from current and former employees related to alleged unpaid wage, benefit, severance and other compensation matters.Certain South American administrative proceedings are indirect tax-related and may require that we deposit funds in escrow. Escrowdeposits may range from $500 million to $700 million. Some of the matters may involve compensatory, punitive or other trebledamage claims, environmental remediation programs or sanctions that, if granted, could require us to pay damages or make otherexpenditures in amounts that could not be reasonably estimated at December 31, 2014. We believe that appropriate accruals have beenestablished for such matters based on information currently available. Reserves for litigation losses are recorded in Accrued liabilitiesand Other liabilities. Litigation is inherently unpredictable however; and unfavorable resolutions could occur. Accordingly it ispossible that an adverse outcome from such proceedings could exceed the amounts accrued in an amount that could be material to ourfinancial condition, results of operations and cash flows in any particular reporting period.
Proceedings Related to Ignition Switch and Other Recalls
In the three months ended March 31, 2014 we announced recalls to repair ignition switches that under certain circumstances couldunintentionally move from the “run” position to the “accessory” or “off” position with a corresponding loss of power, which in turn mayprevent airbags from deploying in the event of a crash. Those recalls included Chevrolet Cobalt and HHR, Pontiac G5, Pursuit andSolstice and Saturn ION and Sky vehicles. Since those recalls, we have announced a number of additional recalls in the year endedDecember 31, 2014 relating to safety, customer satisfaction and other matters.
Through January 30, 2015 we are aware of 108 putative class actions that are pending against GM in various U.S. District Courts and statecourts alleging that consumers who purchased or leased GM vehicles have been economically harmed by one or more of the recallsannounced this year and/or the underlying vehicle conditions associated with those recalls (economic-loss cases). Additionally, throughJanuary 30, 2015, 20 putative class actions have been filed in various Provincial Courts in Canada seeking similar relief as the U.S.-basedcases. In the aggregate, these economic-loss cases seek recovery for purported compensatory damages, including alleged diminution in valueof the vehicles, punitive damages, and injunctive and other relief. In addition through January 30, 2015, we are aware of 104 actions pendingagainst GM alleging injury or death as a result of defects that may be the subject of recalls announced in the year ended December 31, 2014,including faulty ignition switches and/or the failure of air bags to properly deploy due to faulty ignition switches (personal injury cases). Inthe aggregate these personal injury cases seek recovery for purported compensatory damages, punitive damages and other relief.
Since June 2014 the United States Judicial Panel on Multidistrict Litigation has issued orders from time to time directing that certainpending economic-loss and personal injury federal lawsuits involving alleged faulty ignition switches or other defects that may be relatedto the recalls announced in 2014 be transferred to, and consolidated in, a single federal court, the Southern District of New York (themultidistrict litigation). Through January 30, 2015, 156 cases have been transferred and consolidated as part of the multidistrict litigation.We have requested that various other recently filed federal lawsuits also be transferred and consolidated in the multidistrict litigation. Thecourt in the multidistrict litigation has appointed lead counsel to prosecute the claims on behalf of all plaintiffs in the consolidated cases.On October 14, 2014 lead counsel filed two amended consolidated complaints. Because the majority of plaintiffs in these actions aresuing over vehicles manufactured by pre-bankruptcy General Motors Corporation, we are seeking to enforce the terms of the federalBankruptcy Court’s July 2009 Sale Order and Injunction to preclude liability for any economic loss damages based on vehicles and partsmanufactured prior to July 2009. These cases are in their early stages. In addition to the cases pending in the multidistrict litigation, othereconomic-loss and personal injury cases related to ignition-switch and other alleged defects that may be the subject of recalls in 2014 arepending in various other state and federal courts throughout the country. The cases pending in other state courts include a November 19,2014 lawsuit filed by the Attorney General for Arizona against GM in Arizona state court alleging claims similar to those alleged in theeconomic-loss actions discussed above and seeking an injunction, civil penalties and other relief.
Through January 30, 2015 we are aware of two actions that have been filed against GM alleging that GM’s purported concealment ofthe ignition switch and other defects that have been the subject of recalls in 2014 has diminished the value of other GM vehicles and
111

GENERAL MOTORS COMPANY AND SUBSIDIARIES
NOTES TO CONSOLIDATED FINANCIAL STATEMENTS — (Continued)
seeking economic damages under California consumer protection statutes. One of these actions is a putative class action that has beenconsolidated with the ignition switch putative class actions and transferred to the Southern District of New York. The other action wasbrought by the Orange County, California district attorney and is pending in California state court. In the aggregate, these actions seekrecovery under California consumer protection statutes for economic damages as well as civil penalties, punitive damages, attorneys’ feesand costs.
On March 21, 2014 a putative shareholder class action was filed in the United States District Court for the Eastern District ofMichigan against GM and various current and former officers or employees of GM (Pio v. General Motors Company et al.) on behalfof purchasers of GM securities from November 17, 2010 through March 10, 2014. The complaint alleges that defendants madematerial misstatements and omissions relating to problems with the ignition switch and other matters in SEC filings. Plaintiffs seekunspecified monetary damages, interest and attorneys’ fees and costs. The court appointed the New York State Teachers’ RetirementSystem as the lead plaintiff. On January 15, 2015 New York State Teachers’ Retirement System filed a Consolidated Class ActionComplaint against GM and several current and former officers and employees. The Consolidated Class Action Complaint supersedesthe complaint filed March 21, 2014 in this same case.
On March 28, 2014 a shareholder derivative action was filed in the United States District Court for the Eastern District of Michiganagainst certain current and former GM directors (Hockstein v. Barra, et al.). The complaint alleges breach of fiduciary duty, waste ofcorporate assets, and unjust enrichment by GM’s directors in connection with monitoring, remediation and disclosure of the issuesunderlying the ignition switch recall. Between April 9, 2014 and July 22, 2014, similar shareholder derivative actions were filed in theEastern District of Michigan (Police Retirement System of St. Louis v. Barra, et al.), the Circuit Court for Wayne County, Michigan(Bekkerman v. Barra, et al., Wietschiner, et al. v. Barra, et al.) and the Chancery Court for the State of Delaware (Nash v. Barra, etal., DiStefano v. Barra, et al., Newspaper and Magazine Employees Union v. Barra, et al., Boso v. Solso, et al.). All of these actionsseek damages allegedly resulting from defendants’ failure to timely identify, correct and disclose the ignition switch defect, an ordercompelling implementation of various corporate governance policies and practices and other relief purportedly for the benefit of GM.
With regard to the two above listed shareholder derivative actions pending in the United States District Court for the EasternDistrict of Michigan against certain current and former GM directors, those actions have been consolidated and we filed a motion todismiss the consolidated amended complaint on October 9, 2014. On January 11, 2015 the court issued an order suspending furtherproceedings in the actions and holding our motion to dismiss in abeyance pending disposition of the parallel action currently beinglitigated in Delaware Chancery Court (In re General Motors Deriv. Litig., C.A. No. 9627-VCG). With regard to that pending litigationin Delaware Chancery Court, the four above listed shareholder derivative actions pending in that court have been consolidated andplaintiffs filed an amended consolidated complaint on October 13, 2014. We filed a motion to dismiss the amended consolidatedcomplaint on December 5, 2014. With regard to the two above listed derivative actions filed in the Circuit Court of Wayne County,Michigan, those actions have been consolidated and stayed pending the federal derivative actions.
We are also the subject of various inquiries, investigations, subpoenas and requests for information from the U.S. Attorney’s Officefor the Southern District of New York, Congress, the SEC, Transport Canada and 49 state attorneys general in connection with the2014 recalls. We are investigating these matters and believe we are cooperating fully with all requests. Such investigations anddiscussions could in the future result in the imposition of material damages, fines or civil and criminal penalties and other remedies.
We are currently unable to estimate a range of reasonably possible loss for the lawsuits and investigations because these mattersinvolve significant uncertainties at these early stages. These uncertainties include the legal theory or the nature of the claims as well asthe complexity of the facts. Although we cannot estimate a reasonable range of loss based on currently available information, theresolution of these matters could have a material adverse effect on our financial position, results of operations or cash flows.
GMCL Dealers’ Claim
On February 12, 2010 a claim was filed in the Ontario Superior Court of Justice against General Motors of Canada Limited(GMCL) on behalf of a purported class of over 200 former GMCL dealers (the Plaintiff Dealers) which had entered into wind-down
112

GENERAL MOTORS COMPANY AND SUBSIDIARIES
NOTES TO CONSOLIDATED FINANCIAL STATEMENTS — (Continued)
agreements with GMCL. In May 2009 in the context of the global restructuring of the business and the possibility that GMCL mightbe required to initiate insolvency proceedings, GMCL offered the Plaintiff Dealers the wind-down agreements to assist with their exitfrom the GMCL dealer network and to facilitate winding down their operations in an orderly fashion by December 31, 2009 or suchother date as GMCL approved but no later than on October 31, 2010. The Plaintiff Dealers allege that the Dealer Sales and ServiceAgreements were wrongly terminated by GMCL and that GMCL failed to comply with certain disclosure obligations, breached itsstatutory duty of fair dealing and unlawfully interfered with the Plaintiff Dealers’ statutory right to associate in an attempt to coercethe Plaintiff Dealers into accepting the wind-down agreements. The Plaintiff Dealers seek damages and assert that the wind-downagreements are rescindable. The Plaintiff Dealers’ initial pleading makes reference to a claim “not exceeding” CAD $750 million,without explanation of any specific measure of damages. On March 1, 2011 the court approved certification of a class for the purposeof deciding a number of specifically defined issues including: (1) whether GMCL breached its obligation of “good faith” in offeringthe wind-down agreements; (2) whether GMCL interfered with the Plaintiff Dealers’ rights of free association; (3) whether GMCLwas obligated to provide a disclosure statement and/or disclose more specific information regarding its restructuring plans inconnection with proffering the wind-down agreements; and (4) assuming liability, whether the Plaintiff Dealers can recover damagesin the aggregate (as opposed to proving individual damages). A number of former dealers have opted out of participation in thelitigation, leaving 181 dealers in the certified class. Trial of the class issues was completed in the fourth quarter of 2014. We are nowawaiting a decision from the Ontario Superior Court. The current prospects for liability are uncertain, but because liability is notdeemed probable we have no accrual relating to this litigation. We cannot estimate the range of reasonably possible loss in the eventof liability as the case presents a variety of different legal theories, none of which GMCL believes are valid.
UAW Claim
On April 6, 2010 the UAW filed suit against us in the U.S. District Court for the Eastern District of Michigan claiming that webreached our obligation to contribute $450 million to the New VEBA. The UAW alleges that we were contractually required to makethis contribution pursuant to the UAW-Delphi-GM Memorandum of Understanding Delphi Restructuring dated June 22, 2007. Webelieve this claim is without merit. On December 10, 2013 the court granted our motion for summary judgment and dismissed theclaims asserted by the UAW, holding that the relevant agreement is unambiguous and does not require the payment sought. The UAWhas appealed. On October 9, 2014 the United States Court of Appeals for the Sixth Circuit heard oral arguments. We are now awaitinga decision from the United States Court of Appeals for the Sixth Circuit.
GM Korea Wage Litigation
Commencing on or about September 29, 2010 current and former hourly employees of GM Korea filed eight separate group actionsin the Incheon District Court in Incheon, Korea. The cases, which in aggregate involve more than 10,000 employees, allege that GMKorea failed to include bonuses and certain allowances in its calculation of Ordinary Wages due under the Presidential Decree of theKorean Labor Standards Act. On November 23, 2012 the Seoul High Court (an intermediate level appellate court) issued a decisionaffirming a decision of the Incheon District Court in a case involving five GM Korea employees which was contrary to GM Korea’sposition. GM Korea appealed to the Supreme Court of the Republic of Korea (Supreme Court) and initiated a constitutional challengeto the adverse interpretation of the relevant statute. In December 2013 the Supreme Court rendered a decision in a case involvinganother company not affiliated with us which addressed many of the issues presented in the cases pending against GM Korea andresolved many of them in a manner which we believe is favorable to GM Korea. In particular, while the Supreme Court held that fixedbonuses should be included in the calculation of Ordinary Wages, it also held that claims for retroactive application of this rule wouldbe barred under certain circumstances. On May 29, 2014 the Supreme Court rendered its decision with respect to the case involvingthe five GM Korea employees and remanded the case to the Seoul High Court consistent with its December 2013 ruling. In July 2014GM Korea and its labor union agreed to include bonuses and certain allowances in ordinary wages retroactively to March 1, 2014.Therefore our accrual related to these cases was reclassified from a contingent liability to the Pensions liability. We estimate ourreasonably possible loss, as defined by ASC 450, “Contingencies,” in excess of amounts accrued to be 562 billion South Korean Won(equivalent to $511 million) at December 31, 2014, which relates to periods before March 1, 2014. We are also party to litigation withcurrent and former salaried employees over allegations relating to Ordinary Wages regulation. At December 31, 2014 we haveidentified a reasonably possible loss in excess of the amount of our accrual of 164 billion South Korean Won (equivalent to $149
113

GENERAL MOTORS COMPANY AND SUBSIDIARIES
NOTES TO CONSOLIDATED FINANCIAL STATEMENTS — (Continued)
million). Both the scope of claims asserted and GM Korea’s assessment of any or all of the individual claim elements may change ifnew information becomes available. These cases are currently pending before various district courts in Korea and the Supreme Court.
Inventory Management Securities Class Action
On June 29, 2012 a putative securities class action was filed against us and a number of our past and current officers and directorsin the United States District Court for the Southern District of New York (George G. Scott v. General Motors Company et al).Purporting to sue on behalf of owners of common stock deriving from our 2010 initial public offering, plaintiff asserts non-fraudprospectus based liability claims under various federal securities statutes alleging that the Company has made false statements aboutits vehicle inventory controls and production decisions, particularly with respect to full-size trucks. The plaintiff’s complaint requestscompensatory damages, rescission and litigation costs, fees and disbursements. On November 21, 2012 the court appointed theTeamster’s Local 710 Pension Fund as lead plaintiff in the matter. On February 1, 2013 the plaintiff filed an amended complaint. OnSeptember 4, 2014 the district court granted our motion to dismiss, and dismissed the case with prejudice. Plaintiff filed an appeal.
GM Financial Subpoena
In July 2014 GM Financial was served with a subpoena by the U.S. Department of Justice directing GM Financial to producecertain documents relating to GM Financial’s and its subsidiaries’ and affiliates’ origination and securitization of sub-primeautomobile loans since 2007 in connection with an investigation by the U.S. Department of Justice in contemplation of a civilproceeding for potential violations of the Financial Institutions Reform, Recovery, and Enforcement Act of 1989. Among othermatters, the subpoena requests information relating to the underwriting criteria used to originate these automobile loans and therepresentations and warranties relating to those underwriting criteria that were made in connection with the securitization of theautomobile loans. GM Financial was subsequently served with additional investigative subpoenas to produce documents from stateattorneys general and other governmental offices relating to its sub-prime automotive finance business and securitization of sub-primeautomobile loans. In October 2014 GM Financial received a document request from the SEC in connection with its investigation intocertain practices in sub-prime automobile loan securitization. GM Financial is investigating these matters internally and believes thatit is cooperating with all requests. Such investigations could in the future result in the imposition of damages, fines or civil or criminalclaims and/or penalties. No assurance can be given that the ultimate outcome of the investigations or any resulting proceedings wouldnot materially and adversely affect GM Financial or any of its subsidiaries and affiliates.
Product Liability
With respect to product liability claims involving our and General Motors Corporation’s products, we believe that any judgmentagainst us for actual damages will be adequately covered by our recorded accruals and, where applicable, excess liability insurancecoverage. Although punitive damages are claimed in some of these lawsuits and such claims are inherently unpredictable, accrualsincorporate historic experience with these types of claims. In addition we indemnify dealers for certain product liability related claimsincluding products sold by General Motors Corporation’s dealers. We monitor actual claims experience and make periodicadjustments to our estimates. Liabilities have been recorded in Accrued liabilities and Other liabilities for the expected cost of allknown product liability claims plus an estimate of the expected cost for product liability claims that have already been incurred andare expected to be filed in the future for which we are self-insured. In light of recent vehicle recalls it is reasonably possible that ouraccruals for product liability claims may increase in future periods in material amounts, although we cannot estimate a reasonablerange of incremental loss based on currently available information.
Ignition Switch Recall Compensation Program
In the three months ended June 30, 2014 we announced the creation of a compensation program (the Program) to compensateaccident victims who died or suffered physical injury (or their families) as a result of a faulty ignition switch related to the 2.6 millionvehicles recalled as more fully described in Note 13. It is important to our company that we reach everyone through this Program whohas been impacted. The Program is being administered by an independent program administrator. The independent administrator has
114

GENERAL MOTORS COMPANY AND SUBSIDIARIES
NOTES TO CONSOLIDATED FINANCIAL STATEMENTS — (Continued)
established a protocol that defines the eligibility requirements to participate in the Program. There is no cap on the amount ofpayments that can be made to claimants under the Program.
At December 31, 2014 we have an accrual of $315 million recorded in Corporate which represents our best estimate of remainingamounts that may be paid under the Program. However, it is reasonably possible that the liability could exceed our recorded amountby approximately $200 million. The most significant estimates affecting the amount recorded include the number of participants thathave eligible claims related to death and physical injury, which also contemplates the severity of injury, the length of hospital staysand related compensation amounts and the number of people who actually elect to participate in the Program. Our estimate is subjectto significant uncertainties, as programs of this nature are highly unusual and each eligible claim will have a unique underlying factpattern. While we do not anticipate material changes to our current estimate, it is possible that material changes could occur shouldactual eligible claims and the related compensation amounts differ from this estimate. The Program accepted claims from August 1,2014 through January 31, 2015. Payments to eligible claimants began in the fourth quarter 2014 and will continue through the firsthalf of 2015. Accident victims (or their families) could choose not to participate in the Program and pursue litigation against us. AtJanuary 30, 2015 the Program had received 3,810 claims and the independent program administrator has determined 128 claims to beeligible for payment under the Program. Remaining claims are either under review, deficient awaiting further documentation ordeemed ineligible. Based on currently available information we believe our accrual at December 31, 2014 is adequate to cover theestimated costs under the Program. At January 30, 2015 we have paid $93 million to eligible claimants under the Program. Accidentvictims that accept a payment under the Program agree to settle all claims against GM related to the accident.
Environmental Liability
Automotive operations, like operations of other companies engaged in similar businesses, are subject to a wide range ofenvironmental protection laws, including laws regulating air emissions, water discharges, waste management and environmentalremediation. Liabilities have been recorded primarily in Other liabilities for the expected costs to be paid over the periods ofremediation for the applicable sites, which typically range from five to 30 years.
The final outcome of environmental matters cannot be predicted with certainty at this time. Subsequent adjustments to initialestimates are recorded as necessary based upon additional information obtained. In future periods new laws or regulations, advancesin remediation technologies and additional information about the ultimate remediation methodology to be used could significantlychange our estimates. It is possible that the resolution of one or more environmental matters could exceed the amounts accrued in anamount that could be material to our financial condition, results of operations and cash flows. At December 31, 2014 we estimate theremediation losses could range from $110 million to $210 million.
Other Matters
Brazil Excise Tax Incentive
In October 2012 the Brazilian government issued a decree which increased an excise tax rate by 30 percentage points, but alsoprovided an offsetting tax incentive that requires participating companies to meet certain criteria, such as local investment and fuelefficiency standards. Participating companies that fail to meet the required criteria are subject to clawback provisions and fines. AtDecember 31, 2014 we believe it is reasonably assured that the program requirements will be met based on the current business modeland available technologies.
Korea Fuel Economy Certification
We determined the certified fuel economy ratings on our Cruze 1.8L gasoline vehicles sold in Korea were incorrect. We re-testedand re-certified the Cruze fuel economy ratings which fell below our prior certification and self-reported this issue to localgovernment authorities. We voluntarily announced a customer compensation program for current and previous Cruze owners andrecorded an insignificant charge in the three months ended December 31, 2014.
115
GENERAL MOTORS COMPANY AND SUBSIDIARIES
NOTES TO CONSOLIDATED FINANCIAL STATEMENTS — (Continued)
In November 2014 the Korean government released new fuel economy certification guidelines. We are reviewing the impact thenew testing guidelines may have on the domestic fuel economy certification ratings of our products.
India Tavera Emissions Compliance
We determined there was an emissions compliance issue with certain Tavera models produced in India. We self-reported this issuein the three months ended September 30, 2013 to local government authorities and are continuing to cooperate. We developed asolution, and while the issue was not safety related, we voluntarily recalled the vehicles to serve our customers. We believe ouraccrual at December 31, 2014 is adequate to cover the estimated costs of the recalled vehicles.
Noncancelable Operating Leases
The following table summarizes our minimum commitments under noncancelable operating leases having initial terms in excess ofone year, primarily for property (dollars in millions):
2015 2016 2017 2018 2019 Thereafter
Minimum commitments (a) . . . . . . . . . . . . . . . . . . . . . . . . . . . . . . . . . . . . . $ 348 $ 280 $ 196 $ 171 $ 144 $ 396Sublease income . . . . . . . . . . . . . . . . . . . . . . . . . . . . . . . . . . . . . . . . . . . . . . (53) (62) (59) (56) (54) (248)
Net minimum commitments . . . . . . . . . . . . . . . . . . . . . . . . . . . . . . . . . . . . . $ 295 $ 218 $ 137 $ 115 $ 90 $ 148
(a) Certain of the leases contain escalation clauses and renewal or purchase options.
Rental expense under operating leases was $444 million, $477 million and $474 million in the years ended December 31, 2014,2013 and 2012.
Note 18. Income Taxes
The following table summarizes income (loss) before income taxes and equity income (dollars in millions):
Years Ended December 31,
2014 2013 2012
U.S. income (loss) . . . . . . . . . . . . . . . . . . . . . . . . . . . . . . . . . . . . . . . . . . . . . . . . . . . . . . . . . . . . . . . . . $ 1,683 $ 4,880 $(19,063)Non-U.S. income (loss) . . . . . . . . . . . . . . . . . . . . . . . . . . . . . . . . . . . . . . . . . . . . . . . . . . . . . . . . . . . . . 469 768 (11,194)
Income (loss) before income taxes and equity income . . . . . . . . . . . . . . . . . . . . . . . . . . . . . . . . . . . . . $ 2,152 $ 5,648 $(30,257)
116

GENERAL MOTORS COMPANY AND SUBSIDIARIES
NOTES TO CONSOLIDATED FINANCIAL STATEMENTS — (Continued)
Income Tax Expense (Benefit)
The following table summarizes Income tax expense (benefit) (dollars in millions):
Years Ended December 31,
2014 2013 2012
Current income tax expense (benefit)U.S. federal . . . . . . . . . . . . . . . . . . . . . . . . . . . . . . . . . . . . . . . . . . . . . . . . . . . . . . . . . . . . . . . . . . . . . . $ (23) $ (34) $ 6U.S. state and local . . . . . . . . . . . . . . . . . . . . . . . . . . . . . . . . . . . . . . . . . . . . . . . . . . . . . . . . . . . . . . . . 154 88 78Non-U.S. . . . . . . . . . . . . . . . . . . . . . . . . . . . . . . . . . . . . . . . . . . . . . . . . . . . . . . . . . . . . . . . . . . . . . . . . 671 512 646
Total current income tax expense . . . . . . . . . . . . . . . . . . . . . . . . . . . . . . . . . . . . . . . . . . . . . . . . . . . . . 802 566 730Deferred income tax expense (benefit)U.S. federal . . . . . . . . . . . . . . . . . . . . . . . . . . . . . . . . . . . . . . . . . . . . . . . . . . . . . . . . . . . . . . . . . . . . . . (581) 1,049 (28,965)U.S. state and local . . . . . . . . . . . . . . . . . . . . . . . . . . . . . . . . . . . . . . . . . . . . . . . . . . . . . . . . . . . . . . . . (60) 137 (3,415)Non-U.S. . . . . . . . . . . . . . . . . . . . . . . . . . . . . . . . . . . . . . . . . . . . . . . . . . . . . . . . . . . . . . . . . . . . . . . . . 67 375 (3,181)
Total deferred income tax expense (benefit) . . . . . . . . . . . . . . . . . . . . . . . . . . . . . . . . . . . . . . . . . . . . . (574) 1,561 (35,561)
Total income tax expense (benefit) . . . . . . . . . . . . . . . . . . . . . . . . . . . . . . . . . . . . . . . . . . . . . . . . . . . . $ 228 $ 2,127 $(34,831)
Provisions are made for estimated U.S. and non-U.S. income taxes, less available tax credits and deductions, which may be incurredon the remittance of our basis differences in investments in foreign subsidiaries and corporate joint ventures not deemed to beindefinitely reinvested. Taxes have not been provided on basis differences in investments primarily as a result of earnings in foreignsubsidiaries and corporate joint ventures which are deemed indefinitely reinvested of $3.0 billion and $2.6 billion at December 31,2014 and 2013. Additional basis differences related to investments in nonconsolidated China JVs exist of $4.1 billion at December 31,2014 and 2013 primarily related to fresh-start reporting. Quantification of the deferred tax liability, if any, associated with indefinitelyreinvested basis differences is not practicable.
The following table summarizes a reconciliation of Income tax expense (benefit) compared with the amounts at the U.S. federalstatutory income tax rate (dollars in millions):
Years Ended December 31,
2014 2013 2012
Income tax expense (benefit) at U.S. federal statutory income tax rate . . . . . . . . . . . . . . . . . . . . . . . . $ 753 $ 1,977 $(10,590)State and local tax expense . . . . . . . . . . . . . . . . . . . . . . . . . . . . . . . . . . . . . . . . . . . . . . . . . . . . . . . . . . 73 145 254Non-U.S. income taxed at other than 35% . . . . . . . . . . . . . . . . . . . . . . . . . . . . . . . . . . . . . . . . . . . . . . (72) (168) 908Foreign tax credit election change . . . . . . . . . . . . . . . . . . . . . . . . . . . . . . . . . . . . . . . . . . . . . . . . . . . . — — (1,075)U.S. tax on Non-U.S. income . . . . . . . . . . . . . . . . . . . . . . . . . . . . . . . . . . . . . . . . . . . . . . . . . . . . . . . . (8) 543 713Change in valuation allowance . . . . . . . . . . . . . . . . . . . . . . . . . . . . . . . . . . . . . . . . . . . . . . . . . . . . . . . (402) 182 (33,917)Change in tax laws . . . . . . . . . . . . . . . . . . . . . . . . . . . . . . . . . . . . . . . . . . . . . . . . . . . . . . . . . . . . . . . . 602 146 67Research incentives . . . . . . . . . . . . . . . . . . . . . . . . . . . . . . . . . . . . . . . . . . . . . . . . . . . . . . . . . . . . . . . (279) (490) (68)Goodwill impairment . . . . . . . . . . . . . . . . . . . . . . . . . . . . . . . . . . . . . . . . . . . . . . . . . . . . . . . . . . . . . . 41 124 8,705Settlements of prior year tax matters . . . . . . . . . . . . . . . . . . . . . . . . . . . . . . . . . . . . . . . . . . . . . . . . . . (275) (473) —Realization of basis differences in affiliates . . . . . . . . . . . . . . . . . . . . . . . . . . . . . . . . . . . . . . . . . . . . . (256) — —Foreign currency remeasurement . . . . . . . . . . . . . . . . . . . . . . . . . . . . . . . . . . . . . . . . . . . . . . . . . . . . . 124 (21) (36)U.S. salaried pension plan settlement . . . . . . . . . . . . . . . . . . . . . . . . . . . . . . . . . . . . . . . . . . . . . . . . . . — — 541Other adjustments . . . . . . . . . . . . . . . . . . . . . . . . . . . . . . . . . . . . . . . . . . . . . . . . . . . . . . . . . . . . . . . . . (73) 162 (333)
Total income tax expense (benefit) . . . . . . . . . . . . . . . . . . . . . . . . . . . . . . . . . . . . . . . . . . . . . . . . . . . $ 228 $ 2,127 $(34,831)
117

GENERAL MOTORS COMPANY AND SUBSIDIARIES
NOTES TO CONSOLIDATED FINANCIAL STATEMENTS — (Continued)
Deferred Income Tax Assets and Liabilities
Deferred income tax assets and liabilities at December 31, 2014 and 2013 reflect the effect of temporary differences betweenamounts of assets, liabilities and equity for financial reporting purposes and the bases of such assets, liabilities and equity as measuredby tax laws, as well as tax loss and tax credit carryforwards. The following table summarizes the components of temporary differencesand carryforwards that give rise to deferred tax assets and liabilities (dollars in millions):
December 31, 2014 December 31, 2013
Deferred tax assetsPostretirement benefits other than pensions . . . . . . . . . . . . . . . . . . . . . . . . . . . . . . . . . . . . . . . . . . . $ 2,958 $ 2,902Pension and other employee benefit plans . . . . . . . . . . . . . . . . . . . . . . . . . . . . . . . . . . . . . . . . . . . . 7,503 5,469Warranties, dealer and customer allowances, claims and discounts . . . . . . . . . . . . . . . . . . . . . . . . . 5,512 4,282Property, plants and equipment . . . . . . . . . . . . . . . . . . . . . . . . . . . . . . . . . . . . . . . . . . . . . . . . . . . . . 2,323 2,464Capitalized research expenditures . . . . . . . . . . . . . . . . . . . . . . . . . . . . . . . . . . . . . . . . . . . . . . . . . . . 8,588 7,179Operating loss and tax credit carryforwards (a) . . . . . . . . . . . . . . . . . . . . . . . . . . . . . . . . . . . . . . . . 14,136 19,342Miscellaneous . . . . . . . . . . . . . . . . . . . . . . . . . . . . . . . . . . . . . . . . . . . . . . . . . . . . . . . . . . . . . . . . . . 3,286 1,663
Total deferred tax assets before valuation allowances . . . . . . . . . . . . . . . . . . . . . . . . . . . . . . . . . 44,306 43,301Less: valuation allowances . . . . . . . . . . . . . . . . . . . . . . . . . . . . . . . . . . . . . . . . . . . . . . . . . . . . . . . . (9,659) (10,823)
Total deferred tax assets . . . . . . . . . . . . . . . . . . . . . . . . . . . . . . . . . . . . . . . . . . . . . . . . . . . . . . . . . . 34,647 32,478Deferred tax liabilitiesIntangible assets . . . . . . . . . . . . . . . . . . . . . . . . . . . . . . . . . . . . . . . . . . . . . . . . . . . . . . . . . . . . . . . . 416 397
Net deferred tax assets . . . . . . . . . . . . . . . . . . . . . . . . . . . . . . . . . . . . . . . . . . . . . . . . . . . . . . . . . . . $ 34,231 $ 32,081
(a) Includes operating loss and tax credit carryforwards of $8.9 billion expiring through 2034 and $5.2 billion that may be carried forwardindefinitely at December 31, 2014.
At December 31, 2014 and 2013 valuation allowances against deferred tax assets were primarily in GME and South Korea businessunits and in the U.S. and Canada related primarily to capital loss tax attributes and state operating loss carryforwards.
At December 31, 2014 our European businesses had deferred tax asset valuation allowances of $4.9 billion. As a result of thechanges in our European operating structure and improving financial performance in certain jurisdictions, we are experiencingpositive evidence trends in certain operations. If these operations generate profits and taxable income in the future, it is reasonablypossible our conclusion regarding the need for full valuation allowances could change, resulting in the reversal of significant portionsof the valuation allowances. In the quarter in which significant valuation allowances are reversed, we will record a material tax benefitreflecting the reversal, which could result in a negative effective tax rate for both the quarter and full year.
At December 31, 2012 as a result of sustained profitability in the U.S. and Canada evidenced by three years of earnings and thecompletion of our near- and medium-term business plans in the three months ended December 31, 2012 that forecast continuingprofitability, we determined it was more likely than not future earnings will be sufficient to realize deferred tax assets in these twojurisdictions. Accordingly we reversed most of the U.S. and Canadian valuation allowances resulting in non-cash income tax benefitsof $33.2 billion and $3.1 billion.
118

GENERAL MOTORS COMPANY AND SUBSIDIARIES
NOTES TO CONSOLIDATED FINANCIAL STATEMENTS — (Continued)
Uncertain Tax Positions
The following table summarizes activity of the total amounts of unrecognized tax benefits (dollars in millions):
Years Ended December 31,
2014 2013 2012
Beginning balance . . . . . . . . . . . . . . . . . . . . . . . . . . . . . . . . . . . . . . . . . . . . . . . . . . . . . . . . . . . . . . . . $ 2,530 $ 2,745 $ 2,370Additions to current year tax positions . . . . . . . . . . . . . . . . . . . . . . . . . . . . . . . . . . . . . . . . . . . . . . . . 184 251 112Additions to prior years’ tax positions . . . . . . . . . . . . . . . . . . . . . . . . . . . . . . . . . . . . . . . . . . . . . . . . . 149 276 512Reductions to prior years’ tax positions . . . . . . . . . . . . . . . . . . . . . . . . . . . . . . . . . . . . . . . . . . . . . . . (603) (535) (141)Reductions in tax positions due to lapse of statutory limitations . . . . . . . . . . . . . . . . . . . . . . . . . . . . (164) (73) (34)Settlements . . . . . . . . . . . . . . . . . . . . . . . . . . . . . . . . . . . . . . . . . . . . . . . . . . . . . . . . . . . . . . . . . . . . . . (138) (132) (112)Other . . . . . . . . . . . . . . . . . . . . . . . . . . . . . . . . . . . . . . . . . . . . . . . . . . . . . . . . . . . . . . . . . . . . . . . . . . (81) (2) 38
Ending balance . . . . . . . . . . . . . . . . . . . . . . . . . . . . . . . . . . . . . . . . . . . . . . . . . . . . . . . . . . . . . . . . . . . $ 1,877 $ 2,530 $ 2,745
At December 31, 2014 and 2013 there were $1.2 billion and $1.5 billion of unrecognized tax benefits that if recognized wouldfavorably affect our effective tax rate in the future. In the years ended December 31, 2014, 2013 and 2012 income tax related interestand penalties were insignificant. At December 31, 2014 and 2013 we had liabilities of $246 million and $286 million for income taxrelated interest and penalties.
In the year ended December 31, 2013 we remeasured a previously disclosed uncertain tax position and recorded a $473 million taxbenefit that increased net operating loss carryforwards, reducing future taxable income.
At December 31, 2014 it is not possible to reasonably estimate the expected change to the total amount of unrecognized tax benefitsin the next twelve months.
Other Matters
Income tax returns are filed in multiple jurisdictions and are subject to examination by taxing authorities throughout the world. Wehave open tax years from 2006 to 2014 with various significant tax jurisdictions. These open years contain matters that could besubject to differing interpretations of applicable tax laws and regulations as they relate to the amount, character, timing or inclusion ofrevenue and expenses or the sustainability of income tax credits for a given audit cycle. Given the global nature of our operationsthere is a risk that transfer pricing disputes may arise.
We have net operating loss carryforwards in Germany through November 30, 2009 that, as a result of reorganizations that tookplace in 2008 and 2009, were not recorded as deferred tax assets. Depending on the outcome of European court decisions these losscarryforwards may be available to reduce future taxable income in Germany.
General Motors Corporation was liquidated on December 15, 2011. The Internal Revenue Service has audited the returns through theliquidation date and, in January 2014, the audit of these returns was closed. The reduction to the amount of unrecognized tax benefits wasnot significant.
In January 2013 the U.S. Congress enacted federal income tax legislation including an extension of the research credit for tax years2012 and 2013. As a result, in the year ended December 31, 2013 we recorded an income tax benefit related to the 2012 researchcredit of approximately $200 million.
Note 19. Restructuring and Other Initiatives
We have executed various restructuring and other initiatives and we plan to execute additional initiatives in the future, if necessary,in order to align manufacturing capacity and other costs with prevailing global automotive production and to improve the utilization
119

GENERAL MOTORS COMPANY AND SUBSIDIARIES
NOTES TO CONSOLIDATED FINANCIAL STATEMENTS — (Continued)
of remaining facilities. To the extent these programs involve voluntary separations, no liabilities are generally recorded until offers toemployees are accepted. If employees are involuntarily terminated, a liability is generally recorded at the communication date.Related charges are recorded in Automotive cost of sales and Automotive selling, general and administrative expense.
The following table summarizes the reserves related to restructuring and other initiatives and charges by segment, includingpostemployment benefit reserves and charges (dollars in millions):
GMNA GME GMIO GMSA Total
Balance at January 1, 2012 . . . . . . . . . . . . . . . . . . . . . . . . . . . . . . . . . . . . . . . . . . . . . . $ 884 $ 687 $ 1 $ 12 $ 1,584Additions, interest accretion and other . . . . . . . . . . . . . . . . . . . . . . . . . . . . . . . . . . . . . 140 254 84 92 570Payments . . . . . . . . . . . . . . . . . . . . . . . . . . . . . . . . . . . . . . . . . . . . . . . . . . . . . . . . . . . (304) (344) (46) (55) (749)Revisions to estimates and effect of foreign currency . . . . . . . . . . . . . . . . . . . . . . . . . (67) (7) — (11) (85)
Balance at December 31, 2012 (a) . . . . . . . . . . . . . . . . . . . . . . . . . . . . . . . . . . . . . . . . 653 590 39 38 1,320Additions, interest accretion and other . . . . . . . . . . . . . . . . . . . . . . . . . . . . . . . . . . . . . 58 202 404 50 714Payments . . . . . . . . . . . . . . . . . . . . . . . . . . . . . . . . . . . . . . . . . . . . . . . . . . . . . . . . . . . (182) (299) (111) (68) (660)Revisions to estimates and effect of foreign currency . . . . . . . . . . . . . . . . . . . . . . . . . (32) 10 1 (4) (25)
Balance at December 31, 2013 (a) . . . . . . . . . . . . . . . . . . . . . . . . . . . . . . . . . . . . . . . . 497 503 333 16 1,349Additions, interest accretion and other . . . . . . . . . . . . . . . . . . . . . . . . . . . . . . . . . . . . . 42 675 213 83 1,013Payments . . . . . . . . . . . . . . . . . . . . . . . . . . . . . . . . . . . . . . . . . . . . . . . . . . . . . . . . . . . (96) (329) (342) (95) (862)Revisions to estimates and effect of foreign currency . . . . . . . . . . . . . . . . . . . . . . . . . 16 (98) (38) (2) (122)
Balance at December 31, 2014 (a) . . . . . . . . . . . . . . . . . . . . . . . . . . . . . . . . . . . . . . . . $ 459 $ 751 $ 166 $ 2 $ 1,378
(a) The remaining cash payments related to these reserves for restructuring and other initiatives, including temporary layoff benefits of $354million, $353 million and $356 million at December 31, 2014, 2013 and 2012 for GMNA, primarily relate to postemployment benefits to bepaid.
Year Ended December 31, 2014
Restructuring and other initiatives at GME primarily related to the termination of all vehicle and transmission production at ourBochum, Germany facility. Through December 31, 2014 the active separation programs related to Germany had a total cost of $841million and had affected a total of 3,560 employees. We completed the separation program at Bochum in December 2014.
Restructuring and other initiatives at GMIO primarily related to separation programs in Australia and Korea, the withdrawal of theChevrolet brand from Europe and the cessation of manufacturing in Australia. Through December 31, 2014 the active separationprograms related to Australia, Korea and Chevrolet Europe locations had a total cost of $514 million and affected a total of 3,380employees. We expect to complete these programs in 2017 and incur additional restructuring and other charges of $270 million.
Restructuring and other initiatives at GMSA primarily related to completed separation programs in Brazil and an active separationprogram in Venezuela and through December 31, 2014 had a total cost of $169 million.
Year Ended December 31, 2013
Restructuring and other initiatives primarily related to: (1) cash severance incentive programs for skilled trade U.S. hourly employees andservice cost for hourly layoff benefits at GMNA; (2) our plan to terminate all vehicle and transmission production at our Bochum, Germanyfacility by the end of 2014 which had a total cost of $194 million and had affected a total of 450 employees at GME through December 31,2013; (3) separation programs in Australia and Korea and programs related to the withdrawal of the Chevrolet brand from Europe, describedbelow, which had a total cost of $420 million and had affected a total of 4,100 employees at GMIO through December 31, 2013; and(4) active separation programs in Brazil which had a total cost of $103 million at GMSA through December 31, 2013.
120

GENERAL MOTORS COMPANY AND SUBSIDIARIES
NOTES TO CONSOLIDATED FINANCIAL STATEMENTS — (Continued)
Year Ended December 31, 2012
Restructuring and other initiatives primarily related to: (1) our 2011 UAW labor agreement, which included cash severanceincentive programs that were completed at March 31, 2012 at a total cost of $99 million affecting 1,400 skilled trade U.S. hourlyemployee participants and increased production capacity utilization in Canada at GMNA; (2) separation and early retirementprograms in Germany and the United Kingdom that had a total cost of $400 million and affected a total of 2,550 employees, of which$310 million related to a program initiated in Germany in 2010 at GME; (3) voluntary separation programs in Korea and Australiawhich had a total cost of $69 million and affected 650 employees at GMIO; and (4) a separation program in Brazil of $87 million atGMSA.
Withdrawal of the Chevrolet Brand from Europe
In December 2013 we announced our plans to focus our marketing and product portfolio on our Opel and Vauxhall brands inWestern and Central Europe and cease mainstream distribution of the Chevrolet brand in those markets in 2015. This decision impacts1,200 Chevrolet dealers and distributors in the affected countries and 480 Chevrolet Europe employees. In the three months endedDecember 31, 2013 we recorded pre-tax charges of $636 million, net of noncontrolling interests of $124 million. These chargesincluded dealer restructuring costs of $233 million and employee severance costs of $30 million which are reflected in the tableabove. The remaining charges for intangible asset impairments of $264 million and sales incentive, inventory related and other costsof $233 million are not included in the table above. Refer to Note 11 for additional information on the intangible asset impairmentcharges.
Manufacturing Operations at Holden
In December 2013 we announced plans to cease vehicle and engine manufacturing and significantly reduce engineering operationsat Holden by the end of 2017. Holden will continue to sell imported vehicles through its Holden dealer network and maintain itsglobal design studio. This decision affects 2,900 employees at certain Holden facilities. In the three months ended December 31, 2013we recorded pre-tax charges of $536 million in Automotive cost of sales consisting primarily of asset impairment charges of $477million, including property, plant and equipment, which are not included in the table above. The remaining charges relate to exit-related costs, including certain employee severance related costs, of which $59 million are included in the table above. Refer to Note 9for additional information on the property, plant and equipment impairment charges.
Note 20. Interest Income and Other Non-Operating Income, net
The following table summarizes the components of Interest income and other non-operating income, net (dollars in millions):
Years Ended December 31,
2014 2013 2012
Interest income . . . . . . . . . . . . . . . . . . . . . . . . . . . . . . . . . . . . . . . . . . . . . . . . . . . . . . . . . . . . . . . . . . . . . . $ 211 $ 246 $ 343Net gains (losses) on derivatives . . . . . . . . . . . . . . . . . . . . . . . . . . . . . . . . . . . . . . . . . . . . . . . . . . . . . . . . 48 (13) (63)Dividends and royalties . . . . . . . . . . . . . . . . . . . . . . . . . . . . . . . . . . . . . . . . . . . . . . . . . . . . . . . . . . . . . . . 101 97 98Foreign currency transaction and remeasurement gains (losses) . . . . . . . . . . . . . . . . . . . . . . . . . . . . . . . . 378 (154) 16Gains (losses) on securities and other investments — realized and unrealized . . . . . . . . . . . . . . . . . . . . . 13 691 (193)Deferred income from technology agreements . . . . . . . . . . . . . . . . . . . . . . . . . . . . . . . . . . . . . . . . . . . . . — 100 114Other . . . . . . . . . . . . . . . . . . . . . . . . . . . . . . . . . . . . . . . . . . . . . . . . . . . . . . . . . . . . . . . . . . . . . . . . . . . . . . 72 96 530
Total interest income and other non-operating income, net . . . . . . . . . . . . . . . . . . . . . . . . . . . . . . . . . . . . $ 823 $ 1,063 $ 845
In December 2013 we sold our investment in Ally Financial common stock through a private offering for net proceeds of $880million and recorded a gain of $483 million.
121

GENERAL MOTORS COMPANY AND SUBSIDIARIES
NOTES TO CONSOLIDATED FINANCIAL STATEMENTS — (Continued)
Note 21. Stockholders’ Equity and Noncontrolling Interests
Preferred and Common Stock
We have 2.0 billion shares of preferred stock and 5.0 billion shares of common stock authorized for issuance. There were no sharesof Series A Preferred Stock issued and outstanding at December 31, 2014 and 156 million shares of Series A Preferred Stock issuedand outstanding at December 31, 2013. We had 1.6 billion and 1.5 billion shares of common stock issued and outstanding atDecember 31, 2014 and 2013.
The following table summarizes significant features relating to our preferred and common stock (dollars in millions, except for pershare amounts):
LiquidationPreferencePer Share
DividendPer Annum
Dividends PaidYears Ended December 31,
2014 2013 2012
Series A Preferred Stock . . . . . . . . . . . . . . . . . . . . . . . . . . . . . . . . . . . . . . . . . . $ 25.00 9.00% $ 1,160 $ 1,370 $ 621Series B Preferred Stock . . . . . . . . . . . . . . . . . . . . . . . . . . . . . . . . . . . . . . . . . . $ 50.00 4.75% $ 237 $ 238Common stock . . . . . . . . . . . . . . . . . . . . . . . . . . . . . . . . . . . . . . . . . . . . . . . . . . N/A $ 1.20 $ 1,928 $ — $ —
Series A Preferred Stock
In December 2014 we redeemed all of the remaining outstanding shares of our Series A Preferred Stock at a price equal to theaggregate liquidation amount, including accumulated dividends, of $3.9 billion, which reduced Net income attributable to commonstockholders by $809 million and is included within dividends paid in the table above.
In September 2013 we purchased 120 million shares (or 43.5% of the total shares outstanding) of our Series A Preferred Stock heldby the New VEBA at a price equal to 108.1% of the aggregate liquidation amount for $3.2 billion. We recorded a loss for thedifference between the carrying amount of the Series A Preferred Stock purchased and the consideration paid, which reduced Netincome attributable to common stockholders by $816 million and is included within dividends paid in the table above.
Series B Preferred Stock
On December 1, 2013 each of the 100 million shares of our Series B Preferred Stock outstanding automatically converted into1.3736 shares of our common stock for a total of 137 million common shares. The number of shares of our common stock issued uponmandatory conversion of each share of Series B Preferred Stock was determined based on the average of the closing prices of ourcommon stock over the 40 consecutive trading day period ended November 26, 2013.
Common Stock
Holders of our common stock are entitled to dividends at the sole discretion of our Board of Directors. No common stock dividendswere declared or paid prior to 2014. Holders of common stock are entitled to one vote per share on all matters submitted to ourstockholders for a vote. The liquidation rights of holders of our common stock are secondary to the payment or provision for paymentof all our debts and liabilities and to holders of our preferred stock, if any such shares are then outstanding.
In September 2014 we repurchased 5 million shares of our outstanding common stock at a weighted-average price of $33.69 pershare, to offset the dilution from the June 2014 grant of stock incentive awards under the 2014 Long-term Incentive Plan.
In December 2012 we purchased 200 million shares of our common stock from the U.S. Treasury at a price of $27.50 per share fora total of $5.5 billion. The purchase price represented a premium to the prior day’s closing price of $25.49. We allocated the purchase
122

GENERAL MOTORS COMPANY AND SUBSIDIARIES
NOTES TO CONSOLIDATED FINANCIAL STATEMENTS — (Continued)
price between a direct reduction to stockholders’ equity of $5.1 billion and a charge to Automotive selling, general and administrativeexpense of $402 million representing the premium. These shares were retired and returned to authorized but unissued status. In theyear ended December 31, 2012 we issued 1.3 million shares of common stock for the settlement of restricted stock and salary stockawards and 400,000 shares for exercised warrants. Refer to Note 23 for additional information on our stock incentive plans.
Warrants
In July 2009 we issued two tranches of warrants, each to acquire 136 million shares of common stock, to Motors LiquidationCompany (MLC) which have all been distributed to creditors of General Motors Corporation and to the Motors Liquidation CompanyGUC Trust by MLC and one tranche of warrants to acquire 46 million shares of common stock to the New VEBA. The first tranche ofMLC warrants is exercisable at any time prior to July 10, 2016 at an exercise price of $10.00 per share and the second tranche of MLCwarrants is exercisable at any time prior to July 10, 2019 at an exercise price of $18.33 per share. The New VEBA warrants, whichwere subsequently sold by the New VEBA, are exercisable at any time prior to December 31, 2015 at an exercise price of $42.31 pershare. Upon exercise of the warrants, the shares issued will be included in the number of basic shares outstanding used in thecomputation of earnings per share. The number of shares of common stock underlying each of the warrants and the per share exerciseprice are subject to adjustment as a result of certain events, including stock splits, reverse stock splits and stock dividends. Theoutstanding balance of warrants was 165 million and 293 million at December 31, 2014 and 2013.
123

GENERAL MOTORS COMPANY AND SUBSIDIARIES
NOTES TO CONSOLIDATED FINANCIAL STATEMENTS — (Continued)
Accumulated Other Comprehensive Loss
The following table summarizes the components of Accumulated other comprehensive loss (dollars in millions):
Years Ended December 31,
2014 2013 2012
Foreign Currency Translation AdjustmentsBalance at beginning of period . . . . . . . . . . . . . . . . . . . . . . . . . . . . . . . . . . . . . . . . . . . . . . . . . . . . . . . . . . $ (614) $ 101 $ 215Other comprehensive loss . . . . . . . . . . . . . . . . . . . . . . . . . . . . . . . . . . . . . . . . . . . . . . . . . . . . . . . . . . . . . . (477) (722) (103)Tax expense (benefit) . . . . . . . . . . . . . . . . . . . . . . . . . . . . . . . . . . . . . . . . . . . . . . . . . . . . . . . . . . . . . . . . . . (4) 11 —
Other comprehensive loss, net of tax . . . . . . . . . . . . . . . . . . . . . . . . . . . . . . . . . . . . . . . . . . . . . . . . . . . . . . (473) (733) (103)Other comprehensive income (loss) attributable to noncontrolling interests, net of tax . . . . . . . . . . . . . . . 23 18 (11)
Balance at end of period . . . . . . . . . . . . . . . . . . . . . . . . . . . . . . . . . . . . . . . . . . . . . . . . . . . . . . . . . . . . . . . $(1,064) $ (614) $ 101
Unrealized Gains and Losses on Securities, NetBalance at beginning of period . . . . . . . . . . . . . . . . . . . . . . . . . . . . . . . . . . . . . . . . . . . . . . . . . . . . . . . . . . $ 2 $ 41 $ (4)Other comprehensive income (loss) before reclassification adjustment . . . . . . . . . . . . . . . . . . . . . . . . . . . (2) 133 (140)Tax expense (benefit) . . . . . . . . . . . . . . . . . . . . . . . . . . . . . . . . . . . . . . . . . . . . . . . . . . . . . . . . . . . . . . . . . . (1) (6) 22
Other comprehensive income (loss) before reclassification adjustment, net of tax . . . . . . . . . . . . . . . . . . (1) 139 (162)Reclassification adjustment . . . . . . . . . . . . . . . . . . . . . . . . . . . . . . . . . . . . . . . . . . . . . . . . . . . . . . . . . . . . . (7) (185) 202Tax benefit . . . . . . . . . . . . . . . . . . . . . . . . . . . . . . . . . . . . . . . . . . . . . . . . . . . . . . . . . . . . . . . . . . . . . . . . . . (3) (7) (5)
Reclassification adjustment, net of tax . . . . . . . . . . . . . . . . . . . . . . . . . . . . . . . . . . . . . . . . . . . . . . . . . . . . (4) (178) 207
Other comprehensive income (loss), net of tax . . . . . . . . . . . . . . . . . . . . . . . . . . . . . . . . . . . . . . . . . . . . . . (5) (39) 45
Balance at end of period . . . . . . . . . . . . . . . . . . . . . . . . . . . . . . . . . . . . . . . . . . . . . . . . . . . . . . . . . . . . . . . $ (3) $ 2 $ 41
Defined Benefit Plans, NetBalance at beginning of period . . . . . . . . . . . . . . . . . . . . . . . . . . . . . . . . . . . . . . . . . . . . . . . . . . . . . . . . . . $(2,501) $(8,194) $(6,074)Other comprehensive income (loss) before reclassification adjustment — prior service cost or credit . . . (20) 6 (53)Other comprehensive income (loss) before reclassification adjustment — actuarial gains or losses . . . . . (6,457) 8,673 (3,180)Tax expense (benefit) . . . . . . . . . . . . . . . . . . . . . . . . . . . . . . . . . . . . . . . . . . . . . . . . . . . . . . . . . . . . . . . . . . (1,854) 3,087 (1,021)
Other comprehensive income (loss) before reclassification adjustment, net of tax . . . . . . . . . . . . . . . . . . (4,623) 5,592 (2,212)Reclassification adjustment — prior service cost or credit (a) . . . . . . . . . . . . . . . . . . . . . . . . . . . . . . . . . . 22 (128) (125)Reclassification adjustment — actuarial gains or losses (a) . . . . . . . . . . . . . . . . . . . . . . . . . . . . . . . . . . . . 76 178 229Tax expense (benefit) (a) . . . . . . . . . . . . . . . . . . . . . . . . . . . . . . . . . . . . . . . . . . . . . . . . . . . . . . . . . . . . . . . (20) (51) 12
Reclassification adjustment, net of tax (a) . . . . . . . . . . . . . . . . . . . . . . . . . . . . . . . . . . . . . . . . . . . . . . . . . . 118 101 92
Other comprehensive income (loss), net of tax . . . . . . . . . . . . . . . . . . . . . . . . . . . . . . . . . . . . . . . . . . . . . . (4,505) 5,693 (2,120)
Balance at end of period . . . . . . . . . . . . . . . . . . . . . . . . . . . . . . . . . . . . . . . . . . . . . . . . . . . . . . . . . . . . . . . $(7,006) $(2,501) $(8,194)
(a) Included in the computation of net periodic pension and OPEB (income) expense. Refer to Note 15 for additional information.
124
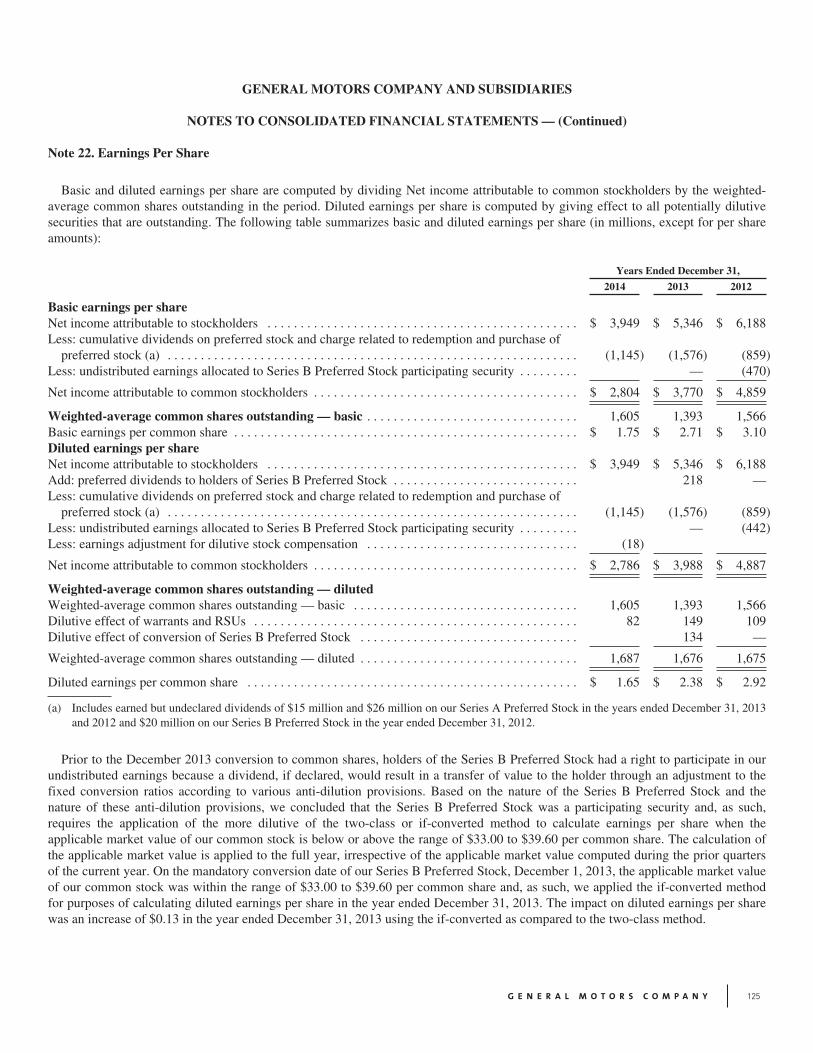
GENERAL MOTORS COMPANY AND SUBSIDIARIES
NOTES TO CONSOLIDATED FINANCIAL STATEMENTS — (Continued)
Note 22. Earnings Per Share
Basic and diluted earnings per share are computed by dividing Net income attributable to common stockholders by the weighted-average common shares outstanding in the period. Diluted earnings per share is computed by giving effect to all potentially dilutivesecurities that are outstanding. The following table summarizes basic and diluted earnings per share (in millions, except for per shareamounts):
Years Ended December 31,
2014 2013 2012
Basic earnings per shareNet income attributable to stockholders . . . . . . . . . . . . . . . . . . . . . . . . . . . . . . . . . . . . . . . . . . . . . . . $ 3,949 $ 5,346 $ 6,188Less: cumulative dividends on preferred stock and charge related to redemption and purchase of
preferred stock (a) . . . . . . . . . . . . . . . . . . . . . . . . . . . . . . . . . . . . . . . . . . . . . . . . . . . . . . . . . . . . . . (1,145) (1,576) (859)Less: undistributed earnings allocated to Series B Preferred Stock participating security . . . . . . . . . — (470)
Net income attributable to common stockholders . . . . . . . . . . . . . . . . . . . . . . . . . . . . . . . . . . . . . . . . $ 2,804 $ 3,770 $ 4,859
Weighted-average common shares outstanding — basic . . . . . . . . . . . . . . . . . . . . . . . . . . . . . . . . 1,605 1,393 1,566Basic earnings per common share . . . . . . . . . . . . . . . . . . . . . . . . . . . . . . . . . . . . . . . . . . . . . . . . . . . . $ 1.75 $ 2.71 $ 3.10Diluted earnings per shareNet income attributable to stockholders . . . . . . . . . . . . . . . . . . . . . . . . . . . . . . . . . . . . . . . . . . . . . . . $ 3,949 $ 5,346 $ 6,188Add: preferred dividends to holders of Series B Preferred Stock . . . . . . . . . . . . . . . . . . . . . . . . . . . . 218 —Less: cumulative dividends on preferred stock and charge related to redemption and purchase of
preferred stock (a) . . . . . . . . . . . . . . . . . . . . . . . . . . . . . . . . . . . . . . . . . . . . . . . . . . . . . . . . . . . . . . (1,145) (1,576) (859)Less: undistributed earnings allocated to Series B Preferred Stock participating security . . . . . . . . . — (442)Less: earnings adjustment for dilutive stock compensation . . . . . . . . . . . . . . . . . . . . . . . . . . . . . . . . (18)
Net income attributable to common stockholders . . . . . . . . . . . . . . . . . . . . . . . . . . . . . . . . . . . . . . . . $ 2,786 $ 3,988 $ 4,887
Weighted-average common shares outstanding — dilutedWeighted-average common shares outstanding — basic . . . . . . . . . . . . . . . . . . . . . . . . . . . . . . . . . . 1,605 1,393 1,566Dilutive effect of warrants and RSUs . . . . . . . . . . . . . . . . . . . . . . . . . . . . . . . . . . . . . . . . . . . . . . . . . 82 149 109Dilutive effect of conversion of Series B Preferred Stock . . . . . . . . . . . . . . . . . . . . . . . . . . . . . . . . . 134 —
Weighted-average common shares outstanding — diluted . . . . . . . . . . . . . . . . . . . . . . . . . . . . . . . . . 1,687 1,676 1,675
Diluted earnings per common share . . . . . . . . . . . . . . . . . . . . . . . . . . . . . . . . . . . . . . . . . . . . . . . . . . $ 1.65 $ 2.38 $ 2.92
(a) Includes earned but undeclared dividends of $15 million and $26 million on our Series A Preferred Stock in the years ended December 31, 2013and 2012 and $20 million on our Series B Preferred Stock in the year ended December 31, 2012.
Prior to the December 2013 conversion to common shares, holders of the Series B Preferred Stock had a right to participate in ourundistributed earnings because a dividend, if declared, would result in a transfer of value to the holder through an adjustment to thefixed conversion ratios according to various anti-dilution provisions. Based on the nature of the Series B Preferred Stock and thenature of these anti-dilution provisions, we concluded that the Series B Preferred Stock was a participating security and, as such,requires the application of the more dilutive of the two-class or if-converted method to calculate earnings per share when theapplicable market value of our common stock is below or above the range of $33.00 to $39.60 per common share. The calculation ofthe applicable market value is applied to the full year, irrespective of the applicable market value computed during the prior quartersof the current year. On the mandatory conversion date of our Series B Preferred Stock, December 1, 2013, the applicable market valueof our common stock was within the range of $33.00 to $39.60 per common share and, as such, we applied the if-converted methodfor purposes of calculating diluted earnings per share in the year ended December 31, 2013. The impact on diluted earnings per sharewas an increase of $0.13 in the year ended December 31, 2013 using the if-converted as compared to the two-class method.
125

GENERAL MOTORS COMPANY AND SUBSIDIARIES
NOTES TO CONSOLIDATED FINANCIAL STATEMENTS — (Continued)
In the year ended December 31, 2012 we were required to use the two-class method for calculating earnings per share as theapplicable market value of our common stock was below $33.00 per common share. Under the two-class method for computingearnings per share, undistributed earnings are allocated to common stock and the Series B Preferred Stock according to theirrespective participation rights in undistributed earnings, as if all the earnings for the period had been distributed. This allocation to theSeries B Preferred Stock holders reduced Net income attributable to common stockholders, resulting in a lower basic and dilutedearnings per share amount. The application of the two-class method resulted in an allocation of undistributed earnings to our Series BPreferred Stock holders and, accordingly, 152 million common stock equivalents from the assumed conversion of the Series BPreferred Stock are not considered outstanding for purposes of determining the weighted-average common shares outstanding in thecomputation of diluted earnings per share for December 31, 2012.
In the years ended December 31, 2014, 2013 and 2012 warrants to purchase 46 million shares were not included in the computationof diluted earnings per share because the warrants’ exercise price was greater than the average market price of the common shares.
Note 23. Stock Incentive Plans
Stock incentive plan awards outstanding at December 31, 2014 consist of awards granted under the 2014 Long-Term IncentivePlan, the 2009 Long-Term Incentive Plan and the Salary Stock Plan. The 2014 Long-Term Incentive Plan was approved bystockholders in June 2014 and replaced the 2009 Long-Term Incentive Plan and Salary Stock Plan. These plans are administered bythe Executive Compensation Committee of our Board of Directors. The aggregate number of shares with respect to which awards maybe granted under the 2014 Long-Term Incentive Plan shall not exceed 60 million. In January 2014 we amended the 2009 Long-TermIncentive Plan and the Salary Stock Plan to provide cash payment, on a going forward basis, of dividend equivalents upon settlementto active employees and certain former employees with outstanding awards as of the amendment date.
Long-Term Incentive Plan
We grant RSUs and PSUs under our 2014 Long-Term Incentive Plan and, prior to our 2014 Long-Term Incentive Plan, RSUs underour 2009 Long-Term Incentive Plan. Shares awarded under the plans are subject to forfeiture if the participant leaves the company forreasons other than those permitted under the plans such as retirement, death or disability. Our policy is to issue new shares uponsettlement of RSUs and PSUs.
We granted 8 million, 7 million and 7 million RSUs in the years ended December 31, 2014, 2013 and 2012. These awards eithercliff vest or ratably vest generally over a three-year service period, as defined in the terms of each award. Vesting and subsequentsettlement will generally occur based upon employment at the end of each specified service period.
We issued 4 million PSUs, equal to the targeted number of shares, in the year ended December 31, 2014. The ultimate number ofshares earned will be determined at the end of the specified performance period, which is three years, based on performance criteriadetermined by the Executive Compensation Committee of the Board of Directors at the time of award. The number of shares earnedmay equal, exceed or be less than the targeted number of shares depending on whether the performance criteria are met, surpassed ornot met. PSU awards generally vest and settle at the end of a three-year period.
Salary Stock Plan
In the years ended December 31, 2013 and 2012 a portion of each participant’s salary was accrued on each salary payment date andconverted to RSUs on a quarterly basis. In June 2013 we amended the plan to provide for cash or share settlement of awards based onelection by the participant. The liability for these awards continues to be remeasured to fair value at the end of each reporting period.
126

GENERAL MOTORS COMPANY AND SUBSIDIARIES
NOTES TO CONSOLIDATED FINANCIAL STATEMENTS — (Continued)
RSUs and PSUs
The following table summarizes information about the RSUs and PSUs under our stock incentive plans (units in millions):
Shares
Weighted-AverageGrantDate
Fair Value
Weighted-Average
RemainingContractual
Term in Years
Units outstanding at January 1, 2014 . . . . . . . . . . . . . . . . . . . . . . . . . . . . . . . . . . . . . . . . . . . . . . . . . . 18.6 $ 27.76 1.2Granted . . . . . . . . . . . . . . . . . . . . . . . . . . . . . . . . . . . . . . . . . . . . . . . . . . . . . . . . . . . . . . . . . . . . . . . . . 12.1 $ 35.31Settled . . . . . . . . . . . . . . . . . . . . . . . . . . . . . . . . . . . . . . . . . . . . . . . . . . . . . . . . . . . . . . . . . . . . . . . . . . (9.3) $ 27.85Forfeited or expired . . . . . . . . . . . . . . . . . . . . . . . . . . . . . . . . . . . . . . . . . . . . . . . . . . . . . . . . . . . . . . . (1.5) $ 30.39
Units outstanding at December 31, 2014 . . . . . . . . . . . . . . . . . . . . . . . . . . . . . . . . . . . . . . . . . . . . . . . 19.9 $ 32.11 1.3
Units unvested and expected to vest at December 31, 2014 . . . . . . . . . . . . . . . . . . . . . . . . . . . . . . . . 12.7 $ 32.91 1.5Units vested and payable at December 31, 2014 . . . . . . . . . . . . . . . . . . . . . . . . . . . . . . . . . . . . . . . . . 6.7 $ 30.49Units granted in the year ended December 31, 2013 . . . . . . . . . . . . . . . . . . . . . . . . . . . . . . . . . . . . . . $ 29.05Units granted in the year ended December 31, 2012 . . . . . . . . . . . . . . . . . . . . . . . . . . . . . . . . . . . . . . $ 25.10
The following table summarizes compensation expense recorded for our stock incentive plans (dollars in millions):
Years Ended December 31,
2014 2013 2012
Compensation expense . . . . . . . . . . . . . . . . . . . . . . . . . . . . . . . . . . . . . . . . . . . . . . . . . . . . . . . . . . . . . . . . . $ 245 $ 311 $ 302Income tax benefit . . . . . . . . . . . . . . . . . . . . . . . . . . . . . . . . . . . . . . . . . . . . . . . . . . . . . . . . . . . . . . . . . . . . $ 81 $ 100 $ 100
At December 31, 2014 the total unrecognized compensation expense for nonvested equity awards granted was $247 million. Thisexpense is expected to be recorded over a weighted-average period of 1.5 years. The total fair value of RSUs and PSUs vested in theyears ended December 31, 2014, 2013 and 2012 was $221 million, $342 million and $141 million. In the years ended December 31,2014, 2013 and 2012 total payments for 2.4 million, 3.1 million and 1.6 million RSUs settled under stock incentive plans were $85million, $94 million and $36 million.
Note 24. Supplementary Quarterly Financial Information (Unaudited)
The following tables summarize supplementary quarterly financial information (dollars in millions, except per share amounts):
1st Quarter 2nd Quarter 3rd Quarter 4th Quarter
2014Total net sales and revenue . . . . . . . . . . . . . . . . . . . . . . . . . . . . . . . . . . . . . . . . . . . . . $ 37,408 $ 39,649 $ 39,255 $ 39,617Automotive gross margin . . . . . . . . . . . . . . . . . . . . . . . . . . . . . . . . . . . . . . . . . . . . . . $ 2,188 $ 2,611 $ 3,945 $ 4,266Net income . . . . . . . . . . . . . . . . . . . . . . . . . . . . . . . . . . . . . . . . . . . . . . . . . . . . . . . . . $ 280 $ 287 $ 1,442 $ 2,009Net income attributable to stockholders . . . . . . . . . . . . . . . . . . . . . . . . . . . . . . . . . . . $ 213 $ 278 $ 1,471 $ 1,987Earnings per share, basic . . . . . . . . . . . . . . . . . . . . . . . . . . . . . . . . . . . . . . . . . . . . . . $ 0.08 $ 0.12 $ 0.86 $ 0.69Earnings per share, diluted . . . . . . . . . . . . . . . . . . . . . . . . . . . . . . . . . . . . . . . . . . . . . $ 0.06 $ 0.11 $ 0.81 $ 0.66
1st Quarter 2nd Quarter 3rd Quarter 4th Quarter
2013Total net sales and revenue . . . . . . . . . . . . . . . . . . . . . . . . . . . . . . . . . . . . . . . . . . . . . $ 36,884 $ 39,075 $ 38,983 $ 40,485Automotive gross margin . . . . . . . . . . . . . . . . . . . . . . . . . . . . . . . . . . . . . . . . . . . . . . $ 3,727 $ 4,416 $ 4,954 $ 4,070Net income . . . . . . . . . . . . . . . . . . . . . . . . . . . . . . . . . . . . . . . . . . . . . . . . . . . . . . . . . $ 1,185 $ 1,388 $ 1,705 $ 1,053Net income attributable to stockholders . . . . . . . . . . . . . . . . . . . . . . . . . . . . . . . . . . . $ 1,175 $ 1,414 $ 1,717 $ 1,040Earnings per share, basic . . . . . . . . . . . . . . . . . . . . . . . . . . . . . . . . . . . . . . . . . . . . . . $ 0.63 $ 0.87 $ 0.50 $ 0.64Earnings per share, diluted . . . . . . . . . . . . . . . . . . . . . . . . . . . . . . . . . . . . . . . . . . . . . $ 0.58 $ 0.75 $ 0.45 $ 0.57
127

GENERAL MOTORS COMPANY AND SUBSIDIARIES
NOTES TO CONSOLIDATED FINANCIAL STATEMENTS — (Continued)
The three months ended December 31, 2014 included the following on a pre-tax basis:
• Gain on extinguishment of debt of $207 million related to unsecured debt in Brazil in GMSA.
• Asset impairment charges of $158 million related to our Thailand subsidiary in GMIO.
The three months ended September 30, 2014 included asset impairment charges of $194 million related to Russian subsidiaries inGME on a pre-tax basis.
The three months ended June 30, 2014 included the following on a pre-tax basis:
• Recall campaign and courtesy transportation charges of $1.1 billion in GMNA.
• Catch-up adjustment of $874 million related to change in estimate of recall campaigns in GMNA.
• Charge of $400 million for ignition switch recall compensation program in Corporate.
The three months ended March 31, 2014 included the following on a pre-tax basis:
• Recall campaign and courtesy transportation charges of $1.3 billion in GMNA.
• Charge of $419 million for the Venezuela currency devaluation in GMSA.
The three months ended December 31, 2013 included the following on a pre-tax (except tax matters) and pre-noncontrollinginterests basis:
• Benefit from the release of GM Korea wage litigation accruals of $846 million in GMIO.
• Asset impairment charges of $805 million at Holden and GM India in GMIO.
• Charges of $745 million related to our plans to cease mainstream distribution of Chevrolet brand in Europe in GMIO.
• Gain on sale of equity investment in Ally Financial of $483 million in Corporate.
• Goodwill impairment charges of $481 million in GMIO.
• Tax benefit of $473 million from remeasurement of uncertain tax position in Corporate.
• Gain on sale of equity investment in PSA of $152 million in GME.
The three months ended June 30, 2013 included loss on extinguishment of debt of $240 million related to early redemption ofpreferred shares at GM Korea in GMIO on a pre-tax and pre-noncontrolling interests basis.
The three months ended March 31, 2013 included a charge of $162 million in GMSA for the Venezuela currency devaluation on apre-tax basis. In the three months ended March 31, 2013 we used the two-class method for calculating earnings per share becauseSeries B Preferred Stock was a participating security.
128

GENERAL MOTORS COMPANY AND SUBSIDIARIES
NOTES TO CONSOLIDATED FINANCIAL STATEMENTS — (Continued)
Note 25. Segment Reporting
We analyze the results of our business through the following segments: GMNA, GME, GMIO, GMSA and GM Financial. Thechief operating decision maker evaluates the operating results and performance of our automotive segments through income beforeinterest and income taxes, as adjusted for additional amounts, which is presented net of noncontrolling interests. The chief operatingdecision maker evaluates GM Financial through income before income taxes-adjusted because he/she believes interest income andinterest expense are part of operating results when assessing and measuring the operational and financial performance of the segment.Each segment has a manager responsible for executing our strategies. Our automotive manufacturing operations are integrated withinthe segments, benefit from broad-based trade agreements and are subject to regulatory requirements, such as corporate average fueleconomy regulations. While not all vehicles within a segment are individually profitable on a fully allocated cost basis, those vehiclesare needed in our product mix in order to attract customers to dealer showrooms and to maintain sales volumes for other, moreprofitable vehicles. Because of these and other factors, we do not manage our business on an individual brand or vehicle basis.
Substantially all of the cars, trucks and parts produced are marketed through retail dealers in North America, and throughdistributors and dealers outside of North America, the substantial majority of which are independently owned.
In addition to the products sold to dealers for consumer retail sales, cars and trucks are also sold to fleet customers, including dailyrental car companies, commercial fleet customers, leasing companies and governments. Sales to fleet customers are completedthrough the network of dealers and in some cases sold directly to fleet customers. Retail and fleet customers can obtain a wide rangeof aftersale vehicle services and products through the dealer network, such as maintenance, light repairs, collision repairs, vehicleaccessories and extended service warranties.
GMNA primarily meets the demands of customers in North America with vehicles developed, manufactured and/or marketed underthe Buick, Cadillac, Chevrolet and GMC brands. The demands of customers outside North America are primarily met with vehiclesdeveloped, manufactured and/or marketed under the Buick, Cadillac, Chevrolet, GMC, Holden, Opel and Vauxhall brands. We alsohad equity ownership stakes directly or indirectly in entities through various regional subsidiaries, primarily in Asia. These companiesdesign, manufacture and market vehicles under the Alpheon, Baojun, Buick, Cadillac, Chevrolet, Jiefang and Wuling brands.
Our automotive operations’ interest income and interest expense are recorded centrally in Corporate. Corporate assets consistprimarily of cash and cash equivalents, marketable securities and intercompany balances. All intersegment balances and transactionshave been eliminated in consolidation.
129

GENERAL MOTORS COMPANY AND SUBSIDIARIES
NOTES TO CONSOLIDATED FINANCIAL STATEMENTS — (Continued)
The following tables summarize key financial information by segment (dollars in millions):
At and For the Year Ended December 31, 2014
GMNA GME GMIO GMSA Corporate EliminationsTotal
AutomotiveGM
Financial Eliminations Total
SalesExternal customers . . . . . . . . . . $ 101,199 $ 22,235 $ 14,392 $ 13,115 $ 151 $ 151,092 $ — $ — $ 151,092GM Financial revenue . . . . . . . . — — — — — — 4,854 (17) 4,837
Total net sales and revenue . . . . $ 101,199 $ 22,235 $ 14,392 $ 13,115 $ 151 $ 151,092 $ 4,854 $ (17) $ 155,929
Income (loss) before interestand taxes-adjusted . . . . . . . . . $ 6,603 $ (1,369) $ 1,222 $ (180) $ (580) $ 5,696 $ 803 $ (5) $ 6,494
Adjustments (a) . . . . . . . . . . . . . $ (975) $ (245) $ (180) $ (539) $ (400) $ (2,339) $ 12 $ — (2,327)Automotive interest income . . . 211Automotive interest expense . . . (403)Gain on extinguishment of
debt . . . . . . . . . . . . . . . . . . . . 202Net income attributable to
noncontrolling interests . . . . . 69
Income before income taxes . . . $ 4,246
Equity in net assets ofnonconsolidated affiliates . . . $ 88 $ 6 $ 8,254 $ 2 $ — $ — $ 8,350 $ — $ — $ 8,350
Total assets . . . . . . . . . . . . . . . . $ 92,864 $ 10,528 $ 22,949 $ 10,066 $ 24,368 $ (29,041) $ 131,734 $ 47,861 $ (1,918) $ 177,677Expenditures for property . . . . . $ 4,985 $ 887 $ 681 $ 359 $ 127 $ — $ 7,039 $ 52 $ — $ 7,091Depreciation, amortization and
impairment of long-livedassets and finite-livedintangible assets . . . . . . . . . . . $ 4,376 $ 627 $ 740 $ 386 $ 75 $ (4) $ 6,200 $ 918 $ — $ 7,118
Equity income (loss) . . . . . . . . . $ 19 $ (45) $ 2,120 $ — $ — $ — $ 2,094 $ — $ — $ 2,094
(a) Consists of a catch-up adjustment related to the change in estimate for recall campaigns of $874 million and charges related to flood damage, net of insurancerecoveries, of $101 million in GMNA; asset impairment charges of $245 million related to our Russian subsidiaries in GME; asset impairment charges of $158million related to our Thailand subsidiary in GMIO; Venezuela currency devaluation charges of $419 million and Goodwill impairment charges of $120 million inGMSA; a charge related to the ignition switch recall compensation program of $400 million in Corporate; and other of $10 million.
130

GENERAL MOTORS COMPANY AND SUBSIDIARIES
NOTES TO CONSOLIDATED FINANCIAL STATEMENTS — (Continued)
At and For the Year Ended December 31, 2013
GMNA GME GMIO GMSA Corporate EliminationsTotal
AutomotiveGM
Financial Eliminations Total
SalesExternal customers . . . . . . . . . . . $ 95,091 $ 21,962 $ 18,411 $ 16,478 $ 150 $ 152,092 $ — $ — $ 152,092GM Financial revenue . . . . . . . . . — — — — — — 3,344 (9) 3,335Intersegment . . . . . . . . . . . . . . . . 8 — — — — 8 — (8) —
Total net sales and revenue . . . . . $ 95,099 $ 21,962 $ 18,411 $ 16,478 $ 150 $ 152,100 $ 3,344 $ (17) $ 155,427
Income (loss) before interest andtaxes-adjusted . . . . . . . . . . . . . $ 7,461 $ (869) $ 1,255 $ 327 $ (494) $ 7,680 $ 898 $ — $ 8,578
Adjustments (a) . . . . . . . . . . . . . . $ (100) $ 153 $ (1,169) $ (157) $ 483 $ (790) $ (15) $ — (805)Automotive interest income . . . . 246Automotive interest expense . . . . (334)Loss on extinguishment of
debt . . . . . . . . . . . . . . . . . . . . . (212)Net loss attributable to
noncontrolling interests . . . . . . (15)
Income before income taxes . . . . $ 7,458
Equity in net assets ofnonconsolidated affiliates . . . . $ 74 $ 95 $ 7,921 $ 4 $ — $ — $ 8,094 $ — $ — $ 8,094
Total assets . . . . . . . . . . . . . . . . . $ 87,978 $ 11,276 $ 22,100 $ 11,488 $ 26,460 $ (29,252) $ 130,050 $ 38,084 $ (1,790) $ 166,344Expenditures for property . . . . . . $ 5,466 $ 818 $ 724 $ 444 $ 92 $ 5 $ 7,549 $ 16 $ — $ 7,565Depreciation, amortization and
impairment of long-livedassets and finite-livedintangible assets . . . . . . . . . . . . $ 4,216 $ 426 $ 1,786 $ 522 $ 63 $ (1) $ 7,012 $ 498 $ (10) $ 7,500
Equity income . . . . . . . . . . . . . . . $ 15 $ 34 $ 1,760 $ 1 $ — $ — $ 1,810 $ — $ — $ 1,810
(a) Consists of pension settlement charges of $56 million and charges related to PSA product development agreement of $49 million in GMNA; gain on sale of equityinvestment in PSA of $152 million in GME; property and intangible asset impairment charges of $774 million, costs related to the withdrawal of the Chevroletbrand in Europe of $621 million and goodwill impairment charges of $442 million, partially offset by GM Korea hourly wage litigation of $577 million andacquisition of GM Korea preferred shares of $67 million in GMIO, all net of noncontrolling interests; Venezuela currency devaluation charges of $162 million inGMSA; gain on sale of equity investment in Ally Financial of $483 million in Corporate; costs related to the withdrawal of the Chevrolet brand in Europe of $15million in GM Financial; and income related to various insurance recoveries of $35 million.
131

GENERAL MOTORS COMPANY AND SUBSIDIARIES
NOTES TO CONSOLIDATED FINANCIAL STATEMENTS — (Continued)
At and For the Year Ended December 31, 2012
GMNA GME GMIO GMSA Corporate EliminationsTotal
AutomotiveGM
Financial Eliminations Total
SalesExternal customers . . . . . . . . . . . $ 89,912 $ 23,055 $ 20,588 $ 16,700 $ 40 $ 150,295 $ — $ — $ 150,295GM Financial revenue . . . . . . . . . — — — — — — 1,961 — 1,961Intersegment . . . . . . . . . . . . . . . . (2) — — — — (2) — 2 —
Total net sales and revenue . . . . . $ 89,910 $ 23,055 $ 20,588 $ 16,700 $ 40 $ 150,293 $ 1,961 $ 2 $ 152,256
Income (loss) before interest andtaxes-adjusted . . . . . . . . . . . . . $ 6,470 $ (1,949) $ 2,538 $ 457 $ (400) $ 7,116 $ 744 $ (1) $ 7,859
Adjustments (a) . . . . . . . . . . . . . . $ (29,052) $ (6,389) $ (290) $ 27 $ (402) $ (36,106) $ — $ — (36,106)Automotive interest income . . . . . 343Automotive interest expense . . . . (489)Loss on extinguishment of
debt . . . . . . . . . . . . . . . . . . . . . (250)Net loss attributable to
noncontrolling interests . . . . . . (52)
Loss before income taxes . . . . . . $ (28,695)
Equity in net assets ofnonconsolidated affiliates . . . . $ 65 $ 159 $ 6,656 $ 3 $ — $ — $ 6,883 $ — $ — $ 6,883
Total assets . . . . . . . . . . . . . . . . . $ 87,100 $ 10,475 $ 24,147 $ 11,958 $ 16,991 $ (16,927) $ 133,744 $ 16,368 $ (690) $ 149,422Expenditures for property . . . . . . $ 4,766 $ 1,075 $ 1,185 $ 956 $ 77 $ (4) $ 8,055 $ 13 $ — $ 8,068Depreciation, amortization and
impairment of long-lived assetsand finite-lived intangibleassets . . . . . . . . . . . . . . . . . . . . $ 3,663 $ 6,584 $ 624 $ 483 $ 49 $ (1) $ 11,402 $ 225 $ (10) $ 11,617
Equity income . . . . . . . . . . . . . . . $ 9 $ 35 $ 1,517 $ 1 $ — $ — $ 1,562 $ — $ — $ 1,562Valuation allowances against
deferred tax assets (b) . . . . . . . $ — $ — $ — $ — $ (36,261) $ — $ (36,261) $ (103) $ — $ (36,364)
(a) Consists primarily of Goodwill impairment charges of $26.4 billion, pension settlement charges of $2.7 billion and income related to various insurance recoveriesof $9 million in GMNA; property impairment charges of $3.7 billion, intangible assets impairment charges of $1.8 billion, goodwill impairment charges of $590million, impairment charges related to investment in PSA of $220 million, a charge of $119 million to record General Motors Strasbourg S.A.S. assets andliabilities to estimated fair value and income related to various insurance recoveries of $9 million in GME; GM Korea hourly wage litigation charge of $336million, goodwill impairment charges of $132 million, which are presented net of noncontrolling interests, income related to various insurance recoveries of $110million and income related to redemption of the GM Korea mandatorily redeemable preferred shares of $68 million in GMIO; income related to various insurancerecoveries of $27 million in GMSA; and a charge of $402 million which represents the premium paid to purchase our common stock from the UST in Corporate.
(b) Includes valuation allowance releases of $36.5 billion net of the establishment of new valuation allowances of $0.1 billion. Amounts exclude changes related toincome tax expense (benefits) in jurisdictions with a full valuation allowance throughout the period.
Automotive revenue is attributed to geographic areas based on the country in which our subsidiary is located. AutomotiveFinancing revenue is attributed to the geographic area where the financing is originated. The following table summarizes informationconcerning principal geographic areas (dollars in millions):
At and For the Years Ended December 31,
2014 2013 2012
Net Sales &Revenue
Long-LivedAssets
Net Sales &Revenue
Long-LivedAssets
Net Sales &Revenue
Long-LivedAssets
AutomotiveU.S. . . . . . . . . . . . . . . . . . . . . . . . . . . . . . . . . . . . . $ 93,559 $ 18,813 $ 88,784 $ 15,844 $ 85,105 $ 13,520Non-U.S. . . . . . . . . . . . . . . . . . . . . . . . . . . . . . . . . 57,533 12,355 63,308 12,289 65,190 12,425
GM FinancialU.S. . . . . . . . . . . . . . . . . . . . . . . . . . . . . . . . . . . . . 2,549 5,477 2,233 2,472 1,832 1,112Non-U.S. . . . . . . . . . . . . . . . . . . . . . . . . . . . . . . . . 2,288 1,755 1,102 1,043 129 590
Total consolidated . . . . . . . . . . . . . . . . . . . . . . . . . . . $ 155,929 $ 38,400 $ 155,427 $ 31,648 $ 152,256 $ 27,647
132

GENERAL MOTORS COMPANY AND SUBSIDIARIES
NOTES TO CONSOLIDATED FINANCIAL STATEMENTS — (Continued)
No individual country other than the U.S. represented more than 10% of our total Net sales and revenue or Long-lived assets.
Note 26. Supplemental Information for the Consolidated Statements of Cash Flows
The following table summarizes the sources (uses) of cash provided by Change in other operating assets and liabilities and cashpaid for income taxes and interest (dollars in millions):
Years Ended December 31,
2014 2013 2012
Accounts receivable . . . . . . . . . . . . . . . . . . . . . . . . . . . . . . . . . . . . . . . . . . . . . . . . . . . . . . . . . . . . . . . $ (1,248) $ 8 $ (460)Purchases of wholesale receivables, net . . . . . . . . . . . . . . . . . . . . . . . . . . . . . . . . . . . . . . . . . . . . . . . (2,000) — —Inventories . . . . . . . . . . . . . . . . . . . . . . . . . . . . . . . . . . . . . . . . . . . . . . . . . . . . . . . . . . . . . . . . . . . . . . (309) 59 (326)Automotive equipment on operating leases . . . . . . . . . . . . . . . . . . . . . . . . . . . . . . . . . . . . . . . . . . . . . (1,949) (968) 370Change in other assets . . . . . . . . . . . . . . . . . . . . . . . . . . . . . . . . . . . . . . . . . . . . . . . . . . . . . . . . . . . . . (213) (563) (312)Accounts payable . . . . . . . . . . . . . . . . . . . . . . . . . . . . . . . . . . . . . . . . . . . . . . . . . . . . . . . . . . . . . . . . . 19 (485) 162Income taxes payable . . . . . . . . . . . . . . . . . . . . . . . . . . . . . . . . . . . . . . . . . . . . . . . . . . . . . . . . . . . . . . (145) (161) 155Accrued liabilities and other liabilities . . . . . . . . . . . . . . . . . . . . . . . . . . . . . . . . . . . . . . . . . . . . . . . . 6,089 784 1,041
Total . . . . . . . . . . . . . . . . . . . . . . . . . . . . . . . . . . . . . . . . . . . . . . . . . . . . . . . . . . . . . . . . . . . . . . . . . . . $ 244 $ (1,326) $ 630
Cash paid for income taxes and interestCash paid for income taxes . . . . . . . . . . . . . . . . . . . . . . . . . . . . . . . . . . . . . . . . . . . . . . . . . . . . . . . . . $ 947 $ 727 $ 575Cash paid for interest (net of amounts capitalized) — Automotive . . . . . . . . . . . . . . . . . . . . . . . . . . $ 301 $ 299 $ 335Cash paid for interest (net of amounts capitalized) — GM Financial . . . . . . . . . . . . . . . . . . . . . . . . . 1,120 760 298
Total cash paid for interest (net of amounts capitalized) . . . . . . . . . . . . . . . . . . . . . . . . . . . . . . . . . . . $ 1,421 $ 1,059 $ 633
* * * * * * *
133

GENERAL MOTORS COMPANY AND SUBSIDIARIES
Disclosure Controls and Procedures
We maintain disclosure controls and procedures designed to provide reasonable assurance that information required to be disclosedin reports filed under the Securities Exchange Act of 1934, as amended (Exchange Act) is recorded, processed, summarized andreported within the specified time periods and accumulated and communicated to our management, including our principal executiveofficer and principal financial officer, as appropriate to allow timely decisions regarding required disclosure.
Our management, with the participation of our CEO and Executive Vice President and CFO, evaluated the effectiveness of ourdisclosure controls and procedures (as defined in Rules 13a-15(e) or 15d-15(e) promulgated under the Exchange Act) at December 31,2014. Based on these evaluations, our CEO and CFO concluded that our disclosure controls and procedures required by paragraph(b) of Rules 13a-15 or 15d-15 were effective as of December 31, 2014.
Management’s Report on Internal Control over Financial Reporting
Our management is responsible for establishing and maintaining effective internal control over financial reporting as defined inRules 13a-15(f) and 15d-15(f) under the Exchange Act. This system is designed to provide reasonable assurance regarding thereliability of financial reporting and the preparation of consolidated financial statements for external purposes in accordance with U.S.GAAP. Because of the inherent limitations of internal control over financial reporting, including the possibility of collusion orimproper management override of controls, misstatements due to error or fraud may not be prevented or detected on a timely basis.
Our management performed an assessment of the effectiveness of our internal control over financial reporting at December 31,2014, utilizing the criteria discussed in the “Internal Control — Integrated Framework (2013)” issued by the Committee ofSponsoring Organizations of the Treadway Commission. The objective of this assessment was to determine whether our internalcontrol over financial reporting was effective at December 31, 2014. Based on management’s assessment, we have concluded that ourinternal control over financial reporting was effective at December 31, 2014.
The effectiveness of our internal control over financial reporting has been audited by Deloitte & Touche LLP, an independentregistered public accounting firm, as stated in its report which is included herein.
Changes in Internal Controls
We have commenced several transformation initiatives to centralize and simplify our business processes and systems. These arelong-term initiatives which we believe will enhance our internal controls over financial reporting due to increased automation andfurther integration of related processes. We will continue to monitor our internal controls over financial reporting throughout thetransformation.
There have not been any other changes in our internal control over financial reporting during the three months ended December 31,2014 that have materially affected, or are reasonably likely to materially affect, our internal control over financial reporting.
/s/ MARY T. BARRA /s/ CHARLES K. STEVENS III
Mary T. BarraChief Executive Officer
Charles K. Stevens IIIExecutive Vice President and Chief Financial Officer
February 4, 2015 February 4, 2015
* * * * * * *
134

GENERAL INFORMATION
COMMON STOCKGM common stock, $0.01 par value, is listed on the New York Stock Exchange and the Toronto Stock Exchange.
Ticker symbol: GM - New York Stock Exchange GMM - Toronto Stock Exchange
ANNUAL MEETINGThe GM Annual Meeting of Stockholders will be held at 9:30 a.m. ET on Tuesday, June 9, 2015, in Detroit, Michigan.
STOCKHOLDER ASSISTANCE Stockholders of record requiring information about their accounts should contact: Computershare Trust Company, N.A. General Motors Company P.O. Box 43078 Providence, Rl 02940-3078
888-887-8945 or 781-575-3334 (from outside the United States, Canada or Puerto Rico)
Computershare representatives are available Monday through Friday from 9 a.m. to 6 p.m. ET. Automated phone service and the Computershare website at www.computershare.com/gm are always available.
For other information, stockholders may contact: GM Stockholder Services General Motors Company Mail Code 482-C25-A36 300 Renaissance Center P.O. Box 300 Detroit, Ml 48265-3000 313-667-1500
ELECTRONIC DELIVERY OF ANNUAL MEETING MATERIALS Stockholders may consent to receive their GM annual report and proxy materials via the Internet. Stockholders of record may enroll at www.computershare.com/gm. If your GM stock is held through a broker, bank or other nominee, contact them directly.
SECURITIES AND INSTITUTIONAL ANALYST QUERIESGM Investor Relations General Motors Company Mail Code 482-C29-D36 300 Renaissance Center P.O. Box 300 Detroit, Ml 48265-3000 313-667-1669
AVAILABLE PUBLICATIONS GM’s Annual Report, Proxy Statement, Forms 10-K and 10-Q and Winning With Integrity (code of conduct) are available online at www.gm.com/investors.
Printed copies may be requested on our website or from GM Stockholder Services at the address listed above (allow four to six weeks for delivery of materials).
VISIT GM ON THE INTERNETLearn more about General Motors vehicles and services on our website at www.gm.com.
GM CUSTOMER ASSISTANCE CENTERS Satisfaction with your entire owner ship experience is important to us. To request product information or to receive assistance with your vehicle, please contact the appropriate brand via phone or Twitter:
Buick: 800-521-7300 or @BuickCustCare Cadillac: 800-458-8006 or @CadillacCustSvc Chevrolet: 800-222-1020 or @ChevyCustCare GMC: 800-462-8782 or @GMCCustCare HUMMER: 800-732-5493 or @GMCustomerSvc Oldsmobile: 800-442-6537 or @GMCustomerSvc Pontiac: 800-762-2737 or @GMCustomerSvc Saab: 800-955-9007 or @GMCustomerSvc Saturn: 800-553-6000 or @GMCustomerSvc
GM of Canada: 800-263-3777 GM Mobility: 800-323-9935
OTHER PRODUCTS AND SERVICESGM Card: 800-846-2273OnStar: 888-667-8277
PRINCIPAL OFFICE
General Motors Company 300 Renaissance Center P.O. Box 300 Detroit, MI 48265-3000 313-556-5000
Printed on paper that consists of 10% post-consumer fiber

3 0 0 R E N A I S S A N C E C E N T E R P . O . B O X 3 0 0
D E T R O I T , M I 4 8 2 6 5 - 3 0 0 0
W W W . G M . C O M


![Biotech Reinvented[1]](https://img.pdfslide.us/doc/110x75/577d2fb91a28ab4e1eb27874/biotech-reinvented1.jpg)