Embed Size (px)
Citation preview

Page 1/15
Comparison and toxicity assessment of co-compostingprocess by pistachio wastes and date-palm straw combinedwith municipal sewage sludgeHabibe Jafariniya Parizi
Shahid Sadoughi University of Medical Sciences and Health ServicesMehdi Mokhtari
Shahid Sadoughi University of Medical Sciences and Health ServicesHadi Eslami ( [email protected] )
Rafsanjan University of Medical Sciences https://orcid.org/0000-0001-5137-4764Farzan Madadizadeh
Shahid Sadoughi University of Medical Sciences and Health ServicesMahrokh Jalili
Shahid Sadoughi University of Medical Sciences and Health ServicesMohammad Mobini
Rafsanjan University of Medical SciencesAbdolreza Nassab Hosseini
Rafsanjan University of Medical SciencesAli Asghar Ebrahimi ( [email protected] )
Shahid Sadoughi University of Medical Sciences and Health Services
Research Article
Keywords: Co-composting, Pistachio Waste, Palm Straw, Municipal Sewage Sludge
Posted Date: June 8th, 2021
DOI: https://doi.org/10.21203/rs.3.rs-499610/v1
License: This work is licensed under a Creative Commons Attribution 4.0 International License. Read Full License

Page 2/15
AbstractThis study aimed to toxicity evaluate and compare the new co-composting process of pistachio dehulling waste combined withmunicipal sewage sludge (PW + SS) and date-palm straw combined with municipal sewage sludge (PS + SS). The process wasevaluated over a 60-day period. During the process, physicochemical parameters (temperature, humidity, pH, electricalconductivity (EC), carbon to nitrogen ratio (C/N), ash and organic carbon (OC)), microbial indicators (parasite eggs, salmonella, E.coli), heavy metals (copper, zinc, Iron, manganese, lead, cadmium, nickel), and germination index were measured. The resultsshowed that in the PW + SS reactor the maximum temperature reached 59°C on the 32th day and in the PS + SS reactor reached39°C on 18th day. The pH level in PW + SS reached a minimum of 3.2 on the 14th day and then increased and �nally reached amaximum of 9.5. The pH level in PS + SS had an increasing trend and �nally reached 7.1. Ash percentage had an increasingtrend in PW + SS and �nally reached 27.5 and reached 19.1 in PS + SS (p = 0.038). EC, C/N and OC in both reactors had asigni�cant decreasing trend. E. coli microbial indicator in both reactors decreased from ≥ 105 to zero at the end of the process.The amounts of heavy metals in both reactors had an increasing trend and were within the standard range. Toxicity assessmentshowed that the PS + SS compost was 100% in all concentrations and the PW + SS compost reached 100% by dilution; therefore,the product of PS + SS was less toxic than the product of PW + SS.
IntroductionIn recent years, there has been a signi�cant increase in the production of various wastes, which has increased the production ofpollutants and created a worrying situation for public health and the global environment (Esmaeili et al. 2020). With the ever-increasing global demand for food, global grain production will increase by about 50% by 2050, leading to the production of largequantities of residues (Ajmal et al. 2020). According to the Food and Agriculture Organization (FAO), about 1.3 billion tons offood waste or garbage is disposed at land�lls each year. Food waste is typically low in calories, high in water, and highlyperishable (Ajmal et al. 2020). Biodegradable waste is the main part of municipal waste and can cause signi�cant environmentalhazards if not treated properly (Girón-Rojas et al. 2020). Disposal of organic waste by land�ll and incineration may cause seriousenvironmental problems, such as gas emissions (Zhou et al. 2019). Every year, due to the increase in agricultural activities tomeet world's growing demand for food, there is a signi�cant increase in waste production in the agricultural sector (Sahu et al.2020). The Middle East is the largest producer of dates in the world, and after Iraq, Saudi Arabia, and Egypt, Iran is the fourthlargest producer of this food in this region. In order to harvest dates with good quality, palms should be pruned every year and thewaste from each palm is on average about 17–34 kg. Large volumes of this waste are incinerated. On the other hand, usingagricultural waste in order to protect the environment is of great importance (Shirani et al. 2011). According to the availablestatistics in Iran, due to the lack of conversion industries, half of the agricultural products are destroyed (Zhao et al. 2015). Thevolume of pistachio production in Iran is more than 575 thousand tons at each year (Jalili et al. 2016). Kerman province is one ofthe arid and semi-arid regions of Iran with poor soils in terms of organic matter and the main pole of one of the most importantagricultural products, namely pistachios. After harvesting pistachio crops, its waste is left which has no economic value(Esmaeili et al. 2020). Pistachio dehulling waste due to its high perishability, if not disposed of hygienically, will causeenvironmental pollution (Ahanchi et al. 2018). Using continuous chemical fertilizers in agricultural lands, by changing theproperties of the soil, leads to soil contamination and soil contamination in turn causes erosion of agricultural lands(Geethamani et al. 2020). Sewage sludge contains valuable sources of organic matter and nutrients (Rashad et al. 2010).Composting is a very acceptable method for converting organic waste into a sustainable product that is non-toxic and non-pathogenic and can be used as a suitable fertilizer for plant growth (Toledo et al. 2020). The direct use of sewage sludge inagriculture has been limited due to the presence of pathogens, improper fermentation of organic waste and the presence ofheavy metals, organic and inorganic contaminants in the sludge (Meng et al. 2020). Composting is an important and widely usedmethod to convert fertilizer into a sustainable organic fertilizer and is an opportunity to close the gap between livestock andagricultural systems and reduce the risk of environmental pollution through managing livestock manure from the animalhusbandry industry (Sahu et al. 2020). Co-composting of sewage sludge combined with other wastes is an important and vitaltechnology leading to the reuse of wastes and also their safe and hygienic disposal. Production of compost from sewage sludgealone is of low quality due to its high humidity and low amount of organic carbon. Therefore, the applying sewage sludgecompost alone is not a priority. Composting sewage sludge combined with animal waste and excrement as bulking agents began
Page 3/15
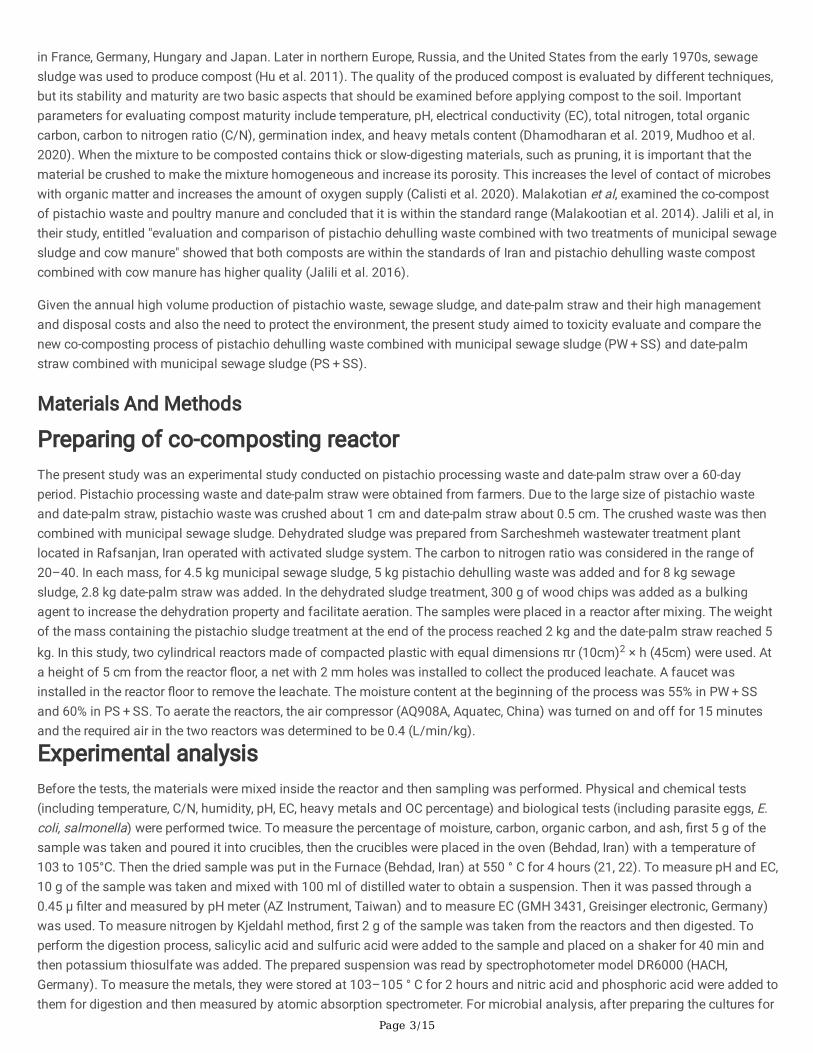
in France, Germany, Hungary and Japan. Later in northern Europe, Russia, and the United States from the early 1970s, sewagesludge was used to produce compost (Hu et al. 2011). The quality of the produced compost is evaluated by different techniques,but its stability and maturity are two basic aspects that should be examined before applying compost to the soil. Importantparameters for evaluating compost maturity include temperature, pH, electrical conductivity (EC), total nitrogen, total organiccarbon, carbon to nitrogen ratio (C/N), germination index, and heavy metals content (Dhamodharan et al. 2019, Mudhoo et al.2020). When the mixture to be composted contains thick or slow-digesting materials, such as pruning, it is important that thematerial be crushed to make the mixture homogeneous and increase its porosity. This increases the level of contact of microbeswith organic matter and increases the amount of oxygen supply (Calisti et al. 2020). Malakotian et al, examined the co-compostof pistachio waste and poultry manure and concluded that it is within the standard range (Malakootian et al. 2014). Jalili et al, intheir study, entitled "evaluation and comparison of pistachio dehulling waste combined with two treatments of municipal sewagesludge and cow manure" showed that both composts are within the standards of Iran and pistachio dehulling waste compostcombined with cow manure has higher quality (Jalili et al. 2016).
Given the annual high volume production of pistachio waste, sewage sludge, and date-palm straw and their high managementand disposal costs and also the need to protect the environment, the present study aimed to toxicity evaluate and compare thenew co-composting process of pistachio dehulling waste combined with municipal sewage sludge (PW + SS) and date-palmstraw combined with municipal sewage sludge (PS + SS).
Materials And Methods
Preparing of co-composting reactorThe present study was an experimental study conducted on pistachio processing waste and date-palm straw over a 60-dayperiod. Pistachio processing waste and date-palm straw were obtained from farmers. Due to the large size of pistachio wasteand date-palm straw, pistachio waste was crushed about 1 cm and date-palm straw about 0.5 cm. The crushed waste was thencombined with municipal sewage sludge. Dehydrated sludge was prepared from Sarcheshmeh wastewater treatment plantlocated in Rafsanjan, Iran operated with activated sludge system. The carbon to nitrogen ratio was considered in the range of20–40. In each mass, for 4.5 kg municipal sewage sludge, 5 kg pistachio dehulling waste was added and for 8 kg sewagesludge, 2.8 kg date-palm straw was added. In the dehydrated sludge treatment, 300 g of wood chips was added as a bulkingagent to increase the dehydration property and facilitate aeration. The samples were placed in a reactor after mixing. The weightof the mass containing the pistachio sludge treatment at the end of the process reached 2 kg and the date-palm straw reached 5kg. In this study, two cylindrical reactors made of compacted plastic with equal dimensions πr (10cm)2 × h (45cm) were used. Ata height of 5 cm from the reactor �oor, a net with 2 mm holes was installed to collect the produced leachate. A faucet wasinstalled in the reactor �oor to remove the leachate. The moisture content at the beginning of the process was 55% in PW + SSand 60% in PS + SS. To aerate the reactors, the air compressor (AQ908A, Aquatec, China) was turned on and off for 15 minutesand the required air in the two reactors was determined to be 0.4 (L/min/kg).
Experimental analysisBefore the tests, the materials were mixed inside the reactor and then sampling was performed. Physical and chemical tests(including temperature, C/N, humidity, pH, EC, heavy metals and OC percentage) and biological tests (including parasite eggs, E.coli, salmonella) were performed twice. To measure the percentage of moisture, carbon, organic carbon, and ash, �rst 5 g of thesample was taken and poured it into crucibles, then the crucibles were placed in the oven (Behdad, Iran) with a temperature of103 to 105°C. Then the dried sample was put in the Furnace (Behdad, Iran) at 550 ° C for 4 hours (21, 22). To measure pH and EC,10 g of the sample was taken and mixed with 100 ml of distilled water to obtain a suspension. Then it was passed through a0.45 µ �lter and measured by pH meter (AZ Instrument, Taiwan) and to measure EC (GMH 3431, Greisinger electronic, Germany)was used. To measure nitrogen by Kjeldahl method, �rst 2 g of the sample was taken from the reactors and then digested. Toperform the digestion process, salicylic acid and sulfuric acid were added to the sample and placed on a shaker for 40 min andthen potassium thiosulfate was added. The prepared suspension was read by spectrophotometer model DR6000 (HACH,Germany). To measure the metals, they were stored at 103–105 ° C for 2 hours and nitric acid and phosphoric acid were added tothem for digestion and then measured by atomic absorption spectrometer. For microbial analysis, after preparing the cultures for

Page 4/15
fecal coliforms, the multi-tube fermentation method and A1 culture medium were used. In this method, different dilutions of 1,0.1, and 0.01 were used, then the tubes were used in water bath conditions at 44.5°C for 20–24 hours. Zinc sulfate solution wasalso used to measure the parasite eggs for preparing the suspension. First, sulfate solution was poured into half of the tube, thenabout 1 g of the sample was poured into the tube and the suspension was prepared using an applicator. The preparedsuspension was passed through a double layer �lter paper to �lter the solution, then the �ltered solution was returned to the tubeand until the solution surface reached 2–3 mm of the tube mouth. The tube was placed in a centrifuge at 3000 rpm for oneminute. After centrifugation, it was placed under a microscope using a lam impregnated with lugol reagent. To measure thenumber of salmonella, some of the sample was �rst placed in peptone water medium and after 24 hours of incubation, in case ofmicrobial growth in the medium, it was inoculated into Rappaport-Vassiliadis Salmonella Enrichment broth (RVS) andtetrathionate broth culture medium. After 24 hours, it was cultured in water bath in Salmonella Shigella (SS) Agar medium toinhibit bacterial species other than salmonella. The amount of salmonella was calculated as MPN/4g dry weight (Jalili et al.2019).
Toxicity Assessment (germination index)To measure the germination index, the compost was mixed with distilled water in a ratio of 1:5. It was placed on a shaker for 30min to obtain a suspension, then passed through a �lter paper. Ten ml of the suspension was poured into a sterilized plate(containing a piece of paper at the bottom of the plate) and 10 cress seeds were added and kept in the dark at 25°C for 48 hours.The number of germinated seeds was then counted and measured (Luo et al. 2018).
GI=(sgcompost)/(sgwater) ×100
GI = germination index
sg = number of germination indices
Data analysisMean, standard deviation, median, and interquartile range indices were used to perform descriptive statistics. To performinferential statistics and compare quantitative study variables (including temperature, humidity, ash and OC percentage, C/N, pH,EC, heavy metals, parasite eggs, salmonella, E. coli, germination index) in the two reactors (PW + SS and PS + SS) Mann-Whitneynon-parametric test was used. All analyses were performed in SPSS software version 16 and the signi�cance level in all testswas considered 0.05.
Results And DiscussionThe co-compost characteristics of PW + SS and PS + SS are given in Table 1. According to the results of Table 1, the changes ofmoisture, C/N, ash and OC percentage were statistically signi�cant (p < 0.05). There was no statistically signi�cant difference inthe other parameters. The results of microbiological tests also showed that the number of E. coli in the two reactors was > 105,which had a decreasing trend during the process and reached zero in the �nal product. The number of parasite eggs andsalmonella in both reactors in the initial raw mixture and �nal product after the process was zero.

Page 5/15
Table 1Physicochemical and microbial parameters in co-composting process by PW + SS and PS + SS reactors
Parameter PS + SS PW + SS p-value
Mean ± standarddeviation(initial)
Maximum Minimum maturecompost(�nal)
Mean ± standarddeviation(initial)
Maximum Minimum maturecompost(�nal)
Humidity(%)
1.55 ± 58.7
60 50 50 4.73 ± 50.1
55 40 40 p < 0.05
pH 0.44 ± 6.8 7.2 6 7 1.98 ± 7 9.5 3.2 9.5 p > 0.05
EC (mmhose/cm)
1.3 ± 3.2 6.2 2 2.3 1.52 ± 3.8
6.1 1.6 3.2 p > 0.05
Temperature(ċ)
3.96 ± 32 40 23.5 26 10.42 ± 37
59 17 27 p > 0.05
Ratio C/N 4.82 ± 30.65
37 23 23 4.07 ± 18.65
24.5 13.26 13.26 p < 0.05
Ash (%) 1.24 ± 17.23
19.01 15.5 19.01 4.18 ± 21.3
27.5 16.32 27.5 p < 0.05
Volatilematter (%)
12.14 ± 61.9
77.47 47.6 47.6 19.72 ± 40.02
67.5 17 17 p < 0.05
E. Coli 41802.02 ± 31431.4
> 100000 0 0 37351.7 ± 25715.7
> 100000 0 0 p > 0.05
Salmonella 0 - - 0 0 - - 0 -
Parasiteeggs
0 - - 0 0 - - 0 -
Temperature and humidity changesOne of the important factors in composting and eliminating pathogens is temperature (Awasthi et al. 2015). Figure 1a reveals thetemperature changes during the composting process of PW + SS and PS + SS reactors over a 60-day period. On the 2nd day ofthe process in both reactors, a signi�cant increase in temperature occurred in the masses. This rate was higher in the PW + SSreactor than in the PS + SS reactor. The PS + SS reactor reached its maximum temperature on the 20th day (40°C) and the PW + SS reactor reached its maximum temperature on the 32th day (57°C). Then the temperature in the masses began to decrease,which on the 60th day reached 25°C in the PW + SS and 27°C in the PS + SS. According to the changes shown in the �gure, thesechanges were not statistically signi�cant (p = 0.5) and the interquartile range for PW + SS and PS + SS reactors were 15.75 and3.5, respectively. The temperature in the PW + SS reactor was better than the PS + SS reactor. The results of Shirani et al,regarding the evaluation and comparison of municipal composting and vermicomposting, showed that the temperature increasein the mass was good and organic matter decomposition was performed well (Shirani et al. 2011). Jalili et al, reported that in thepistachio dehulling waste and cow manure pilot, the temperature reached above 50°C, corresponding to the pistachio dehullingwaste reactor combined with municipal sewage sludge and in the pilot of pistachio dehulling waste and municipal sewagesludge, the temperature reached below 50°C, corresponding to the municipal sewage sludge combined with the date-palm strawreactor (Jalili et al. 2016).
Another important factor in composting is moisture content. Figure 1b shows the moisture changes during the compostingprocess in the PW + SS and PS + SS reactors. In the PW + SS reactor, the moisture percentage was 55% and in the PS + SS reactor,due to the type of straw (due to the high lignocellulose content), a higher moisture content (60%) was considered compared tothe pistachio dehulling waste content (Usman et al. 2015). In a 60-day period, the moisture content in the PW + SS reactordecreased from 55–43% and in the PS + SS reactor the moisture content decreased from 60–54%. The results showed that the

Page 6/15
PS + SS reactor needed more time to lose moisture. Due to the changes in humidity during the composting process in the tworeactors, the moisture percentage decreased signi�cantly (p ≤ 0.001) and the interquartile range for the PW + SS and PS + SSreactors was 9.4 and 2.05, respectively. Xuejiang et al, evaluated the changes in humidity and temperature in the compostingprocess by windrow method and concluded that the compost temperature reached 62°C and the humidity reached 35% on the9th day (Xuejiang et al. 2008). Jalili et al, conducted a study on two pilots of composting pistachio dehulling waste combinedwith municipal sewage sludge and cow manure. They concluded that the appropriate humidity content to start the compostingprocess was 50% and the cow manure reactor was in better condition than municipal sewage. To prevent fungus formation andbetter dehydrating, they added 15% by weight of sawdust, which is consistent with the results of the present study (Jalili et al.2019).
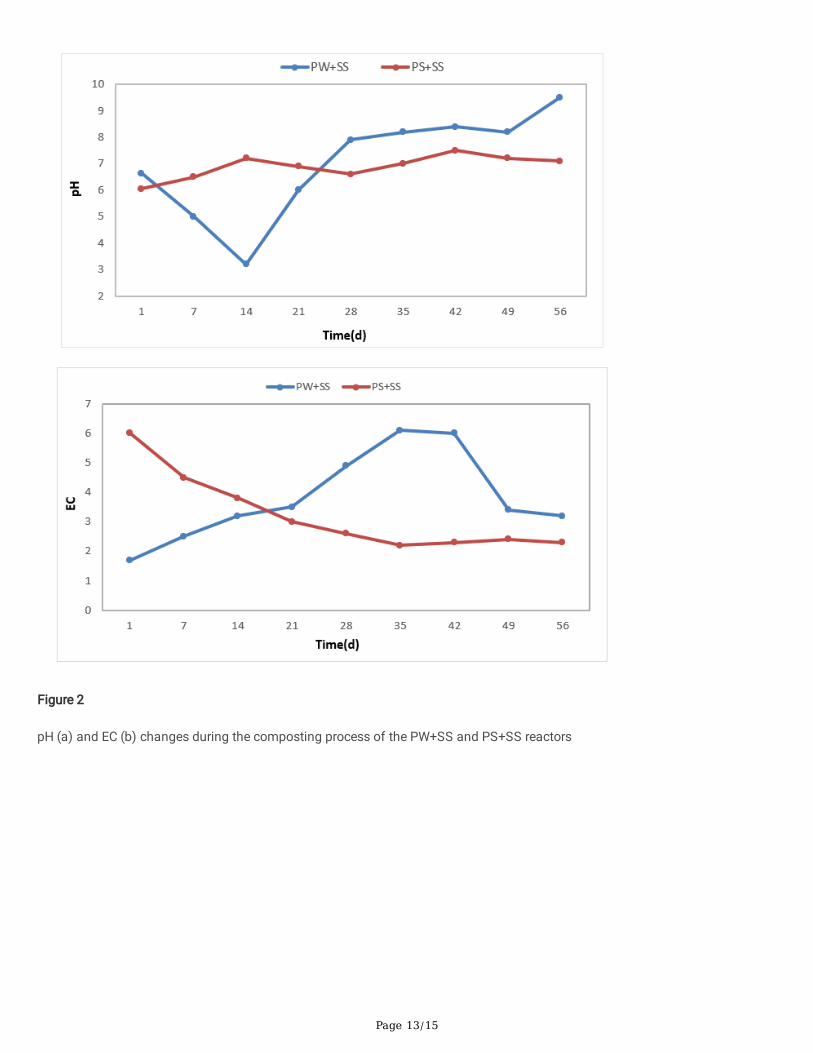
PH and EC changesFigure 2a shows the pH changes during the composting process in the PW + SS and PS + SS reactors. pH is affected by the rawmaterials used in the compost. As the process begins and bacterial activity increases, and organic acids are produced, the pHincreases. pH of the PW + SS reactor reached 3 on the 14th day and then increased, and in the PS + SS reactor reached 7.2 on the14th day and 6.6 on the 28th and had decreasing trend). Then, by entering the secondary mesophilic phase, the reactors pHincreased. The �nal pH value in the PW + SS was 5.9 and in the PS + SS reactor was 7. According to the Fig. 2a, pH changes werenot statistically signi�cant (p = 0.5) and the interquartile range for PW + SS and PS + SS reactors were 2.8 and 0.65, respectively.Rama et al. in their study concluded that the increase in pH was from 40 to 70% and in the �nal value was between 8 and 9(Rama &Vasanthy 2014). Brito et al, in their study reported that pH changes were from 6.9 to 9.9, which was consistent with theresults of the present study (Brito et al. 2012).
The EC is one of the important parameters in the composting process examined during the process. Figure 2b shows the ECchanges during the composting process in the PW + SS and PS + SS reactors. EC changes in PS + SS reactor had decreasingtrend from the beginning (from 6 mmhose/cm to 2.5 mmhose/cm) and in PW + SS reactor initially had an increasing trend (from2 mmhose/cm to 6 mmhose/cm 6) and after the 40th day had a decreasing trend (from 6 mmhose/cm to 3 mmhose/cm).According to the �gure, EC changes were not statistically signi�cant (p = 0.2) and the interquartile ranges for PW + SS and PS + SS reactors were 2.6 and 1.8, respectively. This �nding was consistent with the results of Malakotian et al, in which the EC ratedecreased from 14.34 ds/m to 11.91 ds/m after 30 days (a decreasing trend for pistachios) (Malakootian et al. 2014). However,the present study �nding was not in line with Jalili's study, in which the EC rate increased from 1.2 ds/m to 2.9 ds/m in thereactor of pistachio waste combined with municipal sewage sludge treatment and decreased from 1.4 ds/m to 1.3 ds/m in thereactor of pistachio combined with cattle manure (Jalili et al. 2019).
C/N changesFigure 3 reveals the C/N changes during the composting process in the PW + SS and PS + SS reactors. The C/N ratio in the PW + SS and PS + SS reactors was in the range of 20 to 40. At the beginning of the process, the C/N ratio was 24.5 in the PW + SSreactor and 37.5 in the PS + SS reactor. C/N changes in both reactors had a decreasing trend from 25 to 15 in the PW + SS reactorand from 37 to 23 in the PS + SS reactor. According to Fig. 3, the C/N ratio had further decreased in the PW + SS reactor. Thechanges were statistically signi�cant (p ≤ 0.001) and the interquartile range for PW + SS and PS + SS reactors was 15.75 and 3.5,respectively and for PW + SS and PS + SS reactors were 7.86 and 1.85, respectively. The decreasing trend in C/N ratio in thisstudy is in consistent with others similar studies (Esmaeili et al. 2020, Jalili et al. 2019). The C/N rate in the PW + SS reactor wasin the standard range and the PS + SS reactor needed more time to reach the standard (Brinton 2000).
Percentages of organic carbon and ashFigure 4a shows the changes in the percentage of OC during the composting process of the PW + SS and PS + SS reactors. Thepercentage changes of OC in the PW + SS reactor decreased from 69 to 15 and in the PS + SS reactor from 78 to 48. The trend ofchanges in OC in both reactors was signi�cantly (p = 0.031) decreasing. The interquartile range for PW + SS and PS + SS reactorswas 39.45 and 25.1, respectively. The percentage of decomposition and consumption of OC in the PW + SS reactor was higherthan the PS + SS reactor. Figure 4b reveals the ash percentage. According to the Fig. 4b, changes in ash percentage showed thatash content in both reactors had an increasing trend from 16 to 28 in the PW + SS reactor and from 16 to 20 in the PS + SS

Page 7/15
reactor. Changes in ash percentage in the two reactors were signi�cantly increasing (p = 0.038) and the interquartile range for PW + SS and PS + SS reactors was 7.74 and 2.39, respectively.
Heavy metals changesTable 2 shows the concentration of heavy metals in the initial composition and �nal product of composting in the PW + SS andPS + SS reactors. Copper (Cu) concentration in the PW + SS reactor increased from 112 to 161 ppm and in the PS + SS reactorfrom 206 to 338 ppm. According to the Iranian standard, the amount of Cu is in the range of 90 to 260, so although it had anincreasing trend, it was in the standard range; however, it was not in the standard range in the PS + SS reactor. According to thestandard Cu limit in the US EPA, which is a maximum of 100 ppm, both reactors were not within the international standard range.The concentration of Zn in the PW + SS and PS + SS reactors was (P ≤ 0.01) and up to the end did not change in both reactors (P ≤ 0/01). The standard concentration of Zn in Iran is 800 to 1200 ppm, and the concentration of Zn in both reactors was in thestandard range. The maximum standard Zn concentration in the US EPA is 300 ppm, which is within the standard range. Theamount of iron (Fe) at the beginning of the process in the PW + SS reactor was 0.63 ppm and at the end it was 0.99 ppm and inthe PS + SS reactor it initially increased from 1.21 to 1.79 ppm. The Iranian standard range of Fe in the compost is 800 to 1500%,so the amount of Fe in both reactors was less than the standard. The maximum amount of iron in the US EPA standard is 200ppm, which is within the international standard. Manganese (Mn) concentration in the PW + SS reactor was 0.02 ppm and at theend reached 0.03 ppm and in the PS + SS reactor it was initially 0.03 ppm and at the end reached 0.05 ppm. The standardconcentration of Mn in the compost is 2 to 12 ppm, so although it had an increasing trend, it was in the standard range. Theconcentration of lead in the PW + SS reactor at the beginning and end was 8 and 10 ppm, respectively, and in the PS + SS reactorat the beginning and end reached 18 to 31 ppm. The maximum concentration of lead in the US EPA standard is 100 ppm, whichis within the standard range. The concentration of cadmium (Cd) in the PW + SS reactor at the beginning and end of the processwas 0.29 and 0.33 ppm, respectively, and in the PS + SS reactor at the beginning and end reached 0.32 to 0.41 ppm. According tothe standard range of Cd concentration in the compost in Iran, which is 10 ppm, in both reactors it is in the standard range. TheUS EPA standard has set 3 as the maximum concentration of Cd, which is within the standard range. The concentration of nickel(Ni) in the PW + SS reactor at the beginning and end of the process was 12 and 50 ppm, respectively, and in the PS + SS reactor itincreased from 14 to 21 ppm. Iranian standard value for Ni is 120 ppm, so both of them were within the standard rangeaccording to the results. The maximum standard Ni concentration in USEPA is 50 ppm, which is within the standard range. Tandyet al, studied heavy metals on composting green and �brous waste and concluded that composting for more than 26 weeksreduced the availability of Ni, had no effect on Pb, and slightly increased Cu and Zn. As a result, the total concentrations of Cuand Ni in the compost have exceeded the legal guidelines for land use. However, due to their anti-salinity nature, compost poseslittle threat to soil or plant quality if used for agriculture or land reclamation (Tandy et al. 2009). Wang et al, conducted a study onthe use of lime on municipal sewage sludge compost and its effect on heavy metals. They concluded that it reduced nickel,copper, and manganese, but no signi�cant difference was found in the various forms of Pb. However, the residual form of Pbincreased by adding lime, and the predominant form of Zn was mainly oxidized, and lime further reduced this deformation.Therefore, lime is a suitable substance for composting with municipal sewage sludge to reduce heavy metals (Wang et al. 2013).Fernández et al, pointed out that in the composting process, due to the leachate recirculation and mass loss, the amount ofheavy metals is constantly increasing, which should be taken into account (Fernández et al. 2010). The concentration of heavymetals has changed due to the effect of concentration and mass loss after composting (Farrell &Jones 2009). Bolan et al,reported that the concentration of heavy metals varies with the type of fertilizer, suggesting that plant type may affectcomposting (Bolan et al. 2004). The mentioned studies are not consistent with the current study.

Page 8/15
Table 2Heavy metals concentrations at the beginning and end of the composting process in the PW + SS and PS + SS reactorsMetals (ppm) Initial (PW + SS reactor) Final (PW + SS reactor) Initial (PS + SS reactor) Final (PS + SS reactor)
Cu 112 161 206 338
Mn 0.02 0.03 0.03 0.05
Pb 8 10 18 31
Cd 0.29 0.33 0.32 0.41
Ni 12 50 14 21
Zn ≤ 0.01 ≤ 0.01 ≤ 0.01 ≤ 0.01
Fe 0.63 0.99 1.21 1.79
Toxicity assessment (germination index)Table 3 represents changes in the germination index for �nal compost in PW + SS and PS + SS. In the PS + SS reactor, no dilutionwas performed for the germination index test and the index percentage was measured with 10 cc of the compost extract, whichwas 100 in the PS + SS reactor. For the PW + SS reactor, dilution was performed with distilled water. In the PW + SS compost, theindex percentage was zero until dilution 4. Dilution 10 means (10 cc of the compost extract), dilution 9 means (9 cc of thecompost extract and 1 cc of distilled water), dilution 8 means (8 cc of the compost extract and 2 cc of distilled water), and so on.At a dilution of 1: 9%, the germination index was 100. In evaluating the toxicity, the PS + SS reactor was better than the PW + SSreactor. Due to changes in germination index percentage, it was not statistically signi�cant (p = 0.2). The results showed that PS + SS compost was better than PW + SS compost because the germination index of date-palm straw was 100%. However, the PW + SS reactor after dilution with distilled water showed different percentages at different dilutions. Asses et al, comparedmunicipal sewage sludge compost combined with olive waste and another municipal sewage sludge combined with greenwaste. The results showed that the germination indices for corn and tomato seeds for the �rst compost were 79.68% and 97.36%,respectively and for the second compost were 74.45% and 81.45%, respectively (Asses et al. 2018). Kebieche et al, studied theeffect of sawdust addition on municipal sewage sludge compost and germination index and concluded that the germinationindex was more than 80% (Kebibeche et al. 2019).
Table 3Germination indices in the PW + SS and PS + SS �nal compostFinal compost Dilution
(compost : water)
Germination index (%)
PW + SS 10 : 0 0
9 : 1 0
8 : 2 0
7 : 3 0
6 : 4 4
5 : 5 12
4 : 6 30
3: 7 60
2 : 8 90
1 : 9 100
PS + SS 10 : 0 100

Page 9/15
ConclusionDate-palm straw wastes were used for the �rst time in the composting process and were compared with pistachio wastes in a 60-day period. A greater increase in temperature was observed in the PW + SS reactor. The rate of moisture reduction was higher inthe reactor the PW + SS reactor compared to the PS + SS reactor. EC changes in both reactors were within the standard range. ThepH value in the PW + SS reactor was in the standard range; however, it was not in the standard range in the PS + SS reactor. Inboth reactors, the C/N ratio had a decreasing trend and in the PW + SS reactor it was in the standard range. It was not in thestandard range in the PS + SS reactor and required more time to decompose organic matter. The amount of heavy metals in bothreactors had an increasing trend. All metals were within the USEPA standard range, except copper metal which was not in thestandard range. The fecal coliform microbial index was < 105 at the beginning and reached zero at the end. Toxicity assessmentof the �nal product also showed that PS + SS compost was less toxic than PW + SS. According to the results, the �nal productquality of the PW + SS reactor was higher than PS + SS; however, the �nal product toxicity was lower in the PS + SS reactor.
DeclarationsEthics approval and consent to participate
Not applicable
Consent for publication
Not applicable
Availability of data and materials
Not applicable
Competing interests
The authors declare that they have no competing interests
Funding
This study was a part of a master's thesis in Shahid Sadoughi University of Medical Sciences, Yazd, approved with the ethicscode of IR.SSU.SPH.REC.1398.034 in 2020.
Authors' contributions
HJP, MJ, MM and ANH TZ tested and analysis the data. MM, HE, FM and AAE interpreted the data and contribute to writing thepaper. All authors read and approved the �nal manuscript.
Acknowledgments
This study was a part of a master's thesis in Shahid Sadoughi University of Medical Sciences, Yazd, approved with the ethicscode of IR.SSU.SPH.REC.1398.034 in 2020. It was supported by Rafsanjan University of Medical Sciences and Health Services.Thanks are owed to the staff of Sarcheshmeh water treatment plant and those who cooperated in conducting this study.
References1. Ahanchi M, Tabatabaei M, Aghbashlo M, Rezaei K, Talebi AF, Ghaffari A, Khoshnevisan B, Khounani Z (2018) Pistachio
(Pistachia vera) wastes valorization: enhancement of biodiesel oxidation stability using hull extracts of different varieties. JClean Prod 185:852–859
2. Ajmal M, Aiping S, Awais M, Ullah MS, Saeed R, Uddin S, Ahmad I, Zhou B, Zihao X (2020) Optimization of pilot-scale in-vessel composting process for various agricultural wastes on elevated temperature by using Taguchi technique and

Page 10/15
compost quality assessment. Process Saf. Environ. Prot
3. Asses N, Farhat A, Cherif S, Hamdi M, Bouallagui H (2018) Comparative study of sewage sludge co-composting with olivemill wastes or green residues: Process monitoring and agriculture value of the resulting composts. Process Saf Environ Prot114:25–35
4. Awasthi MK, Pandey AK, Bundela PS, Khan J (2015) Co-composting of organic fraction of municipal solid waste mixed withdifferent bulking waste: characterization of physicochemical parameters and microbial enzymatic dynamic. BioresourTechnol 182:200–207
5. Bolan N, Adriano D, Mahimairaja S (2004) Distribution and bioavailability of trace elements in livestock and poultry manureby-products. Crit Rev Environ Sci Technol 34:291–338
�. Brinton WF (2000) Compost quality standards and guidelines, Final Report by Woods End Research Laboratories. StateAssociation of Recyclers, for the New York
7. Brito LM, Mourão I, Coutinho J, Smith S (2012) Simple technologies for on-farm composting of cattle slurry solid fraction.Waste Manag 32:1332–1340
�. Calisti R, Regni L, Proietti P (2020) Compost-recipe: A new calculation model and a novel software tool to make thecomposting mixture. Journal of Cleaner Production, 122427
9. Dhamodharan K, Varma VS, Veluchamy C, Pugazhendhi A, Rajendran K (2019) Emission of volatile organic compoundsfrom composting: A review on assessment, treatment and perspectives. Sci Total Environ 695:133725
10. Esmaeili A, Khoram MR, Gholami M, Eslami H (2020) Pistachio waste management using combined composting-vermicomposting technique: Physico-chemical changes and worm growth analysis. J Clean Prod 242:118523.10.1016/j.jclepro.2019.118523
11. Farrell M, Jones DL (2009) Heavy metal contamination of a mixed waste compost: metal speciation and fate. BioresourTechnol 100:4423–4432
12. Fernández FJ, Sánchez-Arias V, Rodríguez L, Villaseñor J (2010) Feasibility of composting combinations of sewage sludge,olive mill waste and winery waste in a rotary drum reactor. Waste Manag 30:1948–1956
13. Geethamani R, Soundara B, Kanmani S, Jayanthi V, Subaharini T, Sowbiyalakshmi V, Sowmini C (2020) Production of costaffordable organic manure using institutional waste by rapid composting method. Materials Today: Proceedingshttps://doi.org/10.1016/j.matpr.2020.02.803
14. Girón-Rojas C, Gil E, Garcia-Ruiz A, Iglesias N, López M (2020) Assessment of biowaste composting process for industrialsupport tool development through macro data approach. Waste management 105:364–372
15. Hu Z, Liu Y, Chen G, Gui X, Chen T, Zhan X (2011) Characterization of organic matter degradation during composting ofmanure–straw mixtures spiked with tetracyclines. Bioresour Technol 102:7329–7334
1�. Jalili M, Mokhtari M, Ebrahimi A, Boghri F (2016) An Investigation on In-Vessel Composting of Pistachio Residuals withDifferent Additions. Iranian Journal of Health Environment 9:411–420
17. Jalili M, Mokhtari M, Eslami H, Abbasi F, Ghanbari R, Ebrahimi AA (2019) Toxicity evaluation and management of co-composting pistachio wastes combined with cattle manure and municipal sewage sludge. Ecotoxicol Environ Saf 171:798–804. 10.1016/j.ecoenv.2019.01.056
1�. Kebibeche H, Khelil O, Kacem M, Harche MK (2019) Addition of wood sawdust during the co-composting of sewage sludgeand wheat straw in�uences seeds germination. Ecotoxicol Environ Saf 168:423–430
19. Luo Y, Liang J, Zeng G, Chen M, Mo D, Li G, Zhang D (2018) Seed germination test for toxicity evaluation of compost: Itsroles, problems and prospects. Waste Manag 71:109–114
20. Malakootian M, Mobini M, Nekoonam GA (2014) Evaluation of the Compost Produced from Mixed Sludge of MunicipalWastewater Treatment Plant and Pistachio Hull Waste. Journal of Mazandaran University of Medical Sciences 24:172–183
21. Meng X, Yan J, Zuo B, Wang Y, Yuan X, Cui Z (2020) Full-scale of composting process of biogas residues from corn stoveranaerobic digestion: Physical-chemical, biology parameters and maturity indexes during whole process. Bioresour Technol302:122742

Page 11/15
22. Mudhoo A, Ramasamy DL, Bhatnagar A, Usman M, Sillanpää M (2020) An analysis of the versatility and effectiveness ofcomposts for sequestering heavy metal ions, dyes and xenobiotics from soils and aqueous milieus. Ecotoxicol Environ Saf197:110587
23. Rama L, Vasanthy M (2014) Market waste management using compost technology. International Journal of Plant AnimalEnvironmental Sciences(IJPAES) 4:57–61
24. Rashad FM, Saleh WD, Moselhy MA (2010) Bioconversion of rice straw and certain agro-industrial wastes to amendmentsfor organic farming systems: 1. Composting, quality, stability and maturity indices. Bioresour Technol 101:5952–5960
25. Sahu A, Manna M, Bhattacharjya S, Rahman MM, Mandal A, Thakur J, Sahu K, Bhargav V, Singh U, Sahu K (2020) Dynamicsof maturity and stability indices during decomposition of biodegradable city waste using rapo-compost technology. ApplSoil Ecol 155:103670
2�. Shirani H, Abolhasani Z, Lakzian A, Akhgar A (2011) Decomposition rate of municipal wastes compost, vermi compost,manure and Pistaco compost in different soil texture and salinity in laboratory condition. Journal of watr soil 25:84–93
27. Tandy S, Healey J, Nason M, Williamson J, Jones D (2009) Heavy metal fractionation during the co-composting of biosolids,deinking paper �bre and green waste. Bioresour Technol 100:4220–4226
2�. Toledo M, Gutiérrez M, Peña A, Siles J, Martín M (2020) Co-composting of chicken manure, alperujo, olive leaves/pruningand cereal straw at full-scale: Compost quality assessment and odour emission. Process Saf. Environ. Prot
29. Usman AR, Abduljabbar A, Vithanage M, Ok YS, Ahmad M, Ahmad M, Elfaki J, Abdulazeem SS, Al-Wabel MI (2015) Biocharproduction from date palm waste: charring temperature induced changes in composition and surface chemistry. J Anal ApplPyrolysis 115:392–400
30. Wang F, Zhao L, Shen Y, Meng H, Xiang X, Cheng H, Luo Y (2013) Analysis of heavy metal contents and source tracing inorganic fertilizer from livestock manure in North China. Transactions of the Chinese Society of Agricultural Engineering29:202–208
31. Xuejiang W, Ling C, Siqing X, Jianfu Z (2008) Changes of Cu, Zn, and Ni chemical speciation in sewage sludge co-composted with sodium sul�de and lime. J Environ Sci 20:156–160
32. Zhao F, Kang D, Han X, Yang G, Feng Y, Ren G (2015) Soil stoichiometry and carbon storage in long-term afforestation soilaffected by understory vegetation diversity. Ecol Eng 74:415–422
33. Zhou X, Hua X, Huang L, Xu Y (2019) Bio-utilization of cheese manufacturing wastes (cheese whey powder) for bioethanoland speci�c product (galactonic acid) production via a two-step bioprocess. Bioresour Technol 272:70–76
Figures

Page 12/15
Figure 1
Temperature (a) and humidity (b) changes during composting process in PW+SS and PS+SS reactors
Page 13/15
Figure 2
pH (a) and EC (b) changes during the composting process of the PW+SS and PS+SS reactors

Page 14/15
Figure 3
C/N ratio changes during the composting process of the PW+SS and PS+SS reactors

Page 15/15
Figure 4
Changes in the organic carbon (a) and ash (b) percentage during the composting process of the PW+SS and PS+SS reactors