Embed Size (px)
Citation preview
Clinical Value of Absolute Quantification of Myocardial Perfusion
with 15O-water in Coronary Artery Disease
Kajander et al: Absolute Quantification of Myocardial Blood Flow
Sami A. Kajander1, MD; Esa Joutsiniemi2, MD; Markku Saraste3, MD;
Mikko Pietilä2, MD, PhD; Heikki Ukkonen2, MD, PhD; Antti Saraste2, MD, PhD;
Hannu T. Sipilä1, PhD; Mika Teräs1, PhD; Maija Mäki3, MD, PhD;
Juhani Airaksinen2, MD, PhD; Jaakko Hartiala3, MD, PhD; Juhani Knuuti1, MD, PhD.
1Turku PET Centre/University of Turku, Finland 2Dept of Medicine/University of Turku, Finland
3Dept of Clinical Physiology and Nuclear Medicine/University of Turku, Finland
Correspondence to: Sami Kajander, MD
Turku PET Centre, PO BOX 52, FI-20521 Turku, Finland. Fax: +358-2-231 8191 Tel: +358-2-313 0000 E-mail: [email protected]
Journal Subject Codes: [124] Cardiovascular imaging agents/Techniques; [29] Coronary imaging: angiography/ultrasound/Doppler/CC; [32] Nuclear cardiology and PET
iinlnlanannd d
and
cal Ph siol and Nucl r Medicine/Universit of Turku, Finlacal Physiology and Nuclear Medicine/University of Turku, Finla
by guest on May 6, 2018
http://circimaging.ahajournals.org/
Dow
nloaded from
Abstract
Background The standard interpretation of perfusion imaging is based on the assessment of
relative perfusion distribution. The limitations of that approach have been recognized in patients
with multi-vessel disease and/or endothelial dysfunction. To date, however, no large clinical
studies have investigated the value of measuring quantitative blood flow, and compared that with
relative uptake.
Methods and Results 104 patients with moderate (30-70%) pre-test likelihood of CAD were
imaged with PET during adenosine stress using 15O-water and dynamic imaging. Absolute
myocardial blood flow was calculated, from which both standard relative myocardial perfusion
images and images that were scaled to known absolute scale were produced. The patients and the
regions were then classified as normal or abnormal and compared against the reference,
conventional angiography with fractional flow reserve. In patient-based analysis, the PPV, NPV
and accuracy of absolute perfusion in the detection of any obstructive CAD were 86%, 97% and
92% with absolute quantification. The corresponding values with relative analysis were 61%,
83% and 73%, respectively. In region-based analysis, the ROC curves confirmed that the
absolute quantification was superior to relative assessment. In particular, the specificity and the
PPV were low using just relative differences in flow. Only 9 of 24 patients with 3-vessel disease
were correctly assessed using relative analysis.
Conclusions The measurement of myocardial blood flow in absolute terms has significant
impact on the interpretation of myocardial perfusion. As expected, multi-vessel disease is more
accurately detected.
Clinical Trial Registration URL: http://www.clinicaltrials.gov. Unique identifier:
NCT00627172.
Key Words: cardiac PET, cardiovascular imaging, coronary artery disease, perfusion
prprodododododododucucucucucucucededededededed.. . ... ThThThThThThThe e eeeee papapapapapapa
classified as normal or abnormal and compared against t
graphy with fractional flow reserve. In patient-based analysis, h
olute erfusion in the detection of a obstructive CAD were 8
q antification. The corresp nding values with relative analy
classified as normal or abnormal and compared against t
graphy with fractional flow reserve. In patient-based analysis, th
olute perfusion in the detection of any obstructive CAD were 8
quantification. The corresponding values with relative analys
by guest on May 6, 2018
http://circimaging.ahajournals.org/
Dow
nloaded from
The detection of functional consequences of epicardial coronary artery disease (CAD) has an
established role in the detection and the guidance of the therapy of the disease (1). In addition,
the assessment of impairment in microcirculatory reactivity has recently gained more interest.
Estimates of myocardial perfusion contain independent prognostic information about future
major cardiac events and the effectiveness of risk reduction strategies (1).
While the standard interpretation of myocardial perfusion imaging is based on assessment of
relative myocardial perfusion defects, this approach has obvious limitations: the assessment is
based on the assumption that the region with the best perfusion is normal, and can be used as a
reference. In clinical scenarios, these shortcomings may arise particularly with patients that have
multi-vessel disease. In addition, global reduction of myocardial perfusion caused by diffuse
micro-vascular disease or balanced multi-vessel disease may be completely missed when
assessment of myocardial perfusion is based on relative uptake of radiotracer.
These limitations may be avoided when using absolute quantification of myocardial blood flow.
At present, the most robust technique to quantify myocardial blood flow non-invasively in
human heart is positron emission tomography (PET). PET is a quantitative technique and allows
fast and effective imaging protocols with relatively low radiation burden in both rest and stress
(2-6).
Absolute quantification of myocardial blood flow with PET is performed using the tracer kinetic
method, which is based on measuring the in vivo kinetics of a tracer concentration during
dynamic acquisition. Normal myocardial blood flow (MBF) at rest is from 0.6 to 1 mL/g/min
and increases by threefold to fivefold in stress as the coronaries dilate (7).
cuculalalalalalalarlrlrlrlrlrlrly y y yyyy wiwiwiwiwiwiwiththththththth p p pppp patatataaaatiieieieieieie
e. In addition, lobal reduction of m cardial rfusion cause
ease or balanced multi-vessel disease may be completely m
a
e. In addition, global reduction of myocardial perfusion cause
ease or balanced multi-vessel disease may be completely m
ardial perfusion is based on relative uptake of radiotracer.
by guest on May 6, 2018
http://circimaging.ahajournals.org/
Dow
nloaded from

15O-water and 13N-ammonia are the tracers most widely used for the quantification of myocardial
perfusion with PET. They provide absolute information of MBF over a wide range of blood
flows but their production requires a cyclotron (8). Absolute MBF can, however, also be
assessed with the more widely used generator-produced perfusion tracer 82Rubidium (9).
Despite of this, quantification of MBF with PET has been mainly used in research protocols and
in studies in which absolute perfusion has been measured on the global level only. These studies
have focused on the effect of various risk factors on early coronary dysfunction (10-11). More
recently, due to the increased use of PET (and PET/CT) in clinical cardiology and the
development of analysis methods, simple and robust perfusion quantification has become
available (12-15). However, large patient studies demonstrating the value of absolute
quantification in the detection of CAD - as well as in the guidance of the therapy - are still
largely lacking. In a recent study by Hajjiri et al, 27 patients with known or suspected CAD
were studied. In this material, quantification improved the accuracy for the identification of the
CAD (16).
The aim of the current study was to investigate whether the additional information gained from
absolute quantification of myocardial perfusion has a significant clinical impact in a patient
population with a moderate pre-test probability of CAD.
Methods
General Study Protocol
Initially, 107 consecutive patients with chest discomfort and 30-70% pre-test likelihood of CAD
were enrolled. Prior to invasive coronary angiography, coronary CT angiography followed by
PET perfusion imaging during adenosine stress were performed to 104 of them using 15O water
ttttinini g g ggggg ththe e e e vavalululululululue e ee eee
ance ofofofofofofof t t t t ttthehehehehehehe t tt t t ttheheheheheheherarrr
a recent study by Hajjiri et al, 27 patients with known or u
i f
a recent study by Hajjiri et al, 27 patients with known or su
is material, quantification improved the accuracy for the identifmm
by guest on May 6, 2018
http://circimaging.ahajournals.org/
Dow
nloaded from
and dynamic non-gated imaging (GE Discovery VCT PET/CT, General Electric, WI, USA). In 3
subjects, a PET study was not possible due to technical reasons. The main results of hybrid
PET/CT imaging in this population have been published recently (17). As the reference method,
all patients underwent ICA with FFR within two weeks during which no cardiac events took
place. During ICA, FFR measurements were performed for stenoses over 30%. However, there
were some stenoses not subject to FFR because of logistics, the operator’s clinical and visual
assessment of complicated lesions or technical reasons in some extremely tight stenoses.
PET Imaging
Rest-stress perfusion cardiac PET was performed with 900-1100 MBq of 15O-labeled water
(Radiowater Generator, Hidex Oy, Finland) at rest as an intravenous bolus over 15s at an
infusion rate of 10 ml/min. A dynamic non-gated acquisition of the heart 4 min 40 s was
performed (14 x 5 s, 3 x 10 s, 3 x 20 s and 4 x 30 s). After 10 min decay of the radioactivity, an
adenosine-induced stress scan was performed. Adenosine was started 2 minutes before the scan
start and infused at 140 μg/kg body weight/min (17).
ICA and FFR
All coronary angiographies were performed on Siemens Axiom Artis coronary angiography
system (Siemens, Germany). Quantitative analysis of coronary angiograms (QCA) was
performed using software with automated edge detection system (Quantcore, Siemens, Germany)
by an experienced reader (MP) blinded to other the results of PET, CTA and FFR. 17 standard
segments were analyzed.
In the presence of 30%-70% stenosis, FFR measurement was performed using ComboMap®
pressure/flow instrument and a 0.014-inch BrightWire® pressure guidewires (Volcano
Corp.,USA). The pressure was measured distally to the lesion during maximal hyperemia
vevenonooooooususususususus b b b bb b bolololololololususususususus o o o oo o ovvvvvvv
ml/min. A dynamic non-gated acquisition of the heart 4 m
, 3 x 10 s, 3 x 20 s and 4 x 30 s). After 10 min decay of the r d
stress scan was rformed. Adenosine was started 2 minutes be
140 μg/kg body weight/min (17).
ml/min. A dynamic non-gated acquisition of the heart 4 m
, 3 x 10 s, 3 x 20 s and 4 x 30 s). After 10 min decay of the rad
stress scan was performed. Adenosine was started 2 minutes be
140 μg/kg body weight/min (17).
by guest on May 6, 2018
http://circimaging.ahajournals.org/
Dow
nloaded from
induced by 18 μg intracoronary boluses of adenosine with simultaneous measurement of aortic
pressure through the catheter. FFR was calculated as the ratio between mean distal pressure and
mean aortic pressure (18-20).
Analysis and Interpretation of the Studies
The perfusion studies were analyzed using validated software. First, absolute blood flow for the
standard 17 myocardial segments were calculated using a standard anatomical template and
CarimasTM software (14,17) (www.turkupetcentre.net/carimasturku). The PET images were fused
with corresponding CTA images at a GE ADW Workstation (CardIQ Fusion, GE Healthcare, USA)
to determine the individual regions supplied by each artery. Absolute myocardial flow in any region
of less than 2.5 mL/g/min during stress was considered abnormal (17).
In patient based analysis the result was interpreted as pathological if any region showed abnormal
perfusion.
Although it is customary in clinical practice to evaluate relative perfusion abnormalities visually,
we chose to use calculated MBF values as the basis of the relative uptake analysis, too. The
region of the highest perfusion (regardless of the absolute flow) was assigned the value “1” after
which all the other areas were graded relative to that. For example, if the MBF were 2.0
mL/g/min in the LAD territory, 1.5 mL/g/min in the LCX territory and 1.0 mL/g/min in the
RCA-supplied area, the corresponding relative values were 1, 0.75 and 0.5. The optimal cut-off
for the relative uptake was 0.8 (i.e., 80% of the maximal uptake in any region) on the basis of the
ROC curve.
Parametric images of the blood flow were produced from the data. The scaling of the images was
either automatic (with relative scale the best perfused region always has the brightest color
11111117)7)7)7)7)7)7).
alysis the result was interpreted as pathological if any region shalysis the result was interpreted as pathological if any region sh
by guest on May 6, 2018
http://circimaging.ahajournals.org/
Dow
nloaded from
regardless of the actual blood flow and the other regions have colors reflecting the flows relative to
the best region) or manual (with absolute scale the flow in ml/g/min relates to a predefined color).
When FFR was performed during ICA, stenoses with FFR >0.8 were classified as non-
significant (20), regardless of the degree of narrowing. In cases without FFR, luminal diameter
narrowing 50% in QCA was considered significant.
Statistical Methods
Sensitivity, specificity, PPV, NPV and accuracy were calculated for both quantitative blood flow
and quantitative relative uptake. ROC analysis curves were performed with the Youden index
and the areas under the curves were calculated. McNemar`s test was performed to compare
accuracy of quantitative blood flow and quantitative relative uptake against reference method
(ICA with FFR). A P-value of < 0.05 was considered statistically significant. The statistical tests
were performed with SAS version 9.1.
Results
According to the reference method (ICA with FFR), 38/104 patients that underwent PET had
significant CAD. Two of the three patients without PET data had significant CAD but were not
included in the analysis. Of the 38 patients, 24 had multi-vessel disease and 14 had single-vessel
disease. 18 patients had either a totally occluded vessel or >90% stenosis in which FFR was not
technically possible. In four other patients FFR could not be performed because of scheduling or
technical reasons. 238/312 arteries were normal or had non-significant disease, 74 were
significantly diseased.
stst w wwwwwwasasasasasasas p p p p p p perererererererfofofofofofoformrmrmrmrmrmrmededededededed
ative blood flow and antita ive relative u ake ainst refer
P s
h
ative blood flow and quantitative relative uptake against refer
P-value of < 0.05 was considered statistically significant. The sd
h SAS version 9.1.
by guest on May 6, 2018
http://circimaging.ahajournals.org/
Dow
nloaded from
Patient-based analysis
Quantitative blood flow analysis correctly identified 36 out of the 38 positive patients. There
were two false negatives in which the flow was 2.5mL/g/min in all regions and 6 false
positives. Of these, 5 patients had diffusely reduced flow whereas one patient had <2.5mL/g/min
flow in just one vascular region. Quantitative analysis resulted in sensitivity of 95%, specificity
91%, PPV 86% and NPV 97%.
With relative myocardial uptake analysis, PET was able to identify only 28/38 patients with
significant CAD correctly. There were 10 false negatives and 18 false positives. This resulted in
sensitivity of 74% and specificity of 73%. PPV and NPV were 61% and 83%, respectively. The
results of the patient-based analysis are exhibited in Tables 1-2 and Figure 1.
Patients with multi-vessel disease
There were 24 patients with significant multi-vessel disease. All but one (which was a false
negative) were identified by abnormal quantitative blood flow. In addition, there were 5 false
positives with diffusely reduced MBF but no CAD according to ICA/FFR.
Using relative uptake, we were able to detect 22 of the 24 patients as having significant CAD
whereas 2 patients were erroneously interpreted as being normal (both had very low but diffusely
reduced flow). In addition, 26 patients were classified as having multi-vessel disease although
they did not. The results of the analysis of patients with multi-vessel disease are presented in
Figures 2a and 2b.
%%%%% %% ananananananand d d d d dd 83838383838383%,%,%,%,%%%, r rrrrrresesesesesesesppppppp
t-based anal sis are exhibited in Tables 1-2 and Fi re 1.
i
ents with sig ificant multi-vessel disease. All but one (whi h
t-based analysis are exhibited in Tables 1-2 and Figure 1.
i-vessel disease
ents with significant multi-vessel disease. All but one (which
by guest on May 6, 2018
http://circimaging.ahajournals.org/
Dow
nloaded from
Regional analysis
In regional (vessel-based) analysis quantitative blood flow had the sensitivity and the specificity
of 95% and 92%, respectively for in the detection of significant CAD. PPV, NPV and accuracy
were 78%, 98% and 92%, respectively. When relative flow analysis was used, PPV, NPV and
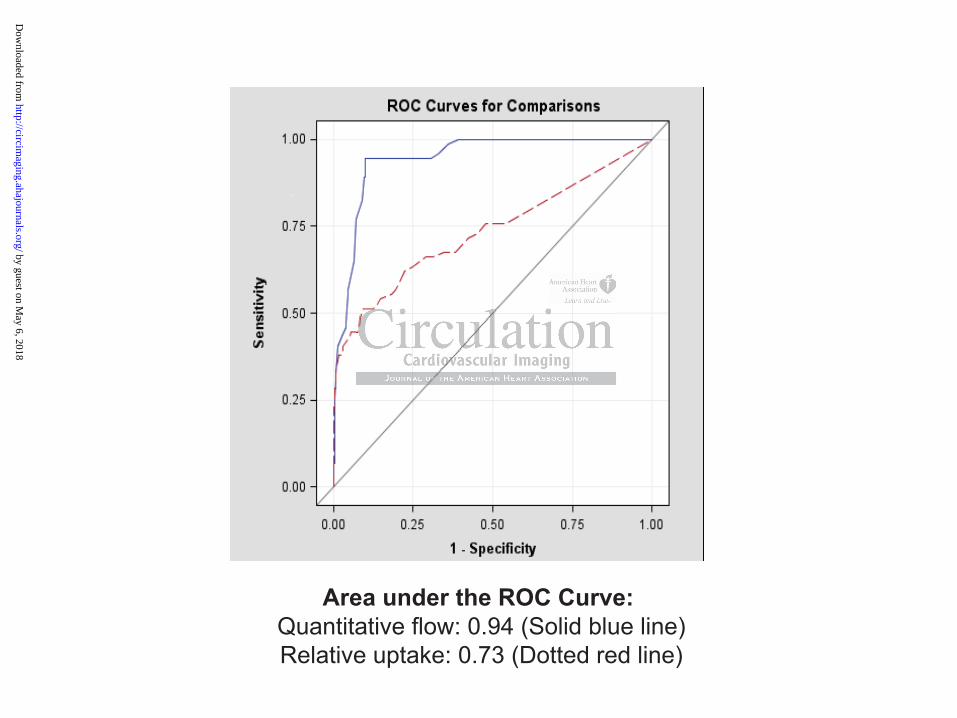
accuracy were 64%, 85% and 82%, respectively. The results of the two analysis methods were,
in addition, compared by means of ROC analysis. The area under the curve was 0.94
(quantitative blood flow) and 0.73 (relative uptake).
The relative perfusion method failed to assess the underlying extent of the disease in 13/24
patients with multi-vessel CAD because they were thought to have one-vessel disease only. In
addition, 7 other patients with the diagnosis of multi-vessel disease really had one-vessel disease.
The region-based results are presented in Tables 3-4 and Figures 2-3.
Discussion
Myocardial perfusion yields independent and important information about risk stratification in
patients with CAD. In the present study, we compared the conventional approach of assessing
relative radiotracer uptake to quantitative measurement of MBF and found out that the latter
method was more sensitive and accurate. In particular, in the presence of the multi-vessel disease
relative differences in regional myocardial radiotracer uptake may underestimate the severity of
CAD.
There are three main patient groups that account for the differences between relative uptake and
quantitative blood flow. First group is the patients with three-vessel disease and balanced,
rreaeaaaalllllllllllllly y y y y y y hahahahahahahadd dd d d d ononononononone-e-e-ee-e-e-vvvvvvv
ssults are presented in Tables 3-4 and Figures 2-3.
by guest on May 6, 2018
http://circimaging.ahajournals.org/
Dow
nloaded from

uniform reduction of perfusion. In this study, using relative uptake analysis only, we would have
totally missed CAD in two such patients. Using absolute quantification, however, balanced CAD
is usually easily distinguished from normal perfusion.
The second major group of discrepant findings consisted of 13 other patients with multi-vessel
disease. In these patients, presence of CAD was detected using relative uptake analysis but only
one region was considered pathological. This, too, is easy to understand because the region with
the best perfusion is considered to represent normal flow in relative analysis - which is however
not usually the case in patients with multi-vessel disease.
The third group of discrepancies consisted of patients with high MBF but inhomogeneous
radiotracer uptake erroneously interpreted as perfusion defects. According to ICA and FFR, these
patients had no significant CAD. Such misinterpretation is most likely to occur with tracers with
linear relationship between the measured and actual flow even at high range, such as 15O-water,
but may also be important with other tracers with high extraction (21). This potential pitfall is
avoided when using quantitative blood flow analysis.
Two case examples of false findings in relative uptake and their counterpart images based on the
quantitative blood flow are shown in Figures 4 and 5.
An interesting subgroup is the patients with normal (or nearly normal) epicardial vessels but with
diffusely reduced MBF. With quantitative PET, these patients with possible microcirculatory
disease often cannot be separated from those with epicardial multi-vessel disease. This may have
important implications on decisions concerning referral to invasive coronary angiography but it
should be noted that such patients can usually be correctly diagnosed with hybrid PET/CT
imaging. On the other hand, relative perfusion method frequently classifies these patients as
gghhhh hhh MBMBMBMBMBMBMBF F F F F F F bububububububutttt t tt inininininininhhhhhhh
rroneousl inter eted as rfusion defects. Accordi to ICA n
t
portant with other tracers wit high extraction (21). This pot
rroneously interpreted as perfusion defects. According to ICA an
ificant CAD. Such misinterpretation is most likely to occur wit
etween the measured and actual flow even at high range, such
portant with other tracers with high extraction (21). This pote
by guest on May 6, 2018
http://circimaging.ahajournals.org/
Dow
nloaded from
normal. Of course, the relative quantity of patients with multi- and single vessel disease as well
as impaired microcirculation reflects a particular patient population and the pre-test probability
of CAD in that group.
We utilized hybrid PET/CT images to visualize the location of the actual coronary arteries and
their territories. The normal variation in anatomy is considerable and possible “non-anatomical”
pseudo lesions in perfusion images are more easily distinguished from real abnormalities. In our
opinion, it is advisable to utilize hybrid images for anatomy and flow values for function if both
are available.
A limitation of the current study is that the poor performance of relative uptake analysis at high
perfusion range should not be directly extrapolated to other perfusion tracers used in PET
imaging or conventional nuclear medicine. Most tracers (such as sestamibi, tetrofosmin,
ammonia and rubidium) exhibit non-linear flow characteristics between detected signal and
actual perfusion, thus naturally omitting heterogeneity in perfusion at the high end of the normal
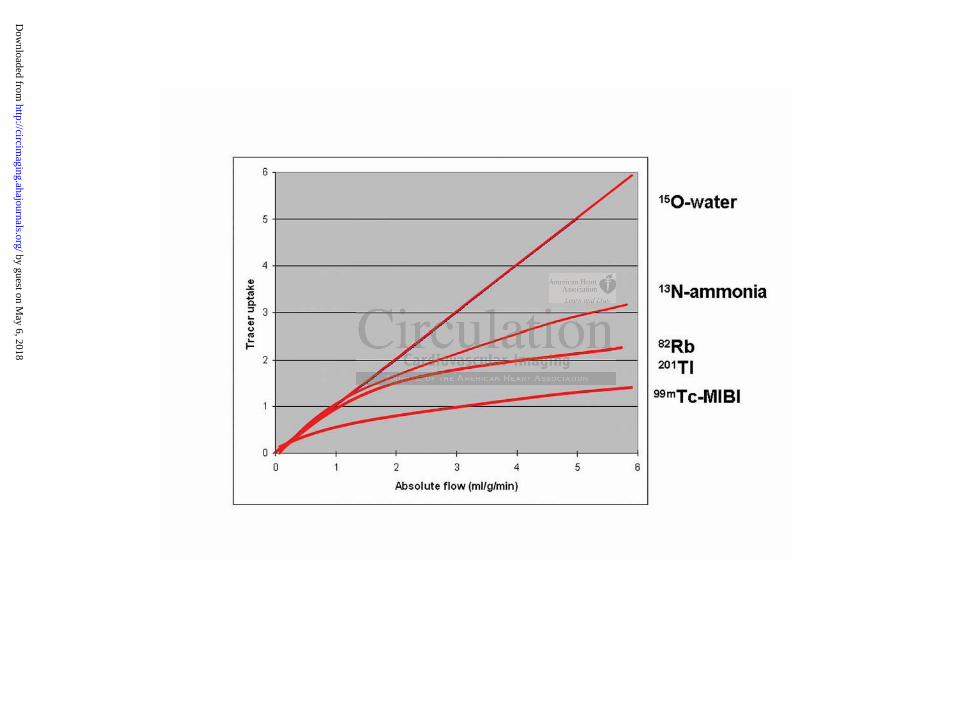
perfusion range. These relationships are demonstrated in Figure 6 (22).
Another limitation is the lack of ECG-gating in our approach. Gated images provide information
about wall motion and this information could improve the accuracy of relative analysis. A third
limitation of the study is the relatively small number of patients with significant CAD (n=38).
This reflects the patient population but warrants further studies with more patients. On the other
hand this kind of population with intermediate likelihood of disease should be ideal for assessing
diagnostic methods especially since we avoided referral bias by performing ICA in all patients.
eelalalllll tititititititiveveveveveveve u u u u uu uptptptptptptptakakakakakakake e eeeee ananananananan
ould not be directl extra lated to other rfusion tracers
n
d e
us naturally omitting heterog neity in perfusion at the high end
ould not be directly extrapolated to other perfusion tracers
ntional nuclear medicine. Most tracers (such as sestamibi,t
dium) exhibit non-linear flow characteristics between detecte
us naturally omitting heterogeneity in perfusion at the high end
by guest on May 6, 2018
http://circimaging.ahajournals.org/
Dow
nloaded from
Conclusion
Quantification of myocardial blood flow is superior to the assessment of relative uptake only. In
particular, assessment of the absolute flow improves the correct detection of multi-vessel disease.
In addition, patients with diffusely reduced flow but with no significant epicardial stenoses are
easily identified using quantification. Furthermore, local variances within normal high flow can
be separated from regionally compromised perfusion. This is particularly important when tracers
with high extraction are used.
by guest on May 6, 2018
http://circimaging.ahajournals.org/
Dow
nloaded from

Acknowledgements
We warmly thank Ville Aalto for his skillful statistical analysis. This study was conducted within
the Centre of Excellence in Molecular Imaging in Cardiovascular and Metabolic Research,
supported by the Academy of Finland, University of Turku, Turku University Hospital, and Abo
Academy. Financial support was also obtained from the Finnish Cardiovascular Foundation and
the Hospital District of Southwest Finland.
Disclosures
None.
by guest on May 6, 2018
http://circimaging.ahajournals.org/
Dow
nloaded from
References
1. Klocke FJ, Baird MG, Lorell BH, Bateman TM, Messer JV, Berman DS, O'Gara
PT,Carabello BA, Russell RO Jr, Cerqueira MD, St John Sutton MG, DeMaria AN,
Udelson JE, Kennedy JW, Verani MS, Williams KA, Antman EM, Smith SC Jr, Alpert
JS, Gregoratos G, Anderson JL, Hiratzka LF, Faxon DP, Hunt SA, Fuster V, Jacobs AK,
Gibbons RJ, Russell RO; American College of Cardiology; American Heart Association
Task Force on Practice Guidelines; American Society for Nuclear Cardiology.
ACC/AHA/ASNC guidelines for the clinical use of cardiac radionuclide imaging--
executive summary: a report of the American College of Cardiology/American Heart
Association Task Force on Practice Guidelines (ACC/AHA/ASNC Committee to Revise
the 1995 Guidelines for the Clinical Use of Cardiac Radionuclide Imaging). Circulation.
2003;108:1404-18.
2. Hara T, Michihata T, Yokoi F, Sakamoto S, Masuoka T, Iio M. Quantitative
measurement of disease by intravenous injection of 13N-ammonia in positron emission
tomography. Eur J Nucl Med. 1990;16:231-5.
3. Muzik O, Duvernoy C, Beanlands RS, Sawada S, Dayanikli F, Wolfe ER Jr, Schwaiger
M. Assessment of diagnostic performance of quantitative flow measurements in normal
subjects and patients with angiographically documented coronary artery disease by means
of nitrogen-13 ammonia and positron emission tomography. J Am Coll Cardiol.
1998;31:534-40.
4. Yoshinaga K, Katoh C, Noriyasu K, Iwado Y, Furuyama H, Ito Y, Kuge Y, Kohya T,
Kitabatake A, Tamaki N. Reduction of coronary flow reserve in areas with and without
ischemia on stress perfusion imaging in patients with coronary artery disease: a study
using oxygen 15-labeled water PET. J Nucl Cardiol. 2003;10:275-83.
AAAAAAA/A/A/A/A/A/A/ASNSNSNSNSNSNSNC C C C C C C CoCoCoCoCoCoCommmmmmmmmmmmmmititititititit
idelines for the Clinical Use of Cardiac Radionuclide Ima i )
ichihata T, Yokoi F, Sakamoto S, Masuoka T, Iio M.
t of disease by intravenous injection of 13N-ammonia in p sit
idelines for the Clinical Use of Cardiac Radionuclide Imaging)
04-18.
ichihata T, Yokoi F, Sakamoto S, Masuoka T, Iio M.
t of disease by intravenous injection of 13N-ammonia in posit
by guest on May 6, 2018
http://circimaging.ahajournals.org/
Dow
nloaded from
5. Parkash R, deKemp RA, Ruddy TD, Kitsikis A, Hart R, Beauchesne L, Williams K,
Davies RA, Labinaz M, Beanlands RS. Potential utility of rubidium 82 PET
quantification in patients with 3-vessel coronary artery disease. J Nucl Cardiol.
2004;11:440-9.
6. Kajander S, Ukkonen H, Sipilä H, Teräs M, Knuuti J. Low radiation dose imaging of
myocardial perfusion and coronary angiography with a hybrid PET/CT scanner. Clin
Physiol Funct Imaging. 2009;29:81-8.
7. Pandit-Taskar N, Grewal RK, Strauss HW. Cardiovascular system. In: Christian PE,
Waterstram-Rich KM, eds. Nuclear medicine and PET/CT technology and techniques. St.
Louis: Mosby Elsevier; 2007. pp. 479-512.
8. Bol A, Melin JA, Vanoverschelde JL, et al. Direct comparison of [13N]ammonia and
[15O]water estimates of perfusion with quantification of regional myocardial blood flow
by microspheres. Circulation. 1993;87:512-25
9. El Fakhri G, Kardan A, Sitek A, Dorbala S, Abi-Hatem N, Lahoud Y, Fischman A,
Coughlan M, Yasuda T, Di Carli MF. Reproducibility and accuracy of quantitative
myocardial blood flow assessment with (82)Rb PET: comparison with (13)N-ammonia
PET. J Nucl Med. 2009;50:1062-71.
10. Dayanikli F, Grambow D, Muzik O, Mosca L, Rubenfire M, Schwaiger M. Early
detection of abnormal coronary flow reserve in asymptomatic men at high risk for
coronary artery disease using positron emission tomography. Circulation. 1994;90:808-
17.
11. Pitkänen OP, Nuutila P, Raitakari OT, Porkka K, Iida H, Nuotio I, Rönnemaa T, Viikari
J, Taskinen MR, Ehnholm C, Knuuti J. Coronary flow reserve in young men with familial
combined hyperlipidemia. Circulation. 1999;99:1678-84.
12. Kaufmann PA, Camici PG. Myocardial blood flow measurement by PET: technical
aspects and clinical applications. J Nucl Med. 2005;46:75-88.
ararisisisisisisisononononononon o o o o oo of f f f f f f [1[1[1[1[1[1[13N3N3N3N3N3N3N]a]a]a]a]a]a]a
estimates of rfusion with uantification of r ional ocardi
e
G Kardan Sitek A Dorbala Abi-Hatem N Lahoud Y
M, Yasuda T, Di Carli MF. R producibili y and accuracy f
estimates of perfusion with quantification of regional myocardi
eres. Circulation. 1993;87:512-25
G, Kardan A, Sitek A, Dorbala S, Abi-Hatem N, Lahoud Y,
M, Yasuda T, Di Carli MF. Reproducibility and accuracy of
by guest on May 6, 2018
http://circimaging.ahajournals.org/
Dow
nloaded from
13. El Fakhri G, Sitek A, Di Carli MF. QDA: An automated graphical software for absolute
quantification of regional myocardial blood flow [abstract]. J Nucl Med. 2007;48:203.
14. Nesterov SV, Han C, Maki M et al. Myocardial perfusion quantitation with (15)O-
labelled water PET: high reproducibility of the new cardiac analysis software (Carimas).
Eur J Nucl Med Mol Imaging. 2009;36:1594-602. Erratum in: Eur J Nucl Med Mol
Imaging. 2010;37:832.
15. Fricke H, Elsner A, Weise R, Bolte M, van den Hoff J, Burchert W, Domik G, Fricke E.
Quantitative myocardial perfusion PET combined with coronary anatomy derived from
CT angiography: validation of a new fusion and visualization software. Z Med Phys.
2009;19:182-8.
16. Hajjiri MM, Leavitt MB, Zheng H, Spooner AE, Fischman AJ, Gewirtz H.Comparison of
positron emission tomography measurement of adenosine-stimulated absolute myocardial
blood flow versus relative myocardial tracer content for physiological assessment of
coronary artery stenosis severity and location. JACC Cardiovasc Imaging. 2009;2:751-8.
17. Kajander S, Joutsiniemi E, Saraste M, Pietilä M, Ukkonen H, Saraste A, Sipilä HT,
Teräs M, Mäki M, Airaksinen J, Hartiala J, Knuuti J. Cardiac PET/CT imaging accurately
detects anatomically and functionally significant coronary artery disease. Circulation.
2010;122:603-13.
18. Berger A, Botman KJ, MacCarthy PA, Wijns W, Bartunek J, Heyndrickx GR, Pijls NH,
De Bruyne B. Long-term clinical outcome after fractional flow reserve-guided
percutaneous coronary intervention in patients with multivessel disease. J Am Coll
Cardiol. 2005; 46:438-442.
19. Tonino PA, De Bruyne B, Pijls NH, Siebert U, Ikeno F, van' t Veer M, Klauss V,
Manoharan G, Engstrøm T, Oldroyd KG, Ver Lee PN, MacCarthy PA, Fearon WF;
FAME Study Investigators. Fractional flow reserve versus angiography for guiding
percutaneous coronary intervention. N Engl J Med. 2009; 360:213-224.
AJAJAJAJAJAJAJ, , , , GeGeGeGeGeGeGewiwiwiwiwiwiwirtrtrtrtrtrtrtz z zzzzz H.H.HHHHH CCCCCCC
ssion tomo h measurement of adenosine-stimulated absolu
versus relative myocardial tracer content for physiological a
ery stenosis severity and location. JACC Cardiovasc Imaging. 20
Joutsiniemi , Saraste , Pietilä , Ukkonen H, Saraste A
ssion tomography measurement of adenosine-stimulated absolu
versus relative myocardial tracer content for physiological a
ery stenosis severity and location. JACC Cardiovasc Imaging. 20
Joutsiniemi E, Saraste M, Pietilä M, Ukkonen H, Saraste A
by guest on May 6, 2018
http://circimaging.ahajournals.org/
Dow
nloaded from

20. Pijls NH. Optimum guidance of complex PCI by coronary pressure measurement. Heart.
2004; 90:1085-1093.
21. Nekolla SG, Reder S, Saraste A, Higuchi T, Dzewas G, Preissel A, Huisman M, Poethko
T, Schuster T, Yu M, Robinson S, Casebier D, Henke J, Wester HJ, Schwaiger M.
Evaluation of the novel myocardial perfusion positron-emission tomography tracer 18F-
BMS-747158-02: comparison to 13N-ammonia and validation with microspheres in a pig
model. Circulation. 2009;119:2333-42.
22. Knuuti J, Kajander S, Mäki M, Ukkonen H. Quantification of myocardial blood flow will
reform the detection of CAD. J Nucl Cardiol. 2009;16:497-506.
by guest on May 6, 2018
http://circimaging.ahajournals.org/
Dow
nloaded from
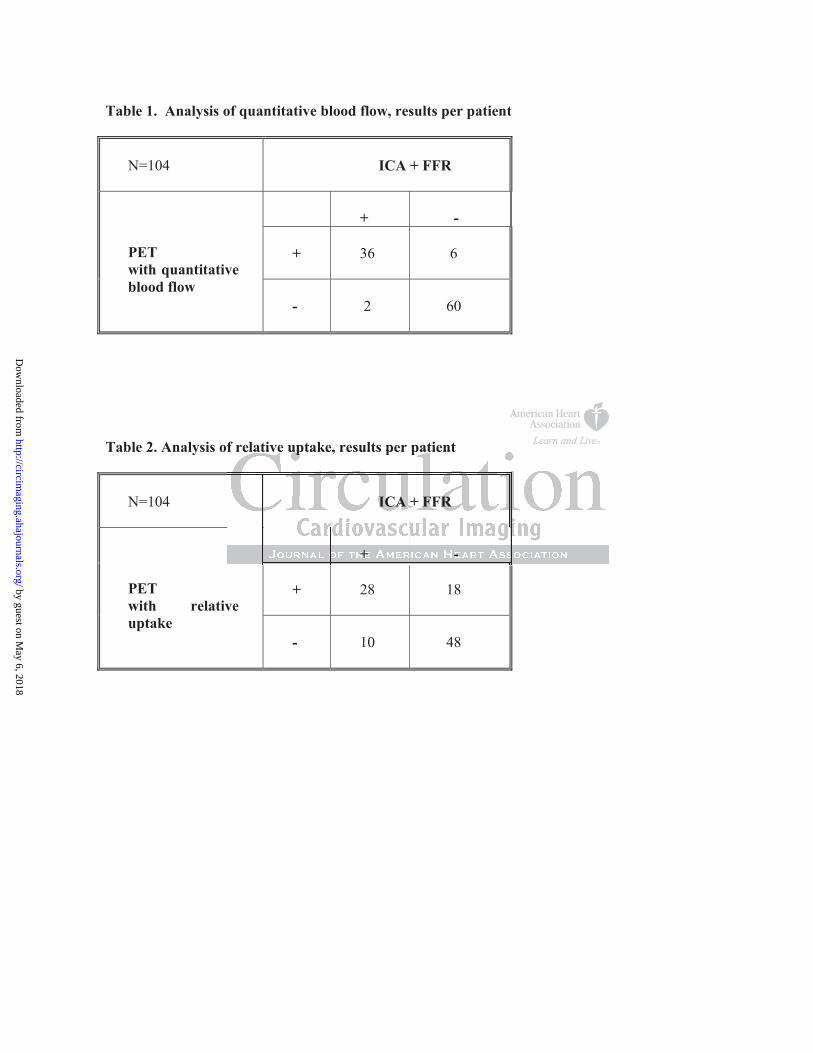
Table 1. Analysis of quantitative blood flow, results per patient
N=104
ICA + FFR
+
-
+
36
6
PETwith quantitative blood flow
-
2
60
Table 2. Analysis of relative uptake, results per patient
N=104
ICA + FFR
+
-
+
28
18
PETwith relative uptake
-
10
48
f relative uptake, results per patient f relative uptake, results per patient
ICA + FFR
+ -
by guest on May 6, 2018
http://circimaging.ahajournals.org/
Dow
nloaded from
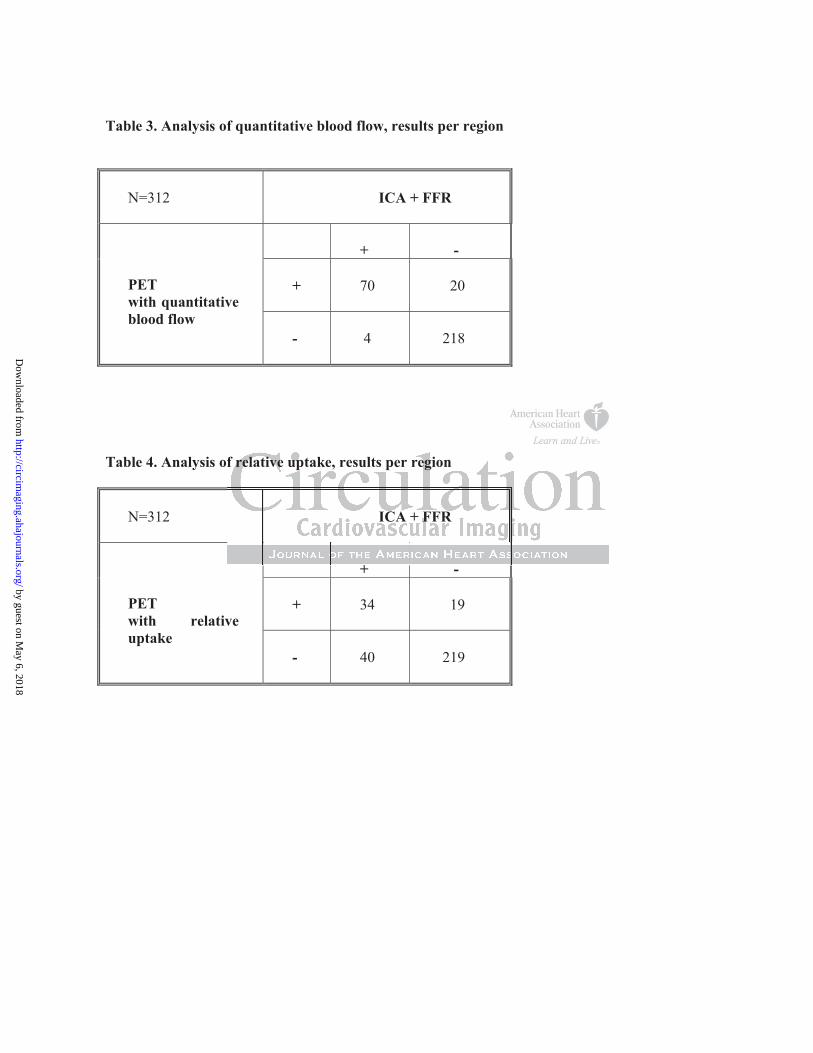
Table 3. Analysis of quantitative blood flow, results per region
N=312
ICA + FFR
+
-
+
70
20
PETwith quantitative blood flow
-
4
218
Table 4. Analysis of relative uptake, results per region
N=312
ICA + FFR
+
-
+
34
19
PETwith relative uptake -
40
219
+
f relative uptake, results per region
ICA + FFR
+
by guest on May 6, 2018
http://circimaging.ahajournals.org/
Dow
nloaded from
Figure Legends
Figure 1. Patient-based assessment: Quantitative blood flow vs. relative uptake in adenosine-
induced stress with ICA+FFR as reference method. Normal flow: 2.5 mL/g/min in quantitative
blood flow, 80% of the maximal uptake in relative uptake. Quantitative blood flow (blue bar).
Relative uptake (burgundy bar). N=104.
Figure 2a. Regional (per-vessel) assessment: Quantitative blood flow vs. relative uptake in
adenosine-induced stress with ICA+FFR as reference method. Normal flow: 2.5 mL/g/min in
quantitative blood flow, 80% of the maximal uptake in relative uptake. Quantitative blood flow
(blue bar). Relative uptake (burgundy bar). N=312.
Figure 2b. Regional (per-vessel) assessment in patients with multivessel disease: Quantitative blood
flow vs. relative uptake in adenosine-induced stress with ICA+FFR as reference method. Normal
flow: 2.5 mL/g/min in quantitative blood flow, 80% of the maximal uptake in relative uptake.
Quantitative blood flow (blue bar). Relative uptake (burgundy bar). N=312.
Figure 3. ROC curves of regional assessment methods: Quantitative blood flow vs. relative uptake.
Solid blue line: quantitative blood flow. Dotted red line: relative uptake.
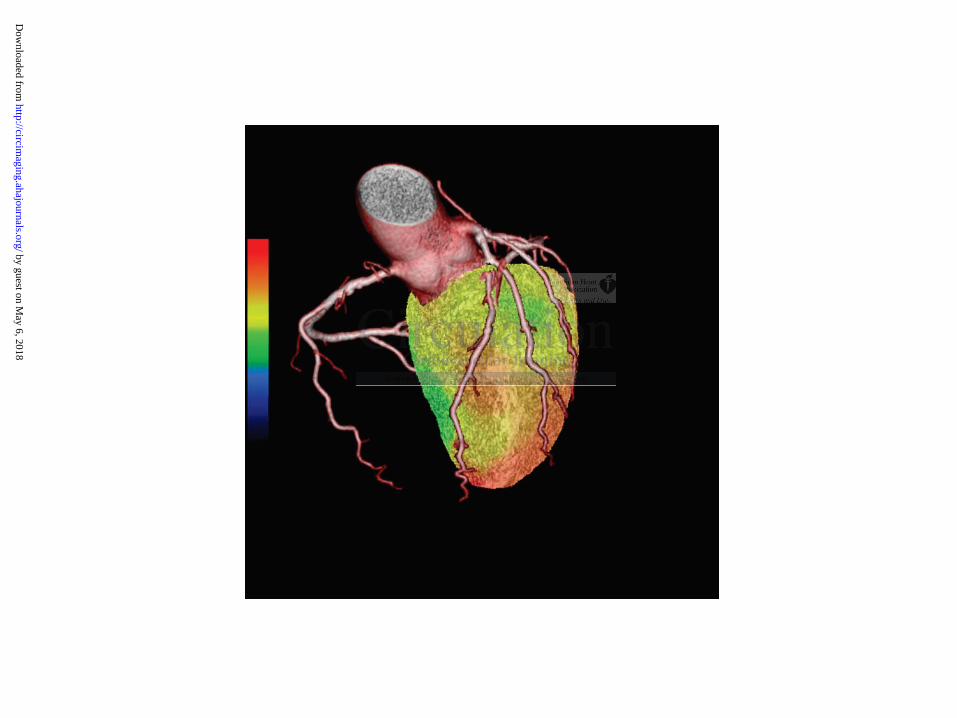
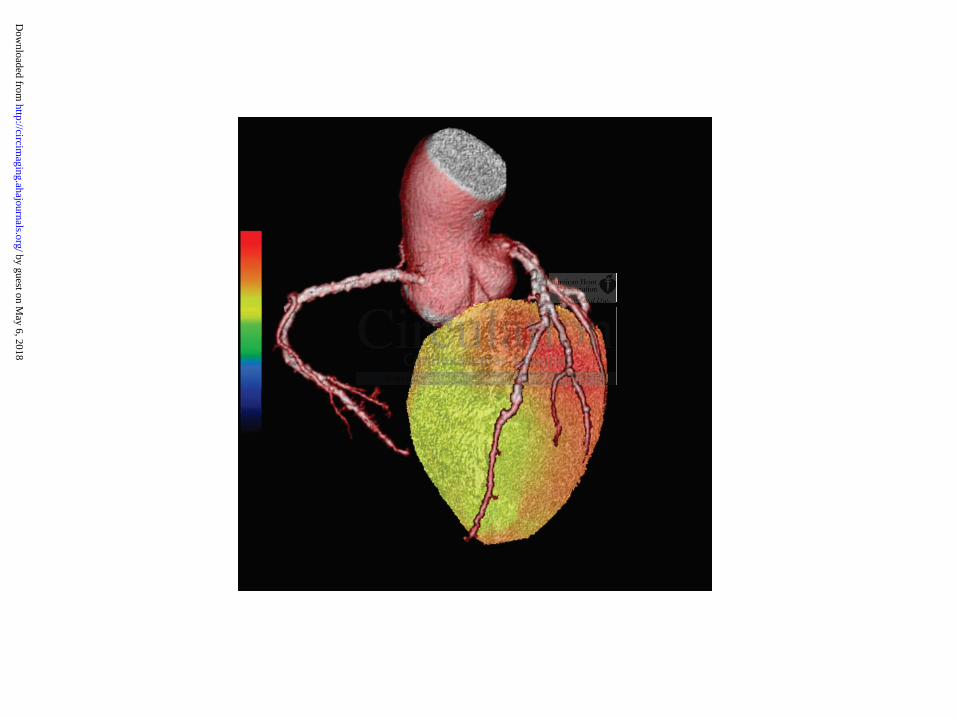
Figure 4. False positive finding in relative uptake analysis. Figure 4a: Relative uptake in hybrid
PET/CTA-images, automatic color scale. The heterogeneity in perfusion was erroneously
interpreted as reduced perfusion in LAD and LCX territories. Normal perfusion: yellow or red
color, reduced perfusion: green or blue color. Figure 4b: Quantitative blood flow with a preset color
mmallllllal f f f f f f flololololololow:w:w:w:w:w:w: 2.2.2.2.2.2.2.5 5 5 5 5 5 5 mmmmmmm
ow, 80% of the maximal uptake in relative uptake. Quantitativ
(per-vesse ) assessment in patients with multivessel disease: Qu
ow, 80% of the maximal uptake in relative uptake. Quantitativ
uptake (burgundy bar). N=312.
(per-vessel) assessment in patients with multivessel disease: Qu
by guest on May 6, 2018
http://circimaging.ahajournals.org/
Dow
nloaded from

scale of 0-3.5 mL/g/min. Normal perfusion is 2.5 mL/g/min (yellow or red color). Reduced
perfusion is < 2,5 mL/g/min (green or blue color). Normal finding. ICA + FFR was normal.
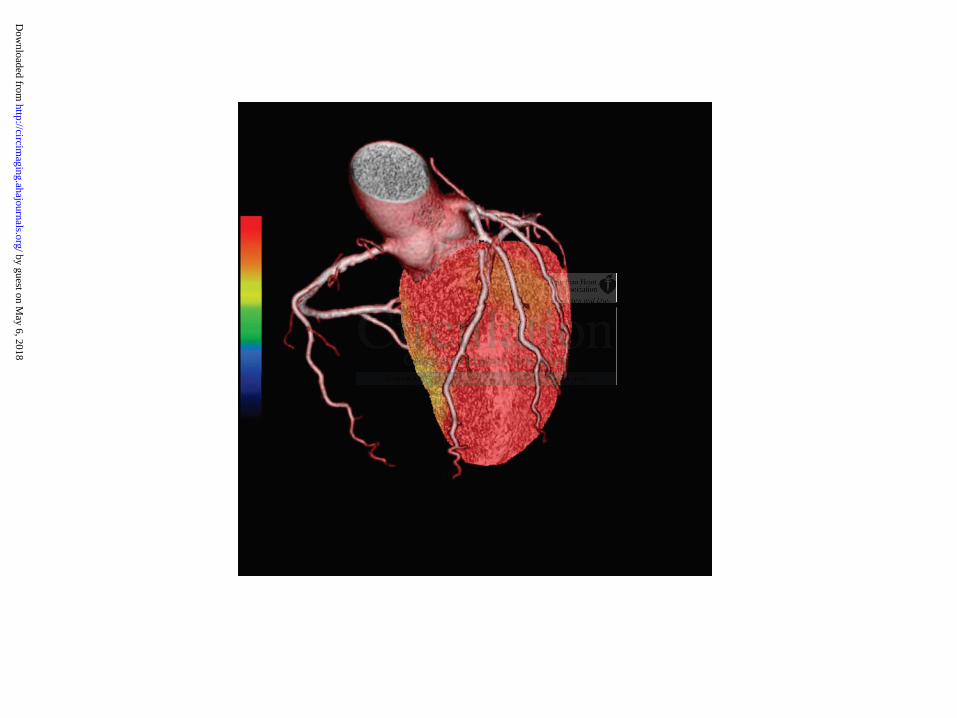
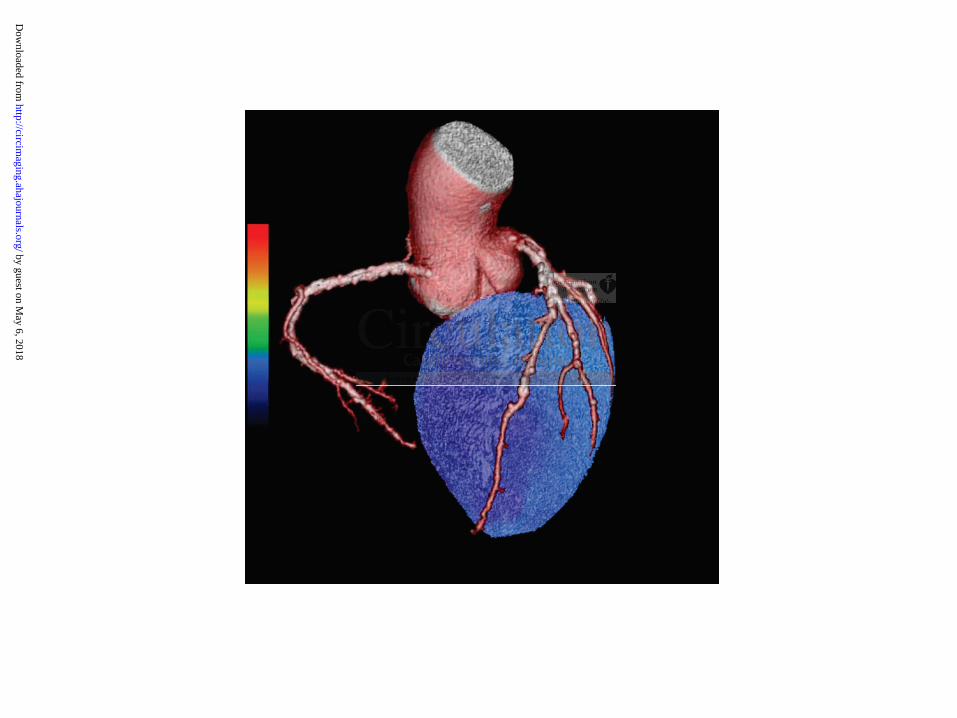
Figure 5. False negative finding in relative uptake analysis. Figure 5a: Relative uptake in hybrid
PET/CTA-images, automatic color scale. This appeared normal in all regions and was false
negative finding. Normal perfusion: yellow or red color, reduced perfusion: green or blue color.
Figure 5b: Quantitative blood flow images with a preset color scale of 0-3.5 mL/g/min. Normal
perfusion is 2.5 mL/g/min (yellow or red color). Reduced perfusion is < 2,5 mL/g/min (green or
blue color). Blue color reflects severely impaired perfusion in all 3 major vascular territories. ICA +
FFR was abnormal in all 3 vessels.
Figure 6. Graphical presentation of the relationship between absolute myocardial perfusion and
tracer uptake. The lines are estimates of the tracer uptake characteristics. In all tracers except 15O-
water, tracer extraction is reduced when perfusion is increased. Reproduced with permission (ref:
Knuuti J, Kajander S, Mäki M, Ukkonen H. Quantification of myocardial blood flow will reform
the detection of CAD. J Nucl Cardiol. 2009;16:497-506.)
p esentation of the relationshi between absolute ocardial e
nes are estimates of the tracer uptake characteristics. In all trace
i
S, Mäki M, Ukkonen H. Quantification of my cardial blood fl w
presentation of the relationship between absolute myocardial pe
nes are estimates of the tracer uptake characteristics. In all trace
ion is reduced when perfusion is increased. Reproduced with pe
S, Mäki M, Ukkonen H. Quantification of myocardial blood flow
by guest on May 6, 2018
http://circimaging.ahajournals.org/
Dow
nloaded from
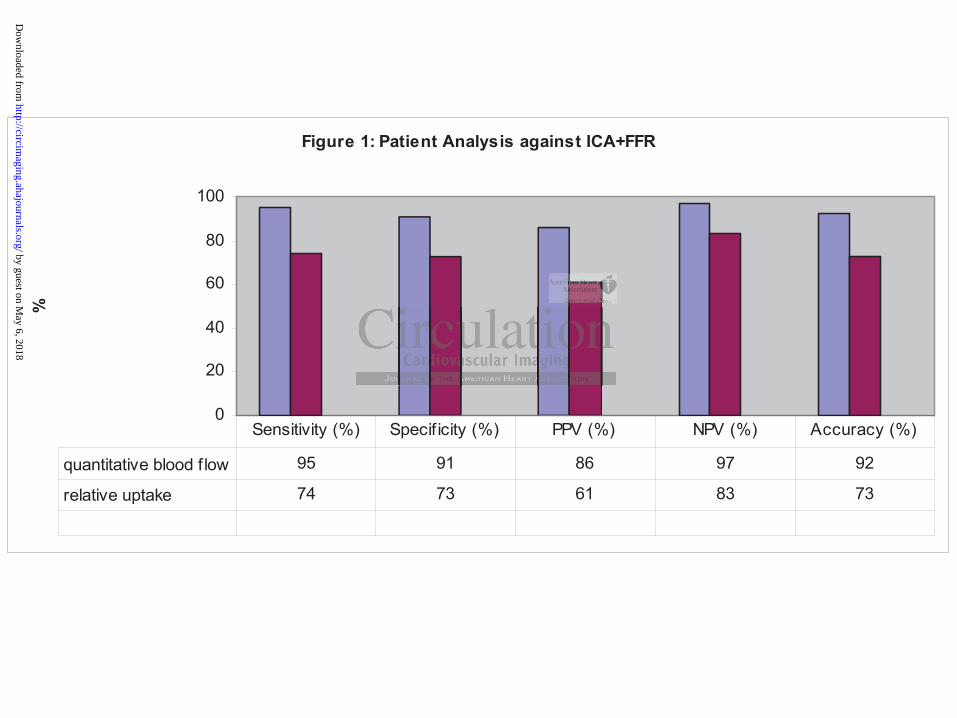
Figure 1: Patient Analysis against ICA+FFR
0
20
40
60
80
100
%
quantitative blood f low 95 91 86 97 92
relative uptake 74 73 61 83 73
Sensitivity (%) Specif icity (%) PPV (%) NPV (%) Accuracy (%)
by guest on May 6, 2018
http://circimaging.ahajournals.org/
Dow
nloaded from
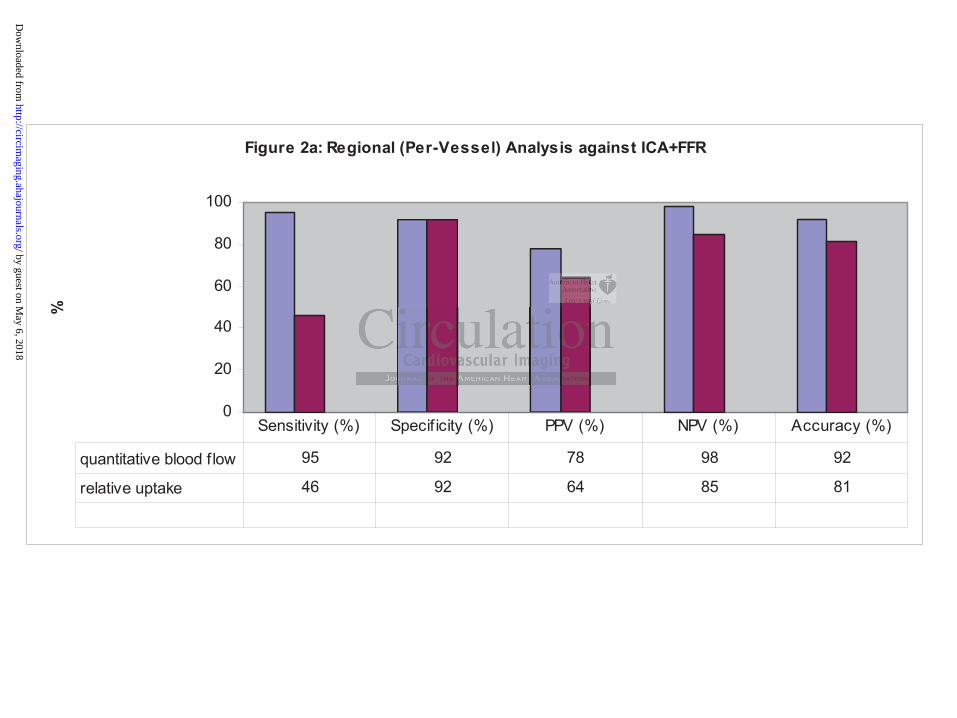
Figure 2a: Regional (Per-Vessel) Analysis against ICA+FFR
0
20
40
60
80
100
%
quantitative blood f low 95 92 78 98 92
relative uptake 46 92 64 85 81
Sensitivity (%) Specif icity (%) PPV (%) NPV (%) Accuracy (%)
by guest on May 6, 2018
http://circimaging.ahajournals.org/
Dow
nloaded from
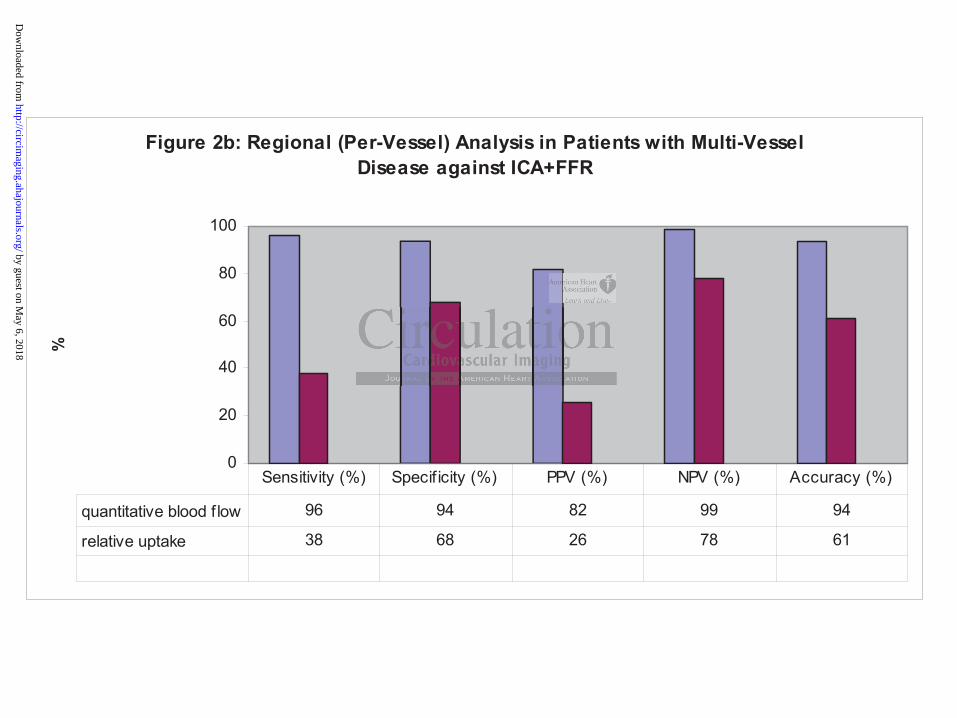
Figure 2b: Regional (Per-Vessel) Analysis in Patients with Multi-Vessel Disease against ICA+FFR
0
20
40
60
80
100
%
quantitative blood f low 96 94 82 99 94
relative uptake 38 68 26 78 61
Sensitivity (%) Specif icity (%) PPV (%) NPV (%) Accuracy (%)
by guest on May 6, 2018
http://circimaging.ahajournals.org/
Dow
nloaded from
Area under the ROC Curve: Quantitative flow: 0.94 (Solid blue line)Relative uptake: 0.73 (Dotted red line)
by guest on May 6, 2018
http://circimaging.ahajournals.org/
Dow
nloaded from
by guest on May 6, 2018
http://circimaging.ahajournals.org/
Dow
nloaded from
by guest on May 6, 2018
http://circimaging.ahajournals.org/
Dow
nloaded from
by guest on May 6, 2018
http://circimaging.ahajournals.org/
Dow
nloaded from
by guest on May 6, 2018
http://circimaging.ahajournals.org/
Dow
nloaded from
by guest on May 6, 2018
http://circimaging.ahajournals.org/
Dow
nloaded from
Hannu T. Sipilä, Mika Teräs, Maija Mäki, Juhani Airaksinen, Jaakko Hartiala and Juhani KnuutiSami A. Kajander, Esa Joutsiniemi, Markku Saraste, Mikko Pietilä, Heikki Ukkonen, Antti Saraste,
Artery DiseaseO-water in Coronary15Clinical Value of Absolute Quantification of Myocardial Perfusion with
Print ISSN: 1941-9651. Online ISSN: 1942-0080 Copyright © 2011 American Heart Association, Inc. All rights reserved.
TX 75231is published by the American Heart Association, 7272 Greenville Avenue, Dallas,Circulation: Cardiovascular Imaging
published online September 16, 2011;Circ Cardiovasc Imaging.
http://circimaging.ahajournals.org/content/early/2011/09/16/CIRCIMAGING.110.960732World Wide Web at:
The online version of this article, along with updated information and services, is located on the
http://circimaging.ahajournals.org//subscriptions/
is online at: Circulation: Cardiovascular Imaging Information about subscribing to Subscriptions:
http://www.lww.com/reprints Information about reprints can be found online at: Reprints:
document. Permissions and Rights Question and Answer this process is available in the
located, click Request Permissions in the middle column of the Web page under Services. Further information aboutnot the Editorial Office. Once the online version of the published article for which permission is being requested is
can be obtained via RightsLink, a service of the Copyright Clearance Center,Circulation: Cardiovascular Imaging Requests for permissions to reproduce figures, tables, or portions of articles originally published inPermissions:
by guest on May 6, 2018
http://circimaging.ahajournals.org/
Dow
nloaded from