Embed Size (px)
Citation preview
University of Wisconsin Extension & Applied Population Laboratory
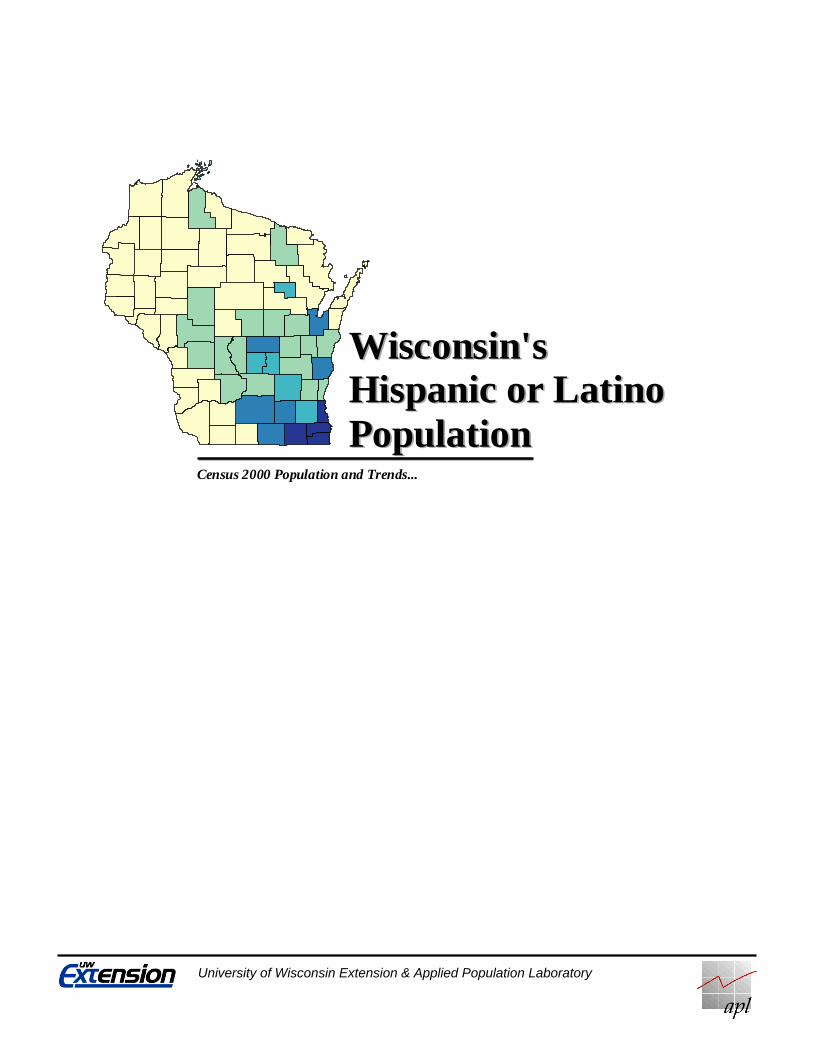
Wisconsin'sHispanic or LatinoPopulation
Wisconsin'sHispanic or LatinoPopulation
Census 2000 Population and Trends...

HISPANIC CHARTBOOK
University of Wisconsin Extension & Applied Population Laboratory
I
TABLE OF CONTENTS List of Maps -------------------------------------------------------------------------------------- II
List of Charts ----------------------------------------------------------------------------------- III List of Tables ------------------------------------------------------------------------------------ IV
About this Report ------------------------------------------------------------------------------ VI Executive Summary -------------------------------------------------------------------------- VII Hispanics in Wisconsin -------------------------------------------------------------------------- 1 Distribution of Hispanics (Numeric) --------------------------------------------------------------- 1 Distribution of Hispanics (Percent) ---------------------------------------------------------------- 2 Population Change (Numeric) ---------------------------------------------------------------------- 3 Population Change (Percent) ------------------------------------------------------------------------ 4 County Shares ----------------------------------------------------------------------------------------- 5 Urban/Rural ------------------------------------------------------------------------------------------- 6 Hispanic Identification -------------------------------------------------------------------------- 7 Heritage ------------------------------------------------------------------------------------------------ 7 Hispanics by Race ------------------------------------------------------------------------------------ 8 Birthplace ---------------------------------------------------------------------------------------------- 9 Birthplace of Persons Born in Latin America ---------------------------------------------------- 10 Year of Entry for Persons Born in Latin America ----------------------------------------------- 11 Earlier Residence ------------------------------------------------------------------------------------ 12 Age and Sex -------------------------------------------------------------------------------------- 13 Population Pyramid ---------------------------------------------------------------------------------- 13 Median Age ------------------------------------------------------------------------------------------ 14 Population Under Age 15 (Percent) --------------------------------------------------------------- 15 Young Adults----------------------------------------------------------------------------------------- 16 Families and Households ---------------------------------------------------------------------- 17 Living Arrangements -------------------------------------------------------------------------------- 17 Family Size ------------------------------------------------------------------------------------------- 18 Household Size--------------------------------------------------------------------------------------- 19 Households with Non-Relatives ------------------------------------------------------------------- 20 Female Householders ------------------------------------------------------------------------------- 21
HISPANIC CHARTBOOK
University of Wisconsin Extension & Applied Population Laboratory
II
Education ----------------------------------------------------------------------------------------- 22 Educational Attainment: 1990 & 2000 ------------------------------------------------------------ 22 Educational Attainment by Sex -------------------------------------------------------------------- 23 Language Spoken ------------------------------------------------------------------------------------ 24 Limited English Proficiency by District ---------------------------------------------------------- 25 Limited English Proficiency by Grade Group --------------------------------------------------- 26Income ------------------------------------------------------------------------------------------- 27 Median Household & Family Income ------------------------------------------------------------- 27 Household Income Distribution -------------------------------------------------------------------- 28 Median Earnings by Sex ---------------------------------------------------------------------------- 29 Poverty Status ------------------------------------------------------------------------------------ 30 Distribution of Hispanic Poverty ------------------------------------------------------------------ 30 Poverty by Age --------------------------------------------------------------------------------------- 31 Poverty by Age: 1989 & 1999 --------------------------------------------------------------------- 32 Poverty Status for Female Householder Families ----------------------------------------------- 33 Poverty Status of Families with Female Householders: 1989 & 1999 ------------------------ 34 Labor Force -------------------------------------------------------------------------------------- 35 Employment Status by Sex: Hispanic and Total ------------------------------------------------- 35 Employment Status by Sex: 1990 & 2000 -------------------------------------------------------- 36 Employment Status for Females by Presence of Children ------------------------------------- 37 Housing ------------------------------------------------------------------------------------------- 38 Housing Value --------------------------------------------------------------------------------------- 38 Tenure ------------------------------------------------------------------------------------------------- 39 Healthcare ---------------------------------------------------------------------------------------- 40 Health Insurance ------------------------------------------------------------------------------------- 40 Preventive Care -------------------------------------------------------------------------------------- 41 Business ------------------------------------------------------------------------------------------- 42 Hispanic-owned Firms ------------------------------------------------------------------------------ 42 Hispanic-owned Firms by Paid Employee Status ----------------------------------------------- 43 List of Maps Map 1: Hispanic Population 1990 ------------------------------------------------------------------ 1 Map 2: Hispanic Population 2000 ------------------------------------------------------------------ 1 Map 3: Percent Hispanic 1990 ---------------------------------------------------------------------- 2 Map 4: Percent Hispanic 2000 ---------------------------------------------------------------------- 2 Map 5: Hispanic Population Change 1980-1990 ------------------------------------------------- 3 Map 6: Hispanic Population Change 1990-2000 ------------------------------------------------- 3

HISPANIC CHARTBOOK
University of Wisconsin Extension & Applied Population Laboratory
III
Map 7: Hispanic Population Percent Change 1980-1990---------------------------------------- 4 Map 8: Hispanic Population Percent Change 1990-2000---------------------------------------- 4 Map 9: Hispanic Population in Poverty 2000 ---------------------------------------------------- 30 Map 10: Percent of Hispanics in Poverty 2000 -------------------------------------------------- 30 List of Charts
Chart 1: Distribution of Wisconsin’s Hispanic Population, Wisconsin Counties: 2000 ----- 5 Chart 2: Urban/Rural Residence, Wisconsin: 2000 ---------------------------------------------- 6 Chart 3: Heritage of Hispanics, Wisconsin: 2000 ------------------------------------------------ 7 Chart 4: Race of Hispanics, Wisconsin: 2000----------------------------------------------------- 8 Chart 5: Birthplace of Total Population & Hispanics, Wisconsin: 2000 ---------------------- 9 Chart 6: Birthplace of Persons Born in Latin America, Wisconsin: 2000 -------------------- 10 Chart 7: Year of Entry for Persons Born in Latin America, Wisconsin: 2000 --------------- 11
Chart 8: Movers’ Place of Residence in 1995, Total and Hispanic Persons, Wisconsin: 2000 ---------------------------------------------------------------- 12
Chart 9: Total and Hispanic Population by Age and Sex, Wisconsin: 2000 ----------------- 13 Chart 10: Median Age by Heritage and Sex, Wisconsin: 2000 -------------------------------- 14 Chart 11: Population Under Age 15 by Sex, Wisconsin: 2000 -------------------------------- 15 Chart 12: Young Hispanic Persons by Age and Sex, Wisconsin: 2000 ---------------------- 16 Chart 13: Types of Family and Non-Family Household Living Arrangements, Wisconsin: 2000 -------------------------------------------------------------------------- 17 Chart 14: Average Number of Persons in Families by Heritage, Wisconsin: 2000 --------- 18 Chart 15: Average Number of Persons in Households by Heritage, Wisconsin: 2000 ----- 19 Chart 16: Households by Presence of Non-Relatives and Heritage, Wisconsin: 2000 ----- 20 Chart 17: Percent Female Householders within Selected Categories, Wisconsin: 2000 --- 21 Chart 18: Educational Attainment among Persons 25 Years or Older, Wisconsin: 1990 & 2000 ------------------------------------------------------------------------------ 22 Chart 19: Educational Attainment by Sex among Hispanic Persons 25 Years or Older, Wisconsin: 1990 & 2000 ---------------------------------------------------------------- 23 Chart 20: Language Spoken at Home for Hispanic Persons 5 Years and Over, Wisconsin: 2000 ---------------------------------------------------------------------------------------- 24 Chart 21: Top Ten Districts in Limited-English Proficient Spanish-Speaking Students, Wisconsin: March 1999 ----------------------------------------------------------------- 25 Chart 22: Limited-English Proficient Spanish-Speaking Students by Grade Group, Wisconsin: March 1999 ----------------------------------------------------------------- 26 Chart 23: Median Household and Family Income, Wisconsin: 1999 ------------------------- 27 Chart 24: Household Income Distribution, Wisconsin: 1999 ---------------------------------- 28 Chart 25: Median Earnings by Sex among Year-Round, Full-Time Workers, Wisconsin: 1999 -------------------------------------------------------------------------- 29 Chart 26: Percent of Total and Hispanic Population Below Poverty Level by Age, Wisconsin: 1999 -------------------------------------------------------------------------- 31 Chart 27: Percent of Hispanics Below Poverty Level by Age, Wisconsin: 1989 & 1999 -- 32 Chart 28: Families with Female Householders in Poverty by Presence of Related Children Under Age 18, Wisconsin: 1999 ------------------------------------------------------- 33
HISPANIC CHARTBOOK
University of Wisconsin Extension & Applied Population Laboratory
IV
Chart 29: Families with Female Householders in Poverty by Presence of Related Children Under Age 18, Wisconsin: 1989 & 1999 ---------------------------------------------- 34 Chart 30: Employment Status for Persons Age 16 and Over by Sex, Wisconsin: 2000 ---- 35 Chart 31: Employment Status for the Hispanic Population Age 16 and Over by Sex, Wisconsin: 1990 & 2000 ---------------------------------------------------------------- 36 Chart 32: Employment Status by Presence of Own Children Under Age 18, for Females Age 16 and Over, Wisconsin: 2000 ----------------------------------------- 37 Chart 33: Median Housing Unit Value, Wisconsin: 2000 -------------------------------------- 38 Chart 34: Persons in Owner Occupied Housing Units, Wisconsin: 2000 -------------------- 39 Chart 35: Health Insurance Coverage, Wisconsin: 2000 --------------------------------------- 40 Chart 36: General Physical and Dental Exams by Race/Ethnicity, Wisconsin: 2000 ------- 41 Chart 37: Number of Hispanic Owned Firms by Classification, Wisconsin: 2000 --------- 42 Chart 38: Hispanic Owned Businesses with and without Paid Employees, Wisconsin: 2000 -------------------------------------------------------------------------- 43 List of Tables
Table 1: Total and Hispanic County Populations, Wisconsin: 1980-2000 ------------------- 45 Table 2: County Hispanic Populations as a Share of Total Hispanic Population, Wisconsin: 2000 -------------------------------------------------------------------------- 47
Table 3: Urban/Rural Residence, Wisconsin: 2000 --------------------------------------------- 47 Table 4: Heritage of Hispanics, Wisconsin: 2000 ----------------------------------------------- 48 Table 5: Race of Hispanic Persons, Wisconsin: 2000 ------------------------------------------ 48 Table 6: Birthplace of Total Population and Hispanics, Wisconsin: 2000 ------------------- 48 Table 7: Foreign-Born Population by Place of Birth, Wisconsin: 2000 ---------------------- 49 Table 8: Foreign Population Originating in Latin America by Place of Birth by Year of Entry, Wisconsin: 2000 ----------------------------------------------------- 49 Table 9: Residence in 1995 for Persons Age 5 and Over, Wisconsin: 2000 ----------------- 49 Table 10: Population by Age and Sex, Wisconsin: 2000 --------------------------------------- 50 Table 11: Median Age by Heritage and Sex, Wisconsin: 2000 -------------------------------- 50 Table 12: Population Under Age 15, Wisconsin: 2000 ----------------------------------------- 50 Table 13: Hispanic Young Persons by Age and Sex, Wisconsin: 2000 ---------------------- 51 Table 14: Types of Family and Non-Family Household Living Arrangements, Wisconsin: 2000 ------------------------------------------------------------------------- 52 Table 15: Average Number of Persons in Families by Heritage, Wisconsin: 2000 --------- 52 Table 16: Average Number of Persons in Households by Heritage, Wisconsin: 2000 ----- 52 Table 17: Households with Non-Relatives, Wisconsin: 2000 --------------------------------- 53 Table 18: Percent Female Householders within Selected Categories, Wisconsin: 2000 --- 53 Table 19: Educational Attainment Among Persons Age 25 and Over, Wisconsin: 1990 & 2000 ---------------------------------------------------------------- 54 Table 20: Educational Attainment Among Hispanic Persons Age 25 and Over by Sex, Wisconsin: 2000 --------------------------------------------------------------- 54 Table 21: Language Spoken at Home for Hispanic Persons Age 5 and Over, Wisconsin: 2000 ------------------------------------------------------------------------- 54 Table 22: Household Income Distribution, Wisconsin: 1999 ---------------------------------- 55

HISPANIC CHARTBOOK
University of Wisconsin Extension & Applied Population Laboratory
V
Table 23: Hispanics in Poverty, Wisconsin: 1999 ----------------------------------------------- 56 Table 24: Poverty Level by Age, Wisconsin: 1999 --------------------------------------------- 57 Table 25: Poverty Level by Age, Wisconsin: 1989 --------------------------------------------- 57 Table 26: Female-Headed Families Below Poverty Level by Presence of Related Children Under Age 18, Wisconsin: 1999 ---------------------------------- 57 Table 27: Female-Headed Families Below Poverty Level by Presence of Related Children Under Age 18, Wisconsin: 1989 ---------------------------------- 57 Table 28: Employment Status for the Population Age 16 and Over by Sex, Wisconsin: 2000 ------------------------------------------------------------------------- 58 Table 29: Employment Status for the Hispanic Population Age 16 and Over by Sex, Wisconsin: 1990 & 2000------------------------------------------------------ 58 Table 30: Employment Status by Presence of Own Children Under Age 18 for Females Age 16 and Over, Wisconsin: 2000 ---------------------------------------- 59 Table 31: Persons in Owner Occupied Housing Units, Wisconsin: 2000 -------------------- 60 Table 32: Health Insurance Coverage, Wisconsin: 2000 --------------------------------------- 61 Table 33: General Physical and Dental Exams by Race/Ethnicity, Wisconsin: 2000 ------ 61
HISPANIC CHARTBOOK
Applied Population Laboratory
Department of Rural Sociology University of Wisconsin-Madison/Extension
1450 Linden Drive, Room 316 Madison, WI 53706
(608) 265-9545
VI
ABOUT THIS REPORT This report presents demographic data on the Hispanic or Latino population in Wisconsin. The Applied Population Laboratory at the University of Wisconsin, Madison prepared this report for the Hispanic Educational Needs Assessment Project as part of the cross-divisional effort by University of Wisconsin Extension. The results of Census 2000 are highlighted in a series of charts, maps, and tables covering basic demographic and socioeconomic characteristics of the Hispanic population in Wisconsin such as: size and distribution; age structure; composition of households and families; education; income and poverty; employment; housing and health care. This report covers data available from the 2000 Census with comparisons, in some cases, to data from the 1990 Census. Information from several Wisconsin state agencies is also presented. The report is organized into eleven content sections. Generally, each section contains several maps or charts presenting data or trends that help paint a portrait of Hispanics or Latinos in Wisconsin. Attached to each map or chart is a short narrative which provides some discussion and highlights details in the data which might be of particular interest to readers. At the end of the report is a table section which provides the detailed data underlying most of the maps and charts. For quick reference, attached to most of the maps and charts is footnote indicating the table which contains the data used to create the graphic. In making use of the data presented in this report, it is important to understand that, as defined by federal and state government agencies, race and ethnicity are separate concepts. Since the 1980 Census, ethnicity in census data has referred to whether a person is of Hispanic origin or not of Hispanic origin. So, people of a specific racial background (like white, black or American Indian) can be Hispanic or not Hispanic. Likewise, Hispanics can be of any race. While some discussion of racial identification of Hispanics or Latinos is included, most of the data presented is for all Hispanics regardless of race. Finally, use of terminology and “labels” when talking about racial ethnic populations can be a sensitive issue. The authors of this report understand that Hispanic and Latino are often used interchangeably and there are some political, cultural and social preferences and implications in using one or the other term. While we would prefer to use both Hispanic and Latino in presenting this information, we have chosen to use Hispanic throughout the charts, maps and tables not only to simplify the labelling of data, but also to reflect the terminology and categorization used by federal and state government agencies. The principal authors of this report are David Long ([email protected]) and Dan Veroff ([email protected]) of the Applied Population Laboratory. With appreciation and thanks, the authors would like to acknowledge the advice and assistance provided by Jeanette Karon, Jennifer Vogt, and Elizabeth Wilke. Each lent their immense skills and talents in preparing data, constructing tables and charts, and editing text. For more information about this report, the authors can be contacted at the address listed below.
HISPANIC CHARTBOOK
University of Wisconsin Extension & Applied Population Laboratory
Source: 2000 Census of Population and Housing U.S. Census Bureau
VII
EXECUTIVE SUMMARY Wisconsin’s Hispanic Population: Still small though growing fast Wisconsin’s Hispanic or Latino population more than doubled from 93,232 in 1990 to 192,921
persons in 2000. The growth of the Hispanic population was especially rapid between 1990 and 2000 in
Southeastern Wisconsin, where nearly 80% of Wisconsin’s Hispanics reside. Some rural communities have experienced increases of over 300% in their Hispanic populations
since 1990. Wisconsin’s Hispanics are primarily Mexican in origin.
Wisconsin’s Hispanics differed in many ways from the total Wisconsin population in 2000 A higher percentage of Hispanics resided in urban areas than that of the total Wisconsin
population. There was higher mobility among Wisconsin’s Hispanic population between 1995 and 2000 than
in the total population. There was also a higher rate of in-migration to Wisconsin from a foreign country among Hispanics.
Wisconsin’s Hispanics had a younger median age than that of all Wisconsin residents combined There was a larger percentage of families among the Hispanic population, especially married
parents with children and single parents with children. Hispanic families and households were slightly larger than the average Wisconsin family or
household. There were larger percentages of female householders in all family types among Wisconsin
Hispanics when compared to the total Wisconsin population. Among homeowners, the median value of Hispanic-owned homes was lower than that of all
owner-occupied homes in Wisconsin. The percent of Hispanics that identified themselves as homeowners was also much lower than that in the total Wisconsin population.
Wisconsin’s Hispanics had lower levels of educational attainment and higher levels of poverty than the total Wisconsin population in 2000 Over 25% of Wisconsin’s Hispanics over the age of 25 had no high school education, although
Hispanic women had higher levels of educational attainment than Hispanic men. Nearly 12% of Wisconsin’s Hispanics earned less than $10,000 in 1999, with most Hispanics
earning less than $45,000 in 1999.
HISPANIC CHARTBOOK
University of Wisconsin Extension & Applied Population Laboratory
Source: 2000 Census of Population and Housing U.S. Census Bureau
VIII
While there was still a gender gap in earnings among Hispanics, it was smaller than in the total Wisconsin population in 1999. However, the average Hispanic male earned the same as the average Wisconsin female in 1999.
The Hispanic poverty rate in 2000 was more than twice the rate for all of Wisconsin. The combination of lower earnings and larger family size contributes to a greater risk of poverty for Hispanics.
The counties with the highest rates of Hispanic poverty were scattered across the state in predominantly rural areas. Southeastern Wisconsin (with the exception of Milwaukee County) had the lowest rates of poverty despite a high Hispanic population.
Hispanic men and women had higher rates of unemployment and non-participation in the labor force than in the total Wisconsin population in 2000. These rates have not improved since 1990.
Hispanics in Wisconsin were more likely than non-Hispanics to not have health insurance or to be insured for only part of the year in 2000.

HISPANICS IN WISCONSIN
University of Wisconsin Extension & Applied Population Laboratory
Source: 2000 Census of Population and Housing U.S. Census Bureau
1
Distribution of Hispanics (Numeric)
Maps 1 and 2 show the number of Hispanic persons in Wisconsin counties in 1990 and 2000. In both 1990 and 2000, Hispanics resided predominantly in the southeastern portion of the state. Although the Hispanic population increased significantly between 1990 and 2000, the general pattern shown in each of the maps remains similar; the counties with the most Hispanics in 1990 tended to have the most in 2000 as well.
Milwaukee County is shaded in gray, to distinguish it as having more then three times the Hispanic population of the second highest county both in 1990 and 2000. In 1990, only Milwaukee County had more than 10,000 Hispanics, by 2000 there were four Wisconsin counties with more than 10,000 persons of Hispanic origin: Milwaukee (82,406), Racine (14,990), Dane (14,387), and Kenosha (10,757).
1990 2000
Persons
0 - 500500 - 2,5002,500 - 5,0005,000 - 10,00010,000 - 15,00044,67282,406
Wisconsin Counties: 1990 & 2000
Maps 1 & 2. Hispanic PopulationMaps 1 & 2. Hispanic PopulationWisconsin Counties: 1990 & 2000
82,40644,67210,000 - 15,0005,000 - 10,0002,500 - 5,000500 - 2,5000 - 500
Persons
20001990
see table 1 for map data

HISPANICS IN WISCONSIN
University of Wisconsin Extension & Applied Population Laboratory
Source: 2000 Census of Population and Housing U.S. Census Bureau
2
Distribution of Hispanics (Percent) Maps 3 and 4 show Hispanics as a percent of each Wisconsin county’s total population. As with the
maps of Hispanic population counts among Wisconsin counties, the distribution of Hispanics in terms of percent is also concentrated in the southeastern counties. In 2000, four counties in Wisconsin had Hispanic or Latino populations that exceed 5% of the total county population: Milwaukee (8.8%), Racine (7.9%), Kenosha (7.2%), and Walworth (6.5%).
The maps below show distinct patterns from the previous maps in several ways. First, Racine County, rather than Milwaukee County, had the highest percentage (5.2%) of Hispanics in 1990. By 2000, however, Milwaukee County’s population was 8.8 percent Hispanic, surpassing Racine and Kenosha which were 7.9 and 7.2 percent Hispanic. Second, Menominee County stood out among its neighbors in the Northeast, with a comparatively high concentration of Hispanics both in 1990 (2.2 percent) and 2000 (2.7 percent).
20001990Percent Hispanic
0.1% - 1.0%1.0% - 2.0%2.0% - 3.0%3.0% - 5.0%5.0% - 8.8%
Maps 3 & 4. Percent HispanicWisconsin Counties: 1990 & 2000
see table 1 for map data

HISPANICS IN WISCONSIN
University of Wisconsin Extension & Applied Population Laboratory
Source: 2000 Census of Population and Housing U.S. Census Bureau
3
Population Change (Numeric) Maps 5 and 6 show the numerical change in the Hispanic population from 1980 to 1990 and from
1990 to 2000. Again, the pattern of growth reflects the existing centers of Hispanic population, with the greatest numeric increases occurring in counties in the southeast portion of the state. Between 1990 and 2000 a significant amount of growth also occurred in central Wisconsin extending North through the Fox Valley up to Brown County. Milwaukee County is again shown in gray to highlight the more dramatic numeric increase that occurred there in the two decades leading up to 2000. Between 1990 and 2000, five counties experienced an increase of greater than 5,000 persons in their Hispanic populations: Milwaukee (37,734), Dane (8,643), Brown (7,173), Racine (5,956) and Kenosha (5,177).
1980 - 1990 1990 - 2000
Population Change
-52 - 500500 - 1,0001,000 - 2,5002,500 - 5,0005,000 - 10,00015,32937,734
Wisconsin Counties: 1980 - 2000
Maps 5 & 6. Hispanic Population Change
see table 1 for map data
HISPANICS IN WISCONSIN
University of Wisconsin Extension & Applied Population Laboratory
Source: 2000 Census of Population and Housing U.S. Census Bureau
4
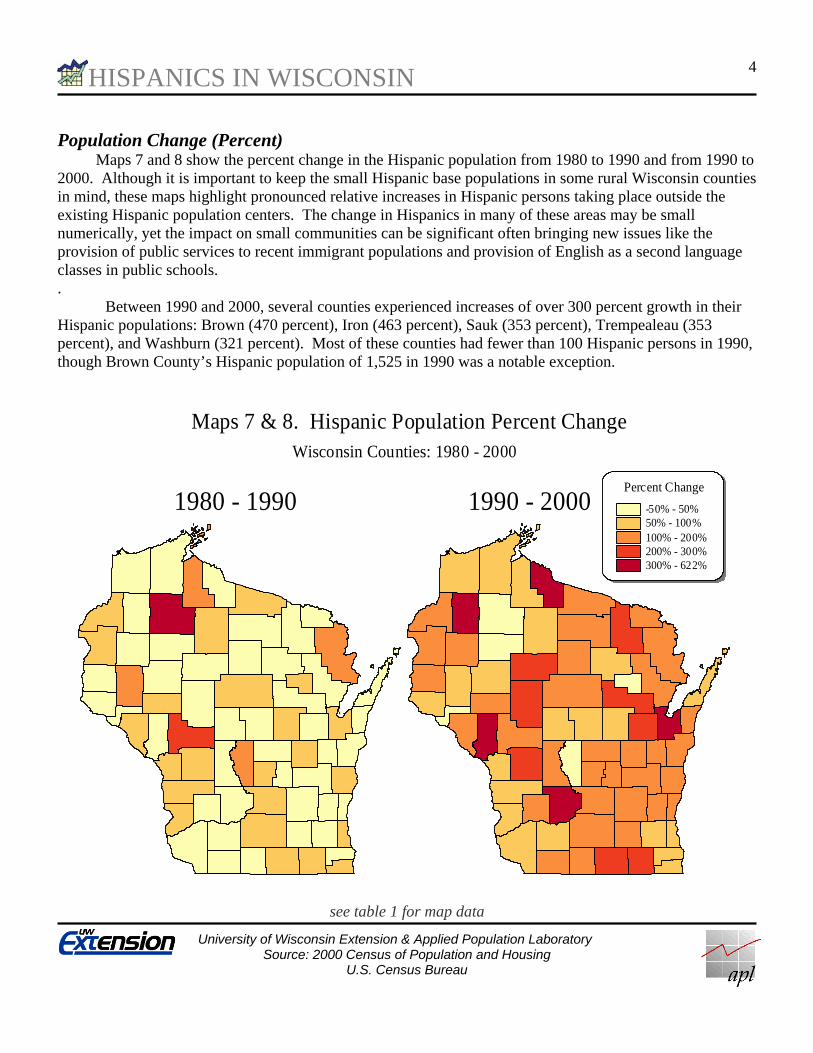
Population Change (Percent) Maps 7 and 8 show the percent change in the Hispanic population from 1980 to 1990 and from 1990 to 2000. Although it is important to keep the small Hispanic base populations in some rural Wisconsin counties in mind, these maps highlight pronounced relative increases in Hispanic persons taking place outside the existing Hispanic population centers. The change in Hispanics in many of these areas may be small numerically, yet the impact on small communities can be significant often bringing new issues like the provision of public services to recent immigrant populations and provision of English as a second language classes in public schools. .
Between 1990 and 2000, several counties experienced increases of over 300 percent growth in their Hispanic populations: Brown (470 percent), Iron (463 percent), Sauk (353 percent), Trempealeau (353 percent), and Washburn (321 percent). Most of these counties had fewer than 100 Hispanic persons in 1990, though Brown County’s Hispanic population of 1,525 in 1990 was a notable exception.
1990 - 20001980 - 1990Percent Change
-50% - 50%50% - 100%100% - 200%200% - 300%300% - 622%
Maps 7 & 8. Hispanic Population Percent ChangeWisconsin Counties: 1980 - 2000
see table 1 for map data

HISPANICS IN WISCONSIN
University of Wisconsin Extension & Applied Population Laboratory
Source: 2000 Census of Population and Housing U.S. Census Bureau
5
County Shares Chart 1 shows the distribution of Wisconsin’s Hispanic population among counties. Milwaukee
County contains by far the largest share, representing almost 43 percent of the state’s total Hispanic population. Milwaukee County is followed by Racine, Dane, and Kenosha counties, each with less than 8 percent of the Hispanic population in 2000. Together, the eight counties listed on the chart below were home to nearly 80 percent of Wisconsin Hispanics in 2000
Milwaukee 42.7%
Racine 7.8%
Dane 7.5%
Kenosha 5.6%
Waukesha 4.9%
Brown 4.5%
Walworth 3.2%
Rock 3.1%
Remaining Counties 20.8%
Chart 1. Distribution of Wisconsin's Hispanic Population,Wisconsin Counties: 2000
see table 2 for chart data
HISPANICS IN WISCONSIN
University of Wisconsin Extension & Applied Population Laboratory
Source: 2000 Census of Population and Housing U.S. Census Bureau
6
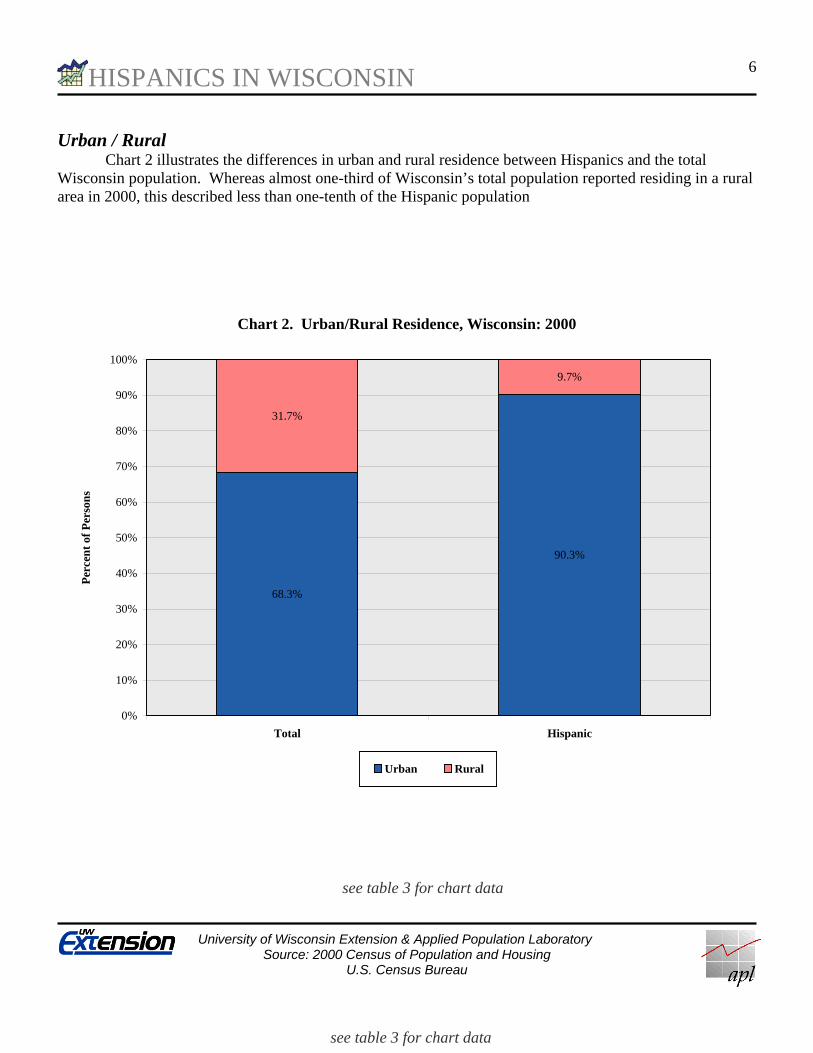
Urban / Rural Chart 2 illustrates the differences in urban and rural residence between Hispanics and the total
Wisconsin population. Whereas almost one-third of Wisconsin’s total population reported residing in a rural area in 2000, this described less than one-tenth of the Hispanic population
Chart 2. Urban/Rural Residence, Wisconsin: 2000
68.3%
90.3%
31.7%
9.7%
0%
10%
20%
30%
40%
50%
60%
70%
80%
90%
100%
Total Hispanic
Per
cen
t of
Per
son
s
Urban Rural
see table 3 for chart data
see table 3 for chart data

HISPANIC IDENTIFICATION
University of Wisconsin Extension & Applied Population Laboratory
Source: 2000 Census of Population and Housing U.S. Census Bureau
7
Heritage Census 2000 tabulated numerous sub-groups representing distinct ethnic identities within the
Hispanic population. Chart 3 shows 7 heritage subgroups: Mexican, Puerto Rican, South American, Central American, Cuban, Dominican Republic, and the general category Other Hispanic or Latino. Wisconsin Hispanics are predominantly of Mexican heritage (66 percent). The next largest category, Puerto Rican, is considerably smaller (16 percent), but still a significant share relative to the other four specified categories, each representing less than three percent of total Hispanics.
Chart 3. Heritage of Hispanics, Wisconsin: 2000
Mexican 65.7%
Puerto Rican 15.7%
South American 2.1%
Central American 2.1%
Cuban 1.3%
Dominican Republic 0.3%
Other Hispanic or Latino 12.8%
see table 4 for chart data
HISPANIC IDENTIFICATION
University of Wisconsin Extension & Applied Population Laboratory
Source: 2000 Census of Population and Housing U.S. Census Bureau
8
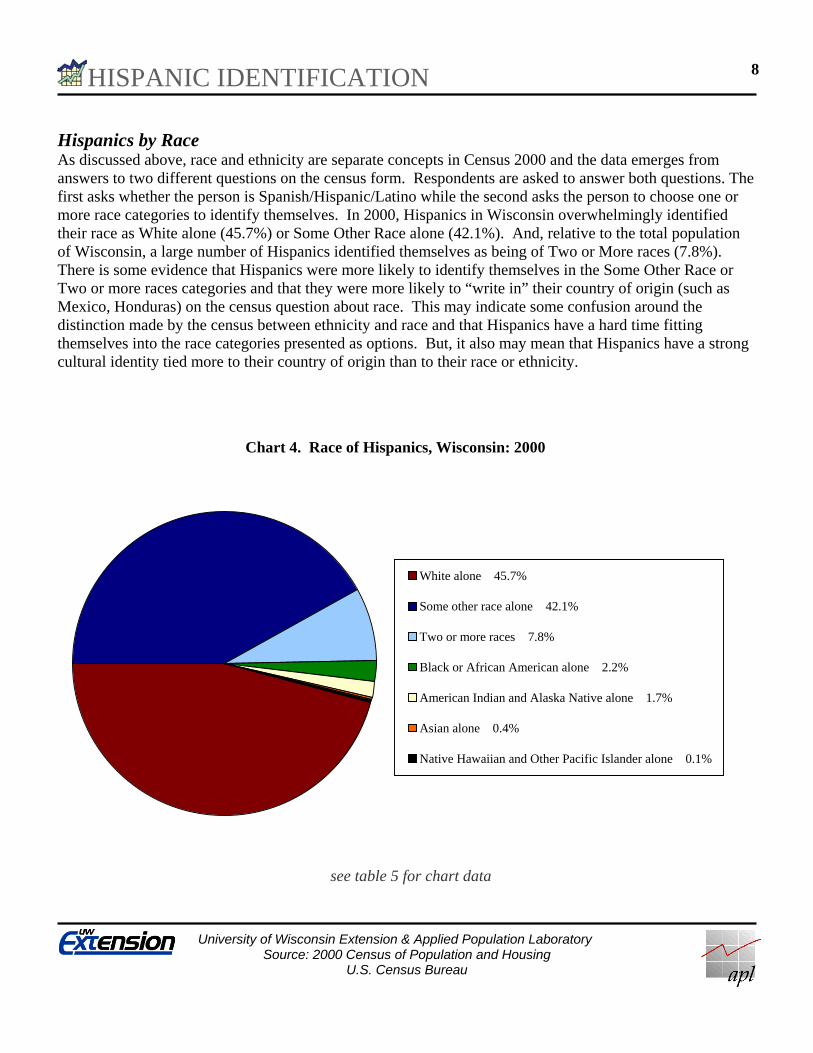
Hispanics by Race As discussed above, race and ethnicity are separate concepts in Census 2000 and the data emerges from answers to two different questions on the census form. Respondents are asked to answer both questions. The first asks whether the person is Spanish/Hispanic/Latino while the second asks the person to choose one or more race categories to identify themselves. In 2000, Hispanics in Wisconsin overwhelmingly identified their race as White alone (45.7%) or Some Other Race alone (42.1%). And, relative to the total population of Wisconsin, a large number of Hispanics identified themselves as being of Two or More races (7.8%). There is some evidence that Hispanics were more likely to identify themselves in the Some Other Race or Two or more races categories and that they were more likely to “write in” their country of origin (such as Mexico, Honduras) on the census question about race. This may indicate some confusion around the distinction made by the census between ethnicity and race and that Hispanics have a hard time fitting themselves into the race categories presented as options. But, it also may mean that Hispanics have a strong cultural identity tied more to their country of origin than to their race or ethnicity.
Chart 4. Race of Hispanics, Wisconsin: 2000
White alone 45.7%
Some other race alone 42.1%
Two or more races 7.8%
Black or African American alone 2.2%
American Indian and Alaska Native alone 1.7%
Asian alone 0.4%
Native Hawaiian and Other Pacific Islander alone 0.1%
see table 5 for chart data

HISPANIC IDENTIFICATION
University of Wisconsin Extension & Applied Population Laboratory
Source: 2000 Census of Population and Housing U.S. Census Bureau
9
Birthplace Chart 5 compares birthplace data for Wisconsin’s total and Hispanic populations. Almost three-
quarters of the total Wisconsin population was born in Wisconsin, and less than one-sixth of those born outside of Wisconsin were born outside the U.S. In contrast, approximately as many Hispanics were born outside the United States as were born in Wisconsin (about 40% each). The only similarity in the two populations is in the proportion of persons in the category Born elsewhere in the United States which includes roughly one-fifth of the population in each.
Chart 5. Birthplace of Total Population & Hispanics, Wisconsin: 2000
73%
40%
22%
20%
4%
40%
0%
10%
20%
30%
40%
50%
60%
70%
80%
90%
100%
Total Hispanics
Per
cent
of
Per
sons
Born outside the United States
Born elsewhere in the United States
Born in Wisconsin
see table 6 for chart data
HISPANIC IDENTIFICATION
University of Wisconsin Extension & Applied Population Laboratory
Source: 2000 Census of Population and Housing U.S. Census Bureau
10
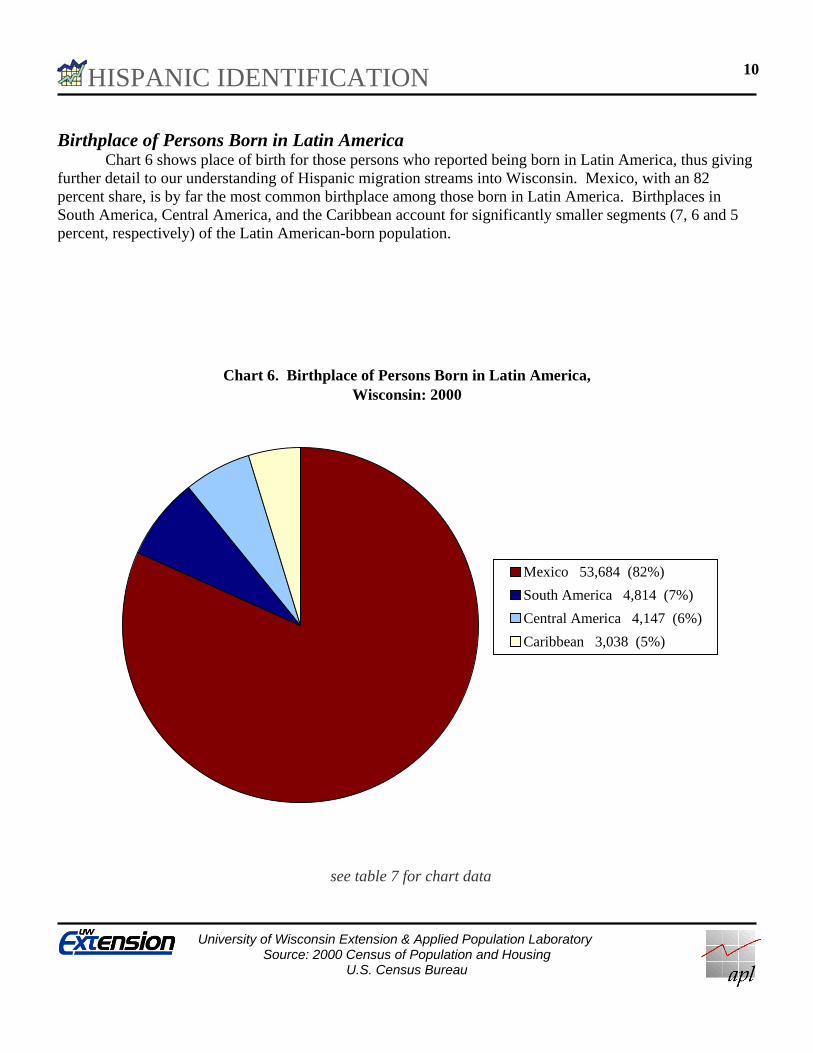
Birthplace of Persons Born in Latin America Chart 6 shows place of birth for those persons who reported being born in Latin America, thus giving
further detail to our understanding of Hispanic migration streams into Wisconsin. Mexico, with an 82 percent share, is by far the most common birthplace among those born in Latin America. Birthplaces in South America, Central America, and the Caribbean account for significantly smaller segments (7, 6 and 5 percent, respectively) of the Latin American-born population.
Chart 6. Birthplace of Persons Born in Latin America,Wisconsin: 2000
Mexico 53,684 (82%)
South America 4,814 (7%)
Central America 4,147 (6%)
Caribbean 3,038 (5%)
see table 7 for chart data

HISPANIC IDENTIFICATION
University of Wisconsin Extension & Applied Population Laboratory
Source: 2000 Census of Population and Housing U.S. Census Bureau
11
Year of Entry for Persons Born in Latin America The 2000 Census asked all people born outside the United States to report the year in which they
came to live in the United States. Chart 7 shows the resulting tabulation for those born in Latin America, highlighting the relatively recent entry of those born in Mexico, Central America, and South America. Except for persons of Caribbean origin, the number of in-migrants between 1990 and 2000 exceeds the total number of in-migrants prior to those years. This trend is most pronounced in the case of persons born in Mexico; those entering between 1990 and 2000 amount to almost twice the total from all previous years’ entry.
Chart 7. Year of Entry for Persons Born in Latin America,Wisconsin: 2000
15%
39%
13%
24%
20%
25%
36%20%
65%
36%
51%56%
0%
10%
20%
30%
40%
50%
60%
70%
80%
90%
100%
Mexico Caribbean Central America South America
Per
cen
t b
y R
egio
n o
f O
rigi
n
Before 1980 1980-1989 1990-2000
see table 8 for chart data
HISPANIC IDENTIFICATION
University of Wisconsin Extension & Applied Population Laboratory
Source: 2000 Census of Population and Housing U.S. Census Bureau
12
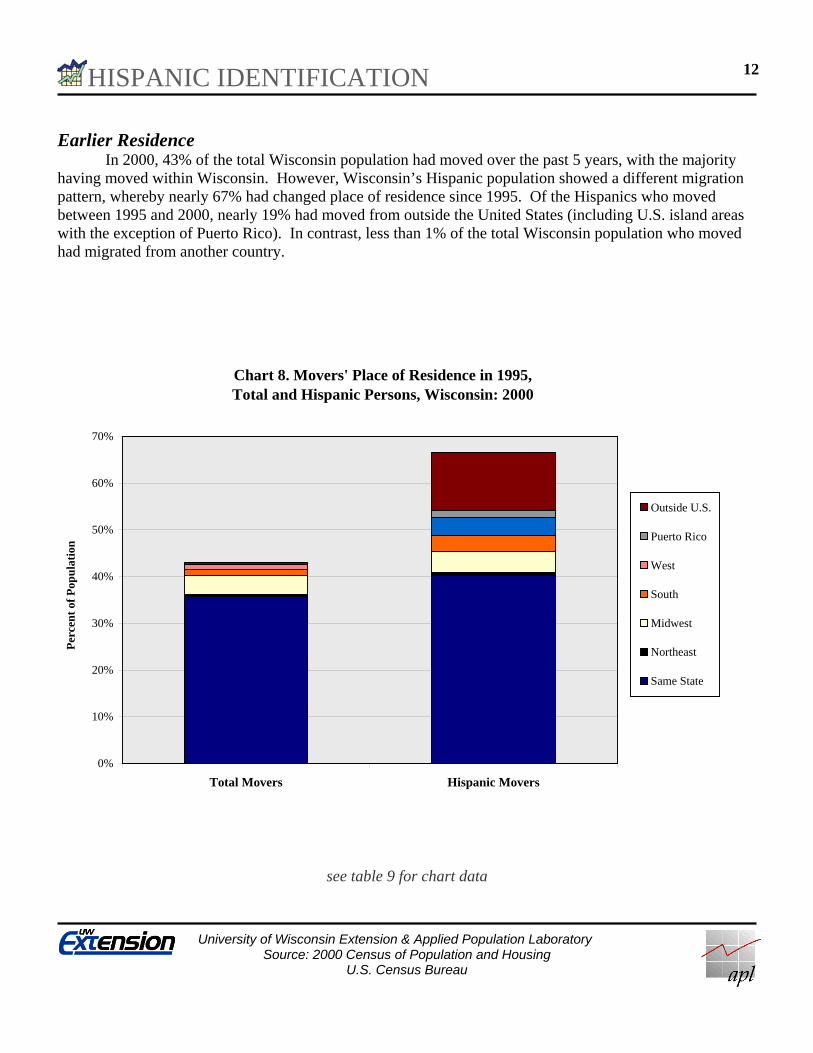
Earlier Residence In 2000, 43% of the total Wisconsin population had moved over the past 5 years, with the majority
having moved within Wisconsin. However, Wisconsin’s Hispanic population showed a different migration pattern, whereby nearly 67% had changed place of residence since 1995. Of the Hispanics who moved between 1995 and 2000, nearly 19% had moved from outside the United States (including U.S. island areas with the exception of Puerto Rico). In contrast, less than 1% of the total Wisconsin population who moved had migrated from another country.
Chart 8. Movers' Place of Residence in 1995, Total and Hispanic Persons, Wisconsin: 2000
0%
10%
20%
30%
40%
50%
60%
70%
Total Movers Hispanic Movers
Per
cen
t of
Pop
ula
tion
Outside U.S.
Puerto Rico
West
South
Midwest
Northeast
Same State
see table 9 for chart data

AGE & SEX
University of Wisconsin Extension & Applied Population Laboratory
Source: 2000 Census of Population and Housing U.S. Census Bureau
13
Population Pyramid Chart 9 illustrates the age differences between the Hispanic population in Wisconsin and the total
Wisconsin population. The combination of high fertility and higher in-migration rates among young persons creates a broad “base” for the Hispanic pyramid. The lowest age category, children under age five, represents 12.8 percent of the total Hispanic population, compared with only 6.4 percent of all persons in Wisconsin. Within the upper age categories, there is also a stark contrast between the Hispanic and total Wisconsin populations. Persons over age 65 comprise only 3 percent of the Hispanic population, compared with 13 percent of Wisconsin’s total population. Also noteworthy is the asymmetrical curve formed by the bars representing Hispanic males and females ages 15-34. This peculiarity is described further in Chart 12.
Chart 9. Total and Hispanic Population by Age and Sex, Wisconsin: 2000
7% 6% 5% 4% 3% 2% 1% 0% 1% 2% 3% 4% 5% 6% 7%
0 - 4
5 - 9
10 - 14
15 - 19
20 - 24
25 - 2930 - 34
35 - 39
40 - 44
45 - 49
50 - 54
55 - 59
60 - 64
65 - 69
70 - 74
75 - 79
80 - 84
85 +
Age
Gro
up
Percent
Hispanic Total
FemalesMales
see table 10 for chart data
AGE & SEX
University of Wisconsin Extension & Applied Population Laboratory
Source: 2000 Census of Population and Housing U.S. Census Bureau
14
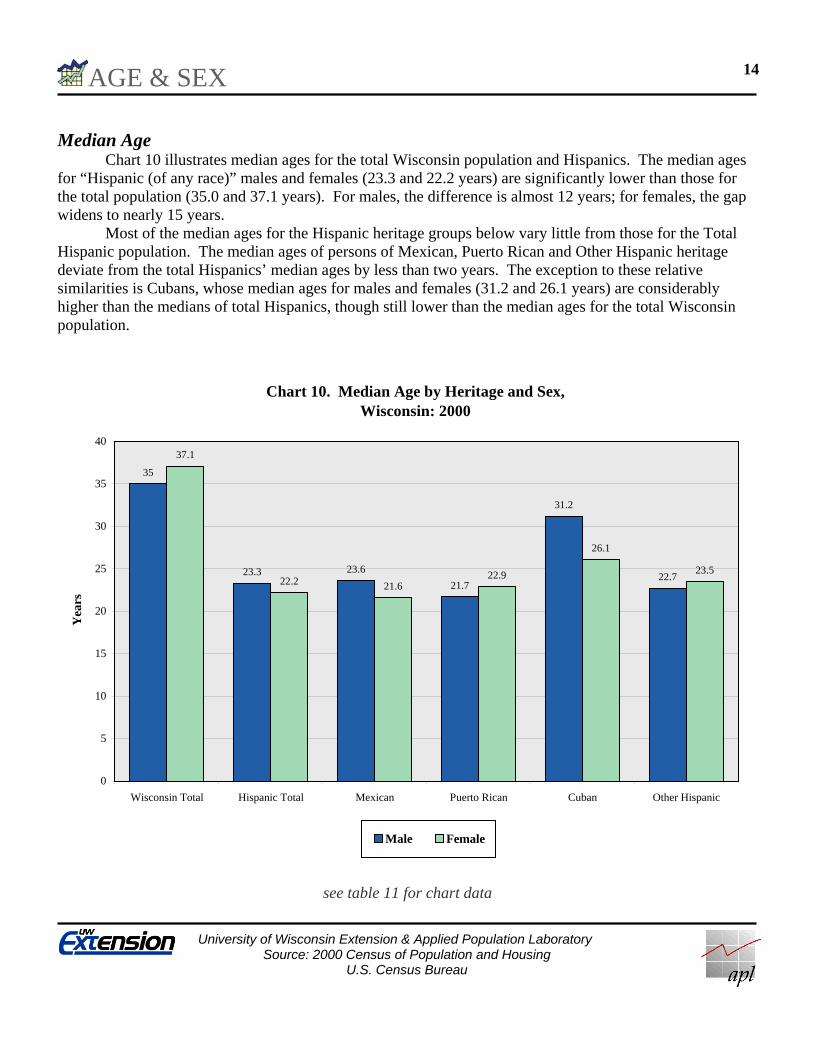
Median Age Chart 10 illustrates median ages for the total Wisconsin population and Hispanics. The median ages
for “Hispanic (of any race)” males and females (23.3 and 22.2 years) are significantly lower than those for the total population (35.0 and 37.1 years). For males, the difference is almost 12 years; for females, the gap widens to nearly 15 years.
Most of the median ages for the Hispanic heritage groups below vary little from those for the Total Hispanic population. The median ages of persons of Mexican, Puerto Rican and Other Hispanic heritage deviate from the total Hispanics’ median ages by less than two years. The exception to these relative similarities is Cubans, whose median ages for males and females (31.2 and 26.1 years) are considerably higher than the medians of total Hispanics, though still lower than the median ages for the total Wisconsin population.
Chart 10. Median Age by Heritage and Sex,Wisconsin: 2000
35
23.3 23.6
21.7
31.2
22.7
37.1
22.2 21.622.9
26.1
23.5
0
5
10
15
20
25
30
35
40
Wisconsin Total Hispanic Total Mexican Puerto Rican Cuban Other Hispanic
Yea
rs
Male Female
see table 11 for chart data

AGE & SEX
University of Wisconsin Extension & Applied Population Laboratory
Source: 2000 Census of Population and Housing U.S. Census Bureau
15
Population Under Age 15 Chart 11 shows the proportion of males and females under age 15, again comparing the Hispanic and
total Wisconsin populations. Over 35 percent of Hispanic females and over 31 percent of Hispanic males are under age 15, compared with less than 22 percent for each sex of the total Wisconsin population.
Chart 11. Population Under Age 15 by Sex,Wisconsin: 2000
31.4%
20.2%
35.4%
21.8%
0.0%
5.0%
10.0%
15.0%
20.0%
25.0%
30.0%
35.0%
40.0%
Total Hispanic
Per
cen
t U
nd
er 1
5 Y
ears
of
Age
Male Female
see table 12 for chart data
AGE & SEX
University of Wisconsin Extension & Applied Population Laboratory
Source: 2000 Census of Population and Housing U.S. Census Bureau
16
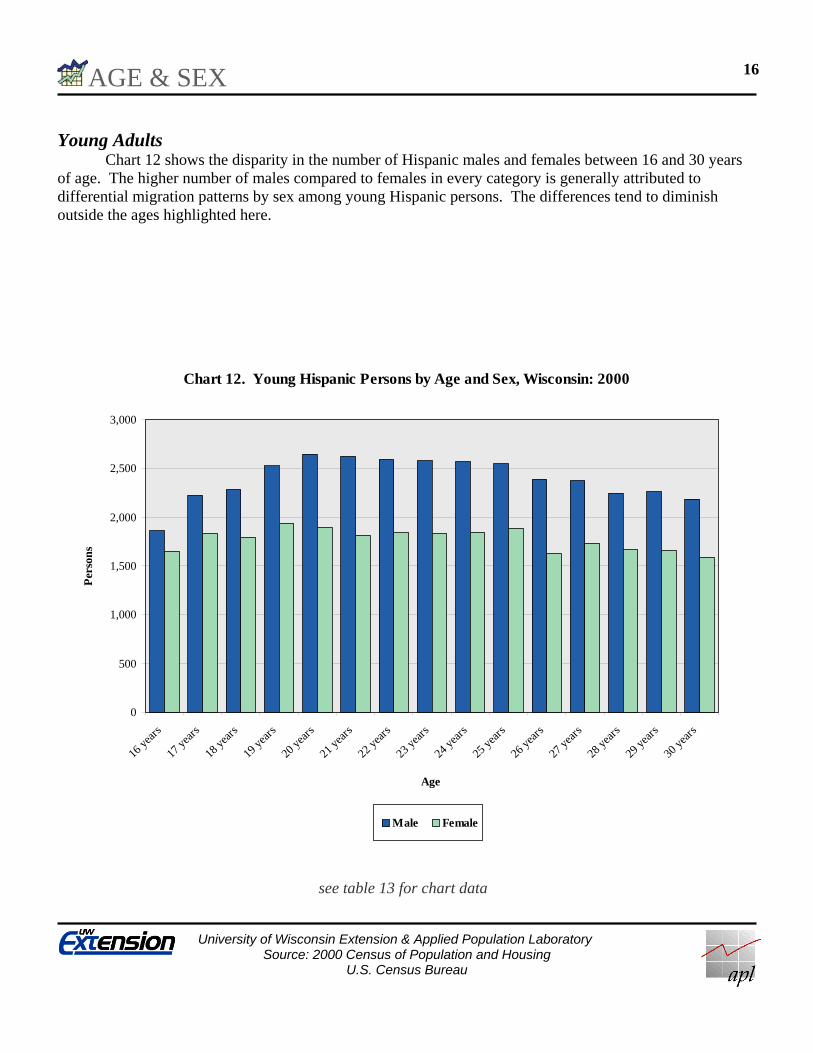
Young Adults Chart 12 shows the disparity in the number of Hispanic males and females between 16 and 30 years
of age. The higher number of males compared to females in every category is generally attributed to differential migration patterns by sex among young Hispanic persons. The differences tend to diminish outside the ages highlighted here.
Chart 12. Young Hispanic Persons by Age and Sex, Wisconsin: 2000
0
500
1,000
1,500
2,000
2,500
3,000
16 ye
ars
17 ye
ars
18 ye
ars
19 ye
ars
20 ye
ars
21 ye
ars
22 ye
ars
23 ye
ars
24 ye
ars
25 ye
ars
26 ye
ars
27 ye
ars
28 ye
ars
29 ye
ars
30 ye
ars
Age
Per
son
s
Male Female
see table 13 for chart data

FAMILIES AND HOUSEHOLDS
University of Wisconsin Extension & Applied Population Laboratory
Source: 2000 Census of Population and Housing U.S. Census Bureau
17
Living Arrangements Chart 13 shows the proportion of Hispanics and the total Wisconsin population in various household
living arrangements. The Census Bureau defines households as all the people occupying one housing unit (one place intended for separate occupancy). The term can apply to both family and non-family living arrangements. The data indicate that 76 percent of Hispanic households are families, compared with 67 percent of total Wisconsin households. Thus, a smaller proportion of Hispanic households are non-family households (persons who live alone or with someone not related by marriage, blood or adoption). The chart also shows that roughly one-third (34 percent) of Hispanic households are married couples with children under age 18, compared to less than one-fourth (24 percent) of the total population households. Furthermore, the proportion of single parents among Hispanic households is more than double that of the total population (18 versus 8 percent). Finally, almost one-third of the total population households (30 percent) are married couples with no children, but such arrangements are only half as prevalent among Hispanic households.
Chart 13. Types of Family and Non-Family Household Living Arrangements, Wisconsin: 2000
30%
27%
34%
18%
9% 9%7%
5%
8%
24%
15%15%
0.0%
5.0%
10.0%
15.0%
20.0%
25.0%
30.0%
35.0%
40.0%
MarriedCouples, No
Children
MarriedCouples, With
Children
Single Parent Other Family Alone With Others
Per
cen
t
Total Hispanic
Family Non-Family
see table 14 for chart data

FAMILIES AND HOUSEHOLDS
University of Wisconsin Extension & Applied Population Laboratory
Source: 2000 Census of Population and Housing U.S. Census Bureau
18
Family Size Chart 14 shows the variation in average family size among the total Wisconsin population, total
Hispanics and several specific Hispanic heritage groups. Hispanic families are larger, on average, than families in the total Wisconsin population. Among Hispanics, the average number of persons per family is 3.8, compared with 3.1 persons per family for the total Wisconsin population. Comparing specific Hispanic heritage groups also reveals differences in family size, ranging between 4.0 persons per family among Mexicans and 3.5 among Cubans.
Chart 14. Average Number of Persons in Families by Heritage, Wisconsin: 2000
3.1
3.84.0
3.63.5
3.6
0
0.5
1
1.5
2
2.5
3
3.5
4
4.5
Wisconsin Total Hispanic Total Mexican Puerto Rican Cuban Other Hispanic
Per
son
s
see table 15 for chart data
FAMILIES AND HOUSEHOLDS
University of Wisconsin Extension & Applied Population Laboratory
Source: 2000 Census of Population and Housing U.S. Census Bureau
19
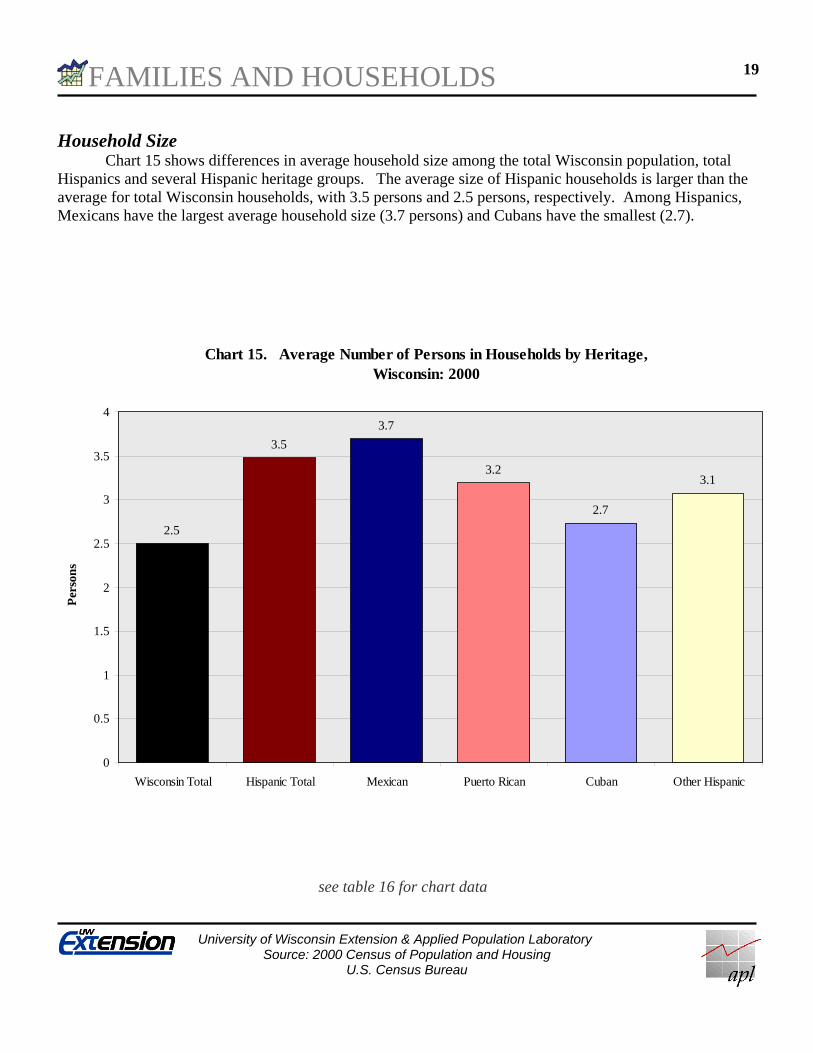
Household Size Chart 15 shows differences in average household size among the total Wisconsin population, total
Hispanics and several Hispanic heritage groups. The average size of Hispanic households is larger than the average for total Wisconsin households, with 3.5 persons and 2.5 persons, respectively. Among Hispanics, Mexicans have the largest average household size (3.7 persons) and Cubans have the smallest (2.7).
Chart 15. Average Number of Persons in Households by Heritage,Wisconsin: 2000
2.5
3.5
3.7
3.2
2.7
3.1
0
0.5
1
1.5
2
2.5
3
3.5
4
Wisconsin Total Hispanic Total Mexican Puerto Rican Cuban Other Hispanic
Per
son
s
see table 16 for chart data

FAMILIES AND HOUSEHOLDS
University of Wisconsin Extension & Applied Population Laboratory
Source: 2000 Census of Population and Housing U.S. Census Bureau
20
Households with Non-Relatives Chart 16 illustrates the prevalence of non-relatives living in households for the total Wisconsin
population, total Hispanics and selected Hispanic heritage groups. Non-relatives include any household members that are not related to the householder by birth, marriage, or adoption, including foster children. Within Hispanic households of any heritage, non-relatives are present at more than twice the rate for that of Wisconsin’s total households (22 percent versus 10 percent, respectively). Among Hispanic households, the presence of non-relatives is highest for those with householders of Mexican heritage (23 percent) and lowest for those with householders of Cubans heritage (16 percent).
Chart 16. Households by Presence of Non-Relatives and Heritage,Wisconsin: 2000
10%
22%
23%
20%
16%
19%
0%
5%
10%
15%
20%
25%
Wisconsin Total Hispanic Total Mexican Puerto Rican Cuban Other Hispanic
Per
cen
t of
Per
son
s
see table 17 for chart data
FAMILIES AND HOUSEHOLDS
University of Wisconsin Extension & Applied Population Laboratory
Source: 2000 Census of Population and Housing U.S. Census Bureau
21
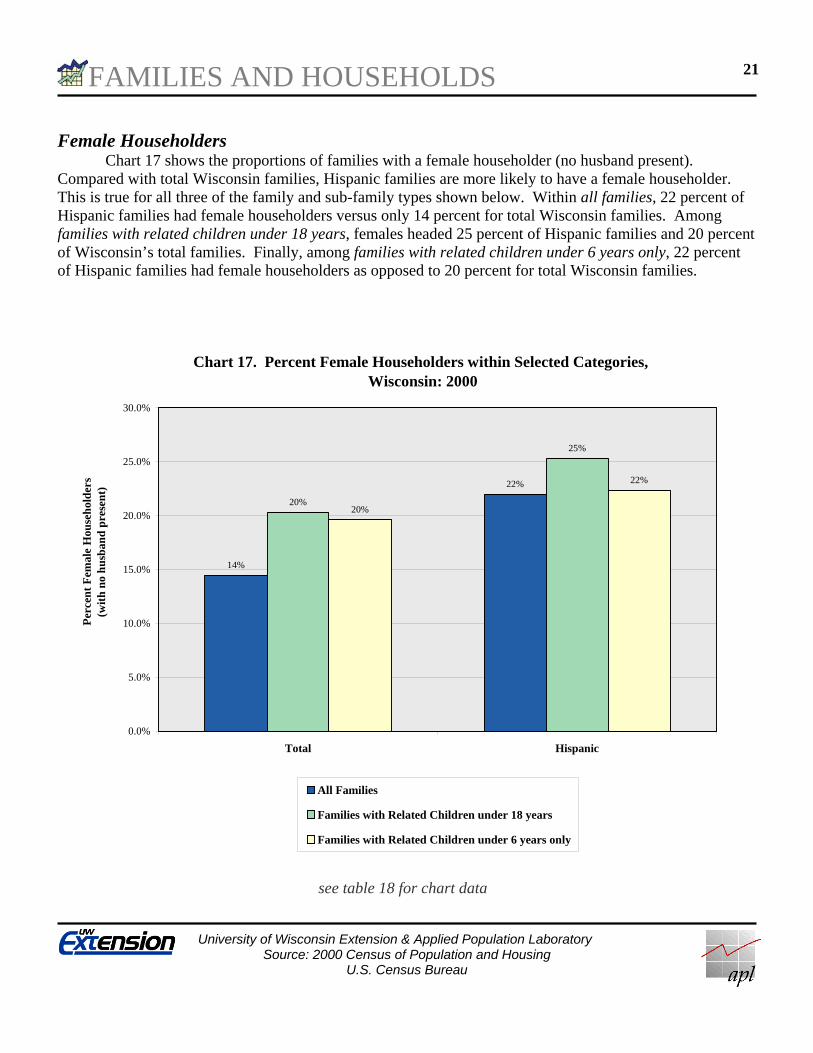
Female Householders Chart 17 shows the proportions of families with a female householder (no husband present).
Compared with total Wisconsin families, Hispanic families are more likely to have a female householder. This is true for all three of the family and sub-family types shown below. Within all families, 22 percent of Hispanic families had female householders versus only 14 percent for total Wisconsin families. Among families with related children under 18 years, females headed 25 percent of Hispanic families and 20 percent of Wisconsin’s total families. Finally, among families with related children under 6 years only, 22 percent of Hispanic families had female householders as opposed to 20 percent for total Wisconsin families.
Chart 17. Percent Female Householders within Selected Categories, Wisconsin: 2000
14%
22%
20%
25%
20%
22%
0.0%
5.0%
10.0%
15.0%
20.0%
25.0%
30.0%
Total Hispanic
Per
cen
t F
emal
e H
ouse
hol
der
s(w
ith
no
hu
sban
d p
rese
nt)
All Families
Families with Related Children under 18 years
Families with Related Children under 6 years only
see table 18 for chart data
EDUCATION
University of Wisconsin Extension & Applied Population Laboratory
Source: 2000 Census of Population and Housing U.S. Census Bureau
22
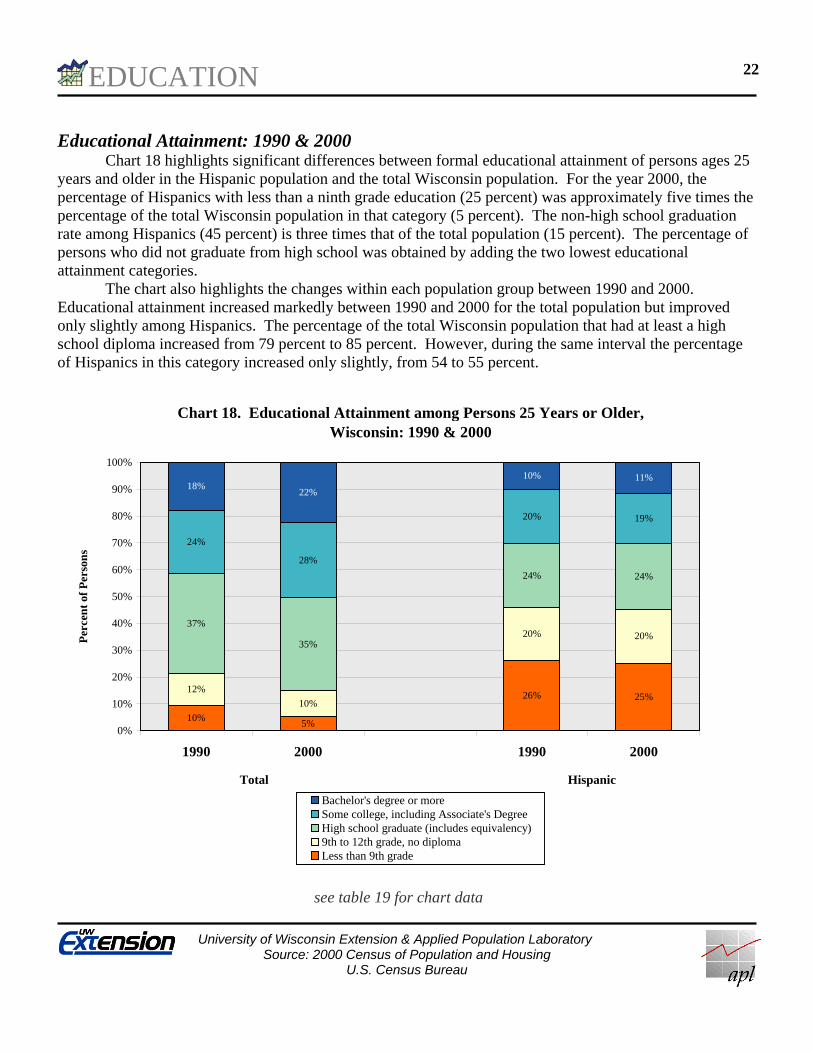
Educational Attainment: 1990 & 2000 Chart 18 highlights significant differences between formal educational attainment of persons ages 25
years and older in the Hispanic population and the total Wisconsin population. For the year 2000, the percentage of Hispanics with less than a ninth grade education (25 percent) was approximately five times the percentage of the total Wisconsin population in that category (5 percent). The non-high school graduation rate among Hispanics (45 percent) is three times that of the total population (15 percent). The percentage of persons who did not graduate from high school was obtained by adding the two lowest educational attainment categories.
The chart also highlights the changes within each population group between 1990 and 2000. Educational attainment increased markedly between 1990 and 2000 for the total population but improved only slightly among Hispanics. The percentage of the total Wisconsin population that had at least a high school diploma increased from 79 percent to 85 percent. However, during the same interval the percentage of Hispanics in this category increased only slightly, from 54 to 55 percent.
Chart 18. Educational Attainment among Persons 25 Years or Older, Wisconsin: 1990 & 2000
10%5%
26% 25%12%
10%
20% 20%37%
35%
24% 24%
24%
28%
20% 19%
18%22%
10% 11%
0%
10%
20%
30%
40%
50%
60%
70%
80%
90%
100%
1990 2000 1990 2000
Per
cen
t of
Per
son
s
Bachelor's degree or moreSome college, including Associate's DegreeHigh school graduate (includes equivalency)9th to 12th grade, no diplomaLess than 9th grade
Total Hispanic
see table 19 for chart data

EDUCATION
University of Wisconsin Extension & Applied Population Laboratory
Source: 2000 Census of Population and Housing U.S. Census Bureau
23
Educational Attainment by Sex Hispanic women have higher levels of formal educational attainment than Hispanic men. Chart 19
shows the share of the population within each educational category for each sex. There is a greater proportion of men in the categories with less than a high school diploma (including equivalency) and a greater proportion of women in the categories representing more than a high school education. Roughly the same proportions of Hispanic men and women are in the category of high school graduate (only).
The largest difference between the sexes is within the category representing the lowest level of educational attainment: those with less than a ninth grade education. Twenty-seven percent of Hispanic men fall into this group compared to only 23 percent of Hispanic women.
Chart 19. Educational Attainment by Sex among Hispanic Persons 25 Years and Older, Wisconsin: 2000
27%
21%
24%
18%
11%
23%
19%
24%
20%
12%
0%
5%
10%
15%
20%
25%
30%
Less than 9th grade 9th to 12th grade, nodiploma
High school graduate(includes equivalency)
Some college orAssociate's degree
Bachelor's degree ormore
Per
cen
t
Men Women
see table 20 for chart data
EDUCATION
University of Wisconsin Extension & Applied Population Laboratory
Source: 2000 Census of Population and Housing U.S. Census Bureau
24
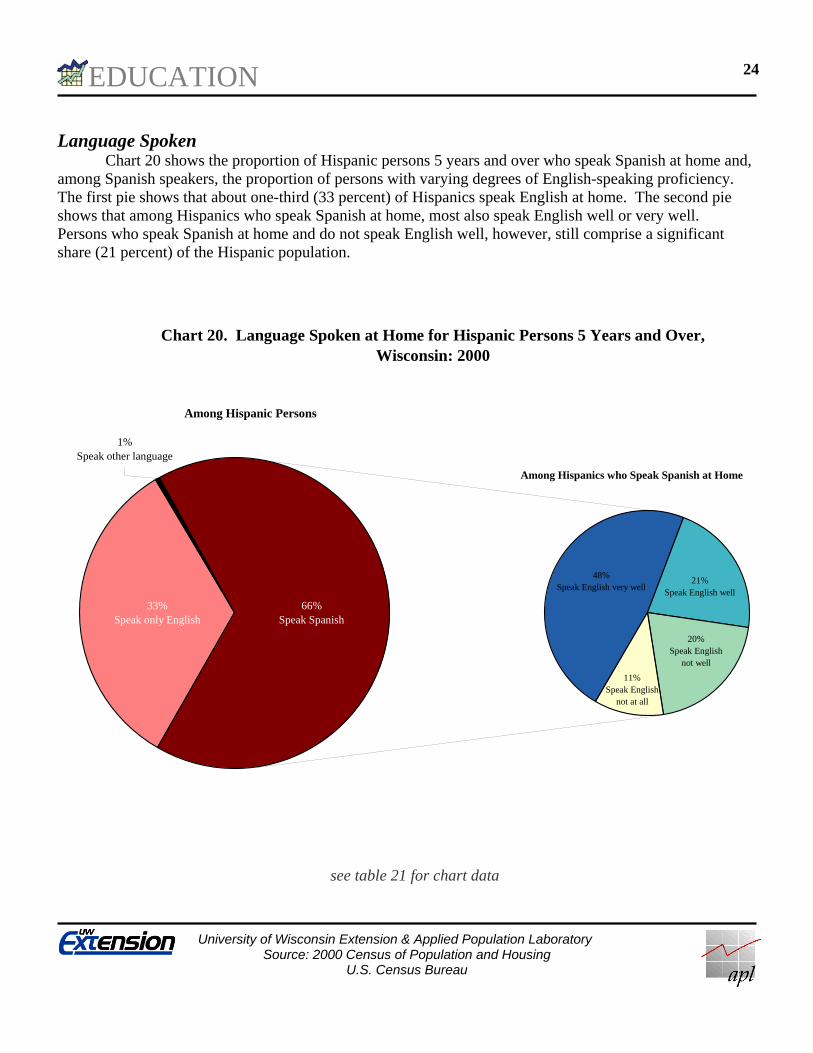
Language Spoken Chart 20 shows the proportion of Hispanic persons 5 years and over who speak Spanish at home and,
among Spanish speakers, the proportion of persons with varying degrees of English-speaking proficiency. The first pie shows that about one-third (33 percent) of Hispanics speak English at home. The second pie shows that among Hispanics who speak Spanish at home, most also speak English well or very well. Persons who speak Spanish at home and do not speak English well, however, still comprise a significant share (21 percent) of the Hispanic population.
66%Speak Spanish
1%Speak other language
33%Speak only English
Chart 20. Language Spoken at Home for Hispanic Persons 5 Years and Over,Wisconsin: 2000
Among Hispanic Persons
Among Hispanics who Speak Spanish at Home
48% Speak English very well
21% Speak English well
20% Speak English
not well
11% Speak English
not at all
see table 21 for chart data

EDUCATION
University of Wisconsin Extension & Applied Population Laboratory
Source: UW Whitewater Bilingual Teacher Training Program via Department of Public Instruction
25
Limited English Proficiency by District The data shown in Chart 21 were provided by the Wisconsin Department of Public Instruction. The
bars represent counts of Spanish-speaking students with limited English proficiency (LEP) by district. The Milwaukee district, with 5,059 Spanish-speaking LEP students, contains approximately 46 percent of Wisconsin’s total. This district alone nearly eclipses the combined total of the remaining districts, each of which has fewer than 900 LEP Spanish speakers.
Chart 21. Top Ten Districts inLimited-English Proficient Spanish-Speaking Students,
Wisconsin: March 1999
5,059
819 753569 503 399
277 269 206 158
1,896
0
1,000
2,000
3,000
4,000
5,000
6,000
Milw
auke
e
Racine
Green B
ay A
rea
Mad
ison M
etrop
olitan
Wau
kesh
a
Kenos
ha
Delava
n-Dari
en
Shebo
ygan
Area
Beloit
Wau
toma A
rea
All Othe
rs
School District
Nu
mbe
r of
Stu
den
ts
EDUCATION
University of Wisconsin Extension & Applied Population Laboratory
Source: UW Whitewater Bilingual Teacher Training Program via Department of Public Instruction
26
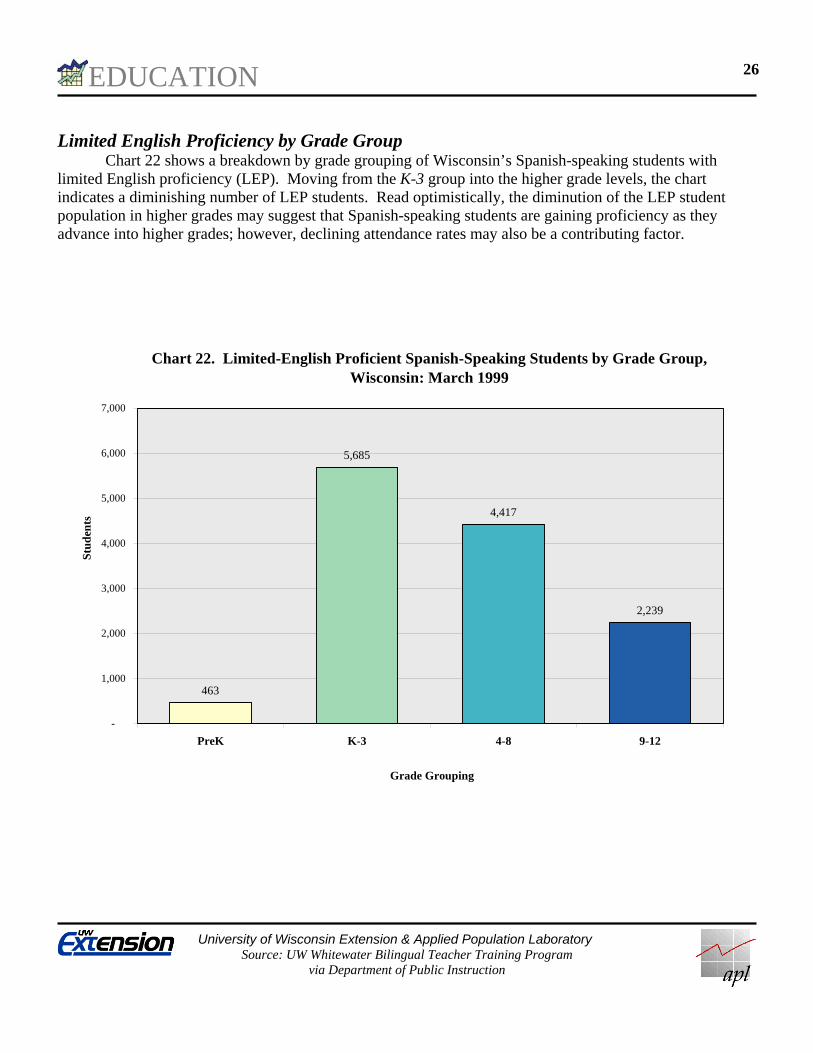
Limited English Proficiency by Grade Group Chart 22 shows a breakdown by grade grouping of Wisconsin’s Spanish-speaking students with
limited English proficiency (LEP). Moving from the K-3 group into the higher grade levels, the chart indicates a diminishing number of LEP students. Read optimistically, the diminution of the LEP student population in higher grades may suggest that Spanish-speaking students are gaining proficiency as they advance into higher grades; however, declining attendance rates may also be a contributing factor.
463
5,685
4,417
2,239
-
1,000
2,000
3,000
4,000
5,000
6,000
7,000
PreK K-3 4-8 9-12
Grade Grouping
Stu
den
ts
Chart 22. Limited-English Proficient Spanish-Speaking Students by Grade Group,Wisconsin: March 1999
INCOME
University of Wisconsin Extension & Applied Population Laboratory
Source: 2000 Census of Population and Housing U.S. Census Bureau
27
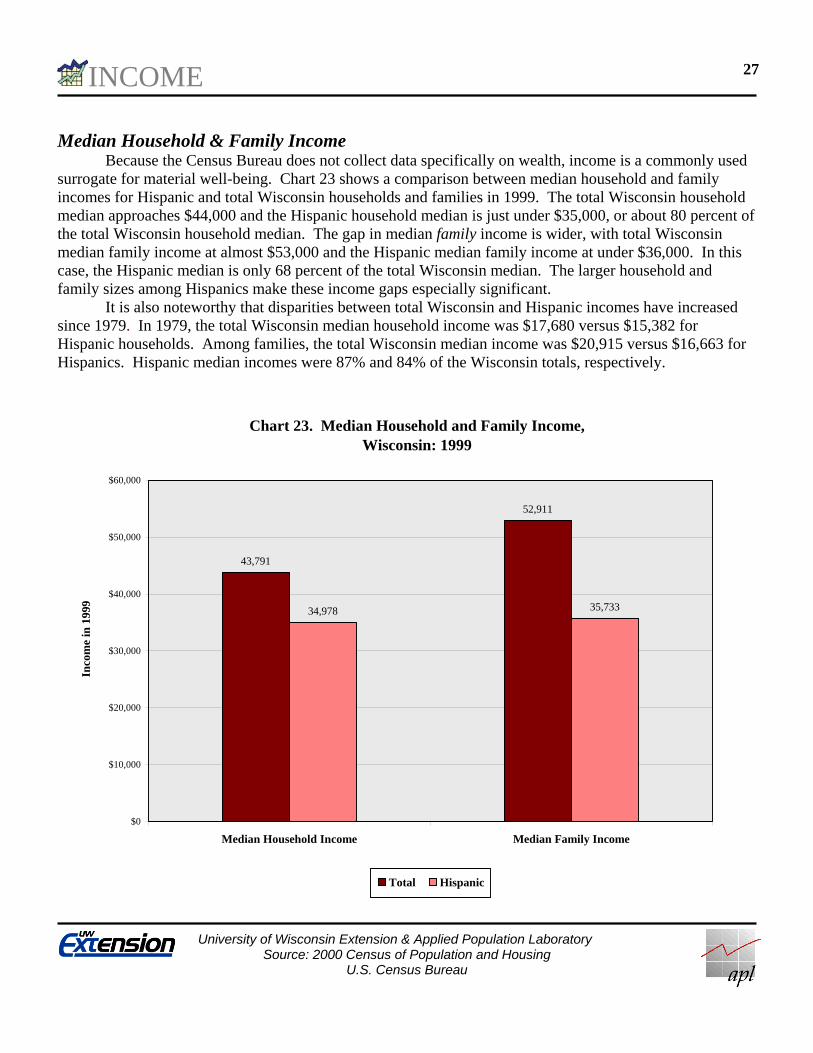
Median Household & Family Income Because the Census Bureau does not collect data specifically on wealth, income is a commonly used
surrogate for material well-being. Chart 23 shows a comparison between median household and family incomes for Hispanic and total Wisconsin households and families in 1999. The total Wisconsin household median approaches $44,000 and the Hispanic household median is just under $35,000, or about 80 percent of the total Wisconsin household median. The gap in median family income is wider, with total Wisconsin median family income at almost $53,000 and the Hispanic median family income at under $36,000. In this case, the Hispanic median is only 68 percent of the total Wisconsin median. The larger household and family sizes among Hispanics make these income gaps especially significant.
It is also noteworthy that disparities between total Wisconsin and Hispanic incomes have increased since 1979. In 1979, the total Wisconsin median household income was $17,680 versus $15,382 for Hispanic households. Among families, the total Wisconsin median income was $20,915 versus $16,663 for Hispanics. Hispanic median incomes were 87% and 84% of the Wisconsin totals, respectively.
Chart 23. Median Household and Family Income, Wisconsin: 1999
43,791
52,911
34,978 35,733
$0
$10,000
$20,000
$30,000
$40,000
$50,000
$60,000
Median Household Income Median Family Income
Inco
me
in 1
999
Total Hispanic

INCOME
University of Wisconsin Extension & Applied Population Laboratory
Source: 2000 Census of Population and Housing U.S. Census Bureau
28
Household Income Distribution
Chart 24 provides a more nuanced perspective on differences in household income, showing the percentages of households within specified income ranges for both Hispanic and total Wisconsin households. The income disparity is most apparent in the lowest range, Less than $10,000, which includes just over 7 percent of total Wisconsin households but more than 12 percent of Hispanic households. A larger share of Hispanic households is found in each of the income categories below $45,000. Among incomes $50,000 and above, the relative difference between total Wisconsin and Hispanic household incomes within each category tends to increase, strongly favoring total Wisconsin households in the upper range. When grouped together, the share of households in the $60,000 and above income categories represent 32 percent of total Wisconsin households though only 21 percent of Hispanic households.
Chart 24. Household Income Distribution, Wisconsin: 1999
0%
2%
4%
6%
8%
10%
12%
14%
Less t
han $
10,00
0
$10,0
00 to
$14,9
99
$15,0
00 to
$19,9
99
$20,0
00 to
$24,9
99
$25,0
00 to
$29,9
99
$30,0
00 to
$34,9
99
$35,0
00 to
$39,9
99
$40,0
00 to
$44,9
99
$45,0
00 to
$49,9
99
$50,0
00 to
$59,9
99
$60,0
00 to
$74,9
99
$75,0
00 to
$99,9
99
$100
,000 t
o $12
4,999
$125
,000 t
o $14
9,999
$150
,000 t
o $19
9,999
$200
,000 o
r mor
e
Per
cen
t of
Hou
seh
old
s
Total Hispanics
see table 22 for chart data

INCOME
University of Wisconsin Extension & Applied Population Laboratory
Source: 2000 Census of Population and Housing U.S. Census Bureau
29
Median Earnings by Sex Chart 25 shows a breakdown of earnings for the total and Hispanic populations by sex, revealing that
the “gender gap” is much more pronounced in the total Wisconsin population than it is among Hispanics. Female workers in the total Wisconsin population earn approximately 70 cents on the dollar to male workers, while Hispanic female workers earn nearly 85 cents on the dollar compared with their male counterparts. Hispanic male workers, however, have median earnings similar to that of total Wisconsin female workers. The median earnings for Hispanic females is about 86% percent of the median for Wisconsin females, whereas the median income for Hispanic males is only 71% of the Wisconsin male population’s median. Differences in earnings for workers within households help to explain the large gaps in household and family incomes shown previously.
Chart 25. Median Earnings by Sex among Year-Round, Full-Time Workers,Wisconsin: 1999
$37,062
$26,165$25,865
$22,154
$0
$5,000
$10,000
$15,000
$20,000
$25,000
$30,000
$35,000
$40,000
Total Hispanic
Male Female
POVERTY STATUS
University of Wisconsin Extension & Applied Population Laboratory
Source: 2000 Census of Population and Housing U.S. Census Bureau
30
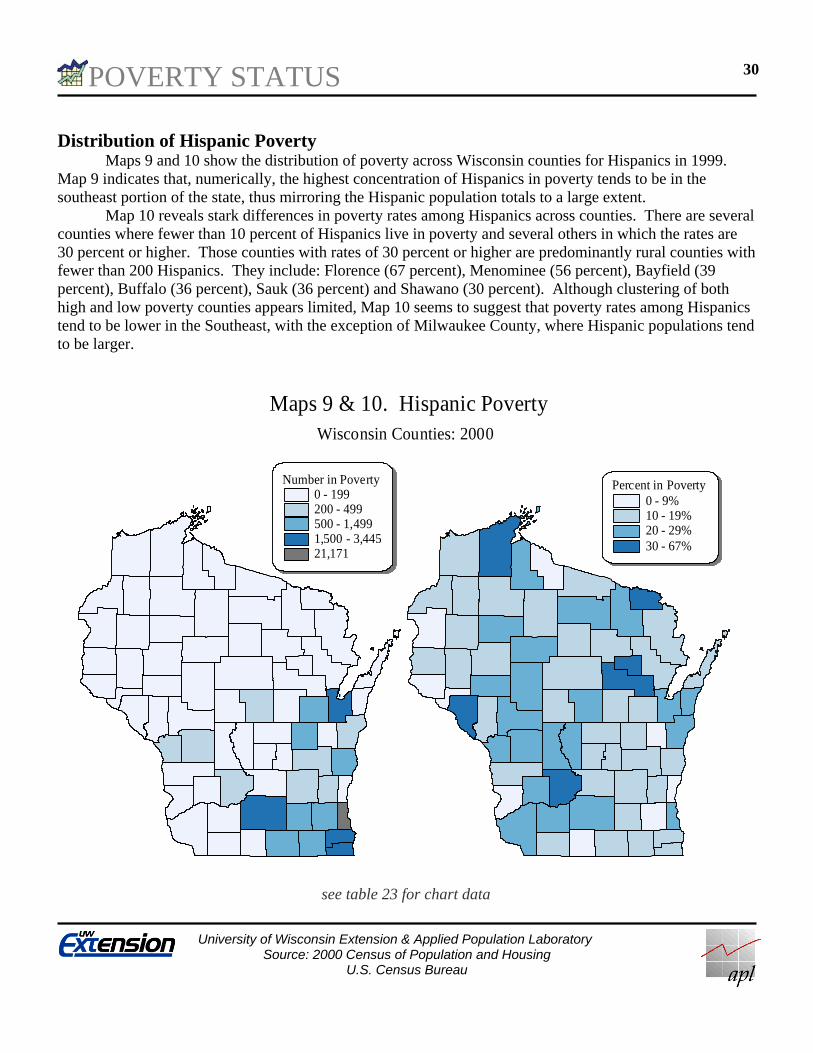
Distribution of Hispanic Poverty Maps 9 and 10 show the distribution of poverty across Wisconsin counties for Hispanics in 1999.
Map 9 indicates that, numerically, the highest concentration of Hispanics in poverty tends to be in the southeast portion of the state, thus mirroring the Hispanic population totals to a large extent.
Map 10 reveals stark differences in poverty rates among Hispanics across counties. There are several counties where fewer than 10 percent of Hispanics live in poverty and several others in which the rates are 30 percent or higher. Those counties with rates of 30 percent or higher are predominantly rural counties with fewer than 200 Hispanics. They include: Florence (67 percent), Menominee (56 percent), Bayfield (39 percent), Buffalo (36 percent), Sauk (36 percent) and Shawano (30 percent). Although clustering of both high and low poverty counties appears limited, Map 10 seems to suggest that poverty rates among Hispanics tend to be lower in the Southeast, with the exception of Milwaukee County, where Hispanic populations tend to be larger.
Percent in Poverty0 - 9%10 - 19%20 - 29%30 - 67%
Number in Poverty0 - 199200 - 499500 - 1,4991,500 - 3,44521,171
Wisconsin Counties: 2000
Maps 9 & 10. Hispanic Poverty
see table 23 for chart data
POVERTY STATUS
University of Wisconsin Extension & Applied Population Laboratory
Source: 2000 Census of Population and Housing U.S. Census Bureau
31
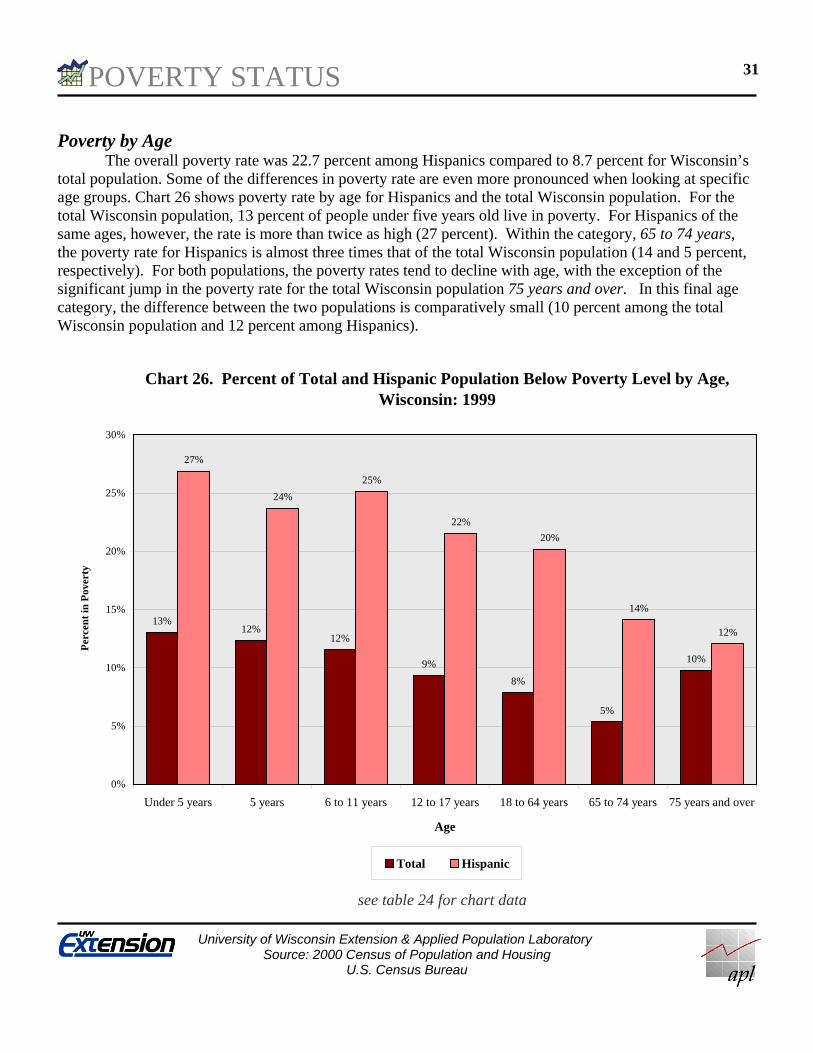
Poverty by Age The overall poverty rate was 22.7 percent among Hispanics compared to 8.7 percent for Wisconsin’s
total population. Some of the differences in poverty rate are even more pronounced when looking at specific age groups. Chart 26 shows poverty rate by age for Hispanics and the total Wisconsin population. For the total Wisconsin population, 13 percent of people under five years old live in poverty. For Hispanics of the same ages, however, the rate is more than twice as high (27 percent). Within the category, 65 to 74 years, the poverty rate for Hispanics is almost three times that of the total Wisconsin population (14 and 5 percent, respectively). For both populations, the poverty rates tend to decline with age, with the exception of the significant jump in the poverty rate for the total Wisconsin population 75 years and over. In this final age category, the difference between the two populations is comparatively small (10 percent among the total Wisconsin population and 12 percent among Hispanics).
13%12%
12%
9%
8%
5%
10%
27%
24%
25%
22%
20%
14%
12%
0%
5%
10%
15%
20%
25%
30%
Under 5 years 5 years 6 to 11 years 12 to 17 years 18 to 64 years 65 to 74 years 75 years and over
Age
Per
cent
in P
over
ty
Total Hispanic
Chart 26. Percent of Total and Hispanic Population Below Poverty Level by Age, Wisconsin: 1999
see table 24 for chart data

POVERTY STATUS
University of Wisconsin Extension & Applied Population Laboratory
Source: 2000 Census of Population and Housing U.S. Census Bureau
32
Poverty Status by Age: 1989 & 1999 Chart 27 presents the same poverty information for the Hispanic population in 1999 as the previous
chart, and compares it with Hispanic poverty status in 1989. Between 1989 and 1999, considerable reductions in the poverty rates occurred among Hispanics in almost every age category. The most dramatic improvements in poverty rate are indicated at either end of the age range, among those under 5 years and those 75 years and over. For those under five, the poverty rate fell from 40 percent to 27 percent. Among those over 75, the poverty rate declined by nearly half, from 23 to 12 percent. The largest category numerically, those 18 to 64 years, experienced the least change, with the rate declining from 22 to 20 percent.
Chart 27. Percent of Hispanics Below Poverty Level by Age,Wisconsin: 1989 & 1999
40%
34%33%
28%
22%
17%
27%
24%25%
22%20%
14%
12%
23%
0%
5%
10%
15%
20%
25%
30%
35%
40%
45%
Under 5 years 5 years 6 to 11 years 12 to 17 years 18 to 64 years 65 to 74 years 75 years and over
Age
Per
cen
t in
Pov
erty
1989 1999
see tables 24 & 25 for chart data
POVERTY STATUS
University of Wisconsin Extension & Applied Population Laboratory
Source: 2000 Census of Population and Housing U.S. Census Bureau
33
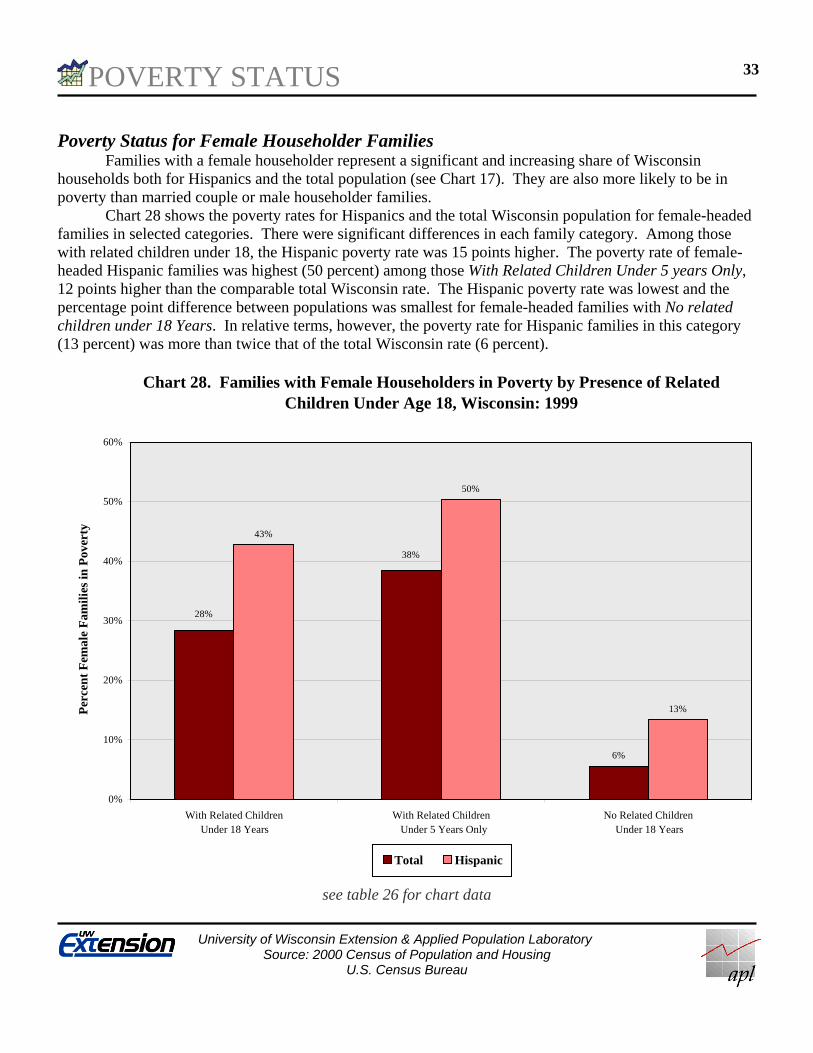
Poverty Status for Female Householder Families Families with a female householder represent a significant and increasing share of Wisconsin
households both for Hispanics and the total population (see Chart 17). They are also more likely to be in poverty than married couple or male householder families.
Chart 28 shows the poverty rates for Hispanics and the total Wisconsin population for female-headed families in selected categories. There were significant differences in each family category. Among those with related children under 18, the Hispanic poverty rate was 15 points higher. The poverty rate of female-headed Hispanic families was highest (50 percent) among those With Related Children Under 5 years Only, 12 points higher than the comparable total Wisconsin rate. The Hispanic poverty rate was lowest and the percentage point difference between populations was smallest for female-headed families with No related children under 18 Years. In relative terms, however, the poverty rate for Hispanic families in this category (13 percent) was more than twice that of the total Wisconsin rate (6 percent).
6%
43%
50%
13%
28%
38%
0%
10%
20%
30%
40%
50%
60%
With Related Children With Related Children No Related Children
Per
cen
t F
emal
e F
amil
ies
in P
over
ty
Total Hispanic
Chart 28. Families with Female Householders in Poverty by Presence of Related Children Under Age 18, Wisconsin: 1999
Under 18 Years Under 5 Years Only Under 18 Years
see table 26 for chart data
POVERTY STATUS
University of Wisconsin Extension & Applied Population Laboratory
Source: 2000 Census of Population and Housing U.S. Census Bureau
34
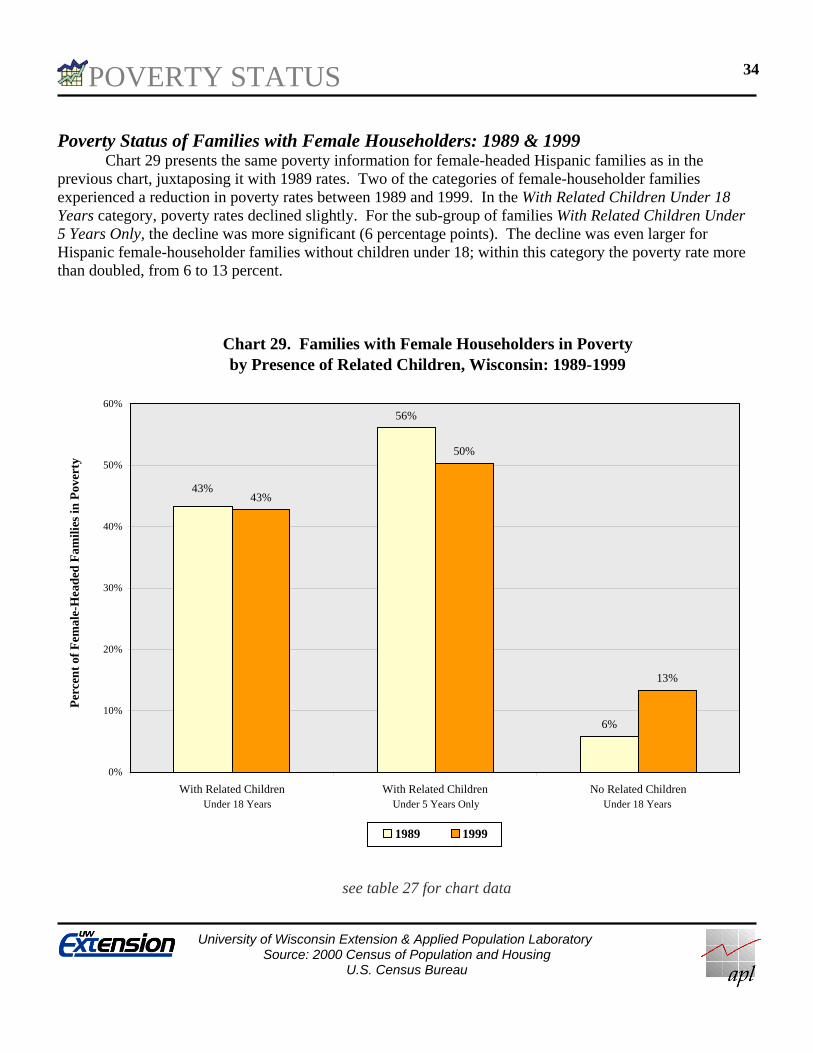
Poverty Status of Families with Female Householders: 1989 & 1999 Chart 29 presents the same poverty information for female-headed Hispanic families as in the
previous chart, juxtaposing it with 1989 rates. Two of the categories of female-householder families experienced a reduction in poverty rates between 1989 and 1999. In the With Related Children Under 18 Years category, poverty rates declined slightly. For the sub-group of families With Related Children Under 5 Years Only, the decline was more significant (6 percentage points). The decline was even larger for Hispanic female-householder families without children under 18; within this category the poverty rate more than doubled, from 6 to 13 percent.
6%
43%
50%
13%
43%
56%
0%
10%
20%
30%
40%
50%
60%
With Related Children With Related Children No Related Children
Per
cen
t of
Fem
ale-
Hea
ded
Fam
ilie
s in
Pov
erty
1989 1999
Chart 29. Families with Female Householders in Poverty by Presence of Related Children, Wisconsin: 1989-1999
Under 18 Years Under 5 Years Only Under 18 Years
see table 27 for chart data

LABOR FORCE
University of Wisconsin Extension & Applied Population Laboratory
Source: 2000 Census of Population and Housing U.S. Census Bureau
35
Employment Status by Sex: Hispanic and Total Chart 30 shows three categories of employment status, broken down by sex, for both the total
Wisconsin and Hispanic populations ages 16 years and older. As with other tabulations presented in this chart book, differences in the age, sex, and household composition of populations can be important determinants of labor force status.
The fundamental differences in employment status for the Hispanic population versus the total Wisconsin population are true for each sex. That is, the percentage of males and females not in the labor force is slightly higher for Hispanics than for the total Wisconsin population. Similarly, the unemployment rates for Hispanic males and females are roughly double the rates for their counterparts in the total Wisconsin population. The remaining share, the proportion of persons employed or in the Armed Forces, is slightly higher among males and females in the total Wisconsin population than in the Hispanic population.
70%
61%65%
54%
4%
3%
7%
6%
26%
36%28%
40%
0%
10%
20%
30%
40%
50%
60%
70%
80%
90%
100%
Males Females Males Females
Per
cen
t of
Per
son
s Not in labor force
Unemployed
Employed or inArmed Forces
Total Hispanic
Chart 30. Employment Status for Persons Age 16 and Over by Sex, Wisconsin: 2000
see table 28 for chart data
LABOR FORCE
University of Wisconsin Extension & Applied Population Laboratory
Source: 2000 Census of Population and Housing U.S. Census Bureau
36
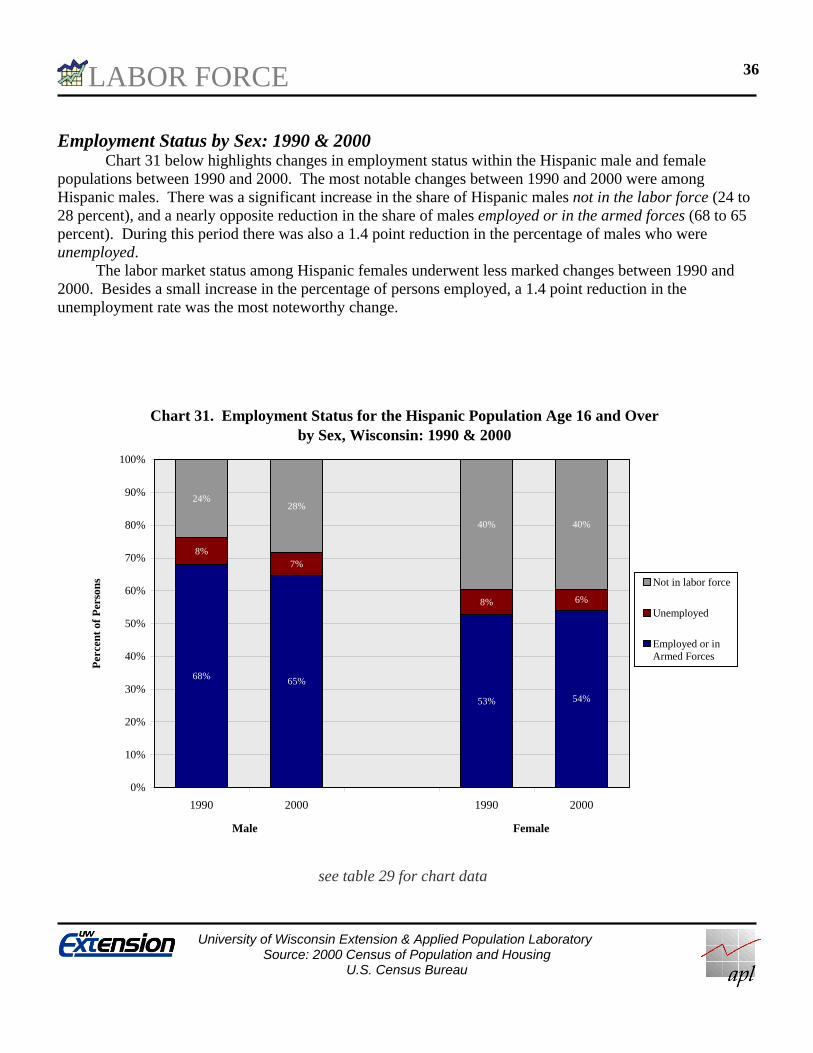
Employment Status by Sex: 1990 & 2000 Chart 31 below highlights changes in employment status within the Hispanic male and female
populations between 1990 and 2000. The most notable changes between 1990 and 2000 were among Hispanic males. There was a significant increase in the share of Hispanic males not in the labor force (24 to 28 percent), and a nearly opposite reduction in the share of males employed or in the armed forces (68 to 65 percent). During this period there was also a 1.4 point reduction in the percentage of males who were unemployed. The labor market status among Hispanic females underwent less marked changes between 1990 and 2000. Besides a small increase in the percentage of persons employed, a 1.4 point reduction in the unemployment rate was the most noteworthy change.
Chart 31. Employment Status for the Hispanic Population Age 16 and Overby Sex, Wisconsin: 1990 & 2000
68% 65%
53% 54%
8%7%
8% 6%
24%
40% 40%
28%
0%
10%
20%
30%
40%
50%
60%
70%
80%
90%
100%
1990 2000 1990 2000
Per
cent
of
Per
son
s Not in labor force
Unemployed
Employed or inArmed Forces
Male Female
see table 29 for chart data

LABOR FORCE
University of Wisconsin Extension & Applied Population Laboratory
Source: 2000 Census of Population and Housing U.S. Census Bureau
37
Employment Status for Females by Presence of Children Chart 32 provides a more detailed view of differences in labor market status among females in the
total Wisconsin and Hispanic populations, grouped according to the presence and age of children. Aside from the differences in labor market participation rates discussed previously, the most notable distinction here between the total Wisconsin and Hispanic populations is the difference in labor force participation among females with no children under 18. Among total Wisconsin females, the participation rate is much lower for the No Own Children Under 18 Years group than for the other two groups (55% compared with 76% and 70%). Among Hispanic females, however, the participation rates of those without children under 18 are roughly comparable to those in the other two categories. This difference likely reflects the age structure of females in the total Wisconsin and Hispanic populations (see chart 9), with a higher percentage of women over age 65 represented by the No Own Children Under 18 Years category within the total Wisconsin population.
Chart 32. Employment Status by Presence of Own Children Under Age 18, for Females Age 16 and Over, Wisconsin: 2000
76%70%
55% 55%48%
54%
3%
3%
3% 6%
8%
6%
21%26%
42% 39%44%
40%
0%
10%
20%
30%
40%
50%
60%
70%
80%
90%
100%
With OwnChildren Under
18 Years
With OwnChildren under
6 Years
No ownChildren under
18 Years
With OwnChildren Under
18 Years
With OwnChildren under
6 Years
No ownChildren under
18 Years
Per
cen
t
Not in labor force
Unemployed
Employed or inArmed Forces
Total Females Hispanic Females
see table 30 for chart data

HOUSING
University of Wisconsin Extension & Applied Population Laboratory
Source: 2000 Census of Population and Housing U.S. Census Bureau
38
Housing Value Chart 33 shows the median housing unit values for owner occupied units. In 2000, the median value for Wisconsin as a whole was $21,400 greater (24 percent more) than the Hispanic median.
Chart 33. Median Housing Unit Value, Wisconsin: 2000
$112,200
$90,800
$0
$20,000
$40,000
$60,000
$80,000
$100,000
$120,000
Total Hispanic

HOUSING
University of Wisconsin Extension & Applied Population Laboratory
Source: 2000 Census of Population and Housing U.S. Census Bureau
39
Tenure Chart 34 shows the percent of the total Wisconsin and Hispanic populations who live in owner
occupied housing units, a figure used to describe home ownership. A smaller proportion of Hispanics (40 percent) live in owner occupied housing units compared with individuals in the total Wisconsin population (73 percent). Among Hispanics, persons of Cuban and Other Hispanic origin had the highest occupancy rates (52 and 44 percent, respectively), and persons of Mexican and Puerto Rican heritage had the lowest (39 and 38 percent, respectively).
Chart 34. Persons in Owner Occupied Housing Units,Wisconsin: 2000
73%
40% 39% 38%
52%
44%
0%
10%
20%
30%
40%
50%
60%
70%
80%
Wisconsin Total Hispanic Total Mexican Puerto Rican Cuban Other Hispanic
Per
cen
t of
Per
son
s
see table 31 for chart data

HEALTHCARE
University of Wisconsin Extension & Applied Population Laboratory
Source: Wisconsin Family Health Survey 2000 (PHC5321) WI Department of Health and Family Services, February 2002
40
Health Insurance Chart 35 displays the rates of health insurance coverage in 2000. The data, provided by the
Wisconsin Department of Health and Family Services, are included to complement the Census 2000 tabulations on Hispanic socioeconomic indicators. This chart shows that Hispanics are almost four times as likely to have been uninsured than non-Hispanic Whites (12 percent and 3 percent, respectively). They are also more than three times as likely as non-Hispanic Whites to have been insured for only a portion of the year (23 and 7 percent, respectively).
Chart 35. Health Insurance Coverage, Wisconsin: 2000
89%
77% 78%
60%
7%
14%11%
23%
3%7% 11% 12%
0%
10%
20%
30%
40%
50%
60%
70%
80%
90%
100%
White, Non-Hispanic Black, Non-Hispanic Amer. Indian, Non-Hispanic
Hispanic
Per
cen
t of
Per
son
s
Uninsured All Year
Insured Part of the Year
Insured All Year
see table 32 for chart data
HEALTHCARE
University of Wisconsin Extension & Applied Population Laboratory
Source: Wisconsin Family Health Survey 2000 (PHC5321) WI Department of Health and Family Services, February 2002
41
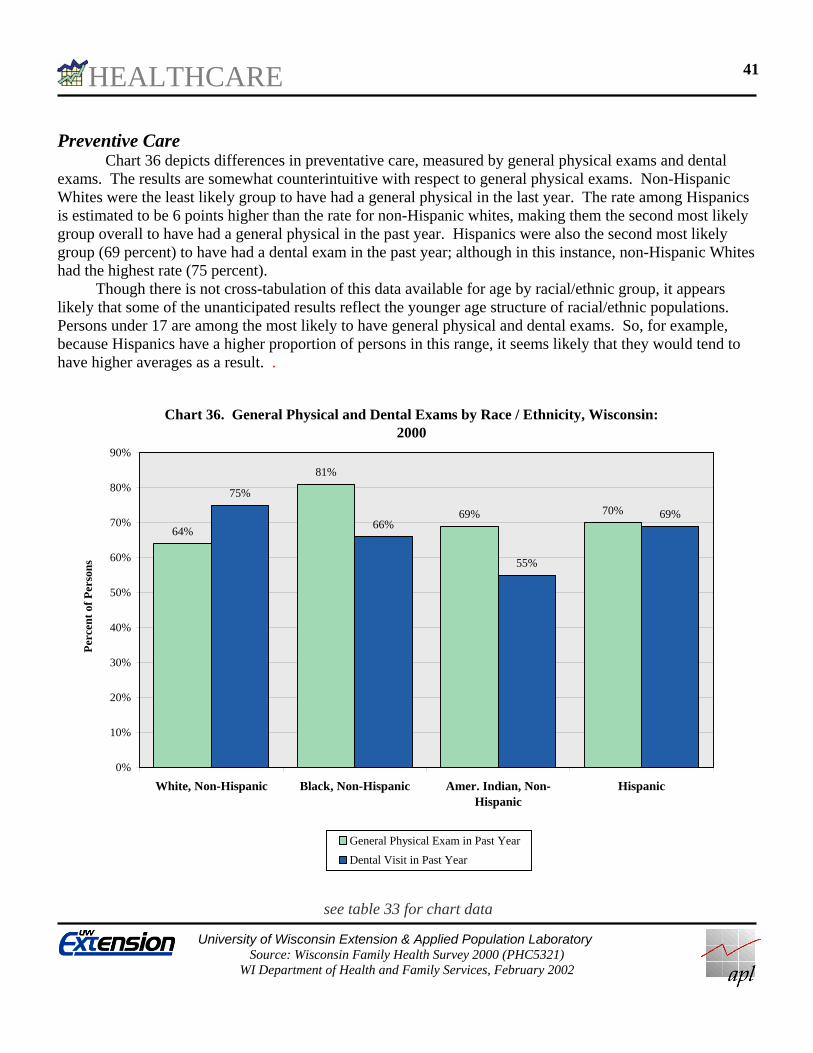
Preventive Care Chart 36 depicts differences in preventative care, measured by general physical exams and dental
exams. The results are somewhat counterintuitive with respect to general physical exams. Non-Hispanic Whites were the least likely group to have had a general physical in the last year. The rate among Hispanics is estimated to be 6 points higher than the rate for non-Hispanic whites, making them the second most likely group overall to have had a general physical in the past year. Hispanics were also the second most likely group (69 percent) to have had a dental exam in the past year; although in this instance, non-Hispanic Whites had the highest rate (75 percent). Though there is not cross-tabulation of this data available for age by racial/ethnic group, it appears likely that some of the unanticipated results reflect the younger age structure of racial/ethnic populations. Persons under 17 are among the most likely to have general physical and dental exams. So, for example, because Hispanics have a higher proportion of persons in this range, it seems likely that they would tend to have higher averages as a result. .
Chart 36. General Physical and Dental Exams by Race / Ethnicity, Wisconsin: 2000
64%
81%
69% 70%
75%
66%
55%
69%
0%
10%
20%
30%
40%
50%
60%
70%
80%
90%
White, Non-Hispanic Black, Non-Hispanic Amer. Indian, Non-Hispanic
Hispanic
Per
cen
t of
Per
son
s
General Physical Exam in Past Year
Dental Visit in Past Year
see table 33 for chart data
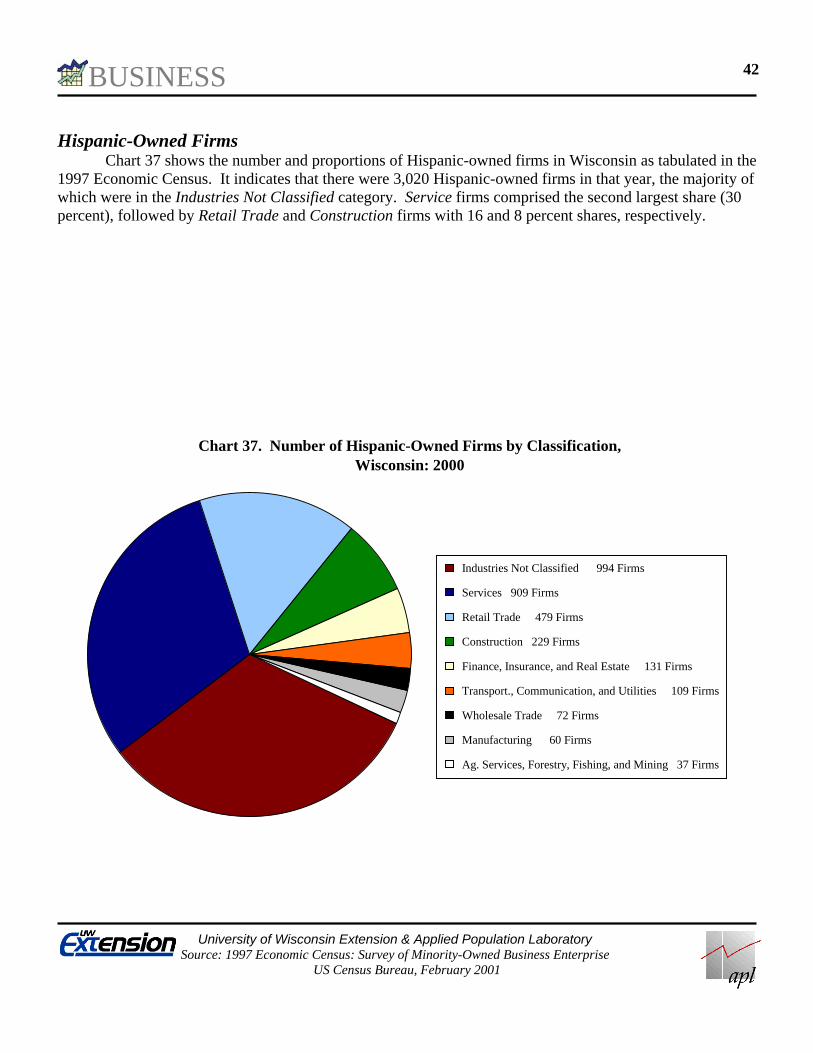
BUSINESS
University of Wisconsin Extension & Applied Population Laboratory
Source: 1997 Economic Census: Survey of Minority-Owned Business Enterprise US Census Bureau, February 2001
42
Hispanic-Owned Firms Chart 37 shows the number and proportions of Hispanic-owned firms in Wisconsin as tabulated in the
1997 Economic Census. It indicates that there were 3,020 Hispanic-owned firms in that year, the majority of which were in the Industries Not Classified category. Service firms comprised the second largest share (30 percent), followed by Retail Trade and Construction firms with 16 and 8 percent shares, respectively.
Chart 37. Number of Hispanic-Owned Firms by Classification,Wisconsin: 2000
Industries Not Classified 994 Firms
Services 909 Firms
Retail Trade 479 Firms
Construction 229 Firms
Finance, Insurance, and Real Estate 131 Firms
Transport., Communication, and Utilities 109 Firms
Wholesale Trade 72 Firms
Manufacturing 60 Firms
Ag. Services, Forestry, Fishing, and Mining 37 Firms
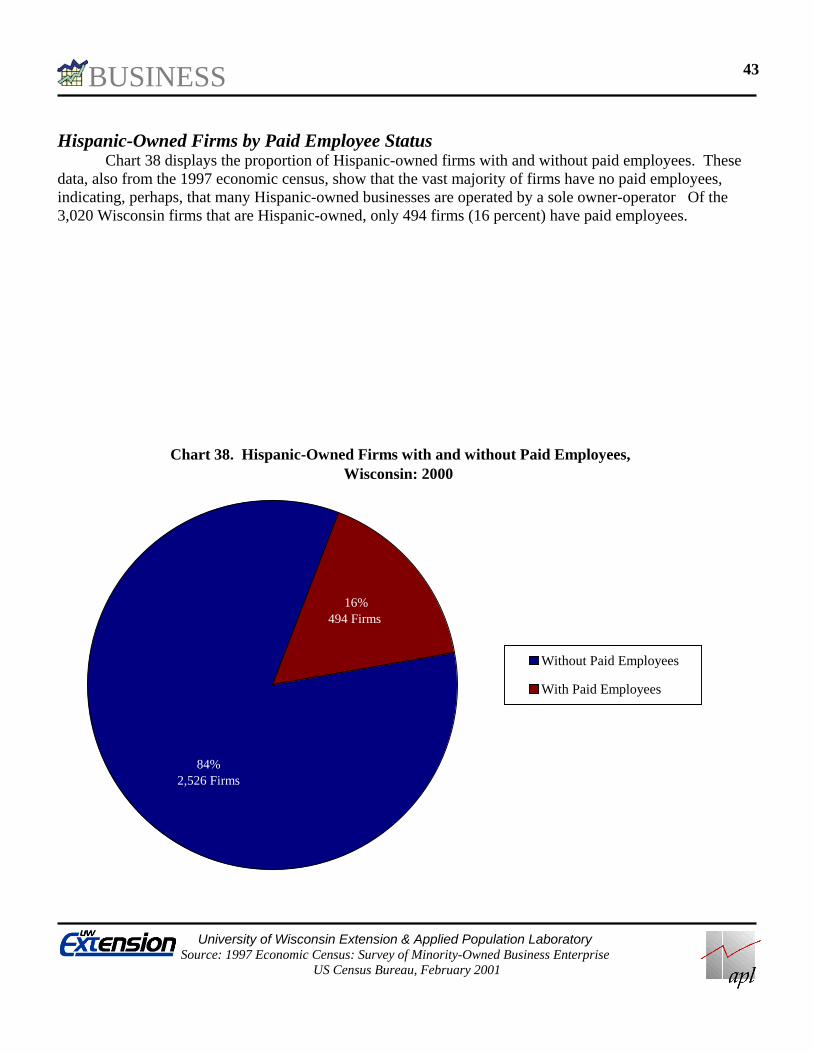
BUSINESS
University of Wisconsin Extension & Applied Population Laboratory
Source: 1997 Economic Census: Survey of Minority-Owned Business Enterprise US Census Bureau, February 2001
43
Hispanic-Owned Firms by Paid Employee Status Chart 38 displays the proportion of Hispanic-owned firms with and without paid employees. These
data, also from the 1997 economic census, show that the vast majority of firms have no paid employees, indicating, perhaps, that many Hispanic-owned businesses are operated by a sole owner-operator Of the 3,020 Wisconsin firms that are Hispanic-owned, only 494 firms (16 percent) have paid employees.
Chart 38. Hispanic-Owned Firms with and without Paid Employees, Wisconsin: 2000
16%494 Firms
84%2,526 Firms
Without Paid Employees
With Paid Employees

HISPANICS IN WISCONSIN
University of Wisconsin Extension & Applied Population Laboratory
Source: 2000 Census of Population and Housing U.S. Census Bureau
44
…
Data Tables for the
Hispanic Population in Wisconsin
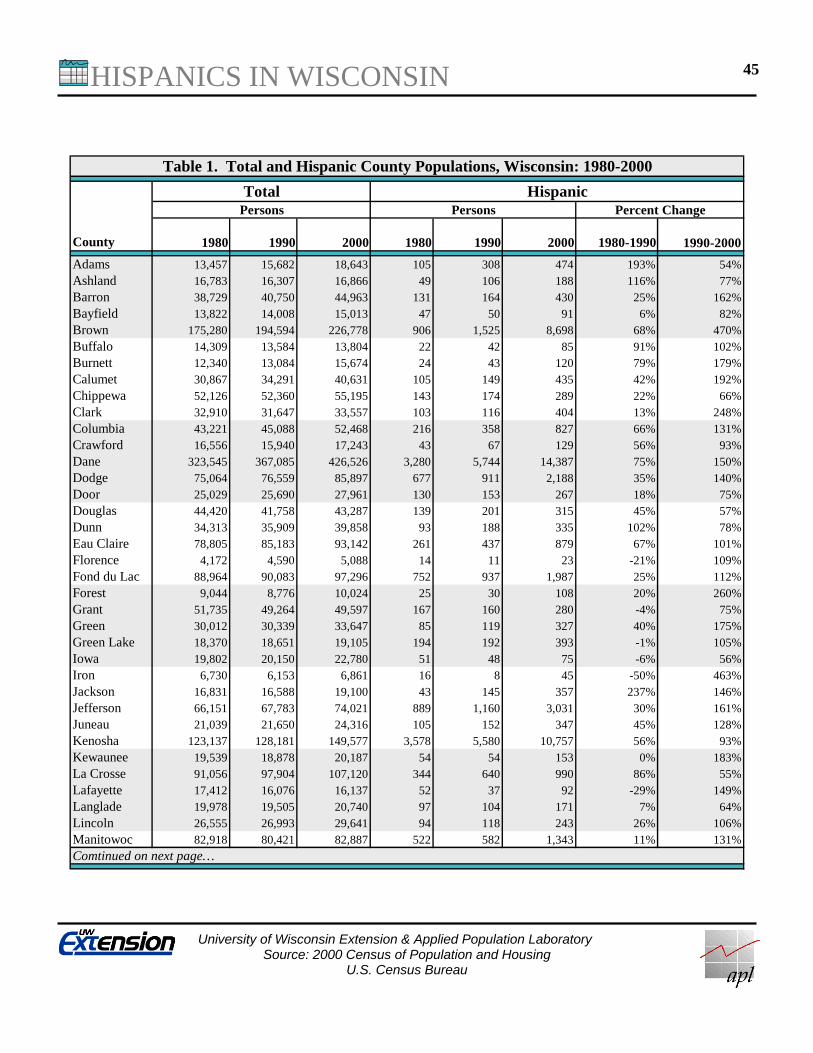
HISPANICS IN WISCONSIN
University of Wisconsin Extension & Applied Population Laboratory
Source: 2000 Census of Population and Housing U.S. Census Bureau
45
1980 1990 2000 1980 1990 2000 1980-1990 1990-2000
Adams 13,457 15,682 18,643 105 308 474 193% 54%Ashland 16,783 16,307 16,866 49 106 188 116% 77%Barron 38,729 40,750 44,963 131 164 430 25% 162%Bayfield 13,822 14,008 15,013 47 50 91 6% 82%Brown 175,280 194,594 226,778 906 1,525 8,698 68% 470%Buffalo 14,309 13,584 13,804 22 42 85 91% 102%Burnett 12,340 13,084 15,674 24 43 120 79% 179%Calumet 30,867 34,291 40,631 105 149 435 42% 192%Chippewa 52,126 52,360 55,195 143 174 289 22% 66%Clark 32,910 31,647 33,557 103 116 404 13% 248%Columbia 43,221 45,088 52,468 216 358 827 66% 131%Crawford 16,556 15,940 17,243 43 67 129 56% 93%Dane 323,545 367,085 426,526 3,280 5,744 14,387 75% 150%Dodge 75,064 76,559 85,897 677 911 2,188 35% 140%Door 25,029 25,690 27,961 130 153 267 18% 75%Douglas 44,420 41,758 43,287 139 201 315 45% 57%Dunn 34,313 35,909 39,858 93 188 335 102% 78%Eau Claire 78,805 85,183 93,142 261 437 879 67% 101%Florence 4,172 4,590 5,088 14 11 23 -21% 109%Fond du Lac 88,964 90,083 97,296 752 937 1,987 25% 112%Forest 9,044 8,776 10,024 25 30 108 20% 260%Grant 51,735 49,264 49,597 167 160 280 -4% 75%Green 30,012 30,339 33,647 85 119 327 40% 175%Green Lake 18,370 18,651 19,105 194 192 393 -1% 105%Iowa 19,802 20,150 22,780 51 48 75 -6% 56%Iron 6,730 6,153 6,861 16 8 45 -50% 463%Jackson 16,831 16,588 19,100 43 145 357 237% 146%Jefferson 66,151 67,783 74,021 889 1,160 3,031 30% 161%Juneau 21,039 21,650 24,316 105 152 347 45% 128%Kenosha 123,137 128,181 149,577 3,578 5,580 10,757 56% 93%Kewaunee 19,539 18,878 20,187 54 54 153 0% 183%La Crosse 91,056 97,904 107,120 344 640 990 86% 55%Lafayette 17,412 16,076 16,137 52 37 92 -29% 149%Langlade 19,978 19,505 20,740 97 104 171 7% 64%Lincoln 26,555 26,993 29,641 94 118 243 26% 106%Manitowoc 82,918 80,421 82,887 522 582 1,343 11% 131%Comtinued on next page…
Table 1. Total and Hispanic County Populations, Wisconsin: 1980-2000
County
Percent ChangeHispanic
PersonsPersonsTotal
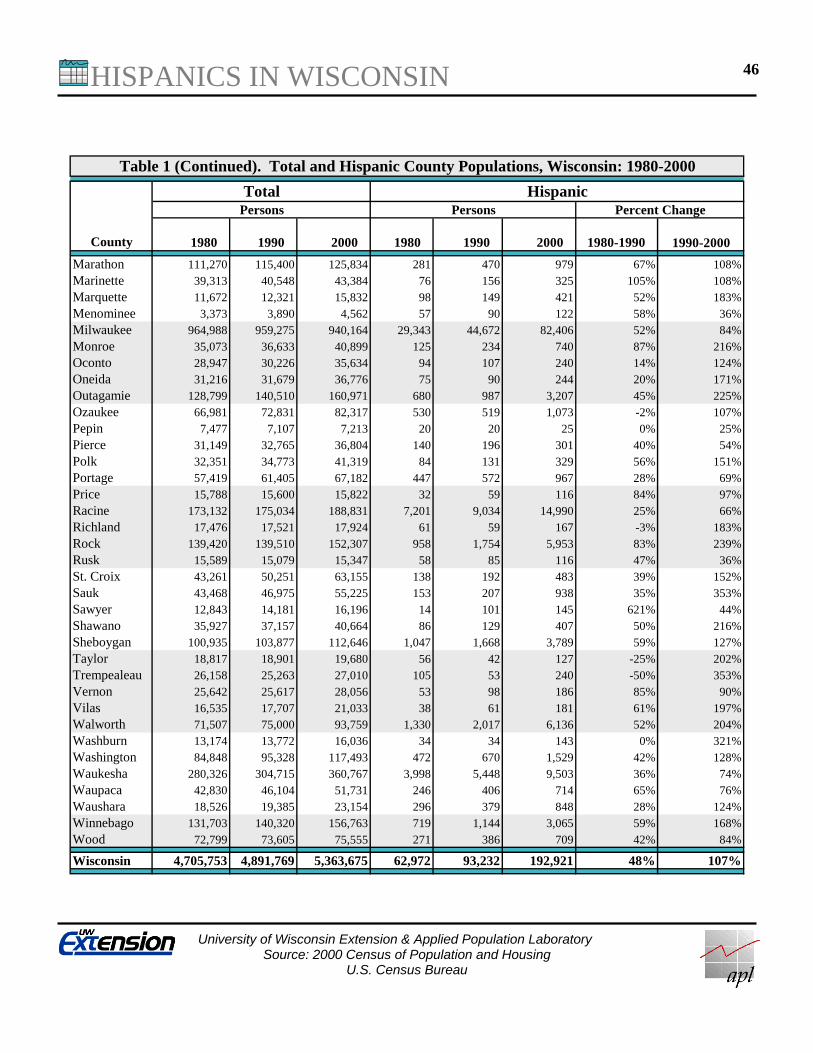
HISPANICS IN WISCONSIN
University of Wisconsin Extension & Applied Population Laboratory
Source: 2000 Census of Population and Housing U.S. Census Bureau
46
1980 1990 2000 1980 1990 2000 1980-1990 1990-2000
Marathon 111,270 115,400 125,834 281 470 979 67% 108%Marinette 39,313 40,548 43,384 76 156 325 105% 108%Marquette 11,672 12,321 15,832 98 149 421 52% 183%Menominee 3,373 3,890 4,562 57 90 122 58% 36%Milwaukee 964,988 959,275 940,164 29,343 44,672 82,406 52% 84%Monroe 35,073 36,633 40,899 125 234 740 87% 216%Oconto 28,947 30,226 35,634 94 107 240 14% 124%Oneida 31,216 31,679 36,776 75 90 244 20% 171%Outagamie 128,799 140,510 160,971 680 987 3,207 45% 225%Ozaukee 66,981 72,831 82,317 530 519 1,073 -2% 107%Pepin 7,477 7,107 7,213 20 20 25 0% 25%Pierce 31,149 32,765 36,804 140 196 301 40% 54%Polk 32,351 34,773 41,319 84 131 329 56% 151%Portage 57,419 61,405 67,182 447 572 967 28% 69%Price 15,788 15,600 15,822 32 59 116 84% 97%Racine 173,132 175,034 188,831 7,201 9,034 14,990 25% 66%Richland 17,476 17,521 17,924 61 59 167 -3% 183%Rock 139,420 139,510 152,307 958 1,754 5,953 83% 239%Rusk 15,589 15,079 15,347 58 85 116 47% 36%St. Croix 43,261 50,251 63,155 138 192 483 39% 152%Sauk 43,468 46,975 55,225 153 207 938 35% 353%Sawyer 12,843 14,181 16,196 14 101 145 621% 44%Shawano 35,927 37,157 40,664 86 129 407 50% 216%Sheboygan 100,935 103,877 112,646 1,047 1,668 3,789 59% 127%Taylor 18,817 18,901 19,680 56 42 127 -25% 202%Trempealeau 26,158 25,263 27,010 105 53 240 -50% 353%Vernon 25,642 25,617 28,056 53 98 186 85% 90%Vilas 16,535 17,707 21,033 38 61 181 61% 197%Walworth 71,507 75,000 93,759 1,330 2,017 6,136 52% 204%Washburn 13,174 13,772 16,036 34 34 143 0% 321%Washington 84,848 95,328 117,493 472 670 1,529 42% 128%Waukesha 280,326 304,715 360,767 3,998 5,448 9,503 36% 74%Waupaca 42,830 46,104 51,731 246 406 714 65% 76%Waushara 18,526 19,385 23,154 296 379 848 28% 124%Winnebago 131,703 140,320 156,763 719 1,144 3,065 59% 168%Wood 72,799 73,605 75,555 271 386 709 42% 84%
Wisconsin 4,705,753 4,891,769 5,363,675 62,972 93,232 192,921 48% 107%
Table 1 (Continued). Total and Hispanic County Populations, Wisconsin: 1980-2000
County
Total HispanicPersons Persons Percent Change

HISPANICS IN WISCONSIN
University of Wisconsin Extension & Applied Population Laboratory
Source: 2000 Census of Population and Housing U.S. Census Bureau
47
County Hispanic
PopulationPercent of Total
Hispanics
Milwaukee 82,406 43%
Racine 14,990 8%Dane 14,387 7%Kenosha 10,757 6%
Waukesha 9,503 5%Brown 8,698 5%Walworth 6,136 3%Rock 5,953 3%Remaining Counties 40,091 21%
Total 192,921 100%
Table 2. County Hispanic Populations as a Share of Total Hispanic Population, Wisconsin: 2000
Total Population
Percent of Total
Hispanic Population
Percent of Hispanic Total
Urban 3,663,643 68.3% 174,265 90.3%
Rural 1,700,032 31.7% 18,656 9.7%
Total 5,363,675 100.0% 192,921 100.0%
Table 3. Urban/Rural Residence, Wisconsin: 2000
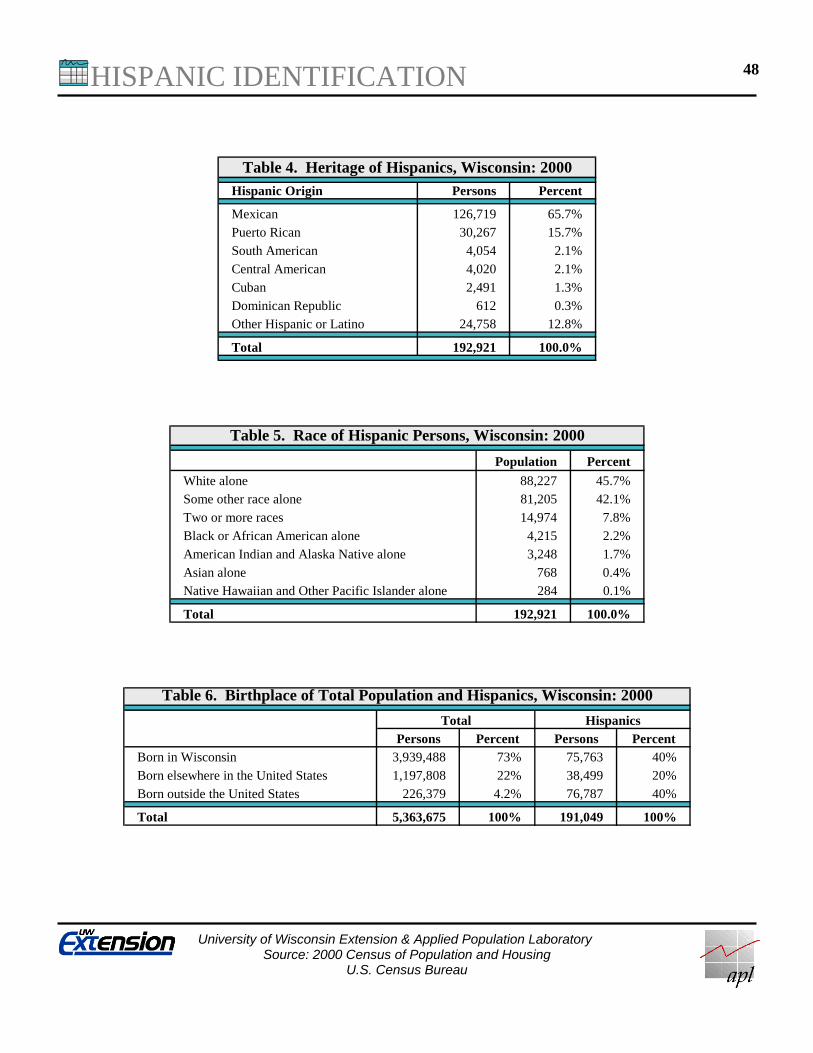
HISPANIC IDENTIFICATION
University of Wisconsin Extension & Applied Population Laboratory
Source: 2000 Census of Population and Housing U.S. Census Bureau
48
Hispanic Origin Persons Percent
Mexican 126,719 65.7%Puerto Rican 30,267 15.7%
South American 4,054 2.1%
Central American 4,020 2.1%
Cuban 2,491 1.3%
Dominican Republic 612 0.3%Other Hispanic or Latino 24,758 12.8%
Total 192,921 100.0%
Table 4. Heritage of Hispanics, Wisconsin: 2000
Population Percent
White alone 88,227 45.7%Some other race alone 81,205 42.1%
Two or more races 14,974 7.8%
Black or African American alone 4,215 2.2%
American Indian and Alaska Native alone 3,248 1.7%
Asian alone 768 0.4%Native Hawaiian and Other Pacific Islander alone 284 0.1%
Total 192,921 100.0%
Table 5. Race of Hispanic Persons, Wisconsin: 2000
Persons Percent Persons PercentBorn in Wisconsin 3,939,488 73% 75,763 40%
Born elsewhere in the United States 1,197,808 22% 38,499 20%
Born outside the United States 226,379 4.2% 76,787 40%
Total 5,363,675 100% 191,049 100%
Total
Table 6. Birthplace of Total Population and Hispanics, Wisconsin: 2000
Hispanics
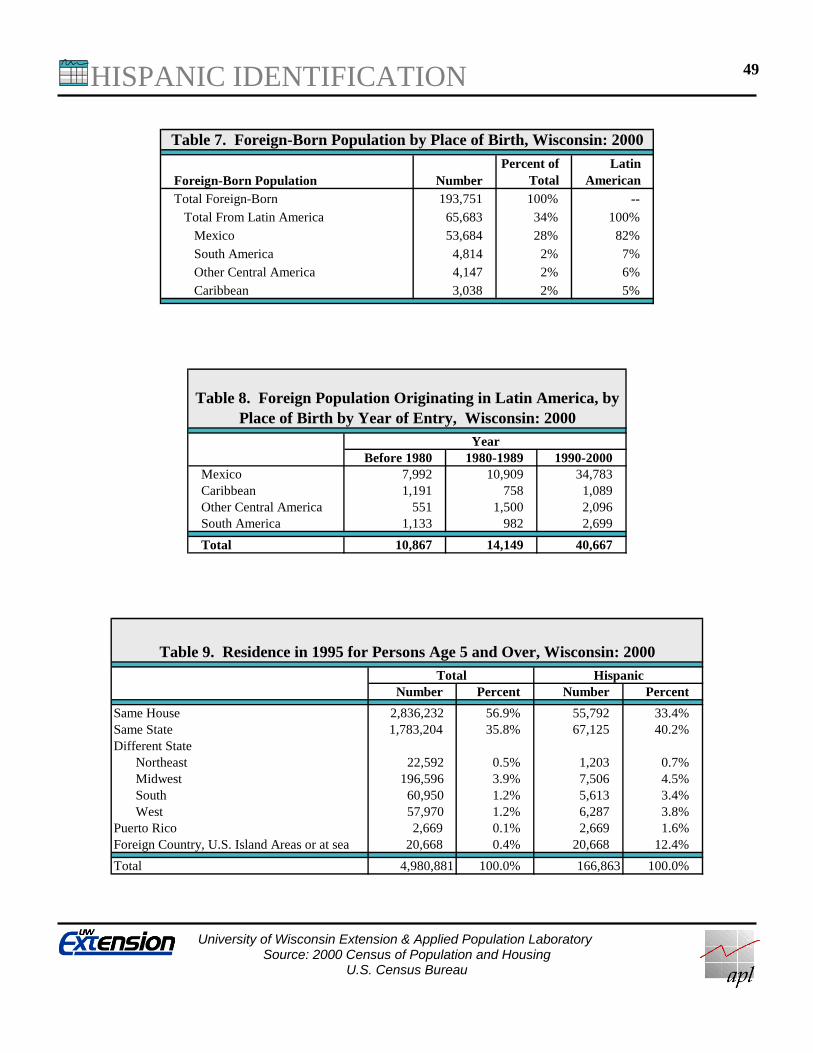
HISPANIC IDENTIFICATION
University of Wisconsin Extension & Applied Population Laboratory
Source: 2000 Census of Population and Housing U.S. Census Bureau
49
Foreign-Born Population NumberPercent of
TotalLatin
American
Total Foreign-Born 193,751 100% -- Total From Latin America 65,683 34% 100%
Mexico 53,684 28% 82%
South America 4,814 2% 7% Other Central America 4,147 2% 6%
Caribbean 3,038 2% 5%
Table 7. Foreign-Born Population by Place of Birth, Wisconsin: 2000
Before 1980 1980-1989 1990-2000Mexico 7,992 10,909 34,783Caribbean 1,191 758 1,089Other Central America 551 1,500 2,096South America 1,133 982 2,699
Total 10,867 14,149 40,667
Table 8. Foreign Population Originating in Latin America, by Place of Birth by Year of Entry, Wisconsin: 2000
Year
Number Percent Number Percent
Same House 2,836,232 56.9% 55,792 33.4%Same State 1,783,204 35.8% 67,125 40.2%Different State
Northeast 22,592 0.5% 1,203 0.7%Midwest 196,596 3.9% 7,506 4.5%South 60,950 1.2% 5,613 3.4%West 57,970 1.2% 6,287 3.8%
Puerto Rico 2,669 0.1% 2,669 1.6%Foreign Country, U.S. Island Areas or at sea 20,668 0.4% 20,668 12.4%
Total 4,980,881 100.0% 166,863 100.0%
Table 9. Residence in 1995 for Persons Age 5 and Over, Wisconsin: 2000
HispanicTotal

AGE & SEX
University of Wisconsin Extension & Applied Population Laboratory
Source: 2000 Census of Population and Housing U.S. Census Bureau
50
Age Group Male Female Male Female
Under 5 175,041 167,299 12,526 12,098
5-9 years 194,506 184,978 10,970 10,385
10-14 years 206,665 196,409 9,328 8,842
15-19 years 208,785 198,410 10,810 8,817
20-24 years 182,372 174,920 13,014 9,227
25-29 years 170,011 163,902 11,814 8,579
30-34 years 188,414 183,841 9,430 7,156
35-39 years 217,663 217,592 7,476 6,006
40-44 years 221,424 218,843 6,030 4,972
45-49 years 200,621 197,072 4,368 3,721
50-54 years 168,086 166,527 3,059 2,599
55-59 years 124,363 128,379 1,884 1,775
60-64 years 99,580 105,419 1,306 1,324
65-69 years 85,771 96,348 959 1,030
70-74 years 78,610 94,578 720 793
75-79 years 61,121 85,554 469 511
80-84 years 38,757 66,189 203 301
85+ 27,251 68,374 157 262
Total Hispanic
Table 10. Population by Age and Sex, Wisconsin: 2000
Male Female BothWisconsin Total 35.0 37.1 36.0Hispanic Total 23.3 22.2 22.8 Mexican 23.6 21.6 22.8 Puerto Rican 21.7 22.9 22.4 Cuban 31.2 26.1 28.7 Other Hispanic 22.7 23.5 23.0
Table 11. Median Age by Heritage and Sex, Wisconsin: 2000
Number Percent Number PercentMale 576,212 21.8% 32,824 31.4%
Female 548,686 20.2% 31,325 35.4%
Both 1,124,898 21.0% 64,149 33.3%
Table 12. Population Under Age 15, Wisconsin: 2000
Total Hispanic
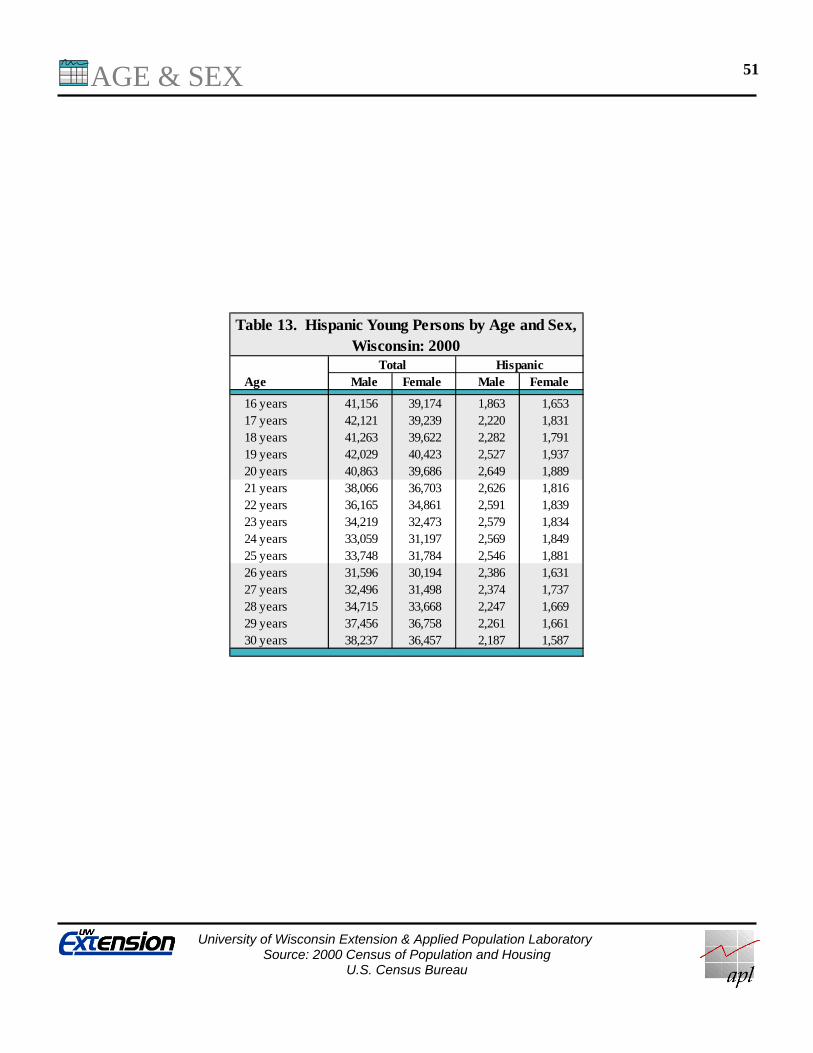
AGE & SEX
University of Wisconsin Extension & Applied Population Laboratory
Source: 2000 Census of Population and Housing U.S. Census Bureau
51
Age Male Female Male Female
16 years 41,156 39,174 1,863 1,65317 years 42,121 39,239 2,220 1,83118 years 41,263 39,622 2,282 1,79119 years 42,029 40,423 2,527 1,93720 years 40,863 39,686 2,649 1,88921 years 38,066 36,703 2,626 1,81622 years 36,165 34,861 2,591 1,83923 years 34,219 32,473 2,579 1,83424 years 33,059 31,197 2,569 1,84925 years 33,748 31,784 2,546 1,88126 years 31,596 30,194 2,386 1,63127 years 32,496 31,498 2,374 1,73728 years 34,715 33,668 2,247 1,66929 years 37,456 36,758 2,261 1,66130 years 38,237 36,457 2,187 1,587
HispanicTotal
Table 13. Hispanic Young Persons by Age and Sex, Wisconsin: 2000
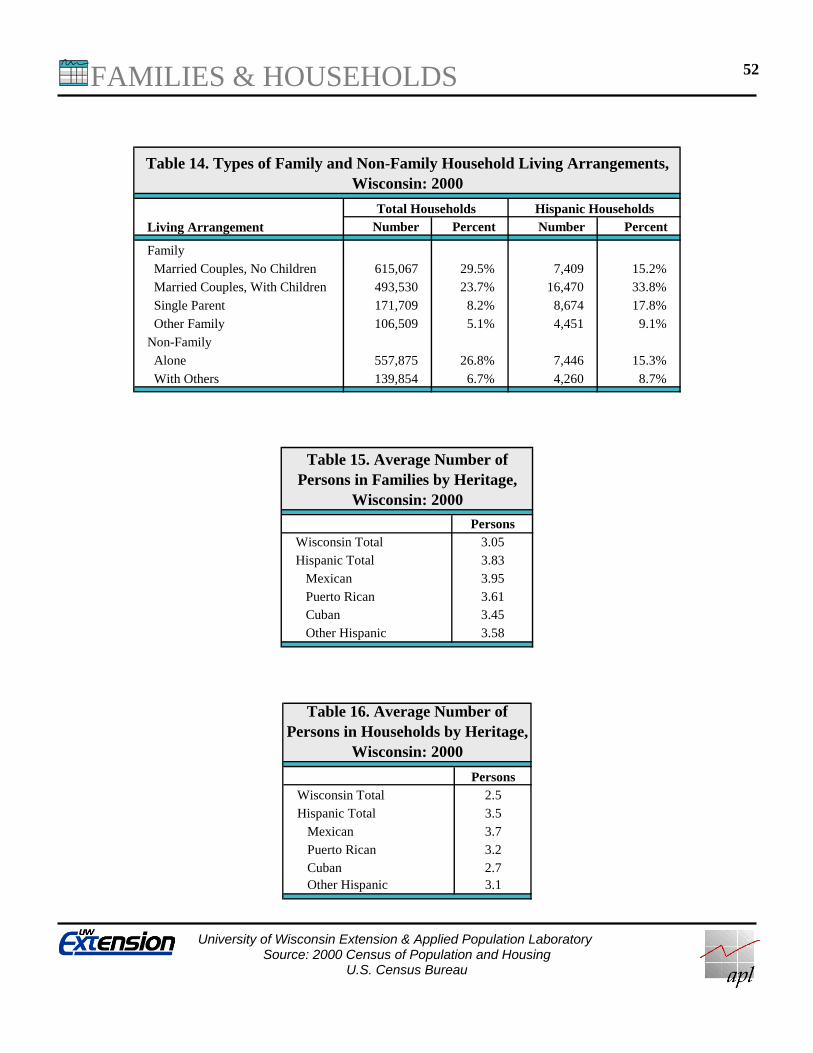
FAMILIES & HOUSEHOLDS
University of Wisconsin Extension & Applied Population Laboratory
Source: 2000 Census of Population and Housing U.S. Census Bureau
52
Living Arrangement Number Percent Number Percent
Family
Married Couples, No Children 615,067 29.5% 7,409 15.2% Married Couples, With Children 493,530 23.7% 16,470 33.8%
Single Parent 171,709 8.2% 8,674 17.8%
Other Family 106,509 5.1% 4,451 9.1%
Non-Family
Alone 557,875 26.8% 7,446 15.3%
With Others 139,854 6.7% 4,260 8.7%
Table 14. Types of Family and Non-Family Household Living Arrangements, Wisconsin: 2000
Total Households Hispanic Households
PersonsWisconsin Total 3.05Hispanic Total 3.83 Mexican 3.95 Puerto Rican 3.61 Cuban 3.45 Other Hispanic 3.58
Table 15. Average Number of Persons in Families by Heritage,
Wisconsin: 2000
PersonsWisconsin Total 2.5Hispanic Total 3.5 Mexican 3.7 Puerto Rican 3.2 Cuban 2.7 Other Hispanic 3.1
Table 16. Average Number of Persons in Households by Heritage,
Wisconsin: 2000

FAMILIES & HOUSEHOLDS
University of Wisconsin Extension & Applied Population Laboratory
Source: 2000 Census of Population and Housing U.S. Census Bureau
53
Total
HouseholdsHouseholds with Non-Relative(s)
Percent with Non-Relative(s)
Wisconsin Total 2,084,544 216,218 10.4%Hispanic Total 48,710 10,675 21.9% Mexican 30,861 7,248 23.5% Puerto Rican 8,593 1,686 19.6% Cuban 763 119 15.6% Other 8,493 1,622 19.1%
Table 17. Households with Non-Relatives, Wisconsin: 2000
All Householders
All Householders
Number Number Percent Number Number Percent
All Families 1,386,815 200,300 14.4% 37,004 8,127 22.0%
Families with related children under 18 years 694,671 141,011 20.3% 27,128 6,864 25.3%
Families with related children under 6 years only 159,745 31,320 19.6% 7,858 1,755 22.3%
Table 18. Percent Female Householders within Selected Categories, Wisconsin: 2000
Total Hispanic
Female Headed Householders
Female Headed Householders
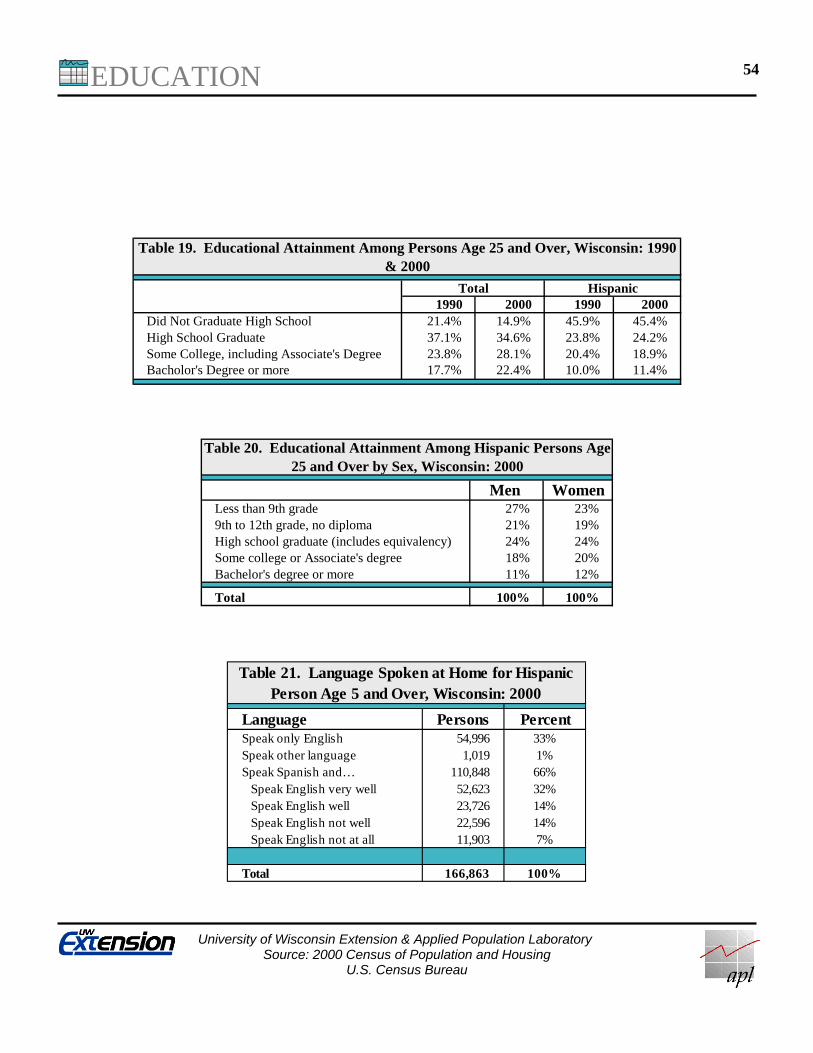
EDUCATION
University of Wisconsin Extension & Applied Population Laboratory
Source: 2000 Census of Population and Housing U.S. Census Bureau
54
1990 2000 1990 2000Did Not Graduate High School 21.4% 14.9% 45.9% 45.4%High School Graduate 37.1% 34.6% 23.8% 24.2%Some College, including Associate's Degree 23.8% 28.1% 20.4% 18.9%Bacholor's Degree or more 17.7% 22.4% 10.0% 11.4%
Total Hispanic
Table 19. Educational Attainment Among Persons Age 25 and Over, Wisconsin: 1990 & 2000
Men WomenLess than 9th grade 27% 23%9th to 12th grade, no diploma 21% 19%High school graduate (includes equivalency) 24% 24%Some college or Associate's degree 18% 20%Bachelor's degree or more 11% 12%
Total 100% 100%
Table 20. Educational Attainment Among Hispanic Persons Age 25 and Over by Sex, Wisconsin: 2000
Language Persons PercentSpeak only English 54,996 33%Speak other language 1,019 1%Speak Spanish and… 110,848 66% Speak English very well 52,623 32% Speak English well 23,726 14% Speak English not well 22,596 14% Speak English not at all 11,903 7%
Total 166,863 100%
Table 21. Language Spoken at Home for Hispanic Person Age 5 and Over, Wisconsin: 2000
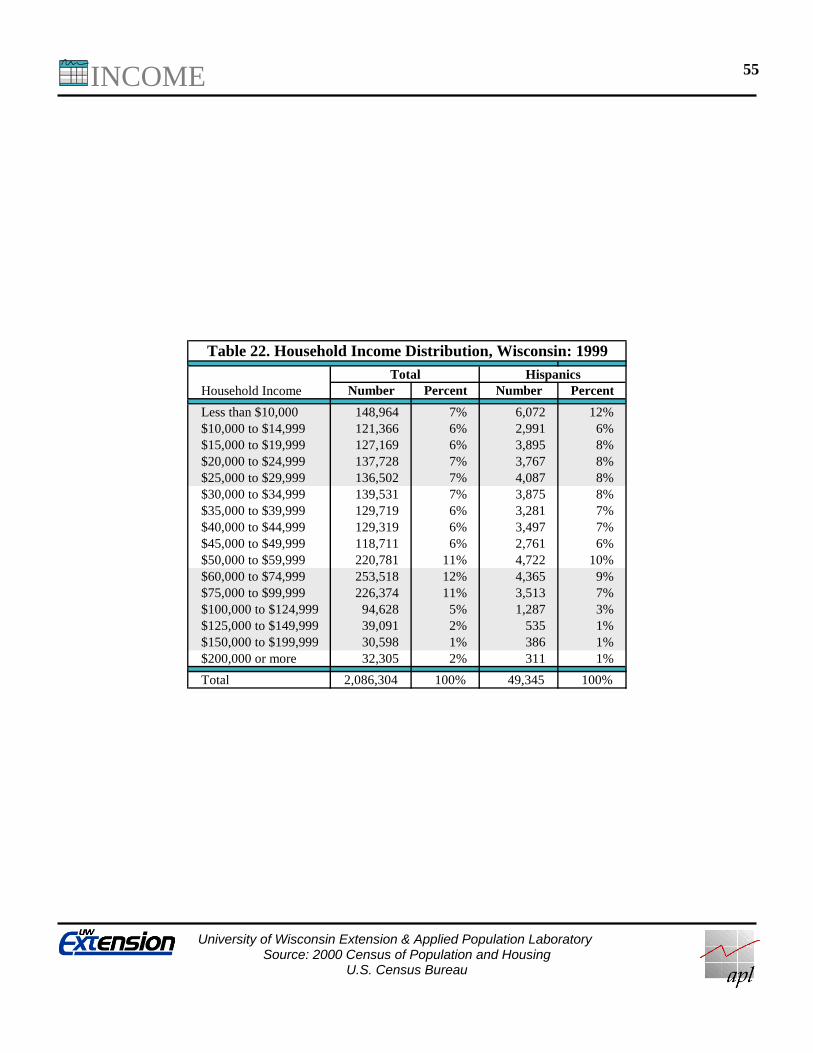
INCOME
University of Wisconsin Extension & Applied Population Laboratory
Source: 2000 Census of Population and Housing U.S. Census Bureau
55
Number Percent Number Percent
Less than $10,000 148,964 7% 6,072 12%$10,000 to $14,999 121,366 6% 2,991 6%$15,000 to $19,999 127,169 6% 3,895 8%$20,000 to $24,999 137,728 7% 3,767 8%$25,000 to $29,999 136,502 7% 4,087 8%$30,000 to $34,999 139,531 7% 3,875 8%$35,000 to $39,999 129,719 6% 3,281 7%$40,000 to $44,999 129,319 6% 3,497 7%$45,000 to $49,999 118,711 6% 2,761 6%$50,000 to $59,999 220,781 11% 4,722 10%$60,000 to $74,999 253,518 12% 4,365 9%$75,000 to $99,999 226,374 11% 3,513 7%$100,000 to $124,999 94,628 5% 1,287 3%$125,000 to $149,999 39,091 2% 535 1%$150,000 to $199,999 30,598 1% 386 1%$200,000 or more 32,305 2% 311 1%
Total 2,086,304 100% 49,345 100%
Table 22. Household Income Distribution, Wisconsin: 1999
Total HispanicsHousehold Income
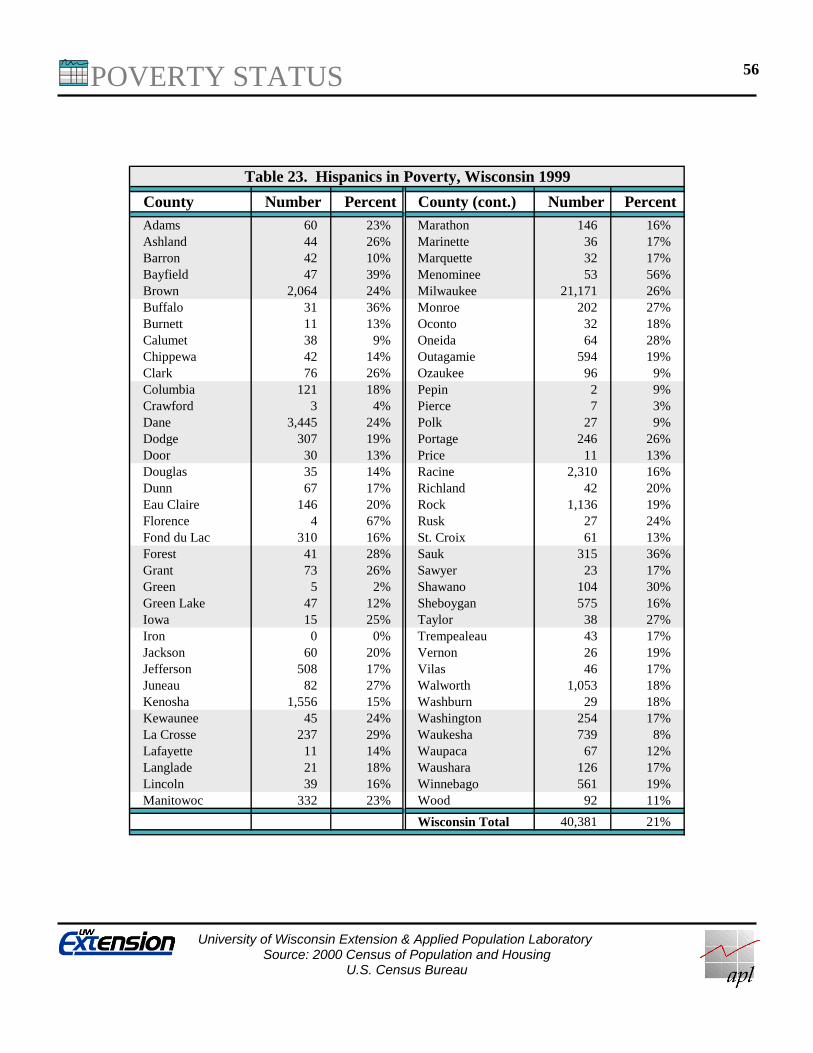
POVERTY STATUS
University of Wisconsin Extension & Applied Population Laboratory
Source: 2000 Census of Population and Housing U.S. Census Bureau
56
County Number Percent County (cont.) Number Percent
Adams 60 23% Marathon 146 16%Ashland 44 26% Marinette 36 17%Barron 42 10% Marquette 32 17%Bayfield 47 39% Menominee 53 56%Brown 2,064 24% Milwaukee 21,171 26%Buffalo 31 36% Monroe 202 27%Burnett 11 13% Oconto 32 18%Calumet 38 9% Oneida 64 28%Chippewa 42 14% Outagamie 594 19%Clark 76 26% Ozaukee 96 9%Columbia 121 18% Pepin 2 9%Crawford 3 4% Pierce 7 3%Dane 3,445 24% Polk 27 9%Dodge 307 19% Portage 246 26%Door 30 13% Price 11 13%Douglas 35 14% Racine 2,310 16%Dunn 67 17% Richland 42 20%Eau Claire 146 20% Rock 1,136 19%Florence 4 67% Rusk 27 24%Fond du Lac 310 16% St. Croix 61 13%Forest 41 28% Sauk 315 36%Grant 73 26% Sawyer 23 17%Green 5 2% Shawano 104 30%Green Lake 47 12% Sheboygan 575 16%Iowa 15 25% Taylor 38 27%Iron 0 0% Trempealeau 43 17%Jackson 60 20% Vernon 26 19%Jefferson 508 17% Vilas 46 17%Juneau 82 27% Walworth 1,053 18%Kenosha 1,556 15% Washburn 29 18%Kewaunee 45 24% Washington 254 17%La Crosse 237 29% Waukesha 739 8%Lafayette 11 14% Waupaca 67 12%Langlade 21 18% Waushara 126 17%Lincoln 39 16% Winnebago 561 19%Manitowoc 332 23% Wood 92 11%
Wisconsin Total 40,381 21%
Table 23. Hispanics in Poverty, Wisconsin 1999
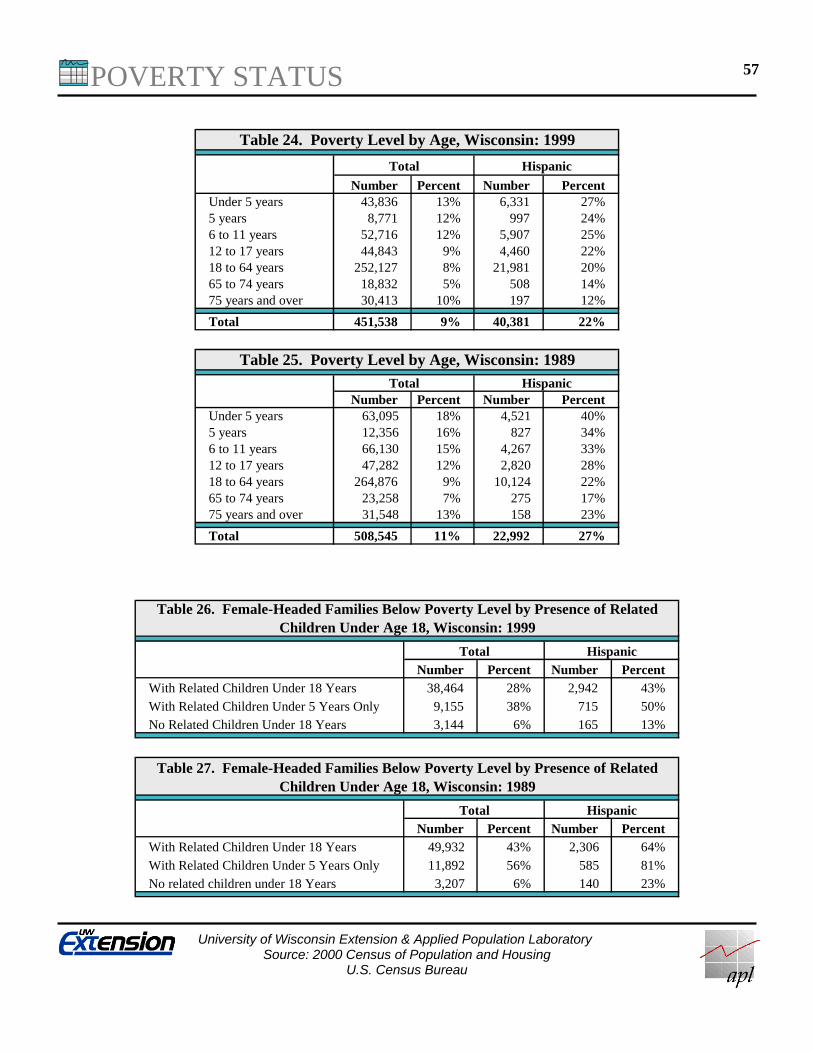
POVERTY STATUS
University of Wisconsin Extension & Applied Population Laboratory
Source: 2000 Census of Population and Housing U.S. Census Bureau
57
Number Percent Number PercentUnder 5 years 43,836 13% 6,331 27%5 years 8,771 12% 997 24%6 to 11 years 52,716 12% 5,907 25%12 to 17 years 44,843 9% 4,460 22%18 to 64 years 252,127 8% 21,981 20%65 to 74 years 18,832 5% 508 14%75 years and over 30,413 10% 197 12%
Total 451,538 9% 40,381 22%
Table 24. Poverty Level by Age, Wisconsin: 1999
Total Hispanic
Number Percent Number PercentUnder 5 years 63,095 18% 4,521 40%5 years 12,356 16% 827 34%6 to 11 years 66,130 15% 4,267 33%12 to 17 years 47,282 12% 2,820 28%18 to 64 years 264,876 9% 10,124 22%65 to 74 years 23,258 7% 275 17%75 years and over 31,548 13% 158 23%
Total 508,545 11% 22,992 27%
Total Hispanic
Table 25. Poverty Level by Age, Wisconsin: 1989
Number Percent Number PercentWith Related Children Under 18 Years 38,464 28% 2,942 43%
With Related Children Under 5 Years Only 9,155 38% 715 50%No Related Children Under 18 Years 3,144 6% 165 13%
Table 26. Female-Headed Families Below Poverty Level by Presence of Related Children Under Age 18, Wisconsin: 1999
Total Hispanic
Number Percent Number PercentWith Related Children Under 18 Years 49,932 43% 2,306 64%
With Related Children Under 5 Years Only 11,892 56% 585 81%No related children under 18 Years 3,207 6% 140 23%
Total Hispanic
Table 27. Female-Headed Families Below Poverty Level by Presence of Related Children Under Age 18, Wisconsin: 1989

LABOR FORCE
University of Wisconsin Extension & Applied Population Laboratory
Source: 2000 Census of Population and Housing U.S. Census Bureau
58
Number Percent Number Percent
Male: 2,030,019 100.0% 69,222 100.0%In labor force: 1,508,279 74.3% 49,500 71.5%
In Armed Forces 2,426 0.1% 84 0.1%Civilian: 1,505,853 74.2% 49,416 71.4%
Employed 1,428,493 70.4% 44,736 64.6%Unemployed 77,360 3.8% 4,680 6.8%
Not in labor force 521,740 25.7% 19,722 28.5%Female: 2,127,011 100.0% 54,944 100.0%
In labor force: 1,363,825 64.1% 33,186 60.4%In Armed Forces 442 0.0% 6 0.0%Civilian: 1,363,383 64.1% 33,180 60.4%
Employed 1,306,432 61.4% 29,718 54.1%Unemployed 56,951 2.7% 3,462 6.3%
Not in labor force 763,186 35.9% 21,758 39.6%
Total Hispanic
Table 28. Employment Status for the Population Age 16 and Over by Sex, Wisconsin: 2000
Number Percent Number Percent
Male: 27,961 100.0% 69,222 1.0%In labor force: 21,281 76.1% 49,500 71.5%
In Armed Forces 86 0.3% 84 0.1%Civilian: 21,195 75.8% 49,416 71.4%
Employed 18,900 67.6% 44,736 64.6%Unemployed 2,295 8.2% 4,680 6.8%
Not in labor force 6,680 23.9% 19,722 28.5%Female: 24,856 100.0% 54,944 100.0%
In labor force: 15,005 60.4% 33,186 60.4%In Armed Forces 13 0.1% 6 0.0%Civilian: 14,992 60.3% 33,180 60.4%
Employed 13,067 52.6% 29,718 54.1%Unemployed 1,925 7.7% 3,462 6.3%
Not in labor force 9,851 39.6% 21,758 39.6%
Table 29. Employment Status for the Hispanic Population Age 16 and Over by Sex, Wisconsin: 1990 & 2000
1990 2000
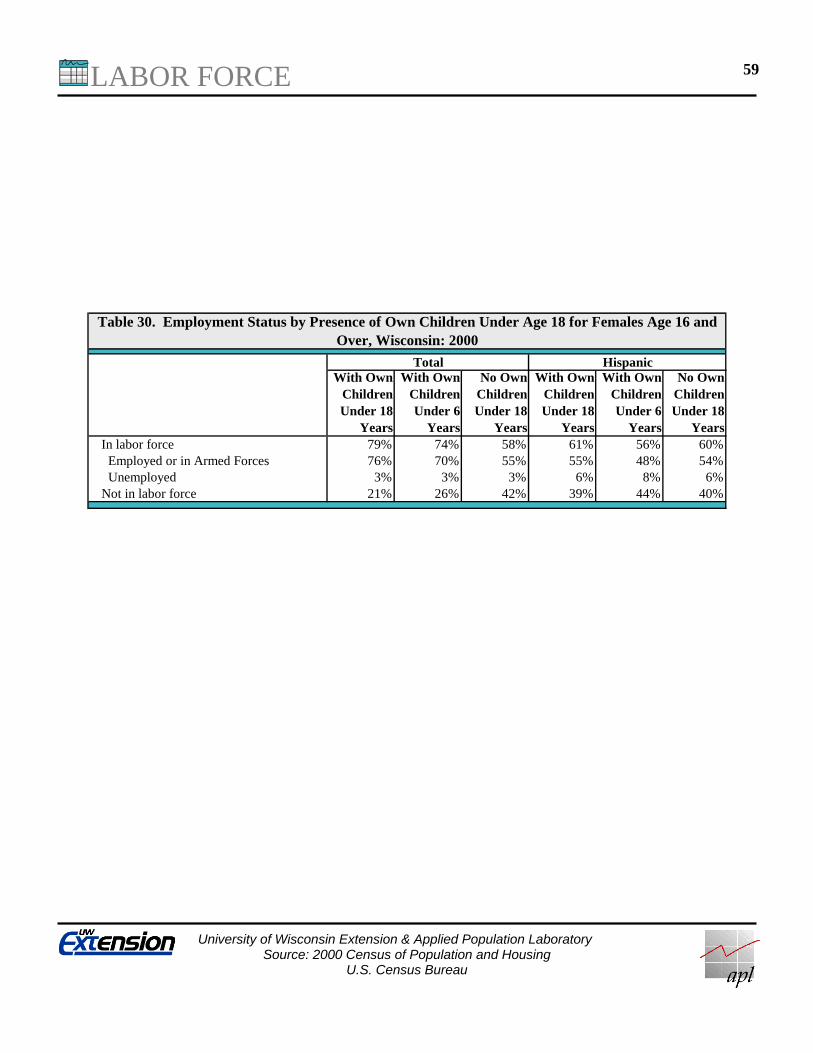
LABOR FORCE
University of Wisconsin Extension & Applied Population Laboratory
Source: 2000 Census of Population and Housing U.S. Census Bureau
59
With Own Children Under 18
Years
With Own Children Under 6
Years
No Own Children Under 18
Years
With Own Children Under 18
Years
With Own Children Under 6
Years
No Own Children Under 18
YearsIn labor force 79% 74% 58% 61% 56% 60% Employed or in Armed Forces 76% 70% 55% 55% 48% 54% Unemployed 3% 3% 3% 6% 8% 6%Not in labor force 21% 26% 42% 39% 44% 40%
Table 30. Employment Status by Presence of Own Children Under Age 18 for Females Age 16 and Over, Wisconsin: 2000
Total Hispanic

HOUSING
University of Wisconsin Extension & Applied Population Laboratory
Source: 2000 Census of Population and Housing U.S. Census Bureau
60
Number Percent Number PercentWisconsin Total 3,789,836 73% 1,417,881 27%
Hispanic Total 67,792 40% 101,618 60%
Mexican 44,786 39% 69,099 61%
Puerto Rican 10,516 38% 16,873 62% Cuban 1,074 52% 1,010 48%
Other Hispanic 11,416 44% 14,636 56%
Table 31. Persons in Owner Occupied Housing Units, Wisconsin: 2000
Renter Occupied
Owner Occupied
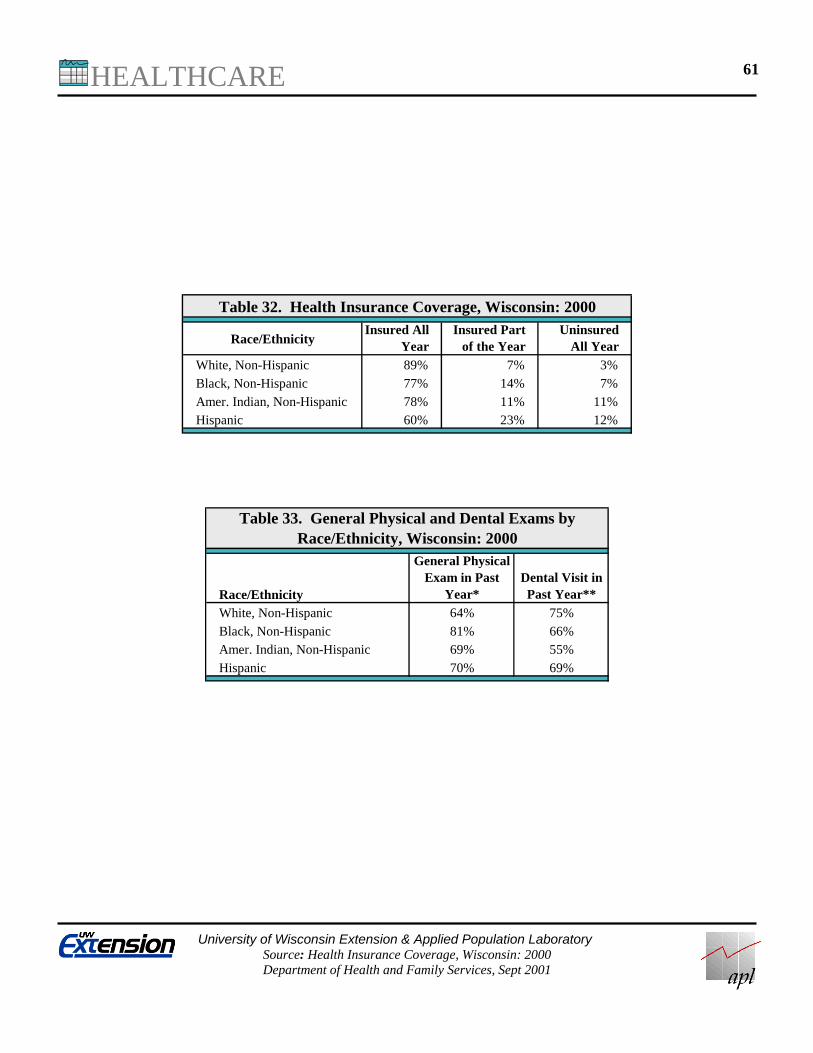
HEALTHCARE
University of Wisconsin Extension & Applied Population Laboratory
Source: Health Insurance Coverage, Wisconsin: 2000 Department of Health and Family Services, Sept 2001
61
Race/EthnicityInsured All
YearInsured Part
of the YearUninsured
All Year
White, Non-Hispanic 89% 7% 3%
Black, Non-Hispanic 77% 14% 7%
Amer. Indian, Non-Hispanic 78% 11% 11%Hispanic 60% 23% 12%
Table 32. Health Insurance Coverage, Wisconsin: 2000
Race/Ethnicity
General Physical Exam in Past
Year*Dental Visit in Past Year**
White, Non-Hispanic 64% 75%
Black, Non-Hispanic 81% 66%Amer. Indian, Non-Hispanic 69% 55%
Hispanic 70% 69%
Table 33. General Physical and Dental Exams by Race/Ethnicity, Wisconsin: 2000