Embed Size (px)
Citation preview
Sources
• Source: Bowyer, 2013 – Bowyer, J. 2013. An Environmental Quiz that Can Open the
Door to Inquiry and Learning about Forests and Forestry. Dovetail Partners Inc. http://www.dovetailinc.org/reportsview/2012/responsible-consumption/pdr-jim-bowyerp/environmental-quiz-can-open-door-inquiry-an
• Source: Barrett, 2013 – Barrett, George. 2013. Editor. Hardwood Publishing.
http://www.hardwoodreview.com/Main.aspx?ReturnUrl=%2f#

Wisconsin’s Forest Industry: Taking on the World
Scott Bowe Professor of Wood Products
Governor’s Forestry Economic Summit December 12 & 13, 2013
Outline
• History – Perceptions – Recent History
• Current trends – Sustainability – Export Market Demand
• Outlook

History of Wisconsin’s Forest Industry

Perception

True (T) or False (F):
The raw material that is used in the greatest quantity in the U.S. today, and
which accounts for almost one-third (by weight) of the total raw materials used
annually is steel.
(Source: Bowyer, 2013)

True (T) or False (F):
The raw material that is used in the greatest quantity in the U.S. today, and
which accounts for almost one-third (by weight) of the total raw materials used
annually is steel.
(Source: Bowyer, 2013)

Annual U.S. Consumption of Various Raw Materials, 2010
Million Metric tons Million m3 Roundwood 153 341 Industrial roundwood* 135 300 Cement 71 64 Steel 80 101 Plastics 40.6 35.8 Aluminum 3.5 1.3
* Roundwood is the volume of all wood harvested. Industrial roundwood is the volume of wood used in making forest products; the difference is firewood.
(Source: Bowyer, 2013)

In fact, more wood is used in the U.S. every year than all metals and all
plastics combined!
(Source: Bowyer, 2013)

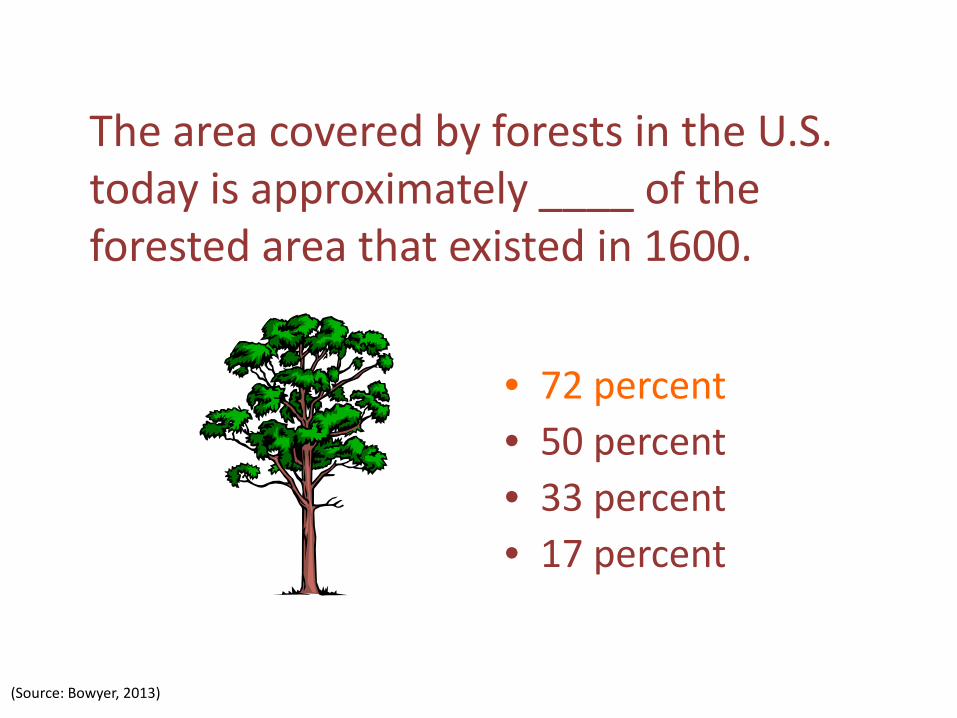
The area covered by forests in the U.S. today is approximately ____ of the forested area that existed in 1600.
• 72 percent • 50 percent • 33 percent • 17 percent
(Source: Bowyer, 2013)
The area covered by forests in the U.S. today is approximately ____ of the forested area that existed in 1600.
• 72 percent • 50 percent • 33 percent • 17 percent
(Source: Bowyer, 2013)

Forests now cover 72% of the land area in the U.S. that they did at the time of
European settlement
1600 2013
Forest - 1,100 million acres
Forest - 751
million acres
Source: USDA - Forest Service (Source: Bowyer, 2013)

Forest Area in the United States 1630-2012
Tho
usan
d A
cres
Source: USDA-Forest Service, RPA Update. (2012). (Source: Bowyer, 2013)

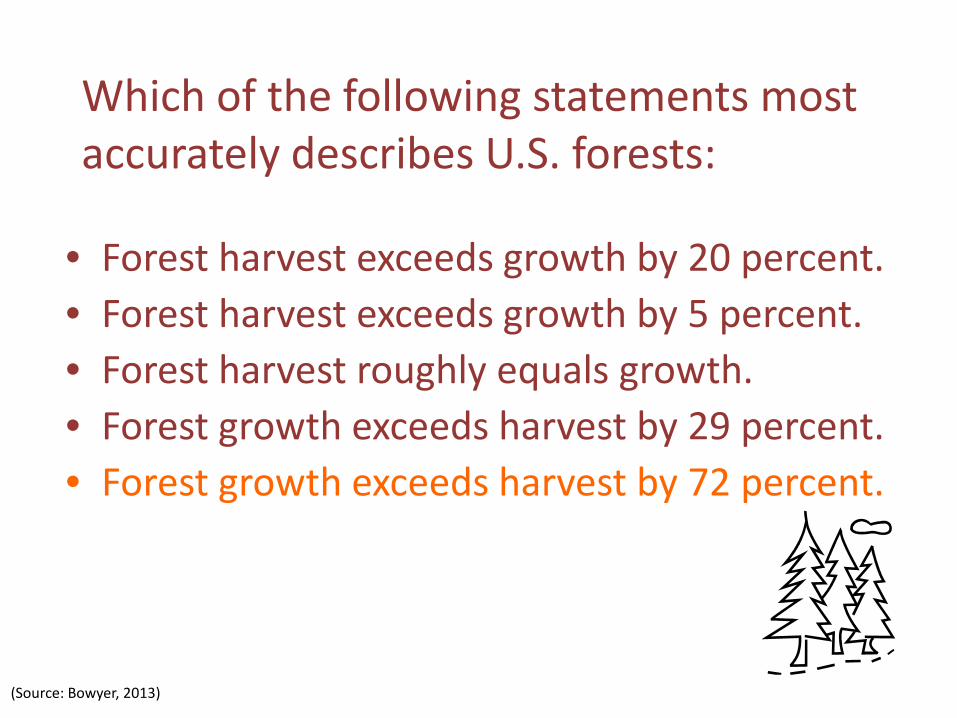
Which of the following statements most accurately describes U.S. forests:
• Forest harvest exceeds growth by 20 percent. • Forest harvest exceeds growth by 5 percent. • Forest harvest roughly equals growth. • Forest growth exceeds harvest by 29 percent. • Forest growth exceeds harvest by 72 percent.
(Source: Bowyer, 2013)

Net Growth/Removals Ratios – U.S., 1952-2006
When net forest growth divided by removals = 1.0, timber inventories are neither expanding or declining.
(Source: Bowyer, 2013)

Growth/Removals Ratios – U.S., 1952-2006
Year Softwoods Hardwoods Total 1952 1.00 1.50 1.17 1962 1.25 1.65 1.55 1970 1.23 2.01 1.48 1976 1.25 2.25 1.54 1986 1.19 1.92 1.42 1991 1.15 1.75 1.33 1996 1.33 1.71 1.47 2001 1.33 1.71 1.47 2006 1.55 2.03 1.72
(Source: Bowyer, 2013)

Sustainability
• What do I think sustainability means? – Environmental – Social – Economic
• Public? – Preservation
Environmental
Social Economic
SUSTAINABILITY

0
75,000
150,000
225,000
300,000
375,000
450,000
1953 1977 1987 1997 2007 Most RecentData
Mill
ion
Cub
ic F
eet
Net Voulme of Hardwood Growing Stocks on US Timberland
Total Public Privately Held
44.5%
18.0%
12.0%
13.5% 5.7%
41.6%
17.5%
11.4% 9.4%
5.4%
59.7% 20.6% 14.7% 31.4% 6.9%
Percent Change in Growing Stock Volumes on Public, Private, and Total US Timberland
Source: UDSA Forest Service Graph: HMR Executive®

True (T) or False (F). At current rates of deforestation, forty (40) percent of current forests in the U.S. will be lost by the middle of this century.
(Source: Bowyer, 2013)

True (T) or False (F). At current rates of deforestation, forty (40) percent of current forests in the U.S. will be lost by the middle of this century.
In fact, the area covered by forests in the U.S. is increasing.
(Source: Bowyer, 2013)


Recent History

Recent History
$500
$600
$700
$800
$900
$1,000
$1,100
$1,200
$1,300
$1,400
$1,500
Jan-96 Jan-98 Jan-00 Jan-02 Jan-04 Jan-06 Jan-08 Jan-10 Jan-12 Jan-14
KD
Inde
x in
Jan
199
6 D
olla
rs
9/11 Attack
Red Oak falls out of favor; prices drop
Supply driven price spike
Stock market crash
Housing market
collapse
Exports sharply contracting
Domestic furniture market begins shift to AsiaDomestic furniture
manufacturing peaks
Housing boom fueling
cabinet/flooring demand
Housing market rebounding
(Source: Barrett, 2013)

Trends in Demand for Wood Products


Exports U.S. Hardwood Exports
0.5
1.0
1.5
2.0
2.5
3.0
3.519
91
1993
1995
1997
1999
2001
2003
2005
2007
2009
2011
2013
Mill
ion
Cub
ic M
eter
s
LUMBER
LOGS
(Source: Barrett, 2013)

Regional Export Shifts U.S. Hardwood Lumber Exports
0
300
600
900
1,200
1,500
1,800
2,10019
91
1993
1995
1997
1999
2001
2003
2005
2007
2009
2011
2013
Thou
sand
Cub
ic M
eter
s
EuropeNorth AmericaEast/SE AsiaME/NACentral/South Amer./Carib
(Source: Barrett, 2013)

Exports U.S. Hardwood Exports to China
0.0
0.3
0.6
0.9
1.2
1.519
91
1993
1995
1997
1999
2001
2003
2005
2007
2009
2011
2013
Mill
ion
Cub
ic M
eter
s
LUMBER
LOGS
(Source: Barrett, 2013)

Asian Export Shifts U.S. Hardwood Lumber Exports to Asia
0
200
400
600
800
1,000
1,200
1,400
1,60019
91
1993
1995
1997
1999
2001
2003
2005
2007
2009
2011
2013
Thou
sand
Cub
ic M
eter
s
ChinaJapanTaiwanKorea, SouthVietnam
(Source: Barrett, 2013)

Imports Wood Furniture
0
2,000
4,000
6,000
8,000
10,000
12,00019
97
1999
2001
2003
2005
2007
2009
2011
2013
Mill
ion
$
EXPORTS
IMPORTS
(Source: Barrett, 2013)

20-Year Price Trends Nominal Real
Price PriceChange Change
FAS +1.0% -37.3%#1 Com -1.2% -38.7%#2 Com +16.8% -27.5%FAS +21.6% -24.5%#1 Com +30.4% -19.1%#2 Com +41.4% -12.3%FAS +6.8% -33.7%#1 Com +10.2% -31.6%#2 Com +27.1% -21.1%FAS +3.1% -36.0%#1 Com +8.1% -32.9%#2 Com +19.0% -26.1%FAS +1.7% -36.9%#1 Com +15.5% -28.3%#2 Com +25.0% -22.4%FAS -16.0% -47.9%#1 Com -19.6% -50.1%#2 Com -14.7% -47.0%
Unsel. Hard Maple
Unsel. Cherry
Red Oak
White Oak
Ash
Poplar
(Source: Barrett, 2013)

What issues are important in today’s export markets?

EUTR
• European Timber Regulation – On 3 March 2013, the EUTR came into effect
1. Prohibits illegally harvested timber and derived
products in the EU marketplace. 2. EU traders must exercise due diligence. 3. EU traders must keep records of their suppliers
and customers.
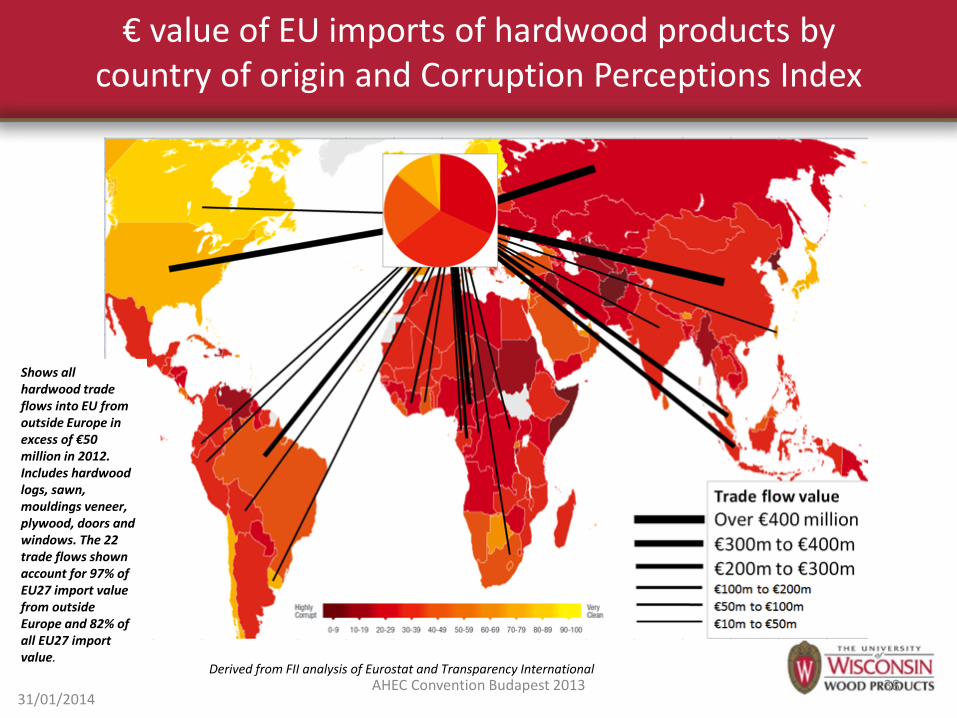
€ value of EU imports of hardwood products by country of origin and Corruption Perceptions Index
31/01/2014 AHEC Convention Budapest 2013 38
Derived from FII analysis of Eurostat and Transparency International
Shows all hardwood trade flows into EU from outside Europe in excess of €50 million in 2012. Includes hardwood logs, sawn, mouldings veneer, plywood, doors and windows. The 22 trade flows shown account for 97% of EU27 import value from outside Europe and 82% of all EU27 import value.

Lacey Act
• Lacey Act 1900 - prohibits trade in wildlife, fish, and plants that have been illegally taken, transported or sold.
• Lacey Act 2008 - amendment included anti-illegal-logging provisions.
Is U.S. wood legal?
• Legality – 2008 Seneca Creek Associates, LLC – 2014 AHEC budget
• Ownership

American Hardwoods and the EUTR
1. Prohibits illegally harvested timber and derived products in the EU marketplace.
2. EU traders must exercise due diligence. 3. EU traders must keep records of their suppliers and
customers.
• How does the EUTR impact trade outside of the EU?
– Voluntary Partnership Agreements (VPAs) • trade agreements with timber exporting countries

Forest Certification
• Certified wood has yet to achieve a critical mass in the marketplace.
• Driven primarily by the paper industry. • Examples from Wisconsin:
– Land base • State, County, and MFL
– Value to the solid Industry?

A Hardwood Promotion Strategy


Market Outlook

Global Economic Improvement
• Europe coming out of recession – Benefits direct lumber sales to EU mfrs – Benefits lumber sales to Chinese mfrs.
• Asian domestic demand slower – But much untapped potential
• U.S. economic recovery driving mfg. boom in Mexico and some U.S. repatriation – Both markets more loyal to NA hardwoods
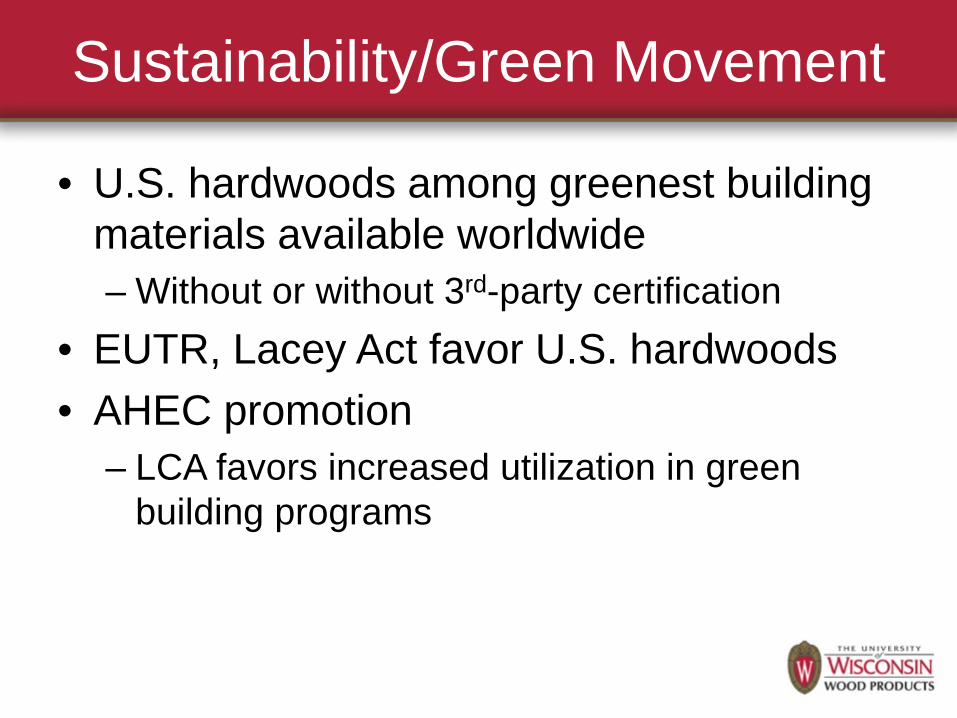
Sustainability/Green Movement
• U.S. hardwoods among greenest building materials available worldwide – Without or without 3rd-party certification
• EUTR, Lacey Act favor U.S. hardwoods • AHEC promotion
– LCA favors increased utilization in green building programs

U.S. Production
• Last year’s price increases resulted mostly from industry inability/unwillingness to increase production
• External constraints will restrain production for another year – Capital, lending, timber prices, logger issues

Short-Term (this year)
• Domestic lumber demand will seasonally taper towards winter – Flooring plants starting to fill up – Home construction will wind down
• Industrial products and exports to Asia will more than offset domestic grade lumber slowing through mid-November
• Production increases will lag demand – Prices generally firming through year-end
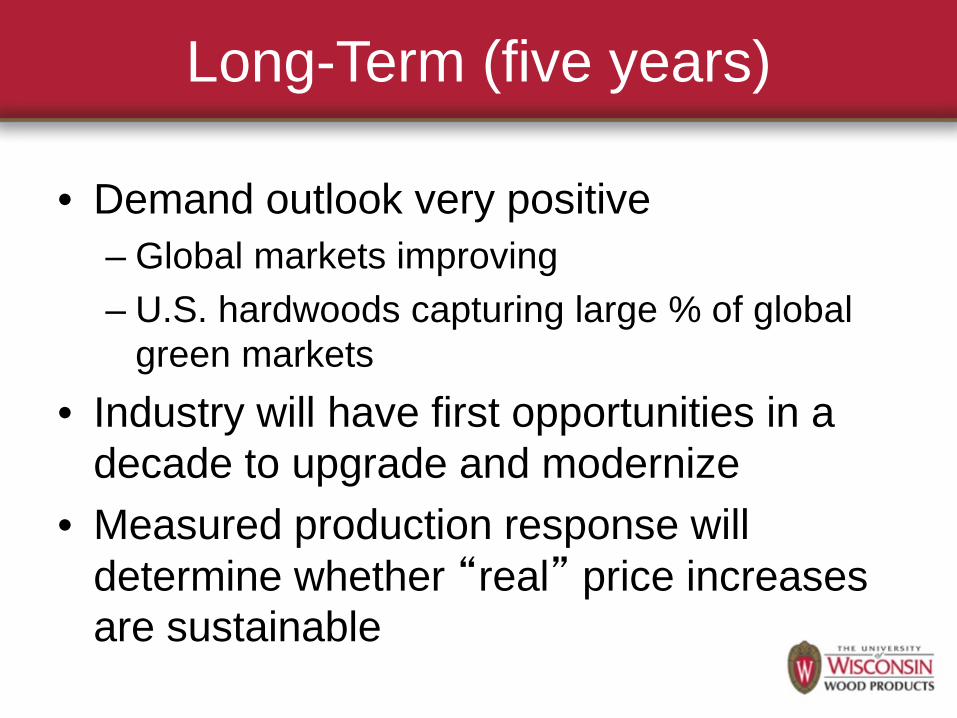
Long-Term (five years)
• Demand outlook very positive – Global markets improving – U.S. hardwoods capturing large % of global
green markets • Industry will have first opportunities in a
decade to upgrade and modernize • Measured production response will
determine whether “real” price increases are sustainable

Does this apply to WI?
• WI Hardwoods – Freight disadvantage for export – Central advantage for domestic use – Color, grain, uniformity, etc.
• WI Pulp and Paper – Older and smaller equipment – Specialty products – Close to markets – Secondary paper manufacturing hub

Why are WI Wood Products the Right Choice?
• When compared to other non-wood substitute materials: – WI Wood Products are abundant – WI Wood Products are renewable – WI Wood Products are natural – WI Wood Products use less energy to manufacture – WI Wood Products create less pollution during
manufacturing – WI Wood Products are carbon neutral – WI Wood Products are beautiful!

Contact Information
Scott Bowe, PhD Professor & Wood Products Specialist
Department of Forest and Wildlife Ecology College of Agricultural and Life Sciences
University of Wisconsin 226 Russell Laboratories
1630 Linden Drive Madison, WI 53706-1598, USA
Phone: 608-265-5849 Email: [email protected]