Embed Size (px)
Citation preview
Wisconsin’s Annual Elder Abuse and Neglect Report: 2016 Bureau of Aging and Disability Resources
Wisconsin Department of Health Services
Wisconsin’s Annual Elder Abuse and Neglect Report:
2016
A statewide summary of reports submitted by Wisconsin counties
Division of Public Health P-00124-16 (11/2017)

Wisconsin’s Annual Elder Abuse and Neglect Report: 2016 Bureau of Aging and Disability Resources
Wisconsin Department of Health Services
Introduction: The Annual Elder Abuse and Neglect Report
In Wisconsin, county agencies receive elder abuse, neglect, and financial exploitation referrals and determine whether a situation of abuse, neglect, or financial exploitation exists. They create individualized service plans to assist elder adults at risk and help ensure their safety. After responding to a referral, county agencies file an incident report with the Department of Health Services, using the web-based Wisconsin Incident Tracking System (WITS). A compilation of all county reports from 2016 are the basis of this statewide report: Wisconsin’s Annual Elder Abuse and Neglect Report.

Wisconsin’s Annual Elder Abuse and Neglect Report: 2016 Bureau of Aging and Disability Resources
Wisconsin Department of Health Services
2016 Annual Report
This report documents and summarizes reported incidents in Wisconsin, providing information about: • The types of abuse and neglect reported. • The characteristics of elder adults at risk and alleged abusers. • The local responses that guide the state’s efforts to stop elder
abuse. Allegations of abuse, neglect, and exploitation of individuals living in licensed facilities are generally addressed by the Department of Health Services’ Office of Caregiver Quality, which is located in the Division of Quality Assurance (DQA).
Wisconsin’s Annual Elder Abuse and Neglect Report: 2016 Bureau of Aging and Disability Resources
Wisconsin Department of Health Services
Your Role in Reporting Abuse, Neglect, or Exploitation of Older Adults
Wisconsin has made great strides in identifying and protecting elders. No one should experience or endure abuse, neglect or exploitation. Let individuals know that you are concerned about them and that they are not alone. There are others who do understand and are there to help them stay safe. Call your County Help Line if you need to talk to someone about suspected abuse, neglect, or exploitation of an elder adult at risk (ages 60 and older). See http://dhs.wisconsin.gov/aps/Contacts/aaragencies.htm for these help line phone numbers.
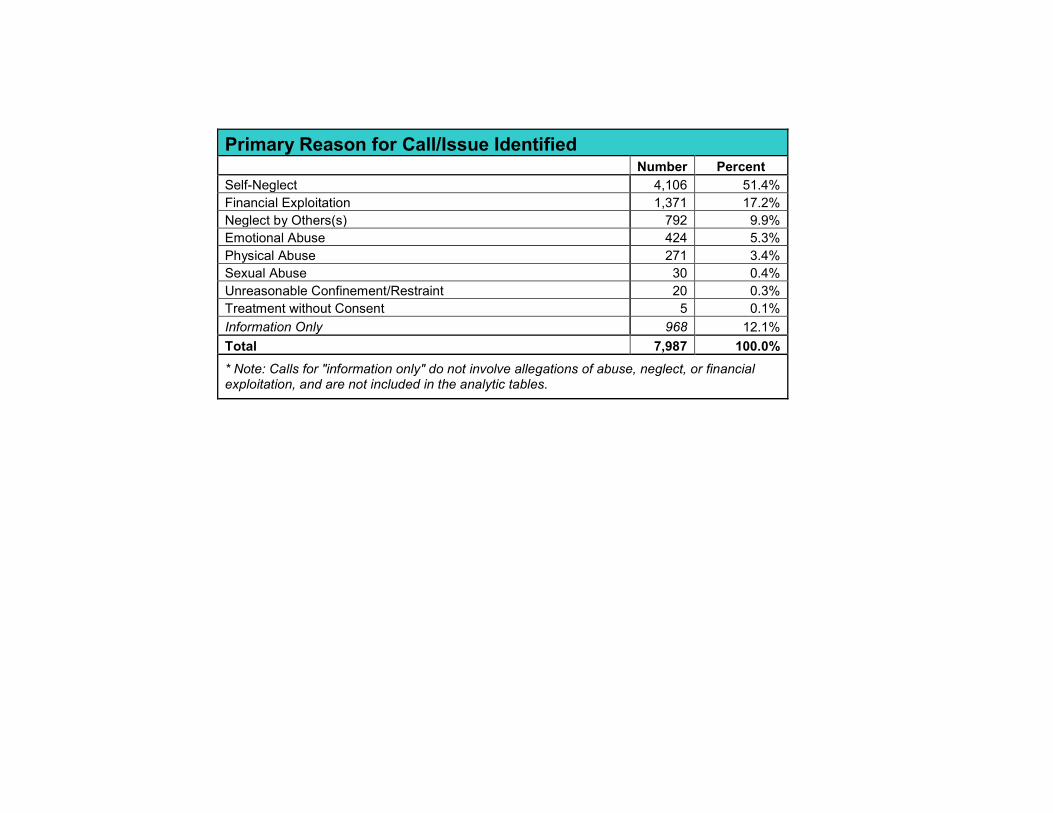
Primary Reason for Call/Issue Identified Number Percent Self-Neglect 4,106 51.4% Financial Exploitation 1,371 17.2% Neglect by Others(s) 792 9.9% Emotional Abuse 424 5.3% Physical Abuse 271 3.4% Sexual Abuse 30 0.4% Unreasonable Confinement/Restraint 20 0.3% Treatment without Consent 5 0.1% Information Only 968 12.1% Total 7,987 100.0% * Note: Calls for "information only" do not involve allegations of abuse, neglect, or financial exploitation, and are not included in the analytic tables.

Self-Neglect52%
Financial Exploitation17%
Neglect by Others(s)10%
Emotional Abuse5% Physical Abuse
4%Sexual Abuse
0%
Unreasonable Confinement/
Restraint0.3%
Information Only12%
Primary Issue Identified
* Note: Calls for "information only" do not involve allegations of abuse, neglect, or financial exploitation, and are not included in the analytic tables.
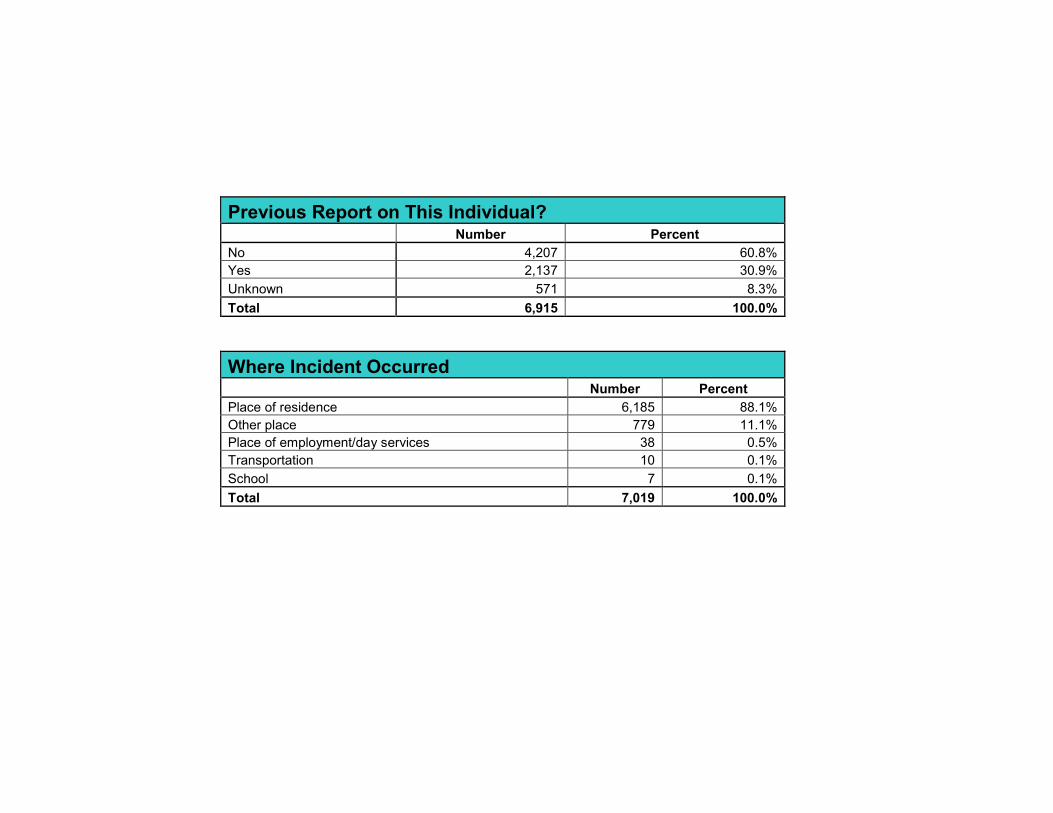
Previous Report on This Individual? Number Percent No 4,207 60.8% Yes 2,137 30.9% Unknown 571 8.3% Total 6,915 100.0%
Where Incident Occurred Number Percent Place of residence 6,185 88.1% Other place 779 11.1% Place of employment/day services 38 0.5% Transportation 10 0.1% School 7 0.1% Total 7,019 100.0%

Number PercentRelative 1,358 19.3%Medical professional 1,285 18.3%Other referral source (specify) 817 11.6%Other provider (specify) 700 10.0%Law enforcement 677 9.6%Agency (specify) 491 7.0%Friend/neighbor 500 7.1%Victim 330 4.7%ADRC 276 3.9%Residential support provider 212 3.0%Anonymous 199 2.8%Mental health svc provider 84 1.2%Housing inspection/zoning 41 0.6%Vocational/day svc prov 8 0.1%Regulatory auth (DHFS/DQA) 29 0.4%Employer 2 0.0%Alleged abuser 7 0.1%Subst abuse svc provider 3 0.0%Total 7,019 100.0%
Referral Source
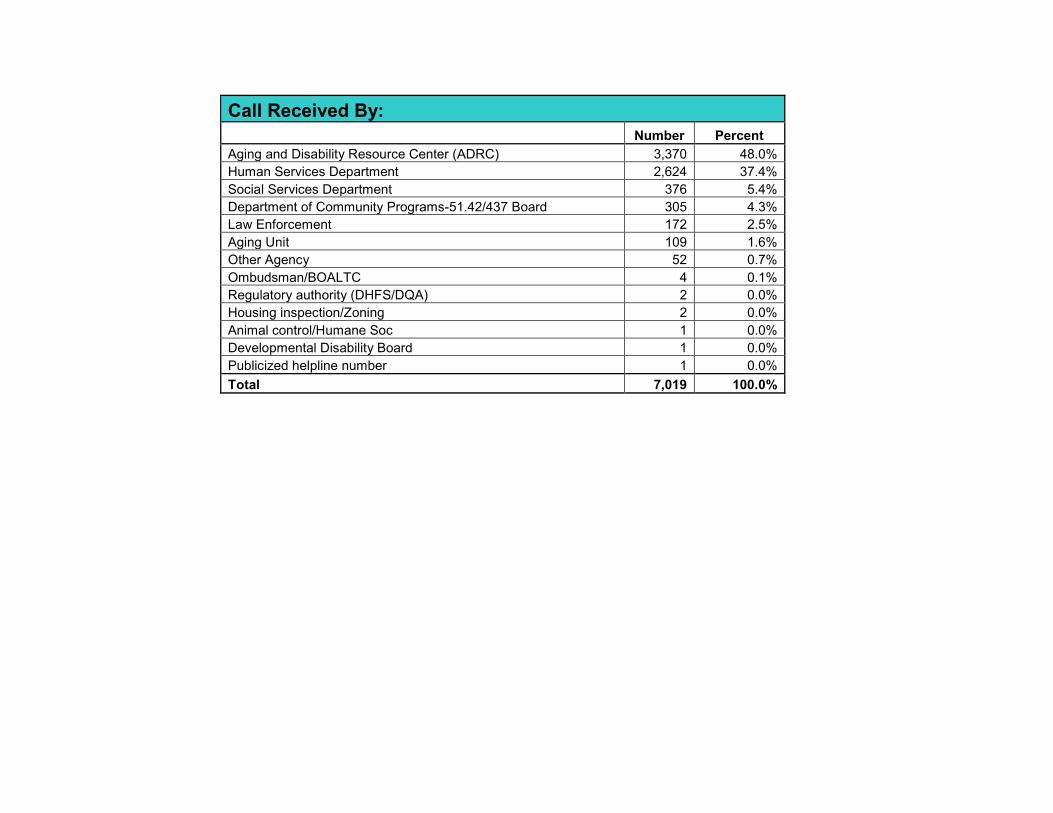
Call Received By: Number Percent Aging and Disability Resource Center (ADRC) 3,370 48.0% Human Services Department 2,624 37.4% Social Services Department 376 5.4% Department of Community Programs-51.42/437 Board 305 4.3% Law Enforcement 172 2.5% Aging Unit 109 1.6% Other Agency 52 0.7% Ombudsman/BOALTC 4 0.1% Regulatory authority (DHFS/DQA) 2 0.0% Housing inspection/Zoning 2 0.0% Animal control/Humane Soc 1 0.0% Developmental Disability Board 1 0.0% Publicized helpline number 1 0.0% Total 7,019 100.0%

0.00%
0.01%
0.01%
0.03%
0.03%
0.1%
0.7%
1.6%
2.5%
4.3%
5.4%
37.4%
48.0%
Developmental Disability Board
Animal control/Humane Soc
Publicized helpline number
Regulatory authority (DHFS/DQA)
Housing inspection/Zoning
Ombudsman/BOALTC
Other Agency
Aging Unit
Law Enforcement
Department of Community Programs-51.42/437 Board
Social Services Department
Human Services Department
Aging and Disability Resource Center (ADRC)
Call Received By:

Number PercentHuman services dept 3,246 46.2%Aging and Disability Resource Center (ADRC) 1,732 24.7%Aging Unit 967 13.8%Social Services Department 538 7.7%Dept Community Progs_51.42/437 Board 303 4.3%Law Enforcement 192 2.7%Other (specify) 23 0.3%DQA/Licensing and reg 6 0.1%Public Health Department 5 0.1%Housing inspection/zoning 5 0.1%Developmental Disability Board 0 0.0%BOALTC/Ombudsman 2 0.0%Animal control/humane society 0 0.0%WI Department of Justice 0 0.0%Total 7,019 100.0%
Initial Investigating Agency

0.00%
0.00%
0.00%
0.03%
0.1%
0.1%
0.1%
0.3%
2.7%
4.3%
7.7%
13.8%
24.7%
46.2%
Developmental Disability Board
Animal control/humane society
WI Department of Justice
BOALTC/Ombudsman
Public Health Department
Housing inspection/zoning
DQA/Licensing and reg
Other (specify)
Law Enforcement
Dept Community Progs_51.42/437 Board
Social Services Department
Aging Unit
Aging and Disability Resource Center (ADRC)
Human services dept
Initial Investigating Agency

Number PercentNo 6,326 90.1%Yes 413 5.9%Unknown 280 4.0%Total 7,019 100.0%
Number PercentNo 310 75.1%Yes 100 24.2%Unknown 3 0.7%Total 413 100.0%Note: Percents represent share of all life-threatening incidents.
Number PercentYes 46 46.0%No 36 36.0%Unknown 18 18.0%Total 100 100.0%Note: Percents represent share of all incidents involving a death.
Number PercentNo 20 43.5%Yes 15 32.6%Unknown 11 23.9%Total 46 100.0%Note: Percents represent share of all incidents with death related to incident.
Was Incident Life Threatening?
Has Elder Adult at Risk Died?
Was Death Related to the Incident?
Was Death Directly Caused by Incident?
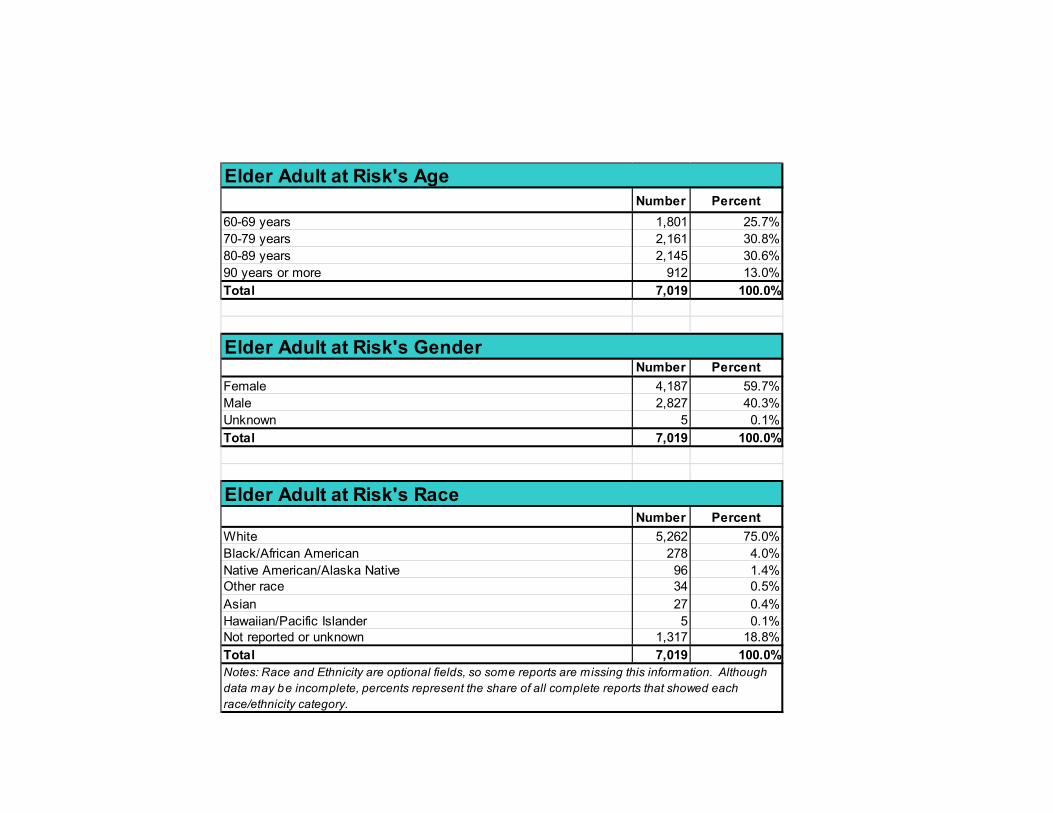
Number Percent60-69 years 1,801 25.7%70-79 years 2,161 30.8%80-89 years 2,145 30.6%90 years or more 912 13.0%Total 7,019 100.0%
Number PercentFemale 4,187 59.7%Male 2,827 40.3%Unknown 5 0.1%Total 7,019 100.0%
Number PercentWhite 5,262 75.0%Black/African American 278 4.0%Native American/Alaska Native 96 1.4%Other race 34 0.5%Asian 27 0.4%Hawaiian/Pacific Islander 5 0.1%Not reported or unknown 1,317 18.8%Total 7,019 100.0%Notes: Race and Ethnicity are optional fields, so some reports are missing this information. Although data may be incomplete, percents represent the share of all complete reports that showed each race/ethnicity category.
Elder Adult at Risk's Age
Elder Adult at Risk's Gender
Elder Adult at Risk's Race

60-69 years, 26%
70-79 years, 31%
80-89 years, 31%
90 years or more, 13%
Elder Adult at Risk's Age
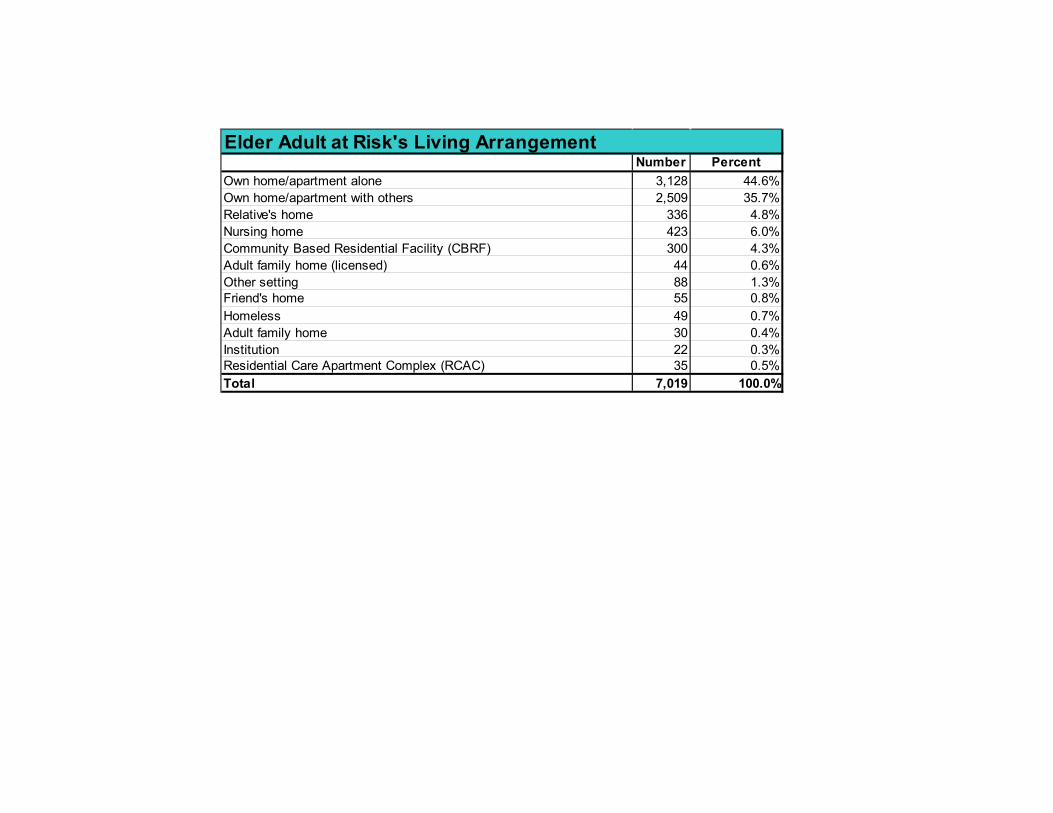
Number PercentOwn home/apartment alone 3,128 44.6%Own home/apartment with others 2,509 35.7%Relative's home 336 4.8%Nursing home 423 6.0%Community Based Residential Facility (CBRF) 300 4.3%Adult family home (licensed) 44 0.6%Other setting 88 1.3%Friend's home 55 0.8%Homeless 49 0.7%Adult family home 30 0.4%Institution 22 0.3%Residential Care Apartment Complex (RCAC) 35 0.5%Total 7,019 100.0%
Elder Adult at Risk's Living Arrangement

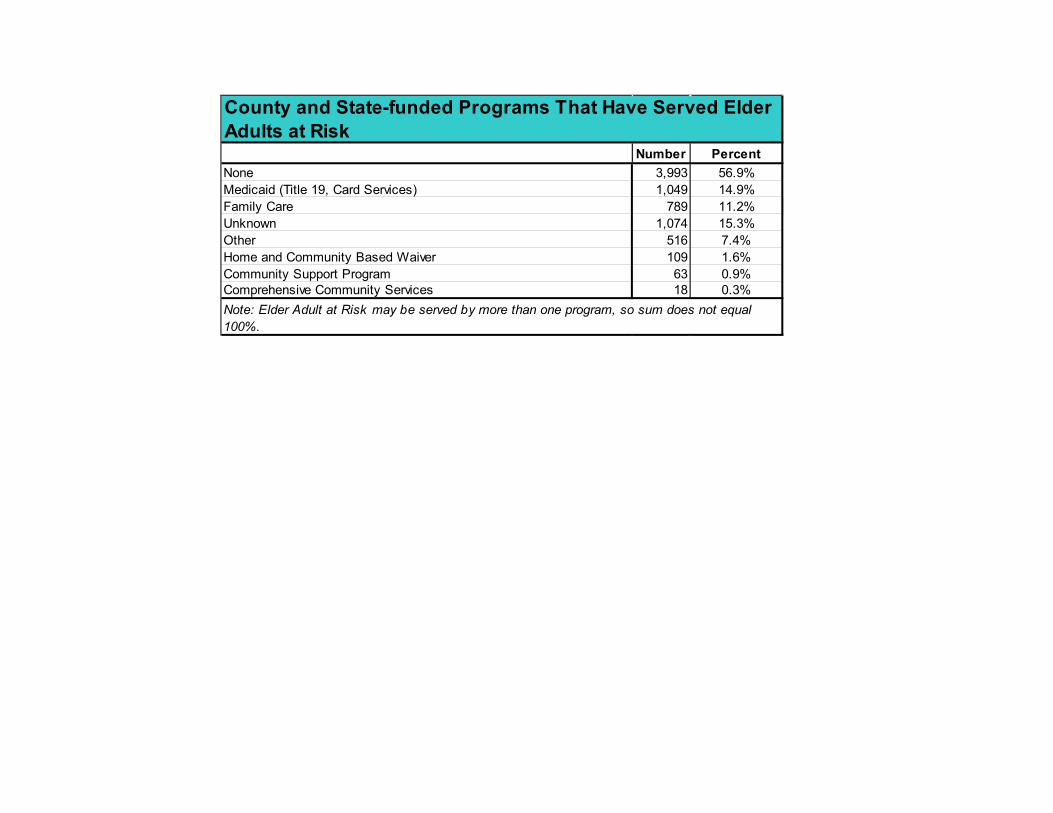
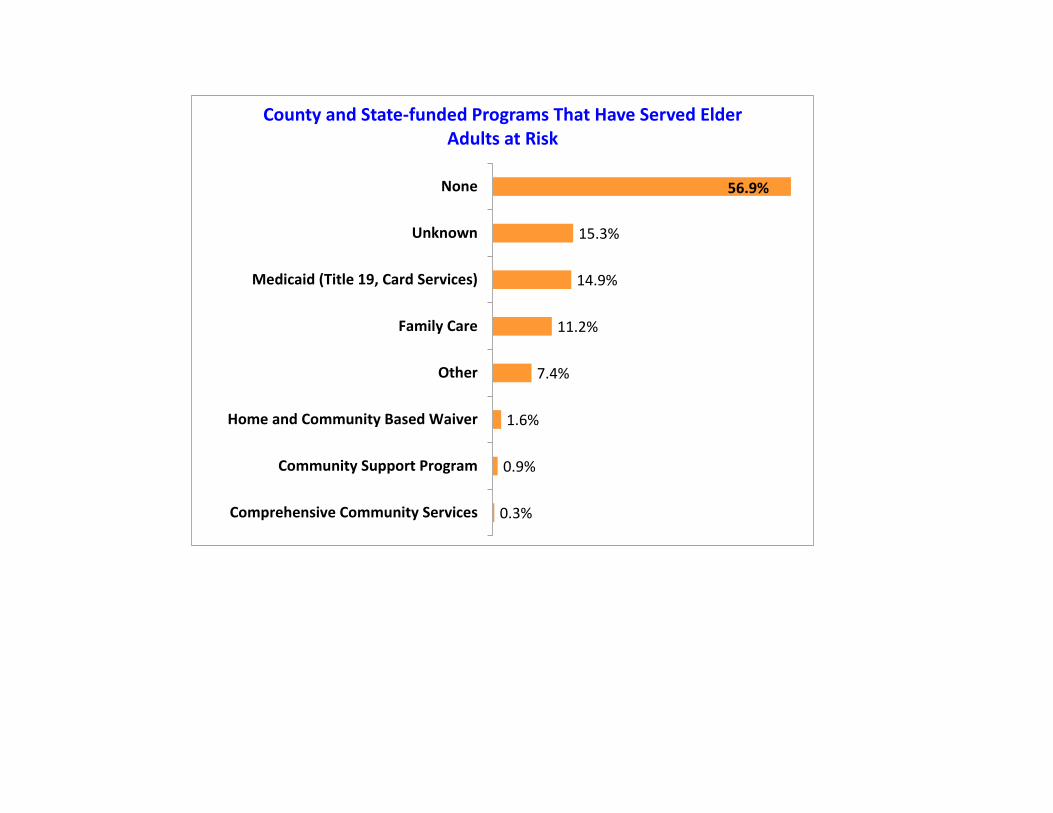
Number PercentNone 3,993 56.9%Medicaid (Title 19, Card Services) 1,049 14.9%Family Care 789 11.2%Unknown 1,074 15.3%Other 516 7.4%Home and Community Based Waiver 109 1.6%Community Support Program 63 0.9%Comprehensive Community Services 18 0.3%
County and State-funded Programs That Have Served Elder Adults at Risk
Note: Elder Adult at Risk may be served by more than one program, so sum does not equal 100%.
0.3%
0.9%
1.6%
7.4%
11.2%
14.9%
15.3%
56.9%
Comprehensive Community Services
Community Support Program
Home and Community Based Waiver
Other
Family Care
Medicaid (Title 19, Card Services)
Unknown
None
County and State-funded Programs That Have Served Elder Adults at Risk

Does Elder Adult at Risk Have a Substitute Decision-Maker?
Number Percent No 3,654 52.1% Yes 2,440 34.8% Unknown 925 13.2% Total 7,019 100.0%
Type(s) of Substitute Decision-Maker Number Percent Power of Attorney (POA) for Health Care (Not activated) 989 40.5% Power of Attorney (POA) for Health Care (Activated) 930 38.1% Power of Attorney (POA) for Finances (Activated) 905 37.1% Guardian of the Person 366 15.0% Guardian of the Estate 277 11.4% Power of Attorney (POA) for Finances (Not activated) 360 14.8% Representative Payee 106 4.3% Other 32 1.3% Temporary Guardian 30 1.2% Conservatorship 10 0.4% Percents represent share of all those with any kind of substitute decision-maker (n=2,225). Multiple responses are allowed, so percents do not total 100%.

0.4%
1.2%
1.3%
4.3%
11.4%
14.8%
15.0%
37.1%
38.1%
40.5%
Conservatorship
Temporary Guardian
Other
Representative Payee
Guardian of the Estate
Power of Attorney (POA) for Finances (Not activated)
Guardian of the Person
Power of Attorney (POA) for Finances (Activated)
Power of Attorney (POA) for Health Care (Activated)
Power of Attorney (POA) for Health Care (Notactivated)
Type(s) of Substitute Decision-Maker

Number PercentFrail elderly 3,194 45.5%Dementia 1,887 26.9%Mobility impaired 1,287 18.3%Medically fragile 1,040 14.8%Mental illness (mentally ill) 735 10.5%Other medical condition 825 11.8%Developmental disability 163 2.3%Disoriented and confused 889 12.7%Physical disability 576 8.2%Diabetes 569 8.1%Homebound 533 7.6%Incontinent 496 7.1%Challenging/dangerous behavior 368 5.2%Alcohol abuse 371 5.3%Stroke-related condition 318 4.5%Chronic mental illness 204 2.9%Deaf/hard of hearing 333 4.7%Other characteristic 224 3.2%Morbidly obese 183 2.6%Financial dependence: alleged abuser dependent on adult at risk 208 3.0%Blind/visually impaired 209 3.0%Chronic alcoholic 159 2.3%Unemployed 83 1.2%Brain injury 85 1.2%Drug abuse 59 0.8%Communication disorder 40 0.6%Financially dependent on abuser 39 0.6%Functionally illiterate 25 0.4%Limited English proficiency 24 0.3%None of the listed characteristics 425 6.1%
Elder Adult at Risk's Characteristics
Percents refer to share of all elder adults at risk having this characteristic. Multiple responses are allowed, so percents do not total 100%.
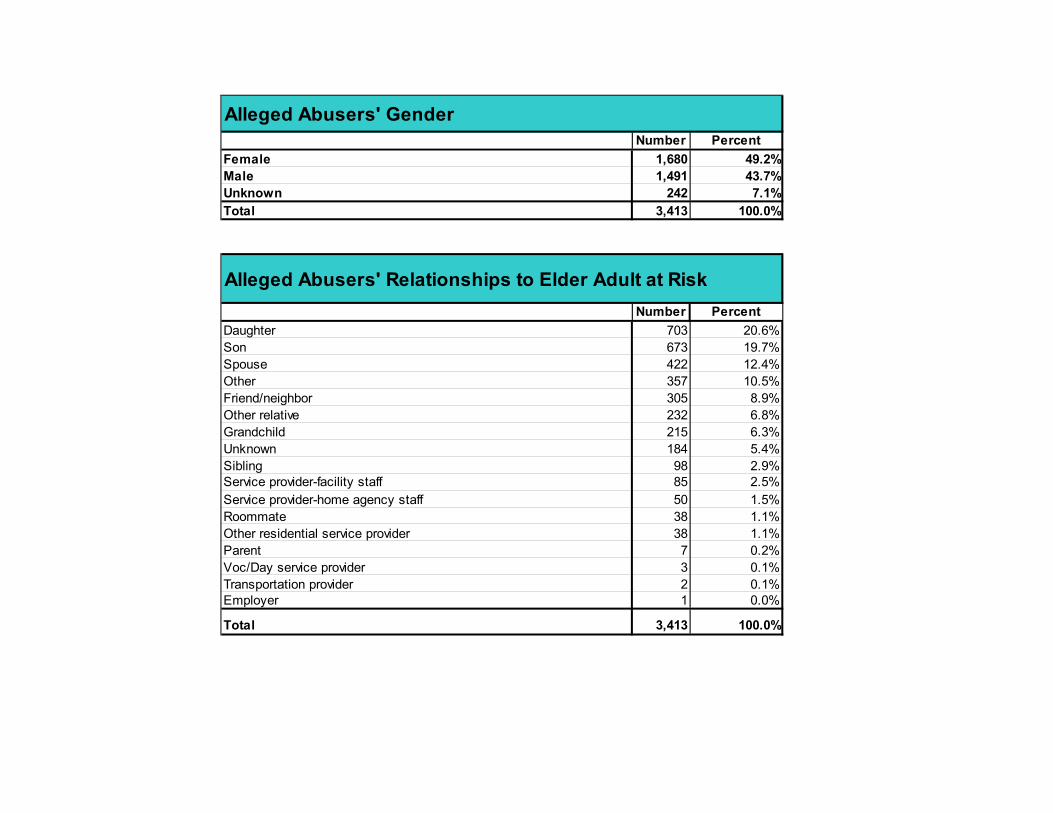
Number PercentFemale 1,680 49.2%Male 1,491 43.7%Unknown 242 7.1%Total 3,413 100.0%
Number PercentDaughter 703 20.6%Son 673 19.7%Spouse 422 12.4%Other 357 10.5%Friend/neighbor 305 8.9%Other relative 232 6.8%Grandchild 215 6.3%Unknown 184 5.4%Sibling 98 2.9%Service provider-facility staff 85 2.5%Service provider-home agency staff 50 1.5%Roommate 38 1.1%Other residential service provider 38 1.1%Parent 7 0.2%Voc/Day service provider 3 0.1%Transportation provider 2 0.1%Employer 1 0.0%
Total 3,413 100.0%
Alleged Abusers' Gender
Alleged Abusers' Relationships to Elder Adult at Risk

Daughter, 21% Son, 20%
Spouse, 12%
Other, 10%
Friend/neighbor, 9%
Other relative, 7%
Grandchild, 6%
Unknown, 5%
Sibling, 3%
Service provider-facility staff, 2%
Service provider-home agency staff, 1%
Roommate, 1%
Other residential service provider, 1%
Parent, 0%
Voc/Day service provider, 0%
Transportation provider, 0%
Employer, 0%
Alleged Abusers' Relationships to Elder Adult at Risk
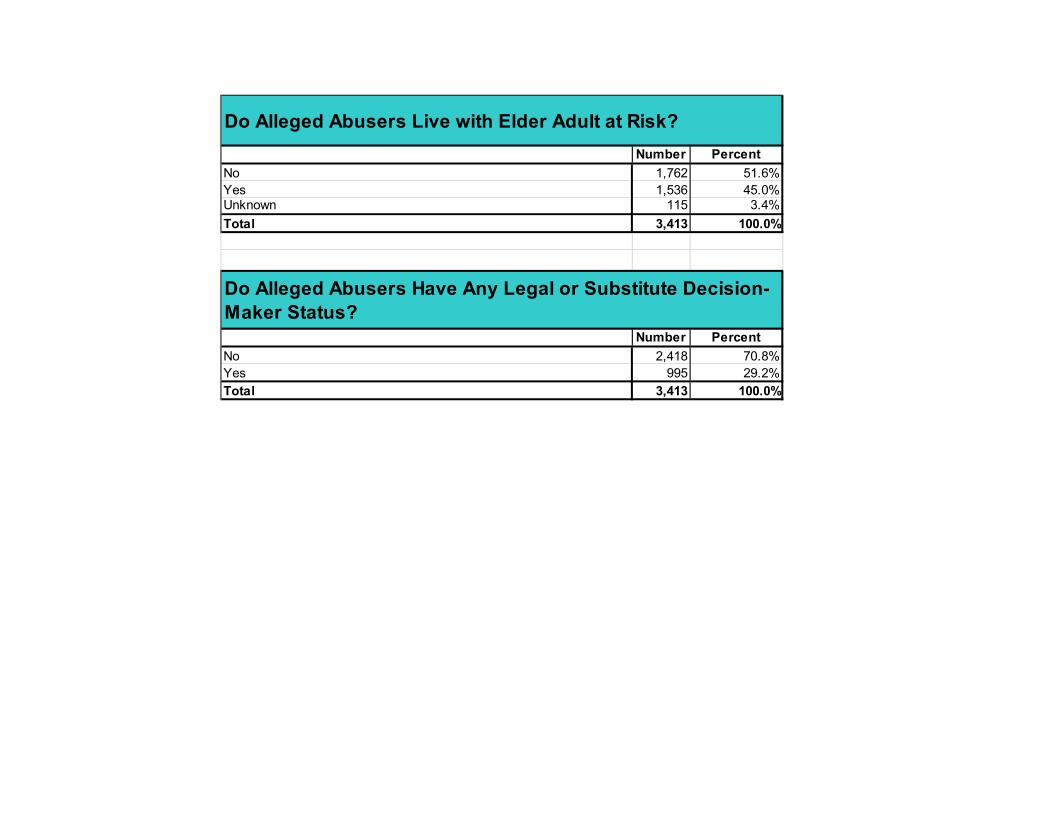
Number PercentNo 1,762 51.6%Yes 1,536 45.0%Unknown 115 3.4%Total 3,413 100.0%
Number PercentNo 2,418 70.8%Yes 995 29.2%Total 3,413 100.0%
Do Alleged Abusers Live with Elder Adult at Risk?
Do Alleged Abusers Have Any Legal or Substitute Decision-Maker Status?
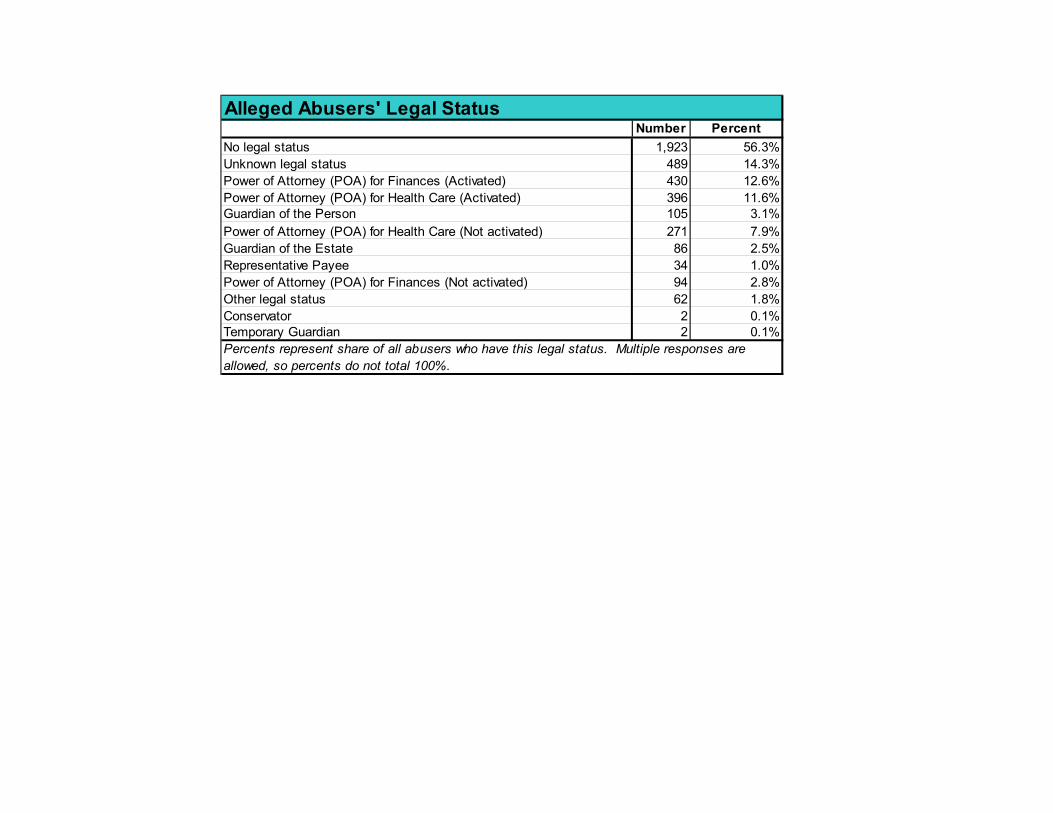
Number PercentNo legal status 1,923 56.3%Unknown legal status 489 14.3%Power of Attorney (POA) for Finances (Activated) 430 12.6%Power of Attorney (POA) for Health Care (Activated) 396 11.6%Guardian of the Person 105 3.1%Power of Attorney (POA) for Health Care (Not activated) 271 7.9%Guardian of the Estate 86 2.5%Representative Payee 34 1.0%Power of Attorney (POA) for Finances (Not activated) 94 2.8%Other legal status 62 1.8%Conservator 2 0.1%Temporary Guardian 2 0.1%
Alleged Abusers' Legal Status
Percents represent share of all abusers who have this legal status. Multiple responses are allowed, so percents do not total 100%.
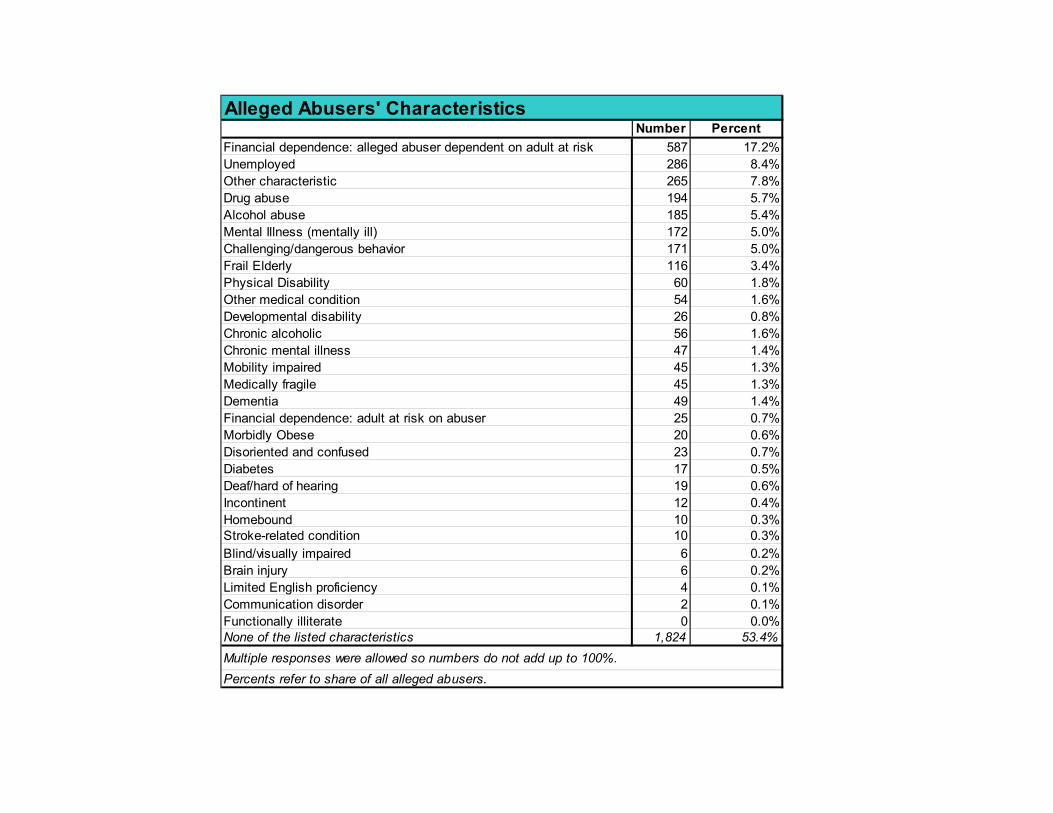
Number PercentFinancial dependence: alleged abuser dependent on adult at risk 587 17.2%Unemployed 286 8.4%Other characteristic 265 7.8%Drug abuse 194 5.7%Alcohol abuse 185 5.4%Mental Illness (mentally ill) 172 5.0%Challenging/dangerous behavior 171 5.0%Frail Elderly 116 3.4%Physical Disability 60 1.8%Other medical condition 54 1.6%Developmental disability 26 0.8%Chronic alcoholic 56 1.6%Chronic mental illness 47 1.4%Mobility impaired 45 1.3%Medically fragile 45 1.3%Dementia 49 1.4%Financial dependence: adult at risk on abuser 25 0.7%Morbidly Obese 20 0.6%Disoriented and confused 23 0.7%Diabetes 17 0.5%Deaf/hard of hearing 19 0.6%Incontinent 12 0.4%Homebound 10 0.3%Stroke-related condition 10 0.3%Blind/visually impaired 6 0.2%Brain injury 6 0.2%Limited English proficiency 4 0.1%Communication disorder 2 0.1%Functionally illiterate 0 0.0%None of the listed characteristics 1,824 53.4%
Alleged Abusers' Characteristics
Multiple responses were allowed so numbers do not add up to 100%.Percents refer to share of all alleged abusers.

Number PercentNo, one alleged abuser only 3,257 95.4%Yes 156 4.6%
Total 3,413 100.0%
Number PercentSubstantiated 3,759 53.6%Unsubstantiated 2,250 32.1%Unable to Substantiate 1,010 14.4%Total 7,019 100.0%
Number PercentServices offered-some accepted 1,703 24.3%Services offered-not accepted 1,457 20.8%Services not needed 1,190 17.0%Services offered-all accepted 938 13.4%Guardian referral 616 8.8%Outreach continues 589 8.4%Referral made to other agency 527 7.5%Protective services placement 441 6.3%Investigation not accepted 370 5.3%Referral to law enforcement/Department of Justice 336 4.8%Other disposition 312 4.4%Other legal action 153 2.2%Referral to protection/advocacy agencies 45 0.6%Mental health commitment 41 0.6%Response/investigation continues 51 0.7%Referral to regulatory authority (DHS/DQA) 45 0.6%Services needed are not available 19 0.3%Referral to Caregiver Misconduct Registry (DHS/DQA) 24 0.3%Referral to detoxification services 10 0.1%Referral made to state agency 14 0.2%
Was Hurt or Harm Substantiated?
More than One Alleged Abuser?
Actions Taken to Assist Elder Adult at Risk
Percents refer to share of all reports showing this action. Multiple responses are allowed so numbers do not add up to 100%.

Number PercentService coordination 2,096 29.9%Substitute decision-making 1,148 16.4%Community based aids/services 1,303 18.6%Facility-based care 1,110 15.8%Advocacy/Legal services 945 13.5%Medical services 460 6.6%Emergency response services 364 5.2%Day care services/treatment 267 3.8%Other services planned 241 3.4%Transportation 206 2.9%Domestic violence/sexual assault victim services 67 1.0%
Services Planned for Elder Adult at Risk
Percents refer to share of all reports showing this service planned. Multiple responses were allowed so numbers do not add up to 100%

1.0%
2.9%
3.4%
3.8%
5.2%
6.6%
13.5%
15.8%
16.4%
18.6%
29.9%
Domestic violence/sexual assault victim services
Transportation
Other services planned
Day care services/treatment
Emergency response services
Medical services
Advocacy/Legal services
Facility-based care
Substitute decision-making
Community based aids/services
Service coordination
Services Planned for Elder Adult at Risk
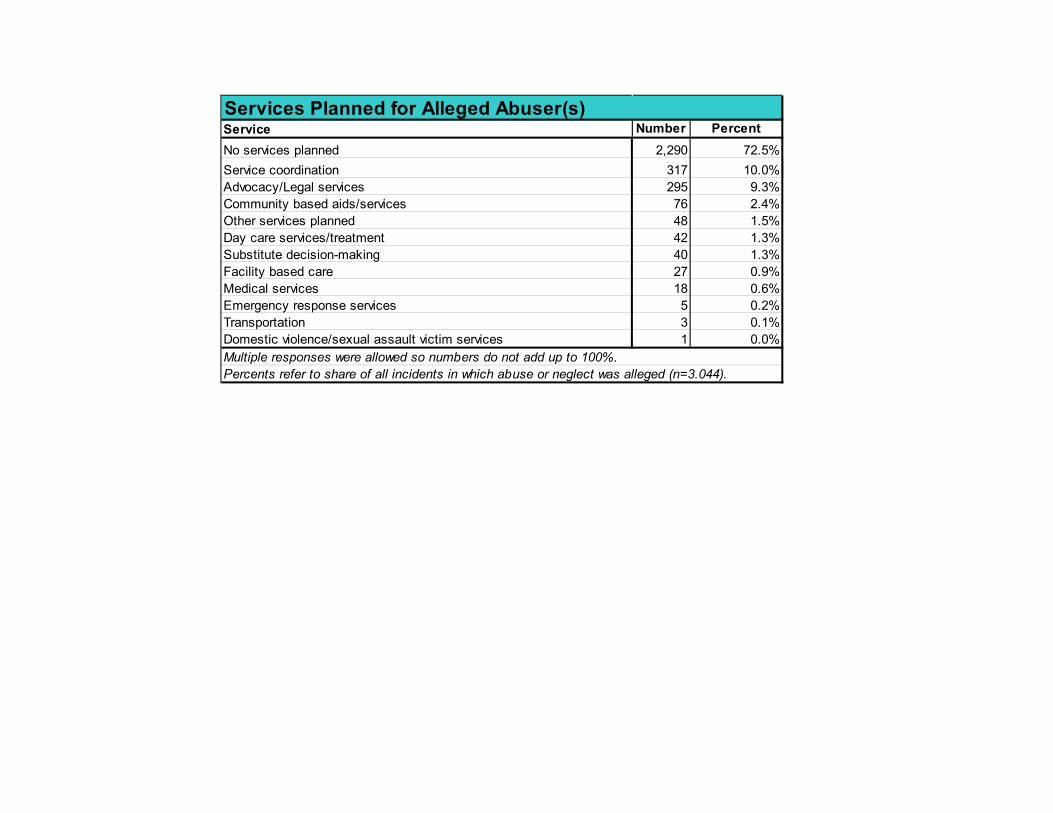
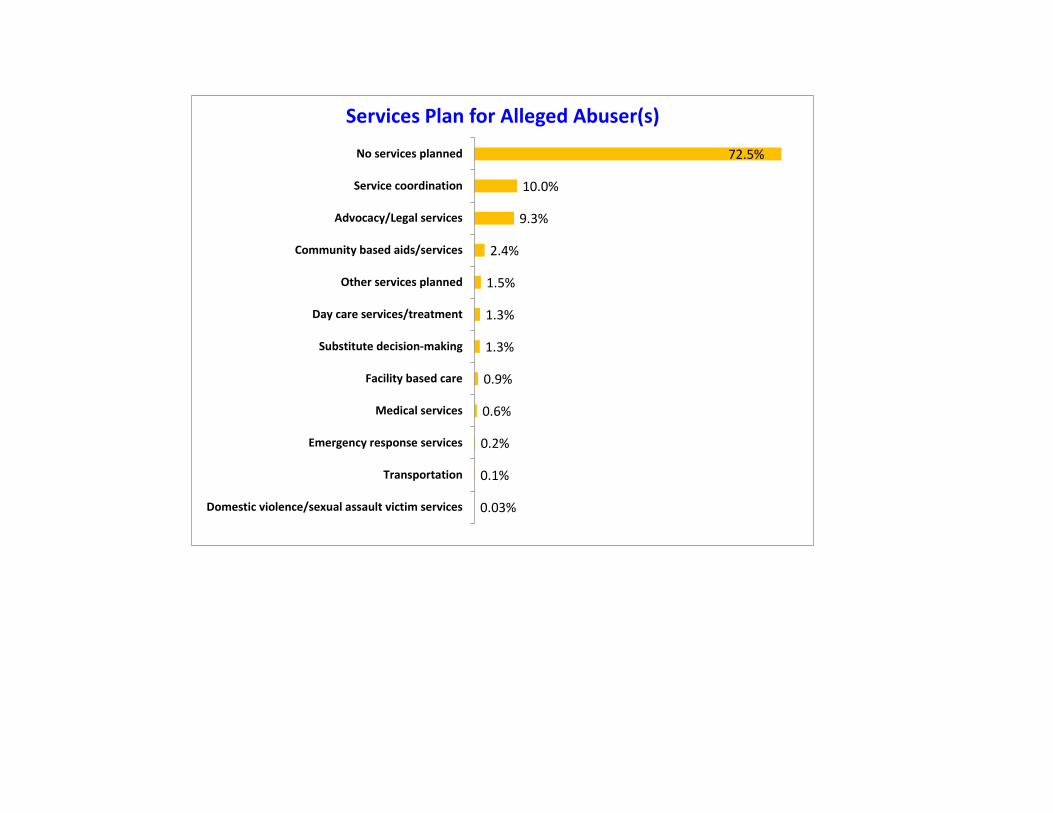
Service Number PercentNo services planned 2,290 72.5%Service coordination 317 10.0%Advocacy/Legal services 295 9.3%Community based aids/services 76 2.4%Other services planned 48 1.5%Day care services/treatment 42 1.3%Substitute decision-making 40 1.3%Facility based care 27 0.9%Medical services 18 0.6%Emergency response services 5 0.2%Transportation 3 0.1%Domestic violence/sexual assault victim services 1 0.0%
Percents refer to share of all incidents in which abuse or neglect was alleged (n=3.044).
Services Planned for Alleged Abuser(s)
Multiple responses were allowed so numbers do not add up to 100%.
0.03%
0.1%
0.2%
0.6%
0.9%
1.3%
1.3%
1.5%
2.4%
9.3%
10.0%
72.5%
Domestic violence/sexual assault victim services
Transportation
Emergency response services
Medical services
Facility based care
Substitute decision-making
Day care services/treatment
Other services planned
Community based aids/services
Advocacy/Legal services
Service coordination
No services planned
Services Plan for Alleged Abuser(s)
Wisconsin’s Annual Elder Abuse and Neglect Report: 2016 Bureau of Aging and Disability Resources
Wisconsin Department of Health Services
Contact Information Doreen Goetsch, CSW
Adult Protective Services Coordinator Wisconsin Department of Health Services
Division of Public Health Bureau of Aging and Disability Resources P.O. Box 7851, Madison WI 53707-7851
Phone: 608-266-2568 FAX: 608-267-3203
Email: [email protected]