Embed Size (px)
Citation preview
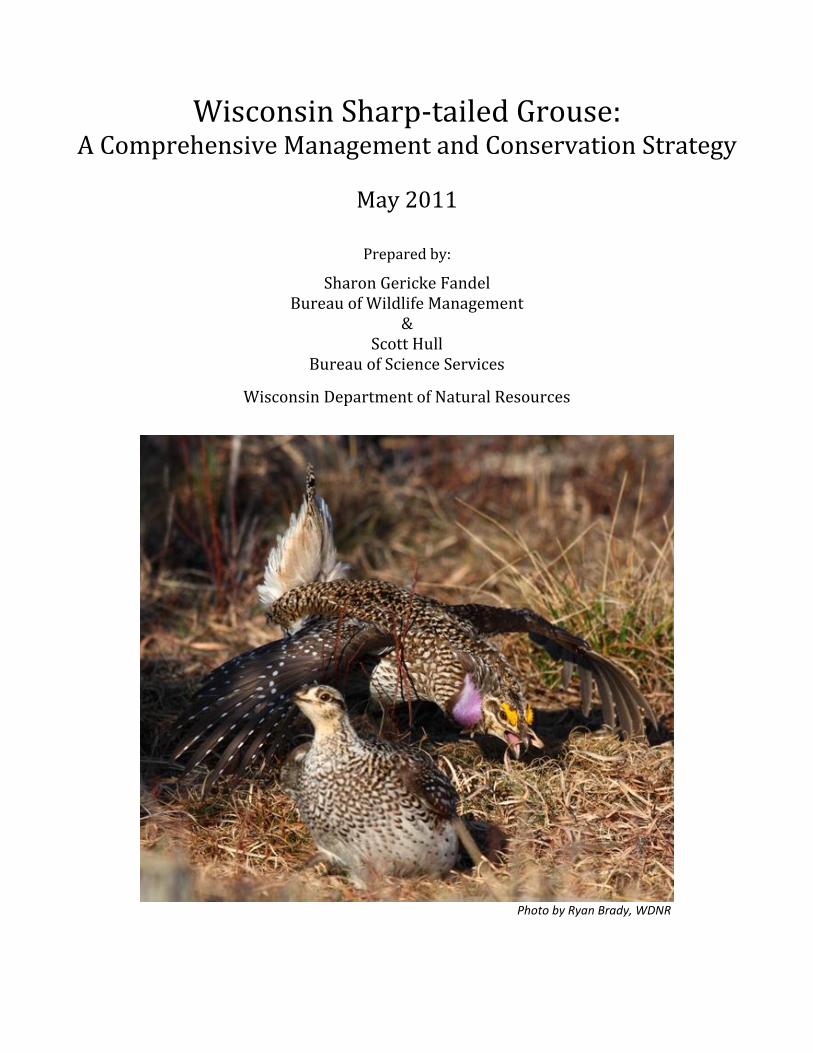
Wisconsin Sharp-tailed Grouse:
A Comprehensive Management and Conservation Strategy
May 2011
Prepared by:
Sharon Gericke Fandel Bureau of Wildlife Management
& Scott Hull
Bureau of Science Services
Wisconsin Department of Natural Resources
Photo by Ryan Brady, WDNR

ii
Plan Timeline & Implementation Updates
Wisconsin Sharp-tailed Grouse: A Comprehensive Management and Conservation Strategy Author(s) Fandel, S.G. and S.D. Hull
Date of Approval June 22, 2011
Contact Address Wisconsin Department of Natural Resources 101 S. Webster St. Madison, WI 53707
Sources of Support WDNR Bureau of Wildlife Management and Bureau of Science Services, Wisconsin Sharp-tailed Grouse Society, Friends of Crex Meadows, Friends of the Namekagon Barrens, Central Michigan University
Conflicts of Interest None Reported
Part I. Plan Revisions/Addendums Date Final draft approved June 22, 2011 (WDNR Natural Resources Board)
DETAILS: In addition to approval of the plan, the NRB requested an addendum addressing predation impacts and a recommendation to address predation as it relates to STGR population security.
Follow-up presentation - Predation Management
August 10, 2011 (WDNR Natural Resources Board) DETAILS: Presented information about predation impacts on the STGR population. Addendum to the plan to include the feasibility of various options and a Department recommendation for action. Addendum due February 2012.
Predation Management Addendum April 25, 2012 (WDNR Natural Resources Board) DETAILS: Addendum added to Plan, reflecting additions/ updates to sections IB, IF5, and IID5 (pages 10, 33, and 45, respectively), options available to mitigate predation impacts on STGR in Wisconsin and a Department recommendation for predation management via landscape-level habitat management. Also included is a summary of research priorities.
Part II. Plan Implementation Updates Date
Spring 2010 & 2011 – Research Efforts at Crex & Namekagon Barrens
DATE: UPDATE:
Fall 2011 – Corridor Modeling Effort DATE: UPDATE:
iii
Table of Contents
Plan Timeline & Implementation Updates ............................................................................................... ii Acknowledgements ................................................................................................................................. v Executive Summary ................................................................................................................................ vi List of Tables ........................................................................................................................................ viii List of Figures ....................................................................................................................................... viii
I. HISTORY AND BACKGROUND ........................................................................................................... 9
A. Introduction / Taxonomy / Description ......................................................................................................... 9
B. Natural History ........................................................................................................................................... 10 Behavior – social system, territoriality, sexual behavior, flight, etc. ............................................................................. 10 Home Range................................................................................................................................................................. 10 Diet – food and water .................................................................................................................................................. 10 Seasonal and Daily Movements ................................................................................................................................... 11 Interspecific Competition, Predation ........................................................................................................................... 11
C. Population Demographics ........................................................................................................................... 11 Breeding system – season, lek site fidelity, nesting/incubation, brood-rearing ............................................................ 11 Productivity – nest success rate, sex/age ratios ........................................................................................................... 12 Dispersal ...................................................................................................................................................................... 13 Survival ........................................................................................................................................................................ 13
D. Habitat Requirements................................................................................................................................. 13 General ........................................................................................................................................................................ 13 Breeding/Lek sites ....................................................................................................................................................... 14 Nesting/Incubation ...................................................................................................................................................... 14 Brood-rearing ............................................................................................................................................................... 15 Fall/Winter .................................................................................................................................................................. 15
E. Population Status and Distribution.............................................................................................................. 15 North America – historic & current distribution ........................................................................................................... 15 Wisconsin - historic & current distribution ................................................................................................................... 16
F. Conservation Issues / Threats ..................................................................................................................... 18 1. Habitat Availability, Current Management, and Threats.......................................................................................... 18
Habitat Availability................................................................................................................................................ 19 Historical habitat availability ................................................................................................................................. 19 Current habitat availability .................................................................................................................................... 19
Habitat Management Practices ............................................................................................................................. 20 Historical Management Activities.......................................................................................................................... 20 Current Management ............................................................................................................................................ 21
Threats to Sharp-tailed Grouse Habitat ................................................................................................................. 21 Habitat loss/conversion/succession..................................................................................................................... 21 Fire suppression .................................................................................................................................................... 22 Private Lands – agriculture, timber, development, and changing land use patterns ......................................... 22
2. Population Viability & Genetic Status ...................................................................................................................... 23 Metapopulations and population persistence ....................................................................................................... 23 Genetic Implications for Sharp-tailed Grouse in Wisconsin ................................................................................... 24
3. Surveys/Population Monitoring & Research ............................................................................................................ 26 Survey protocol and population monitoring .......................................................................................................... 26 Survey efforts and population trends in Wisconsin ............................................................................................... 26 Existing research ................................................................................................................................................... 30

iv
4. Harvest & Recreational Opportunities ..................................................................................................................... 30 Current harvest framework ................................................................................................................................... 31 Harvest framework formula .................................................................................................................................. 32 Impacts of harvest ................................................................................................................................................. 33
5. Disease, Predation, Interspecific Competition ......................................................................................................... 34 6. Other Limiting Factors ............................................................................................................................................. 34
G. Review of 1996-1997 Management Plan ..................................................................................................... 35
II. PLAN GOALS & RECOMMENDATIONS FOR IMPLEMENTATION ........................................................ 37
A. Overarching Plan Goal ................................................................................................................................ 37
B. Focus Areas ................................................................................................................................................ 37
C. Plan Approach ............................................................................................................................................ 40
D. Issues, Goals and Recommended Actions for Plan Implementation .............................................................. 40 1. Habitat Availability & Management ........................................................................................................................ 40 2. Population Viability & Genetic Status ...................................................................................................................... 42 3. Surveys & Research ................................................................................................................................................. 44 4. Harvest & Recreational Opportunities ..................................................................................................................... 45 5. Disease, Predation & Interspecific Competition....................................................................................................... 46 6. Other Limiting Factors ............................................................................................................................................. 46
III. LITERATURE CITED ......................................................................................................................... 48
APPENDIX A – PLAN ALTERNATIVES ....................................................................................................... 53
APPENDIX B – CREX MEADOWS/NAMEKAGON BARRENS RESEARCH PROJECT ........................................ 56
APPENDIX C – INTRASTATE GENETIC RESCUE PLAN ................................................................................ 57

v
Acknowledgements We would like to thank members of the Wisconsin Department of Natural Resources Prairie Grouse Committee and the Sharp-tailed Grouse Management Plan working group who have committed their efforts over the last several years to this important endeavor. We would also like to thank the following partner agencies and organizations who have contributed financially and in-kind to the revision of this management plan and who have supported the sharp-tailed grouse cause for many years in Wisconsin: Wisconsin Sharp-tailed Grouse Society, United States Forest Service, Friends of Crex Meadows Wildlife Area, Friends of the Namekagon Barrens Wildlife area, the Friends of the Bird Sanctuary. Many Divisions and Bureaus within WDNR provided funding and/or assistance in the development of this plan including the Bureaus of Wildlife Management, Endangered Resources and Integrated Science Services, and the Division of Forestry. Ken Jonas, Krista McGinley, Matt Reetz, Scott Lutz, and Michele Windsor provided much needed editorial assistance. In addition, several partner groups took the time to listen to us and provide valuable feedback during the plan development, including Wisconsin Sharp-tailed Grouse Society, United States Forest Service, Wisconsin County Forest Association, Wisconsin Conservation Congress Upland Game Committee, Wisconsin Society of Ornithology, Wisconsin Bird Conservation Initiative, University of Wisconsin – Madison, Wisconsin Chapter of The Wildlife Society, and the Great Lakes Indian Fish and Wildlife Commission. Brad Swanson provided his conservation genetics expertise. Ed Frank, Jim Evrard, Dave Clausen, and Dave Evenson from the Wisconsin Sharp-tailed Grouse Society were especially helpful during this process. Sharon and Scott would particularly like to thank the WDNR Wildlife Policy Team for their support of this management plan and to Dave Sample and Andy Paulios for acting as critical sounding boards when needed.
vi
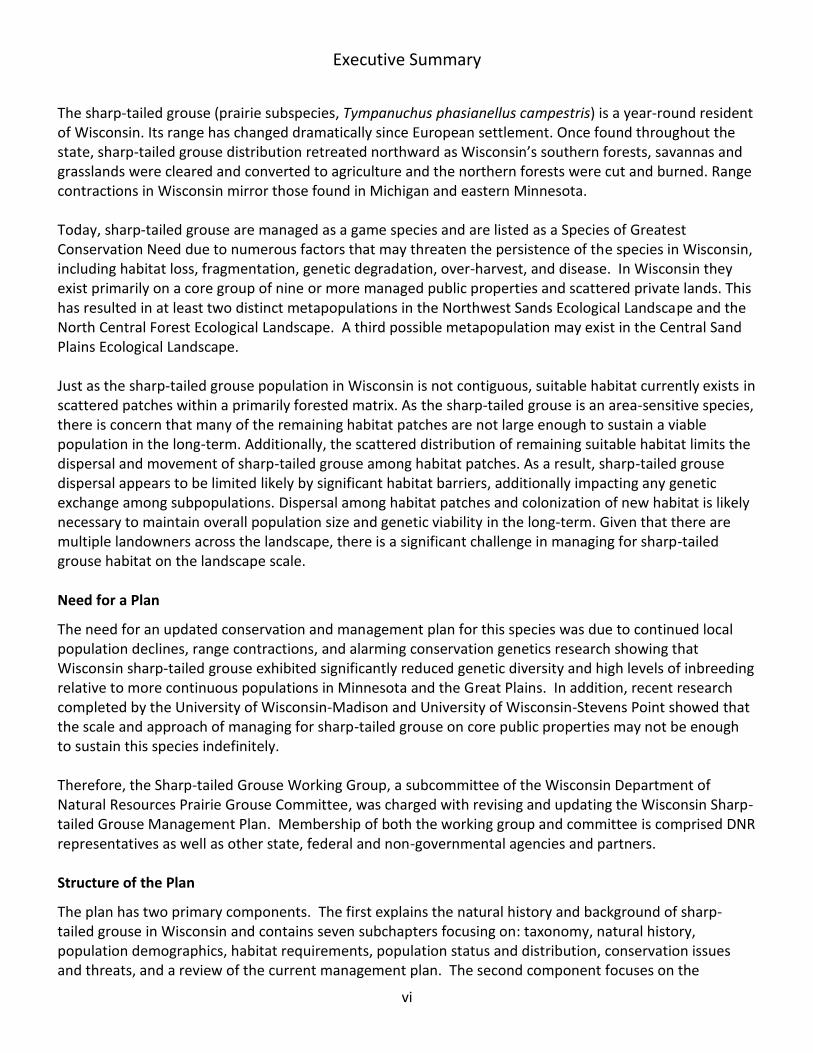
Executive Summary
The sharp-tailed grouse (prairie subspecies, Tympanuchus phasianellus campestris) is a year-round resident of Wisconsin. Its range has changed dramatically since European settlement. Once found throughout the state, sharp-tailed grouse distribution retreated northward as Wisconsin’s southern forests, savannas and grasslands were cleared and converted to agriculture and the northern forests were cut and burned. Range contractions in Wisconsin mirror those found in Michigan and eastern Minnesota.
Today, sharp-tailed grouse are managed as a game species and are listed as a Species of Greatest Conservation Need due to numerous factors that may threaten the persistence of the species in Wisconsin, including habitat loss, fragmentation, genetic degradation, over-harvest, and disease. In Wisconsin they exist primarily on a core group of nine or more managed public properties and scattered private lands. This has resulted in at least two distinct metapopulations in the Northwest Sands Ecological Landscape and the North Central Forest Ecological Landscape. A third possible metapopulation may exist in the Central Sand Plains Ecological Landscape. Just as the sharp-tailed grouse population in Wisconsin is not contiguous, suitable habitat currently exists in scattered patches within a primarily forested matrix. As the sharp-tailed grouse is an area-sensitive species, there is concern that many of the remaining habitat patches are not large enough to sustain a viable population in the long-term. Additionally, the scattered distribution of remaining suitable habitat limits the dispersal and movement of sharp-tailed grouse among habitat patches. As a result, sharp-tailed grouse dispersal appears to be limited likely by significant habitat barriers, additionally impacting any genetic exchange among subpopulations. Dispersal among habitat patches and colonization of new habitat is likely necessary to maintain overall population size and genetic viability in the long-term. Given that there are multiple landowners across the landscape, there is a significant challenge in managing for sharp-tailed grouse habitat on the landscape scale. Need for a Plan
The need for an updated conservation and management plan for this species was due to continued local population declines, range contractions, and alarming conservation genetics research showing that Wisconsin sharp-tailed grouse exhibited significantly reduced genetic diversity and high levels of inbreeding relative to more continuous populations in Minnesota and the Great Plains. In addition, recent research completed by the University of Wisconsin-Madison and University of Wisconsin-Stevens Point showed that the scale and approach of managing for sharp-tailed grouse on core public properties may not be enough to sustain this species indefinitely. Therefore, the Sharp-tailed Grouse Working Group, a subcommittee of the Wisconsin Department of Natural Resources Prairie Grouse Committee, was charged with revising and updating the Wisconsin Sharp-tailed Grouse Management Plan. Membership of both the working group and committee is comprised DNR representatives as well as other state, federal and non-governmental agencies and partners. Structure of the Plan
The plan has two primary components. The first explains the natural history and background of sharp-tailed grouse in Wisconsin and contains seven subchapters focusing on: taxonomy, natural history, population demographics, habitat requirements, population status and distribution, conservation issues and threats, and a review of the current management plan. The second component focuses on the
vii
management plan goals and strategies for implementation, and contains four subchapters on: plan goals, focus areas, plan approach, and plan action items. The plan also includes several appendices with supporting documentation for specific plan goals and action items. Plan Approach, Goals and Action Items
This management plan follows an adaptive management or conservation action planning approach. That is, the plan has set goals based on the best available information and has identified a number of information needs and gaps and a series of actions to address them. When new information becomes available and information gaps are filled, we will adapt the plan as necessary to reach the plan goals. The specific goal of this plan is to ensure a viable population of sharp-tailed grouse within the state that also provides opportunities for regulated harvest. We define a viable population as:
A self-supporting population with sufficient numbers and genetic diversity among local populations and metapopulations to ensure that the species will not become extirpated from the state in the foreseeable future.
We plan to accomplish this goal by focusing our management and research efforts on the existing core range of sharp-tailed grouse in northern Wisconsin. Further, our vision for this overall management effort is to develop and facilitate a voluntary and cooperative partnership among public and private organizations to ensure the long-term viability of sharp-tailed grouse populations in Wisconsin through an ecological landscape and conservation area or focus area approach.
The core sharp-tailed grouse population currently occurs in northern Wisconsin within the Northwest Sands, North Central Forest and Superior Coastal Plains Ecological Landscapes. To ensure the highest probability of maintaining a viable sharp-tailed grouse population in Wisconsin that allows for regulated harvest and maintains Wisconsin’s genetic component, it is recommended that at least two primary Sharp-tailed Grouse Conservation Areas (STGR CA) surrounding core managed properties be maintained. Based on current information on confirmed distribution and presence of sharp-tailed grouse in Wisconsin, the Northwest STGR CA and the North Central STGR CA have been chosen as the conservation areas and landscapes to receive priority management actions for this plan. These conservation areas were chosen because they encompass over 90% of the current sharp-tailed grouse population and range as well as the majority of the current genetic diversity in the population. Additional Sharp-tailed Grouse Conservation Areas could be added pending additional population and habitat data collected during the plan implementation process.
The management plan outlines seventeen specific issues, associated actions goals, and expected outcomes covering six categories: 1) habitat availability and management, 2) population viability and genetic status, 3) surveys and research, 4) harvest and recreational opportunities, 5) disease, predation and interspecific competition, 6) other issues (e.g. climate change). The goals and recommended actions are presented within the context of the Conservation Issues and Threats identified in the first section of the plan. This section and the work described in it will serve as the foundation for the management plan and will guide management and research for the duration of the plan.
viii
List of Tables
Table 1: FST values comparing two Minnesota regions to each Wisconsin subpopulation (grouped by county; KWCA denotes Kimberly-Clark Wildlife Area) .................................................................................................. 25 Table 2: Sharp-tailed grouse population trends on managed lands from 1991-2010 .................................... 27 Table 3: 2008, 2009 & 2010 sharp-tailed grouse permit distribution, harvest and permit success ............... 32 Table 4: 2007-2010 sharp-tailed grouse hunter survey results ...................................................................... 32
List of Figures
Figure 1: Distribution of the Sharp-tailed Grouse (Aldrich 1963) ..................................................................... 9 Figure 2: Distribution of sharp-tailed grouse in Wisconsin from 1850-2000 (Gregg and Niemuth 2000) ...... 17 Figure 3: Sharp-tailed grouse lek locations in Wisconsin, Minnesota, and Michigan ..................................... 17 Figure 4: Estimated 2009 sharp-tailed grouse lek and meta-population locations within Wisconsin Ecological Landscape Boundaries ..................................................................................................................... 18 Figure 5: Changes in grassland and crop coverage in Wisconsin, 1830-2002 (Sample and Mossman 2008) . 20 Figure 6: Extinction Vortex (Lande et al. 2003) ............................................................................................... 23 Figure 7: Genetic status (heterozygosity, allelic diversity, inbreeding and private alleles) for Wisconsin’s sharp-tailed grouse populations (grouped by county) compared to east-central and northwestern populations of Minnesota ................................................................................................................................ 25 Figure 8: Number of dancing male sharp-tailed grouse observed during spring dancing ground surveys on publicly managed properties from 1991-2010 (Fandel 2009) ......................................................................... 27 Figure 9: Number of dancing male sharp-tailed grouse or total number of sharp-tailed grouse recorded during spring dancing ground surveys on publicly managed properties and non-managed properties or hunting zones (1981-2010, except where noted) ............................................................................................ 28 Figure 10: Sharp-tailed grouse Breeding Bird Atlas Map ................................................................................ 30 Figure 11: Deer Management Units, shaded in gray, which have issued sharp-tailed grouse permits in recent years ...................................................................................................................................................... 31 Figure 12: Reported sharp-tailed grouse harvest, 1992-2010 ........................................................................ 31 Figure 13: Sharp-tailed Grouse Conservation Areas ........................................................................................ 39
9
I. History and Background
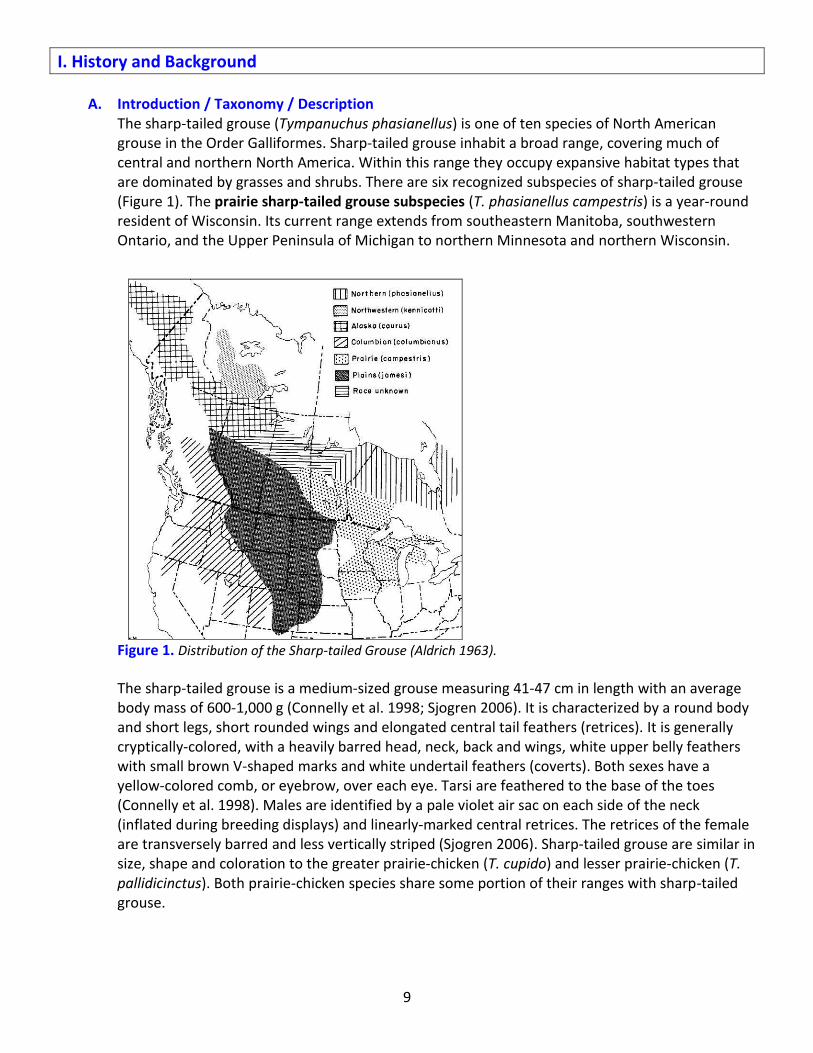
A. Introduction / Taxonomy / Description The sharp-tailed grouse (Tympanuchus phasianellus) is one of ten species of North American grouse in the Order Galliformes. Sharp-tailed grouse inhabit a broad range, covering much of central and northern North America. Within this range they occupy expansive habitat types that are dominated by grasses and shrubs. There are six recognized subspecies of sharp-tailed grouse (Figure 1). The prairie sharp-tailed grouse subspecies (T. phasianellus campestris) is a year-round resident of Wisconsin. Its current range extends from southeastern Manitoba, southwestern Ontario, and the Upper Peninsula of Michigan to northern Minnesota and northern Wisconsin.
Figure 1. Distribution of the Sharp-tailed Grouse (Aldrich 1963). The sharp-tailed grouse is a medium-sized grouse measuring 41-47 cm in length with an average body mass of 600-1,000 g (Connelly et al. 1998; Sjogren 2006). It is characterized by a round body and short legs, short rounded wings and elongated central tail feathers (retrices). It is generally cryptically-colored, with a heavily barred head, neck, back and wings, white upper belly feathers with small brown V-shaped marks and white undertail feathers (coverts). Both sexes have a yellow-colored comb, or eyebrow, over each eye. Tarsi are feathered to the base of the toes (Connelly et al. 1998). Males are identified by a pale violet air sac on each side of the neck (inflated during breeding displays) and linearly-marked central retrices. The retrices of the female are transversely barred and less vertically striped (Sjogren 2006). Sharp-tailed grouse are similar in size, shape and coloration to the greater prairie-chicken (T. cupido) and lesser prairie-chicken (T. pallidicinctus). Both prairie-chicken species share some portion of their ranges with sharp-tailed grouse.
10
B. Natural History Behavior – social system, territoriality, sexual behavior, flight, etc. Sexual behavior and courtship in sharp-tailed grouse are well-documented (Connelly et al. 1998). During the spring both sexes congregate at localized breeding areas called leks or dancing grounds. The lek is a communal display area where males gather to attract and mate with females. Two to 40 males may gather at a single lek, each defending a small territory of 0.46-2.6 ha (Connelly et al. 1998). Leks are often located on slightly elevated sites and in the same location every year (Ammann 1957, Connelly et al. 1998, Sjogren 2006). Males can be observed displaying from just before dawn to just after sunrise (Sjogren 2006). Courtship displays of the male sharp-tailed grouse consist of stages of foot-stomping, tail-rattling, and various vocalizations, with a relaxation phase between display bouts. Males maintain a standing posture with outstretched wings, extended head and superciliary combs, expanded air sacs, and upturned tail during foot-stomping and tail-rattling displays. Males produce six main vocalizations in addition to tail-rattling and foot-stomping displays. Female vocalizations are not well-known (Sjogren 2006). The flight behavior for sharp-tailed grouse is not well-described. Generally, grouse fly <100m, alternating three rapid wingbeats with several seconds of gliding. Sharp-tailed grouse can reach a speed of 64-72 km/h (Nero 1976). They may fly longer distances (see Seasonal and Daily Movements), but most flights are short-distance and limited to moving among foraging, roosting and breeding areas or when disturbed (Connelly et al. 1998). Home Range Mean annual home range size varies between males and females and among seasons. Males, on average, tend to have a larger annual home range size than females (617 ha vs. 464 ha, respectively) (Sjogren 2006, Connelly et al. 1998). Home range size tends to be smallest during spring and summer, coinciding with the breeding and nesting season. On average, summer home range size is approximately 65 ha for males and 55 ha for females (Gratson 1988, Artmann 1971). Home range size expands considerably during fall when dispersal occurs and can be well over 1,300 ha (Gratson 1988). In Wisconsin, average winter home range is 259 ha for males and 149 ha for females (Connelly et al. 1998, Gratson 1983). Habitat and food quality and availability may affect home range size (Giesen 1987). Diet – food and water Sharp-tailed grouse feed on a wide variety of foods, selecting forbs, grasses, insects, fruits and flowers during the spring and summer months and buds, seeds, herbaceous matter, and fruits during the fall and winter months (Connelly et al. 1998). During the spring, summer and fall months, sharp-tailed grouse feed actively in the early morning and late evening. In the winter, birds feed throughout the day, storing food in their crop for later digestion (Hart et al. 1950). Sharp-tailed grouse primarily forage on the ground, except in winter when they frequently feed in shrubs and small trees (Grange 1948, Hart et al. 1950). There is no direct evidence that sharp-tailed grouse need open water to meet their nutritional needs. However, mesic areas may provide a source of water during warm summer months (Kobriger 1965).
11
Seasonal and Daily Movements The sharp-tailed grouse is a year-round resident of Wisconsin and does not regularly migrate long distances. Depending on snow depth, sharp-tailed grouse may travel short distances (<34 km) in search of woody habitats. Longer distance seasonal migration was documented prior to the early 1900s, but there is little information on distance or direction of travel (Hamerstrom and Hamerstrom 1951). Recent historical habitat changes coinciding with agricultural and silvicultural developments are thought to have eliminated the need for longer migrations, as grassland and wooded habitats merged in a more fragmented landscape (Connelly et al. 1998). Seasonal shifts are more prevalent in Wisconsin as birds move to wooded winter habitats. Sharp-tailed grouse typically migrate short distances between late November and early January depending on snow depth and food availability. Sharp-tailed grouse return to lek sites beginning in March and April (Connelly et al. 1998). Daily movements of sharp-tailed grouse also vary depending on season with birds in Wisconsin moving 200-400 m in summer and 800-1200 m in winter (Gratson 1983). Interspecific Competition, Predation Interactions at concentrated foraging sites between sharp-tailed grouse and greater prairie-chickens have been documented where ranges overlap (Sharp 1957, Connelly et al. 1998). Lek interference and nesting parasitism by ring-necked pheasants (Phasianus colchicus) has been documented across the entire range of prairie grouse populations. The most rigorous studies of pheasant interference have been conducted on endangered greater prairie-chicken populations in Illinois. As a result of these studies, a pheasant control program was implemented that resulted in lower lek interference and lower brood parasitism. However, prairie-chicken populations in Illinois did not increase markedly after the pheasant removal project likely because of additional limiting factors (i.e., low genetic diversity) (Walk 2004). Interference at lek sites by ring-necked pheasants has also been observed in Wisconsin (Pete Engman, pers. comm.), but the impacts are unknown at this time. Nest and egg predation is common since sharp-tailed grouse nest on the ground. Nest predators include striped skunk (Mephitis mephitis), ground squirrel (Citellus spp.), raccoon (Procyon lotor), American crow (Corvus brachyrhynchos), common raven (C. corax), mink (Mustela vison), and weasels (Mustela spp.) (Connelly et al. 1998). In addition, coyote (Canis latrans), red fox (Vulpes vulpes), red-tailed hawk (Buteo jamaicensis), northern goshawk (Accipiter gentiles), peregrine falcon (Falco peregrinus), great horned owl (Bubo virginianus), and northern harrier (Circus cyaneus) prey on eggs, chicks, and adult sharp-tailed grouse (Connelly et al. 1998).
C. Population Demographics Breeding system – season, lek site fidelity, nesting/incubation, brood-rearing Breeding Season – Sharp-tailed grouse use a lek mating system in which males establish and defend territories on a dancing ground and display to attract females. Pair bonds are limited to courtship prior to mating and males may breed with several females (Connelly et al. 1998). Dominant males typically receive the majority of breeding opportunities and it is estimated that approximately 10% of all males actively breed in Wisconsin (Temple 1991). While it has been generally accepted that only a few males within a given prairie grouse population obtain the majority of copulations, courtship and mating away from the lek site has been documented, suggesting that perhaps a greater proportion of males do, in fact, mate (Sexton 1979). Likewise,
12
females may visit an individual lek site several times, mating with multiple males, or may visit more than one lek in a given breeding season (Landel 1989, Gratson et al. 1991, pers. obs.). Lek Site Fidelity – There are little data on lek site fidelity, but dominant males likely show the greatest site fidelity whereas males not yet associated with a lek are more likely to disperse (Bergerud and Gratson 1988). As a result, sharp-tailed grouse populations include non-territorial males that are not attending leks. Younger birds will often set up territories on the lek periphery and gradually move toward the lek interior as dominant males are removed (Rippen and Boag 1974). Drummer et al. (2011) observed strong lek site fidelity and lek attendance rates of sharp-tailed grouse males in Upper Michigan. Females may visit one or more leks several times during the breeding season. Females visit territories of potential mates starting in mid- to late April and early May. Nearly all females attempt to nest (Ammann 1957, Connelly et al. 1998). Nesting & Incubation – Nest sites are selected by females and are often under or near small shrubs within 0.4-1.8km of lek sites. On average, the first egg is laid 1-3 days after copulation (Connelly et al. 1998). Subsequent eggs are laid individually every 1-2 days. Average first clutch size is 10-12 eggs. Incubation lasts 21-23 days and begins after the last egg is laid. The female occasionally leaves the nest to feed in the early morning or evening, usually within 200 m of the nest (sources cited in Connelly et al. 1998). In Michigan, hatching peaks in early to mid-June (Ammann 1957 cited in Connelly et al. 1998). Renesting is common following the loss of a clutch to predation or weather. Females will typically renest farther from the lek than the initial nest site. Clutches from renesting attempts are often smaller (Connelly et al. 1998). Brood-rearing – Young are precocious (covered with down, legs well-developed, eyes open and alert) upon hatching. Within 7-10 days they can fly short distances. Juvenile plumage is visible within a few days and young are fully feathered by six weeks of age (Sjogren 2006). By 12 weeks of age young have completed most of their growth. In Wisconsin, care by the adult female concludes in September (Gratson 1983, Gratson 1988). Productivity – nest success rate, sex/age ratios In Wisconsin, approximately 54% of sharp-tailed grouse nests were successful in hatching at least one chick (Bergerud and Gratson 1988). Connolly (2001) found that nesting success was higher on unmanaged sites in Wisconsin and mean nesting success was significantly greater on unmanaged landscapes (76.4%) than managed landscapes (24.6%). Ammann (1957) reported a lower success rate (44%) for sharp-tailed grouse in Upper Michigan. Adult sharp-tailed grouse are more successful at nesting compared to yearlings (61% and 43%, respectively). The primary cause of nest failure is predation (79%) followed by nest desertion, fire, flood and agricultural practices (Sjogren 2006). The male:female sex ratio of sharp-tailed grouse in Colorado is similar to that reported for many gallinaceous birds at 1:1 (Connelly et al. 1998). In Michigan, the sex ratio for juveniles was also not significantly different from 1:1 (Ammann 1957 cited in Connelly et al. 1998; Connelly et al. 1998).
13
Dispersal Dispersal distance in Wisconsin varies from 200-400 m in summer to 800-1200 m in winter. Broods usually stay within 1.6 km of the nest site until dispersal in September and October. Broods typically disperse <6 km from the natal site. Juveniles tend to disperse greater distances than adults, and juvenile females tend to move farther than juvenile males. Adult females also tend to disperse farther than adult males (Connelly et al. 1998). A maximum dispersal distance of 33.8 km (21 miles) was recorded in Michigan but little additional information exists for other Midwestern states (Sjogren 2006). Factors influencing dispersal may include lek carrying capacity, amount and distribution of habitat and location of reliable food sources (Sjogren 2006). Survival The maximum documented life span is 7.5 years (Arnold 1988). In Washington, annual survival was estimated at 53% in an unhunted population and 17-42% in hunted populations (Schroeder 1994). Sexes had similar annual survival rates in South Dakota (Robel et al. 1972). Bergerud (1988) found low survival for breeding females in spring (Connelly et al. 1998). Connolly (2001) estimated daily hen survival in northwestern Wisconsin during the reproductive period to be 98% and 99% on unmanaged and managed landscapes, respectively. According to Johnsgard (1983), sharp-tailed grouse broods experience roughly 47% mortality, primarily within the first month of hatching. In Wisconsin, Connolly (2001) did not find a significant difference in brood survival between managed (43%) and unmanaged (30%) landscapes, but indicated that adverse weather during the 2 to 3 weeks following hatching may have impacted survival in this study. During this period, chicks are especially susceptible to influences of cool weather, predation and starvation (Hillman and Jackson 1973). Predation, hunting and weather all affect survival and recruitment in sharp-tailed grouse populations (Connelly et al. 1998). Winter mortality varies with severity and may be as low as 14% during mild winters and as high as 71% during severe winters (Idaho; Ulliman 1995). Even during severe winters, much of the mortality can be attributed to predation. Infectious diseases are not common in sharp-tailed grouse populations (Connelly et al. 1998).
D. Habitat Requirements General Prior to European settlement, habitat for sharp-tailed grouse in the Upper Great Lakes region included pine barrens, burned forest areas, brushy grasslands in the prairie-to-forest transition zone and non-forested wetlands. Sharp-tailed grouse populations expanded and contracted in response to natural disturbance events such as fire (Ammann 1957, Sjogren 2006). At this time early successional habitat was widespread. For example, Lorimer (2001) estimated that 13.2% of northern Wisconsin would have been classified as early successional habitat (Sjogren 2006). Today, sharp-tailed grouse use a variety of habitat types in Wisconsin including brush prairie, barrens, cut or burned-over forestland, wet meadows, pine/oak savannah, mixed deciduous-conifer forest, and abandoned farmland (Sample and Mossman 1997, Evrard et al. 2000, Gregg and Niemuth 2000, Niemuth 2006). In northwestern Wisconsin, vegetation types heavily used by prairie sharp-tailed grouse vary by season but typically include grass-shrub, shrub-grass, shrub, open conifer woods, sedge (Carex spp.) meadows, shrub marshes, and croplands (Wisconsin All-
14
Bird Conservation Plan 2007 - http://www.wisconsinbirds.org/Plan/species/stgr.htm). Where they occur, dense herbaceous cover and shrubs are important habitat components (Connelly et al. 1998). Fire has long been thought to be the key disturbance process for creating and maintaining sharp-tailed grouse habitat. Depending on fire intensity and weather patterns, fires can create a mosaic of burned and unburned areas (Niemi and Probst 1989). Considered area-sensitive, sharp-tailed grouse require large open blocks of early successional habitat to support viable populations (Gregg 1987, Temple 1991, Sample and Mossman 1997, Connelly et al. 1998, Niemuth and Boyce 2004, Niemuth 2006). In Minnesota, blocks of contiguous habitat must be at least 5 km2, and complexes of inter-connected smaller areas must contain parcels of at least 15 ha (Berg 1997). However, the exact amount of habitat needed to sustain a viable population likely varies by ecological landscape and state. In Upper Michigan, Ammann (1957) reported that optimum sharp-tailed grouse habitat composition for a 260 ha patch included 6-10% open grass and herbaceous cover, 50% shrubs and 40-44% scattered brush and small trees. In northern Minnesota, Berg (1997) observed an ideal habitat composition consisting of 35% grass-legume, 15% crop, 7% sedge, 25% lowland brush and 13% young aspen/willow/birch. Breeding/Lek sites Leks more typically occur in open, elevated sites with less vegetation than surrounding areas (Niemuth 2006, Sample and Mossman 1997). Lek sites have short, sparse vegetation (Sample and Mossman 1997). Scattered shrubs adjacent to leks provide escape cover (NRCS 2007). In Wisconsin, Niemuth and Boyce (2004) found that lek presence was positively associated with a higher proportion of grass and shrubs, a low proportion of forest and greater distance to forest edge than unused sites. Lek locations are generally stable from year to year (Connelly et al. 1998). Lek location and attendance has been significantly correlated with grassland and shrubs, but not with distance between leks. Leks located near recent disturbance had significantly higher attendance than those in areas without (Niemuth 2006). Leks cover a relatively small area, approximately 450 square meters (0.11 ac) (NRCS 2007), with estimated vegetation composition of 70% grass, 15% forbs, 15% bare ground and <1% shrub with escape cover within 500 m (Baydack 1988). The probability of lek abandonment increases when tree cover exceeds 56% and grassland coverage decreases below 15% (Manitoba; Berger and Baydack 1992). The average distance between leks is 2.2 km (1.4 mi) (Baydack 1988). Mean distances from lek to scattered brush, dense brush, and trees are 179 m, 252 m, and 275 m, respectively (Berg 1997). Nesting/Incubation Sharp-tailed grouse prefer to nest in structurally diverse habitat, dominated by dense herbaceous cover and often under or near shrubs or small trees (Connelly et al. 1998, Sjogren 2006, NRCS 2007). The amount, height and density of residual cover appear to be an important factor in nest site selection (NRCS 2007). Vegetation at the nest site is ≥30 cm in height with shrub cover up to 1.2 m high in the nest area (Connelly et al. 1998). Nest composition is a combination of moss, grasses, sedges, herbaceous plants, leaves of shrubs and trees and breast
15
feathers from the hen (Sjogren 2006). Nest sites are typically located 0.4–1.8 km from the nearest lek, with a maximum distance of 2.2 km (Connelly et al. 1998, Connolly 2001). In Wisconsin, Connolly (2001) observed that sharp-tailed grouse in managed landscapes preferred using clearcuts adjacent to managed savanna reserves. At the landscape scale, birds selected areas with greater fragmentation and further from tall (>5 m) trees. Coniferous tree cover, heath cover, deciduous woody cover and grass cover at the nest bowl were important factors at the small habitat scale. In unmanaged landscapes, sharp-tailed grouse selected sites with lower fragmentation and closer to forest edge at the landscape scale. At the small habitat scale, raspberry and heath cover as well as grass cover and height at nest bowl were important determinants of nest site selection (Connolly 2001). Brood-rearing Brood habitat is typically open habitat with little woody vegetation (Hamerstrom 1963, Artmann 1970, Connolly 2001). Young sharp-tailed grouse depend on habitats with abundant forbs and insects, selecting areas with high diversity of herbaceous cover and shrubs with an interspersion of cover types (Connelly et al. 1998, NRCS 2007). The presence of shrub cover may be important in providing overhead and escape cover from predators (Connolly 2001). In Wisconsin, over half of the brood observations (57%) occurred in savanna habitats, predominantly those with a pine component. Remaining observations were split between cultivated lands (14%), grasslands (9%), and edge habitat (11%). Broods were also observed using roadsides or trails and in small openings. However, these observations were also in habitats with a predominant ground cover similar to or the same as the preferred mixed savanna habitat (Hamerstrom 1963). Fall/Winter Winter habitat requirements for sharp-tailed grouse are narrower than in any other season. Wintering sites often contain a higher shrub component in areas with less snow cover as birds shift from open to forested or marshy cover habitats (Gregg 1987, Sample and Mossman 1997, Connelly et al. 1998). Sharp-tailed grouse often depend on deciduous and open coniferous woods, woody draws and riparian areas characterized by small trees and shrubs (Connelly et al. 1998). Woody vegetation is used for feeding (tree buds), roosting, and escape cover (NRCS 2007). In Wisconsin, Gregg (1987) observed that increased snow depth caused sharp-tailed grouse to move larger distances in search of winter food and cover. During snowless periods, birds preferred dense marshy vegetation while upland forests and black spruce bogs were used during deep snows.
E. Population Status and Distribution North America – historic & current distribution Historically, sharp-tailed grouse were found throughout much of central and northern North America, from Alaska east across Canada and the northern U.S. to west-central Quebec and northern Michigan (Connelly et al. 1998). Today, six different subspecies range from the Great Lakes region west to Alaska and south to Colorado. However, extensive habitat changes in these regions have resulted in population declines, with fringe populations occupying smaller, more isolated patches of available habitat. In general, prairie grouse numbers have declined steadily, and in cases like the sharp-tailed grouse, precipitously, throughout their North American range (Vodehnal and Haufler 2007).
16
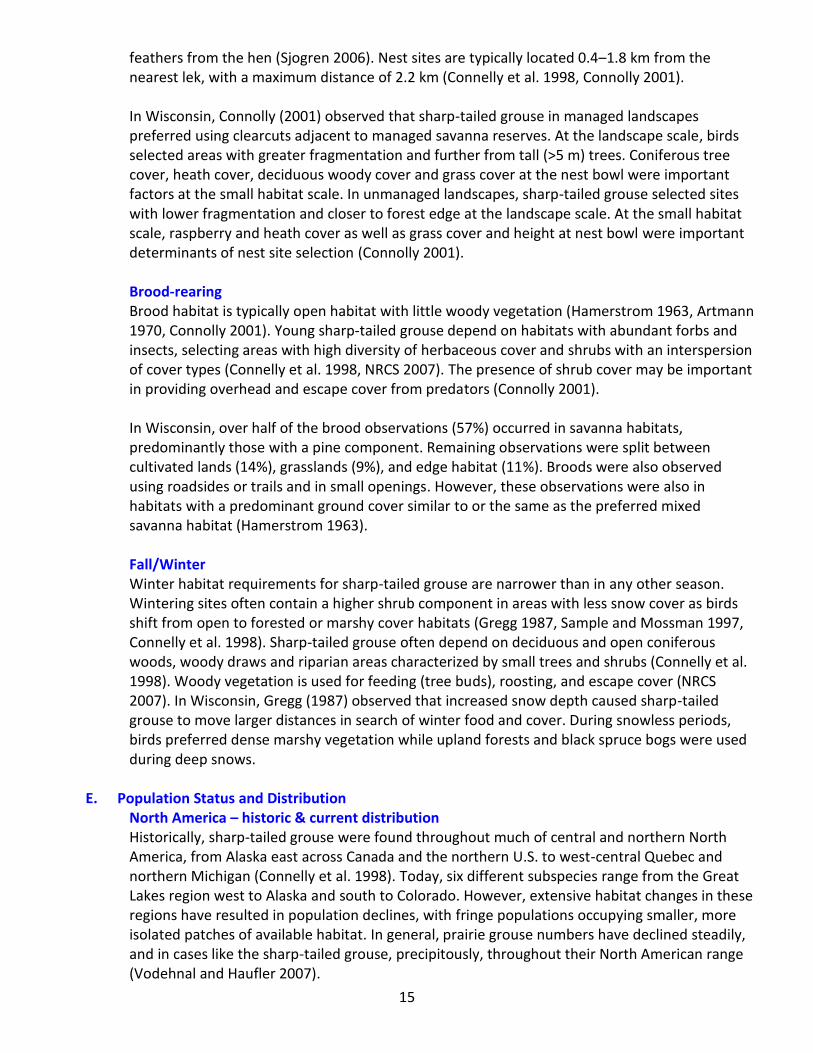
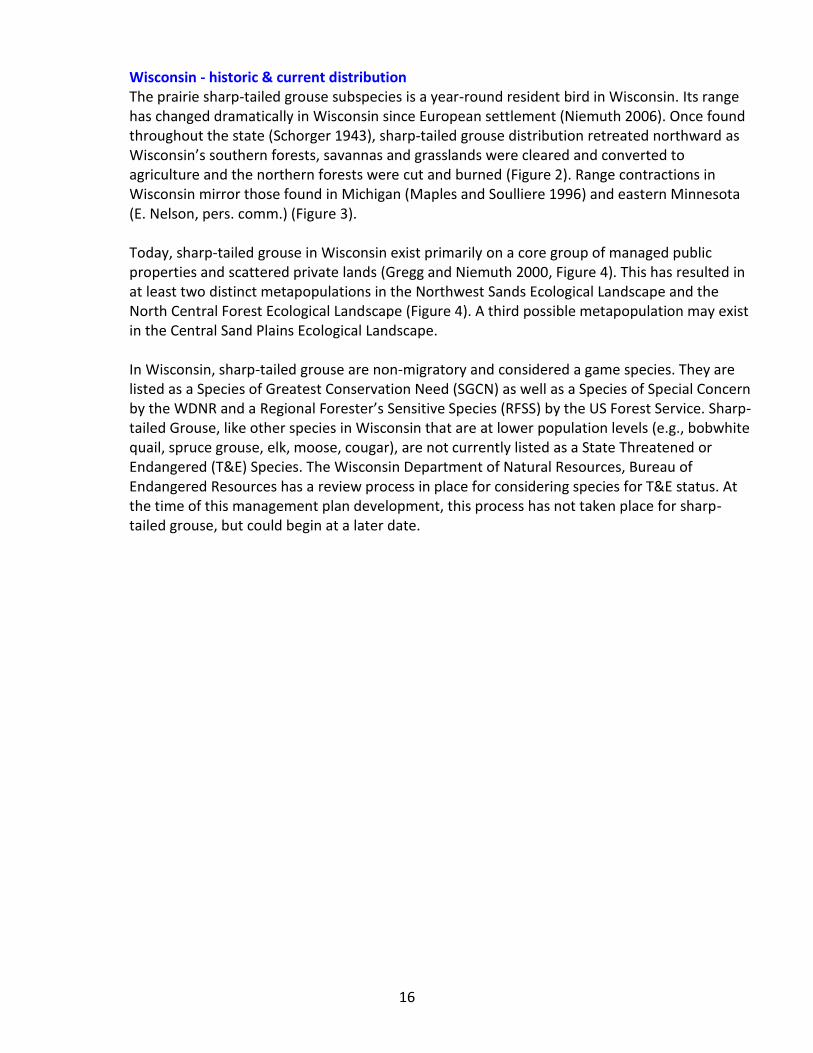
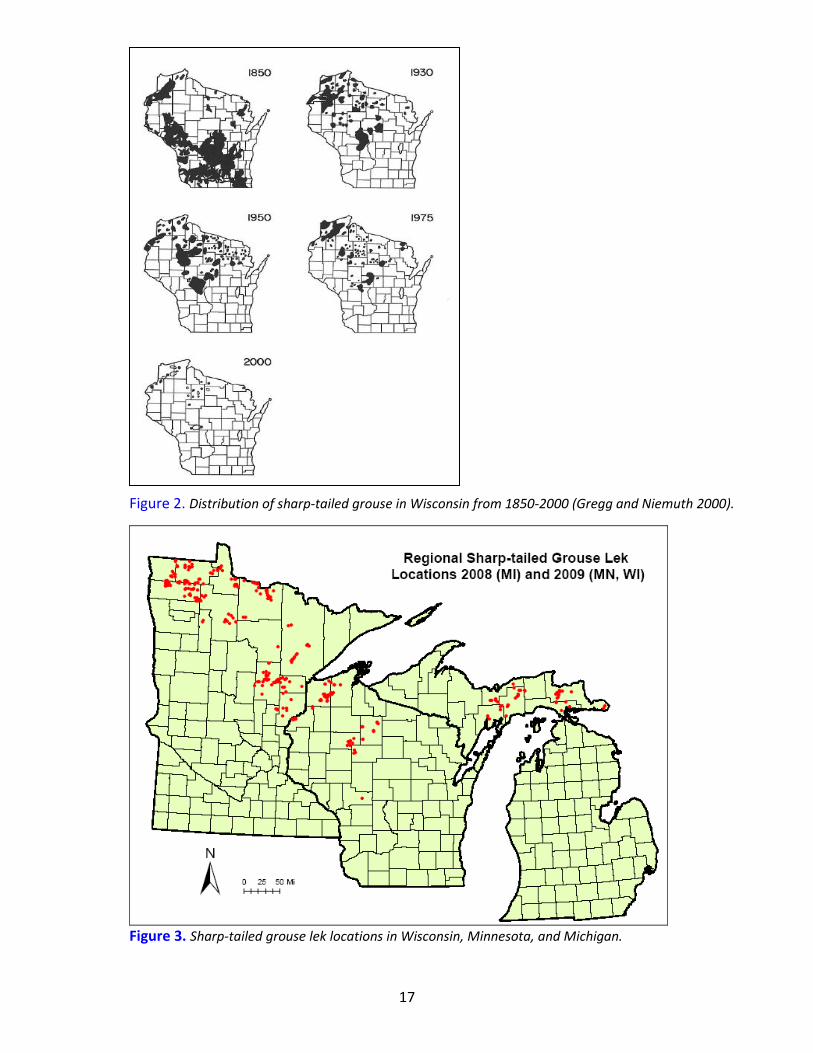
Wisconsin - historic & current distribution The prairie sharp-tailed grouse subspecies is a year-round resident bird in Wisconsin. Its range has changed dramatically in Wisconsin since European settlement (Niemuth 2006). Once found throughout the state (Schorger 1943), sharp-tailed grouse distribution retreated northward as Wisconsin’s southern forests, savannas and grasslands were cleared and converted to agriculture and the northern forests were cut and burned (Figure 2). Range contractions in Wisconsin mirror those found in Michigan (Maples and Soulliere 1996) and eastern Minnesota (E. Nelson, pers. comm.) (Figure 3). Today, sharp-tailed grouse in Wisconsin exist primarily on a core group of managed public properties and scattered private lands (Gregg and Niemuth 2000, Figure 4). This has resulted in at least two distinct metapopulations in the Northwest Sands Ecological Landscape and the North Central Forest Ecological Landscape (Figure 4). A third possible metapopulation may exist in the Central Sand Plains Ecological Landscape. In Wisconsin, sharp-tailed grouse are non-migratory and considered a game species. They are listed as a Species of Greatest Conservation Need (SGCN) as well as a Species of Special Concern by the WDNR and a Regional Forester’s Sensitive Species (RFSS) by the US Forest Service. Sharp-tailed Grouse, like other species in Wisconsin that are at lower population levels (e.g., bobwhite quail, spruce grouse, elk, moose, cougar), are not currently listed as a State Threatened or Endangered (T&E) Species. The Wisconsin Department of Natural Resources, Bureau of Endangered Resources has a review process in place for considering species for T&E status. At the time of this management plan development, this process has not taken place for sharp-tailed grouse, but could begin at a later date.
17
Figure 2. Distribution of sharp-tailed grouse in Wisconsin from 1850-2000 (Gregg and Niemuth 2000).
Figure 3. Sharp-tailed grouse lek locations in Wisconsin, Minnesota, and Michigan.
18
Metapopulation 1
Metapopulation 2
Metapopulation 3
Metapopulation 1
Metapopulation 2
Metapopulation 3
Metapopulation 1
Metapopulation 2
Metapopulation 3
Figure 4. Estimated 2009 sharp-tailed grouse lek and meta-population locations within Wisconsin Ecological Landscape Boundaries.
F. Conservation Issues / Threats
Sharp-tailed grouse are managed as a game species in 18 states and provinces, and protected in 5 states. Midwestern sharp-tailed grouse populations have experienced long-term population declines and are in possible danger of extirpation from some states, including Wisconsin (Niemuth and Boyce 2004). Sharp-tailed grouse are listed as a Species of Greatest Conservation Need in Wisconsin due to numerous factors that may threaten the persistence of this species in the state, including habitat loss and fragmentation, genetic degradation, and over-harvest (Gregg 1987, Gregg and Niemuth 2000, Niemuth and Boyce 2004, WNDR 2005, Niemuth 2006, Sjogren 2006). In this section, the key issues affecting sharp-tailed grouse in Wisconsin are outlined. 1. Habitat Availability, Current Management, and Threats
While factors such as over-harvest and disease may negatively influence sharp-tailed grouse populations, regional and local population declines can be largely attributed to the loss and continued fragmentation of suitable habitat (Sjogren 2006). Since European settlement, there have been sweeping landscape and land use changes. Those having a greater impact on sharp-tailed grouse habitat and populations include the loss of native barrens, savanna, and grassland habitats, the shift to intensive agricultural practices, fire suppression, major changes in forest land management, and increased human development (Sjogren 2006). The sharp-tailed grouse population in Wisconsin is not contiguous, and suitable habitat currently exists in scattered patches within a primarily forested matrix (Sjogren 2006). As a result, dispersal among habitat patches and colonization of new habitat is likely necessary to maintain overall population size and genetic viability. However, sharp-tailed grouse dispersal appears to be limited likely by significant habitat barriers. As a result, genetic exchange among subpopulations is also limited (B. Swanson, pers. comm.).
19
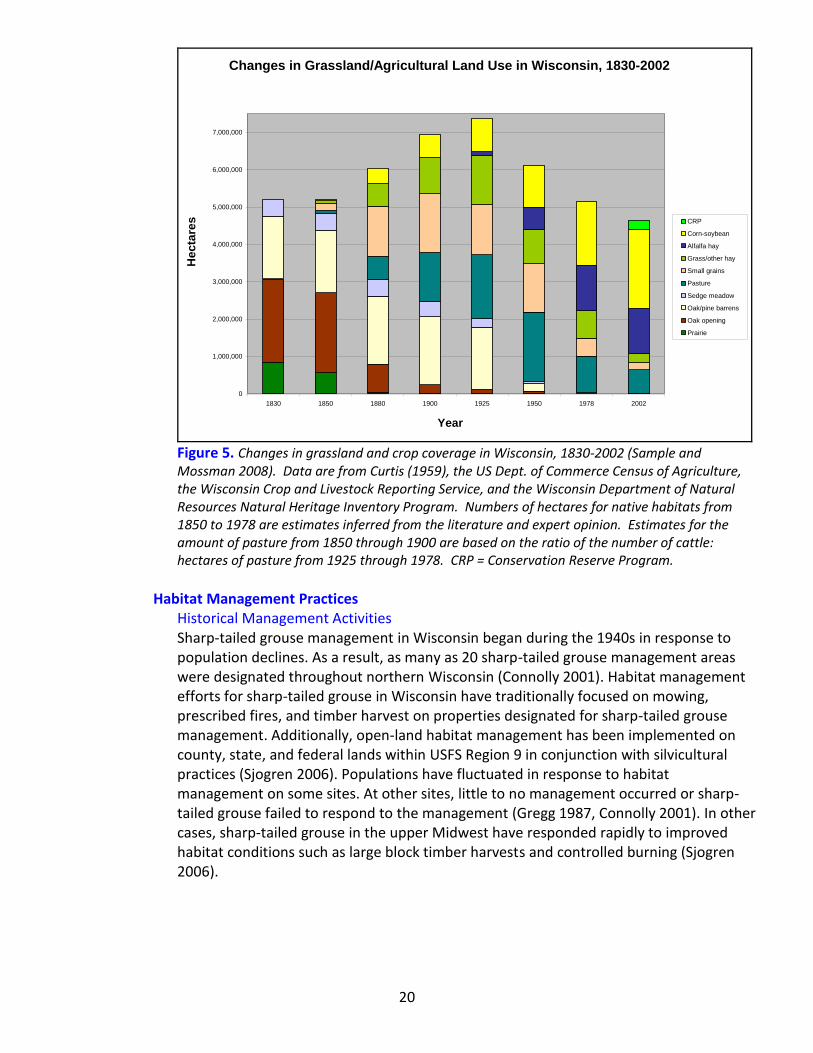
Habitat Availability Historical habitat availability Historically, pine barrens covered approximately one million hectares in Wisconsin, or 7% of the state’s pre-European settlement landscape (Curtis 1959, WDNR in prep.). Oak barrens covered approximately 730,000 hectares, or 5% of the pre-European settlement landscape. Native grasslands were also dominant on the landscape and once covered 850,000 hectares throughout the state. Extensive sedge meadows also occurred in central and northern Wisconsin prior to European settlement, with more than 450,000 hectares present in the early 1800s (Curtis 1959). In fact, early successional habitat at this time was much more widespread and was estimated that 13.2% of northern Wisconsin would have been early successional habitat (Lorimer 2001, Sjogren 2006). Grazing, cultivation, red pine conversion and fire suppression have impacted barrens habitats (Mossman et al. 1991) while draining, ditching, cranberry farming and grazing have impacted both grasslands and sedge meadows (Mossman and Sample 1990). Current habitat availability Current suitable sharp-tailed grouse habitat in Wisconsin exists in scattered patches within a primarily forested matrix in the northern half of the state (Sjogren 2006). Most of this habitat is found on approximately a dozen county, state-, or federally-managed areas, with 1995 estimates of approximately 4,000 hectares (10,000 acres) of quality pine and oak barrens remaining at 65 sites. Oak barrens occur on just 580 hectares (1,432 acres) on 20 of these sites (WDNR in prep.). Other estimates indicate only 3,400 hectares (8,500 acres), or less than 1% of the original barrens distribution (Mossman et al. 1991, Eckstein and Moss 1995, WDNR in prep.). Total barrens area is estimated at 20,240 hectares (50,000 acres), but much of this land is severely degraded and/or has only just entered the restoration phase (WDNR in prep.). In addition to barrens, less than 1% (3,200 hectares) of original native grasslands remains, while approximately 3% (12,000 hectares) of moderate to high quality sedge meadow habitat remains (Mossman and Sample 1990, Mossman et al. 1991) (Figure 5). Land conversion and use as pasture, grass/other hay, and incentive programs such as the Conservation Reserve Program (CRP) have resulted in the maintenance of several hundred thousand hectares of surrogate grassland habitat (Sample and Mossman 2008). However, any subsequent benefits to sharp-tailed grouse have not been evaluated. As an area-sensitive species, there is concern that many of these habitat patches are not large enough to sustain a viable sharp-tailed grouse population in the long-term. Additionally, the scattered distribution of remaining suitable habitat limits the dispersal and movement of sharp-tailed grouse among habitat patches. Given that there are multiple landowners across the landscape, there is a significant challenge in managing for sharp-tailed grouse habitat on the landscape scale.
20
Changes in Grassland/Agricultural Land Use in Wisconsin, 1830-2002
0
1,000,000
2,000,000
3,000,000
4,000,000
5,000,000
6,000,000
7,000,000
1830 1850 1880 1900 1925 1950 1978 2002
Year
Hecta
res CRP
Corn-soybean
Alfalfa hay
Grass/other hay
Small grains
Pasture
Sedge meadow
Oak/pine barrens
Oak opening
Prairie
Figure 5. Changes in grassland and crop coverage in Wisconsin, 1830-2002 (Sample and Mossman 2008). Data are from Curtis (1959), the US Dept. of Commerce Census of Agriculture, the Wisconsin Crop and Livestock Reporting Service, and the Wisconsin Department of Natural Resources Natural Heritage Inventory Program. Numbers of hectares for native habitats from 1850 to 1978 are estimates inferred from the literature and expert opinion. Estimates for the amount of pasture from 1850 through 1900 are based on the ratio of the number of cattle: hectares of pasture from 1925 through 1978. CRP = Conservation Reserve Program.
Habitat Management Practices
Historical Management Activities Sharp-tailed grouse management in Wisconsin began during the 1940s in response to population declines. As a result, as many as 20 sharp-tailed grouse management areas were designated throughout northern Wisconsin (Connolly 2001). Habitat management efforts for sharp-tailed grouse in Wisconsin have traditionally focused on mowing, prescribed fires, and timber harvest on properties designated for sharp-tailed grouse management. Additionally, open-land habitat management has been implemented on county, state, and federal lands within USFS Region 9 in conjunction with silvicultural practices (Sjogren 2006). Populations have fluctuated in response to habitat management on some sites. At other sites, little to no management occurred or sharp-tailed grouse failed to respond to the management (Gregg 1987, Connolly 2001). In other cases, sharp-tailed grouse in the upper Midwest have responded rapidly to improved habitat conditions such as large block timber harvests and controlled burning (Sjogren 2006).
21
Current Management Sharp-tailed grouse habitat is largely dependent on disturbance to maintain an open landscape and appropriate vegetative cover (Connelly et al. 1998). As an area-sensitive species, habitat management for sharp-tailed grouse also requires a landscape-scale perspective by which large tracts of open land are maintained through burning, timber management, grazing, cutting, or mowing. Current sharp-tailed grouse management and survey efforts occur primarily on a core set of managed properties and scattered private lands that have known, current or historically active dancing grounds. Core properties currently include:
Crex Meadows Wildlife Area Douglas County Wildlife Area Kimberly Clark Wildlife Area Moquah Barrens Wildlife Management Area (managed by USFS) Namekagon Barrens Wildlife Area Pershing Wildlife Area Riley Lake Wildlife Management Area (managed by USFS) Wood County Wildlife Area Dike Seventeen Wildlife Area County Forest Pine Barrens Management Area (managed by Bayfield County)
Management on these properties varies widely depending on management goals, surrounding land use, staffing, funding, and available resources. Where management is conducted, it is typically a combination of prescribed burning, timber harvest and mowing, or other mechanical manipulations. Currently, most managed properties are primarily maintained by repeated prescribed burns (Connolly 2001). Burning is used to control woody vegetation, maintaining an open landscape beneficial to sharp-tailed grouse. Frequent prescribed burning in some areas has reduced deciduous and coniferous woody cover, raising the concern that removing excessive amounts of shrub cover may be detrimental (Peterle 1954, Connolly 2001). Unmanaged, natural wildfire sites and clearcuts contain more low-growing vegetation such as leafy spurge and raspberry and have larger amounts of woody debris compared to sites maintained by repeated burning (Niemuth and Boyce 1998). In northwestern Wisconsin, there has been some research indicating that sharp-tailed grouse use unmanaged properties more frequently than managed sites for nest site locations (Connolly 2001). On these unmanaged open landscape sites created by recent wildfires, disease outbreaks, and clearcuts, the early successional vegetation is not maintained but is allowed to mature into forest or is planted to red pine. Planted areas are typically left fallow for two years after the disturbance, and then furrowed and planted with seedlings a year later (Connolly 2001).
Threats to Sharp-tailed Grouse Habitat
Habitat loss/conversion/succession Since European settlement, much of the original jack pine and oak barrens found throughout Wisconsin have been converted, often to red pine plantations. Similarly, grassland and savanna habitats and sedge meadows have also largely been lost to
22
conversion, often due to agriculture or development. Today, only scattered patches of pine and oak barrens remain (WDNR in prep., Eckstein and Moss 1995). The continued conversion of barrens and jack pine forests to red pine plantations is proving to be a significant, long-term threat. The reduction in habitat diversity and lack of understory development in red pine plantations decreases its suitability for sharp-tailed grouse (Niemi and Probst 1990). A combination of prescribed fire and even-aged timber management can help to provide critical sharp-tailed grouse habitat, and recent research suggests that birds may respond more positively to new habitat created as a result of timber harvest (Connolly 2001, Sjogren 2006). However, the location and size of remaining fragments may provide the potential for larger scale restoration of barrens habitats (WDNR in prep.). Fire suppression The pine barrens ecotype is dynamic in nature, with natural wildfires creating large burned openings in a shifting mosaic across the landscape (Niemi and Probst 1990). The suppression of wildfires is one of several factors that have reduced the amount of pine barrens on the landscape and thus the availability of suitable sharp-tailed grouse habitat. Natural wildfires produce habitat heterogeneity on the landscape that can be difficult to replicate with silvicultural and habitat management treatments (Sjogren 2006). Coarse woody debris, unburned “islands” of habitat, snag trees, and increased diversity of understory vegetation are beneficial outcomes of a wildfire regime, and have been shown to benefit sharp-tailed grouse (Niemi and Probst 1990, Sjogren 2006). An integrated approach combining prescribed burning and even-aged timber management can simulate conditions created by natural wildfires for blowdown events. Fire provides a mosaic of shrubs, grasses, and snags (Sjogren 2006). Where burning is unfeasible or cost-prohibitive, mechanical control of succession using hand tools and large machinery can also maintain open landscapes. Private Lands – agriculture, timber, development, and changing land use patterns In addition to fire suppression and conversion to pine plantations, the development of agriculture on the landscape has also impacted sharp-tailed grouse habitat. Practices such as annual grazing and haying operations may negatively influence sharp-tailed grouse during the nesting season, causing nest destruction or abandonment (Sjogren 2006). There are limited state and federal programs offering incentives to landowners to set aside cropland or reduce acreage in plantations to benefit sharp-tailed grouse and other open habitat species. There has also been increasing pressure to convert agricultural land to housing and other human development (Sjogren 2006). In approaching sharp-tailed grouse management it becomes evident that management and protection of private lands is imperative (Probst and Crow 1991). Habitat protection will require consideration of both existing and potential sharp-tailed grouse habitat, and involve strong partnerships with multiple partners and private landowners (e.g., agriculture, timber industry, county, state, federal).
23
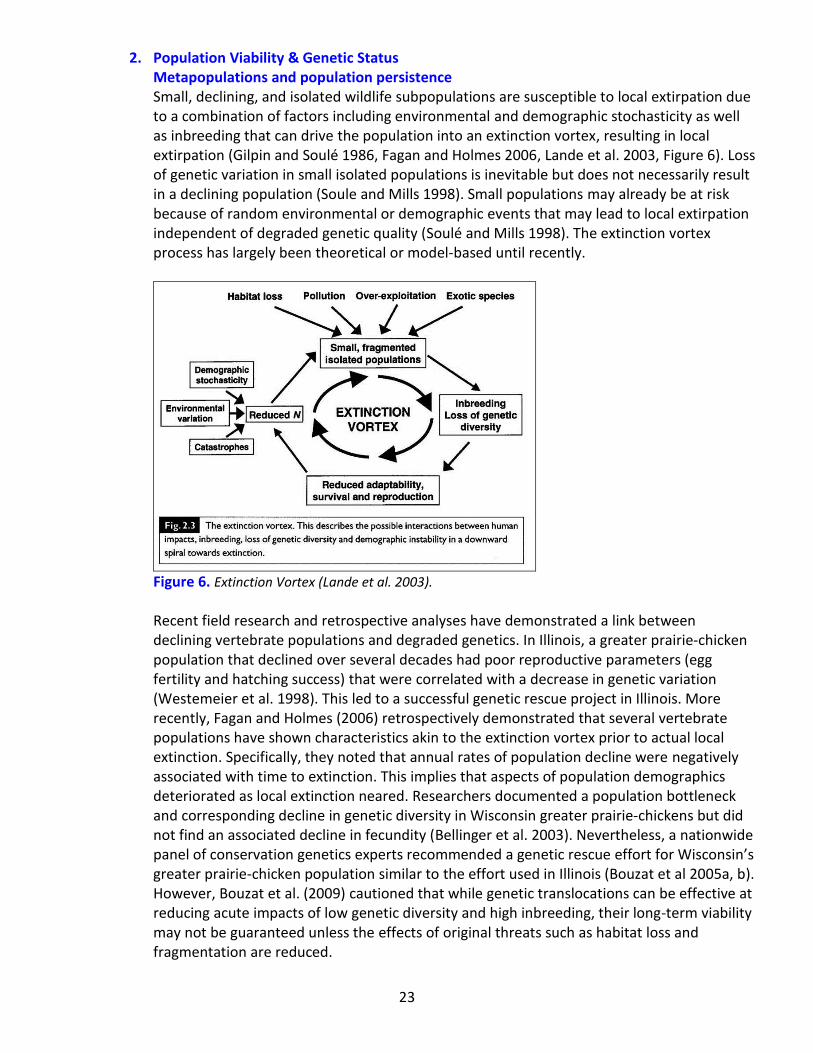
2. Population Viability & Genetic Status Metapopulations and population persistence Small, declining, and isolated wildlife subpopulations are susceptible to local extirpation due to a combination of factors including environmental and demographic stochasticity as well as inbreeding that can drive the population into an extinction vortex, resulting in local extirpation (Gilpin and Soulé 1986, Fagan and Holmes 2006, Lande et al. 2003, Figure 6). Loss of genetic variation in small isolated populations is inevitable but does not necessarily result in a declining population (Soule and Mills 1998). Small populations may already be at risk because of random environmental or demographic events that may lead to local extirpation independent of degraded genetic quality (Soulé and Mills 1998). The extinction vortex process has largely been theoretical or model-based until recently.
Figure 6. Extinction Vortex (Lande et al. 2003).
Recent field research and retrospective analyses have demonstrated a link between declining vertebrate populations and degraded genetics. In Illinois, a greater prairie-chicken population that declined over several decades had poor reproductive parameters (egg fertility and hatching success) that were correlated with a decrease in genetic variation (Westemeier et al. 1998). This led to a successful genetic rescue project in Illinois. More recently, Fagan and Holmes (2006) retrospectively demonstrated that several vertebrate populations have shown characteristics akin to the extinction vortex prior to actual local extinction. Specifically, they noted that annual rates of population decline were negatively associated with time to extinction. This implies that aspects of population demographics deteriorated as local extinction neared. Researchers documented a population bottleneck and corresponding decline in genetic diversity in Wisconsin greater prairie-chickens but did not find an associated decline in fecundity (Bellinger et al. 2003). Nevertheless, a nationwide panel of conservation genetics experts recommended a genetic rescue effort for Wisconsin’s greater prairie-chicken population similar to the effort used in Illinois (Bouzat et al 2005a, b). However, Bouzat et al. (2009) cautioned that while genetic translocations can be effective at reducing acute impacts of low genetic diversity and high inbreeding, their long-term viability may not be guaranteed unless the effects of original threats such as habitat loss and fragmentation are reduced.
24
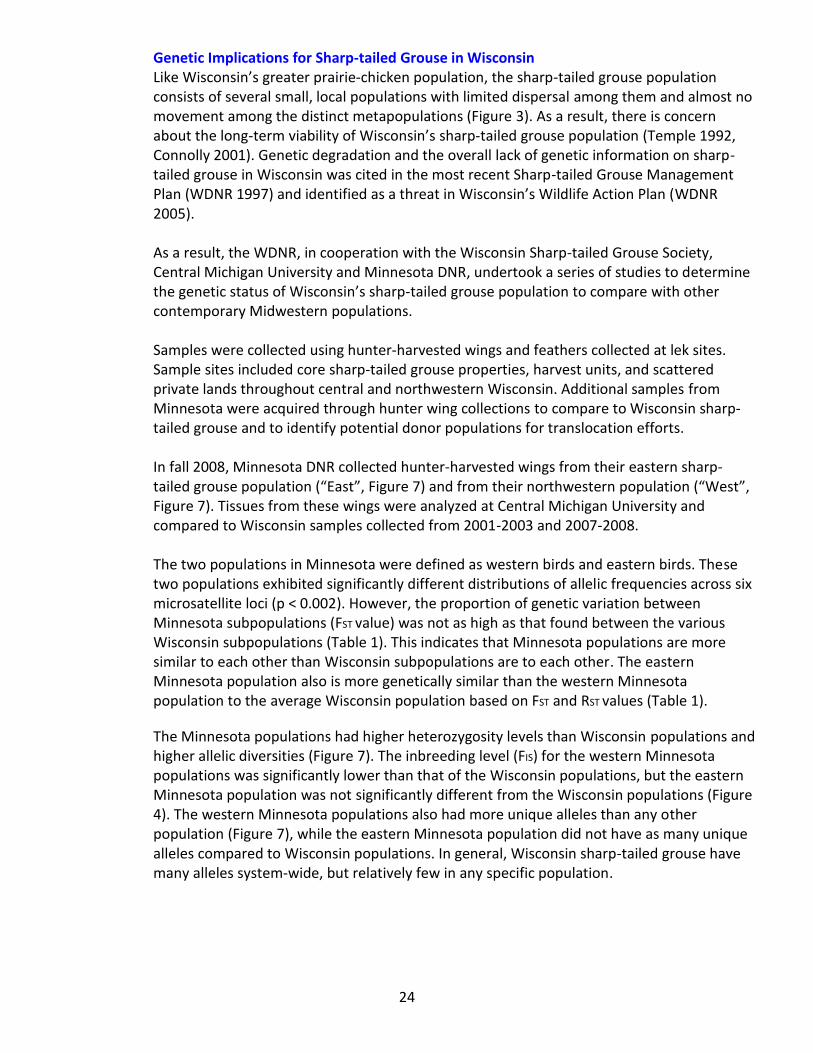
Genetic Implications for Sharp-tailed Grouse in Wisconsin Like Wisconsin’s greater prairie-chicken population, the sharp-tailed grouse population consists of several small, local populations with limited dispersal among them and almost no movement among the distinct metapopulations (Figure 3). As a result, there is concern about the long-term viability of Wisconsin’s sharp-tailed grouse population (Temple 1992, Connolly 2001). Genetic degradation and the overall lack of genetic information on sharp-tailed grouse in Wisconsin was cited in the most recent Sharp-tailed Grouse Management Plan (WDNR 1997) and identified as a threat in Wisconsin’s Wildlife Action Plan (WDNR 2005). As a result, the WDNR, in cooperation with the Wisconsin Sharp-tailed Grouse Society, Central Michigan University and Minnesota DNR, undertook a series of studies to determine the genetic status of Wisconsin’s sharp-tailed grouse population to compare with other contemporary Midwestern populations. Samples were collected using hunter-harvested wings and feathers collected at lek sites. Sample sites included core sharp-tailed grouse properties, harvest units, and scattered private lands throughout central and northwestern Wisconsin. Additional samples from Minnesota were acquired through hunter wing collections to compare to Wisconsin sharp-tailed grouse and to identify potential donor populations for translocation efforts. In fall 2008, Minnesota DNR collected hunter-harvested wings from their eastern sharp-tailed grouse population (“East”, Figure 7) and from their northwestern population (“West”, Figure 7). Tissues from these wings were analyzed at Central Michigan University and compared to Wisconsin samples collected from 2001-2003 and 2007-2008. The two populations in Minnesota were defined as western birds and eastern birds. These two populations exhibited significantly different distributions of allelic frequencies across six microsatellite loci (p < 0.002). However, the proportion of genetic variation between Minnesota subpopulations (FST value) was not as high as that found between the various Wisconsin subpopulations (Table 1). This indicates that Minnesota populations are more similar to each other than Wisconsin subpopulations are to each other. The eastern Minnesota population also is more genetically similar than the western Minnesota population to the average Wisconsin population based on FST and RST values (Table 1).
The Minnesota populations had higher heterozygosity levels than Wisconsin populations and higher allelic diversities (Figure 7). The inbreeding level (FIS) for the western Minnesota populations was significantly lower than that of the Wisconsin populations, but the eastern Minnesota population was not significantly different from the Wisconsin populations (Figure 4). The western Minnesota populations also had more unique alleles than any other population (Figure 7), while the eastern Minnesota population did not have as many unique alleles compared to Wisconsin populations. In general, Wisconsin sharp-tailed grouse have many alleles system-wide, but relatively few in any specific population.
25
0
2
4
6
8
10
12
14
Burnett
DouglasPrice (Riley Lake)
Price (KCWA)
RuskTaylor
MN EastMN West
County
Alle
lic d
ive
rsit
y
00.1
0.20.30.40.5
0.60.70.8
0.91
BurnettDouglas
Price (Riley Lake)
Price (KCWA)
RuskTaylor
MN EastMN West
County
He
tero
zygo
sity
0
0.5
1
1.5
2
2.5
3
3.5
4
4.5
BurnettDouglas
Price (Riley Lake)
Price (KCWA)
RuskTaylor
MN EastMN West
County
Ave
rage
N(P
riva
te a
llele
s)
0
0.1
0.2
0.3
0.4
0.5
0.6
0.7
0.8
0.9
1
BurnettDouglas
Price (Riley Lake)
Price (KCWA)
RuskTaylor
MN EastMN West
County
Inb
ree
din
g (F
is)
Figure 7. Genetic status (heterozygosity, allelic diversity, inbreeding and private alleles) for Wisconsin’s sharp-tailed grouse populations (grouped by county) compared to east-central and northwestern populations of Minnesota.
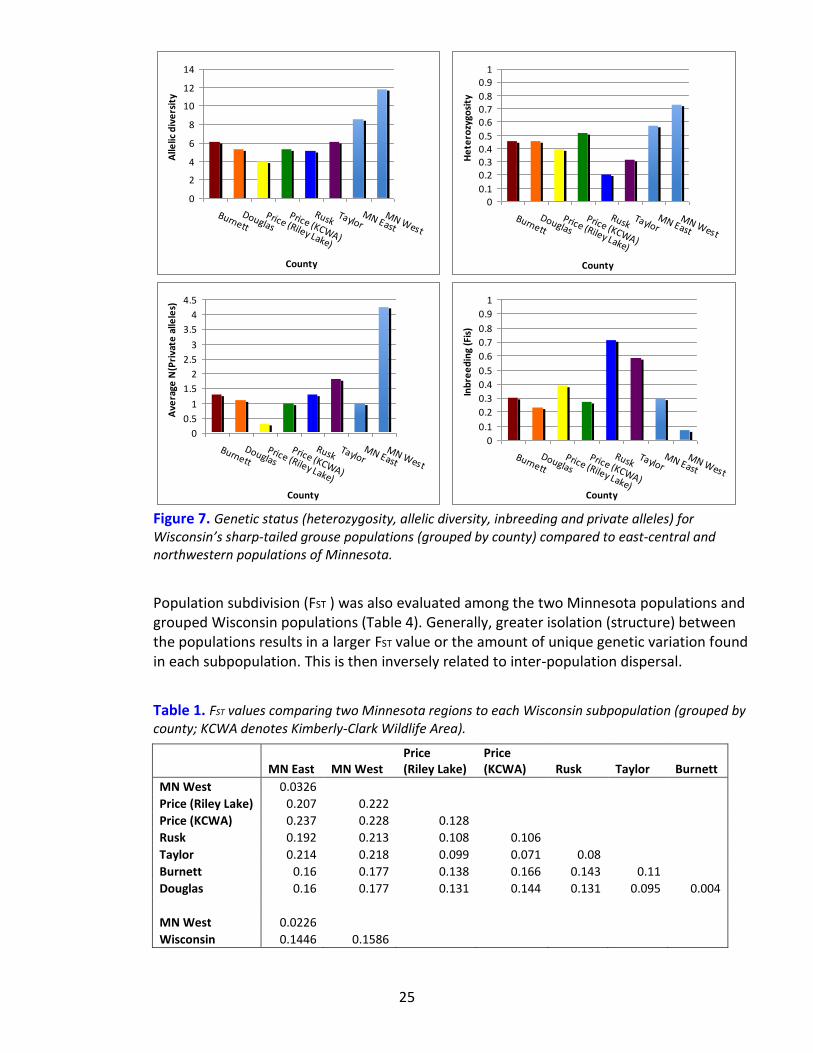
Population subdivision (FST ) was also evaluated among the two Minnesota populations and grouped Wisconsin populations (Table 4). Generally, greater isolation (structure) between the populations results in a larger FST value or the amount of unique genetic variation found in each subpopulation. This is then inversely related to inter-population dispersal.
Table 1. FST values comparing two Minnesota regions to each Wisconsin subpopulation (grouped by county; KCWA denotes Kimberly-Clark Wildlife Area).
MN East MN West Price (Riley Lake)
Price (KCWA) Rusk Taylor Burnett
MN West 0.0326
Price (Riley Lake) 0.207 0.222
Price (KCWA) 0.237 0.228 0.128
Rusk 0.192 0.213 0.108 0.106
Taylor 0.214 0.218 0.099 0.071 0.08
Burnett 0.16 0.177 0.138 0.166 0.143 0.11
Douglas 0.16 0.177 0.131 0.144 0.131 0.095 0.004
MN West 0.0226
Wisconsin 0.1446 0.1586
26
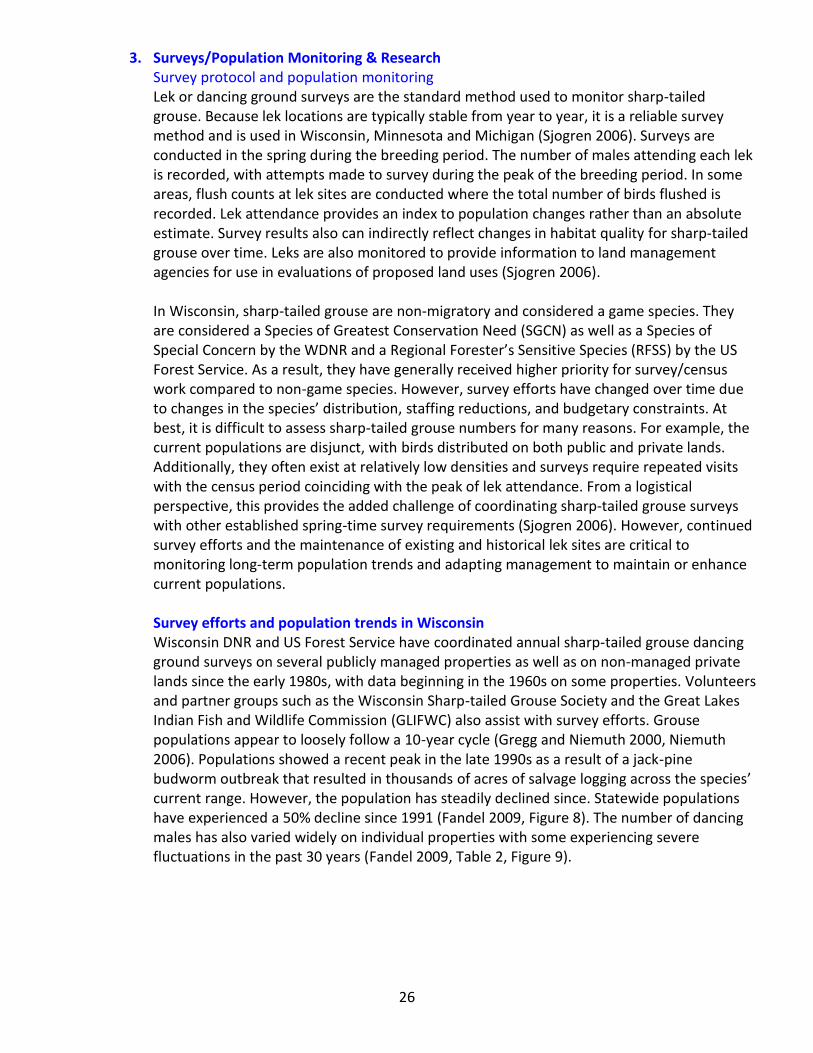
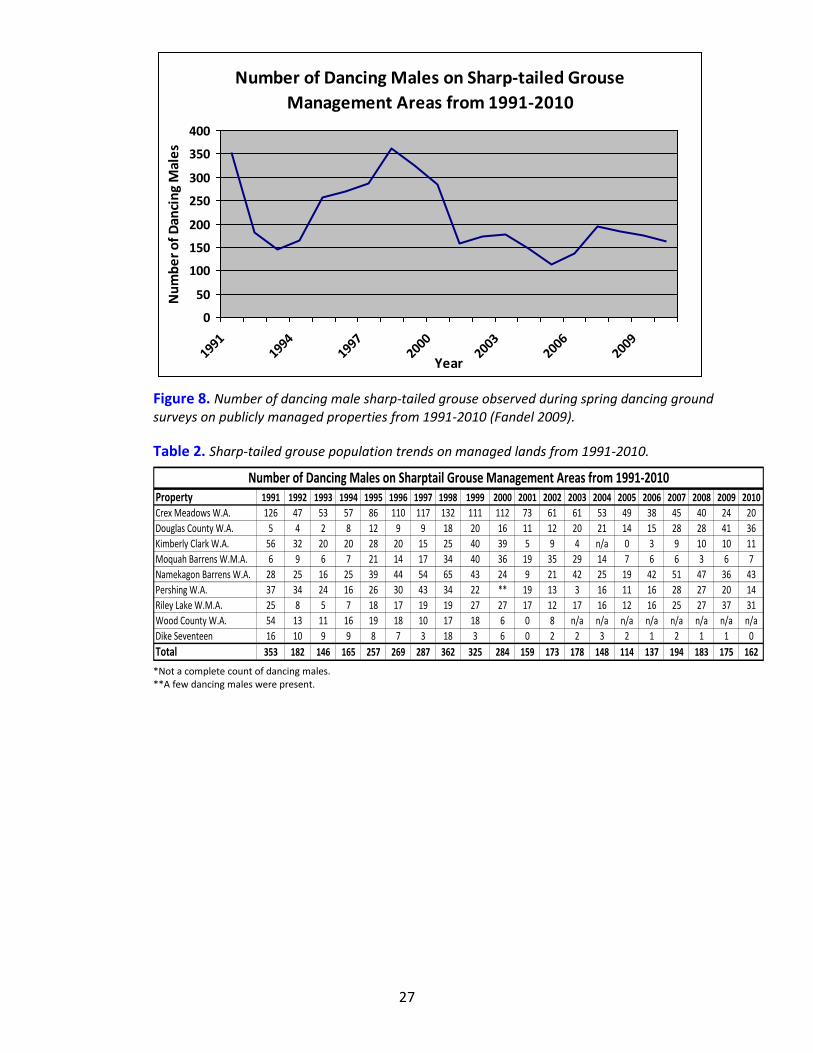
3. Surveys/Population Monitoring & Research Survey protocol and population monitoring Lek or dancing ground surveys are the standard method used to monitor sharp-tailed grouse. Because lek locations are typically stable from year to year, it is a reliable survey method and is used in Wisconsin, Minnesota and Michigan (Sjogren 2006). Surveys are conducted in the spring during the breeding period. The number of males attending each lek is recorded, with attempts made to survey during the peak of the breeding period. In some areas, flush counts at lek sites are conducted where the total number of birds flushed is recorded. Lek attendance provides an index to population changes rather than an absolute estimate. Survey results also can indirectly reflect changes in habitat quality for sharp-tailed grouse over time. Leks are also monitored to provide information to land management agencies for use in evaluations of proposed land uses (Sjogren 2006). In Wisconsin, sharp-tailed grouse are non-migratory and considered a game species. They are considered a Species of Greatest Conservation Need (SGCN) as well as a Species of Special Concern by the WDNR and a Regional Forester’s Sensitive Species (RFSS) by the US Forest Service. As a result, they have generally received higher priority for survey/census work compared to non-game species. However, survey efforts have changed over time due to changes in the species’ distribution, staffing reductions, and budgetary constraints. At best, it is difficult to assess sharp-tailed grouse numbers for many reasons. For example, the current populations are disjunct, with birds distributed on both public and private lands. Additionally, they often exist at relatively low densities and surveys require repeated visits with the census period coinciding with the peak of lek attendance. From a logistical perspective, this provides the added challenge of coordinating sharp-tailed grouse surveys with other established spring-time survey requirements (Sjogren 2006). However, continued survey efforts and the maintenance of existing and historical lek sites are critical to monitoring long-term population trends and adapting management to maintain or enhance current populations. Survey efforts and population trends in Wisconsin Wisconsin DNR and US Forest Service have coordinated annual sharp-tailed grouse dancing ground surveys on several publicly managed properties as well as on non-managed private lands since the early 1980s, with data beginning in the 1960s on some properties. Volunteers and partner groups such as the Wisconsin Sharp-tailed Grouse Society and the Great Lakes Indian Fish and Wildlife Commission (GLIFWC) also assist with survey efforts. Grouse populations appear to loosely follow a 10-year cycle (Gregg and Niemuth 2000, Niemuth 2006). Populations showed a recent peak in the late 1990s as a result of a jack-pine budworm outbreak that resulted in thousands of acres of salvage logging across the species’ current range. However, the population has steadily declined since. Statewide populations have experienced a 50% decline since 1991 (Fandel 2009, Figure 8). The number of dancing males has also varied widely on individual properties with some experiencing severe fluctuations in the past 30 years (Fandel 2009, Table 2, Figure 9).
27
Number of Dancing Males on Sharp-tailed Grouse
Management Areas from 1991-2010
0
50
100
150
200
250
300
350
400
19911994
19972000
20032006
2009
Year
Nu
mb
er
of
Dan
cin
g M
ale
s
Figure 8. Number of dancing male sharp-tailed grouse observed during spring dancing ground surveys on publicly managed properties from 1991-2010 (Fandel 2009).
Table 2. Sharp-tailed grouse population trends on managed lands from 1991-2010.
Property 1991 1992 1993 1994 1995 1996 1997 1998 1999 2000 2001 2002 2003 2004 2005 2006 2007 2008 2009 2010
Crex Meadows W.A. 126 47 53 57 86 110 117 132 111 112 73 61 61 53 49 38 45 40 24 20
Douglas County W.A. 5 4 2 8 12 9 9 18 20 16 11 12 20 21 14 15 28 28 41 36
Kimberly Clark W.A. 56 32 20 20 28 20 15 25 40 39 5 9 4 n/a 0 3 9 10 10 11
Moquah Barrens W.M.A. 6 9 6 7 21 14 17 34 40 36 19 35 29 14 7 6 6 3 6 7
Namekagon Barrens W.A. 28 25 16 25 39 44 54 65 43 24 9 21 42 25 19 42 51 47 36 43
Pershing W.A. 37 34 24 16 26 30 43 34 22 ** 19 13 3 16 11 16 28 27 20 14
Riley Lake W.M.A. 25 8 5 7 18 17 19 19 27 27 17 12 17 16 12 16 25 27 37 31
Wood County W.A. 54 13 11 16 19 18 10 17 18 6 0 8 n/a n/a n/a n/a n/a n/a n/a n/a
Dike Seventeen 16 10 9 9 8 7 3 18 3 6 0 2 2 3 2 1 2 1 1 0
Total 353 182 146 165 257 269 287 362 325 284 159 173 178 148 114 137 194 183 175 162
Number of Dancing Males on Sharptail Grouse Management Areas from 1991-2010
*Not a complete count of dancing males. **A few dancing males were present.
28
Number of Sharp-tailed Grouse Dancing Males within the Northwest Sands
Ecological Landscape and surrounding areas 1990-2010
0
20
40
60
80
100
120
140
1990
1991
1992
1993
1994
1995
1996
1997
1998
1999
2000
2001
2002
2003
2004
2005
2006
2007
2008
2009
2010
Year
Nu
mb
er
of
Dan
cin
g M
ale
s
Crex Meadows W.A. Namekagon Barrens W.A.
Douglas County W.A. Moquah Barrens W.M.A.
Number of Sharp-tailed Grouse Observed
on Non-managed Properties within DMU2 & DMU9 within
the Northwest Sands Ecological Landscape 1999-2010
0
50
100
150
200
250
300
1999
2000
2001
2002
2003
2004
2005
2006
2007
2008
2009
2010
Year
Tota
l Bir
ds
(ass
um
e 7
5%
mal
es)
unit 2 unit 9
29
Number of Sharp-tailed Grouse Dancing Males within
the North Central Forest Ecological Landscape 1991-2010
0
10
20
30
40
50
60
1989
1991
1993
1995
1997
1999
2001
2003
2005
2007
2009
Year
Nu
mb
er
of
Dan
cin
g M
ale
s
Pershing W.A. Kimberly Clark W.A. Riley Lake W.M.A.
Number of Sharp-tailed Grouse Dancing Males within
the Central Sands Plains Ecological Landscape 1981-2010
0
10
20
30
40
50
60
1981
1983
1985
1987
1989
1991
1993
1995
1997
1999
2001
2003
2005
2007
2009
Year
Nu
mb
er o
f D
anci
ng
Mal
es
Wood County W.A. Dike Seventeen
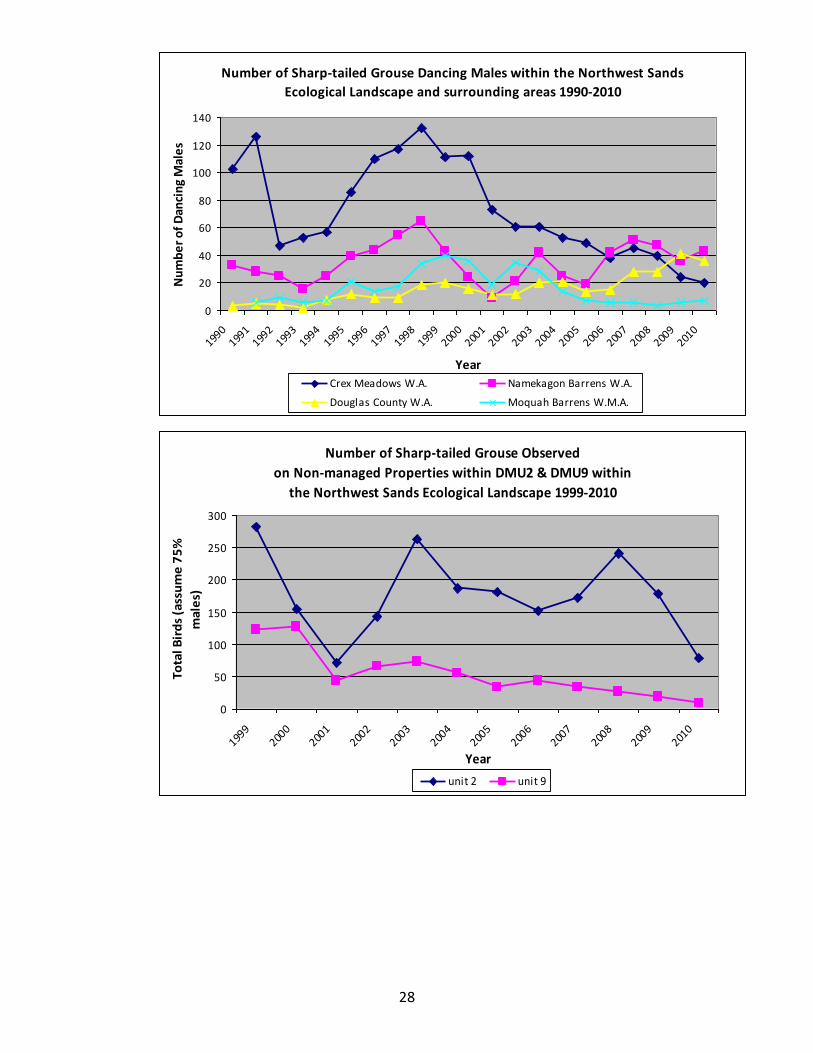
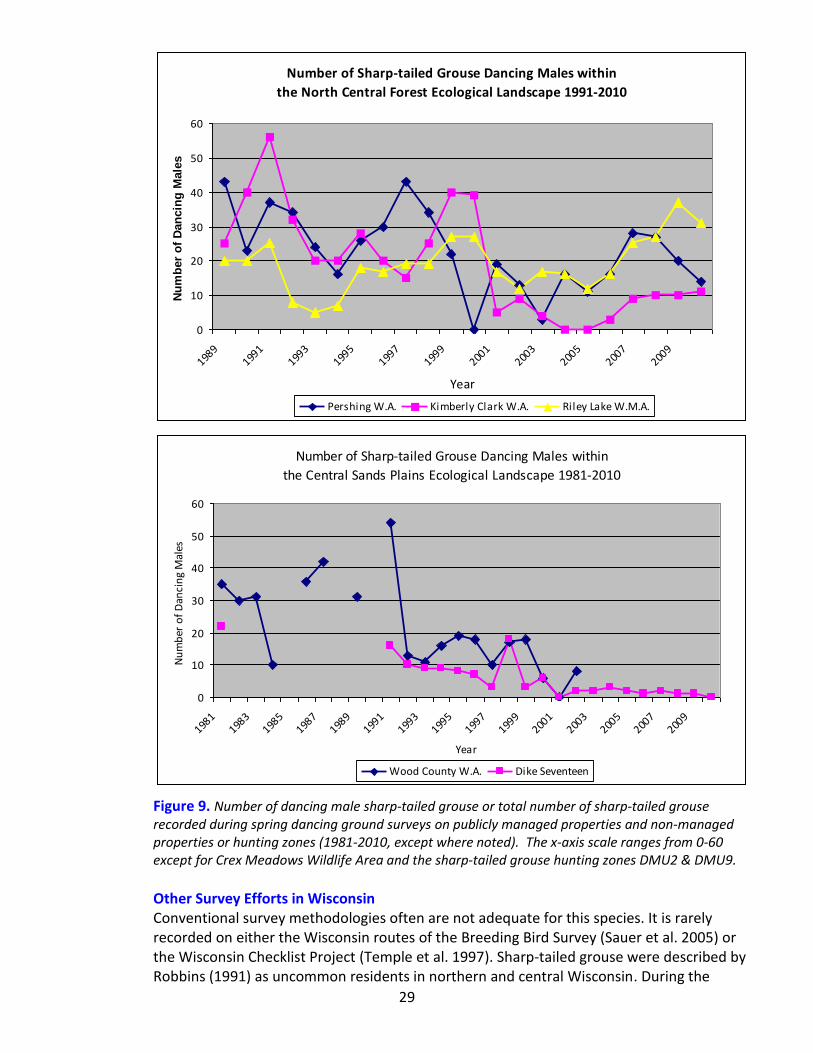
Figure 9. Number of dancing male sharp-tailed grouse or total number of sharp-tailed grouse recorded during spring dancing ground surveys on publicly managed properties and non-managed properties or hunting zones (1981-2010, except where noted). The x-axis scale ranges from 0-60 except for Crex Meadows Wildlife Area and the sharp-tailed grouse hunting zones DMU2 & DMU9. Other Survey Efforts in Wisconsin Conventional survey methodologies often are not adequate for this species. It is rarely recorded on either the Wisconsin routes of the Breeding Bird Survey (Sauer et al. 2005) or the Wisconsin Checklist Project (Temple et al. 1997). Sharp-tailed grouse were described by Robbins (1991) as uncommon residents in northern and central Wisconsin. During the
30
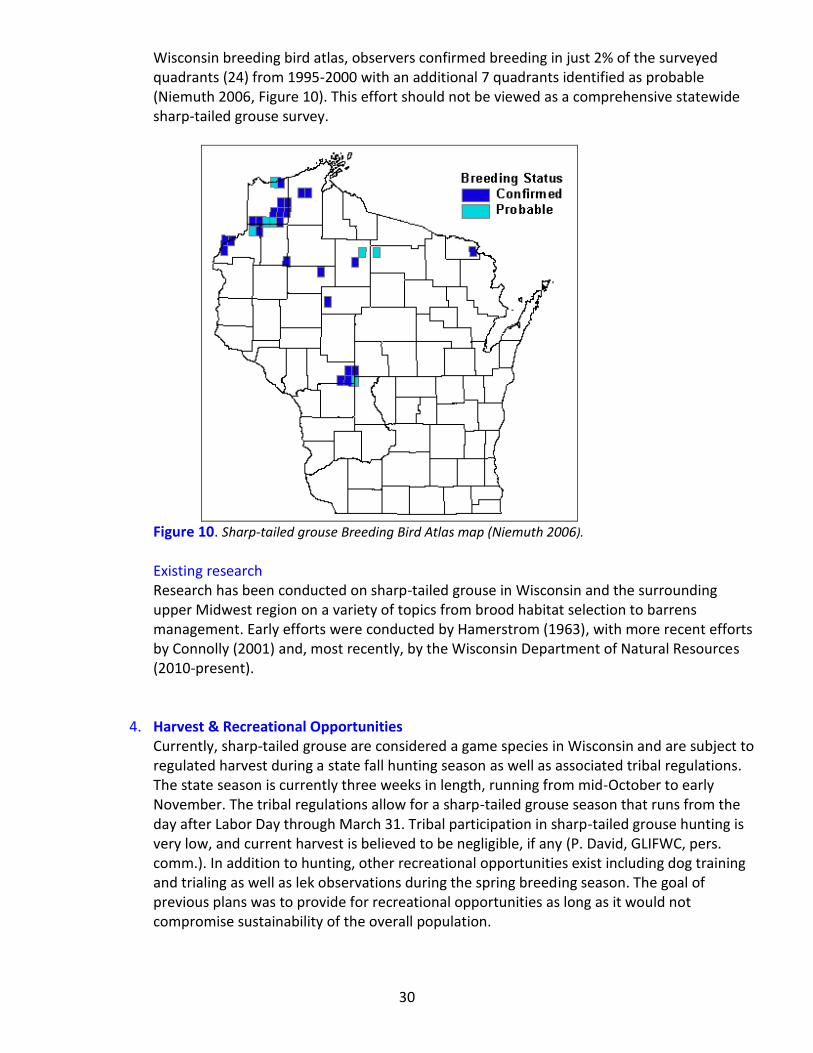
Wisconsin breeding bird atlas, observers confirmed breeding in just 2% of the surveyed quadrants (24) from 1995-2000 with an additional 7 quadrants identified as probable (Niemuth 2006, Figure 10). This effort should not be viewed as a comprehensive statewide sharp-tailed grouse survey.
Figure 10. Sharp-tailed grouse Breeding Bird Atlas map (Niemuth 2006).
Existing research Research has been conducted on sharp-tailed grouse in Wisconsin and the surrounding upper Midwest region on a variety of topics from brood habitat selection to barrens management. Early efforts were conducted by Hamerstrom (1963), with more recent efforts by Connolly (2001) and, most recently, by the Wisconsin Department of Natural Resources (2010-present).
4. Harvest & Recreational Opportunities Currently, sharp-tailed grouse are considered a game species in Wisconsin and are subject to regulated harvest during a state fall hunting season as well as associated tribal regulations. The state season is currently three weeks in length, running from mid-October to early November. The tribal regulations allow for a sharp-tailed grouse season that runs from the day after Labor Day through March 31. Tribal participation in sharp-tailed grouse hunting is very low, and current harvest is believed to be negligible, if any (P. David, GLIFWC, pers. comm.). In addition to hunting, other recreational opportunities exist including dog training and trialing as well as lek observations during the spring breeding season. The goal of previous plans was to provide for recreational opportunities as long as it would not compromise sustainability of the overall population.
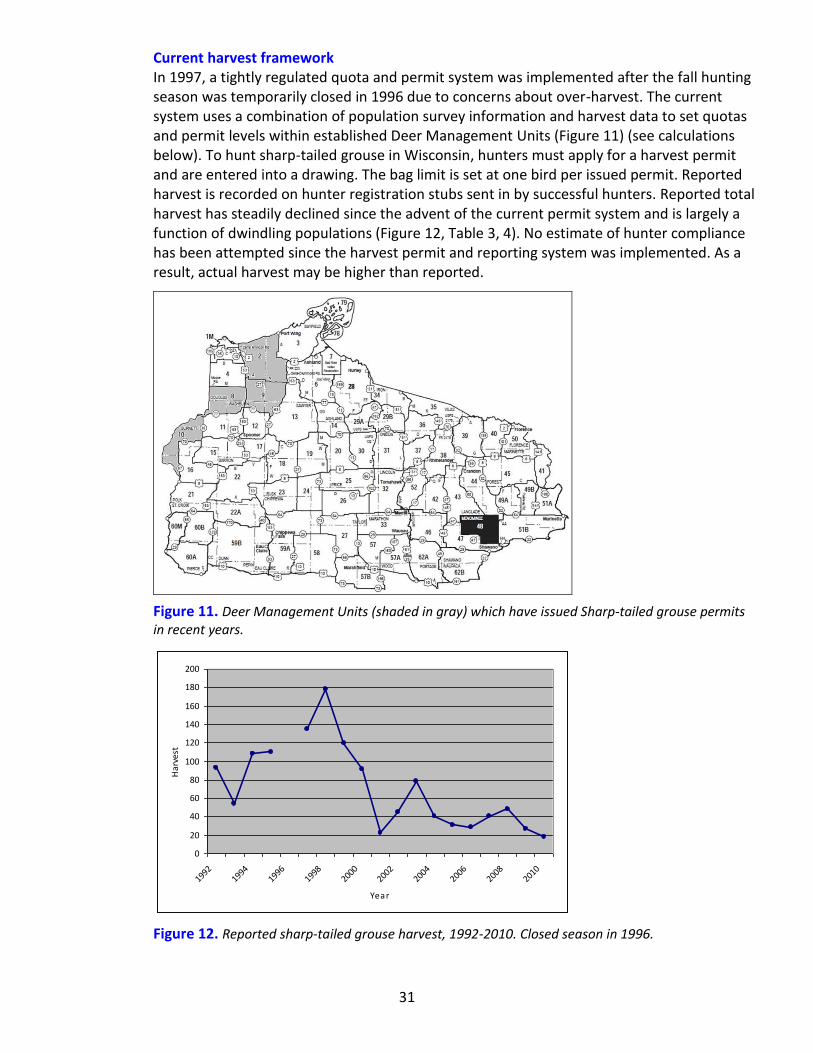
31
Current harvest framework In 1997, a tightly regulated quota and permit system was implemented after the fall hunting season was temporarily closed in 1996 due to concerns about over-harvest. The current system uses a combination of population survey information and harvest data to set quotas and permit levels within established Deer Management Units (Figure 11) (see calculations below). To hunt sharp-tailed grouse in Wisconsin, hunters must apply for a harvest permit and are entered into a drawing. The bag limit is set at one bird per issued permit. Reported harvest is recorded on hunter registration stubs sent in by successful hunters. Reported total harvest has steadily declined since the advent of the current permit system and is largely a function of dwindling populations (Figure 12, Table 3, 4). No estimate of hunter compliance has been attempted since the harvest permit and reporting system was implemented. As a result, actual harvest may be higher than reported.
Figure 11. Deer Management Units (shaded in gray) which have issued Sharp-tailed grouse permits in recent years.
0
20
40
60
80
100
120
140
160
180
200
19921994
19961998
20002002
20042006
20082010
Year
Har
vest
Figure 12. Reported sharp-tailed grouse harvest, 1992-2010. Closed season in 1996.
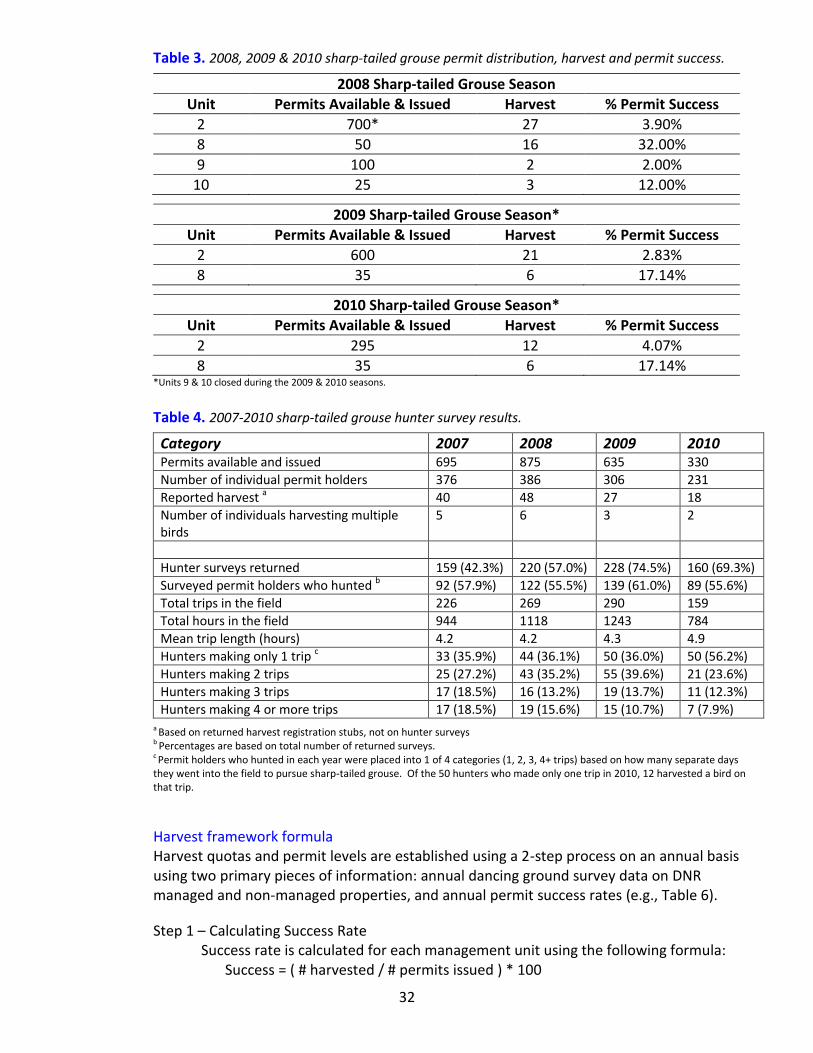
32
Table 3. 2008, 2009 & 2010 sharp-tailed grouse permit distribution, harvest and permit success.
2008 Sharp-tailed Grouse Season
Unit Permits Available & Issued Harvest % Permit Success
2 700* 27 3.90%
8 50 16 32.00%
9 100 2 2.00%
10 25 3 12.00%
2009 Sharp-tailed Grouse Season*
Unit Permits Available & Issued Harvest % Permit Success
2 600 21 2.83%
8 35 6 17.14%
2010 Sharp-tailed Grouse Season*
Unit Permits Available & Issued Harvest % Permit Success
2 295 12 4.07%
8 35 6 17.14% *Units 9 & 10 closed during the 2009 & 2010 seasons.
Table 4. 2007-2010 sharp-tailed grouse hunter survey results.
Category 2007 2008 2009 2010 Permits available and issued 695 875 635 330
Number of individual permit holders 376 386 306 231
Reported harvest a 40 48 27 18
Number of individuals harvesting multiple birds
5 6 3 2
Hunter surveys returned 159 (42.3%) 220 (57.0%) 228 (74.5%) 160 (69.3%)
Surveyed permit holders who hunted b 92 (57.9%) 122 (55.5%) 139 (61.0%) 89 (55.6%)
Total trips in the field 226 269 290 159
Total hours in the field 944 1118 1243 784
Mean trip length (hours) 4.2 4.2 4.3 4.9
Hunters making only 1 trip c 33 (35.9%) 44 (36.1%) 50 (36.0%) 50 (56.2%)
Hunters making 2 trips 25 (27.2%) 43 (35.2%) 55 (39.6%) 21 (23.6%)
Hunters making 3 trips 17 (18.5%) 16 (13.2%) 19 (13.7%) 11 (12.3%)
Hunters making 4 or more trips 17 (18.5%) 19 (15.6%) 15 (10.7%) 7 (7.9%)
a Based on returned harvest registration stubs, not on hunter surveys b Percentages are based on total number of returned surveys. c Permit holders who hunted in each year were placed into 1 of 4 categories (1, 2, 3, 4+ trips) based on how many separate days they went into the field to pursue sharp-tailed grouse. Of the 50 hunters who made only one trip in 2010, 12 harvested a bird on that trip.
Harvest framework formula Harvest quotas and permit levels are established using a 2-step process on an annual basis using two primary pieces of information: annual dancing ground survey data on DNR managed and non-managed properties, and annual permit success rates (e.g., Table 6).
Step 1 – Calculating Success Rate Success rate is calculated for each management unit using the following formula:
Success = ( # harvested / # permits issued ) * 100
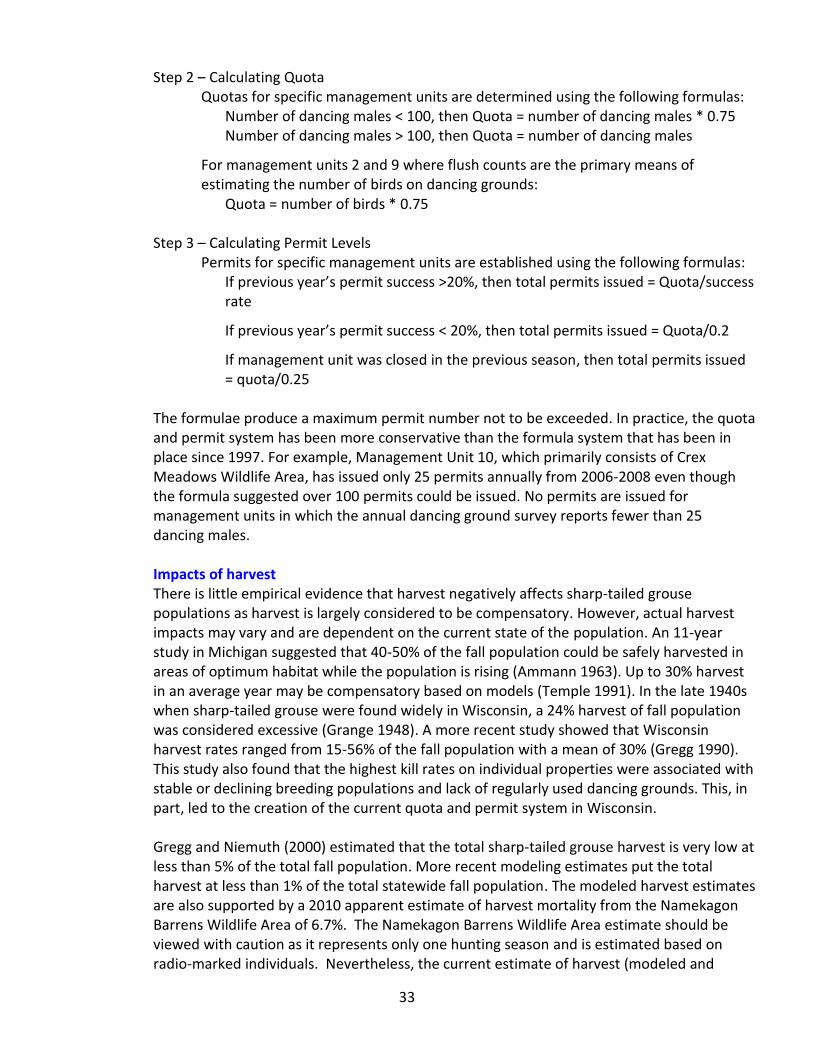
33
Step 2 – Calculating Quota
Quotas for specific management units are determined using the following formulas: Number of dancing males < 100, then Quota = number of dancing males * 0.75 Number of dancing males > 100, then Quota = number of dancing males
For management units 2 and 9 where flush counts are the primary means of estimating the number of birds on dancing grounds:
Quota = number of birds * 0.75
Step 3 – Calculating Permit Levels Permits for specific management units are established using the following formulas:
If previous year’s permit success >20%, then total permits issued = Quota/success rate
If previous year’s permit success < 20%, then total permits issued = Quota/0.2
If management unit was closed in the previous season, then total permits issued = quota/0.25
The formulae produce a maximum permit number not to be exceeded. In practice, the quota and permit system has been more conservative than the formula system that has been in place since 1997. For example, Management Unit 10, which primarily consists of Crex Meadows Wildlife Area, has issued only 25 permits annually from 2006-2008 even though the formula suggested over 100 permits could be issued. No permits are issued for management units in which the annual dancing ground survey reports fewer than 25 dancing males.
Impacts of harvest There is little empirical evidence that harvest negatively affects sharp-tailed grouse populations as harvest is largely considered to be compensatory. However, actual harvest impacts may vary and are dependent on the current state of the population. An 11-year study in Michigan suggested that 40-50% of the fall population could be safely harvested in areas of optimum habitat while the population is rising (Ammann 1963). Up to 30% harvest in an average year may be compensatory based on models (Temple 1991). In the late 1940s when sharp-tailed grouse were found widely in Wisconsin, a 24% harvest of fall population was considered excessive (Grange 1948). A more recent study showed that Wisconsin harvest rates ranged from 15-56% of the fall population with a mean of 30% (Gregg 1990). This study also found that the highest kill rates on individual properties were associated with stable or declining breeding populations and lack of regularly used dancing grounds. This, in part, led to the creation of the current quota and permit system in Wisconsin. Gregg and Niemuth (2000) estimated that the total sharp-tailed grouse harvest is very low at less than 5% of the total fall population. More recent modeling estimates put the total harvest at less than 1% of the total statewide fall population. The modeled harvest estimates are also supported by a 2010 apparent estimate of harvest mortality from the Namekagon Barrens Wildlife Area of 6.7%. The Namekagon Barrens Wildlife Area estimate should be viewed with caution as it represents only one hunting season and is estimated based on radio-marked individuals. Nevertheless, the current estimate of harvest (modeled and
34
apparent) is likely not contributing to the overall population decline of this species (Niemuth 2006). In addition, permit success rates have steadily declined in Wisconsin since the adoption of the quota and permit system in 1997.
1997 permit success rate = 20.8%
1998 permit success rate = 10.0%
2007 permit success rate = 5.8%
2010 hunting mortality rate = 6.7% (n=1 of 15 radioed birds harvested)
A decline in permit success rates further suggests a small impact on the overall statewide population. However, researchers have suggested both in the past (Ammann 1957) and in recent times (Connelly et al. 1998) that hunting may adversely impact small, isolated, and declining populations. New research efforts that began in 2010 at Namekagon Barrens Wildlife Area and Crex Meadows Wildlife Area in Northwest Wisconsin will shed new light on the harvest mortality questions.
5. Disease, Predation, Interspecific Competition
Disease does not appear to be a significant threat to the viability or long-term health of the sharp-tailed grouse population in Wisconsin or across its broader range (Sjogren 2006). Predation, while not likely to impact sharp-tailed grouse at the population level, is suspected of causing many nest losses during the breeding season. Brood mortality (47%), the majority occurring within the first month after hatching, can be largely attributed to predation (Johnsgard 1983). Lek interference and nesting parasitism by ring-necked pheasants has been documented in many prairie grouse populations (Walk 2004). Lek interference by ring-necked pheasants has also been observed in Wisconsin (Pete Engman, pers. comm.) but the impacts are unknown at this time.
6. Other Limiting Factors Additional factors that may be cause for concern regarding long-term sharp-tailed grouse population viability include accidents such as collisions with wires, fences, and vehicles, wildlife observation activities, dog training activities, annual dancing ground surveys or research which may disturb activity at a lek or nest site, invasive species, and climate change (Sjogren 2006). In particular, Wisconsin’s climate is expected to change substantially over the next 100 years. A changing climate will impact the state’s wildlife, including sharp-tailed grouse. As a result, adaptation strategies based on research are needed. Assisting in this effort, experts in wildlife research and management from across the state have formed the Wildlife Working Group, a part of the Wisconsin Initiative for Climate Change Impacts (WICCI). Its mission is to produce and share information on the impact of climate change on Wisconsin’s wildlife resources. According to the Wildlife Working Group of the Wisconsin Climate Change Impacts Initiative (WICCI 2011), Future Climate Change in Wisconsin could have direct and indirect impacts on wildlife. Direct impacts could include things such as altered precipitation (e.g. altered snow

35
cover, flooding) and high temperature events while indirect impacts could include changes in distribution of suitable habitat or changes in species interactions due to shifts in species distributions.
The sharp-tailed grouse is “especially vulnerable” to climate change (North American Bird Conservation Initiative, 2010). While the specific impacts of climate change on sharp-tailed grouse in Wisconsin are unknown, future climate change is likely to impact the species synergistically with other non-climate stressors such as habitat loss and fragmentation, two factors that are already impacting sharp-tailed grouse. In an effort to understand the relationship among direct and indirect climate change impacts and non-climate stressors, the WICCI wildlife working group is developing a Bayesian Network Model (Howe et al. 2010) for Wisconsin’s greater prairie-chicken population. Utilizing the results of this work and developing a similar model for sharp-tailed grouse will help inform managers of the potential threats of future climate change on sharp-tailed grouse in Wisconsin and will result in adaptation strategies that can be incorporated into regional habitat implementation strategies. The resulting conceptual model (e.g. Figure 1) will help identify gaps in our understanding of the strengths and directions of future climate change impacts in sharp-tailed grouse and will lead to potential adaptation strategies (See Part 2, Action item 6.1).
Specific adaptation and/or mitigation strategies for dealing with impacts of future climate change on sharp-tailed grouse populations in Wisconsin have not been developed. Specific strategies will emerge upon completion of the Bayesian Network Model. General adaptation strategies to ensure that vital rates within ecosystems at least say within the recorded variability (Noss 2001) will be required over the short-and long-term. Such strategies may include land protection, connectivity and a strong adherence to adaptive management strategies (WICCI 2011).
G. Review of 1996-1997 Management Plan A thorough review of the existing 10-year Sharp-tailed Grouse Management Plan was recently undertaken. The goals of the review were to:
1. Identify general accomplishments, successes and/or failures of the current management plan.
2. Identify where and how improvements could be made specifically related to plan implementation.
3. Identify remaining information needs.
The goal of the review is to develop a constructive framework for discussing how to learn from the old plan and adapt a new plan. As with any management plan, periodic revision and objective discussion on established goals need to be undertaken to determine where the plan can be strengthened and adapted to fit current and future needs of the species for which the plan was written. The stated Program Goal of the 1996-97 statewide Sharp-tailed Grouse Management Plan (WDNR 1997) was to:
Secure habitat complexes necessary to maintain minimum viable populations of sharp-tailed grouse in northwest and central Wisconsin which will allow for a regulated harvest.
36
In addition the plan contained six 10-year objectives:
Document the current statewide distribution and abundance of sharp-tailed grouse.
Revise and implement this management plan based on the population assessment.
Intensively manage sharp-tailed grouse on nine core areas; the habitat goals for each should be large enough to assure a minimum viable population. Expand management efforts on or near core public lands to provide a minimum of 50,000 acres of brush-prairie and suitable open wetlands to support a minimum of 500 breeding sharp-tailed grouse (during cyclic lows).
Increase suitable habitat distribution and connectivity in the northwest pine barrens region through complementary forest management practices (large block management).
Broaden support for prairie/savannah/pine barrens preservation and restoration through education, publicity and program integration.
Control harvest by 1) opening or closing areas to sharp-tailed grouse hunting as appropriate and 2) implementing a quota harvest system which will limit the number of birds harvested through control of hunter numbers in specific harvest zones.
Moderate attempts were made to meet portions of the 1996 plan objectives. The 1996 plan’s overarching goal was to ensure a minimum viable population of sharp-tailed grouse across the current range. Unfortunately, the actual size of that population was not identified or modeled. In addition, there was language pertaining to 50,000 acres needed to sustain 500 breeding sharp-tailed grouse but it was not clear if that was a statewide goal or individual property goal. Further, there was no clear implementation program/plan established for this management plan and no clear method for adapting the plan as new information was collected despite a clearly stated objective (above). One objective that was fully met since the adoption of the 1996 plan was the harvest framework/permit system established in 1997.
37
II. Plan Goals & Recommendations for Implementation
A. Overarching Plan Goal The specific goal of this plan is to ensure a viable population of sharp-tailed grouse within the state that also provides regulated harvest opportunities. For the purposes of this planning effort, a viable population is defined as:
A self-supporting population with sufficient numbers and genetic diversity among local populations and meta-populations to ensure that the species will not become extirpated from
the state in the foreseeable future. We plan to accomplish this goal by focusing our management efforts on the existing core range of sharp-tailed grouse in Wisconsin. Statewide population goals will be stepped-down using established sharp-tailed grouse conservation areas within key ecological landscapes. Goals will be stepped-down further within each conservation area using habitat-specific information to identify areas of specific importance to sharp-tailed grouse. Specific property population and habitat goals will be described within each of the conservation areas. Further, our vision for this overall management effort is to develop and facilitate a voluntary and cooperative partnership among public and private organizations to ensure the long-term viability of sharp-tailed grouse populations in Wisconsin through an ecological landscape and conservation area or focus area approach. This management plan follows an adaptive management or conservation action planning approach (Gordon et al. 2005). That is, the plan has set goals based on the best available information and has identified a number of information needs and gaps and a series of actions to address them. When new information becomes available and information gaps are filled, we will adapt the plan as necessary to reach the plan goals.
B. Focus Areas
The core sharp-tailed grouse population currently occurs in northern Wisconsin within the Northwest Sands, North Central Forest and Superior Coastal Plains Ecological Landscapes (Figure 4, page 17). A small remnant population may also exist in the Central Sand Plains Ecological Landscape. Within these landscapes sharp-tailed grouse function primarily as two to three distinct meta-populations with local subpopulations existing on several core managed properties.
The primary focus of the sharp-tailed grouse management plan will be on the species’ current range within Wisconsin. To reach the goal of maintaining a viable population of sharp-tailed grouse in Wisconsin, it is necessary to maintain the structure of the current meta-populations and to determine if other meta-populations currently exist or if there is potential to create or restore additional meta-populations in parts of the former range. Focus areas or Sharp-tailed Grouse Conservation Areas (Figure 13) have been identified that will be used to direct management actions to reach the plan goal of ensuring a viable statewide population. Existing meta-populations and established Sharp-tailed Grouse Conservation Areas will be used to
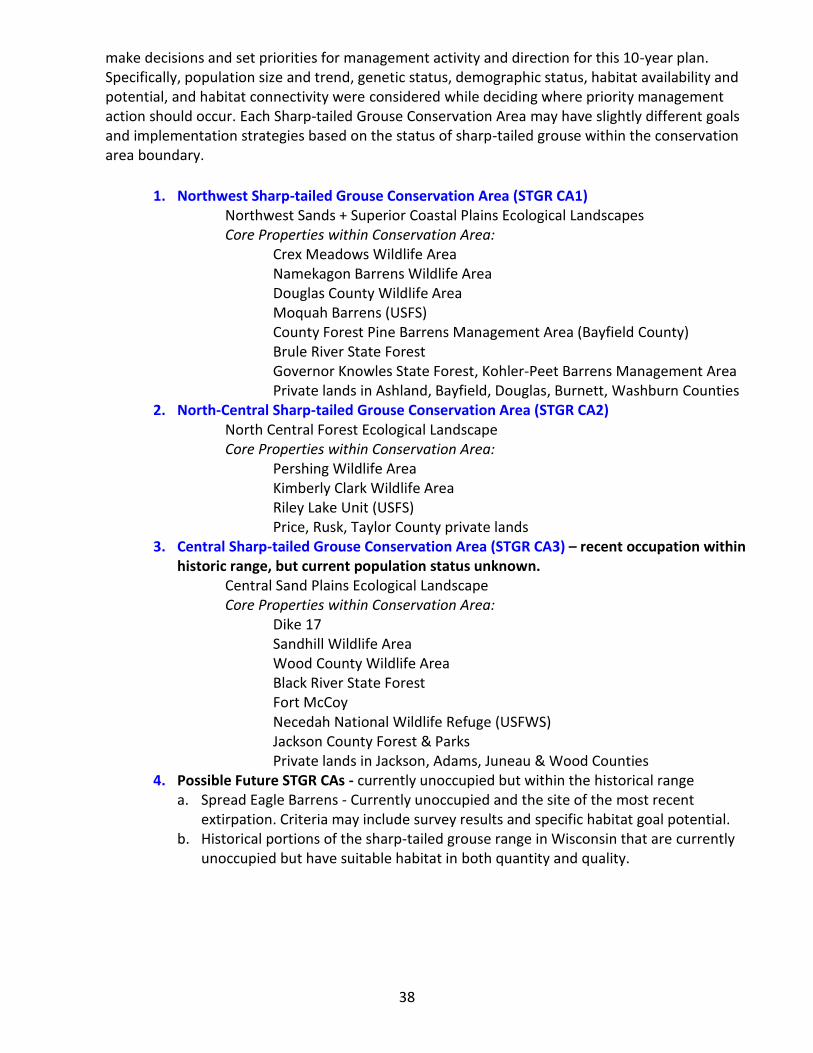
38
make decisions and set priorities for management activity and direction for this 10-year plan. Specifically, population size and trend, genetic status, demographic status, habitat availability and potential, and habitat connectivity were considered while deciding where priority management action should occur. Each Sharp-tailed Grouse Conservation Area may have slightly different goals and implementation strategies based on the status of sharp-tailed grouse within the conservation area boundary.
1. Northwest Sharp-tailed Grouse Conservation Area (STGR CA1)
Northwest Sands + Superior Coastal Plains Ecological Landscapes Core Properties within Conservation Area:
Crex Meadows Wildlife Area Namekagon Barrens Wildlife Area Douglas County Wildlife Area Moquah Barrens (USFS) County Forest Pine Barrens Management Area (Bayfield County) Brule River State Forest Governor Knowles State Forest, Kohler-Peet Barrens Management Area Private lands in Ashland, Bayfield, Douglas, Burnett, Washburn Counties
2. North-Central Sharp-tailed Grouse Conservation Area (STGR CA2) North Central Forest Ecological Landscape Core Properties within Conservation Area:
Pershing Wildlife Area Kimberly Clark Wildlife Area Riley Lake Unit (USFS) Price, Rusk, Taylor County private lands
3. Central Sharp-tailed Grouse Conservation Area (STGR CA3) – recent occupation within historic range, but current population status unknown.
Central Sand Plains Ecological Landscape Core Properties within Conservation Area:
Dike 17 Sandhill Wildlife Area Wood County Wildlife Area Black River State Forest Fort McCoy Necedah National Wildlife Refuge (USFWS) Jackson County Forest & Parks Private lands in Jackson, Adams, Juneau & Wood Counties
4. Possible Future STGR CAs - currently unoccupied but within the historical range a. Spread Eagle Barrens - Currently unoccupied and the site of the most recent
extirpation. Criteria may include survey results and specific habitat goal potential. b. Historical portions of the sharp-tailed grouse range in Wisconsin that are currently
unoccupied but have suitable habitat in both quantity and quality.
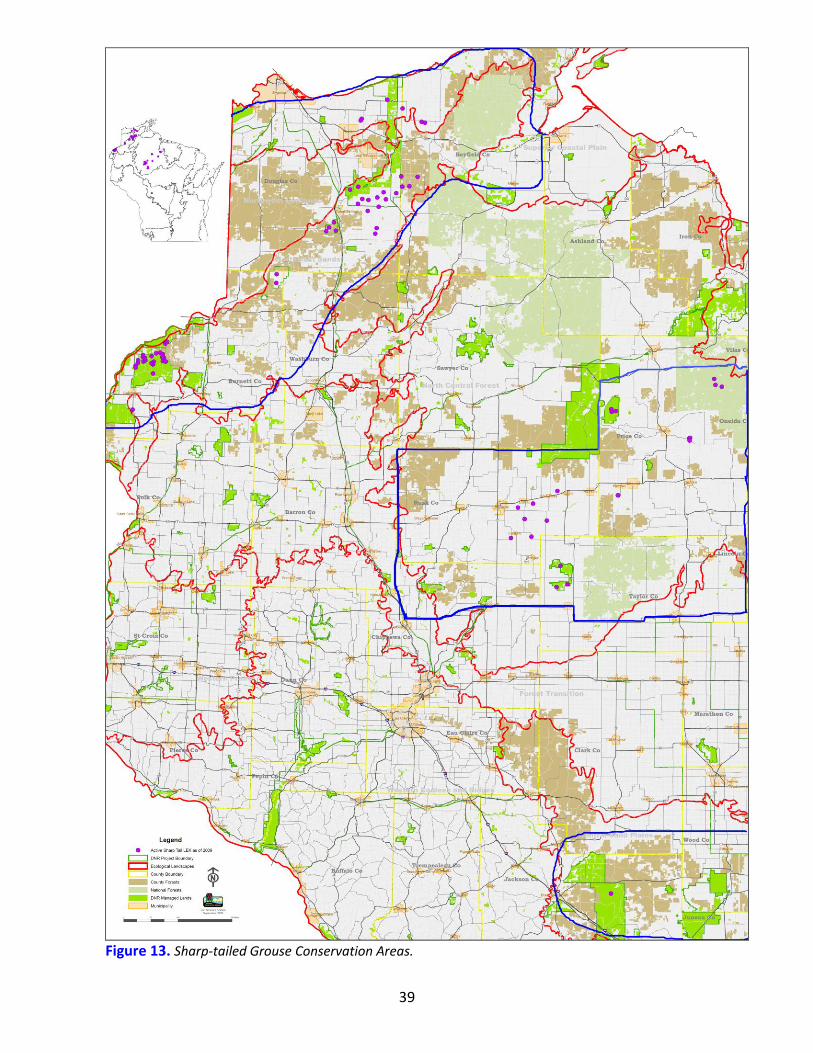
39
Figure 13. Sharp-tailed Grouse Conservation Areas.
40
C. Plan Approach
To ensure the highest probability of maintaining a viable sharp-tailed grouse population in Wisconsin that allows for regulated harvest and maintains Wisconsin’s genetic component, it is recommended that at least two primary Sharp-tailed Grouse Conservation Areas (STGR CA) surrounding core managed properties be maintained. Based on current information on confirmed distribution and presence of sharp-tailed grouse in Wisconsin, STGR CA1 and CA2 have been chosen as the conservation areas and landscapes to receive priority management actions for this plan. These conservation areas were chosen because they encompass over 90% of the current sharp-tailed grouse population and range and comprise the majority of the current genetic diversity in the population. Additional Sharp-tailed Grouse Conservation Areas could be added pending additional population and habitat data collected during the plan implementation process (see issues section below). Within the context of the above outlined plan approach, each Sharp-tailed Grouse Conservation Area will have area-wide and property-specific goals and actions to help direct implementation. This approach was chosen because it was the most likely to minimize the risk of statewide extirpation and maintain as much genetic diversity as possible by working within the stronghold of the current confirmed distribution of sharp-tailed grouse within the state. A number of additional alternatives (Appendix D), including working in only one landscape, were considered but ultimately rejected because the relative risks of statewide extirpation and cost were higher than the chosen alternative.
D. Issues, Goals and Recommended Actions for Plan Implementation Below are a series of issues, goals, actions, and expected outcomes that will be used to guide this plan for the next 10 years. This section and the work described in it will serve as the foundation for the management plan and will guide management and research for the duration of the plan. The following goals and recommended actions are presented within the context of the Conservation Issues and Threats identified in Part I.
1. Habitat Availability & Management
1.1 Issue: Habitat availability is limited, remaining habitat patches are small and fragmented, land use patterns and landscape composition are changing, continued suppression of natural wildfires, and land conversion or succession are proving to be significant long-term threats. These issues vary by ecological landscape and include the conversion of barrens and jack pine forests to red pine plantations in the Northwest Sands Ecological Landscape, or forestation/succession, small-scale farming, and management for aspen/hardwood stands in the North Central Forest Ecological Landscape.
Goal: Develop a habitat management implementation strategy that will achieve the plan goal of ensuring a viable population of sharp-tailed grouse within the state. Action: Establish Sharp-tailed Grouse Conservation Areas, develop STGR CA implementation plans and associated habitat acreage goals, develop a habitat model/corridor plan starting in
41
the NW Sands, and develop habitat goals based on projected population goals needed to sustain a viable population Expected Outcome: The utility of habitat modeling and habitat corridor analysis will be creating a predictive model based on historic lek count information and data available on landscape-scale changes in disturbances (e.g., fire, pest/disease outbreaks) and land use changes (e.g., agriculture, development). Using these data will help managers better predict the likelihood of occurrence of sharp-tailed grouse on the landscape and preferred habitat configurations. In turn, managers will be better equipped on how and where best to manage for sharp-tailed grouse. Further, specific details of a habitat implementation plan such as configuration and amount of habitat will be developed for use in land acquisition, habitat management, land use planning and partnering efforts.
1.2 Issue: Effectiveness of habitat management practices for sharp-tailed grouse on core
properties.
Goal: Evaluate habitat management practices on core managed properties and establish guidelines for best management practices for sharp-tailed grouse and other open landscape-dependent species. Action: Evaluate hen reproduction and survival in relation to management regimes at Crex Meadows and Namekagon Barrens Wildlife Areas (see Appendix E). Assess past and present lek attendance by dancing males on core managed properties. Expected Outcome: Adjust management practices and activities as needed based on outcome of study and review of current literature and expert opinion.
1.3 Issue: Large-scale management activities have been shown to positively impact sharp-tailed
grouse (higher reproductive success and survival) in newly created habitats.
Goal: Develop specific components of the habitat implementation plan (see issue 1.1) that incorporate non-managed properties. Action: Identify opportunities and partners within each of the proposed sharp-tailed grouse conservation areas to develop a shifting mosaic of open habitats (often referred to as “rolling barrens” in the Northwest Sands Ecological Landscape) and focus additional efforts on managing lands outside of core properties. Develop a management cost:benefit analysis as part of a Population Viability Analysis that can be used to make management decisions that will maximize population growth and minimize management costs. Expected Outcome: Strategies for landscape-scale habitat management and maximization of population growth with cooperating partners as key players in implementation.
1.4 Issue: Unoccupied but suitable habitat may exist for sharp-tailed grouse in Wisconsin.
Goal: Identify and evaluate unoccupied but potentially suitable habitat.

42
Action: Develop a habitat model that identifies suitable but currently unoccupied habitat throughout the state. Further develop criteria for establishing populations outside current range and conduct a feasibility study for translocation outside current range. Expected Outcome: Establish a priority list of possible translocation sites and criteria for initiating translocation activities.
1.5 Issue: Populations in northeast Minnesota may be dispersing into northwestern Wisconsin populations and vice versa. Goal: Determine if dispersal is occurring, identify dispersal corridors, and facilitate dispersal of birds among MN and WI. Action: Seek a partnership with MN DNR to determine interstate movement of birds, identify movement corridors, and facilitate movement of birds between states via land management and partnerships with local land owners. Expected Outcome: Effective dispersal among populations could decrease the need for genetic rescue.
1.6 Issue: Secured funding for habitat management in the long-term is nonexistent.
Goal: Secure dedicated funding for sharp-tailed grouse management. Action: Habitat goals derived in the habitat feasibility study will determine the amount of funding needed for habitat management and land acquisition.
Expected Outcome: Availability of adequate funding for approved habitat management and acquisition projects. Funding would provide standardized habitat management practices for sharp-tailed grouse populations while land acquisition would increase acreage of core properties and creation of habitat corridors, thus helping to ensure viability of the species over many years.
2. Population Viability & Genetic Status
2.1 Issue: Statewide populations have experienced long-term, range-wide declines. Existing sharp-tailed grouse population consists of at least two and possibly three distinct metapopulations with several small and isolated subpopulations that have high levels of inbreeding and compromised genetic diversity.
Goal: Stabilize long-term population and increase genetic diversity on and outside core managed properties. Action 2.1a: Conduct genetic rescue (see protocol, Appendix C) from Douglas County properties to Pershing Wildlife Area and Riley Lake Wildlife Management Area (USFS). As of 2011, Year 2 of genetic rescue is nearing completion. In 2010, a total of 18 hens were translocated from Douglas County properties to Pershing Wildlife Area. To date, 10 additional hens have been translocated in 2011. Following translocation, genetic analysis
43
using eggshell fragments from nesting hens will be used to measure changes in allelic diversity and levels of inbreeding. Action 2.1b: Conduct a research study within the Northwest Sharp-tailed Grouse Conservation Area (STGR CA1 – specifically, Crex Meadows and Namekagon Barrens Wildlife Areas) to investigate causes of population declines (see research proposal, Appendix B). As of 2011, both male and female sharp-tailed grouse have been trapped and radioed on each property. Birds will be monitored for nest success (hens), habitat use, daily and seasonal movements, and survival. To date, there are four radioed birds at Crex Meadows and 18 radioed birds at Namekagon Barrens. Action 2.1c: Secure wings collected by Hamerstrom in the 1950s and submit for genetic analysis. Compare genetic diversity of birds from the mid-1950s with modern genetic samples analyzed by Dr. Brad Swanson, CMU, to identify the presence and timeline of a genetic bottleneck.
Expected Outcome: Stabilization of current population declines by 2015. Decrease inbreeding levels at release site locations 10% and increase allelic diversity 10% by 2015. Expand intrastate genetic rescue to other properties within the current range depending on the success of the program at Pershing and Riley Lake. The schedule of genetic rescue via translocation to other properties may be accelerated pending results of further genetic analysis and evidence suggesting continued genetic degradation. Interstate translocation (i.e., demographic rescue) using western Minnesota birds may be considered if it is determined there is a more immediate need to stabilize population numbers. Determining when and if a genetic bottleneck occurred will help determine how degraded the current genetic makeup is compared to a historically more contiguous population. This information can be incorporated into a Population Viability Analysis (PVA) Model to determine the relative probability of statewide extirpation risks and future management actions. In the short-term, this information can guide future genetic rescue efforts.
2.2 Issue: Population information is inadequate in some areas of the state, including the Central STGR CA, northern Wisconsin (public and private lands) and northeast Wisconsin (Spread Eagle Barrens).
Goal: Verify population status in these landscapes. Action: Formally survey the Central Sand Plains Ecological Landscape and Spread Eagle Barrens area in 2010. Expected Outcome: Implement action on additional sharp-tailed grouse conservation areas using the latest population survey information.
2.3 Issue: Current statewide population size is insufficient to sustain a viable population.
Goal: Determine minimum viable population size and estimate persistence of meta-populations under various scenarios utilizing a Population Viability Analysis (PVA).
44
Action: Develop and review preliminary population targets, conduct a range wide PVA that incorporates genetic and habitat data, and conduct a cost:benefit analysis of specific management strategies and actions. Interim population and genetic targets:
o Northwest Sharp-tailed Grouse Conservation Area
By 2015, increase average subpopulation size at known dancing grounds as measured by lek attendance by 10% above 2009 levels.
No short-term genetic goal available unless translocation is implemented. o North Central Sharp-tailed Grouse Conservation Area
By 2015, increase average subpopulation size at known dancing grounds as measured by lek attendance by 10% above 2009 levels.
By 2015, decrease inbreeding levels at translocation release site locations by 10% of existing level and increase allelic diversity 10%.
o Central Sharp-tailed Grouse Conservation Area
Goals unknown at this time due to insufficient population information. o Potential Future Sharp-tailed Grouse Conservation Areas
Currently unoccupied but within the historical range; goals will be adapted once sufficient population information is gathered.
Long-term population goals:
Increase lek attendance 30% by 2025 compared to 2009 levels.
Increase allelic diversity and decrease inbreeding levels by 25% over 2009 levels through genetic translocation and habitat development by 2025.
Expected Outcome: Refine population goals for conservation areas and properties as necessary to meet plan goal of maintaining a statewide viable population.
3. Surveys & Research
3.1 Issue: Current statewide survey effort has insufficient coverage to know the full extent of existing population range and size.
Goal: Revise and standardize current survey protocol. Continue monitoring at known lek locations in the state. Expand survey efforts on both public and private lands to identify new lek locations and evaluate their importance to the overall statewide population within the state. Make additional survey efforts in areas not previously or recently covered but with recent evidence of sharp-tailed grouse presence. Action 3.1a: Continue with the annual expanded statewide survey effort, making improvements and adopting new methods (e.g., playback calls) where necessary. Monitor the statewide population trend, implement quality control measures, and evaluate and implement new survey methods and techniques to increase efficiency and reliability of annual survey. Action 3.1b: Formally survey the Central Sand Plains Ecological Landscape (STGR CA3), northern Wisconsin public and private lands, and Spread Eagle Barrens area in an effort to confirm presence of a sharp-tailed grouse subpopulation.
45
Expected Outcome: Efforts will result in a more complete picture of the status and distribution of sharp-tailed grouse populations in Wisconsin. Surveys at Spread Eagle Barrens conducted in 2010 yielded no sharp-tailed grouse observations.
4. Harvest & Recreational Opportunities
4.1 Issue: Harvest mortality may be additive and therefore could negatively impact success of genetic translocation on key properties.
Goal: Determine impacts of harvest mortality. Action 4.1a: Continue using a tightly regulated harvest permit system but evaluate:
a tiered permit system that allows for an overall quota per landscape or conservation areas with smaller quotas per managed property, and
a fixed quota system with initiated changes based on population trends over a pre-determined time period.
Action 4.1b: Establish a harvest quota of zero in genetic translocation release sites for a minimum of three years post-release. Action 4.1c: Evaluate the impact of harvest mortality as part of the Crex/Namekagon Barrens Research Study. Expected Outcome: Current harvest mortality rates will be available to further refine harvest frameworks.
4.2 Issue: Harvest is under-reported based on a comparison between voluntary harvest registration and voluntary hunter surveys. There is a need to acknowledge incidental or unreported harvest.
Goal: Estimate harvest reporting rate and actual harvest rates. Action 4.2a: Require the registration of harvested sharp-tailed grouse through changes to the administrative code and implementation of an automated process (e.g., phone-in or online system). Accurate harvest information is needed to properly manage the population and to set future harvest quotas and permits. Action 4.2b: Continue annual hunter survey. Expected Outcome: Harvest rates and hunter success will be available to further refine harvest frameworks. Accurate harvest information will assist in properly managing the population, therefore allowing for responsible harvest quotas and permits.
46
5. Disease, Predation & Interspecific Competition
5.1 Issue: Disease and parasites may be limiting individual fitness which in turn could negatively impact local populations. Goal: Determine presence and/or impacts of disease and/or parasites on sharp-tailed grouse populations at both the statewide and metapopulation levels. Action: Conduct baseline disease surveillance as part of the Crex/Namekagon research study and Douglas County/Pershing genetic rescue projects. Consider the presence of diseases or parasites and subsequent effects on individual fitness and reproduction). Expected Outcome: Baseline sharp-tailed grouse health data will become available for the first time for the Wisconsin population. If results of health screening indicate the presence of disease or parasites that are suspected to be impacting local or regional populations then the development of a disease mitigation plan for sharp-tailed grouse will be undertaken in conjunction with WDNR and partner wildlife health experts.
5.2 Issue: Ring-necked pheasants are interfering with lek breeding activity at some properties and may be interfering with nesting through either brood or nest parasitism. Goal: Verify type and degree of ring-necked pheasant interference. Action: Investigate as part of the Crex/Namekagon research study. Expected Outcome: Interference rates are necessary to design possible mitigation efforts. If dancing ground interference or nest parasitism is documented, then local pheasant removal methods may be warranted.
6. Other Limiting Factors
6.1 Issue: Future climate change in Wisconsin could have direct and indirect negative impacts
on sharp-tailed grouse populations in turn reducing the probability of maintaining a viable population in the state.
Goal: Understand the potential impacts of future climate change on sharp-tailed grouse and their habitats and develop adaptation and/or mitigation strategies for addressing said impacts. Action: Develop a Bayesian Network Model in collaboration with UW-Madison climate change scientists. The goal is to develop models of the direct and indirect impacts of climate change to identify: 1) key influences on the survival and reproduction of species and 2) adaptation and management opportunities to reduce the impacts of different stressors, including climate change Expected Outcome: Identification of sharp-tailed grouse vulnerabilities to climate change in Wisconsin and adaptation strategies that can be incorporated into property and landscape level management plans. The results of this work will be available in 2012.
47
6.2 Issue: Invasive plant species may be negatively impacting some aspect(s) of sharp-tailed
grouse population growth.
Goal: Understand the possible impact of invasive plant species on sharp-tailed grouse habitat use and reproduction. Action: Investigate presence and distribution of invasive plant species as part of the Crex Meadows research study. Expected Outcome: Implementation of invasive species control measures as needed, consistent with WDNR and other agency recommendations.
6.3 Issue: Education about sharp-tailed grouse identification and their habits and habitat use
(e.g., barrens/open habitat) is limited and not available for general public consumption.
Goal: Increase awareness and knowledge of sharp-tailed grouse and their habitat requirements. Action: Develop Upland Bird identification pamphlet, sharp-tailed grouse pamphlet, ID poster, etc.
48
III. Literature Cited
Aldrich, J.W. 1963. Geographic orientation of American Tetraonidae. J. Wildl. Manage. 27:529–545.
Ammann, G. A. 1957. The prairie grouse of Michigan. Michigan Department of Conservation Game Division Technical Bulletin, Lansing, U.S.A.
Ammann, G. A. 1963. Status and management of Sharp-tailed Grouse in Michigan. J. Wildl. Manage. 27:802-809
Arnold, T. W. 1988. Life histories of North American game birds: a reanalysis. Canadian Journal of Zoology 66:1906-1912.
Artmann, J. W. 1971. Capturing sharp-tailed grouse hens by using taped chick distress calls. The Journal of Wildlife Management 35(3):557-559.
Baydack, R. K. 1988. Characteristics of sharp-tailed grouse, Tympanuchus phasianellus, leks in the parklands of Manitoba. Canadian Field-Naturalist 102(1):39-44.
Bellinger, M. R., J. A. Johnson, J. E. Toepfer, and P. O. Dunn. 2003. Loss of genetic variation in greater prairie chickens following a population bottleneck in Wisconsin, U.S.A. Conservation Biology 17(3):717-724.
Berg, W. E. 1997. The sharp-tailed grouse in Minnesota. Minnesota Wildlife Report 10, Department of Natural Resources, Saint Paul, U.S.A.
Berger, R. P., and R. K. Baydack. 1992. Effects of aspen succession on sharp-tailed grouse, Tympanuchus phasianellus, in the Interlake Region of Manitoba. Canadian Field-Naturalist 106:185-191.
Bergerud, A. T., and M. W. Gratson, editors. 1988. Adaptive Strategies and Population Ecology of Northern Grouse. University of Minnesota Press, Minneapolis, U.S.A.
Bouzat, J., L., P. Dunn, S. Haig, J. A. Johnson, S. Oyler-McCance, B. L. Sloss, and B. J. Swanson. 2005a. Conservation Genetics Plan For The Management And Recovery Of Greater Prairie-Chickens In Wisconsin. Unpublished report.
Bouzat, J., L., P. Dunn, S. Haig, J. A. Johnson, S. Oyler-McCance, B. L. Sloss, and B. J. Swanson. 2005b. Addendum to Conservation Genetics Plan For The Management And Recovery Of Greater Prairie-Chickens In Wisconsin. Unpublished report.
Bouzat, J. L., J. A. Johnson, J. E. Toepfer, S. A. Simpson, T. L. Esker, and R. L. Westemeier. 2009. Beyond the beneficial effects of translocations as an effective tool for the genetic restoration of isolated populations. Conservation Genetics 10:191-201
Connelly, J. W., M. W. Gratson, and K. P. Reese. 1998. Sharp-tailed grouse. In A. Poole, P. Stettenheim, and F. Gill, editors. The Birds of North America, No. 36. The Academy of Natural Sciences: Philadelphia; The American Ornithologists’ Union: Washington, D.C. U.S.A.
Connolly, T. T. 2001. Reproductive ecology of sharp-tailed grouse in the pine barrens of northwestern Wisconsin. M. S. Thesis, University of Wisconsin, Stevens Point, U.S.A.
Curtis, J. T. 1959. The Vegetation of Wisconsin: An Ordination of Plant Communities. University of Wisconsin Press, Madison, U.S.A.
Drummer, T. D., R. G. Corace III, and S. J. Sjogren. 2001. Sharp-tailed grouse lek attendance and fidelity in Upper Michigan. Journal of Wildlife Management 75(2):311-318.
49
Eckstein, R., and B. Moss. 1995. Oak and pine barrens communities. Pages 98-113 in J. Addis, editor. Wisconsin’s biodiversity as a management issue: a report to DNR managers. Wisconsin Department of Natural Resources, Madison, U.S.A.
Evrard, J. O., J. E. Hoefler, and P. A. Kooiker. 2000. The history of sharp-tailed grouse in the Crex Meadows Wildlife Area. Passenger Pigeon 62(2):175-183.
Fagan, W. F., and E. E. Holmes. 2006. Quantifying the extinction vortex. Ecology Letters 9:51-60.
Fandel, S. G. 2009. 2009 Wisconsin Sharp-tailed Grouse Status Report. Wisconsin Department of Natural Resources (WDNR). Madison, WI.
Giesen, K. M. 1987. Population characteristics and habitat use by Columbian sharp-tailed grouse in northwest Colorado. Pages 251-279 in Colorado Division of Wildlife, P-R Report W-152-R, Denver, U.S.A.
Gilpin, M. E., and Soulé, M. E. 1986. Minimum viable populations: processes of species extinction. Pages 19-34 in M. E. Soulé, editor. Conservation Biology: The Science of Scarcity and Diversity. Sinauer & Associates, Sunderland, MA, U.S.A.
Gordon, D. R., J. D. Parrish, D. W. Salzer, T. H. Tear, and B. Pace-Aldana. 2005. The Nature Conservancy’s Approach to Measuring BiodiversityStatus and the Effectiveness of Conservation Strategies. In Principles of Conservation Biology, 3rd Edition. Groom, MJ., G.K. Meffe, and R.C. Carroll, eds.Sinauer Press: Sunderland, MA
Grange, W. B. 1948. Wisconsin grouse problems. Publication 328, A-1948. Wisconsin Conservation Department, Madison, U.S.A.
Gratson, M. W. 1983. Habitat, mobility, and social patterns of sharp-tailed grouse in Wisconsin. M. S. Thesis. University of Wisconsin, Stevens Point, U.S.A. 91 pp.
Gratson, M. W. 1988. Spatial patterns, movement, and cover selection by sharp-tailed grouse. Pages 158-192 in A. T. Bergerud and M. W. Gratson, editors. Adaptive Strategies and Population Ecology of Northern Grouse. University of Minnesota Press, Minneapolis, U.S.A.
Gratson, M. W., G. K. Gratson and A. T. Bergerud. 1991. Male dominance and copulation disruption do not explain variance in male mating success on Sharp-tailed Grouse (Tympanuchus phasianellus) leks. Behaviour 118: 187–213.
Gregg, L. E. 1987. Recommendations for a program of sharptail habitat preservation in Wisconsin. Research Report No. 141, Wisconsin Department of Natural Resources, Madison, U.S.A.
Gregg, L. E. 1990. Harvest rates of sharp-tailed grouse on managed areas in Wisconsin. Research Report No. 152, Wisconsin Department of Natural Resources, Madison, U.S.A.
Gregg, L. E., and N. D. Niemuth. 2000. The history, status, and future of sharp-tailed grouse in Wisconsin. Passenger Pigeon 62(2):159-174.
Hamerstrom, F. N., and F. Hamerstrom. 1951. Mobility of the sharp-tailed grouse in relation to its ecology and distribution. American Midland Naturalist 46:174-226.
Hamerstrom Jr., F. N. 1963. Sharptail brood habitat in Wisconsin’s northern pine barrens. Journal of Wildlife Management 27(4):793-802.
Hart, C. M., O. S. Lee, and J. B. Low. 1950. The Sharp-tailed Grouse in Utah: its life history, status and management. Publication 3, Utah Department of Fish & Game, Salt Lake City, U.S.A.
50
Hillman, C. N., and W. W. Jackson. 1973. The sharp-tailed grouse in South Dakota. Technical Bulletin 3, South Dakota Department of Game, Fish, and Parks, Pierre, U.S.A.
Howes, A. L., M. Maron, and C. A. AcAlpine. 2010. Bayesian networks and adaptive management of wildlife habitat. Conservation Biology 24(4): 974-983.
Johnsgard, P. A. 1983. The grouse of the world. University of Nebraska Press, Lincoln, U.S.A.
Kobriger, G. D. 1965. Movements, habitats, and foods of prairie grouse on a sandhills refuge. Journal of Wildlife Management 29(4):788-800.
Lande, R., Engen, S. & Saether, B-E. (2003). Stochastic Population Dynamics in Ecology and Conservation. Oxford University Press,Oxford, UK.
Landel, H. 1989. A study of female and male mating behavior and female mate choice in the Sharp- tailed Grouse, Tympanuchus phasianellus jamesi. Ph.D. diss., Purdue Univ., West Lafayette, IN. Sexton, D. A. 1979. Off-lek copulation in Sharp-tailed Grouse. Wilson Bull. 91: 150–151.
Lorimer, C. G. 2001. Historical and ecological roles of disturbance in eastern North American forests: 9,000 years of change. Wildlife Society Bulletin 29(2):425-439.
Maples, T. E., and G. J. Soulliere. 1996. Status of Michigan sharp-tailed grouse in the 1990’s. Report No. 3256, Wildlife Division, Michigan Department of Natural Resources, Lansing, Michigan.
Mossman, M. J., and D. W. Sample. 1990. Birds of Wisconsin sedge meadows. Passenger Pigeon 52(1):38-55.
Mossman, M. J., E. Epstein, and R. M. Hoffman. 1991. Birds of Wisconsin pine and oak barrens. Passenger Pigeon 53:247-253.
Natural Resources Conservation Service (NRCS). 2007. Sharp-tailed Grouse (Tympanuchus phasianellus). Fish and Wildlife Habitat Management Leaflet Number 40.
Nero, R. W. 1976. Sharp-tailed grouse flight speed. Blue Jay 34:2.
Niemi, G. J., and J. R. Probst. 1990. Wildlife and fire in the Upper Midwest. Pages 31-46 in J. M. Sweeney, editor. Management of Dynamic Ecosystems. North Central Section, The Wildlife Society, West Lafayette, Indiana, U.S.A.
Niemuth, N. D. 2006. Sharp-tailed Grouse (Tympanuchus phasianellus). In N. J. Cutright, B. R. Harriman, and R. W. Howe, editors. Atlas of the Breeding Birds of Wisconsin. University of Wisconsin Press, Madison, U.S.A.
Niemuth, N. D., and M. S. Boyce. 1998. Disturbance in Wisconsin pine barrens: implications for management. Transactions of the Wisconsin Academy of Sciences, Arts and Letters 86:167-176.
Niemuth, N. D., and M. S. Boyce. 2004. Influence of landscape composition on sharp-tailed grouse lek location and attendance in Wisconsin pine barrens. Ecoscience 11(2):209-217.
North American Bird Conservation Initiative, U.S. Committee, 2010. The State of the Birds 2010 Report on Climate Change, United States of America. U.S. Department of the Interior: Washington, DC.
Noss, R. 2001. Beyond Kyoto: forest management in a time of rapid climate change. Conservation Biology 15:578-590
Peterle, T. J. 1954. The sharp-tailed grouse in the upper peninsula of Michigan. PhD Dissertation. University of Michigan, Ann Arbor, U.S.A.
51
Probst, J. R., and T. R. Crow. 1991. Integrating biological diversity and resource management: an essential approach to productive, sustainable ecosystems. Journal of Forestry 89:12-17.
Rippen, A. B., and D. A. Boag. 1974. Spatial organization among Sharp-tailed Grouse on arenas. Canadian Journal of Zoology 52:591-597.
Robbins Jr., S. D. 1991. Wisconsin Birdlife: Population and Distribution, Past and Present. University of Wisconsin Press, Madison, U.S.A.
Robel, R. J., F. R. Henderson, and W. Jackson. 1972. Some sharp-tailed grouse population statistics from South Dakota. Journal of Wildlife Management 36:87-98.
Sample, D., and M. Mossman. 1997. Managing habitat for grassland birds: a guide for Wisconsin. Publication SS-925-97, Wisconsin Department of Natural Resources, Madison, U.S.A.
Sample, D.W. and M.J. Mossman. 2008. Two centuries of changes in grassland bird populations and their habitats in Wisconsin. Pp. 301-329 in D.M. Waller and T.P. Rooney, eds. The vanishing present: Wisconsin's changing lands, waters, and wildlife. University of Chicago Press, Chicago. 507 pp.
Sauer, J. R., J. E. Hines, and J. Fallon. 2005. The North American Breeding Bird Survey, Results and Analysis 1966–2004, version 2005.2. U.S. Geological Survey Patuxent Wildlife Research Center, Laurel, Maryland. [Online.] Available at www.mbr-pwrc.usgs.gov/bbs/bbs.html.
Schorger, A. W. 1943. Remains of the Wild Turkey in Wisconsin. The Wilson Bulletin 55(1):54.
Schroeder, M. A. 1994. Movement and habitat use of sage grouse in north-central Washington. Progress Report, Washington Department of Fish and Wildlife, Olympia, U.S.A.
Schroeder, M. A. 1994. Productivity and habitat use of Columbian sharp-tailed grouse in north-central Washington. Progress Report, Washington Department of Fish and Wildlife, Yakima, U.S.A.
Sexton, D. A. 1979. Off-lek copulation in Sharp-tailed Grouse. Wilson Bull. 91: 150–151.
Sharp, W. M. 1957. Social and range dominance in gallinaceous birds – pheasants and prairie grouse. Journal of Wildlife Management 21(2):242-244.
Sjogren, S. J., and R. G. Corace III. 2006. Conservation Assessment for Sharp-tailed Grouse (Tympanuchus phasianellus) in the Great Lakes Region. USDA Forest Service, Eastern Region.
Soulé, M. E., and L. S. Mills. 1998. No need to isolate genetics. Science 282:1658-1659.
Temple, S. A. 1992. Population viability analysis of a Sharp-tailed Grouse metapopulation in Wisconsin. Pages 750-758 in D. R. McCullough and R. H. Barrett, editors. Wildlife 2001: Populations. Elsevier Press, London.
Temple, S. A., J. R. Cary, and R. E. Rolley. 1997. Wisconsin birds: a seasonal and geographical guide, 2nd edition. University of Wisconsin Press, Madison, U.S.A. 320 pp.
Toepfer, J. E. 2003. Prairie chickens and grasslands: 2000 and beyond. Society of Tympanuchus Cupido Pinnatus, Ltd., Elm Grove, Wisconsin, USA.
Ulliman, M. J. 1995. Winter habitat ecology of Columbian sharp-tailed grouse in southeastern Idaho. Thesis, University of Idaho, Moscow, U.S.A.
Walk, J. W. 2004. A plan for the recovery of the Greater Prairie-chicken in Illinois. University of Illinois and Illinois Department of Natural Resources Office of Resource Conservation, Springfield, U.S.A.
52
Westemeier, R. L., et al. 1998. Tracking the long-term decline and recovery of an isolated population. Science 282(5394):1695-1698.
Wisconsin Initiative on Climate Change Impacts (WICCI). 2011. Wisconsin's Changing Climate: Impacts and Adaptation. Nelson Institute for Environmental Studies, University of Wisconsin-Madison and the Wisconsin Department of Natural Resources, Madison, Wisconsin.
Wisconsin Department of Natural Resources (WDNR). 1997. Sharp-tailed Grouse Management Plan. Madison, WI.
Wisconsin Department of Natural Resources (WDNR). 2005. Wisconsin’s strategy for wildlife Species of Greatest Conservation Need. Madison, WI. [Online] Available at http://www.dnr.state.wi.us/org/LAND/er/wwap/
Wisconsin All-Bird Conservation Plan. 2007. Sharp-tailed Grouse (Tympanuchus phasianellus) Species Account. K. Kreitinger and A. Paulios, editors. Wisconsin Department of Natural Resources (WDNR). Madison, WI. [Online] Available at http://www.wisconsinbirds.org/Plan/species/stgr.htm
Wisconsin Department of Natural Resources (WDNR). In prep. DRAFT Ecological Landscapes of Wisconsin. State of Wisconsin Department of Natural Resources, Handbook. 1805.1 Madison, WI.
53
Appendix A – Plan Alternatives
The management plan subcommittee identified a series of Sharp-tailed Grouse Conservation Area alternatives described below. These options assume no acute landscape scale changes that would lead to a population irruption (e.g. large forest fires or pest outbreaks and associated timber harvest). Alternatives 1-5 assume significant management activity is needed and can be accomplished on lands other than core properties (e.g. county forests, industrial forests, private lands). This habitat management activity is needed to facilitate dispersal among core properties. 1. Recommended Approach - Alternative 1: Create 2 STGR Conservation Areas
STGR CA1 – Northwest Sands and Superior Coastal Plains Areas STGR CA2 – North Central Forest Area
a. Genetic Rescue/Translocation needed: YES b. Rationale: To ensure the highest probability of maintaining a viable sharp-tailed grouse population
in Wisconsin that allows for limited harvest and maintains Wisconsin’s genetic component, the management plan group recommends that we should establish at least 2 primary sharp-tailed grouse conservation areas surrounding our core managed properties. Genetic rescue is also needed to stabilize genetic diversity and decrease inbreeding, especially in the North Central Forest Area. The Central Sand Plains metapopulation is excluded here because of an extremely low population and low amount of suitable habitat (but with a high potential for suitable habitat in the future).
c. Projected outcome: Lowest risk of statewide extirpation among alternatives. d. Costs: High
2. Alternative 2: Create 3 STGR Conservation Areas STGR CA1 – Northwest Sands and Superior Coastal Plains Areas STGR CA2 – North Central Forest Area STGR CA3 – Central Sand Plains Area
a. Genetic Rescue/Translocation needed: YES b. Rationale: This option maintains all 3 sharp-tailed grouse metapopulations within the current range.
This option also assumes that the proposed population assessment at Dike 17, Wood County Wildlife Area, and Meadow Valley Wildlife Area would document a demographically sustainable population in the short-term. Genetic rescue would still be needed in the Central Sand Plains Area.
c. Projected outcome: Risk of statewide extirpation is similar to that described in Alternative 1. d. Costs: Higher than Alternative 1.
3. Alternative 3 - Create 3 Sharp-tailed Grouse Conservation Areas and attempt to establish populations outside current range through transplantation. a. Genetic Rescue/Translocation needed: YES b. Rationale: This is the most comprehensive strategy of the alternatives presented. c. Projected outcome: Similar extirpation risk as Alternatives 1 and 2; possible dilution of resources for
translocation (funding, staffing) could diminish efforts and success in core of current range. Probability of successfully establishing a population outside of current range is low due to unsuitability of habitat, future land use changes, and ring-necked pheasant interference. The number of birds (estimated to be in the hundreds) needed to create a self-sustaining population would not be available within Wisconsin. If an interstate source of birds were available, likely MN, they would best be used for genetic rescue in the core range instead of for the establishment of new populations.
d. Costs: Highest of all alternatives
54
4. Alternative 4 - Create 1 Sharp-tailed Grouse Conservation Area, discontinue management activity
elsewhere STGR CA1 – Northwest Sands and Superior Coastal Plain Areas
a. Genetic Rescue/Translocation needed: YES b. Rationale: This alternative presumes that we are unable afford to work in at least 2 sharp-tailed
grouse conservation areas simultaneously. Work to preserve sharp-tailed grouse in the state would focus on what has recently been the most stable core population. Opportunities for additional barrens management here are high and supported by a wide variety of partners. Public land ownership is high in this area.
c. Projected outcome: Stability of core population could change rapidly similar to what we are currently seeing at Crex Meadows. Genetic rescue is needed to improve the genetic quality of this metapopulation. Extirpation risk would be greater than in Alternatives 1-3.
d. Costs: High, but less expensive than Alternatives 1-3. 5. Alternative 5 - Create 1 Sharp-tailed Grouse Conservation Area, discontinue management activity
elsewhere STGR CA2 – North Central Forest Area
a. Genetic Rescue/Translocation needed: YES b. Rationale: This alternative assumes that we can’t afford to work in at least 2 sharp-tailed grouse
conservation areas simultaneously. We would choose to work in this area because of recent instability in the core metapopulation in the NW Sands area. The NC Forest metapopulation is anchored by 2 core properties owned and managed by WDNR and USFS, both of which are fully committed to sharp-tailed grouse management. However, additional and critical dancing grounds exist on non-managed properties and future management activities would need to rely on private lands.
c. Projected outcome: Extirpation risk would be greater than the preferred alternative. Genetic diversity among this metapopulation is low and inbreeding is high. Genetic rescue is needed to improve the genetic quality of this metapopulation. Extirpation risk is higher than Alternatives 1-4.
d. Costs: High 6. Alternative 6 - Status quo (active management on core wildlife areas and USFS properties; continued
regulated harvest, little private lands emphasis, no genetic rescue). a. Rationale: Attempt to preserve or maintain current metapopulation structure with no additional
management cost to current budget. b. Projected outcome: Eventual extirpation from state, diminished harvest opportunities. c. Costs: Moderate, primarily due to continued public land management.
7. Alternative 7 - Discontinue management (active management for sharp-tailed grouse is discontinued; continued regulated harvest). a. Rationale: Sharp-tailed Grouse have exhibited a steep population decline and range contraction in
Wisconsin, exhibit high levels of inbreeding and low levels of genetic diversity, and offer limited recreational opportunities to Wisconsin citizens. Further, Wisconsin is on the edge of the national sharp-tailed grouse range and contributes little to the overall population. Management costs are high and probability for a turnaround is low.
b. Projected outcome: Declining population, contracting range, dwindling harvest opportunities, likely extirpation.
c. Costs: Low
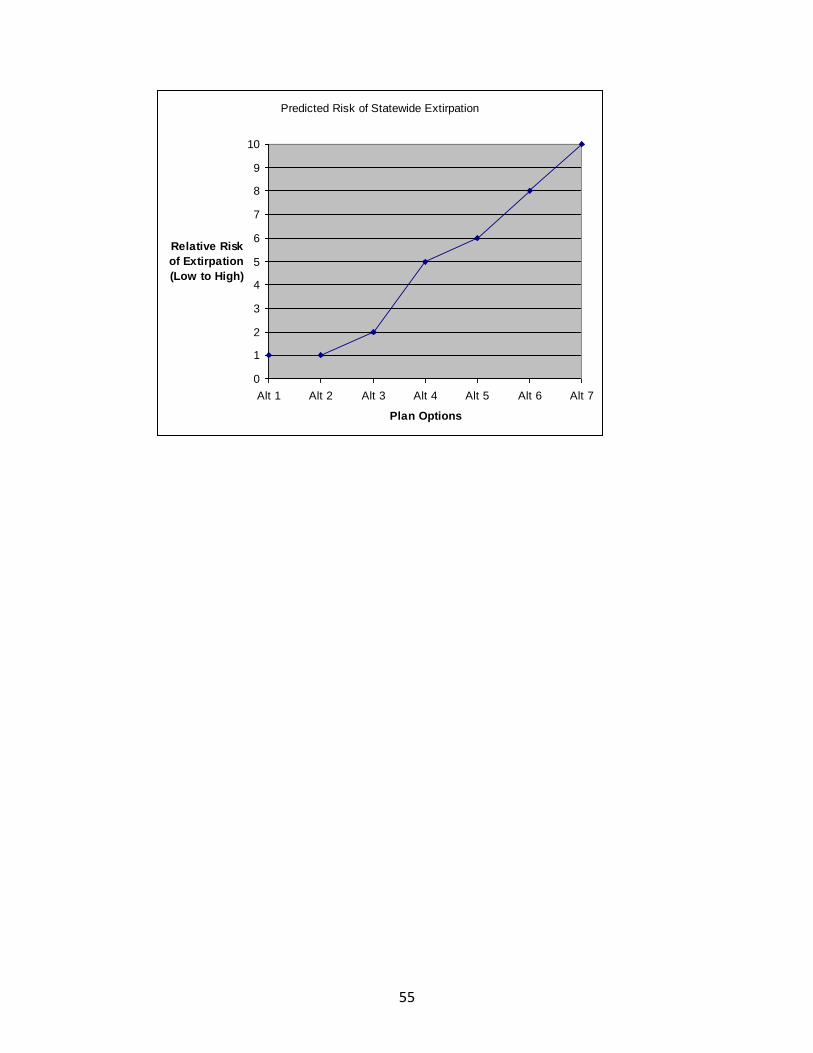
55
Predicted Risk of Statewide Extirpation
0
1
2
3
4
5
6
7
8
9
10
Alt 1 Alt 2 Alt 3 Alt 4 Alt 5 Alt 6 Alt 7
Plan Options
Relative Risk
of Extirpation
(Low to High)
56
Appendix B – Crex Meadows/Namekagon Barrens Research Project
Crex Meadows – Namekagon Barrens Research Project Background Sharp-tailed grouse lek counts at Crex Meadows have declined since the late 1990’s. The cause of the decline is unknown, but the decline has biologists very concerned about the long-term implications for the statewide population. A number of causes for the decline have been raised including disease, ring-necked pheasant interference, habitat management, and habitat connectivity (dispersal ability). Further, genetic analysis suggests that most Wisconsin populations have low genetic diversity and high levels of inbreeding compared to other contiguous populations in adjacent states. Therefore, we propose to investigate sharp-tailed grouse reproduction and survival at Crex Meadows Wildlife Area and Namekagon Barrens Wildlife Area in the Northwest Sands Ecological Landscape to address the long-term declines. We will also investigate the possible role of disease, habitat management treatments, genetic diversity, and inbreeding and dispersal barriers on the observed long-term decline. Research Objectives
1. Collect blood and tissue samples of sharp-tailed grouse at Crex Meadows and Namekagon Barrens to evaluate possible disease issues that could be contributing to recent population declines. - COMPLETED
2. Collect DNA samples from sharp-tailed grouse to assess possible acute changes in genetic diversity and inbreeding compared to 2001-2003 DNA samples. - COMPLETED
3. Radio-mark sharp-tailed grouse hens at Crex Meadows Wildlife Area and Namekagon Barrens to assess reproduction, nest parasitism by ring-necked pheasants, and survival under different habitat management regimes. – IN PROGRESS
4. Develop a habitat conservation corridor plan for managed properties in the Northwest Sands Ecological Landscape that will benefit sharp-tailed grouse as well as other Species of Greatest Conservation Need (State Wildlife Grant requirement). – IN PROGRESS
5. Conduct Population Viability Analysis for statewide population.
Approach – Methods & Monitoring Timeline 2010-2012 Research will be conducted by WDNR Northern Region Wildlife Management staff and UW-Madison beginning in 2010. Hens will be captured on both Crex Meadows and Namekagon Barrens Wildlife Areas. All birds captured will be bled and banded for health screening and genetic analysis. Hens additionally will be fitted with radio transmitters. Field technicians will monitor movements and nest success of radioed hens and conduct vegetative sampling. Following first field season, there will be an assessment of genetic analysis and reproductive data. Supplemental trapping at Crex and Namekagon will occur in spring of 2011, if needed. Monitoring of all radioed hens will continue in 2011. Meanwhile, UW-Madison post-doc will develop a habitat corridor plan and PVA.
Goals To investigate the decline in sharp-tailed grouse lek counts by evaluating the impacts of disease, ring-necked pheasant interference, habitat management, habitat connectivity, and genetic diversity on local reproductive success and survival at two managed properties in the Northwest Sands Ecological Landscape (Crex Meadows Wildlife Area and Namekagon Barrens Wildlife Area).
57
Appendix C – Intrastate Genetic Rescue Plan
Intrastate Genetic Rescue Plan
Recommendations The management plan group recommends that intrastate genetic rescue begin in spring 2010 to prevent further loss of rare Wisconsin sharp-tailed grouse alleles and to minimize the effects of inbreeding, especially in the North Central Forest metapopulation. Although there is no known direct link between recent population declines and low genetic diversity, the loss of key alleles could occur as early as within the next 1-2 sharp-tailed grouse generations, or 2-6 years (B. Swanson pers. comm.). Further, inbreeding depression and the low frequency of certain alleles are sufficient to warrant translocation for genetic rescue purposes. The management plan working group recognizes that current habitat availability and suitability is a limiting factor and that the long-term implementation of a “habitat plan” (e.g., Bouzat et al. 2009) is both necessary and critical for the conservation of sharp-tailed grouse in Wisconsin. However, genetic rescue essentially provides more time to for managers to effectively link local populations by creating additional habitat and corridors within each meta-population to promote dispersal and gene flow.
Approach Intrastate translocation will be conducted by WDNR Northern Region Wildlife Management staff (Lake Superior and Upper Chippewa work units) beginning in spring 2010. Hens will be captured on non-managed lands in DMU2 (portions of Bayfield and Douglas counties) and translocated to Pershing Wildlife Area in 2010 and 2011 and the Riley Lake Unit of the Chequamegon-Nicolet National Forest starting in 2011. These properties were selected for receiving hens because they have the lowest genetic diversity and highest levels of inbreeding among Wisconsin’s local populations. In particular, Pershing also had the highest number of unique alleles, and was therefore given highest priority. The goal is for each property to receive 30-40 birds over two years. USFS staff will also assist in genetic rescue and monitoring pending the approval of an MOU between the two agencies.
Methods & Monitoring Trapping at Douglas County properties by WDNR staff would occur on dancing grounds during the peak of activity in the spring of 2010 and 2011 for translocation to Pershing. Each hen captured would be banded and blood samples drawn for genetic analysis. Hens would be moved to release locations the same spring instead of following the more conventional summer release (Toepfer 2003). Gene flow will be monitored at each of the release sites by collecting shed feathers on dancing grounds and by selective trapping and blood sampling of birds. Because the genetic structure of each bird arriving at the release site will be known, we will be able to track gene flow into the existing population using DNA analysis techniques, post-release.
Translocation goals
Translocate 30-40 hens from properties in Douglas County to Pershing Wildlife Area in 2010 and 2011 – IN PROGRESS
Translocate 30-40 hens from properties in Douglas County to Riley Lake Wildlife Management Area (USFS) in 2012 and 2013.
Maintain current genetic diversity within the statewide global population and prevent further loss of alleles.
Increase genetic diversity (allelic diversity) within local subpopulations 10% by 2015.
Decrease inbreeding (Fst) 10% by 2015.
58
Future considerations Intrastate genetic rescue could be expanded to other properties within the current range depending on the success of the program at Pershing and Riley Lake. The schedule of genetic rescue via translocation to other properties may be accelerated pending an investigation of a specific link between acute population declines and genetic degradation. Interstate translocation for demographic rescue using western Minnesota birds may be considered if we determine a more immediate need to stabilize population numbers. However, interstate translocation is considerably more expensive than intrastate efforts because of the need to equip hens with radio-transmitters and follow the summer translocation protocol, as well as considerable coordination and staff time required by involved partnering agencies and organizations. Other Considerations (interstate translocation) Either Minnesota sharp-tailed grouse population (East or West) would be appropriate if intrastate genetic rescue is needed. The eastern Minnesota population is slightly more similar to the Wisconsin population and thus may be a more appropriate population. It has significantly higher heterozygosity and allelic diversity than any of the Wisconsin populations. It also has as many, or more, unique alleles than 75% (n=6 of 8) of the Wisconsin populations. However, the eastern Minnesota population also appears to exhibit some genetic stresses. The inbreeding found in the eastern Minnesota population is similar to that found in many of the Wisconsin populations. This, taken in conjunction with the small difference in the FST
values (Table 4), suggests that the western Minnesota Sharp-tailed Grouse population may produce a quicker genetic recovery if translocated into the Wisconsin population.
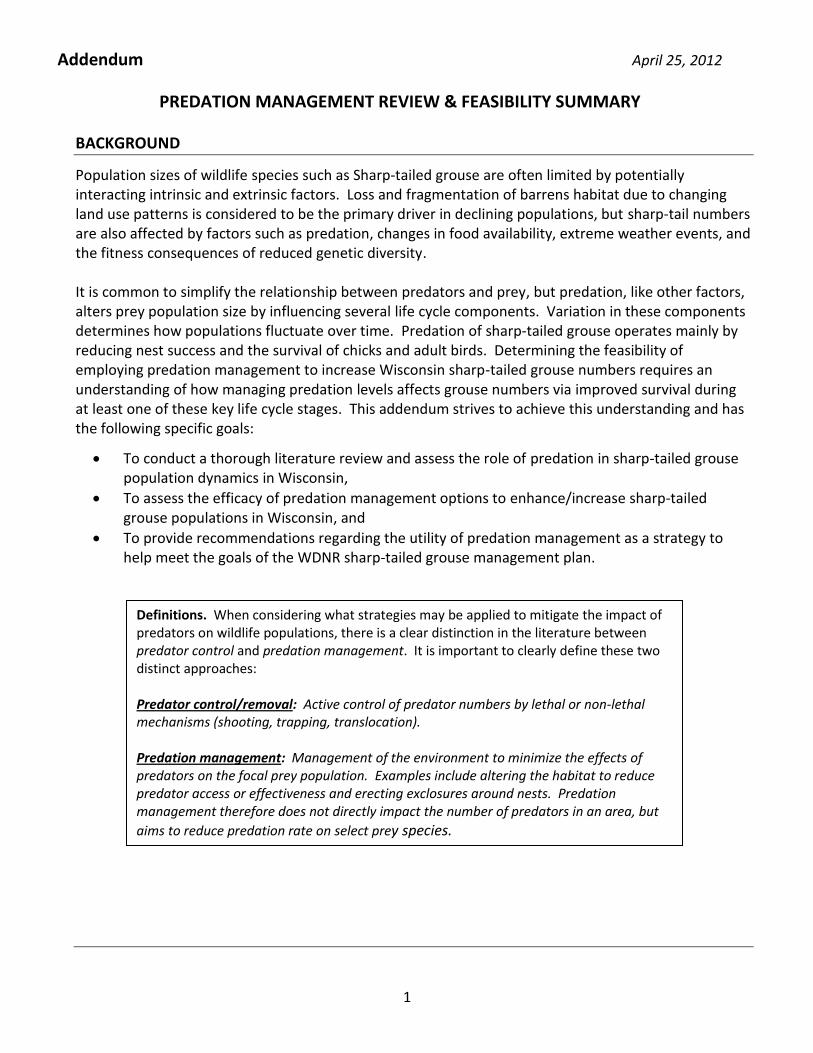
1
Addendum April 25, 2012
PREDATION MANAGEMENT REVIEW & FEASIBILITY SUMMARY
BACKGROUND
Population sizes of wildlife species such as Sharp-tailed grouse are often limited by potentially interacting intrinsic and extrinsic factors. Loss and fragmentation of barrens habitat due to changing land use patterns is considered to be the primary driver in declining populations, but sharp-tail numbers are also affected by factors such as predation, changes in food availability, extreme weather events, and the fitness consequences of reduced genetic diversity. It is common to simplify the relationship between predators and prey, but predation, like other factors, alters prey population size by influencing several life cycle components. Variation in these components determines how populations fluctuate over time. Predation of sharp-tailed grouse operates mainly by reducing nest success and the survival of chicks and adult birds. Determining the feasibility of employing predation management to increase Wisconsin sharp-tailed grouse numbers requires an understanding of how managing predation levels affects grouse numbers via improved survival during at least one of these key life cycle stages. This addendum strives to achieve this understanding and has the following specific goals:
To conduct a thorough literature review and assess the role of predation in sharp-tailed grouse population dynamics in Wisconsin,
To assess the efficacy of predation management options to enhance/increase sharp-tailed grouse populations in Wisconsin, and
To provide recommendations regarding the utility of predation management as a strategy to help meet the goals of the WDNR sharp-tailed grouse management plan.
Definitions. When considering what strategies may be applied to mitigate the impact of predators on wildlife populations, there is a clear distinction in the literature between predator control and predation management. It is important to clearly define these two distinct approaches: Predator control/removal: Active control of predator numbers by lethal or non-lethal mechanisms (shooting, trapping, translocation). Predation management: Management of the environment to minimize the effects of predators on the focal prey population. Examples include altering the habitat to reduce predator access or effectiveness and erecting exclosures around nests. Predation management therefore does not directly impact the number of predators in an area, but
aims to reduce predation rate on select prey species.
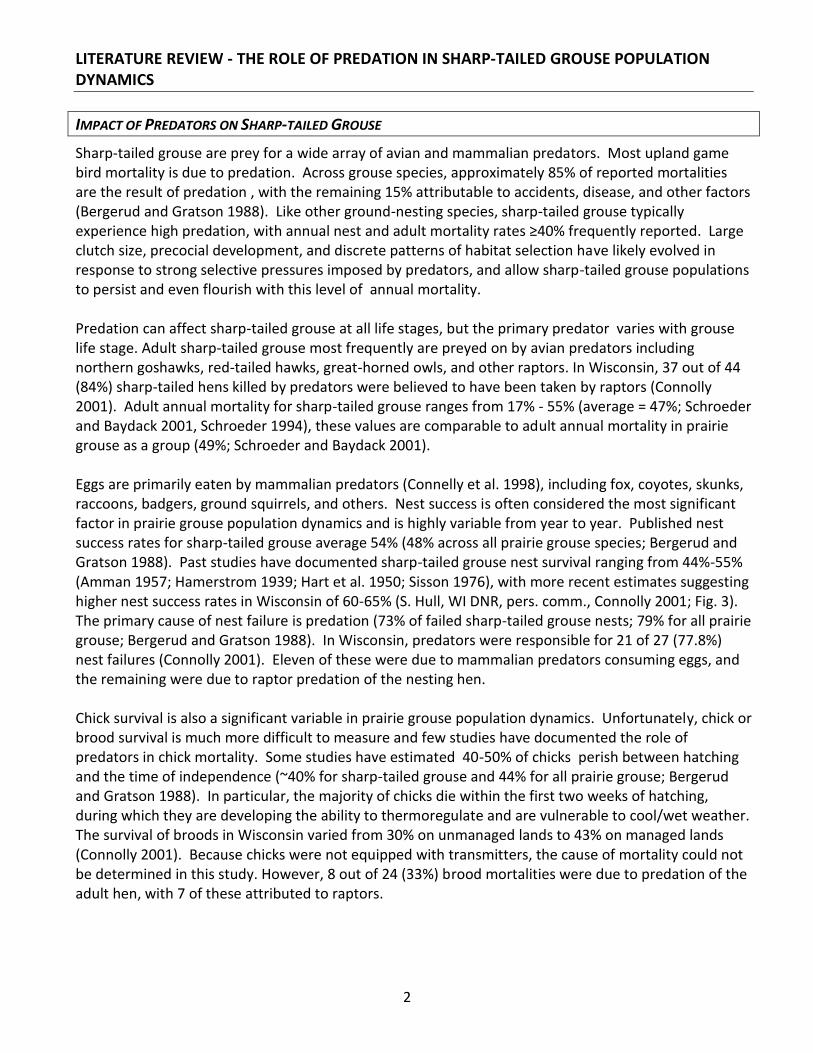
2
LITERATURE REVIEW - THE ROLE OF PREDATION IN SHARP-TAILED GROUSE POPULATION DYNAMICS
IMPACT OF PREDATORS ON SHARP-TAILED GROUSE
Sharp-tailed grouse are prey for a wide array of avian and mammalian predators. Most upland game bird mortality is due to predation. Across grouse species, approximately 85% of reported mortalities are the result of predation , with the remaining 15% attributable to accidents, disease, and other factors (Bergerud and Gratson 1988). Like other ground-nesting species, sharp-tailed grouse typically experience high predation, with annual nest and adult mortality rates ≥40% frequently reported. Large clutch size, precocial development, and discrete patterns of habitat selection have likely evolved in response to strong selective pressures imposed by predators, and allow sharp-tailed grouse populations to persist and even flourish with this level of annual mortality. Predation can affect sharp-tailed grouse at all life stages, but the primary predator varies with grouse life stage. Adult sharp-tailed grouse most frequently are preyed on by avian predators including northern goshawks, red-tailed hawks, great-horned owls, and other raptors. In Wisconsin, 37 out of 44 (84%) sharp-tailed hens killed by predators were believed to have been taken by raptors (Connolly 2001). Adult annual mortality for sharp-tailed grouse ranges from 17% - 55% (average = 47%; Schroeder and Baydack 2001, Schroeder 1994), these values are comparable to adult annual mortality in prairie grouse as a group (49%; Schroeder and Baydack 2001). Eggs are primarily eaten by mammalian predators (Connelly et al. 1998), including fox, coyotes, skunks, raccoons, badgers, ground squirrels, and others. Nest success is often considered the most significant factor in prairie grouse population dynamics and is highly variable from year to year. Published nest success rates for sharp-tailed grouse average 54% (48% across all prairie grouse species; Bergerud and Gratson 1988). Past studies have documented sharp-tailed grouse nest survival ranging from 44%-55% (Amman 1957; Hamerstrom 1939; Hart et al. 1950; Sisson 1976), with more recent estimates suggesting higher nest success rates in Wisconsin of 60-65% (S. Hull, WI DNR, pers. comm., Connolly 2001; Fig. 3). The primary cause of nest failure is predation (73% of failed sharp-tailed grouse nests; 79% for all prairie grouse; Bergerud and Gratson 1988). In Wisconsin, predators were responsible for 21 of 27 (77.8%) nest failures (Connolly 2001). Eleven of these were due to mammalian predators consuming eggs, and the remaining were due to raptor predation of the nesting hen. Chick survival is also a significant variable in prairie grouse population dynamics. Unfortunately, chick or brood survival is much more difficult to measure and few studies have documented the role of predators in chick mortality. Some studies have estimated 40-50% of chicks perish between hatching and the time of independence (~40% for sharp-tailed grouse and 44% for all prairie grouse; Bergerud and Gratson 1988). In particular, the majority of chicks die within the first two weeks of hatching, during which they are developing the ability to thermoregulate and are vulnerable to cool/wet weather. The survival of broods in Wisconsin varied from 30% on unmanaged lands to 43% on managed lands (Connolly 2001). Because chicks were not equipped with transmitters, the cause of mortality could not be determined in this study. However, 8 out of 24 (33%) brood mortalities were due to predation of the adult hen, with 7 of these attributed to raptors.
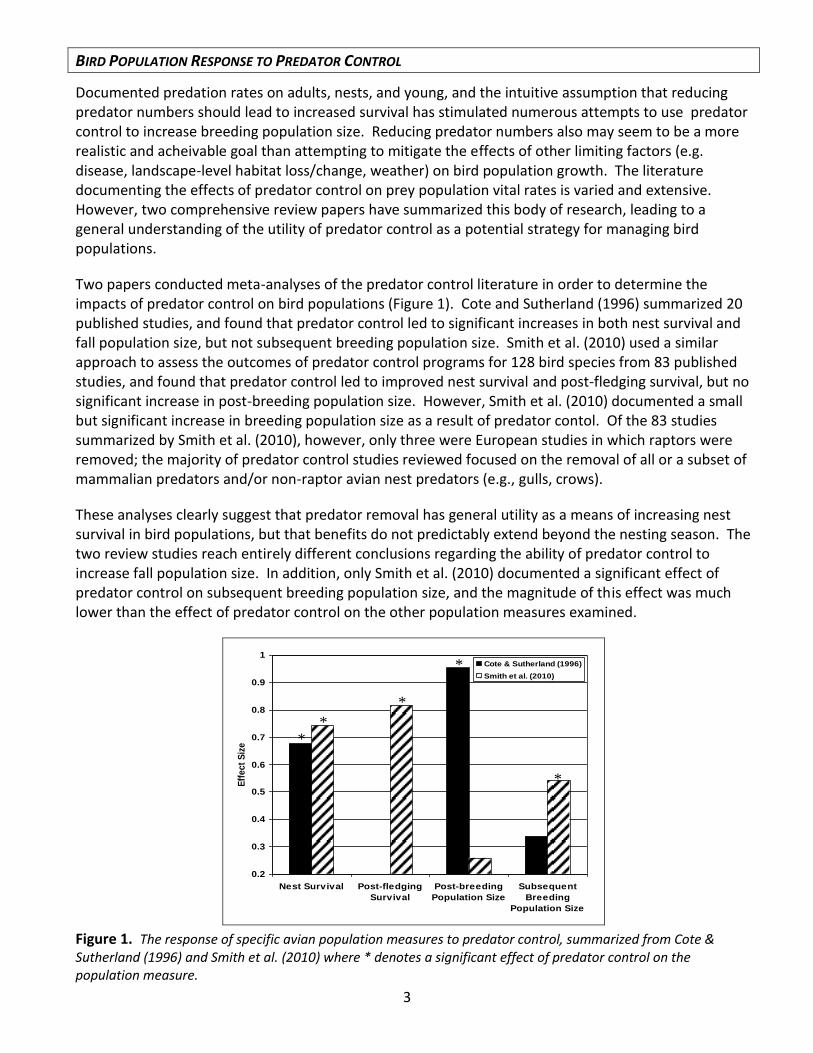
3
BIRD POPULATION RESPONSE TO PREDATOR CONTROL
Documented predation rates on adults, nests, and young, and the intuitive assumption that reducing predator numbers should lead to increased survival has stimulated numerous attempts to use predator control to increase breeding population size. Reducing predator numbers also may seem to be a more realistic and acheivable goal than attempting to mitigate the effects of other limiting factors (e.g. disease, landscape-level habitat loss/change, weather) on bird population growth. The literature documenting the effects of predator control on prey population vital rates is varied and extensive. However, two comprehensive review papers have summarized this body of research, leading to a general understanding of the utility of predator control as a potential strategy for managing bird populations.
Two papers conducted meta-analyses of the predator control literature in order to determine the impacts of predator control on bird populations (Figure 1). Cote and Sutherland (1996) summarized 20 published studies, and found that predator control led to significant increases in both nest survival and fall population size, but not subsequent breeding population size. Smith et al. (2010) used a similar approach to assess the outcomes of predator control programs for 128 bird species from 83 published studies, and found that predator control led to improved nest survival and post-fledging survival, but no significant increase in post-breeding population size. However, Smith et al. (2010) documented a small but significant increase in breeding population size as a result of predator contol. Of the 83 studies summarized by Smith et al. (2010), however, only three were European studies in which raptors were removed; the majority of predator control studies reviewed focused on the removal of all or a subset of mammalian predators and/or non-raptor avian nest predators (e.g., gulls, crows).
These analyses clearly suggest that predator removal has general utility as a means of increasing nest survival in bird populations, but that benefits do not predictably extend beyond the nesting season. The two review studies reach entirely different conclusions regarding the ability of predator control to increase fall population size. In addition, only Smith et al. (2010) documented a significant effect of predator control on subsequent breeding population size, and the magnitude of this effect was much lower than the effect of predator control on the other population measures examined.
0.2
0.3
0.4
0.5
0.6
0.7
0.8
0.9
1
Nest Survival Post-fledging
Survival
Post-breeding
Population Size
Subsequent
Breeding
Population Size
Eff
ec
t S
ize
Cote & Sutherland (1996)
Smith et al. (2010)
Figure 1. The response of specific avian population measures to predator control, summarized from Cote & Sutherland (1996) and Smith et al. (2010) where * denotes a significant effect of predator control on the population measure.
*
*
*
* *
4
UPLAND GAME BIRD RESPONSES TO PREDATOR CONTROL
Our assessment of the utility of predator control to benefit sharp-tailed grouse in Wisconsin also involved a more specific review of the available predator control literature pertaining to upland game birds. Predator control has not received much attention as a management tool for prairie grouse species, but it has been more commonly employed with other upland game birds. Results from individual studies were varied and equivocal. Overall, predator control has not been supported as a prudent technique when the goal is to increase upland game bird numbers despite frequent reports of increased nest survival.
Sharp-tailed Grouse. Only one study previously evaluated the effect of predator control on sharp-tailed grouse populations. Wiens (2007) monitored sharp-tailed grouse and shorebird nests on seven 36 mi2 study areas in North Dakota where mammalian predators had been removed and four control areas with no predator removal. Professional trappers were used and financial incentives offered to maintain high removal rates of predators, yet nest survival for sharp-tailed grouse and shorebirds was the same between predator removal and control areas.
Attwater’s Prairie Chicken. The Attwater’s prairie-chicken (Tumpanuchus cupido attwateri) is a critically-endangered subspecies of the greater prairie-chicken, with a population of fewer than 100 individuals persisting on small isolated grasslands in coastal Texas. The National Fish and Wildlife Foundation used logic modeling to evaluate which conservation strategies and activities (including predator control) would be most likely to yield a secure prairie chicken population. Predator control was ranked as the lowest priority option. Strategies that addressed habitat and genetic concerns were most likely to be effective (National Fish & Wildlife Foundation 2008).
Wild Turkey. Predator control has been used successfully to increase nest survival and poult production in wild turkey populations (Beasom 1974; Speake 1980). However, there is little evidence that predation regulates or limits turkey populations. Indeed, turkey populations across North America have increased and expanded their range despite predation as the major mortality factor for all sex and age classes except adult gobblers (Hughes et al. 2009). Hughes et al. (2009) suggested that predator control is not a cost-effective or publicly-acceptable strategy for wild turkeys. Additionally, Speake (1980) noted that, even when successful, costly predator control programs are likely to only realize short-term benefits for turkeys. For example, Beasom (1974) noted rapid predator recolonization of their south Texas study area each year immediately following the cessation of predator removal activities.
Bobwhite Quail. Given the popularity of quail hunting and the recent nationwide decline in bobwhite quail, predator removal has been explored repeatedly as a management option. Intensive predator control in south Texas did not benefit local populations of either bobwhite or scaled quail (Guthery & Beasom 1977). In addition, Palmer et al. (2005) noted that predator removal in North Carolina led to increased numbers of quail only if done in conjunction with habitat improvements. Carroll et al. (2007) suggested that managers interested in producing quail focus on the management of predation via habitat manipulation and not the direct removal of predators because the latter was ineffective, compromised biodiversity, and had little public support.
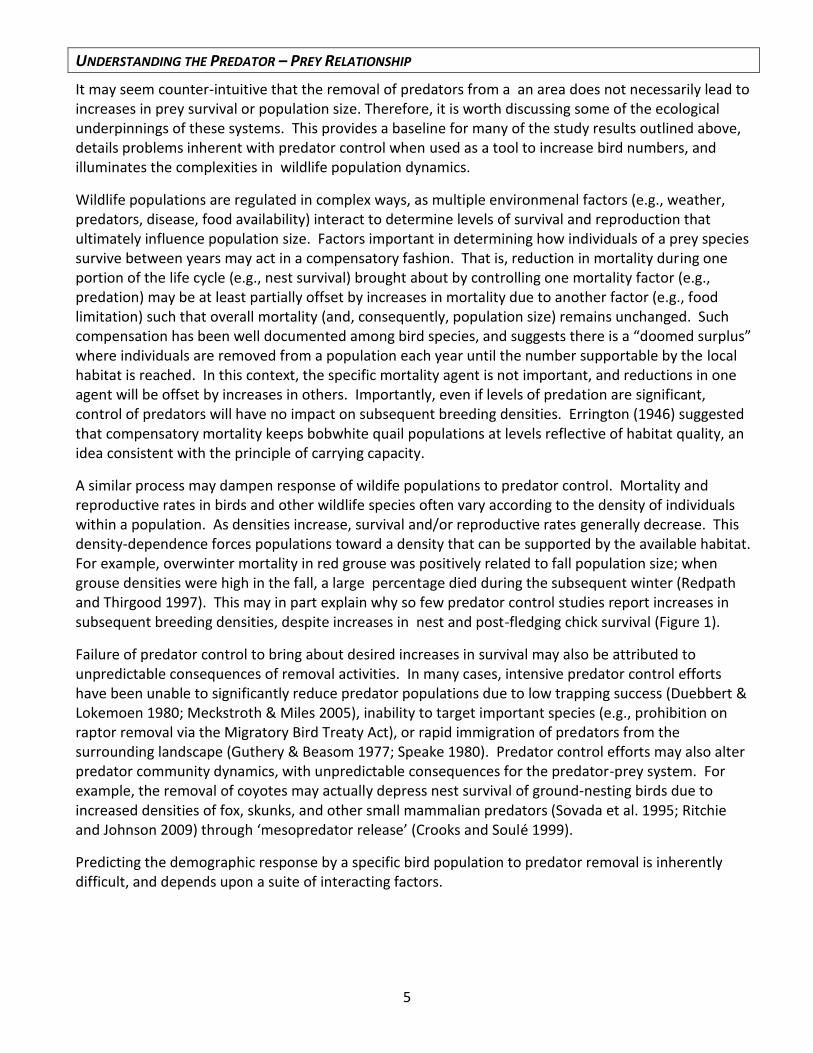
5
UNDERSTANDING THE PREDATOR – PREY RELATIONSHIP
It may seem counter-intuitive that the removal of predators from a an area does not necessarily lead to increases in prey survival or population size. Therefore, it is worth discussing some of the ecological underpinnings of these systems. This provides a baseline for many of the study results outlined above, details problems inherent with predator control when used as a tool to increase bird numbers, and illuminates the complexities in wildlife population dynamics.
Wildlife populations are regulated in complex ways, as multiple environmenal factors (e.g., weather, predators, disease, food availability) interact to determine levels of survival and reproduction that ultimately influence population size. Factors important in determining how individuals of a prey species survive between years may act in a compensatory fashion. That is, reduction in mortality during one portion of the life cycle (e.g., nest survival) brought about by controlling one mortality factor (e.g., predation) may be at least partially offset by increases in mortality due to another factor (e.g., food limitation) such that overall mortality (and, consequently, population size) remains unchanged. Such compensation has been well documented among bird species, and suggests there is a “doomed surplus” where individuals are removed from a population each year until the number supportable by the local habitat is reached. In this context, the specific mortality agent is not important, and reductions in one agent will be offset by increases in others. Importantly, even if levels of predation are significant, control of predators will have no impact on subsequent breeding densities. Errington (1946) suggested that compensatory mortality keeps bobwhite quail populations at levels reflective of habitat quality, an idea consistent with the principle of carrying capacity.
A similar process may dampen response of wildife populations to predator control. Mortality and reproductive rates in birds and other wildlife species often vary according to the density of individuals within a population. As densities increase, survival and/or reproductive rates generally decrease. This density-dependence forces populations toward a density that can be supported by the available habitat. For example, overwinter mortality in red grouse was positively related to fall population size; when grouse densities were high in the fall, a large percentage died during the subsequent winter (Redpath and Thirgood 1997). This may in part explain why so few predator control studies report increases in subsequent breeding densities, despite increases in nest and post-fledging chick survival (Figure 1).
Failure of predator control to bring about desired increases in survival may also be attributed to unpredictable consequences of removal activities. In many cases, intensive predator control efforts have been unable to significantly reduce predator populations due to low trapping success (Duebbert & Lokemoen 1980; Meckstroth & Miles 2005), inability to target important species (e.g., prohibition on raptor removal via the Migratory Bird Treaty Act), or rapid immigration of predators from the surrounding landscape (Guthery & Beasom 1977; Speake 1980). Predator control efforts may also alter predator community dynamics, with unpredictable consequences for the predator-prey system. For example, the removal of coyotes may actually depress nest survival of ground-nesting birds due to increased densities of fox, skunks, and other small mammalian predators (Sovada et al. 1995; Ritchie and Johnson 2009) through ‘mesopredator release’ (Crooks and Soulé 1999).
Predicting the demographic response by a specific bird population to predator removal is inherently difficult, and depends upon a suite of interacting factors.
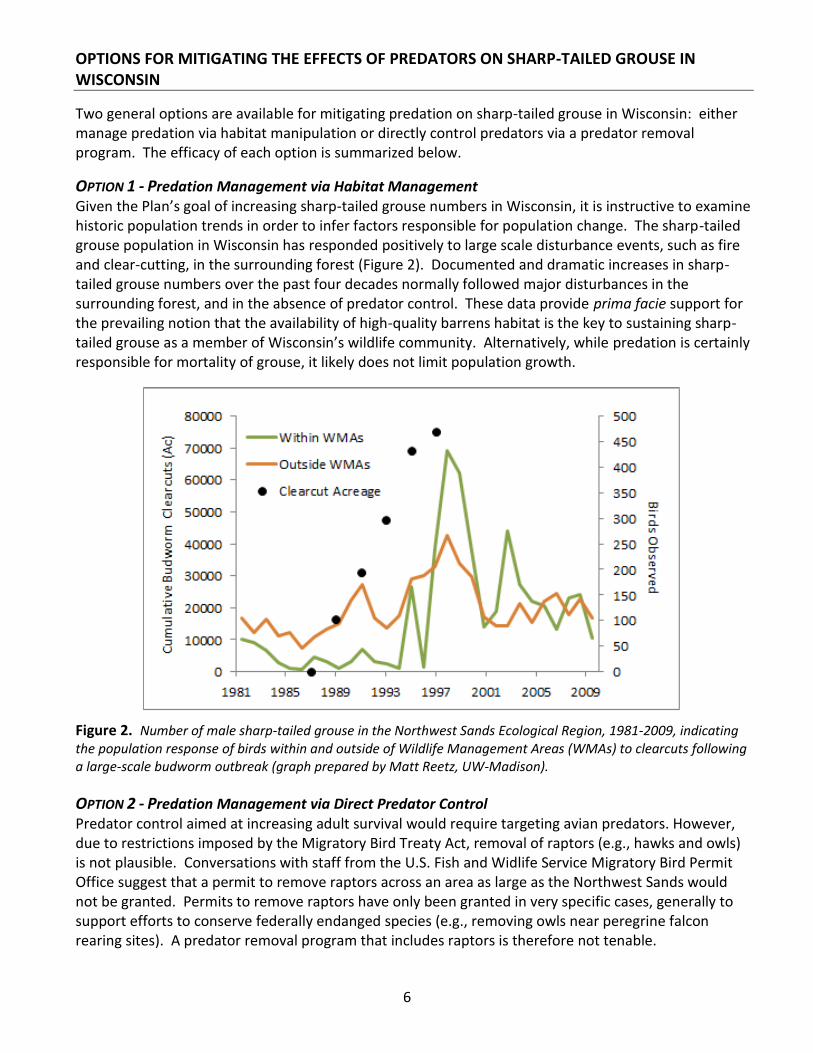
6
OPTIONS FOR MITIGATING THE EFFECTS OF PREDATORS ON SHARP-TAILED GROUSE IN WISCONSIN
Two general options are available for mitigating predation on sharp-tailed grouse in Wisconsin: either manage predation via habitat manipulation or directly control predators via a predator removal program. The efficacy of each option is summarized below.
OPTION 1 - Predation Management via Habitat Management Given the Plan’s goal of increasing sharp-tailed grouse numbers in Wisconsin, it is instructive to examine historic population trends in order to infer factors responsible for population change. The sharp-tailed grouse population in Wisconsin has responded positively to large scale disturbance events, such as fire and clear-cutting, in the surrounding forest (Figure 2). Documented and dramatic increases in sharp-tailed grouse numbers over the past four decades normally followed major disturbances in the surrounding forest, and in the absence of predator control. These data provide prima facie support for the prevailing notion that the availability of high-quality barrens habitat is the key to sustaining sharp-tailed grouse as a member of Wisconsin’s wildlife community. Alternatively, while predation is certainly responsible for mortality of grouse, it likely does not limit population growth.
Figure 2. Number of male sharp-tailed grouse in the Northwest Sands Ecological Region, 1981-2009, indicating the population response of birds within and outside of Wildlife Management Areas (WMAs) to clearcuts following a large-scale budworm outbreak (graph prepared by Matt Reetz, UW-Madison).
OPTION 2 - Predation Management via Direct Predator Control Predator control aimed at increasing adult survival would require targeting avian predators. However, due to restrictions imposed by the Migratory Bird Treaty Act, removal of raptors (e.g., hawks and owls) is not plausible. Conversations with staff from the U.S. Fish and Widlife Service Migratory Bird Permit Office suggest that a permit to remove raptors across an area as large as the Northwest Sands would not be granted. Permits to remove raptors have only been granted in very specific cases, generally to support efforts to conserve federally endanged species (e.g., removing owls near peregrine falcon rearing sites). A predator removal program that includes raptors is therefore not tenable.
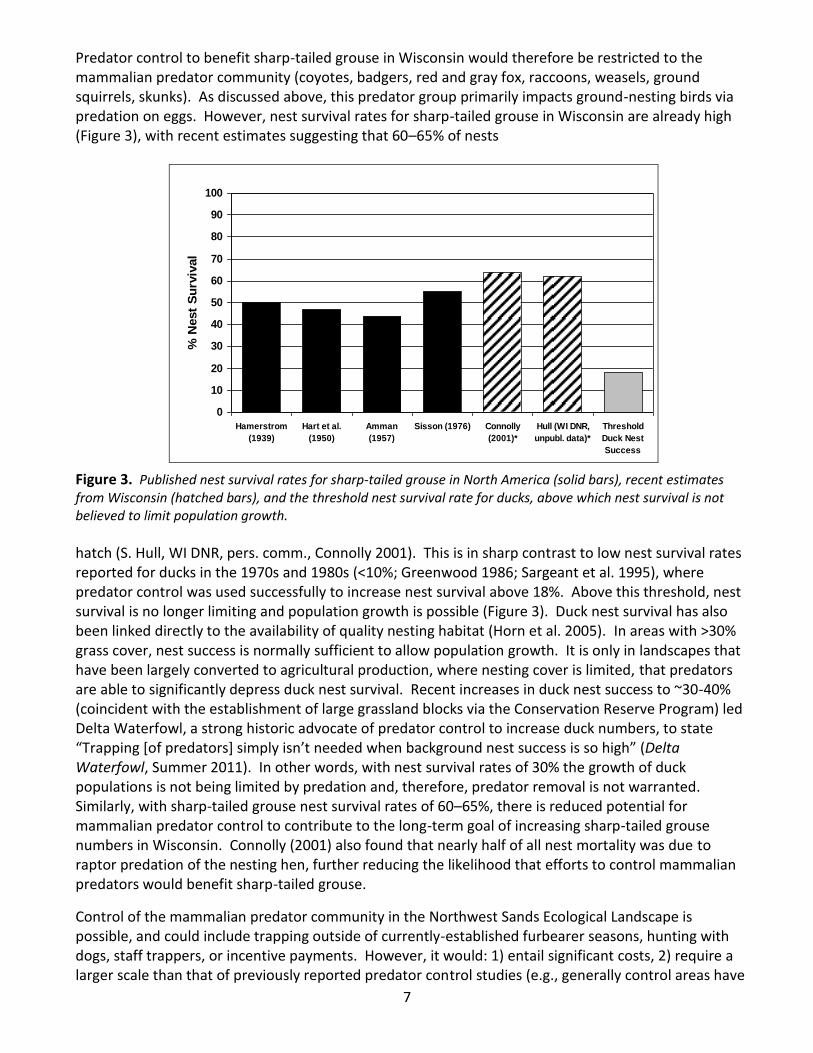
7
Predator control to benefit sharp-tailed grouse in Wisconsin would therefore be restricted to the mammalian predator community (coyotes, badgers, red and gray fox, raccoons, weasels, ground squirrels, skunks). As discussed above, this predator group primarily impacts ground-nesting birds via predation on eggs. However, nest survival rates for sharp-tailed grouse in Wisconsin are already high (Figure 3), with recent estimates suggesting that 60–65% of nests
0
10
20
30
40
50
60
70
80
90
100
Hamerstrom
(1939)
Hart et al.
(1950)
Amman
(1957)
Sisson (1976) Connolly
(2001)*
Hull (WI DNR,
unpubl. data)*
Threshold
Duck Nest
Success
% N
est
Su
rviv
al
Figure 3. Published nest survival rates for sharp-tailed grouse in North America (solid bars), recent estimates from Wisconsin (hatched bars), and the threshold nest survival rate for ducks, above which nest survival is not believed to limit population growth.
hatch (S. Hull, WI DNR, pers. comm., Connolly 2001). This is in sharp contrast to low nest survival rates reported for ducks in the 1970s and 1980s (<10%; Greenwood 1986; Sargeant et al. 1995), where predator control was used successfully to increase nest survival above 18%. Above this threshold, nest survival is no longer limiting and population growth is possible (Figure 3). Duck nest survival has also been linked directly to the availability of quality nesting habitat (Horn et al. 2005). In areas with >30% grass cover, nest success is normally sufficient to allow population growth. It is only in landscapes that have been largely converted to agricultural production, where nesting cover is limited, that predators are able to significantly depress duck nest survival. Recent increases in duck nest success to ~30-40% (coincident with the establishment of large grassland blocks via the Conservation Reserve Program) led Delta Waterfowl, a strong historic advocate of predator control to increase duck numbers, to state “Trapping [of predators] simply isn’t needed when background nest success is so high” (Delta Waterfowl, Summer 2011). In other words, with nest survival rates of 30% the growth of duck populations is not being limited by predation and, therefore, predator removal is not warranted. Similarly, with sharp-tailed grouse nest survival rates of 60–65%, there is reduced potential for mammalian predator control to contribute to the long-term goal of increasing sharp-tailed grouse numbers in Wisconsin. Connolly (2001) also found that nearly half of all nest mortality was due to raptor predation of the nesting hen, further reducing the likelihood that efforts to control mammalian predators would benefit sharp-tailed grouse.
Control of the mammalian predator community in the Northwest Sands Ecological Landscape is possible, and could include trapping outside of currently-established furbearer seasons, hunting with dogs, staff trappers, or incentive payments. However, it would: 1) entail significant costs, 2) require a larger scale than that of previously reported predator control studies (e.g., generally control areas have
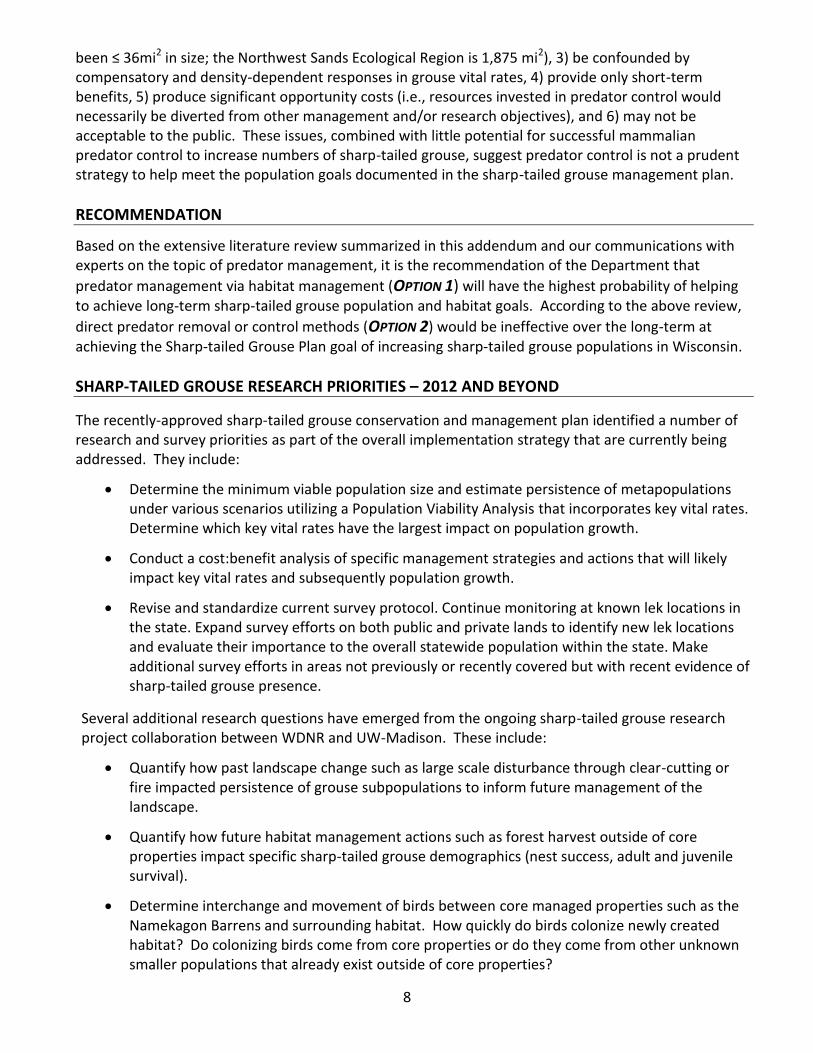
8
been ≤ 36mi2 in size; the Northwest Sands Ecological Region is 1,875 mi2), 3) be confounded by compensatory and density-dependent responses in grouse vital rates, 4) provide only short-term benefits, 5) produce significant opportunity costs (i.e., resources invested in predator control would necessarily be diverted from other management and/or research objectives), and 6) may not be acceptable to the public. These issues, combined with little potential for successful mammalian predator control to increase numbers of sharp-tailed grouse, suggest predator control is not a prudent strategy to help meet the population goals documented in the sharp-tailed grouse management plan.
RECOMMENDATION
Based on the extensive literature review summarized in this addendum and our communications with experts on the topic of predator management, it is the recommendation of the Department that
predator management via habitat management (OPTION 1) will have the highest probability of helping to achieve long-term sharp-tailed grouse population and habitat goals. According to the above review,
direct predator removal or control methods (OPTION 2) would be ineffective over the long-term at achieving the Sharp-tailed Grouse Plan goal of increasing sharp-tailed grouse populations in Wisconsin.
SHARP-TAILED GROUSE RESEARCH PRIORITIES – 2012 AND BEYOND
The recently-approved sharp-tailed grouse conservation and management plan identified a number of research and survey priorities as part of the overall implementation strategy that are currently being addressed. They include:
Determine the minimum viable population size and estimate persistence of metapopulations under various scenarios utilizing a Population Viability Analysis that incorporates key vital rates. Determine which key vital rates have the largest impact on population growth.
Conduct a cost:benefit analysis of specific management strategies and actions that will likely impact key vital rates and subsequently population growth.
Revise and standardize current survey protocol. Continue monitoring at known lek locations in the state. Expand survey efforts on both public and private lands to identify new lek locations and evaluate their importance to the overall statewide population within the state. Make additional survey efforts in areas not previously or recently covered but with recent evidence of sharp‐tailed grouse presence.
Several additional research questions have emerged from the ongoing sharp-tailed grouse research project collaboration between WDNR and UW-Madison. These include:
Quantify how past landscape change such as large scale disturbance through clear-cutting or fire impacted persistence of grouse subpopulations to inform future management of the landscape.
Quantify how future habitat management actions such as forest harvest outside of core properties impact specific sharp-tailed grouse demographics (nest success, adult and juvenile survival).
Determine interchange and movement of birds between core managed properties such as the Namekagon Barrens and surrounding habitat. How quickly do birds colonize newly created habitat? Do colonizing birds come from core properties or do they come from other unknown smaller populations that already exist outside of core properties?
9
Determine the relative contribution of sharp-tailed grouse subpopulations on core managed properties to the overall status of the statewide population.
These projects will help us further understand how management actions, including predator management as a function of habitat management, will impact sharp-tailed grouse vital rates. This will ultimately lead to prioritization of management actions identified in the overall plan that positively impact key vital rates and lead to overall population growth.
Literature Cited
Ammann, G. A. 1957. The prairie grouse of Michigan. Michigan Department of Conservation Game Division Technical Bulletin. Lansing, MI.
Beasom, S. L. 1974. Intensive short-term predator removal as a game management tool. Transactions of the North American Wildlife Conference 29:230-240.
Bergerud, A. T. and Gratson, M. W. 1988. Adaptive strategies and population ecology of northern grouse. University of Minnesota Press. Minneapolis, MN.
Carroll, J. P., Ellis-Felege, S. N., and Palmer, W. E. 2005. Impacts of predators on northern bobwhites in the southeast. Transactions of the 72nd North American Wildlife and Natural Resources Conference 72:246-257.
Connelly, J. W., Gratson, M. W., and Reese, K. P. 1998. Sharp-tailed grouse. In: Poole, A., Stettenhelm, P., and Gill, F., eds. The Birds of North America, No. 36. The Academy of Natural Sciences: Philadelphia; The American Ornithologists’ Union. Washington, D.C.
Connolly, T. T. 2001. Reproductive ecology of sharp-tailed grouse in the pine barrens of northwestern Wisconsin. M. S. Thesis, University of Wisconsin-Stevens Point.
Cote, I. M. and Sutherland, W. J. 1996. The effectiveness of removing predators to protect bird populations. Conservation Biology 11:395-405
Crooks, K.R. and Soule´, M.E. 1999. Mesopredator release and avifaunal extinctions in a fragmented system. Nature 400:563–566.
Duebbert, H. F., and Lokemoen, J. T. 1980. High duck nesting success in a predator-reduced
environment. Journal of Wildlife Management 44:428–37.
Errington, P. L. 1946. Predation and vertebrate populations. The Quarterly Review of Biology 21:144-177.
Greenwood, R. J. 1986. Influence of striped skunk removal on upland duck nest success in North Dakota. Wildlife Society Bulletin 14:6–11.
Guthery, F. S. and Beasom, S. L. 1977. Responses of game and nongame wildlife to predator control in south Texas. Journal of Range Management 30:404-409.
Hamerstrom, F. N. 1939. A study of Wisconsin prairie chicken and sharp-tailed grouse. Wilson Bulletin 51:105-119.
10
Hart, C. M., Lee, O. S., and Low, J. B. 1950. The sharp-tailed grouse in Utah: its life history, status, and management. Publication 3. Utah Department of Fish and Game, Salt Lake City, UT.
Horn, D. J., Phillips, M. L., Koford, R. R., Clark, W. R., Sovada, M. A., and Greenwood, R. J. 2005. Landscape composition, patch size, and distance to edges: interactions affecting duck reproductive success. Ecological Applications 15:1367-1376.
Hughes, T. W., Kennamer, J. E., Tapley, J. L., and Lehman, C. P. 2009. The impacts of predation on wild turkeys. Proceedings of the National Wild Turkey Symposium 9:117-126.
Meckstroth, A. M. and Miles, A. K. 2005. Predator removal and nesting waterbirds success at San Francisco Bay, California. Waterbirds 28:250-255.
National Fish and Wildlife Foundation, 2008. Business plan for Attwater’s prairie chickens. 17pp.
Palmer, W. E., Wellendorf, S. D., Gillis, J. R., and Bromley, P. T. 2005. Effects of field borders and mesomammal reduction on bobwhite abundance on North Carolina farms. The Wildlife Society Bulletin 33:1398-1405.
Redpath, S. and Thirgood, S. 1997. Birds of prey and red grouse. HMSO Publications. London, UK.
Ritchie, E. G. and Johnson, C. N. 2009. Predator interactions, mesopredator release and biodiversity conservation. Ecology Letters 12:982-998.
Sargeant, A. B., Sovada, M. A., and Shaffer, T. L. 1995. Seasonal predator removal relative to hatch rate of duck nests in waterfowl production areas. Wildlife Society Bulletin 23:507-513.
Schroeder, M. A. 1994. Productivity and habitat use of Columbian sharp-tailed grouse in north-central Washington. Progress Report, Washington Department of Fish and Wildlife.
Schroeder, M. A. and Baydack, R. K. 2011. Predation and the management of prairie grouse. Wildlife Society Bulletin 29:24-32.
Sisson, L. 1976. The sharp-tailed grouse in Nebraska. Nebraska Game and Parks Commission. Lincoln, NE.
Smith, R. K., Pullin, A. S., Stewart, G. B., and Sutherland, W. J. 2010. Is predator control an effective strategy for enhancing bird populations? Environmenal Evidence: www.environmentalevidence.org/SR38.html.
Sovada, M. A., Sargeant, A. B., and Grier, J. W. 1995. Differential effects of coyotes and red foxes on duck nest success. Journal of Wildlife Management. 59:1–9.
Speake, D. W. 1980. Predation on wild turkeys in Alabama. Proceedings of the National Wild Turkey Symposium 4:86-101.
Ulliman, M. J. 1995. Winter habitat ecology of Columbian sharp-tailed grouse in southeastern Idaho. M. S. Thesis, University of Idaho, Moscow.
Wiens, D. 2007. Nest success and nest site selection of shorebirds in North Dakota. M. S. Thesis, Louisiana State University, Baton Rouge.