Embed Size (px)
Citation preview

Wisconsin Nightjar Survey
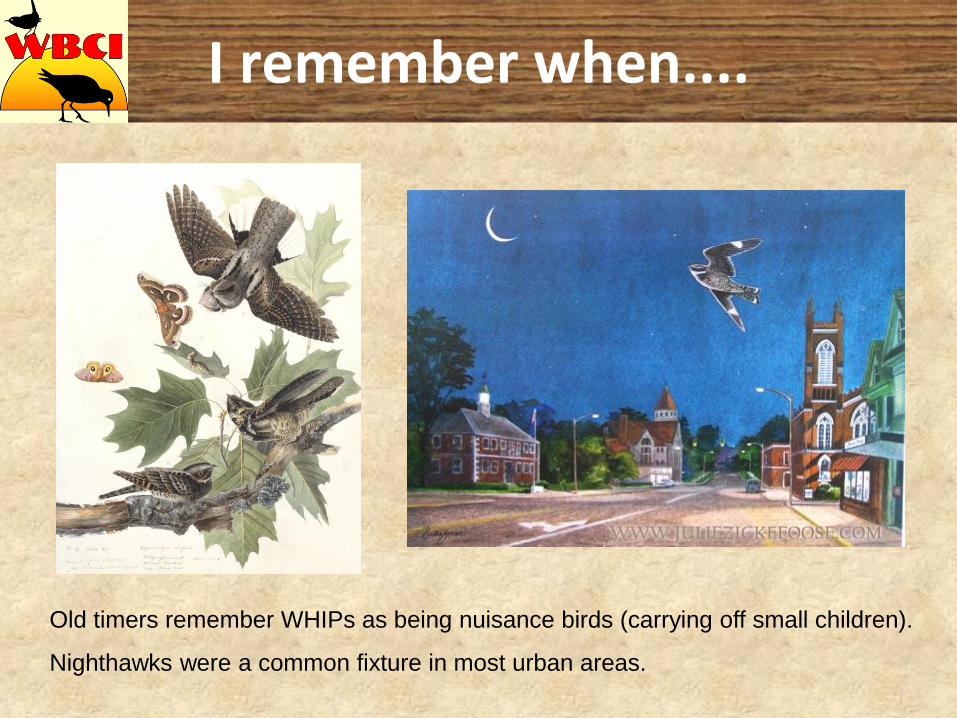
I remember when....
Old timers remember WHIPs as being nuisance birds (carrying off small children).
Nighthawks were a common fixture in most urban areas.
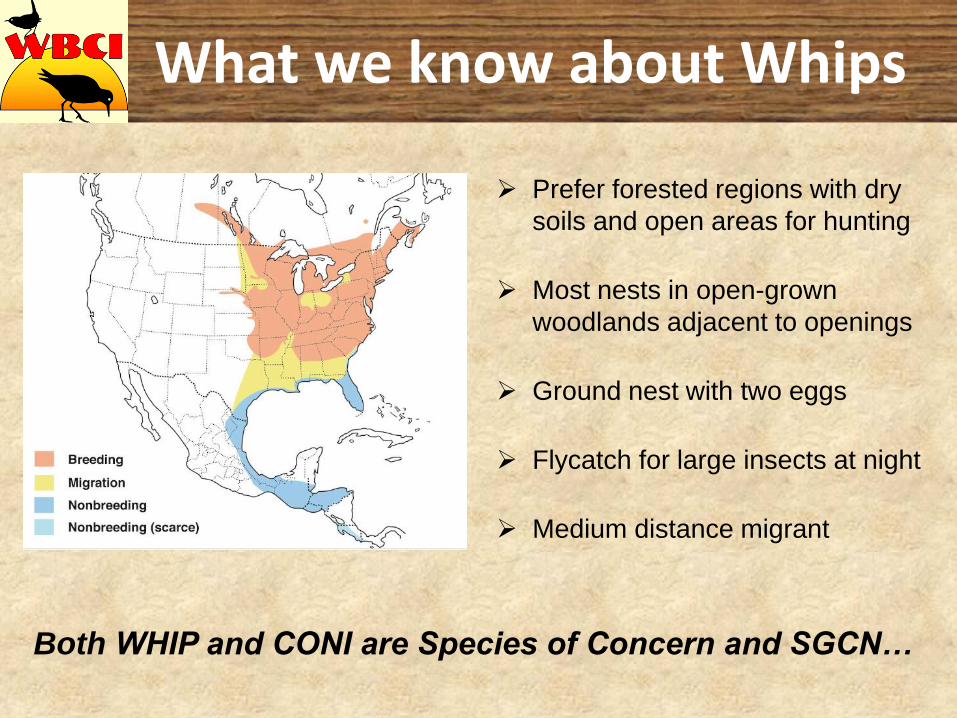
➢ Prefer forested regions with dry
soils and open areas for hunting
➢ Most nests in open-grown
woodlands adjacent to openings
➢ Ground nest with two eggs
➢ Flycatch for large insects at night
➢ Medium distance migrant
What we know about Whips
Both WHIP and CONI are Species of Concern and SGCN…

➢ Prefer open sand barrens,
grasslands, & urban areas
➢ Unique territorial display
➢ Ground nest with two eggs
➢ Predominantly crepuscular,
foraging for insects on the wing
➢ Long distance migrant
➢ Fall flocks mid-Aug to early Sept
What we know about CONIs
Very few studies exploring causes of declines….
….but that doesn’t stop us from guessing!

Possible factors in declines
WHIPs CONIs
Terrestrial habitat
• Forest succession• Fire suppression• Farms abandoned• Development• Invasives
• Changes in rooftop substrate
• Loss of non-ag open habitats
Flying insectsDecreased food availability
Decreased food availability
PredatorsIncreased mammalian (e.g. skunk, raccoon, etc.)
Increased, especially avian (e.g. crows, gulls)
Winter? Deforestation Pesticides


Nightjar Survey - Objectives
➢ Long-term statewide population trends
➢ Distribution, including areas of extirpation and hotspots
➢ Habitat (landscape) associations at broad scales
➢ Not initially designed to address causes of declines

Midwest Nocturnal Bird Monitoring ProgramPart of the Midwest Coordinated Bird Monitoring Partnership
Minnesota (Hawk Ridge Bird Observatory, MN DNR)Wisconsin (WBCI)
Michigan (MNFI & MiBCI)Illinois (MOON)
Missouri River Bird Observatory
Northeast Nightjar Working GroupUS Nightjar Survey Network
Bird Studies Canada


Nightjar Survey - Methods
• Standardized protocols
• Volunteers run random roadside routes (90 total)
• 10 stops/route, 1 mile apart
• 6 minutes/stop, birds tracked by minute
• Passively listen and record nightjars (and owls)
• Routes are run 1-2x from mid-May to early July NEAR TIME OF FULL MOON

From: Wilson and Watts 2006. Wilson Bull. 111: 207-211.
Effect of moon illumination on detectability
of Whip-poor-wills
0
0.1
0.2
0.3
0.4
0.5
0.6
< 10 10-25 50-75 75-100
Moonface Illuminated (%)
Dete
ction P
robabili
ty


Results Overview - WHIP
➢ 7055 routes surveyed per year
➢ 160100 birds detected/yr
➢ 60-70% of routes = 0 detections
➢ 5-9 birds per occupied route
➢ Max birds per route = 15-25 (33)
➢ Calling activity declines in early July; mid-May to mid-June is best
2008 - 2017

2008 WHIPs

2009 WHIPs

2010 WHIPs

2011 WHIPs

2013 WHIPs

2014 WHIPs

2015 WHIPs

2016 WHIPs

2017 WHIPs

2008-2017
Average

Results Overview - WHIP
7.35
6.96
6.13
9.12
4.73
7.35
4.61
5.905.61
0.00
1.00
2.00
3.00
4.00
5.00
6.00
7.00
8.00
9.00
10.00
2008 2009 2010 2011 2012 2013 2014 2015 2016 2017
Mean Whips per route by year# birds perroute
# birds peroccupied route

Results Overview - WHIP

Prelim Conclusions - WHIPs
➢ Survey showing no halt or reversal to declines
➢ May be stable in sand country? Possible observer effects.
➢ Driftless area a bit of a wild card – perhaps declining but not as sharply? (needs more study)
➢ Survey modifications needed:
• Survey fewer zero routes
• Add more routes in sand country
• Special focus on Driftless area?
• Monitoring in response to management activity (e.g. silviculture, fire, savannah & barrens restoration, etc.)
• Explore causes of declines

<15 birds per year = NOT WORKING!
*Needs focused placement of routes & different protocol
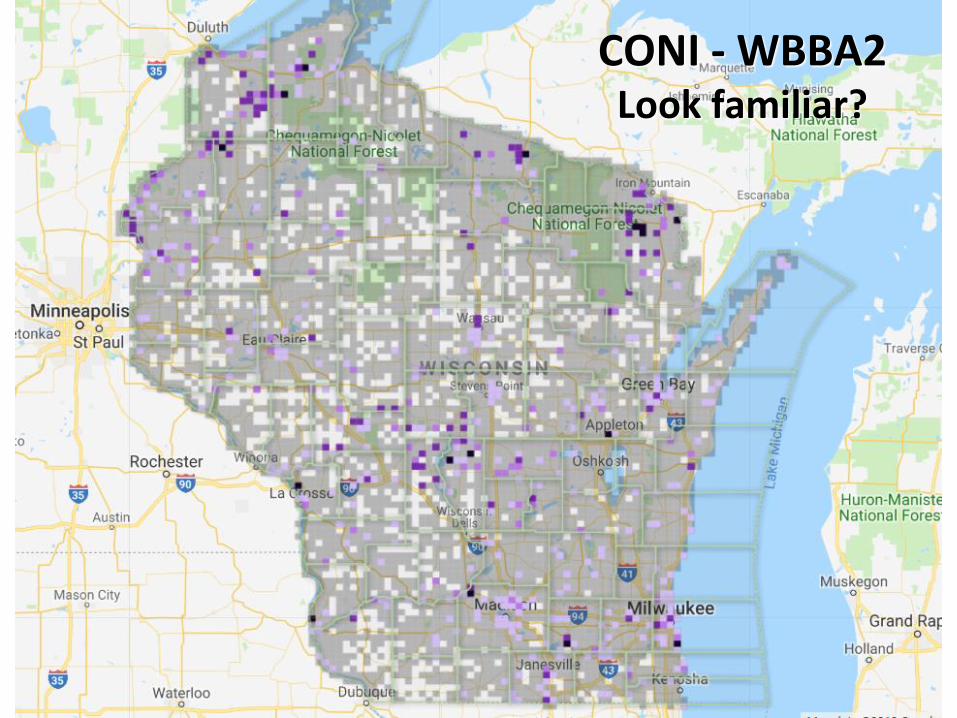
CONI - WBBA2Look familiar?
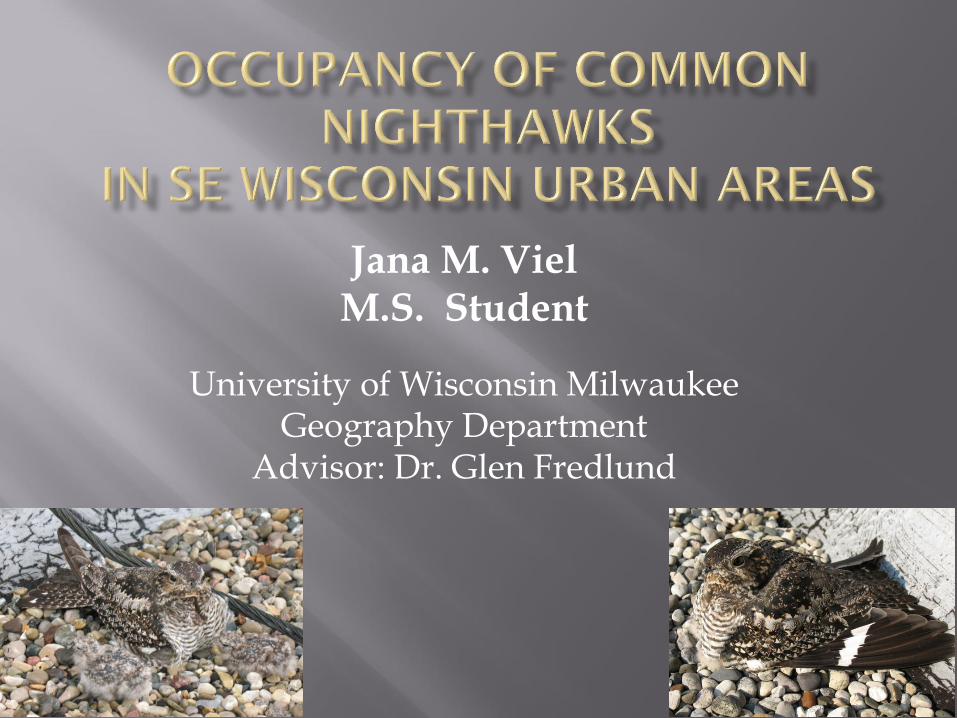
Jana M. VielM.S. Student
University of Wisconsin MilwaukeeGeography Department
Advisor: Dr. Glen Fredlund

Other CONI surveys
1. BBS & U.S. Nightjar Network
2. Breeding bird atlases
3. Expand Jana’s SE WI survey?
4. Migration vs. breedinga. Local efforts (e.g. Concord, Toronto,
Rocky Mountain Bird Observatory, Wisconsin?)
b. Steve Kolbe – NRRI, Duluth

What You Can Do!
➢ Sign up for a route or Atlas block!
➢ Not accepting new routes right now but can start
your own for your organization’s purposes
➢ eBird!
➢ Gretchen will talk about CONIs later
➢WHIPs – manage habitats, no artificial structures
www.ebird.org/wi
![Swarm Intelligence - IJSER · shortest route for food.[3]. Diag.1:- Ants finding the food source. 4 BIRDS Groups of mammals or birds assembled together are called a flock. An artificial](https://img.pdfslide.us/doc/110x75/5fa560fdc7d7584f972ab911/swarm-intelligence-ijser-shortest-route-for-food3-diag1-ants-finding-the.jpg)