Embed Size (px)
Citation preview
Allnals of Glaciology 10 1988 @ International Glacio logical Society
CRYSTAL SIZE AND ORIENTATION PATTERNS IN THE
WISCONSIN- AGE ICE FROM DYE 3, GREENLAND
by
C.C. Langway, Jr, H. Shoji and N. Azuma
(Department of Geological Sciences, State University of New York at Buffalo, 4240 Ridge Lea Road, Amherst, NY 14226, U.S.A .)
ABSTRACT Crystal size and c-axis orientation patterns were
measured on the Dye 3, Greenland, deep ice core in order to investigate time-dependent changes or alterations in the physical character of the core as a function of time after recovery. The physical measurements were expanded to include depth intervals not previously studied in the field. The recent study focused on core samples located between 1786 m and the bottom of the ice sheet at 2037 m.
Manual c-axis measurements were made on 23 new thin sections using a Rigsby-type universal stage. A new semi-automatic ultrasonic wave-velocity measuring device was developed in order to compare the results with the earlier manual measurements and to study an additional 114 ice-core samples in the Wisconsin-age ice. Crystal-size measurements were made on specimen surfaces by inducing evaporation grooves at crystal boundaries and measuring linear intercepts. The ultrasonically measured test samples were subsequently cleaned and analyzed by ion chromatography in order to measure impurity concentration levels of Cl-, NOs-and SO", 2- and study their effects on crystal growth and c-axis orientation.
INTRODUCTION To understand the dynamic processes which occur
within the mass of a polar glacier it is necessary to measure the physical-property variations over the vertical profile. A continuous 2037 m long Greenland Ice Sheet Pro§ram (GISP) core ice was recovered at Dye 3, Greenland (65 II'N, 43 49'W) between 1979 and 1981 (Gundestrup and Johnsen 1985, Langway and others 1985); it provided glacier-ice samples from the surface to bedrock of excellent quality for such an investigation. Initial multi-parameter physical measurements were made on the Dye 3 core in a field-trench laboratory immediately after each core section was augered (S.L. Herron and others 1985). Other physical-property studies were made after the ice core had been transported back to the laboratory (Shoji and Langway 1982 and 1983, S.L. Herron and Langway unpublished, Azuma unpublished).
The Holocene-Wisconsin boundary for the Dye 3, Greenland, ice core was identified at 1786 m depth by the stable-isotope method (Dansgaard and others 1982 and 1985) and confirmed by simultaneous sharp changes in measurements of the physical properties and an increase in wave velocity (S.L. Herron and others 1985), by a pronounced increase in Cl-, NOs- and SO.2- concentration levels (M.M. Herron and Langway 1985), by a lower conductivity and a higher dust content (Hammer and others 1985), and by a higher strain-rate enhancement factor (Shoji and Langway 1985).
The laboratory studies presented here focus on core samples from the Wisconsin-age ice located between the 1786 m depth and the bottom of the ice sheet. Manual c-axis crystal-orientation measurements were made on 23 new thin sections using a Rigsby-type universal stage. A new semi-automatic crystal-orientation technique which makes use of ultrasonic wave velocities was used to measure c-axes on 114 other core samples. Crystal-size measurements
were made on both sets of specimens. The ultrasonically measured test samples were subsequently cleaned and prepared for chemical analyses by ion chromatography in order to study the effect of impurity concentrations on the physical parameters. The results of core studies on the air bubbles, air hydrates, megascopic stratigraphy, melt layers, porosity and air permeability, micro-hardness and crystal anisotropy in the upper fim structure of the Dye 3 deep ice core will be reported elsewhere.
SAMPLES AND METHODS Manual crystal orientations were made on the 23 thin
sections, applying procedures outlined by Langway (1958), using a Rigsby-type universal stage. Crystal size was measured directly on the thin sections or from enlarged photographs. The sections were cut perpendicular to the long ice-core axis. No azimuth control was obtained.
The core samples for ultrasonic wave-velocity measurements were prepared from 3.5 cm thick vertical sections cut parallel to the long axis of the ice core. Each vertical rectangular block section (8 x 8 x 3.5 cm) was first cut by band saw and then smooth-finished, using a microtome blade. No azimuth control was obtained . All samples were systematically spaced at an interval of about
o. b. c. V.C.A. V.C.A. V.CA
Va
RA I H Som~le
~~'~Pl V(J
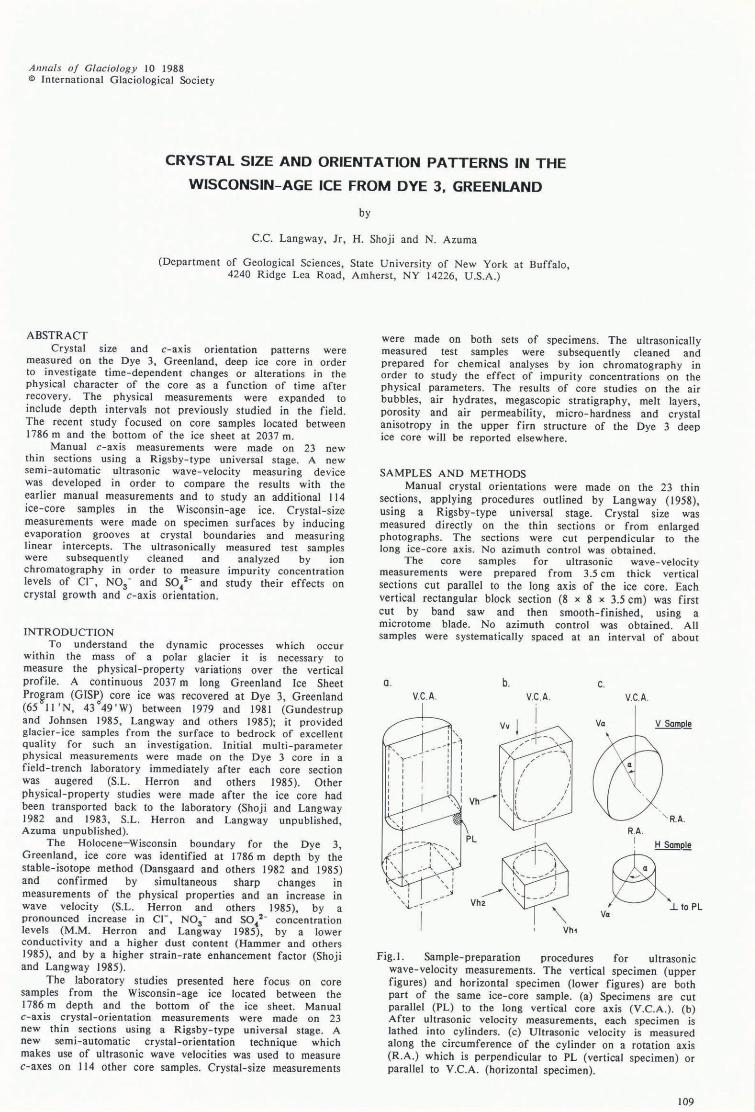
Fig. l . Sample-preparation procedures for ultrasonic wave-velocity measurements. The vertical specimen (upper figures) and horizontal specimen (lower figures) are both part of the same ice-core sample. (a) Specimens are cut parallel (PL) to the long vertical core axis (V.C.A.). (b) After ultrasonic velocity measurements, each specimen is lathed into cylinders. (c) Ultrasonic velocity is measured along the circumference of the cylinder on a rotation axis (R.A.) which is perpendicular to PL (vertical specimen) or parallel to V.C.A. (horizontal specimen).
109
Langway and others: Crystal size and orientation pal/erns
TABLE I. THIN-SECTION SAMPLES FROM THE WISCONSIN-AGE DYE 3 ICE CORE.
Number of Inclination c-axes Fabric of mean c-axes Grain-
Sample Depth measured statistics from core axis size no. m (N)
I 1658.40 99 2 1820.67 140 3 1836.45 157 4 1850.45 150 5 1852.20 150
6 1860.22 190 7 1863.59 200 8 1867.01 180 9 1870.89 200
10 1884.30 178
11 1889.63 180 12 1895.27 180 13 1897.45 132 14 1899.61 152 15 1908 .27 196
16 1911.27 184 17 1929.35 200 18 1933.24 176 19 1943.42 132 20 1961.21 200
21 1980.11 154 22 1995.10 188 23 2006.16 178
2.2 m within the depth range of 1788 and 2034 m. Sample-preparation and orientation procedures are shown in Figure 1. Ultrasonic wave-velocity measurements were made first on the rectangular blocks in both a vertical (V v) and a horizontal (V h) direction. Thereafter the rectangular block was lathed into a cylindrical shape (d = 7 cm, h = 3.5 cm), as shown in Figure I. For the new analytical technique the wave velocities were measured along the circumference of the cylinders by mounting the specimen on the lathe carriage and manually rotating the cylinder in increments of 50. A Krautkramer-Branson USL 38 with a 2.25 MHz transducer was used to propagate an ultrasonic P-wave. A
1820.67m 1836.45m 1850.45m
(R/ N)
0.82 0.98 0.95 0.97 0.96
0.95 0.94 0.98 0.94 0.98
0.94 0.98 0.97 0.97 0.97
0.98 0.97 0.94 0.97 0.95
0.98 0.89 0.99
150C
1905.27m 196i.21m
17SC
Fig.2. Fabric diagrams of six typical thin sections from Wisconsin-age ice measured on a Rigsby-type stage. The center of each diagram (lower hemisphere of Schmidt-net projection) corresponds to the vertical long-core axis.
110
degree mm
I >10 12 0.91 10 1.2 11 l.l 10 0.93
9 1.7 8 1.0 8 1.5 9 0.92 9 1.2
10 1.0 7 1.7 8 1.2
15 1.1 10 1.9
9 0.97 11 2.1 10 1.4
5 1.8 15 1.0
6 1.8 10 3.3
7 2.2
low-viscosity silicone oil was used as a coupler. Measurements were performed in a 15
0 ± 2
0 C cold-room.
Crystal size was measured on these samples by thermal-etching grain-boundary grooves on the flat surface of the cylinder and measuring linear intercepts. Finally, each sample was surface-microtomed, cleaned and melted , using established clean-room procedures, and measured for Cl-, NOs- and SO/- concentration levels by ion chromatography (Langway and Goto-Azuma 1988, this volume), applying procedures previously reported (M.M. Herron and Langway 1985). Samples from the near-bottom silty ice (below 2008 m depth) were not chemically analyzed .
l W 269m -@ ...... : ... . 3.8 f.· ................................ : ............................ · ..... ·f .. ;.>:~~~;.:\:.
(/) 3.7- 2V 701m ' , , , , , , "":.:." "> ...... l ........ .......... 238m ~ 3.8 t ··.. .. .............. :............ .. .................. ~
€ ~~ ~.~~.~~~8m .. ~ , ...... .1.. ...... : .. ~ ....... 1& o 3.8 ....... ,' ...... ' ...... .... ....... 695m
~ 3.7 , ' , , , , , , ...... ® ..
~ 3.9 .. 4V 1820m :h,:::-Vr 1 • :: ;. ~. : ::;: 38 + • " • , ....... -VmO X2 . 1699 U ' ••• ••• : ••• --1 i-8 ... : .... . .. ... .. . m 'g 37 .... ..., : • .. ---Vm'n "'-
~ 39~.4H 182~m • • •• • + ~ 5 38 ............................................... • .................. '/VO
37 _ ' I ! I , I ! J
o 90 180 270 360
Wove Propagation Direction (a), degree
Fig.3. P-wave ultrasonic wave-velocity curves compared with four c-axis fabric diagrams measured on a Rigsby-type stage (S.L. Herron and others 1985). Wave propagation is plotted parallel to the vertical plane of the core for vertical specimens (1 V, 2V, 3V and 4V) or perpendicular to the long-core axis for the horizontal specimen (4H).
RESULTS The results of the fabric and crystal-size measurements
on the 23 manually measured sections are listed in Table I. All sections below 1786 m depth show strong single-maximum fabric patterns. As examples, six of the fabric diagrams are shown in Figure 2. Section depth is identified in the top left of each diagram in Figure 2 and the number of crystals measured is shown in the bottom right. The results of these measurements were compared with similar field measurements which were made by S.L. Herron and others (1985) in order to investigate possible time-dependent changes or alterations in the physical character of the ice cores. No marked differences in orientation pattern or changes in grain-size were observed either in the thin sections reported on here or in the sections measured in the field about 5 years earlier.
Previously reported studies of the crystal anisotropy in ice sheets were usually made by measuring the ultrasonic velocities on selected ice-core samples in two directions: the vertical and the horizontal (Bennett 1972, Kohnen and Langway 1977, Kohnen and Bentley 1977). For this study a new semi-automatic multi-directional technique was developed. The feasibility of the method was first tested by comparing the semi-automatic results from the 269, 701, 1658 and 1820 m depths with the field results of S.L. Herron and others (1985) at the 238, 695, 1699 and 1815 m depths respectively (Fig.3). As shown in Figure 3, the ultrasonic wave-velocity curve which results from measuring sam~le I V from 269 m is nearly constant throughout the 360 rotation and corresponds quite well to the random orientation pattern indicated in the fabric diagram of the 238 m section. Curve 2V from 70 I m shows slightly higher wave velocities between 30
0 and 65 0
, which corresponds to the slightly more circular convergence of c-axes shown in the fabric diagram at 695 m. The 2V velocity curve is asymmetrical with reference to Cl: = 180
0
because the c-axis concentration is asymmetrical. Curve 3Y from 1658 m shows the highest velocity values to be near vertical and compares favorably with the strong vertical fabric pattern displayed in the diagram from 1669 m. Curve 4V from 1820 m shows a pronounced and relatively smooth sinusoidal velocity curve, which is reflected as a very strong, near-vertical, single-maximum fabric pattern in the diagram from 1815 m. Some velocity curves show a flat-velocity maximum and minimum along the wave-propagation direction due to the ±8 m/ s velocity resolution limits of the apparatus. Crosses superimposed on the velocity curves in Figure 3 represent velocity measurements made on the 114 block samples in two directions before the cylinder was made and tested. The velocity differences result from the resolution limits of the apparatus and the geometry of the sample. Temperature-induced error in velocity measurements is estimated to be within 10 m/ so Curve 4H from the 1820 m specimen (d = 4.5 cm, h = 3.5 cm) indicates that the wave velocity in the horizontal plane is nearly isotropic, as it should be when wave-propagation direction is constantly oriented perpendicular to a strong vertically oriented fabric pattern. The above study demonstrates the validity of the multi-directional ultrasonic wave-velocity measurements for determining c-axis crystal-orientation data over a complete spectrum of fabric patterns and configurations.
Since the pole of a strong single-maximum fabric pattern is coincident to the pole of the mean c-axis direction, additional detailed information can be obtained by considering the geometry of the c-axis distribution patterns. The ultrasonic velocity should be highest along the pole direction and decrease as the angle increases from the mean pole direction. The lower velocity (V min) directions result in a cone-shaped configuration in which the half-apex angle is approximately 50
0 (Ben nett 1972). The velocity then
increases to the second highest velocity (V max2) as the wave propagation direction is inclined more than 50
0 from the
pole. In this orientation, measurements are made along a direction perpendicular to the pole direction. Since the ice-crystal c-axis pole direction is not usually found parallel to the vertical cutting plane of the specimen (PL in Figure la), the apparent highest velocity (V maXi) is usually measured along an inclined direction, 9, from the vertical core axis in PL plane. When the pole direction rotates away from PL plane, V maXI decreases, due to the increase in the inclination angle from the pole direction. With this rotation,
Langway and others: Crystal size and orientation patterns
Ultrasonic Velocity, km/s 3.7 3.8 3.9 4.0
1780 Vmox2
i '" ~
• • • I
• • I 'iI
I
" C •• ~820 0 • •
0 • "t • • • "f 0
~ : I I i' , :" : .' . 0
~860 • • I • • • • I • :- i' e •
I
'J i,
E I • • - e: 0 • - •
~ 0 0 , ~ ,
si , ...... 1900 I,
0 0- I Q) 0 ,. Cl .. • • •
• • I
I
'~ i
" • ) :1 -.
~940 • I , •• " •
• , • I
, • • . ' . i • I -i' 0 ,
• • .. 41, • , I I
1980 , ., I •
" " " I. M .. • .. I. , I
I , • I • • • • •• 0 • ,", •
2020 • I, • • • • • le t I •
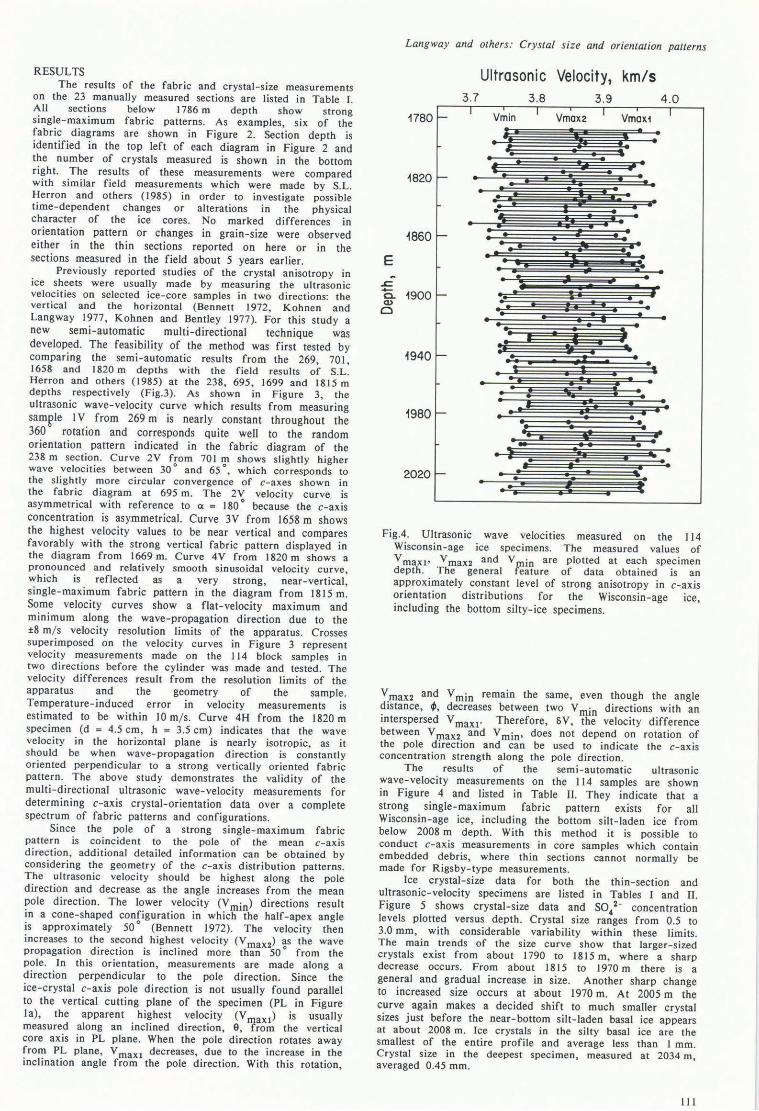
Fig.4 . Ultrasonic wave velocities measured on the 114 Wisconsin-age ice specimens. The measured values of V maxi' V maX2 and V min are plotted at each specimen depth . The general feature of data obtained is an approximately constant level of strong anisotropy in c-axis orientation distributions for the Wisconsin-age ice, including the bottom silty-ice specimens.
V maX2 and V min remain the same, even though the angle distance, ~, decreases between two V min directions with an interspersed V maXI' Therefore, 6V, the velocity difference between V maX2 and V min' does not depend on rotation of the pole direction and can be used to indicate the c-axis concentration strength along the pole direction.
The results of the semi-automatic ultrasonic wave-velocity measurements on the 114 samples are shown in Figure 4 and listed in Table n. They indicate that a strong single-maximum fabric pattern exists for all Wisconsin-age ice, including the bottom silt-laden ice from below 2008 m depth. With this method it is possible to conduct c-axis measurements in core samples which contain embedded debris, where thin sections cannot normally be made for Rigsby-type measurements.
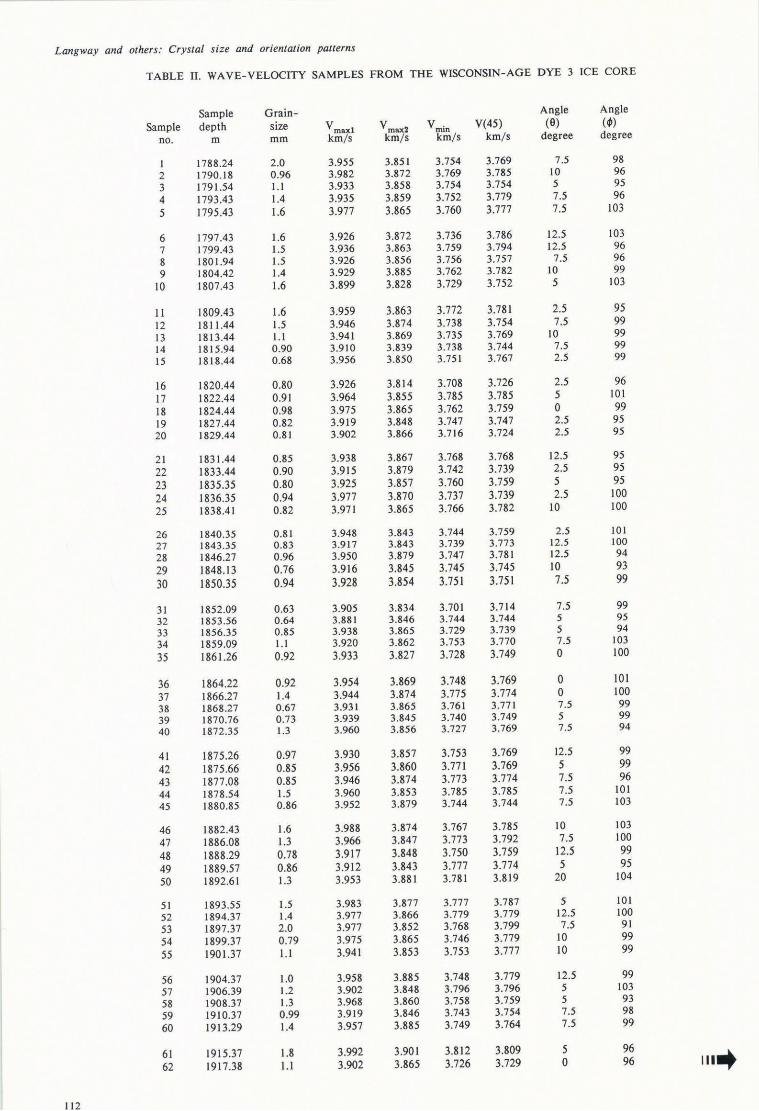
Ice crystal-size data for both the thin-section and ultrasonic-velocity specimens are listed in Tables I and 11. Figure 5 shows crystal-size data and SO./- concentration levels plotted versus depth. Crystal size ranges from 0.5 to 3.0 mm, with considerable variability within these limits. The main trends of the size curve show that larger-sized crystals exist from about 1790 to 1815 m, where a sharp decrease occurs. From about 1815 to 1970 m there is a general and gradual increase in size. Another sharp change to increased size occurs at about 1970 m. At 2005 m the curve again makes a decided shift to much smaller crystal sizes just before the near-bottom silt-laden basal ice appears at about 2008 m. Ice crystals in the silty basal ice are the smallest of the entire profile and average less than I mm. Crystal size in the deepest specimen, measured at 2034 m, averaged 0.45 mm.
III
Langway and others: Crystal size and orientation patterns
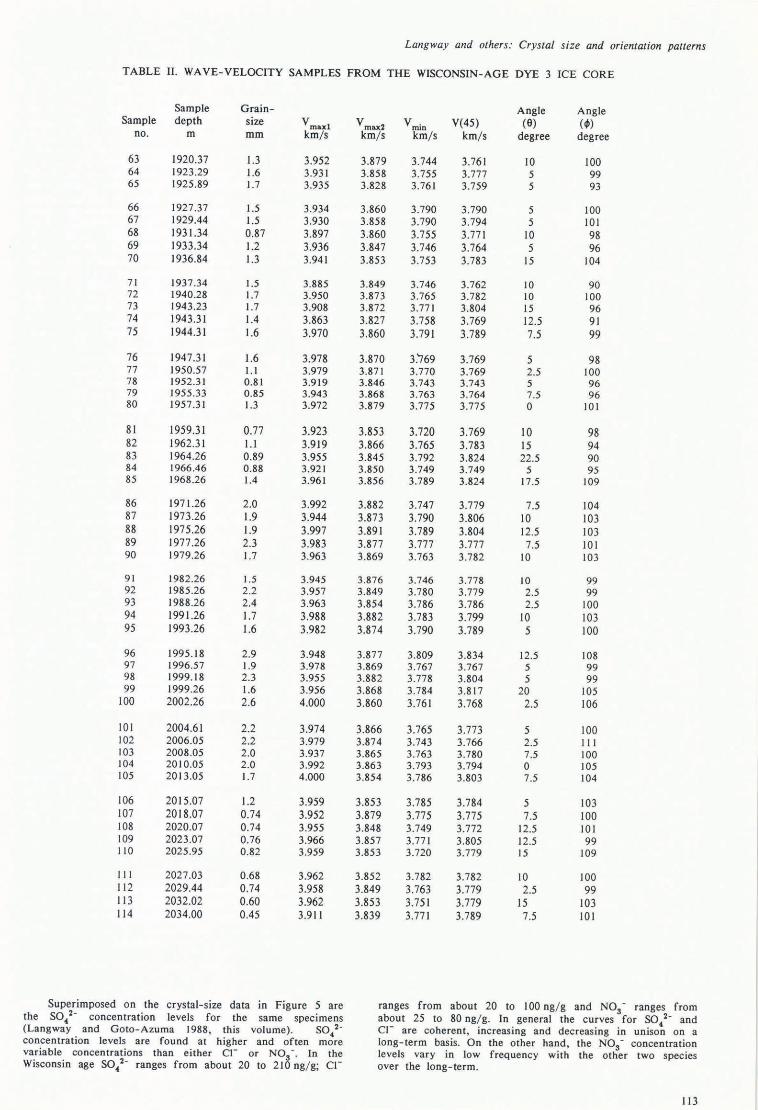
TABLE n. W A VE- VELOCITY SAMPLES FROM THE WISCONSIN-AGE DYE 3 ICE CORE
Sample Grain- Angle Angle Sample depth size V maxI Vmax2 Vmin V(45) (9) (~)
no. m mm km/ s km/ s km/ s km/ s degree degree
I 1788.24 2.0 3.955 3.851 3.754 3.769 7.5 98 2 1790.18 0.96 3.982 3.872 3.769 3.785 10 96 3 1791.54 1.1 3.933 3.858 3.754 3.754 5 95 4 1793.43 1.4 3.935 3.859 3.752 3.779 7.5 96 5 1795.43 1.6 3.977 3.865 3.760 3.777 7.5 103
6 1797.43 1.6 3.926 3.872 3.736 3.786 12.5 103 7 1799.43 1.5 3.936 3.863 3.759 3.794 12.5 96 8 1801.94 1.5 3.926 3.856 3.756 3.757 7.5 96 9 1804.42 1.4 3.929 3.885 3.762 3.782 10 99
10 1807.43 1.6 3.899 3.828 3.729 3.752 5 103
11 1809.43 1.6 3.959 3.863 3.772 3.781 2.5 95 12 1811.44 1.5 3.946 3.874 3.738 3.754 7.5 99 13 1813.44 1.1 3.941 3.869 3.735 3.769 10 99 14 1815.94 0.90 3.910 3.839 3.738 3.744 7.5 99 15 1818.44 0.68 3.956 3.850 3.751 3.767 2.5 99
16 1820.44 0.80 3.926 3.814 3.708 3.726 2.5 96 17 1822.44 0.91 3.964 3.855 3.785 3.785 5 101 18 1824.44 0.98 3.975 3.865 3.762 3.759 0 99 19 1827.44 0.82 3.919 3.848 3.747 3.747 2.5 95 20 1829.44 0.81 3.902 3.866 3.716 3.724 2.5 95
21 1831.44 0.85 3.938 3.867 3.768 3.768 12.5 95 22 1833.44 0.90 3.915 3.879 3.742 3.739 2.5 95 23 1835.35 0.80 3.925 3.857 3.760 3.759 5 95 24 1836.35 0.94 3.977 3.870 3.737 3.739 2.5 100 25 1838.41 0.82 3.971 3.865 3.766 3.782 10 100
26 1840.35 0.81 3.948 3.843 3.744 3.759 2.5 101 27 1843.35 0.83 3.917 3.843 3.739 3.773 12.5 100 28 1846.27 0.96 3.950 3.879 3.747 3.781 12.5 94 29 1848.13 0.76 3.916 3.845 3.745 3.745 10 93 30 1850.35 0.94 3.928 3.854 3.751 3.751 7.5 99
31 1852.09 0.63 3.905 3.834 3.701 3.714 7.5 99 32 1853.56 0.64 3.881 3.846 3.744 3.744 5 95 33 1856.35 0.85 3.938 3.865 3.729 3.739 5 94 34 1859.09 1.1 3.920 3.862 3.753 3.770 7.5 103 35 1861.26 0.92 3.933 3.827 3.728 3.749 0 100
36 1864.22 0.92 3.954 3.869 3.748 3.769 0 101 37 1866.27 1.4 3.944 3.874 3.775 3.774 0 100 38 1868.27 0.67 3.931 3.865 3.761 3.771 7.5 99 39 1870.76 0.73 3.939 3.845 3.740 3.749 5 99 40 1872.35 1.3 3.960 3.856 3.727 3.769 7.5 94
41 1875.26 0.97 3.930 3.857 3.753 3.769 12.5 99 42 1875.66 0.85 3.956 3.860 3.771 3.769 5 99 43 1877.08 0.85 3.946 3.874 3.773 3.774 7.5 96 44 1878 .54 1.5 3.960 3.853 3.785 3.785 7.5 101 45 1880.85 0.86 3.952 3.879 3.744 3.744 7.5 103
46 1882.43 1.6 3.988 3.874 3.767 3.785 10 103 47 1886.08 1.3 3.966 3.847 3.773 3.792 7.5 100 48 1888.29 0.78 3.917 3.848 3.750 3.759 12.5 99 49 1889.57 0.86 3.912 3.843 3.777 3.774 5 95 50 1892.61 1.3 3.953 3.881 3.781 3.819 20 104
51 1893.55 1.5 3.983 3.877 3.777 3.787 5 101 52 1894.37 1.4 3.977 3.866 3.779 3.779 12.5 100 53 1897.37 2.0 3.977 3.852 3.768 3.799 7.5 91 54 1899.37 0.79 3.975 3.865 3.746 3.779 10 99 55 1901.37 1.1 3.941 3.853 3.753 3.777 10 99
56 1904.37 1.0 3.958 3.885 3.748 3.779 12.5 99 57 1906.39 1.2 3.902 3.848 3.796 3.796 5 103 58 1908.37 1.3 3.968 3.860 3.758 3.759 5 93 59 1910.37 0.99 3.919 3.846 3.743 3.754 7.5 98 60 1913.29 1.4 3.957 3.885 3.749 3.764 7.5 99
61 1915.37 1.8 3.992 3.901 3.812 3.809 5 96 Ill" 62 1917.38 1.1 3.902 3.865 3.726 3.729 0 96
11 2
Langway and others: Crystal size and orientation patterns
TABLE n. W A VE- VELOCITY SAMPLES FROM THE WISCONSIN-AGE DYE 3 ICE CORE
Sample Grain-Sample depth size Vmax1
no. m mm km/s
63 1920.37 1.3 3.952 64 1923.29 1.6 3.931 65 1925.89 J.7 3.935
66 1927.37 1.5 3.934 67 1929.44 1.5 3.930 68 1931.34 0.87 3.897 69 1933.34 1.2 3.936 70 1936.84 1.3 3.941
7 I 1937.34 1.5 3.885 72 1940.28 1.7 3.950 73 1943.23 J.7 3.908 74 1943.31 1.4 3.863 75 1944.31 1.6 3.970
76 1947.31 1.6 3.978 77 1950.57 1.1 3.979 78 1952.31 0.81 3.919 79 1955.33 0.85 3.943 80 1957 .31 1.3 3.972
81 1959.31 0.77 3.923 82 1962.31 1.1 3.919 83 1964.26 0.89 3.955 84 1966.46 0.88 3.921 85 1968 .26 1.4 3.961
86 1971.26 2.0 3.992 87 1973 .26 1.9 3.944 88 1975.26 1.9 3.997 89 1977.26 2.3 3.983 90 1979.26 J.7 3.963
91 1982.26 1.5 3.945 92 1985 .26 2.2 3.957 93 1988.26 2.4 3.963 94 1991.26 1.7 3.988 95 1993 .26 1.6 3.982
96 1995.18 2.9 3.948 97 1996.57 1.9 3.978 98 1999. 18 2.3 3.955 99 1999.26 1.6 3.956
100 2002.26 2.6 4.000
101 2004.61 2.2 3.974 102 2006.05 2.2 3.979 103 2008.05 2.0 3.937 104 2010.05 2.0 3.992 105 2013 .05 J.7 4.000
106 2015.07 1.2 3.959 107 2018.07 0.74 3.952 108 2020.07 0.74 3.955 109 2023.07 0.76 3.966 110 2025 .95 0.82 3.959
111 2027.03 0.68 3.962 112 2029.44 0.74 3.958 113 2032.02 0.60 3.962 114 2034.00 0.45 3.911
Superimposed on the crystal-size data in Figure 5 are the SO,/- concentration levels for the same specimens (Langway and Goto-Azuma 1988, this volume). SO,/concentration levels are found at higher and often more variable concentrations than either Cl- or NOs -. In the Wisconsin age SO/- ranges from about 20 to 210 ng/ g; Cl-
Angle Angle Vmax2 Vmin V(45) (9) (~)
km/ s km/s km/ s degree degree
3.879 3.744 3.761 IO 100 3.858 3.755 3.777 5 99 3.828 3.761 3.759 5 93
3.860 3.790 3.790 5 100 3.858 3.790 3.794 5 101 3.860 3.755 3.771 10 98 3.847 3.746 3.764 5 96 3.853 3.753 3.783 15 104
3.849 3.746 3.762 10 90 3.873 3.765 3.782 10 100 3.872 3.771 3.804 15 96 3.827 3.758 3.769 12.5 91 3.860 3.791 3.789 7.5 99
3.870 3.'769 3.769 5 98 3.87 I 3.770 3.769 2.5 100 3.846 3.743 3.743 5 96 3.868 3.763 3.764 7.5 96 3.879 3.775 3.775 0 101
3.853 3.720 3.769 10 98 3.866 3.765 3.783 15 94 3.845 3.792 3.824 22.5 90 3.850 3.749 3.749 5 95 3.856 3.789 3.824 17.5 109
3.882 3.747 3.779 7.5 104 3.873 3.790 3.806 10 103 3.891 3.789 3.804 12.5 103 3.877 3.777 3.777 7.5 101 3.869 3.763 3.782 10 103
3.876 3.746 3.778 10 99 3.849 3.780 3.779 2.5 99 3.854 3.786 3.786 2.5 100 3.882 3.783 3.799 10 103 3.874 3.790 3.789 5 100
3.877 3.809 3.834 12.5 108 3.869 3.767 3.767 5 99 3.882 3.778 3.804 5 99 3.868 3.784 3.817 20 105 3.860 3.761 3.768 2.5 106
3.866 3.765 3.773 5 100 3.874 3.743 3.766 2.5 III 3.865 3.763 3.780 7.5 100 3.863 3.793 3.794 0 105 3.854 3.786 3.803 7.5 104
3.853 3.785 3.784 5 103 3.879 3.775 3.775 7.5 100 3.848 3.749 3.772 12.5 101 3.857 3.771 3.805 12.5 99 3.853 3.720 3.779 15 109
3.852 3.782 3.782 10 100 3.849 3.763 3.779 2.5 99 3.853 3.751 3.779 15 103 3.839 3.771 3.789 7.5 101
ranges from about 20 to 100 ng/ g and NOs- ranges from about 25 to 80 ng/ g. In general the curves for SO,/- and Cl- are coherent, increasing and decreasing in unison on a long-term basis. On the other hand, the NOs- concentration levels vary in low frequency with the other two species over the long-term.
113
Langway and others:
E
.£::. +-ca> o
0 1780
1820
~860
~900
~940
~980
2020
Crystal size and orientation patterns
Grain Size, mm -1.0 2.0 3.0
o WO 200 300
S02- / 4 , ng g
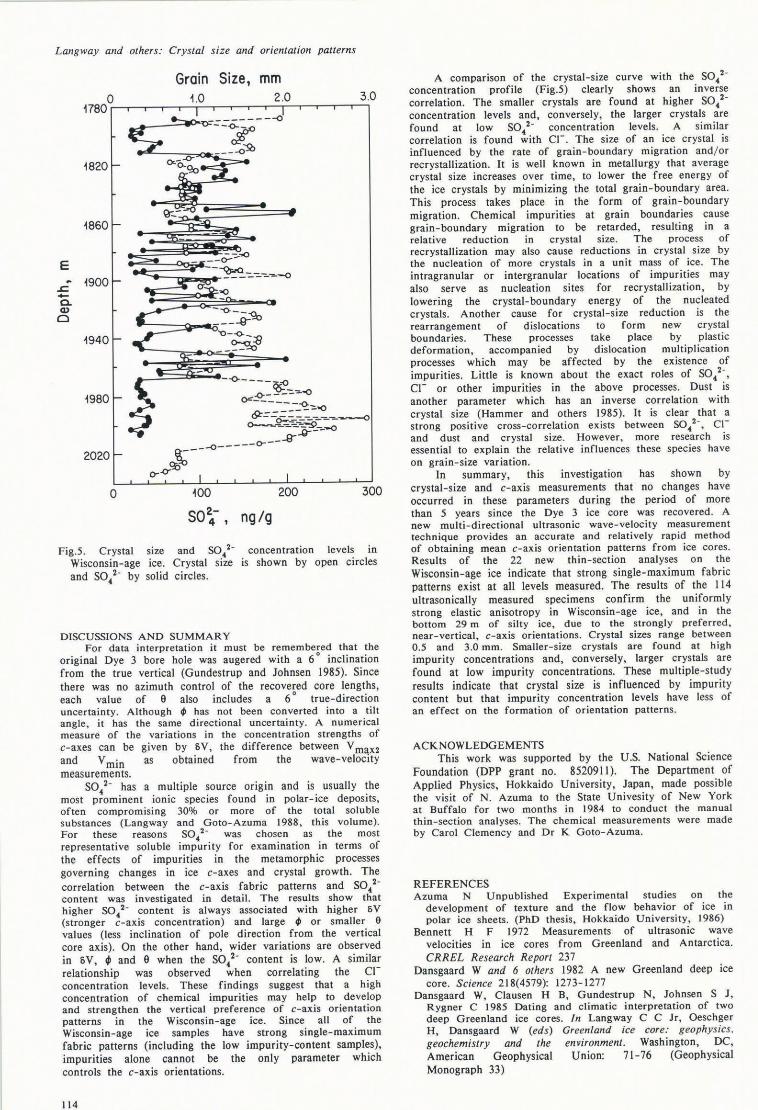
Fig.5. Crystal size and SO.2-Wisconsin-age ice. Crystal size and SO 4 2- by solid circles.
DISCUSSIONS AND SUMMARY
concentration levels in is shown by open circles
For data interpretation it must be remembered that the original Dye 3 bore hole was augered with a 6
0 inclination
from the true vertical (Gundestrup and Johnsen 1985). Since there was no azimuth control of the recovered core lengths, each value of a also includes a 6
0 true-direction
uncertainty. Although 41 has not been converted into a tilt angle, it has the same directional uncertainty. A numerical measure of the variations in the concentration strengths of c-axes can be given by BV, the difference between V m!\X2 and V min as obtained from the wave-velocIty measurementS.
SO/- has a multiple source origin and is usually the most prominent ionic species found in polar-ice deposits, often compromising 30% or more of the total soluble substances (Langway and Goto-Azuma 1988, this volume). For these reasons SO/- was chosen as the most representative soluble impurity for examination in terms of the effects of impurities in the metamorphic processes governing changes in ice c-axes and crystal growth. The correlation between the c-axis fabric patterns and SO. 2-content was investigated in detail. The results show that higher SO 4 2- content is always associated with higher BV (stronger c-axis concentration) and large 41 or smaller a values (less inclination of pole direction from the vertical core axis) . On the other hand, wider variations are observed in cV, ~ and a when the SO/- content is low. A similar relationship was observed when correlating the CIconcentration levels. These findings suggest that a high concentration of chemical impurities may help to develop and strengthen the vertical preference of c-axis orientation patterns in the Wisconsin-age ice. Since all of the Wisconsin-age ice samples have strong single-maximum fabric patterns (including the low impurity-content samples), impurities alone cannot be the only parameter which controls the c-axis orientations.
114
A comparison of the crystal-size curve with the SO/concentration profile (Fig.5) clearly shows an inverse correlation. The smaller crystals are found at higher SO/concentration levels and, conversely, the larger crystals are found at low SO 4 2- concentration levels. A similar correlation is found with CL The size of an ice crystal is influenced by the rate of grain-boundary migration and / or recrystallization. It is well known in metallurgy that average crystal size increases over time, to lower the free energy of the ice crystals by minimizing the total grain-boundary area. This process takes place in the form of grain-boundary migration. Chemical impurities at grain boundaries cause grain-boundary migration to be retarded, resulting in a relative reduction in crystal size. The process of recrystallization may also cause reductions in crystal size by the nucleation of more crystals in a unit mass of ice. The intragranular or intergranular locations of impurities may also serve as nucleation sites for recrystallization, by lowering the crystal-boundary energy of the nucleated crystals. Another cause for crystal-size reduction is the rearrangement of dislocations to form new crystal boundaries. These processes take place by plastic deformation, accompanied by dislocation multiplication processes which may be affected by the existence of impurities. Little is known about the exact roles of SO /-, CI- or other impurities in the above processes. Dust is another parameter which has an inverse correlation with crystal size (Hammer and others 1985). It is clear that a strong positive cross-correlation exists between SO /-, CIand dust and crystal size. However, more research is essential to explain the relative influences these species have on grain-size variation.
In summary, this investigation has shown by crystal-size and c-axis measurements that no changes have occurred in these parameters during the period of more than 5 years since the Dye 3 ice core was recovered. A new multi-directional ultrasonic wave-velocity measurement technique provides an accurate and relatively rapid method of obtaining mean c-axis orientation patterns from ice cores. Results of the 22 new thin-section analyses on the Wisconsin-age ice indicate that strong single-maximum fabric patterns exist at all levels measured. The results of the 114 ultrasonically measured specimens confirm the uniformly strong elastic anisotropy in Wisconsin -age ice, and in the bottom 29 m of silty ice, due to the strongly preferred, near-vertical, c-axis orientations. Crystal sizes range between 0.5 and 3.0 mm. Smaller-size crystals are found at high impurity concentrations and, conversely, larger crystals are found at low impurity concentrations. These multiple-study results indicate that crystal size is influenced by impurity content but that impurity concentration levels have less of an effect on the formation of orientation patterns.
ACKNOWLEDGEMENTS This work was supported by the U .S. National Science
Foundation (DPP grant no. 8520911). The Department of Applied Physics, Hokkaido University, Japan, made possible the visit of N. Azuma to the State Univesity of New York at Buffalo for two months in 1984 to conduct the manual thin-section analyses. The chemical measurements were made by Carol Clemency and Dr K Goto-Azuma.
REFERENCES Azuma N Unpublished Experimental studies on the
development of texture and the flow behavior of ice in polar ice sheets. (PhD thesis, Hokkaido University, 1986)
Bennett H F 1972 Measurements of ultrasonic wave velocities in ice cores from Greenland and Antarctica. CRREL Research Report 237
Dansgaard Wand 6 others 1982 A new Greenland deep ice core. Science 218(4579): 1273-1277
Dansgaard W, Clausen H B, Gundestrup N, Johnsen S J, Rygner C 1985 Dating and climatic interpretation of two deep Greenland ice cores. In Langway C C Jr, Oeschger H, Dansgaard W (eds) Greenland ice core: geophysics. geochemistry and the environment. Washington, DC, American Geophysical Union: 71-76 (Geophysical Monograph 33)
Gundestrup N S, Johnsen S J 1985 A battery powered, instrumented deep ice core drill for liquid filled holes. In Langway C C Jr, Oeschger H, Dansgaard W (eds) Greenland ice core: geophysics, geochemistry and the environment. Washington, DC, American Geophysical Union: 19-22 (Geophysical Monograph 33)
Hammer C U, Clausen H B, Dansgaard W, Neftel A, Kristinsdottir P, Johnson E 1985 Continuous impurity analysis along the Dye 3 deep core. In Langway C C Jr, Oeschger H, Dansgaard W (eds) Greenland ice core: geophysics , geochemistry and the environmelll. Washington, DC. American Geophysical Union: 90-94 (Geophysical Monograph 33)
Herron M M, Langway C C Jr 1985 Chloride, nitrate, and sulfate in the Dye 3 and Camp Century, Greenland ice cores. In Langway C C Jr, Oeschger H, Dansgaard W (eds) Greenland ice core: geophysics, geochemistry and the environment. Washington, DC, American Geophysical Union: 77-84 (Geophysical Monograph 33)
Herron S L, Langway C C Jr, Brugger K A 1985 Ultrasonic velocities and crystalline anisotropy in the ice core from Dye 3, Greenland. In Langway C C Jr, Oeschger H, Dansgaard W (eds) Greenland ice core: geophysics, geochemistry and the environmelll. Washington, DC, American Geophysical Union: 23-31 (Geophysical Monograph 33)
Kohnen H, Bentley C R 1977 Ultrasonic measurements on ice cores from Ross Ice Shelf, Antarctica, drill hole. Antarctic Journal of the United States 12(4): 148-150
Kohnen H, Langway C C Jr 1977 Untersuchungen mit Ultraschall an Eisbohrkernen aus Zentralgronland. Polarforschung 47(1 / 2): 1-10
Langway C C Jr 1958 Ice fabrics and the universal stage. US Army Snow, Ice and Permafrost Research Establishment. Technical Report 62
Langway C C Jr, Goto-Azuma K 1988 Temporal variatIOns in the deep ice core chemistry record from Dye 3, Greenland. Annals of Glaciology 10: 209
Langway C C Jr, Oeschger H, Dansgaard W 1985 The Greenland Ice Sheet Program in prespective. In Langway C C Jr, Oeschger H, Dansgaard W (eds) Greenland ice core: geophysics , geochemistry and the environment . Washington, DC, American Geophysical Union: 1-8 (Geophysical Monograph 33)
Shoji H, Langway C C Jr 1982 Air hydrate inclusions in fresh ice core. Nature 298(5874): 548-550
Shoji H, Langway C C Jr 1983 Volume relaxation of air inclusions in a fresh ice core. Journal of Physical Chemistry 87(21): 4111-4114
Shoji H, Langway C C Jr 1985 The ice flow velocity profile for Dye-3, Greenland. Geophysical Research Letters 12( 1 2): 797-800
Langway and others: Crystal size and orientation patterns
115