Embed Size (px)
Citation preview
Vol.51, No.2, 2018
28
WIRELINE LOGGING RESPONSE AND TRUE CORE ANALYSIS
OF THE UPPER SHALE MEMBER OF ZUBAIR FORMATION,
RUMAILA OILFIELD, SOUTHERN IRAQ
Mohanad H. Al-Jaberi1 and
Hayder K. Al-Mayyahi*
1Department of Geology, College of Science, University of Basra, Basrah, Iraq
*Basra Oil Company, Basra, Iraq, e-mail: [email protected]
Received: 10 April 2018; accepted: 15 May 2018
ABSTRACT Sedimentary rocks can be defined from others not only by their lithology,
structures, fossil content, geometry and sedimentary but furthermore by their general
response to the wireline logs. This study involves the determination of the properties
of Upper Shale Member of Zubair Formation (Lower Cretaceous) in Rumaila oilfield
by using several log interpretation software through wireline logging response of
lithology. Many wells were chosen in Rumaila oilfield to know the lithology of Upper
Shale Member, in addition to calculating permeability for Rumaila oilfield by using
eight wells through Rumaila cross-section. The Gamma Ray log responses of clean
sand range between 30 – 40 API, while it decreased in the case of silt and clay
cemented sand grain. Sandstones are dominated in the south of Rumaila, this could
increase the porosity and permeability of the rocks. While clay and shale are
dominated in the north of Rumaila. Log responses don’t give a true representation for
formation lithology if comparison with true core lithology by using grain size
analysis.
Keywords: Electrofacies; Zubair Formation; Rumaila oilfield; Wireline log
INTRODUCTION Electrofacies analysis is important to clarify the lithological type from wire logging
responses and then to interpret reservoir limited and characterize (Schmitt et al., 2012).
The main element to determine electrofacies is log and core data integration.
Recognition of electrofacies in various types of depositional environments can be
reached through inductive and deductive practices (Marwanza and Nas, 2017(. The term
electrofacies was originally defined as a set of logs response that characterizes a bed and
Iraqi Geological Journal Al-Jaberi and Al-Mayyahi Vol.51, No.2, 2018
29
authorized it to be distinguished from the others (Serra and Abbot, 1980). Electrofacies
are based on properties taken from incessant remote measurements at scales starting
from one meter and more, while geological facies are based primarily on observational
characteristics taken at scales down to millimetres (Doveton, 1994). Electrofacies are
defined as a set of technologies used typically to provide assistance in performing
sequence stratigraphy and recognize rock types with common properties. However,
electherofacies can’t totally determine geology facies (Ramezani et al., 2017). Such a
useful lithofacies can result from orthodox core description combined with wireline log
data due to the wireline log data are related to petrophysical parameters including
permeability, water saturation and porosity (Hwan Woo et al., 2018). In this study, open
hole logs (spontaneous potential, gamma ray, caliper, shallow-medium and deep
resistivity, neutron, density, sonic, photoelectric factor and nuclear magnetic resonance)
were calibrated depending on the lithological discrepancies defined in the core samples.
The potential capability of multivariate analysis in distinguishing each electrofacies was
analysed based on recognition of geological facies within the core samples.
Encouraging results were acquired after applying such techniques mouth bars;
distributary channels, porosity-permeability relationships were established depending
on the defined electrofacies. This study is going to discuss the electrofacies application
using wireline log and true core analyse on the Upper Shale Member of the Zubair
reservoir to define the reservoir characterization.
THE STUDY AREA The Rumaila oilfield is located of about fifty Km to the northeast of North Luhais
oilfield in the Basrah city, southern Iraq. The field lies approximately between
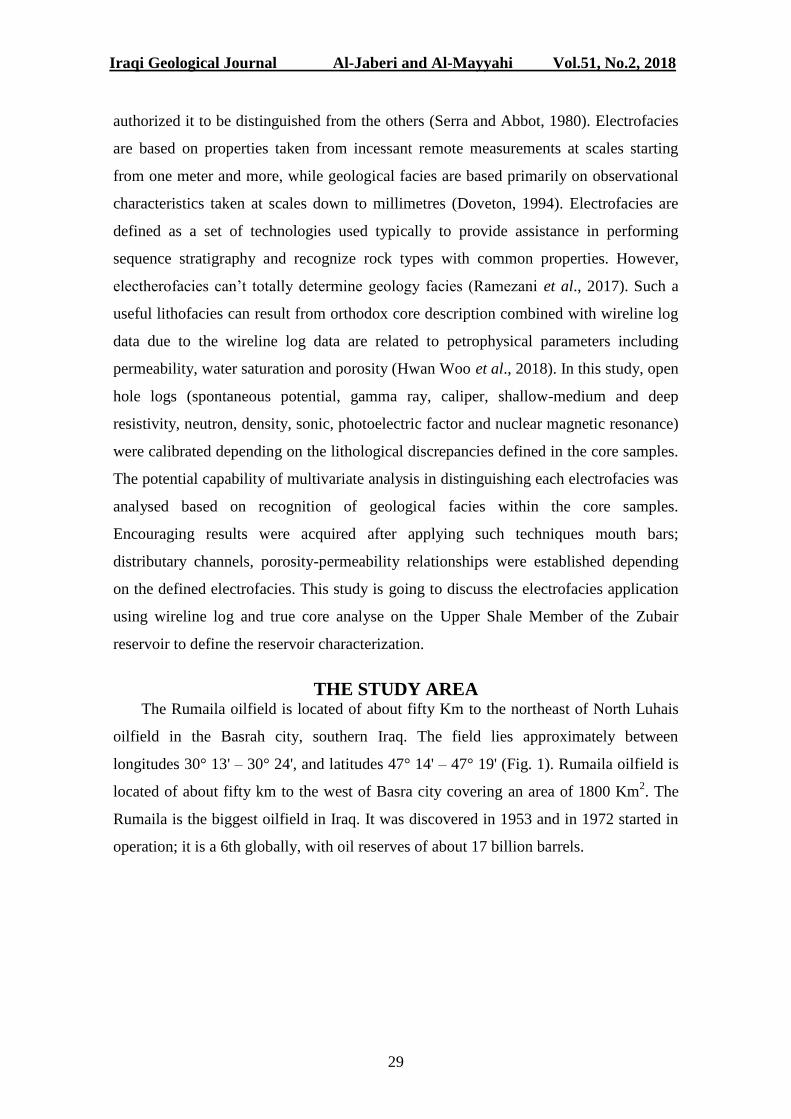
longitudes 30° 13' – 30° 24', and latitudes 47° 14' – 47° 19' (Fig. 1). Rumaila oilfield is
located of about fifty km to the west of Basra city covering an area of 1800 Km2. The
Rumaila is the biggest oilfield in Iraq. It was discovered in 1953 and in 1972 started in
operation; it is a 6th globally, with oil reserves of about 17 billion barrels.
Iraqi Geological Journal Al-Jaberi and Al-Mayyahi Vol.51, No.2, 2018
30
Fig. 1: Location map shows the Rumaila oilfield; Permeability wells,
Core samples wells
METHODS The petrophysical data was processed by employing deductive and inductive
approaches so as to get the most from both methods (Doveton, 1994; Moss, 1997). The
first step of the integrated approach is the application of hierarchical clustering methods
to identify electrofacies groups using log curves (Saikia and Baruah, 2017). Deductive
approaches include those procedures that seek to distinguish the data by the calculation
of a set of component proportions that can be identified through linking with wireline
log data by some set of response equations (Moss, 1997). In this research, the Rumaila
wells project were examined by Petrel software for distributing net sand and calculate
the porosity for all Rumaila oilfield. The best cross-section that passes through eight
wells were chosen, four wells in the south (Ru-382, Ru-385, Ru- 387 and 456) and four
in the north (R-516, R-522, R-520 and R-564) to measure permeability through NMR
wireline log by Techlog software. The model was build taking into account the
components and variables numbers (curves of data). Generally, mismatches and gross
errors detection measurements are comprised in the practices although mathematical
constancy cannot be guaranteed of geological accuracy. This situation is well
represented by standard log analysis. On the contrary, an inductive approach establishes
their classes or transformations rely on the data set and don't rely on any pre-determined
R-572
Ru-387
Ru-215
Ru-387
R-031
Iraqi Geological Journal Al-Jaberi and Al-Mayyahi Vol.51, No.2, 2018
31
correlation between the components. These procedures tend to isolate distinctive
patterns and to derive classifications or new variables that may be interpreted with a
physical meaning. Real lithology representation with wireline log responses chose two
core samples (R-031and Ru-215) and focused on grain size analysis of Upper shale
units’ depth (Table 3) and comparison with wireline log by Geologix software.
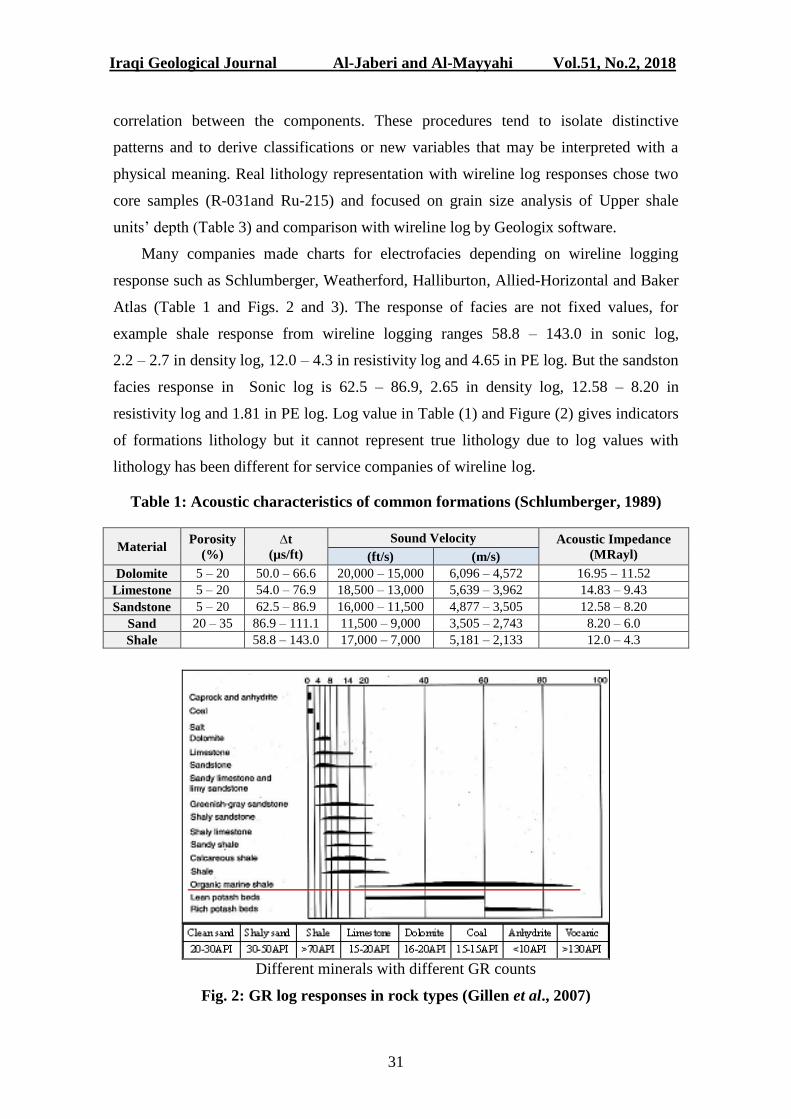
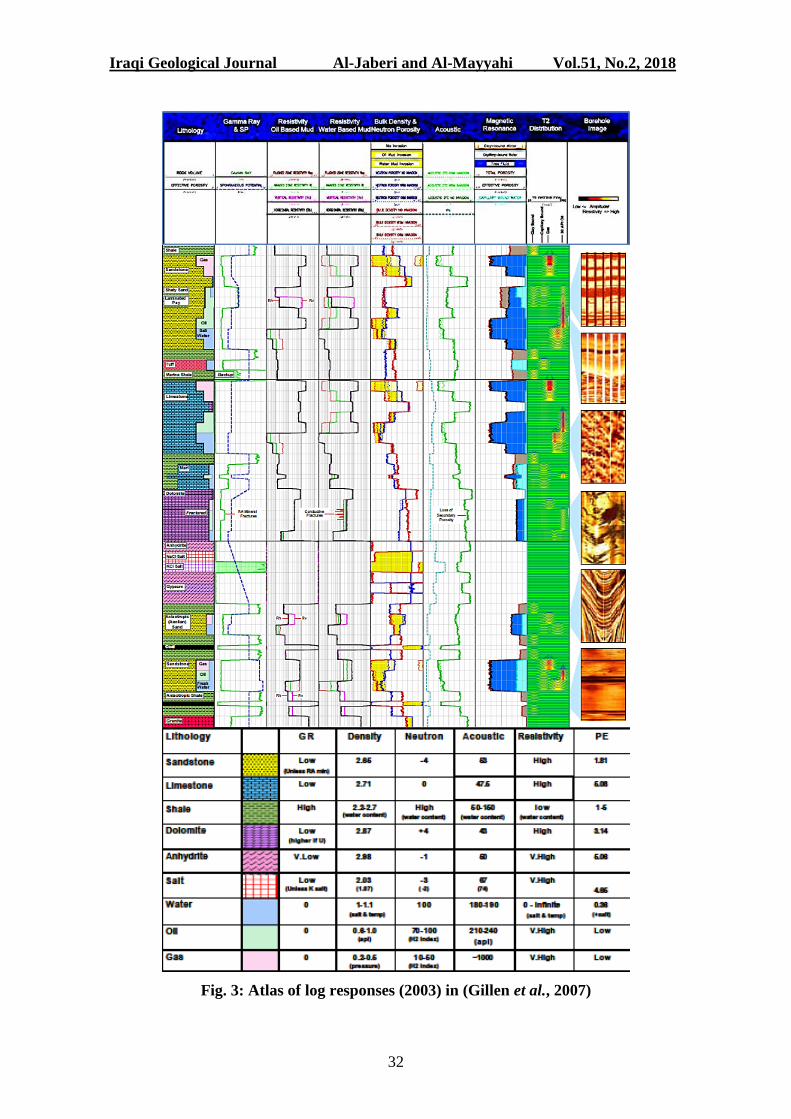
Many companies made charts for electrofacies depending on wireline logging
response such as Schlumberger, Weatherford, Halliburton, Allied-Horizontal and Baker
Atlas (Table 1 and Figs. 2 and 3). The response of facies are not fixed values, for
example shale response from wireline logging ranges 58.8 – 143.0 in sonic log,
2.2 – 2.7 in density log, 12.0 – 4.3 in resistivity log and 4.65 in PE log. But the sandston
facies response in Sonic log is 62.5 – 86.9, 2.65 in density log, 12.58 – 8.20 in
resistivity log and 1.81 in PE log. Log value in Table (1) and Figure (2) gives indicators
of formations lithology but it cannot represent true lithology due to log values with
lithology has been different for service companies of wireline log.
Table 1: Acoustic characteristics of common formations (Schlumberger, 1989)
Material Porosity
(%)
∆t
(µs/ft)
Sound Velocity Acoustic Impedance
(MRayl) (ft/s) (m/s)
Dolomite 5 – 20 50.0 – 66.6 20,000 – 15,000 6,096 – 4,572 16.95 – 11.52
Limestone 5 – 20 54.0 – 76.9 18,500 – 13,000 5,639 – 3,962 14.83 – 9.43
Sandstone 5 – 20 62.5 – 86.9 16,000 – 11,500 4,877 – 3,505 12.58 – 8.20
Sand 20 – 35 86.9 – 111.1 11,500 – 9,000 3,505 – 2,743 8.20 – 6.0
Shale 58.8 – 143.0 17,000 – 7,000 5,181 – 2,133 12.0 – 4.3
Different minerals with different GR counts
Fig. 2: GR log responses in rock types (Gillen et al., 2007)
Iraqi Geological Journal Al-Jaberi and Al-Mayyahi Vol.51, No.2, 2018
32
Fig. 3: Atlas of log responses (2003) in (Gillen et al., 2007)
Iraqi Geological Journal Al-Jaberi and Al-Mayyahi Vol.51, No.2, 2018
33
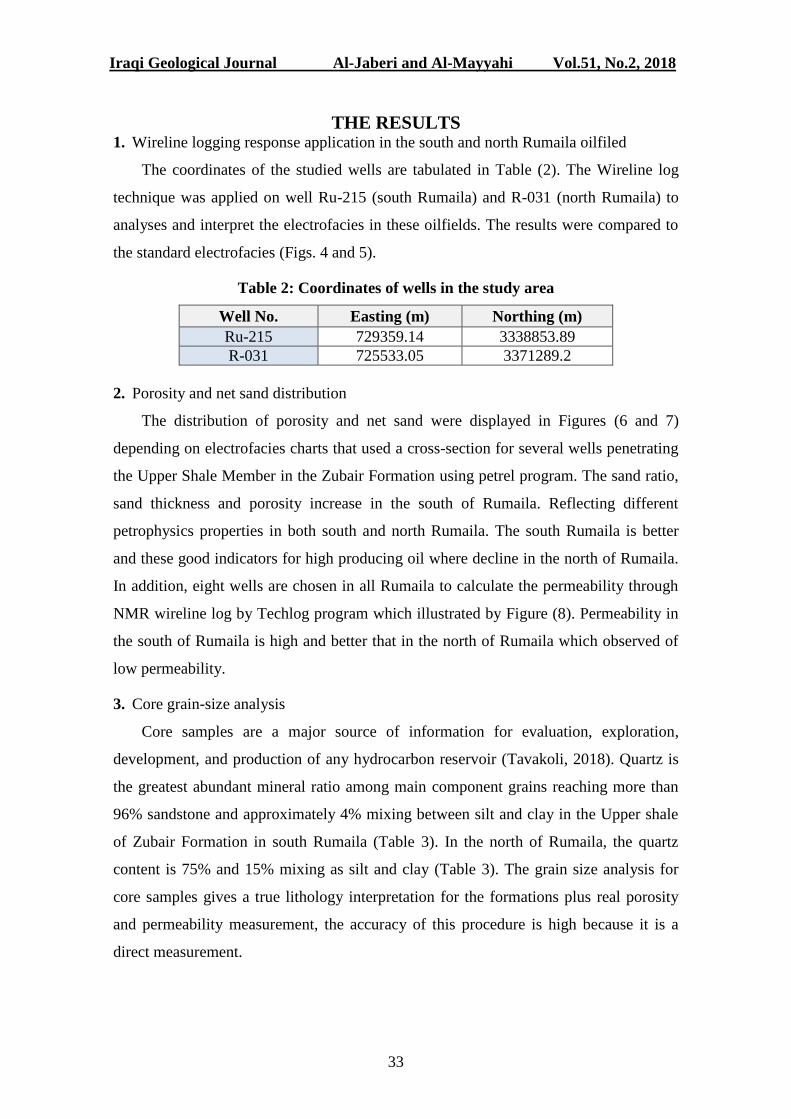
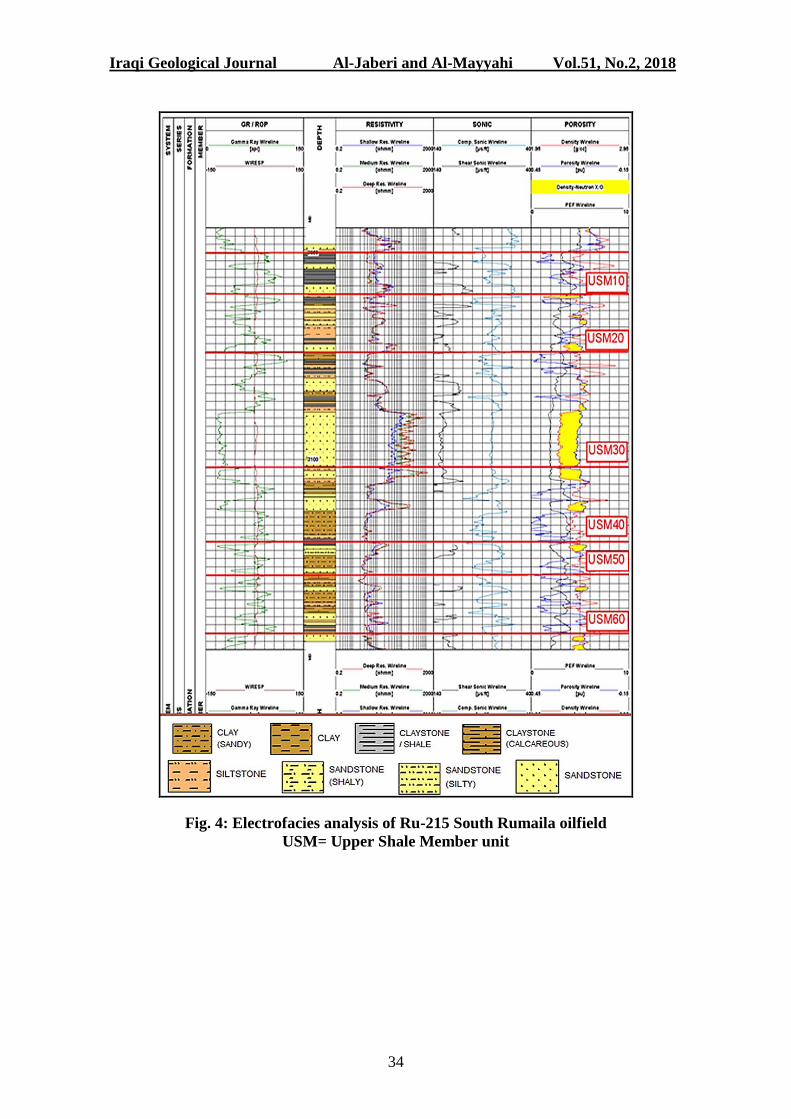
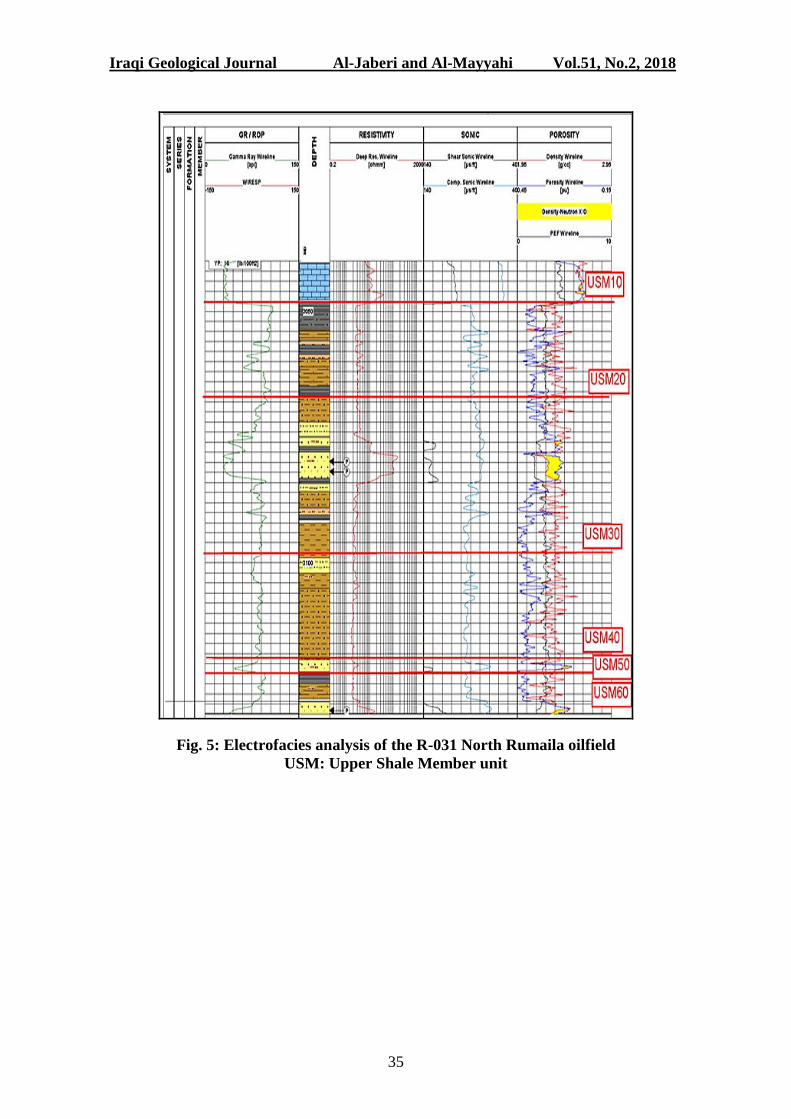
THE RESULTS 1. Wireline logging response application in the south and north Rumaila oilfiled
The coordinates of the studied wells are tabulated in Table (2). The Wireline log
technique was applied on well Ru-215 (south Rumaila) and R-031 (north Rumaila) to
analyses and interpret the electrofacies in these oilfields. The results were compared to
the standard electrofacies (Figs. 4 and 5).
Table 2: Coordinates of wells in the study area
Well No. Easting (m) Northing (m)
Ru-215 729359.14 3338853.89
R-031 725533.05 3371289.2
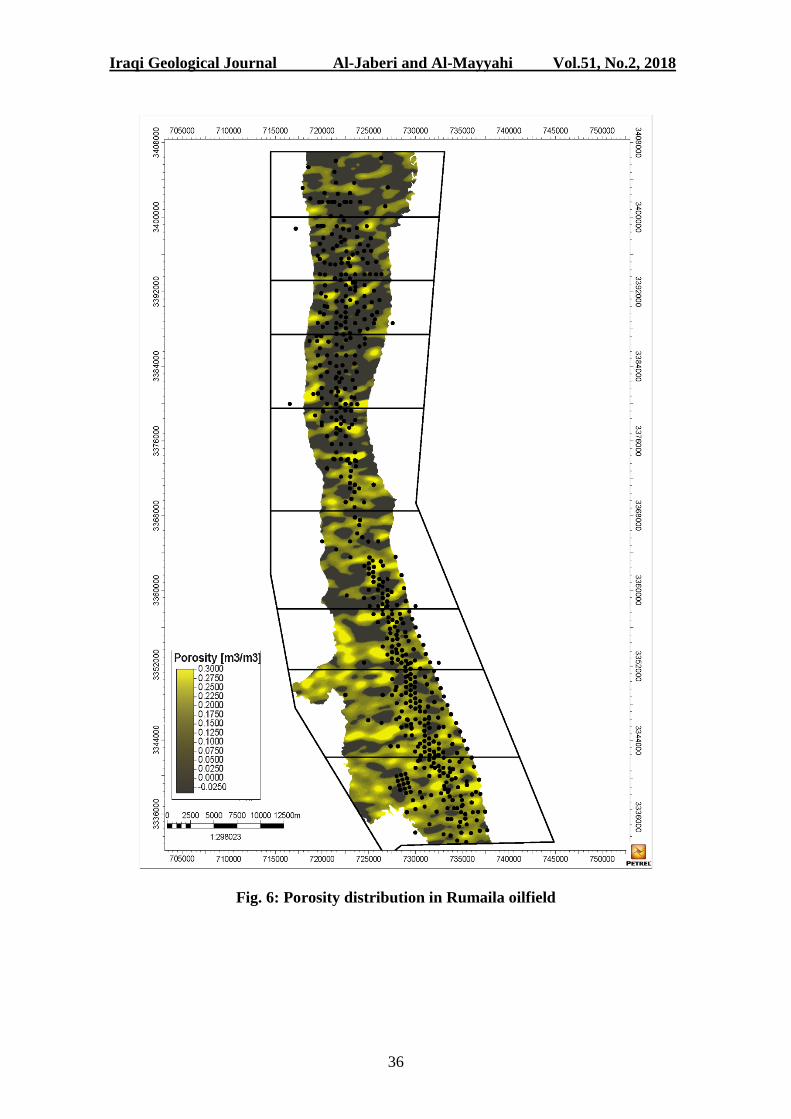
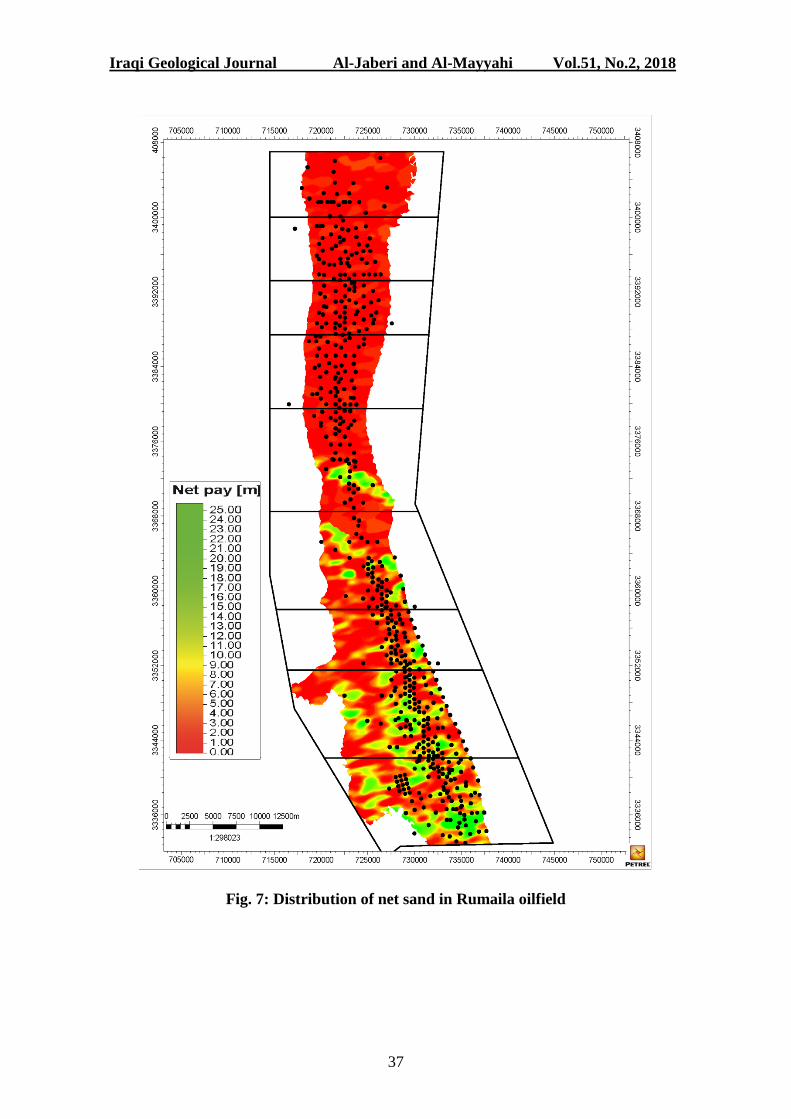
2. Porosity and net sand distribution
The distribution of porosity and net sand were displayed in Figures (6 and 7)
depending on electrofacies charts that used a cross-section for several wells penetrating
the Upper Shale Member in the Zubair Formation using petrel program. The sand ratio,
sand thickness and porosity increase in the south of Rumaila. Reflecting different
petrophysics properties in both south and north Rumaila. The south Rumaila is better
and these good indicators for high producing oil where decline in the north of Rumaila.
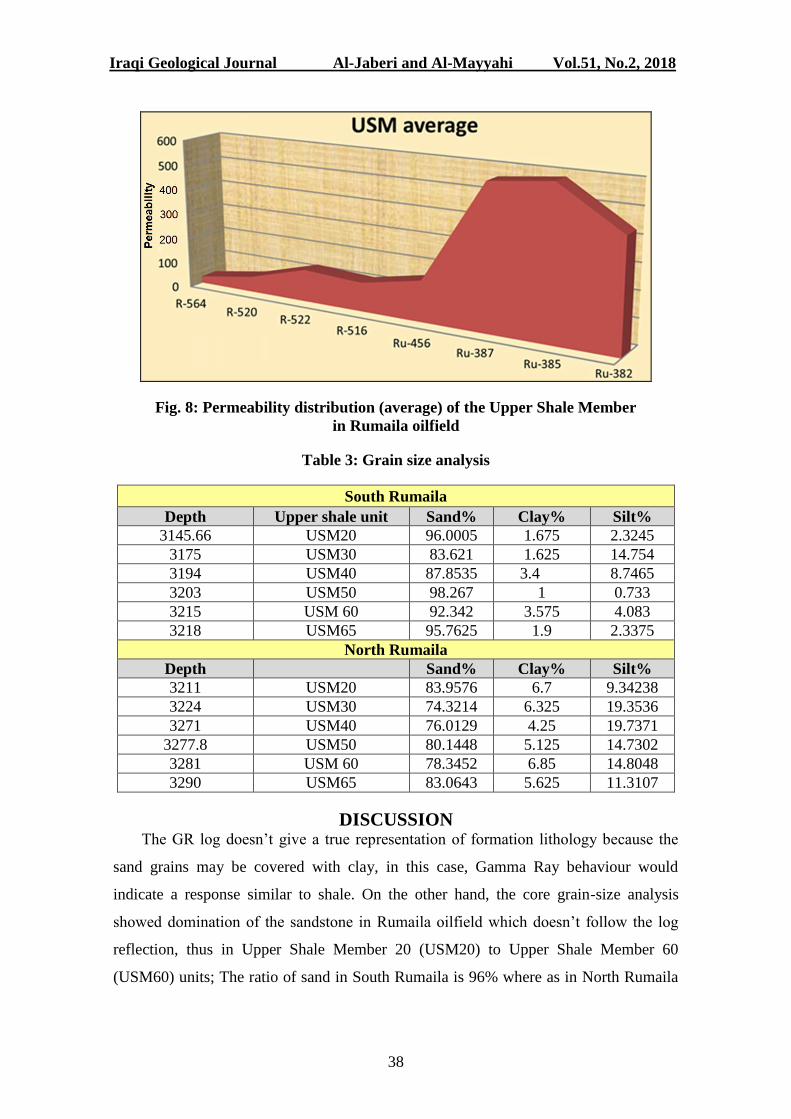
In addition, eight wells are chosen in all Rumaila to calculate the permeability through
NMR wireline log by Techlog program which illustrated by Figure (8). Permeability in
the south of Rumaila is high and better that in the north of Rumaila which observed of
low permeability.
3. Core grain-size analysis
Core samples are a major source of information for evaluation, exploration,
development, and production of any hydrocarbon reservoir (Tavakoli, 2018). Quartz is
the greatest abundant mineral ratio among main component grains reaching more than
96% sandstone and approximately 4% mixing between silt and clay in the Upper shale
of Zubair Formation in south Rumaila (Table 3). In the north of Rumaila, the quartz
content is 75% and 15% mixing as silt and clay (Table 3). The grain size analysis for
core samples gives a true lithology interpretation for the formations plus real porosity
and permeability measurement, the accuracy of this procedure is high because it is a
direct measurement.
Iraqi Geological Journal Al-Jaberi and Al-Mayyahi Vol.51, No.2, 2018
34
Fig. 4: Electrofacies analysis of Ru-215 South Rumaila oilfield
USM= Upper Shale Member unit
Iraqi Geological Journal Al-Jaberi and Al-Mayyahi Vol.51, No.2, 2018
35
Fig. 5: Electrofacies analysis of the R-031 North Rumaila oilfield
USM: Upper Shale Member unit
Iraqi Geological Journal Al-Jaberi and Al-Mayyahi Vol.51, No.2, 2018
36
Fig. 6: Porosity distribution in Rumaila oilfield
Iraqi Geological Journal Al-Jaberi and Al-Mayyahi Vol.51, No.2, 2018
37
Fig. 7: Distribution of net sand in Rumaila oilfield
Iraqi Geological Journal Al-Jaberi and Al-Mayyahi Vol.51, No.2, 2018
38
Fig. 8: Permeability distribution (average) of the Upper Shale Member
in Rumaila oilfield
Table 3: Grain size analysis
South Rumaila
Depth Upper shale unit Sand% Clay% Silt%
3145.66 USM20 96.0005 1.675 2.3245
3175 USM30 83.621 1.625 14.754
3194 USM40 87.8535 3.4 8.7465
3203 USM50 98.267 1 0.733
3215 USM 60 92.342 3.575 4.083
3218 USM65 95.7625 1.9 2.3375
North Rumaila
Depth Sand% Clay% Silt%
3211 USM20 83.9576 6.7 9.34238
3224 USM30 74.3214 6.325 19.3536
3271 USM40 76.0129 4.25 19.7371
3277.8 USM50 80.1448 5.125 14.7302
3281 USM 60 78.3452 6.85 14.8048
3290 USM65 83.0643 5.625 11.3107
DISCUSSION The GR log doesn’t give a true representation of formation lithology because the
sand grains may be covered with clay, in this case, Gamma Ray behaviour would
indicate a response similar to shale. On the other hand, the core grain-size analysis
showed domination of the sandstone in Rumaila oilfield which doesn’t follow the log
reflection, thus in Upper Shale Member 20 (USM20) to Upper Shale Member 60
(USM60) units; The ratio of sand in South Rumaila is 96% where as in North Rumaila
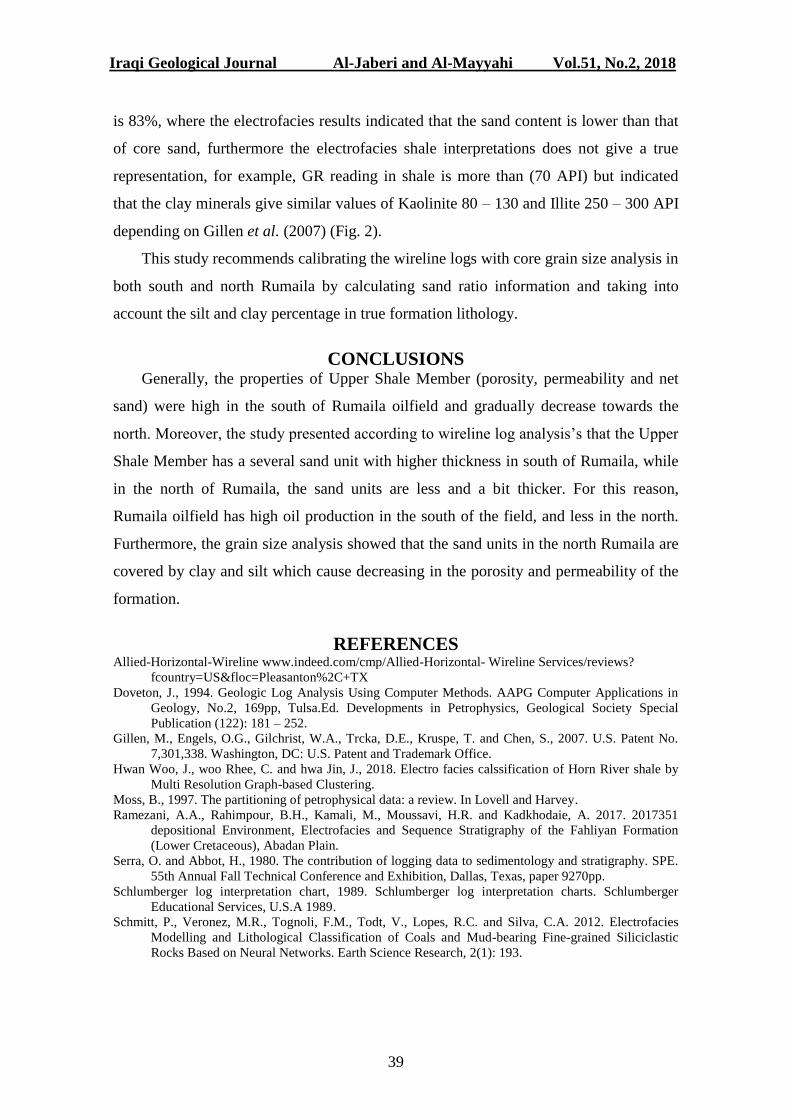
Iraqi Geological Journal Al-Jaberi and Al-Mayyahi Vol.51, No.2, 2018
39
is 83%, where the electrofacies results indicated that the sand content is lower than that
of core sand, furthermore the electrofacies shale interpretations does not give a true
representation, for example, GR reading in shale is more than (70 API) but indicated
that the clay minerals give similar values of Kaolinite 80 – 130 and Illite 250 – 300 API
depending on Gillen et al. (2007) (Fig. 2).
This study recommends calibrating the wireline logs with core grain size analysis in
both south and north Rumaila by calculating sand ratio information and taking into
account the silt and clay percentage in true formation lithology.
CONCLUSIONS Generally, the properties of Upper Shale Member (porosity, permeability and net
sand) were high in the south of Rumaila oilfield and gradually decrease towards the
north. Moreover, the study presented according to wireline log analysis’s that the Upper
Shale Member has a several sand unit with higher thickness in south of Rumaila, while
in the north of Rumaila, the sand units are less and a bit thicker. For this reason,
Rumaila oilfield has high oil production in the south of the field, and less in the north.
Furthermore, the grain size analysis showed that the sand units in the north Rumaila are
covered by clay and silt which cause decreasing in the porosity and permeability of the
formation.
REFERENCES Allied-Horizontal-Wireline www.indeed.com/cmp/Allied-Horizontal- Wireline Services/reviews?
fcountry=US&floc=Pleasanton%2C+TX
Doveton, J., 1994. Geologic Log Analysis Using Computer Methods. AAPG Computer Applications in
Geology, No.2, 169pp, Tulsa.Ed. Developments in Petrophysics, Geological Society Special
Publication (122): 181 – 252.
Gillen, M., Engels, O.G., Gilchrist, W.A., Trcka, D.E., Kruspe, T. and Chen, S., 2007. U.S. Patent No.
7,301,338. Washington, DC: U.S. Patent and Trademark Office.
Hwan Woo, J., woo Rhee, C. and hwa Jin, J., 2018. Electro facies calssification of Horn River shale by
Multi Resolution Graph-based Clustering.
Moss, B., 1997. The partitioning of petrophysical data: a review. In Lovell and Harvey.
Ramezani, A.A., Rahimpour, B.H., Kamali, M., Moussavi, H.R. and Kadkhodaie, A. 2017. 2017351
depositional Environment, Electrofacies and Sequence Stratigraphy of the Fahliyan Formation
(Lower Cretaceous), Abadan Plain.
Serra, O. and Abbot, H., 1980. The contribution of logging data to sedimentology and stratigraphy. SPE.
55th Annual Fall Technical Conference and Exhibition, Dallas, Texas, paper 9270pp.
Schlumberger log interpretation chart, 1989. Schlumberger log interpretation charts. Schlumberger
Educational Services, U.S.A 1989.
Schmitt, P., Veronez, M.R., Tognoli, F.M., Todt, V., Lopes, R.C. and Silva, C.A. 2012. Electrofacies
Modelling and Lithological Classification of Coals and Mud-bearing Fine-grained Siliciclastic
Rocks Based on Neural Networks. Earth Science Research, 2(1): 193.

Iraqi Geological Journal Al-Jaberi and Al-Mayyahi Vol.51, No.2, 2018
40
Saikia, K. and Baruah, C., 2017, April. A Practical Solution to Overcome Challenges in Unconventional
Reservoir Simulation and History Matching Using Integrated Petrophysical and Facies Modeling
Approach. In SPE Oil and Gas India Conference and Exhibition. Society of Petroleum Engineers.
Tavakoli, V., 2018. Core Analysis: An Introduction. In Geological Core Analysis. Springer, Cham,
1 – 13.