Embed Size (px)
Citation preview

Wirelessly WonderfulSolutions for IoT
test challenges
5/26/2017
Alessandro Salsano
Key Account Manager
A&D
Agenda
• Major IoT Design and test challenges
1. Maximizing your device’s battery life
2. Debug complex digital/analog/RF system problems
3. Speeding your device through EMC compliance
4. Speeding your device through Wireless certification
5. Preparing for IoT network deployment
2
35/26/2017
4
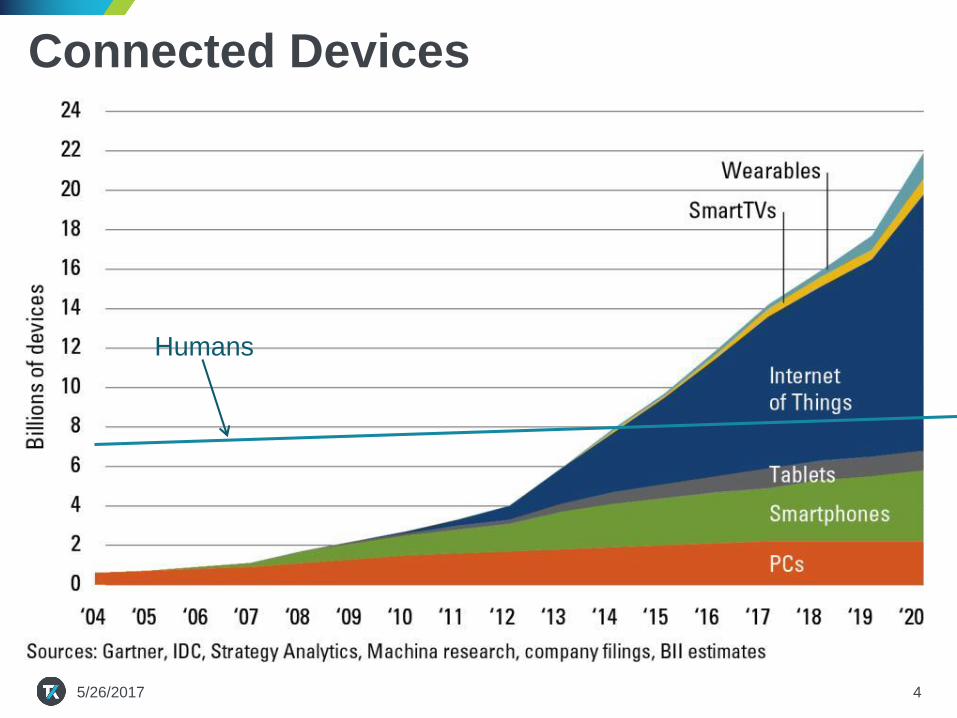
Humans
Connected Devices
5/26/2017
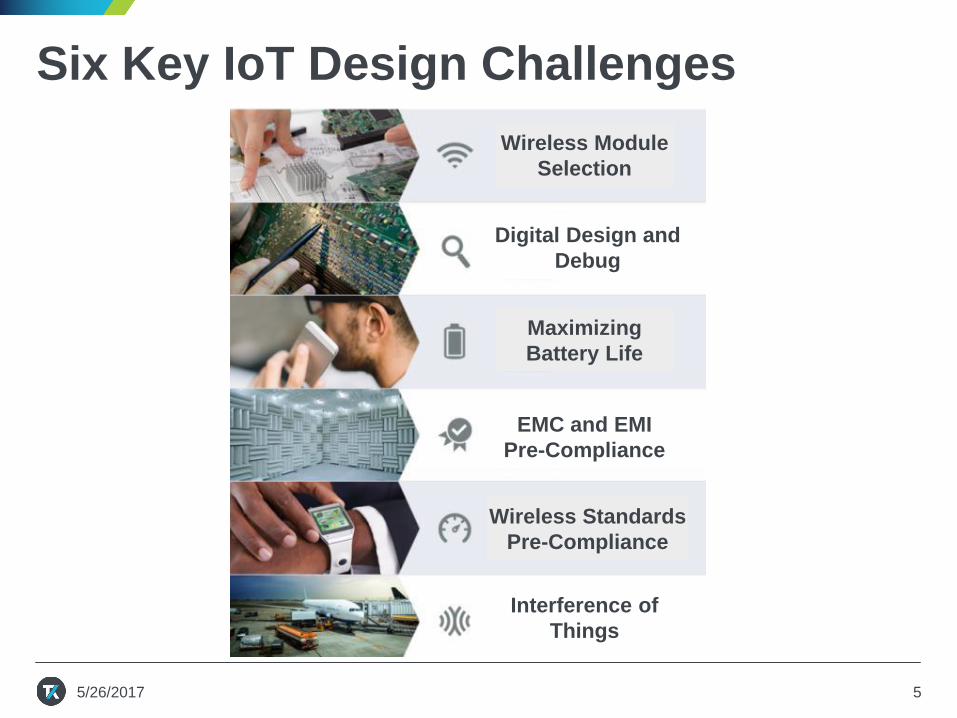
Six Key IoT Design Challenges
5
Wireless Module
Selection
Maximizing
Battery Life
Wireless Standards
Pre-Compliance
Digital Design and
Debug
EMC and EMI
Pre-Compliance
Interference of
Things
5/26/2017

IoT Design and Test Challenge #1
Maximizing your device’s battery life
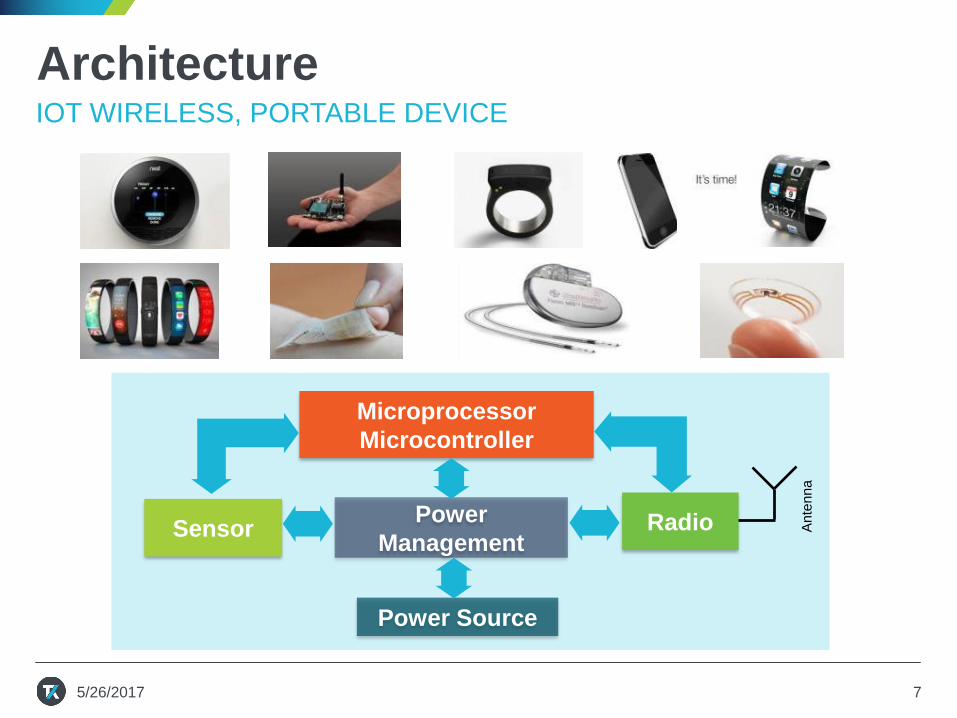
ArchitectureIOT WIRELESS, PORTABLE DEVICE
Sensor
Microprocessor
Microcontroller
Power
ManagementRadio
Power Source
An
ten
na
75/26/2017
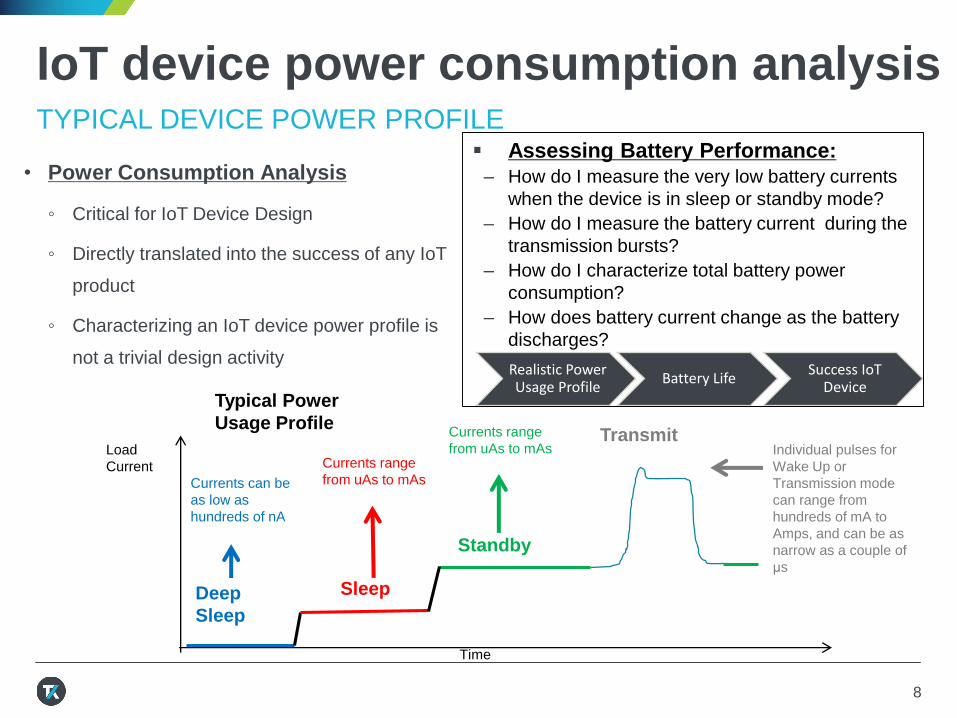
IoT device power consumption analysisTYPICAL DEVICE POWER PROFILE
• Power Consumption Analysis
◦ Critical for IoT Device Design
◦ Directly translated into the success of any IoT
product
◦ Characterizing an IoT device power profile is
not a trivial design activityRealistic Power Usage Profile
Battery LifeSuccess IoT
Device
TransmitIndividual pulses for
Wake Up or
Transmission mode
can range from
hundreds of mA to
Amps, and can be as
narrow as a couple of
μs
Deep
Sleep
Currents can be
as low as
hundreds of nA
Load
Current
Sleep
Standby
Time
Currents range
from uAs to mAs
Currents range
from uAs to mAs
Typical Power
Usage Profile
▪ Assessing Battery Performance:
– How do I measure the very low battery currents
when the device is in sleep or standby mode?
– How do I measure the battery current during the
transmission bursts?
– How do I characterize total battery power
consumption?
– How does battery current change as the battery
discharges?
8
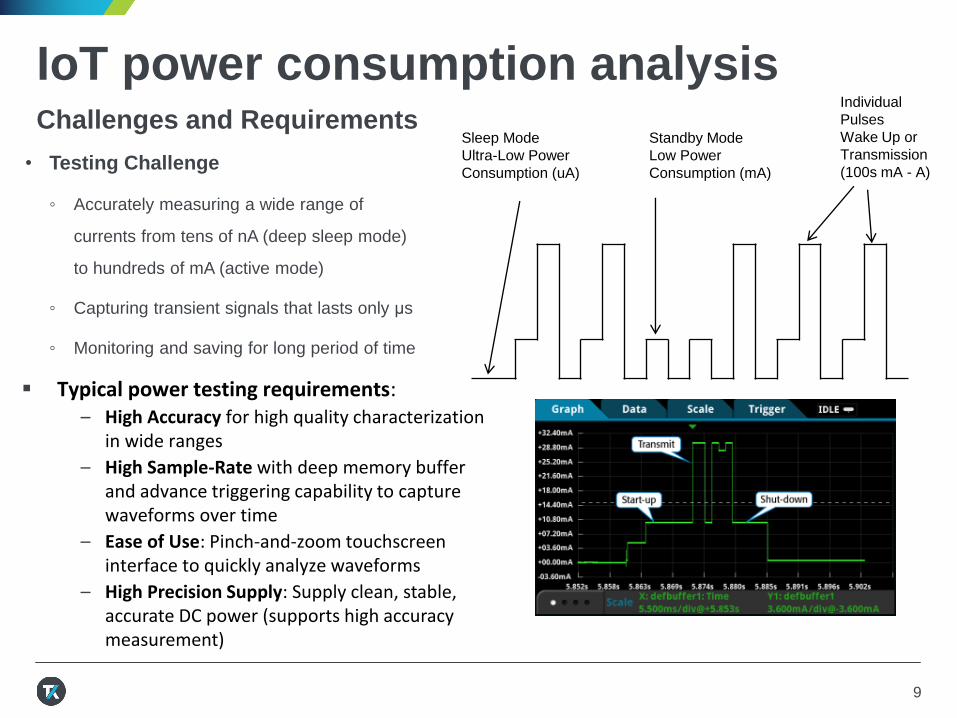
IoT power consumption analysisChallenges and Requirements
• Testing Challenge
◦ Accurately measuring a wide range of
currents from tens of nA (deep sleep mode)
to hundreds of mA (active mode)
◦ Capturing transient signals that lasts only μs
◦ Monitoring and saving for long period of time
▪ Typical power testing requirements:– High Accuracy for high quality characterization
in wide ranges
– High Sample-Rate with deep memory buffer and advance triggering capability to capture waveforms over time
– Ease of Use: Pinch-and-zoom touchscreen interface to quickly analyze waveforms
– High Precision Supply: Supply clean, stable, accurate DC power (supports high accuracy measurement)
Individual
Pulses
Wake Up or
Transmission
(100s mA - A)
Sleep Mode
Ultra-Low Power
Consumption (uA)
Standby Mode
Low Power
Consumption (mA)
9
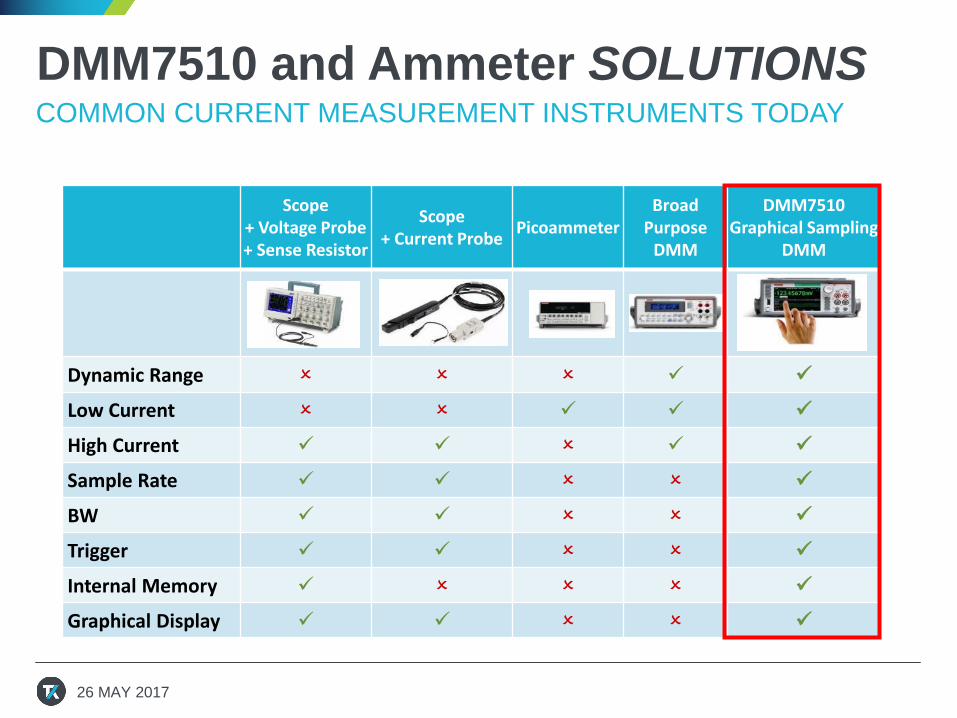
Scope + Voltage Probe + Sense Resistor
Scope+ Current Probe
PicoammeterBroad
Purpose DMM
DMM7510Graphical Sampling
DMM
Dynamic Range ✓ ✓
Low Current ✓ ✓ ✓
High Current ✓ ✓ ✓ ✓
Sample Rate ✓ ✓ ✓
BW ✓ ✓ ✓
Trigger ✓ ✓ ✓
Internal Memory ✓ ✓
Graphical Display ✓ ✓ ✓
DMM7510 and Ammeter SOLUTIONSCOMMON CURRENT MEASUREMENT INSTRUMENTS TODAY
26 MAY 2017
26 MAY 2017 11
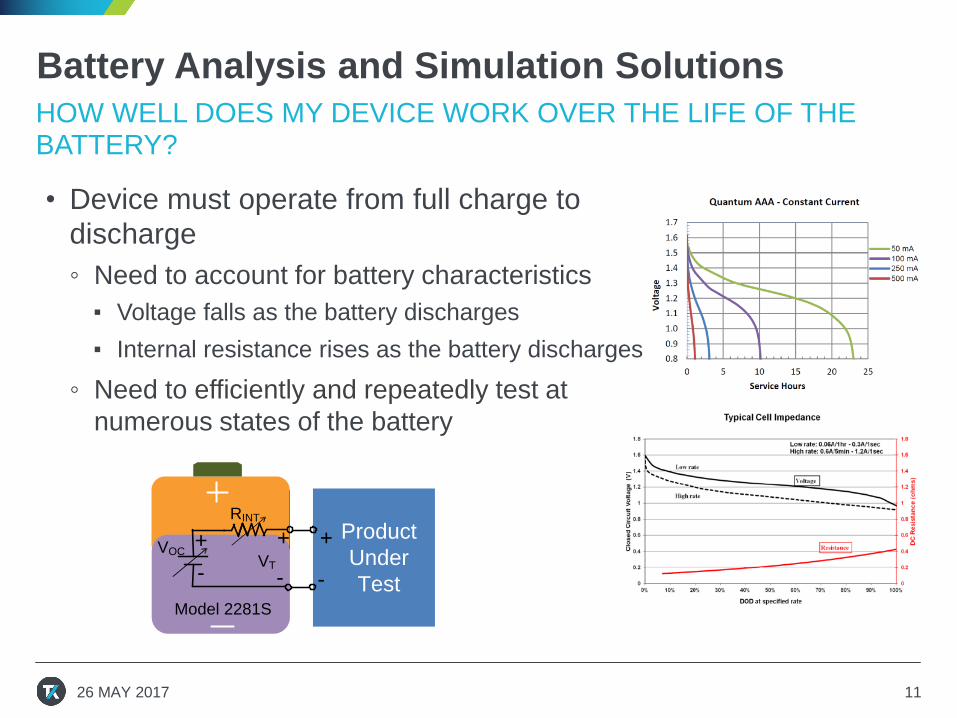
Battery Analysis and Simulation Solutions
HOW WELL DOES MY DEVICE WORK OVER THE LIFE OF THE BATTERY?
• Device must operate from full charge to
discharge
◦ Need to account for battery characteristics
▪ Voltage falls as the battery discharges
▪ Internal resistance rises as the battery discharges
◦ Need to efficiently and repeatedly test at
numerous states of the battery
VOCVT
++
- -
Product
Under
Test
+
-
RINT
Model 2281S
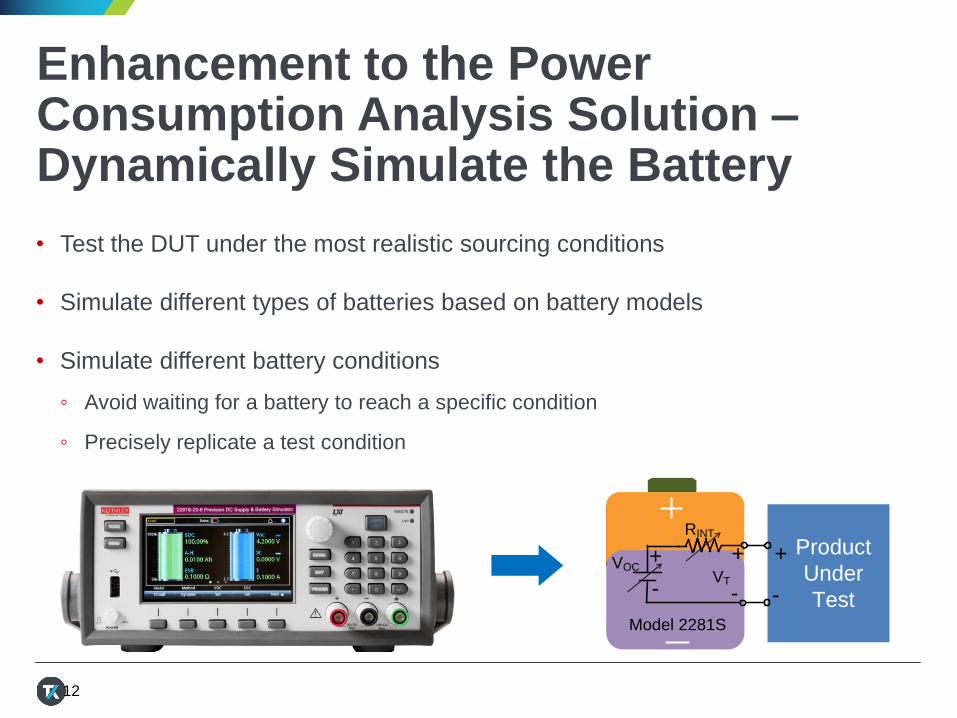
Enhancement to the Power Consumption Analysis Solution –Dynamically Simulate the Battery
• Test the DUT under the most realistic sourcing conditions
• Simulate different types of batteries based on battery models
• Simulate different battery conditions
◦ Avoid waiting for a battery to reach a specific condition
◦ Precisely replicate a test condition
12
VOCVT
++
- -
Product
Under
Test
+
-
RINT
Model 2281S
26 MAY 2017 13
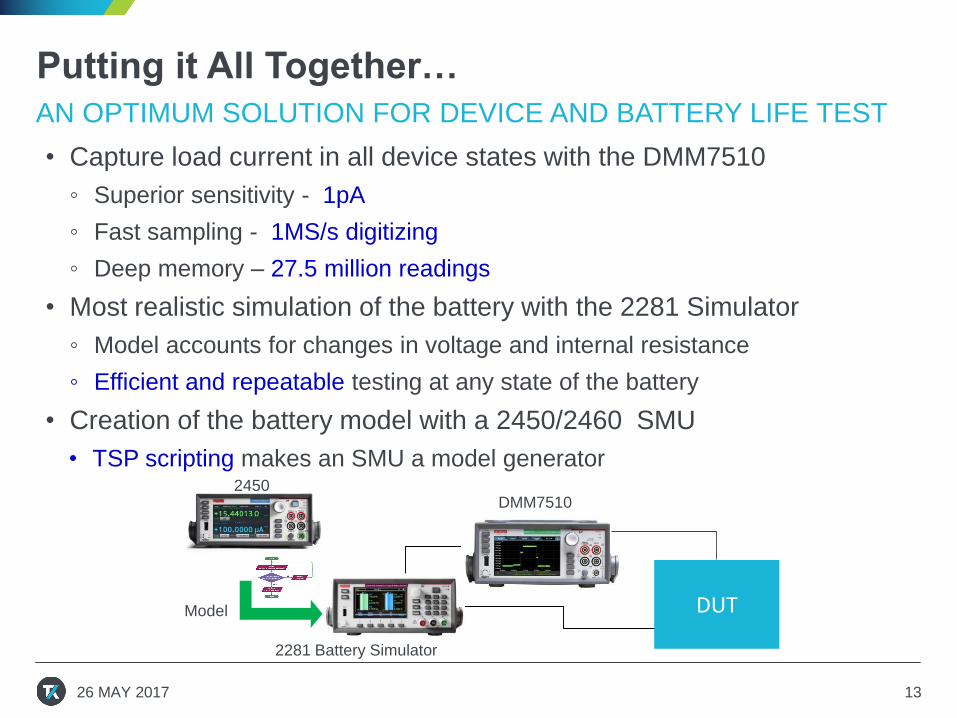
Putting it All Together…
• Capture load current in all device states with the DMM7510
◦ Superior sensitivity - 1pA
◦ Fast sampling - 1MS/s digitizing
◦ Deep memory – 27.5 million readings
• Most realistic simulation of the battery with the 2281 Simulator
◦ Model accounts for changes in voltage and internal resistance
◦ Efficient and repeatable testing at any state of the battery
• Creation of the battery model with a 2450/2460 SMU
• TSP scripting makes an SMU a model generator
DUT
DMM7510
2281 Battery Simulator
2450
Model
AN OPTIMUM SOLUTION FOR DEVICE AND BATTERY LIFE TEST
IoT Design and Test Challenge #3
Debug complex digital/analog/RF system problems
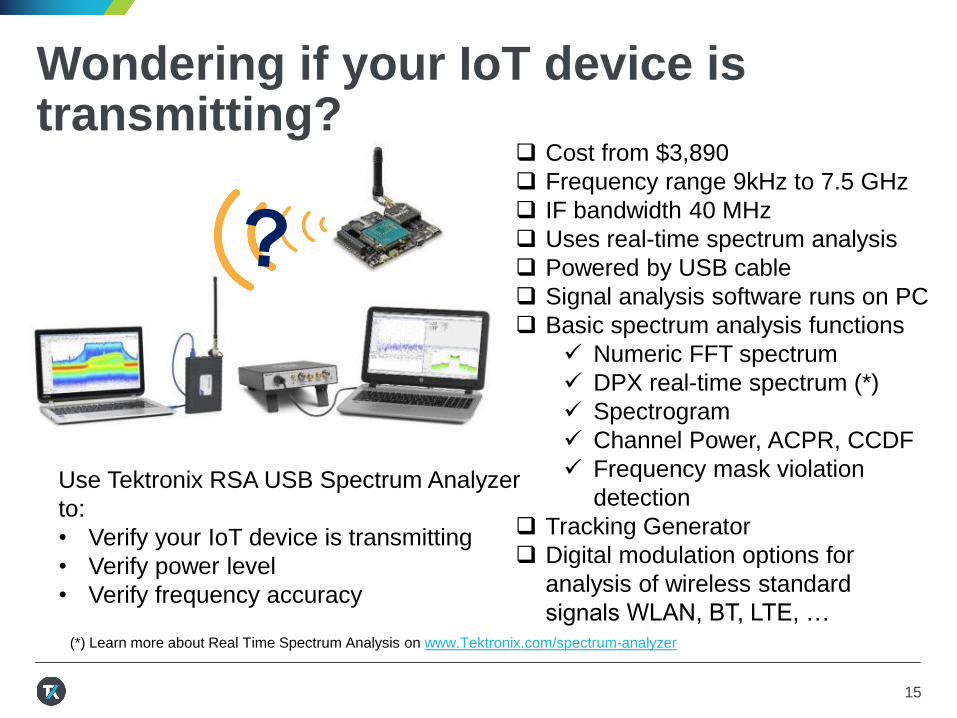
Wondering if your IoT device is transmitting?
Use Tektronix RSA USB Spectrum Analyzer
to:
• Verify your IoT device is transmitting
• Verify power level
• Verify frequency accuracy
15
Cost from $3,890
Frequency range 9kHz to 7.5 GHz
IF bandwidth 40 MHz
Uses real-time spectrum analysis
Powered by USB cable
Signal analysis software runs on PC
Basic spectrum analysis functions
✓ Numeric FFT spectrum
✓ DPX real-time spectrum (*)
✓ Spectrogram
✓ Channel Power, ACPR, CCDF
✓ Frequency mask violation
detection
Tracking Generator
Digital modulation options for
analysis of wireless standard
signals WLAN, BT, LTE, …(*) Learn more about Real Time Spectrum Analysis on www.Tektronix.com/spectrum-analyzer
Basics of Real-Time Analysis
MP APRIL
2015
BASICS OF REAL-TIME SPECTRUM ANALYSIS
16
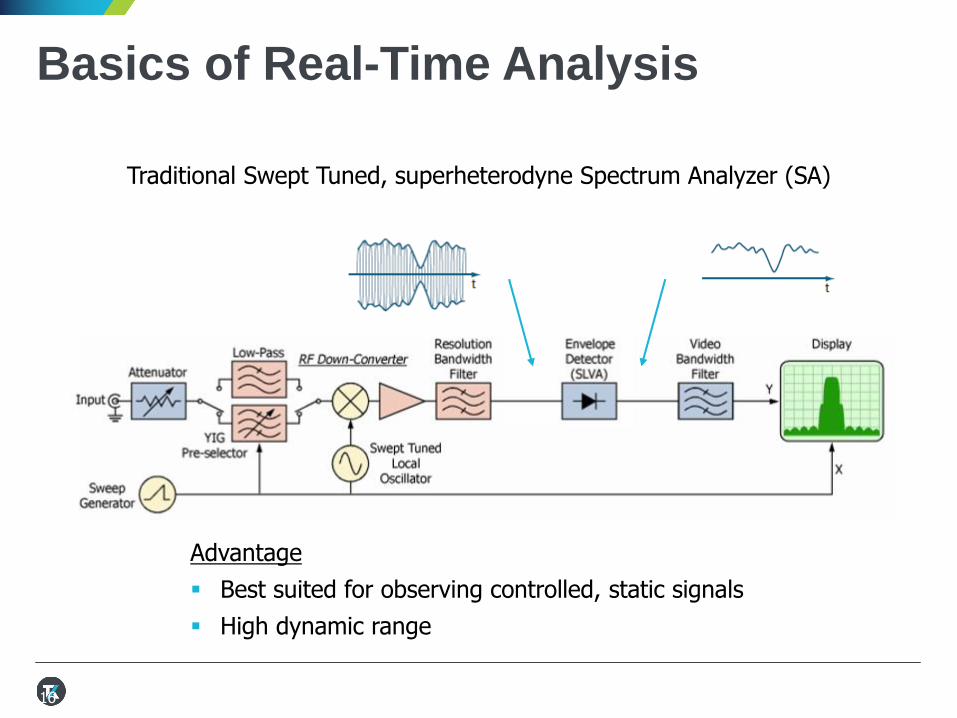
Traditional Swept Tuned, superheterodyne Spectrum Analyzer (SA)
Advantage
▪ Best suited for observing controlled, static signals
▪ High dynamic range
Basics of Real-Time Analysis
MP APRIL
2015
BASICS OF REAL-TIME SPECTRUM ANALYSIS
17
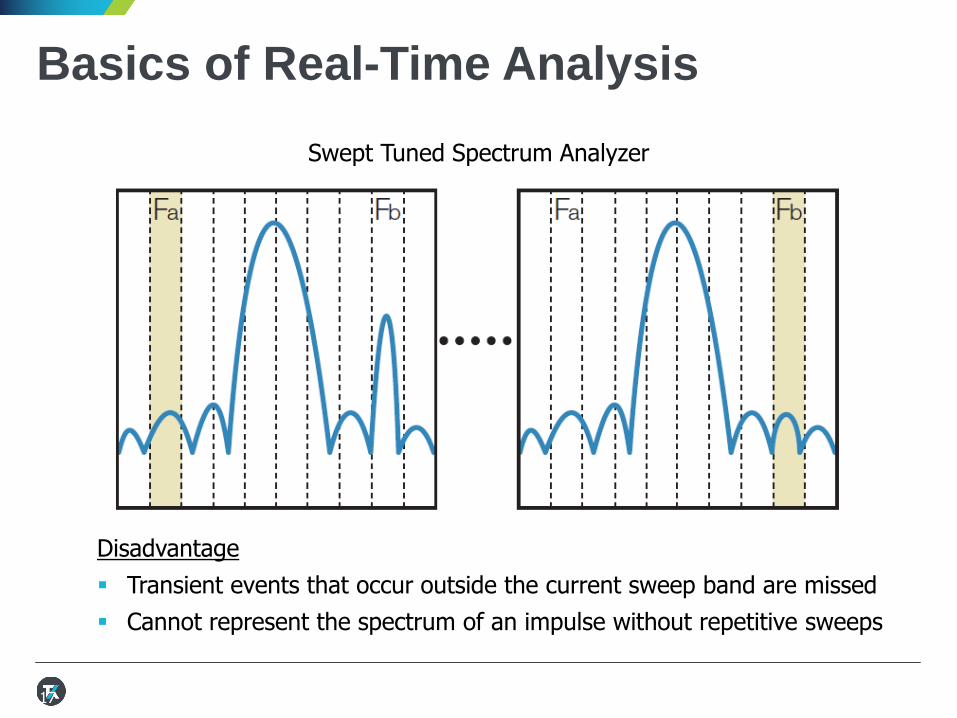
Disadvantage
▪ Transient events that occur outside the current sweep band are missed
▪ Cannot represent the spectrum of an impulse without repetitive sweeps
Swept Tuned Spectrum Analyzer
Basics of Real-Time Analysis
MP APRIL
2015
BASICS OF REAL-TIME SPECTRUM ANALYSIS
18
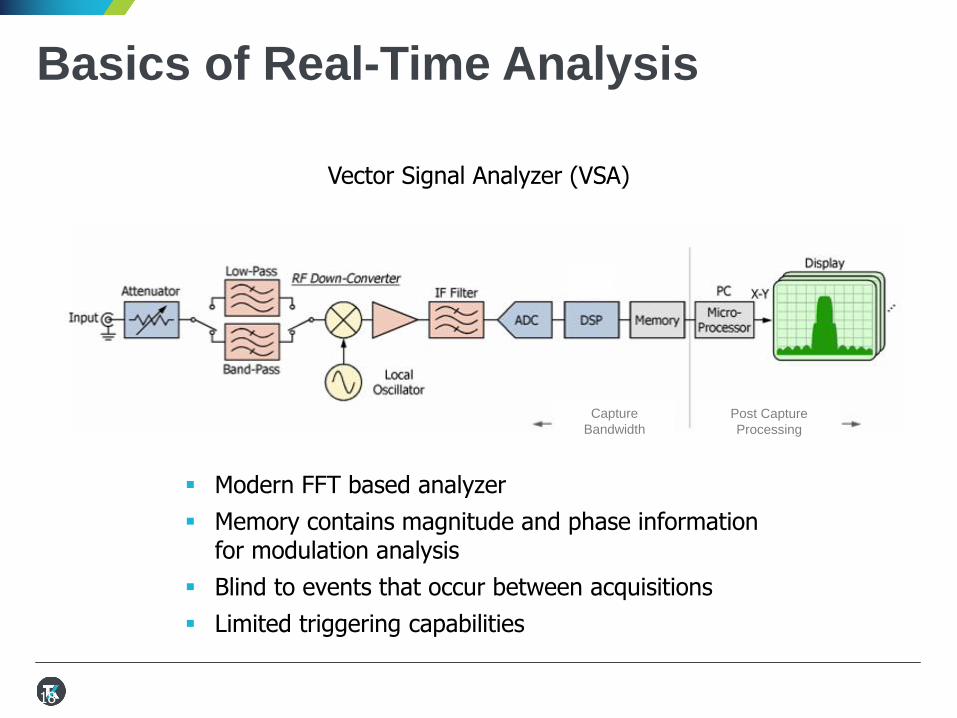
Vector Signal Analyzer (VSA)
▪ Modern FFT based analyzer
▪ Memory contains magnitude and phase information for modulation analysis
▪ Blind to events that occur between acquisitions
▪ Limited triggering capabilities
Capture
Bandwidth
Post Capture
Processing
Basics of Real-Time Analysis
MP APRIL
2015
BASICS OF REAL-TIME SPECTRUM ANALYSIS
19
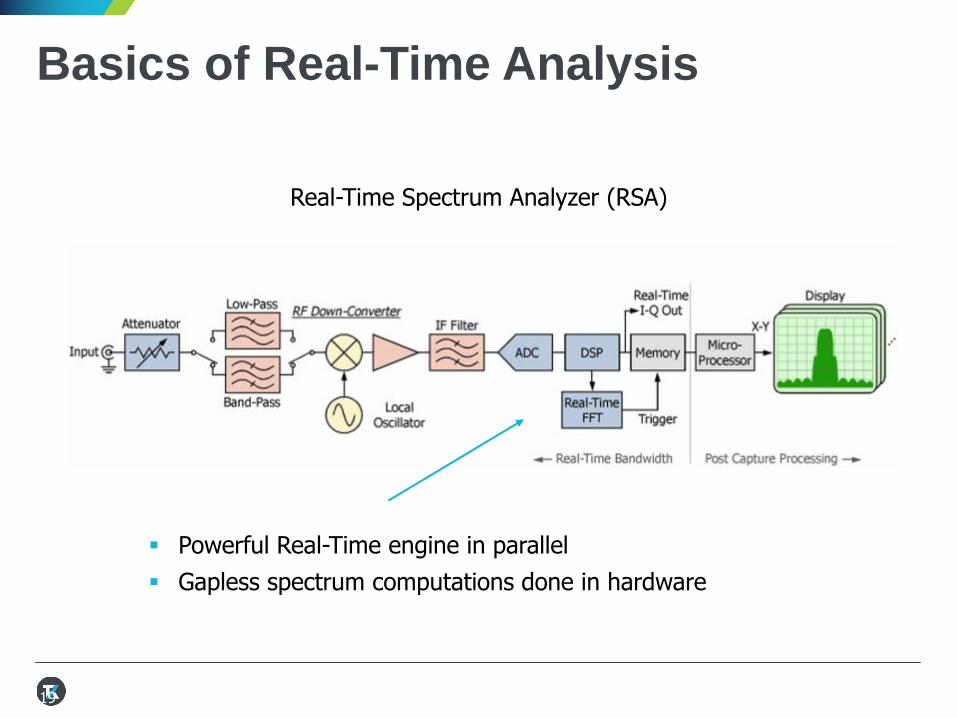
Real-Time Spectrum Analyzer (RSA)
▪ Powerful Real-Time engine in parallel
▪ Gapless spectrum computations done in hardware
Basics of Real-Time Analysis / DPX™
MP APRIL
2015
BASICS OF REAL-TIME SPECTRUM ANALYSIS
20
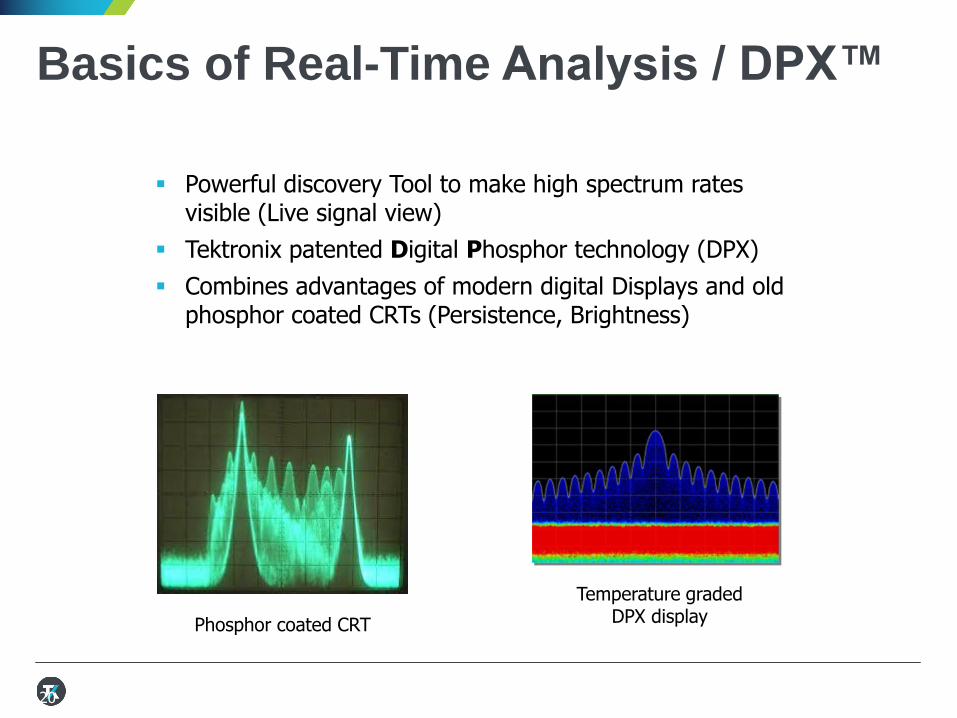
▪ Powerful discovery Tool to make high spectrum rates visible (Live signal view)
▪ Tektronix patented Digital Phosphor technology (DPX)
▪ Combines advantages of modern digital Displays and old phosphor coated CRTs (Persistence, Brightness)
Temperature gradedDPX displayPhosphor coated CRT
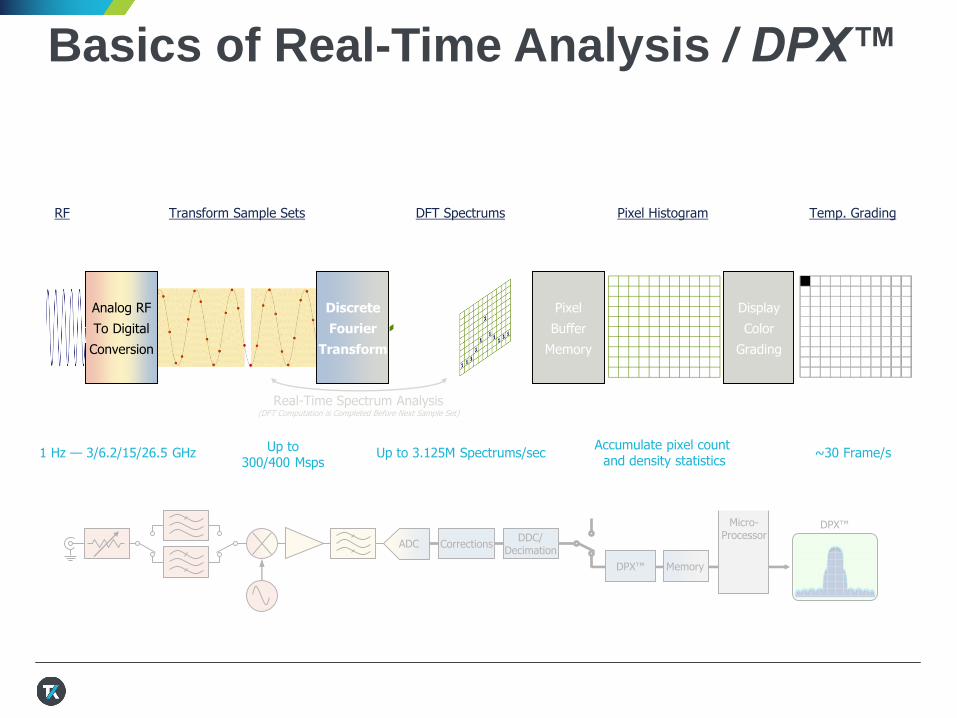
Basics of Real-Time Analysis / DPX™
Discrete
Fourier
Transform
Analog RF
To Digital
Conversion
Display
Color
Grading
Pixel
Buffer
Memory
1 Hz — 3/6.2/15/26.5 GHz Up to300/400 Msps
Up to 3.125M Spectrums/secAccumulate pixel count
and density statistics~30 Frame/s
RF Transform Sample Sets DFT Spectrums Pixel Histogram Temp. Grading
Real-Time Spectrum Analysis(DFT Computation is Completed Before Next Sample Set)
Micro-Processor
ADC CorrectionsDDC/
Decimation
DPX™ Memory
DPX™

Basics of Real-Time Analysis / DPX™
MP APRIL
201522
Example 3D bitmap with 11x10 matrix
Hit count distribution after 1 update Hit count distribution after 9 updates
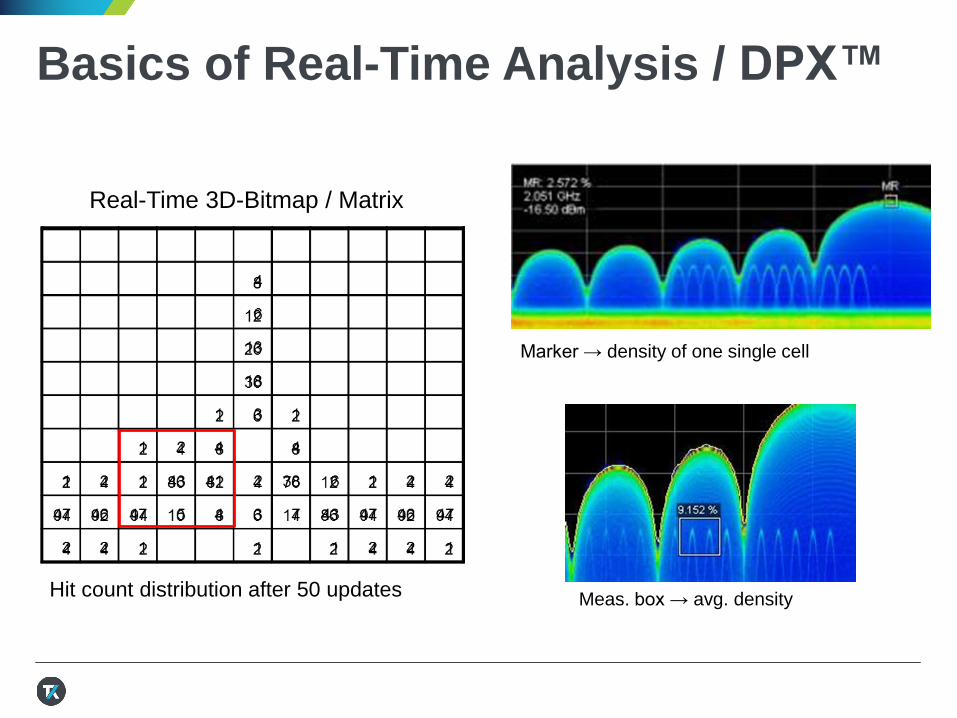
Basics of Real-Time Analysis / DPX™
Marker → density of one single cell
Meas. box → avg. densityHit count distribution after 50 updates
Real-Time 3D-Bitmap / Matrix

Tektronix USB Spectrum Analyzer Comparison
RSA306B RSA500 Series RSA600 Series
Category Basic High Performance High Performance
Frequency Range 9 kHz - 6 GHz9 kHz - 3 GHz
9 kHz - 7.5 GHz9 kHz - 3 GHz
9 kHz - 7.5 GHz
Acquisition Bandwidth 40 MHz 40 MHz 40 MHz
SFDR 60 dB 70 dB 70 dB
Amplitude Accuracy +/- 0.8 dB +/- 0.5 dB +/- 0.5 dB
Frequency Accuracy 10^6 ppm10^6 ppm, 10^9 ppm GPS
trained10^6 ppm, 10^9 ppm GPS
trained
Max. Measurable Output Power
+ 20dBm + 30 dBm + 30 dBm
Tracking Generator N/A Available as option Available as option
Portability USB3.0 Powered Battery or AC Powered AC Powered
Best Fit Environment Field / Lab Field / Lab Lab
Popular Applications Addressed
- Basic RF Design- EMI/EMC Pre-compliance and
Troubleshooting- Basic WLAN Analysis
- Field Interference Hunting- Coverage Mapping
- Surveillance and Monitoring- Radio Network Maintenance
- Advanced WLAN/Bluetooth testing- Component Characterization
- Antenna Matching- RF Environment Record and Playback
Weight 1.6 lbs 7 lbs 6.35 lbs
Dimensions 1.3" X 5.6" X 7.5" 2.6" X 11.8" X 10.7" 3" X 14" X 8.8"
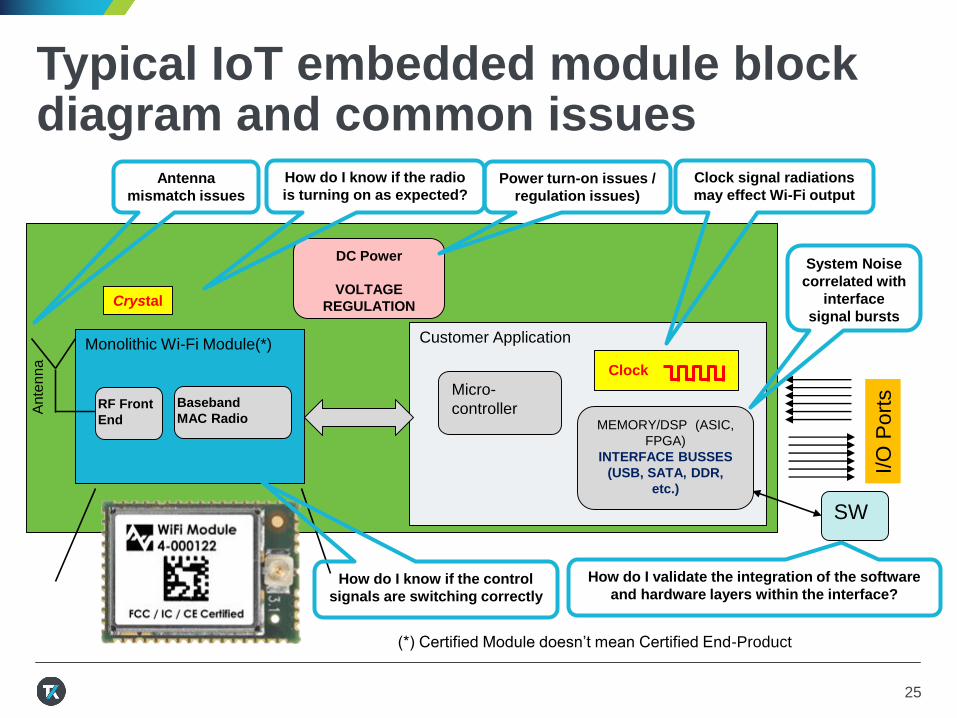
Typical IoT embedded module block diagram and common issues
25
Customer ApplicationMonolithic Wi-Fi Module(*)
An
ten
na
HW
Clock
Crystal
RF Front
End
Baseband
MAC Radio
Micro-
controller
SW
MEMORY/DSP (ASIC,
FPGA)
INTERFACE BUSSES
(USB, SATA, DDR,
etc.)
DC Power
VOLTAGE
REGULATION
I/O
Port
s
Clock signal radiations
may effect Wi-Fi output
System Noise
correlated with
interface
signal bursts
Power turn-on issues /
regulation issues)
Antenna
mismatch issues
How do I validate the integration of the software
and hardware layers within the interface?
(*) Certified Module doesn’t mean Certified End-Product
How do I know if the control
signals are switching correctly
How do I know if the radio
is turning on as expected?
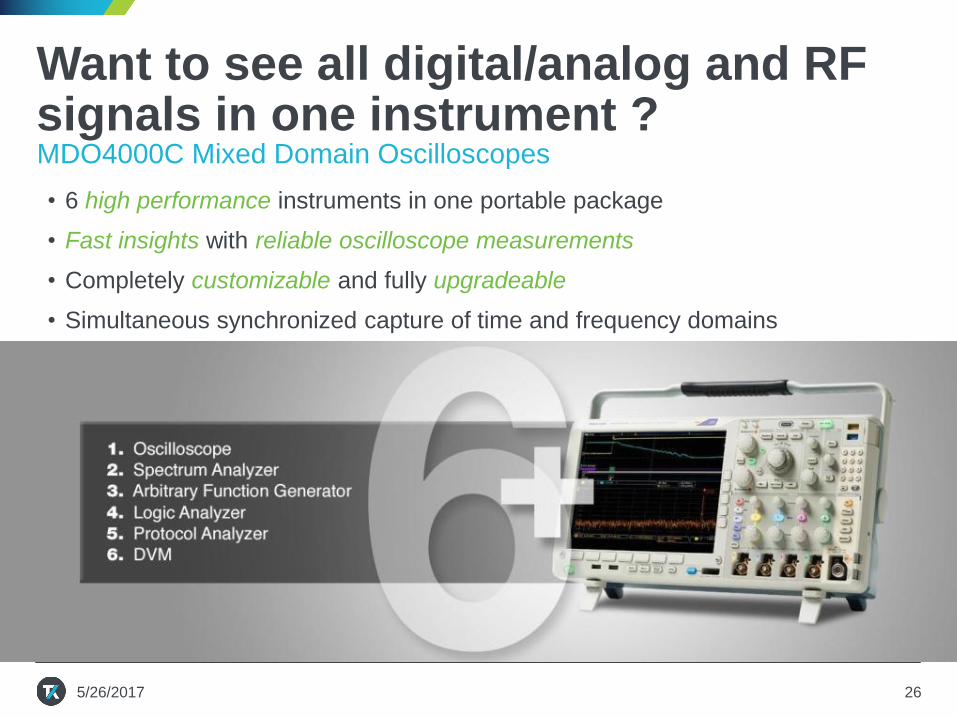
Want to see all digital/analog and RF signals in one instrument ?
26
MDO4000C Mixed Domain Oscilloscopes
• 6 high performance instruments in one portable package
• Fast insights with reliable oscilloscope measurements
• Completely customizable and fully upgradeable
• Simultaneous synchronized capture of time and frequency domains
5/26/2017
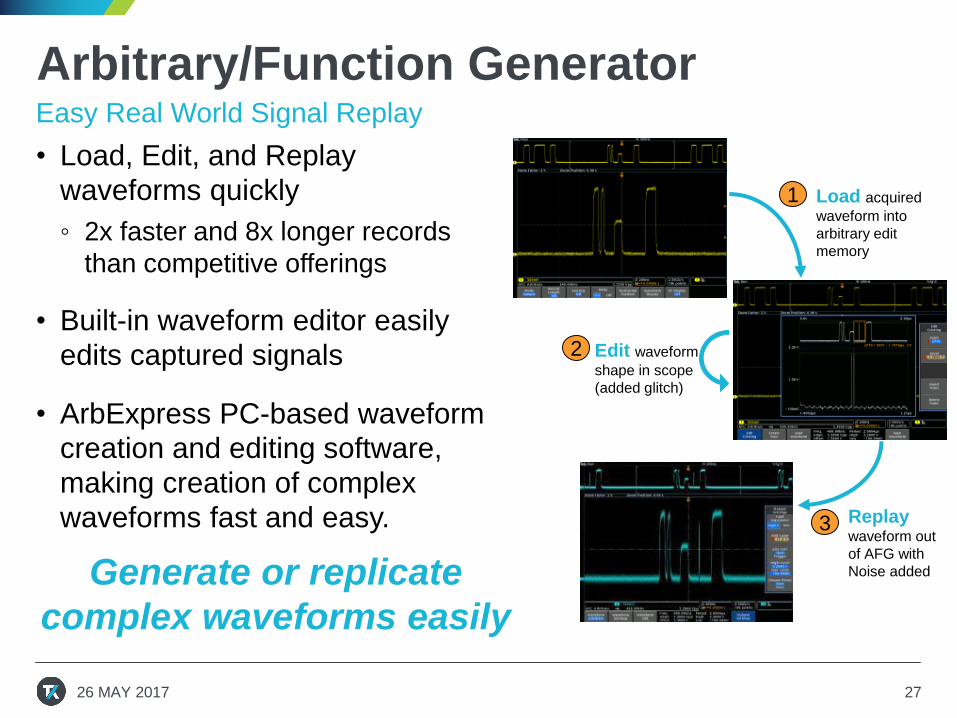
Arbitrary/Function Generator
• Load, Edit, and Replay
waveforms quickly
◦ 2x faster and 8x longer records
than competitive offerings
• Built-in waveform editor easily
edits captured signals
• ArbExpress PC-based waveform
creation and editing software,
making creation of complex
waveforms fast and easy.
27
Easy Real World Signal Replay
Replay waveform out
of AFG with
Noise added
3
Edit waveform
shape in scope
(added glitch)
2
Load acquired
waveform into
arbitrary edit
memory
1
Generate or replicate
complex waveforms easily
26 MAY 2017
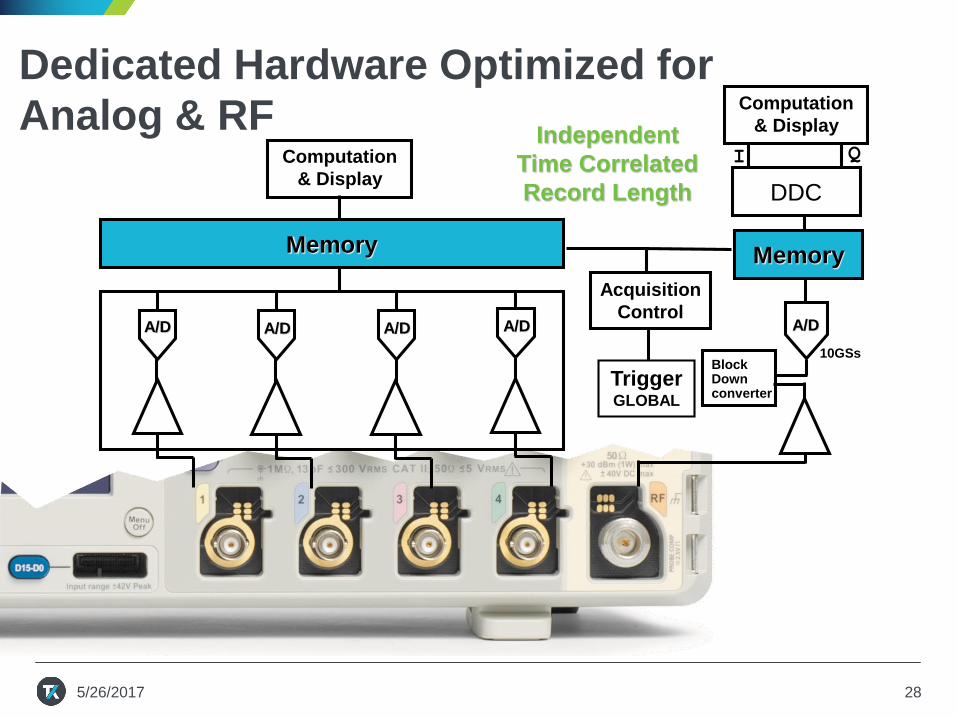
TriggerGLOBAL
Acquisition
Control
Independent
Time Correlated
Record Length
Memory
A/D A/D A/D A/D
Computation
& Display
Memory
A/D
10GSs
DDC
I Q
Computation
& Display
Dedicated Hardware Optimized for
Analog & RF
BlockDownconverter
5/26/2017 28

Time Correlated Multi-Domain Display
• The amount of
time captured in
the top is
referred to as
Analog Time
• The orange bar
is referred to as
Spectrum Time
• The orange bar
indicates the
time period for
the spectrum
from RF input
Tim
e D
om
ain
F
req
uen
cy D
om
ain
Analog Time
Spectrum Time
5/26/2017 29
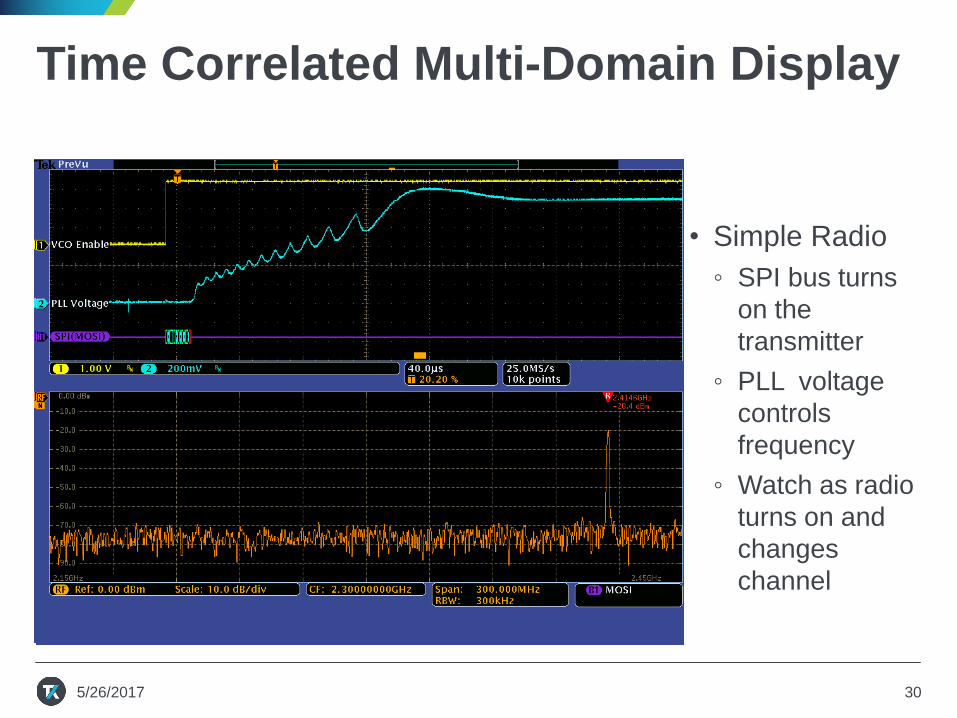
Time Correlated Multi-Domain Display
• Simple Radio
◦ SPI bus turns
on the
transmitter
◦ PLL voltage
controls
frequency
◦ Watch as radio
turns on and
changes
channel
5/26/2017 30
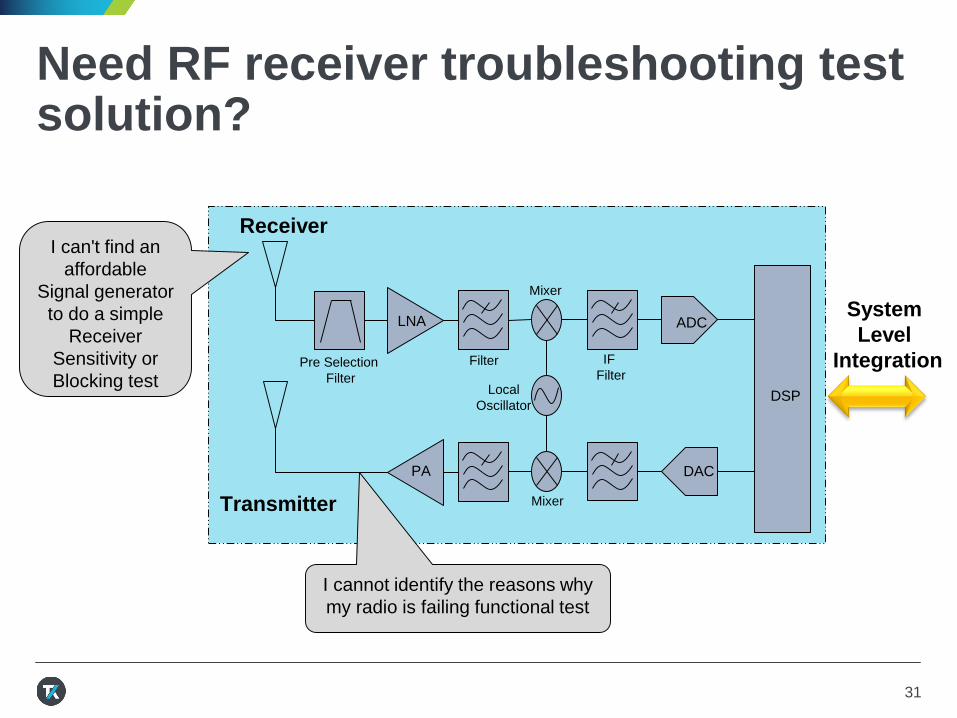
Need RF receiver troubleshooting test solution?
LNA ADC
Pre Selection
Filter
Filter IF
Filter
DSP
DACPA
Local
Oscillator
Receiver
Transmitter
Mixer
Mixer
System
Level
Integration
I can't find an
affordable
Signal generator
to do a simple
Receiver
Sensitivity or
Blocking test
I cannot identify the reasons why
my radio is failing functional test
31
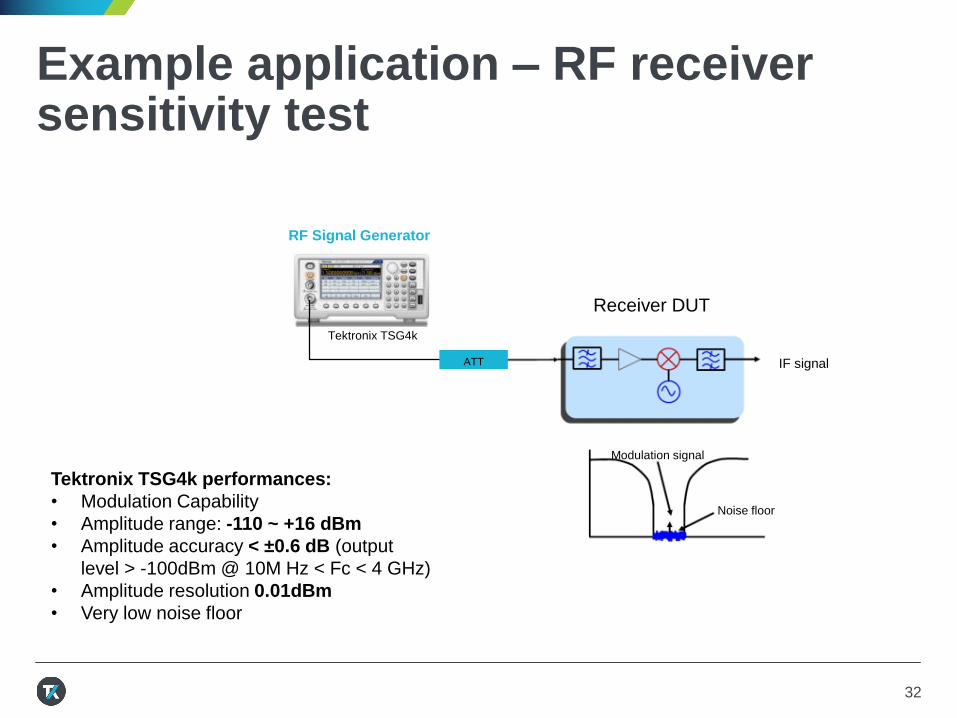
Example application – RF receiver sensitivity test
Tektronix TSG4k performances:
• Modulation Capability
• Amplitude range: -110 ~ +16 dBm
• Amplitude accuracy < ±0.6 dB (output
level > -100dBm @ 10M Hz < Fc < 4 GHz)
• Amplitude resolution 0.01dBm
• Very low noise floor
Receiver DUT
Modulation signal
Noise floor
IF signalATT
Tektronix TSG4k
RF Signal Generator
32
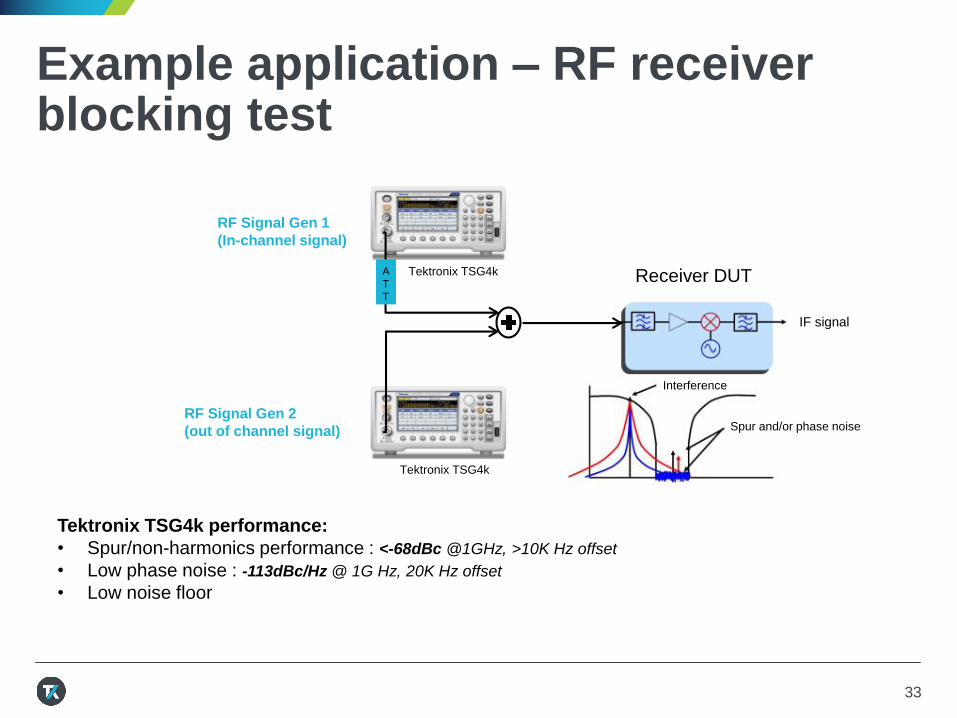
Example application – RF receiver blocking test
Tektronix TSG4k performance:
• Spur/non-harmonics performance : <-68dBc @1GHz, >10K Hz offset
• Low phase noise : -113dBc/Hz @ 1G Hz, 20K Hz offset
• Low noise floor
Tektronix TSG4k
Tektronix TSG4k
Spur and/or phase noise
Interference
IF signal
A
T
T
RF Signal Gen 2
(out of channel signal)
RF Signal Gen 1
(In-channel signal)
Receiver DUT
33

Design your IoT device with higher confidence under true-life signal conditions
TSG4100A or AWG
Signal Generator
RSA306B USB Real – Time Spectrum Analyzer
Record Signal
environment with
RSA306
Play back
recorded signal
during IoT device
design
Stimulus
34
1
2
IoT Design and Test Challenge #4
Speeding your device through EMC compliance
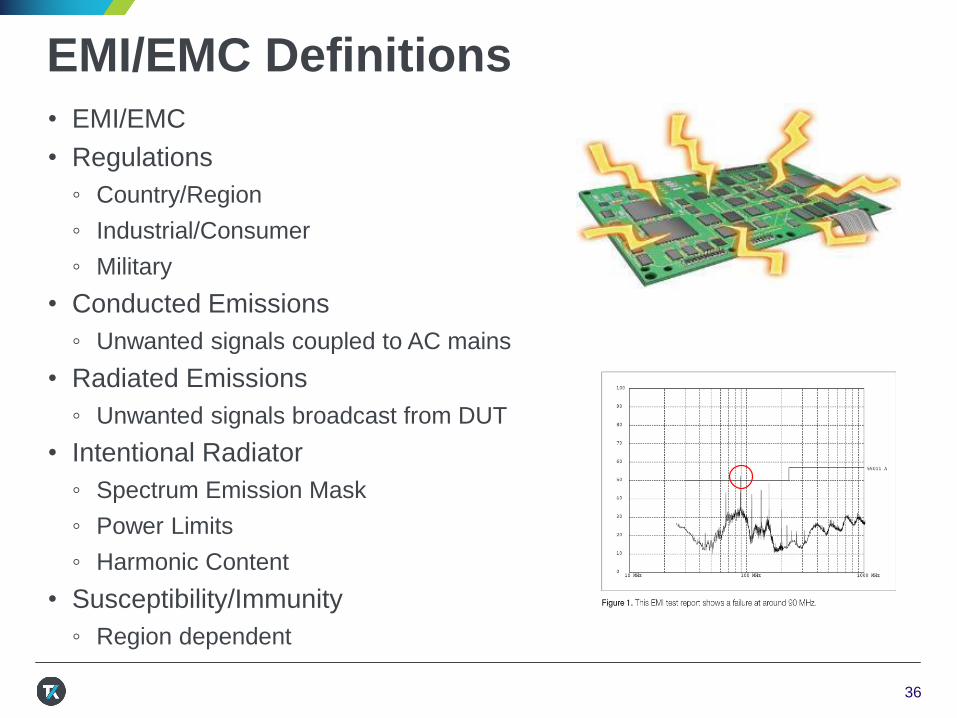
EMI/EMC Definitions
• EMI/EMC
• Regulations
◦ Country/Region
◦ Industrial/Consumer
◦ Military
• Conducted Emissions
◦ Unwanted signals coupled to AC mains
• Radiated Emissions
◦ Unwanted signals broadcast from DUT
• Intentional Radiator
◦ Spectrum Emission Mask
◦ Power Limits
◦ Harmonic Content
• Susceptibility/Immunity
◦ Region dependent
36
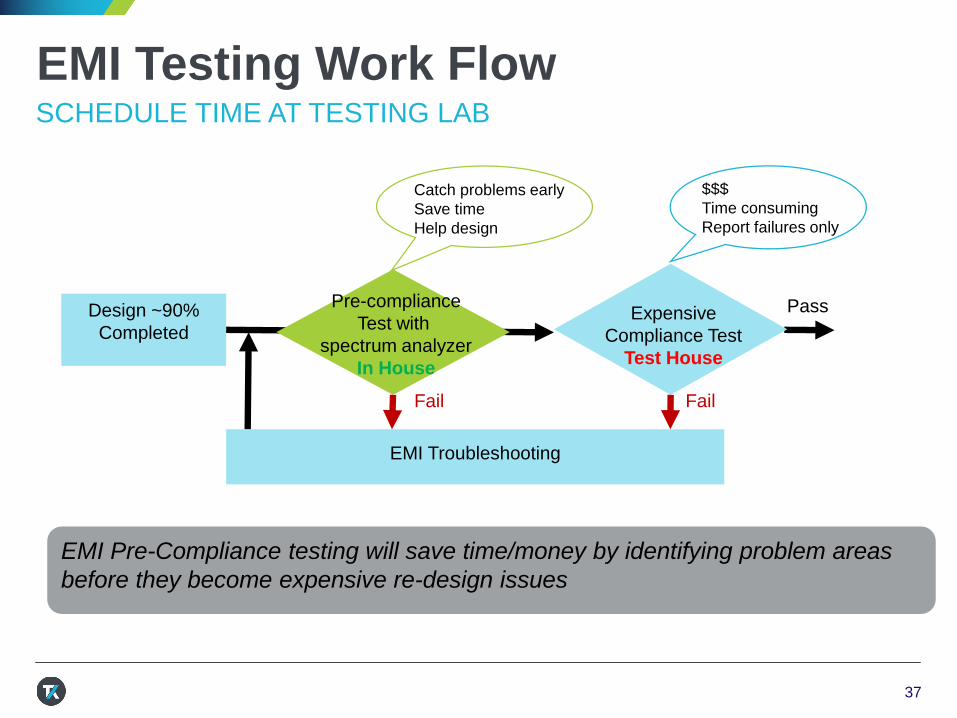
EMI Testing Work FlowSCHEDULE TIME AT TESTING LAB
Design ~90%
CompletedExpensive
Compliance Test
Test House
Pass
EMI Troubleshooting
Fail
Pre-compliance
Test with
spectrum analyzer
In House
Fail
$$$
Time consuming
Report failures only
Catch problems early
Save time
Help design
EMI Pre-Compliance testing will save time/money by identifying problem areas
before they become expensive re-design issues
37
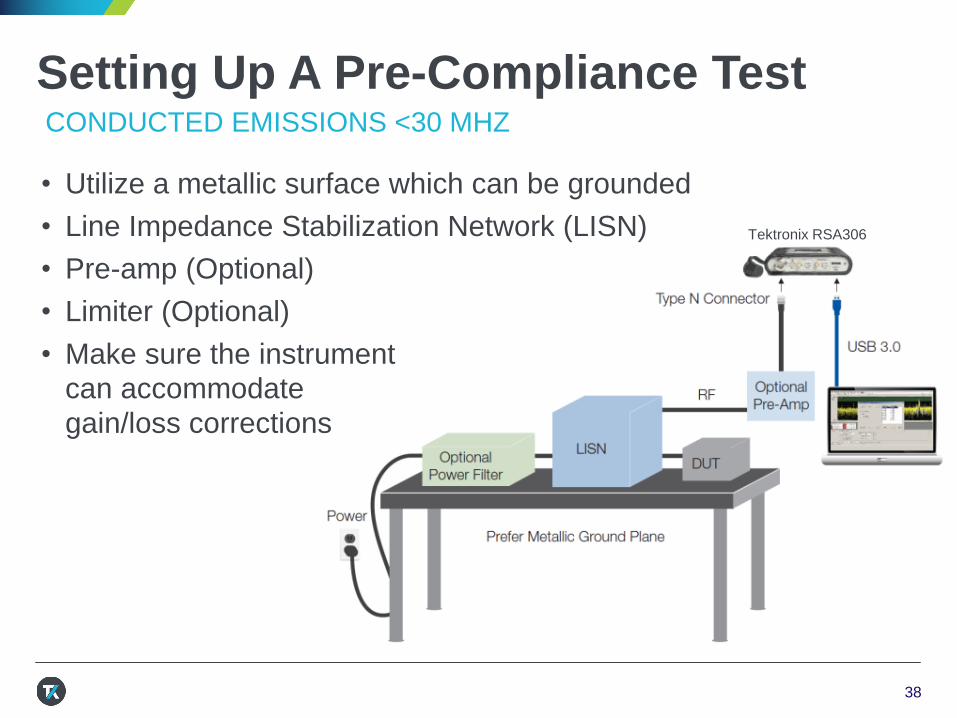
Setting Up A Pre-Compliance Test
• Utilize a metallic surface which can be grounded
• Line Impedance Stabilization Network (LISN)
• Pre-amp (Optional)
• Limiter (Optional)
• Make sure the instrument
can accommodate
gain/loss corrections
CONDUCTED EMISSIONS <30 MHZ
Tektronix RSA306
38

Setting Up A Pre-Compliance Test
• Identify an area with natural
RF shielding
◦ Basements
◦ Parking garages
• Watch out for DAS
◦ Used to help cellular coverage
• Non metallic platform for DUT
• We need to look at 360 around DUT
• Tripod/pre-amp optional but
recommended
RADIATED EMISSIONS >30 MHZ
Tektronix RSA306
39

Pre-Compliance Scan Tektronix RSA306B
• 30 MHz – 6.2 GHz
• 128,004 Trace Points
• ~ 7s (CISPR Peak)
• Shaded area = limit
• Auto ID limit failures
5/26/2017 40
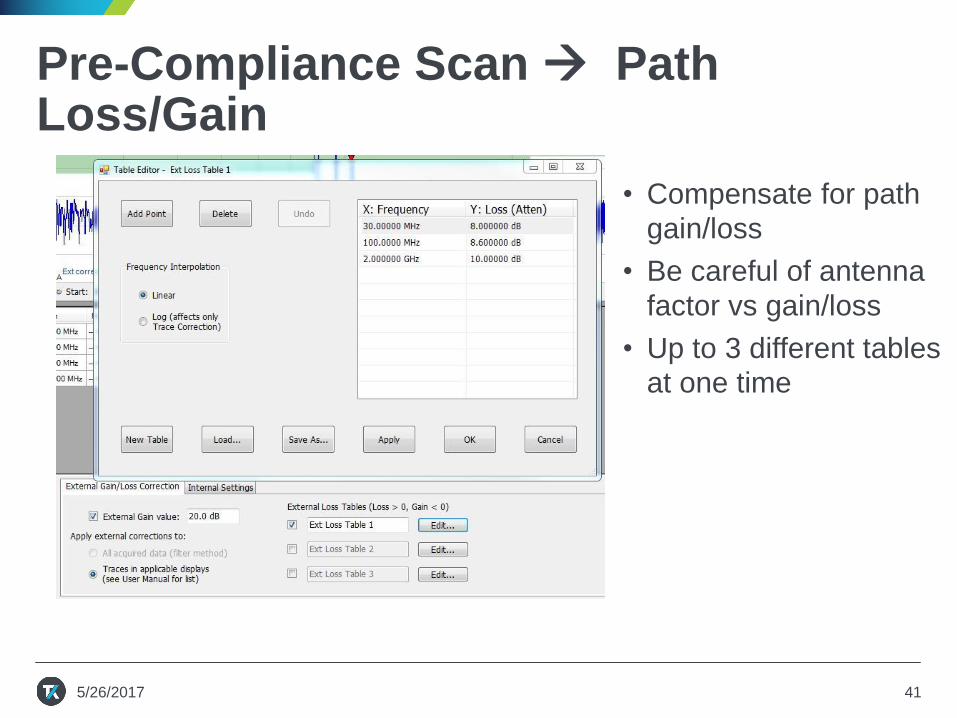
Pre-Compliance Scan Path Loss/Gain
• Compensate for path
gain/loss
• Be careful of antenna
factor vs gain/loss
• Up to 3 different tables
at one time
5/26/2017 41
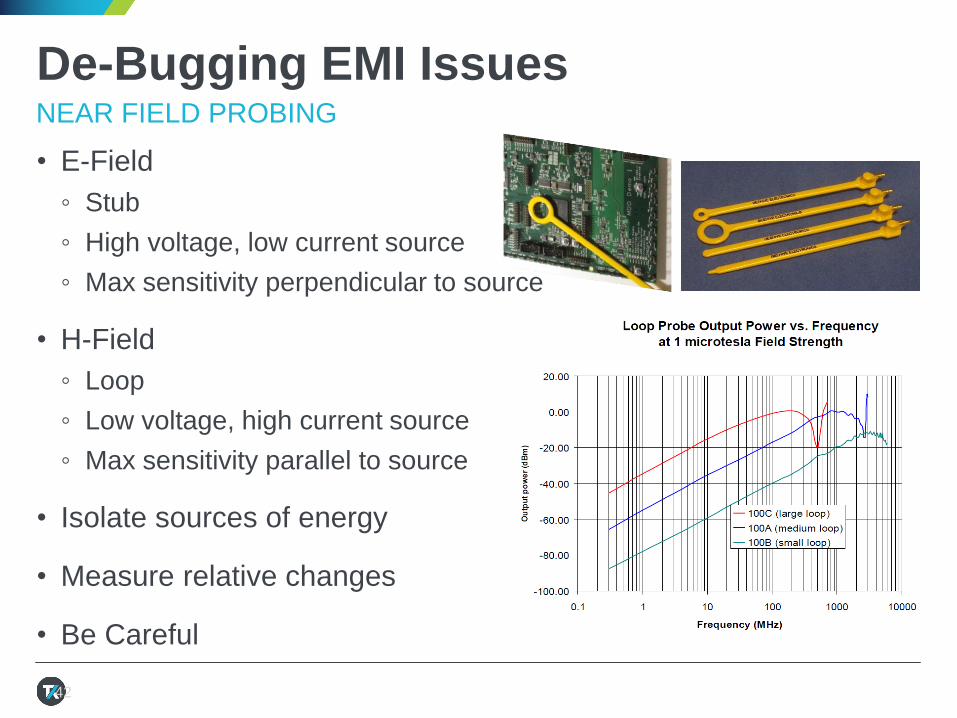
De-Bugging EMI Issues
• E-Field
◦ Stub
◦ High voltage, low current source
◦ Max sensitivity perpendicular to source
• H-Field
◦ Loop
◦ Low voltage, high current source
◦ Max sensitivity parallel to source
• Isolate sources of energy
• Measure relative changes
• Be Careful
42
NEAR FIELD PROBING
IoT Design and Test Challenge #5
Speeding your device through wireless certification
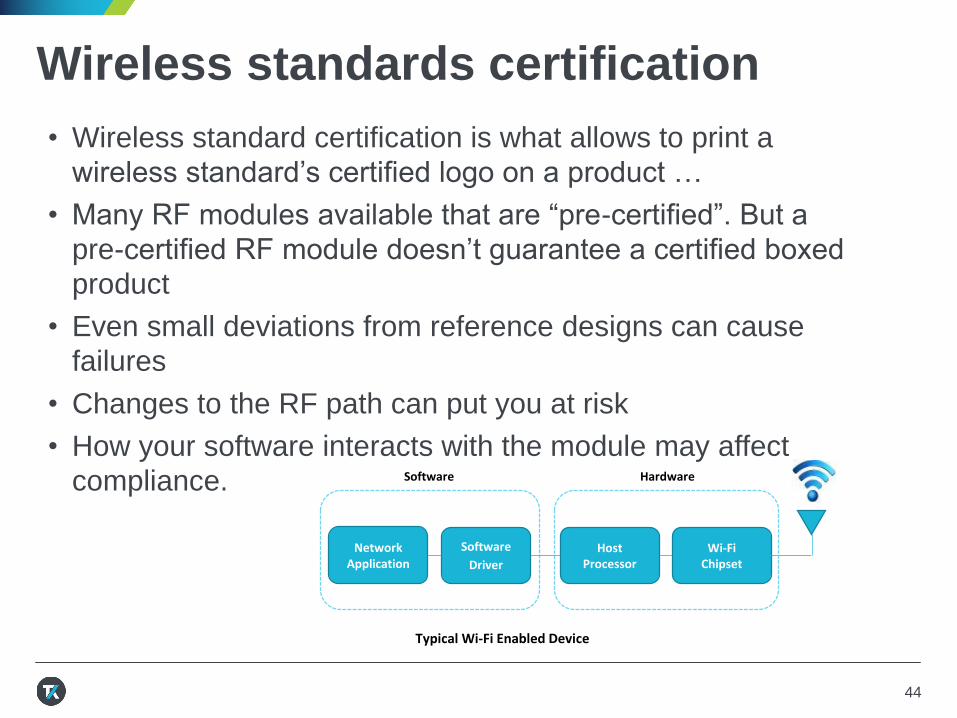
Wireless standards certification
• Wireless standard certification is what allows to print a
wireless standard’s certified logo on a product …
• Many RF modules available that are “pre-certified”. But a
pre-certified RF module doesn’t guarantee a certified boxed
product
• Even small deviations from reference designs can cause
failures
• Changes to the RF path can put you at risk
• How your software interacts with the module may affect
compliance. HardwareSoftware
Software
Driver
Network Application
HostProcessor
Wi-FiChipset
Typical Wi-Fi Enabled Device
44
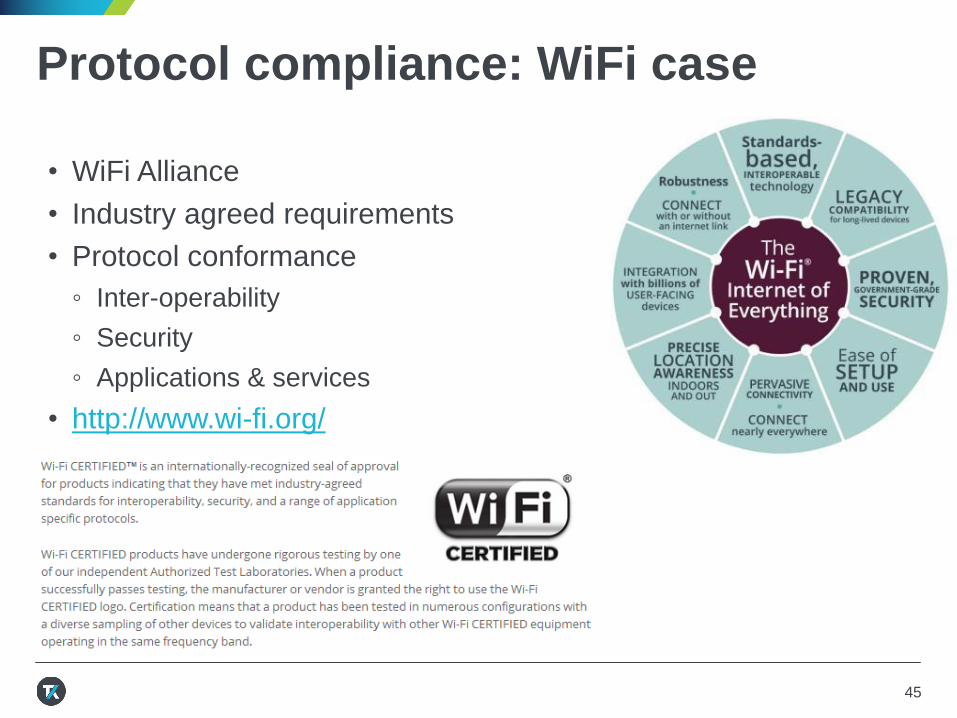
Protocol compliance: WiFi case
• WiFi Alliance
• Industry agreed requirements
• Protocol conformance
◦ Inter-operability
◦ Security
◦ Applications & services
• http://www.wi-fi.org/
45
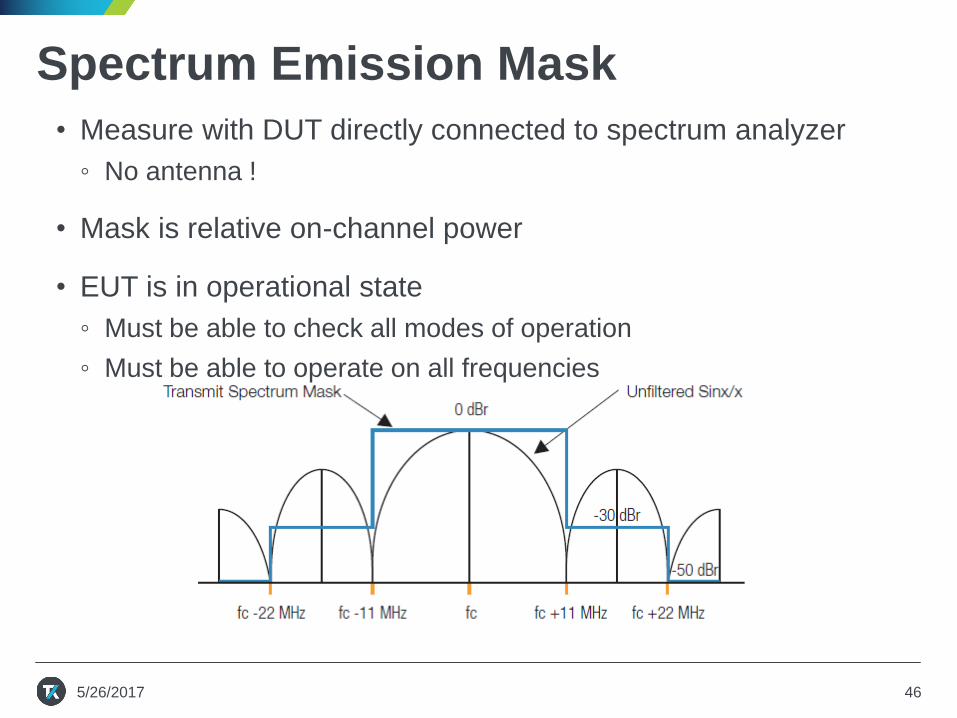
Spectrum Emission Mask
• Measure with DUT directly connected to spectrum analyzer
◦ No antenna !
• Mask is relative on-channel power
• EUT is in operational state
◦ Must be able to check all modes of operation
◦ Must be able to operate on all frequencies
5/26/2017 46
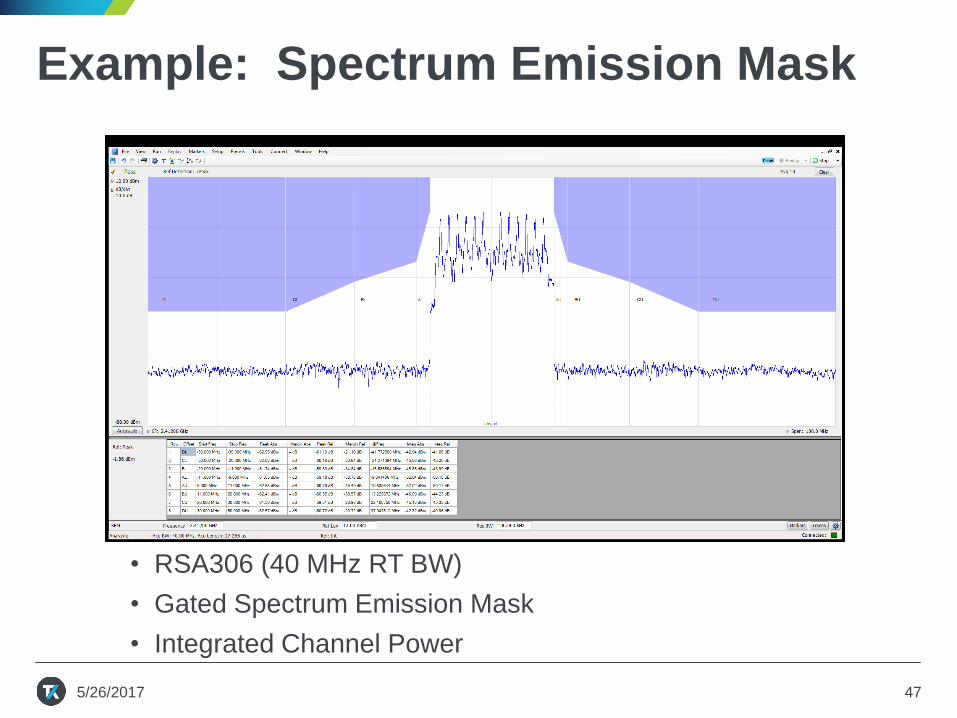
Example: Spectrum Emission Mask
• RSA306 (40 MHz RT BW)
• Gated Spectrum Emission Mask
• Integrated Channel Power
5/26/2017 47
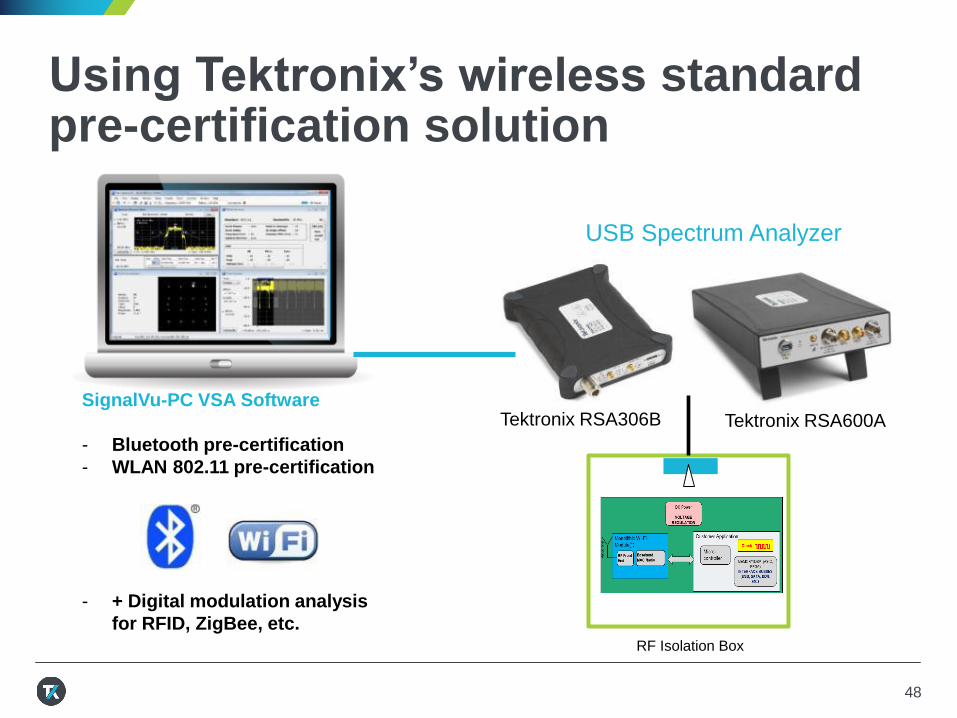
Using Tektronix’s wireless standard pre-certification solution
SignalVu-PC VSA Software
- Bluetooth pre-certification
- WLAN 802.11 pre-certification
- + Digital modulation analysis
for RFID, ZigBee, etc.RF Isolation Box
USB Spectrum Analyzer
Tektronix RSA306B
48
Tektronix RSA600A
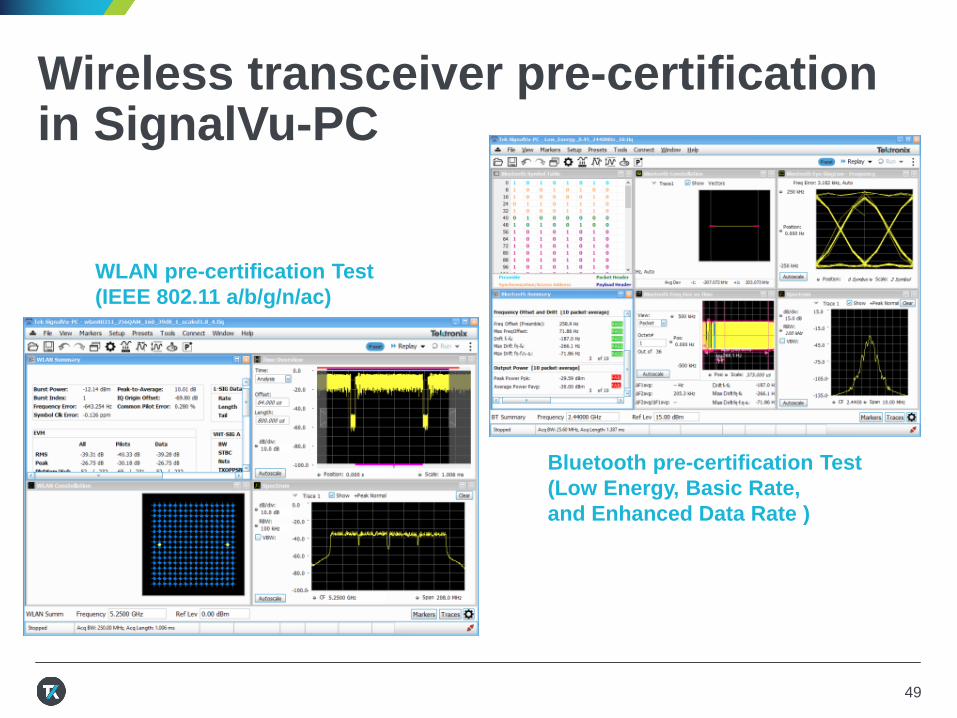
Wireless transceiver pre-certification in SignalVu-PC
49
Bluetooth pre-certification Test
(Low Energy, Basic Rate,
and Enhanced Data Rate )
WLAN pre-certification Test
(IEEE 802.11 a/b/g/n/ac)
IoT Design and Test Challenge #6
Preparing for IoT network deployment
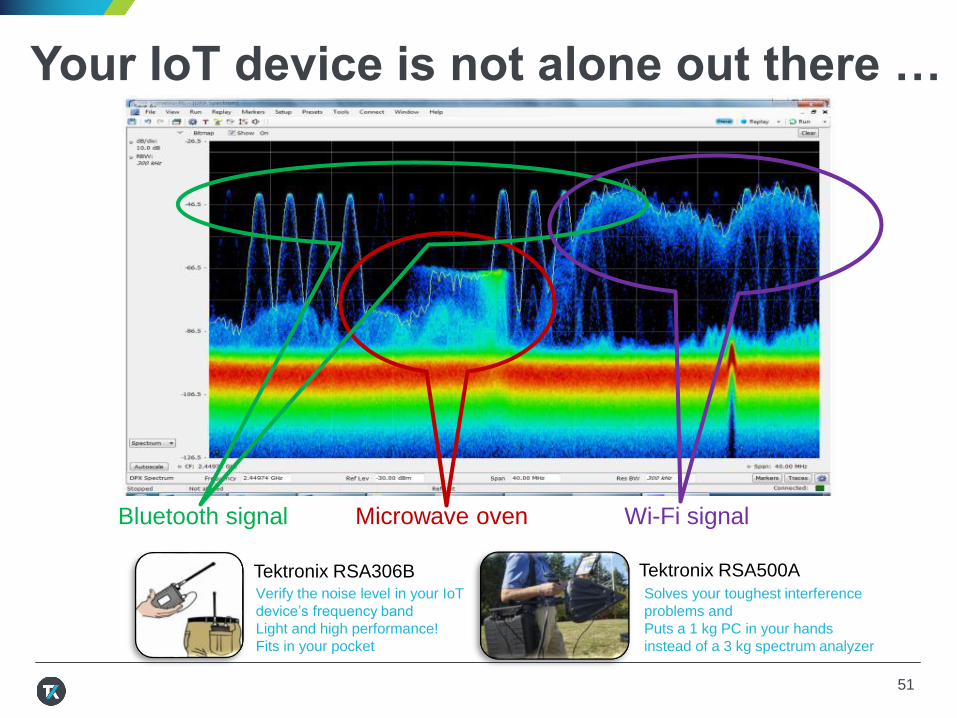
Your IoT device is not alone out there …
Microwave ovenBluetooth signal Wi-Fi signal
51
Verify the noise level in your IoT
device’s frequency band
Light and high performance!
Fits in your pocket
Tektronix RSA306B Tektronix RSA500A
Solves your toughest interference
problems and
Puts a 1 kg PC in your hands
instead of a 3 kg spectrum analyzer
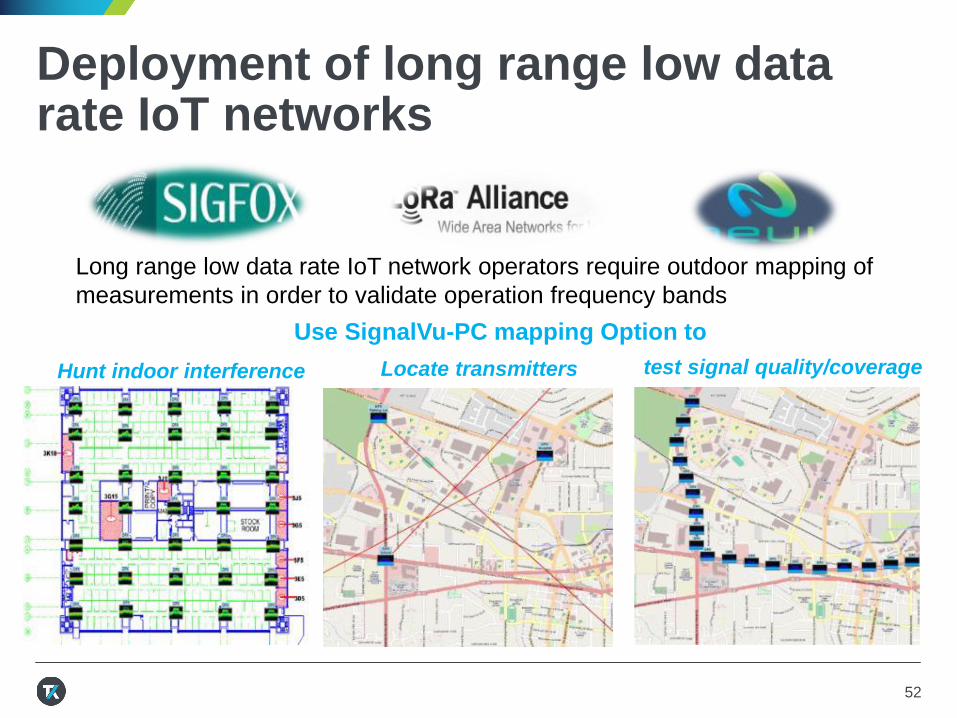
Deployment of long range low data rate IoT networks
Long range low data rate IoT network operators require outdoor mapping of
measurements in order to validate operation frequency bands
Locate transmitters test signal quality/coverage
52
Use SignalVu-PC mapping Option to
Hunt indoor interference
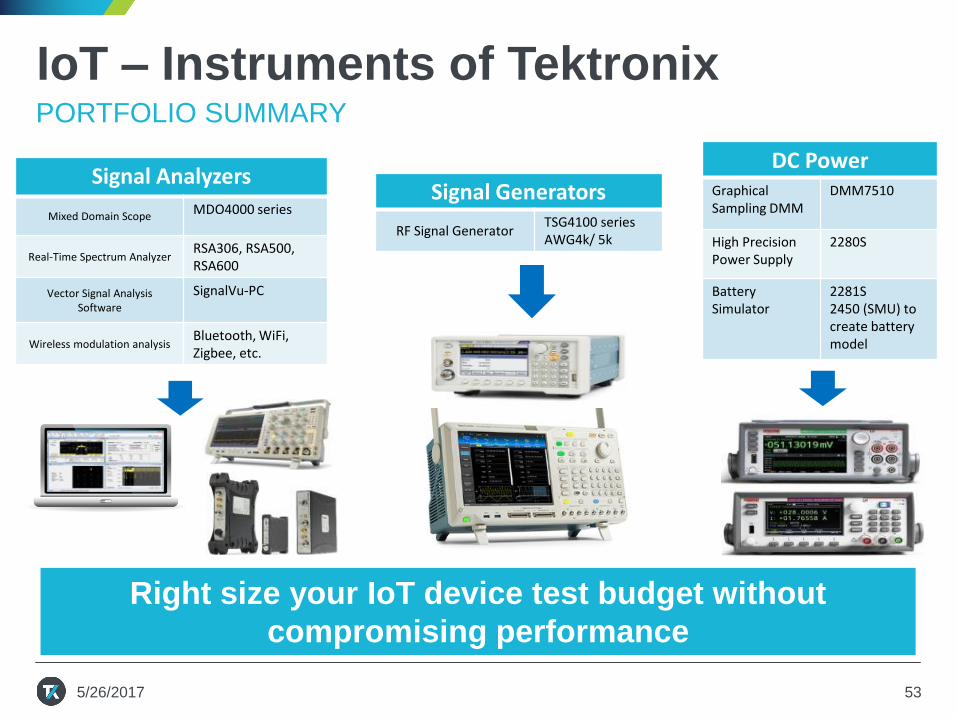
IoT – Instruments of Tektronix
53
PORTFOLIO SUMMARY
Signal Generators
RF Signal GeneratorTSG4100 seriesAWG4k/ 5k
Signal Analyzers
Mixed Domain ScopeMDO4000 series
Real-Time Spectrum AnalyzerRSA306, RSA500, RSA600
Vector Signal Analysis Software
SignalVu-PC
Wireless modulation analysisBluetooth, WiFi, Zigbee, etc.
DC PowerGraphicalSampling DMM
DMM7510
High Precision Power Supply
2280S
Battery Simulator
2281S2450 (SMU) to create battery model
Right size your IoT device test budget without
compromising performance
5/26/2017

54