Embed Size (px)
Citation preview
Wireless Temperature Monitoring System for the Cal Poly Pilot Winery
Caitlin Devaney Materials Engineering Department
California Polytechnic State University, San Luis Obispo Advised by Dr. Katherine Chen
2
Approval Page
Project Title: Wireless Temperature Monitoring System for the Cal Poly Pilot Winery
Author: Caitlin Devaney
Date Submitted: 6/8/12
CAL POLY STATE UNIVERSITY
Materials Engineering Department
Since this project is a result of a class assignment, it has been graded and accepted as fulfillment
of the course requirements. Acceptance does not imply technical accuracy or reliability. Any use
of the information in this report, including numerical data, is done at the risk of the user. These
risks may include catastrophic failure of the device or infringement of patent or copyright laws.
The students, faculty, and staff of Cal Poly State University, San Luis Obispo cannot be held liable
for any misuse of the project.
Prof. Katherine Chen ____________________________
Faculty Advisor Signature
Prof. Trevor Harding ____________________________
Department Chair Signature
3
Acknowledgements
I would like to thank Dr. Katherine C. Chen in the Materials Engineering
Department at California Polytechnic State University for her help and guidance
on my project. Her advice and support were instrumental in the completion of
this project. I would also like to thank Matt Brain in the Food Science and
Nutrition Department for his advice and knowledge of the wine industry and
fermentation process.
4
Table of Contents Introduction ...............................................................................................................................................................9
Goal........................................................................................................................................................................9
Stakeholders .........................................................................................................................................................9
Broader Impacts ................................................................................................................................................ 10
Design Constraints ........................................................................................................................................... 11
Economic ....................................................................................................................................................... 11
Societal ........................................................................................................................................................... 11
Health and Safety ......................................................................................................................................... 12
Environmental Effects and Sustainability .................................................................................................. 12
Background ............................................................................................................................................................ 13
The Cal Poly Pilot Winery ................................................................................................................................ 13
Importance of temperature measurement..................................................................................................... 13
Existing technology ........................................................................................................................................... 14
Polymer Chemistry ........................................................................................................................................... 15
Procedure ............................................................................................................................................................... 18
Materials Selection ........................................................................................................................................... 18
Preliminary Test ................................................................................................................................................ 18
Chemical Degradation...................................................................................................................................... 20
Cost Analysis ..................................................................................................................................................... 21
Life Cycle Analysis............................................................................................................................................ 22
Results .................................................................................................................................................................... 24
Materials Selection ........................................................................................................................................... 24
Preliminary Test ................................................................................................................................................ 25
Chemical Degradation...................................................................................................................................... 27
Design ................................................................................................................................................................. 30
Cost Analysis ..................................................................................................................................................... 31
Life Cycle Analysis............................................................................................................................................ 32
Discussion .............................................................................................................................................................. 34
Conclusions ........................................................................................................................................................... 38
References ............................................................................................................................................................. 39
5
List of Figures
Fig. 1: Wireless monitoring system flow diagram ................................................................................... 9
Fig. 2: Some of the HDPE tanks (left) and one of the stainless steel tanks (right) the Cal Poly winery
currently uses for their fermentation .............................................................................................. 10
Fig. 3: Example of fermenting red wine must ....................................................................................... 14
Fig. 4: TankNET thermostat control box and probe used at the pilot winery ......................................... 14
Fig. 5: Polymerization of polyethylene .................................................................................................. 15
Fig. 6: Formation of styrene from dehydrogenized ethylbenzene ......................................................... 16
Fig. 7: Polymerization of polystyrene ................................................................................................... 16
Fig. 8: Chemical structure of PDMS ..................................................................................................... 17
Fig. 9: Hydrolysis of siloxane ............................................................................................................... 17
Fig. 10: PDMS (A), HDPE(B) and Polystyrene(C) test samples for environmental testing .................... 19
Fig. 11: Weight used to keep HDPE down ........................................................................................... 19
Fig. 12: The beakers filled with wine with Polystyrene (A), HDPE (B), and PDMS (C) samples added
and placed in oven ........................................................................................................................ 19
Fig. 13: PDMS tensile test mold (dimensions are in millimeters) .......................................................... 20
Fig. 14: PDMS samples in their test setup where the PDMS samples are hung from stainless steel
wires (citric acid is one the left and the sodium hydroxide is on the right) ..................................... 21
Fig. 15: Inventory analysis for the materials used for the enclosure of the node .................................. 23
Fig. 16: CES output for water adsorption versus resistance to weak acids........................................... 24
Fig. 17: CES output for the stiffness limited design with panel configuration minimizing cost ............... 24
Fig. 18: CES results for polymer materials which passed all the stages ............................................... 25
Fig. 19: Boxplot of percent water absorbed for each material tested comparing the amount of days after
each material was removed .......................................................................................................... 26
Fig. 20: Results of ANOVA test, analysis of variance ........................................................................... 26
Fig. 21: Results of ANOVA test, grouping information using Bonferroni method .................................. 26
Fig. 22: Boxplot of tensile strength by solution used to treat the samples ............................................ 27
Fig. 23: Results of ANOVA test, grouping information using Bonferroni method .................................. 27
Fig. 24: Representation of testing order’s effect on PDMS tensile sample’s tensile strength (Observation
order 1-4 are the control samples, 5-7 are the NaOH samples, and 8-10 are the citric acids
samples) ....................................................................................................................................... 28
Fig. 25: Tensile Strength versus Elongation for all tensile samples ...................................................... 28
6
Fig. 26: PDMS tensile testing samples from diluted (A) Sodium hydroxide solution, (B) Citric acid
solution, and (C) no solution ......................................................................................................... 29
Fig. 27: Comparison of PDMS surface after Citric acid exposure (a) to Sodium hydroxide (b) at a
magnification of 1,000X. The control sample was indistinguishable from the citric acid sample. ... 29
Fig. 28: Exploded view of enclosure design with overall dimensions .................................................... 30
Fig. 29: Graph representing cost model for the total shaping costs for one node enclosure versus the
batch size ..................................................................................................................................... 32
Fig. 30: Depolymerization by hydroxide ions and silanol formation (silanol group is circled) ................ 35
Fig. 31: Chemical reaction in the creation of the three-dimensional cross-linked PDMS ...................... 36

7
List of Tables
Table I: Definitions and units in the cost model .................................................................................... 22
Table II: Determination of Equipment and Tooling Cost if Manufactured in Single Automated Process
Line .............................................................................................................................................. 31
Table III: Emission and Energy data from CES software feature, Eco-Audit ......................................... 32
Table IV: Streamlined Life Cycle Analysis Matrix ................................................................................. 33
8
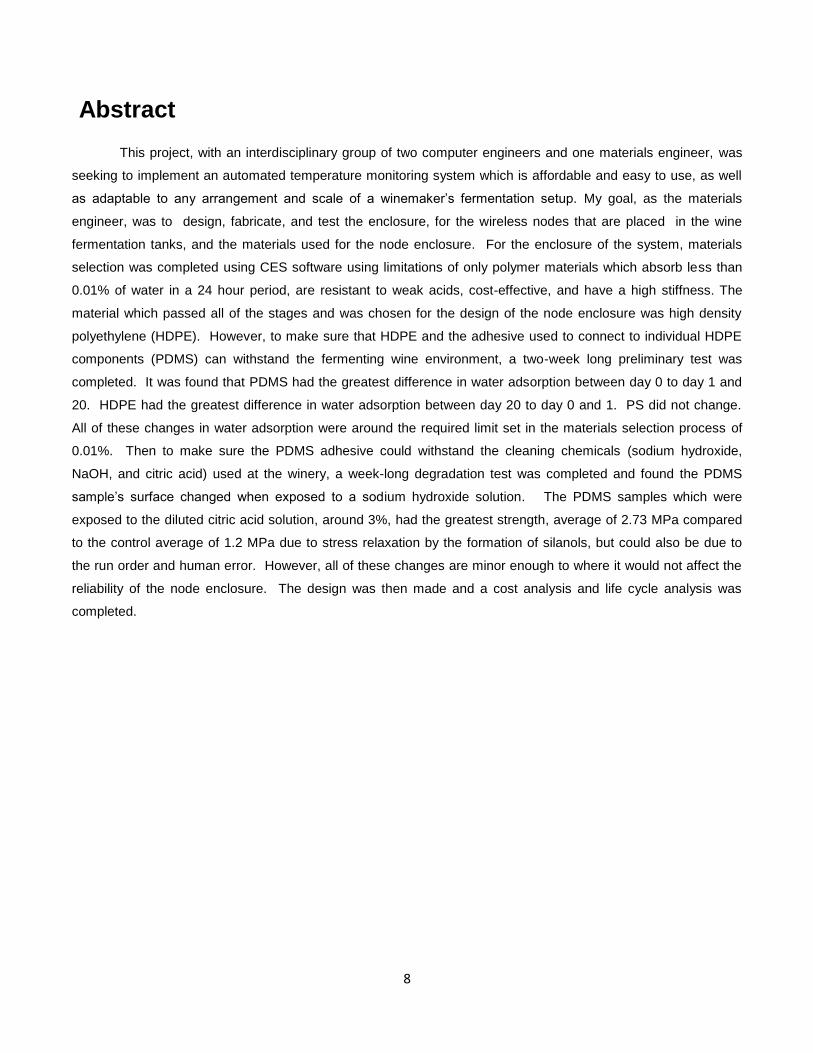
Abstract
This project, with an interdisciplinary group of two computer engineers and one materials engineer, was
seeking to implement an automated temperature monitoring system which is affordable and easy to use, as well
as adaptable to any arrangement and scale of a winemaker’s fermentation setup. My goal, as the materials
engineer, was to design, fabricate, and test the enclosure, for the wireless nodes that are placed in the wine
fermentation tanks, and the materials used for the node enclosure. For the enclosure of the system, materials
selection was completed using CES software using limitations of only polymer materials which absorb less than
0.01% of water in a 24 hour period, are resistant to weak acids, cost-effective, and have a high stiffness. The
material which passed all of the stages and was chosen for the design of the node enclosure was high density
polyethylene (HDPE). However, to make sure that HDPE and the adhesive used to connect to individual HDPE
components (PDMS) can withstand the fermenting wine environment, a two-week long preliminary test was
completed. It was found that PDMS had the greatest difference in water adsorption between day 0 to day 1 and
20. HDPE had the greatest difference in water adsorption between day 20 to day 0 and 1. PS did not change.
All of these changes in water adsorption were around the required limit set in the materials selection process of
0.01%. Then to make sure the PDMS adhesive could withstand the cleaning chemicals (sodium hydroxide,
NaOH, and citric acid) used at the winery, a week-long degradation test was completed and found the PDMS
sample’s surface changed when exposed to a sodium hydroxide solution. The PDMS samples which were
exposed to the diluted citric acid solution, around 3%, had the greatest strength, average of 2.73 MPa compared
to the control average of 1.2 MPa due to stress relaxation by the formation of silanols, but could also be due to
the run order and human error. However, all of these changes are minor enough to where it would not affect the
reliability of the node enclosure. The design was then made and a cost analysis and life cycle analysis was
completed.
9
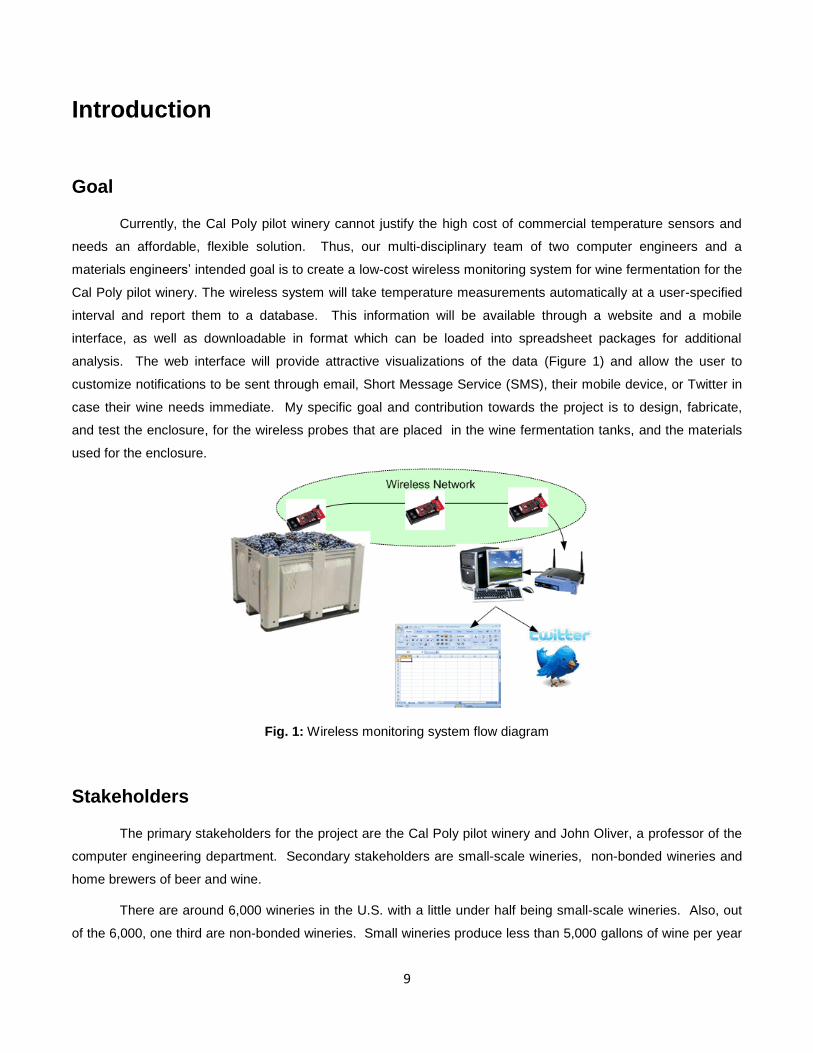
Introduction
Goal
Currently, the Cal Poly pilot winery cannot justify the high cost of commercial temperature sensors and
needs an affordable, flexible solution. Thus, our multi-disciplinary team of two computer engineers and a
materials engineers’ intended goal is to create a low-cost wireless monitoring system for wine fermentation for the
Cal Poly pilot winery. The wireless system will take temperature measurements automatically at a user-specified
interval and report them to a database. This information will be available through a website and a mobile
interface, as well as downloadable in format which can be loaded into spreadsheet packages for additional
analysis. The web interface will provide attractive visualizations of the data (Figure 1) and allow the user to
customize notifications to be sent through email, Short Message Service (SMS), their mobile device, or Twitter in
case their wine needs immediate. My specific goal and contribution towards the project is to design, fabricate,
and test the enclosure, for the wireless probes that are placed in the wine fermentation tanks, and the materials
used for the enclosure.
Fig. 1: Wireless monitoring system flow diagram
Stakeholders
The primary stakeholders for the project are the Cal Poly pilot winery and John Oliver, a professor of the
computer engineering department. Secondary stakeholders are small-scale wineries, non-bonded wineries and
home brewers of beer and wine.
There are around 6,000 wineries in the U.S. with a little under half being small-scale wineries. Also, out
of the 6,000, one third are non-bonded wineries. Small wineries produce less than 5,000 gallons of wine per year
10
and non-bonded wineries are ones that produce or buy their own grapes, but rely on a bonded winery facility to
physically make and bottle their wine. The American Homebrewers Association (AHA) has 30,000 beer-brewing
members, but the AHA says that there are 1,000,000 Americans which brew beer or make wine at least once a
year.
Broader Impacts
The primary stakeholder’s program is funded by the university and surrounding small-scale wineries
through donations. If we can make the program cheaper, the program won’t need to rely on the limited funding by
the university and the donations given by local wineries. Also, if the program is cheaper, these local wineries
won’t need to donate as much in order to keep the program going and thus, use that savings in donations to
invest in their own products. This system could also be beneficial for research in winemaking. Temperature
variation is a key factor for how the resulting wine tastes, so if the system could help in the research of
winemaking, there could be the possibility for more “cutting edge” senior projects for the wine and viticulture
program.
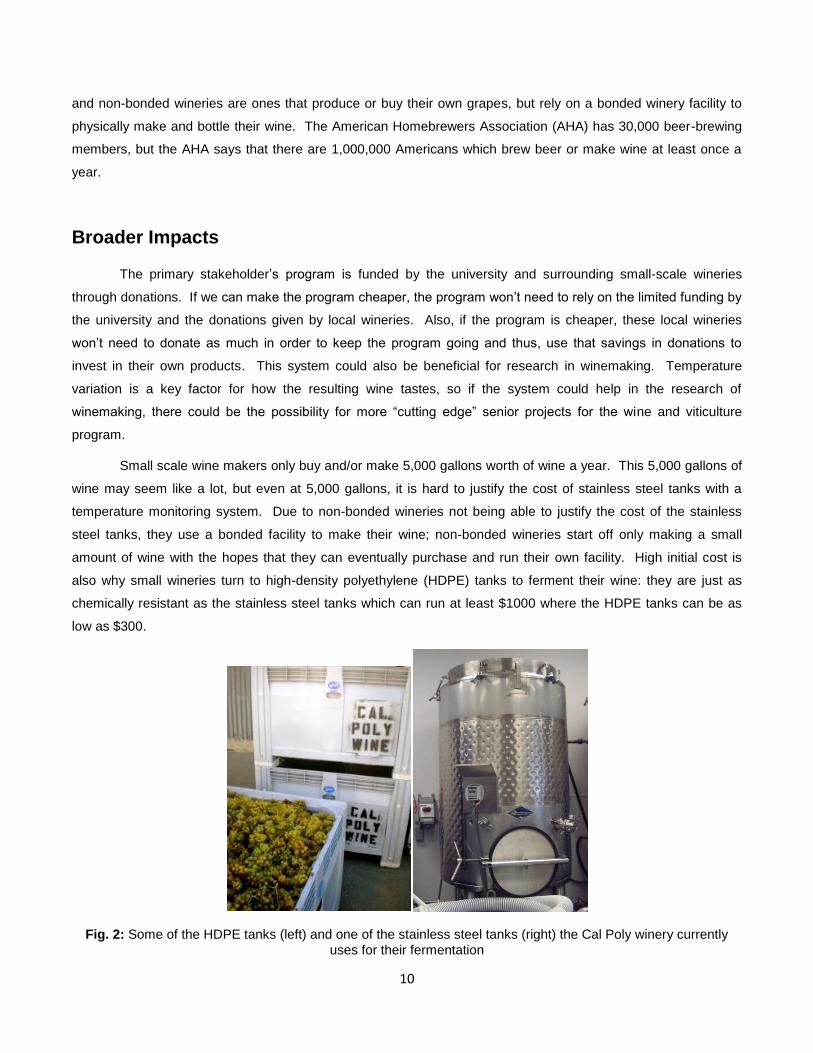
Small scale wine makers only buy and/or make 5,000 gallons worth of wine a year. This 5,000 gallons of
wine may seem like a lot, but even at 5,000 gallons, it is hard to justify the cost of stainless steel tanks with a
temperature monitoring system. Due to non-bonded wineries not being able to justify the cost of the stainless
steel tanks, they use a bonded facility to make their wine; non-bonded wineries start off only making a small
amount of wine with the hopes that they can eventually purchase and run their own facility. High initial cost is
also why small wineries turn to high-density polyethylene (HDPE) tanks to ferment their wine: they are just as
chemically resistant as the stainless steel tanks which can run at least $1000 where the HDPE tanks can be as
low as $300.
Fig. 2: Some of the HDPE tanks (left) and one of the stainless steel tanks (right) the Cal Poly winery currently
uses for their fermentation
11
With the use of our temperature measurement system, small-scale winemakers can use it with their current
fermentation system due to it being highly integrative with their current equipment. Thus, they will not have to
upgrade to the stainless steel tanks and further save at least $700 per HDPE tank used rather than the stainless
steel tanks.
Design Constraints
Economic
With the primary stakeholders of my project being the Cal Poly pilot winery and John Oliver, the wireless
temperature monitoring system needs to be affordable not only for the prototypes but for future sellable models.
The temperature monitoring system needs to be affordable because the project is funded by only John Oliver and
a small grant from CP connect. Thus each prototyped node, one temperature monitoring device which will be in
each of the fermentation tanks, must be less than $100 each. The system also needs to be sellable to the Cal
Poly winery because, according to Matt Brain (the Cal Poly pilot winery’s winemaker), they only buy a few
hundred dollars worth of wine for each ferment, thus the nodes need to be less than $35 a piece in order for them
to be a reasonable investment. Currently there is a system similar to what we want to make called TankNET, but
the system would cost at least $300. If we look at just a simple temperature controller without a web-interface,
the temperature controller still costs around $80. Thus, if we could make a product that is $35 with a web
interface, there is the possibility that this device and business can impact the wine making market.
In order to meet these constraints on budget, I will apply my knowledge of materials selection to pick a
material which possesses all of the properties necessary for the design with a constraint on cost. Then once I
have come up with a design which minimizes the amount of material needed, which is also dependent on the
choice of the material, I will use my knowledge of cost analysis to see if the prototype and then the sellable model
are under the price limit of $100.
Societal
Since we are trying to make the system desirable for the wine industry, we have to make the temperature
measurement system be appropriate for the wine industry. We are accomplishing this by working Matt Brain,
winemaker for the Cal Poly pilot winery, and getting his feedback for what he would want out of a temperature
sensor. We are also going to use the winery for on-site testing of the prototype.
The measurement system also needs to have an impact on the wine community. In order for the system
to have a significant impact, the system needs to be low in cost, save the winemakers’ time, and (most
importantly) be easily adapted into the setups the wineries already use. In order to accomplish this, we are going
to try to make the sensor inexpensive enough so even the smallest wineries can benefit from the system, use
web-based software so the winemaker can access the information from anywhere, and design it in a way where
the system can be used with the wineries existing fermentation equipment.
12
Health and Safety
Wine is supposed to be drinkable and have absolutely no health hazards, and this could entail only
allowing FDA approved materials. But, the FDA approval process has already been addressed for the current
fermentation equipment, but if we want each node to be able to sit in the fermenting wine, the materials needed
for the enclosure of each of the nodes needs to be as resistant and not leach any hazardous chemicals into the
wine. To address this problem, in the materials selection process, only materials which can withstand weak acids
can be used. However, in order to get a better idea of how the materials will react with the wine and the cleaning
chemicals the winery uses, testing of the materials which passed materials selection will be tested in wine and
two of the most common cleaning chemicals used (citric acid and sodium hydroxide) for cleaning the fermentation
tanks.
Safety also means that the product should not hurt the person handling the nodes. Product-human
interaction must be taken into account for the wireless probe specifically because the user will be taking the node
in and out of the fermentation tank numerous times. One of the main things which could be easily implemented is
to not have any sharp edges or small points protruding out of the probe.
Environmental Effects and Sustainability
With the incorporation of an efficient manufacturing process with easily recyclable and available materials
(including a rechargeable battery for the probes), this product should have a small impact on carbon dioxide
emissions. In order to get a better idea of how sustainable the product will be through how the nodes will be
produced and used, a lifecycle assessment, including a cost analysis will be completed once we have built our
final prototype.
13
Background
The Cal Poly Pilot Winery
The pilot winery began as an idea in September 2007 and the winery became a reality in September
2008 when they had their first fermentation. The winery was started by one of the enology professors and was
able to be built based on donation and some minor funding from the food science and nutrition department. The
winery is in a renovated space in the Crops Unit, with a 10 to 12 ton capacity and it houses a cool room, presses,
a de-stemmer and elevator, steam generator, bottling line, tanks, sinks and work areas. The program is currently
only based on the donations including the equipment, barrels, and grapes. But because of the winery being run
mostly by donations, they cannot sell the wine. Thus, the only purpose of the winery is for research for the benefit
of the wine and viticulture majors taking the series during their third year in the program and also for senior project
research. Due to not being able to sell the wine and not wanting to just throw the wine away, the wine produced
is donated to the students, faculty, fundraising, and charity.
Each year the winery produces 1300 gallons of wine where they use 5 to 10 tubs for the 5 to 10 different
types of grapes which are donated from wineries around the central coast. The chardonnays come from Edna
Valley, the cabernets come from Paso Robles, and the Pinots come from Santa Maria. They also have a
vineyard next to the facility which started 5 to 6 years ago, but this vineyard is licensed and run by the Cal Poly
wine company where they can sell the wine. Thus, the pilot winery only gets 2 ½ tons out of the many from that
vineyard.
The current cellarmaster, Matt Brain, has been there for almost a year and has a degree in biological
sciences, but has a background in process engineering. He pursued his dream of winemaking after a successful
career in Toronto and was involved with his first harvest in 2006 in San Luis Obispo. He eventually earned his
degree in winemaking from UC Davis and then developed a strong relationship with the enology and viticulture
program at Cal Poly by eventually becoming a lecturer and managing the pilot winery. He loves working with his
students and mentors them with their senior research projects. He also has his own winery which began 4 years
ago called “Baker & Brain” with winemaker Josh Baker.
Importance of temperature measurement
White wines are typically fermented in the range of 64 to 68°F and red wines are typically fermented at
temperatures up to 85°F. White fermentations last between 10 – 30 days and red fermentations last between 4 –
12 days. However, temperature is one of the most important parameters and slight variation can cause a
completely different result in the wine due to the variation in temperature affects the yeast growth kinetics and the
14
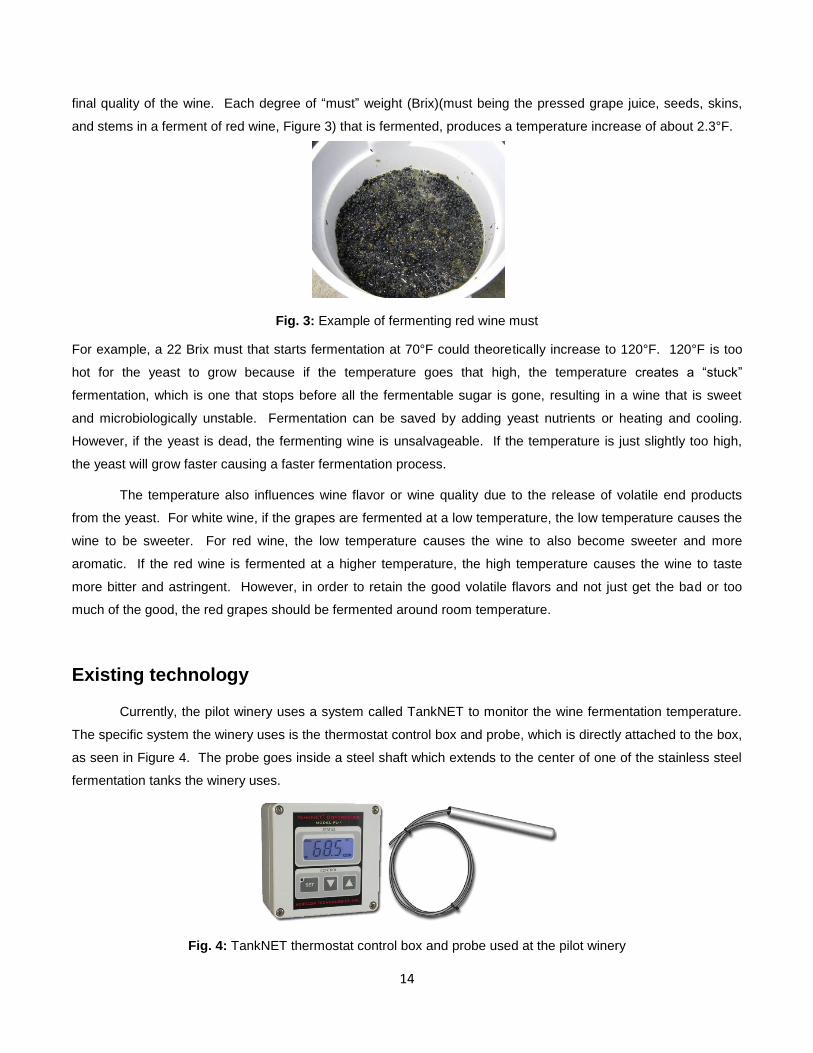
final quality of the wine. Each degree of “must” weight (Brix)(must being the pressed grape juice, seeds, skins,
and stems in a ferment of red wine, Figure 3) that is fermented, produces a temperature increase of about 2.3°F.
Fig. 3: Example of fermenting red wine must
For example, a 22 Brix must that starts fermentation at 70°F could theoretically increase to 120°F. 120°F is too
hot for the yeast to grow because if the temperature goes that high, the temperature creates a “stuck”
fermentation, which is one that stops before all the fermentable sugar is gone, resulting in a wine that is sweet
and microbiologically unstable. Fermentation can be saved by adding yeast nutrients or heating and cooling.
However, if the yeast is dead, the fermenting wine is unsalvageable. If the temperature is just slightly too high,
the yeast will grow faster causing a faster fermentation process.
The temperature also influences wine flavor or wine quality due to the release of volatile end products
from the yeast. For white wine, if the grapes are fermented at a low temperature, the low temperature causes the
wine to be sweeter. For red wine, the low temperature causes the wine to also become sweeter and more
aromatic. If the red wine is fermented at a higher temperature, the high temperature causes the wine to taste
more bitter and astringent. However, in order to retain the good volatile flavors and not just get the bad or too
much of the good, the red grapes should be fermented around room temperature.
Existing technology
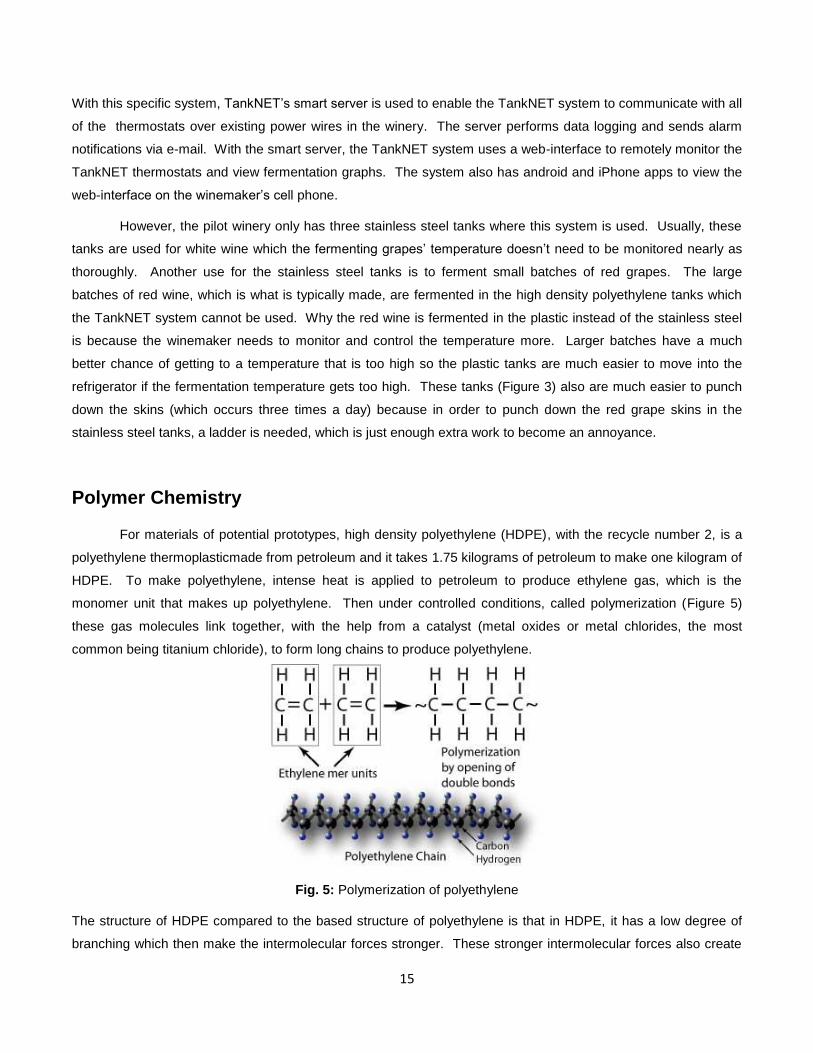
Currently, the pilot winery uses a system called TankNET to monitor the wine fermentation temperature.
The specific system the winery uses is the thermostat control box and probe, which is directly attached to the box,
as seen in Figure 4. The probe goes inside a steel shaft which extends to the center of one of the stainless steel
fermentation tanks the winery uses.
Fig. 4: TankNET thermostat control box and probe used at the pilot winery
15
With this specific system, TankNET’s smart server is used to enable the TankNET system to communicate with all
of the thermostats over existing power wires in the winery. The server performs data logging and sends alarm
notifications via e-mail. With the smart server, the TankNET system uses a web-interface to remotely monitor the
TankNET thermostats and view fermentation graphs. The system also has android and iPhone apps to view the
web-interface on the winemaker’s cell phone.
However, the pilot winery only has three stainless steel tanks where this system is used. Usually, these
tanks are used for white wine which the fermenting grapes’ temperature doesn’t need to be monitored nearly as
thoroughly. Another use for the stainless steel tanks is to ferment small batches of red grapes. The large
batches of red wine, which is what is typically made, are fermented in the high density polyethylene tanks which
the TankNET system cannot be used. Why the red wine is fermented in the plastic instead of the stainless steel
is because the winemaker needs to monitor and control the temperature more. Larger batches have a much
better chance of getting to a temperature that is too high so the plastic tanks are much easier to move into the
refrigerator if the fermentation temperature gets too high. These tanks (Figure 3) also are much easier to punch
down the skins (which occurs three times a day) because in order to punch down the red grape skins in the
stainless steel tanks, a ladder is needed, which is just enough extra work to become an annoyance.
Polymer Chemistry
For materials of potential prototypes, high density polyethylene (HDPE), with the recycle number 2, is a
polyethylene thermoplasticmade from petroleum and it takes 1.75 kilograms of petroleum to make one kilogram of
HDPE. To make polyethylene, intense heat is applied to petroleum to produce ethylene gas, which is the
monomer unit that makes up polyethylene. Then under controlled conditions, called polymerization (Figure 5)
these gas molecules link together, with the help from a catalyst (metal oxides or metal chlorides, the most
common being titanium chloride), to form long chains to produce polyethylene.
Fig. 5: Polymerization of polyethylene
The structure of HDPE compared to the based structure of polyethylene is that in HDPE, it has a low degree of
branching which then make the intermolecular forces stronger. These stronger intermolecular forces also create
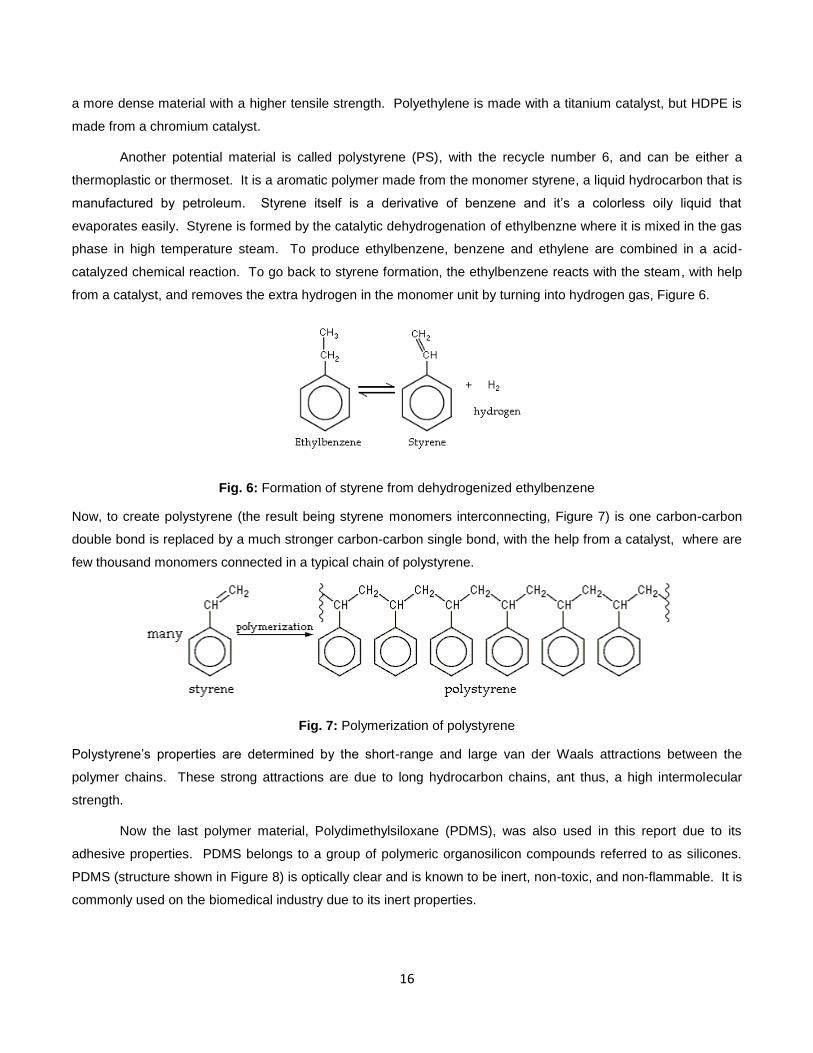
16
a more dense material with a higher tensile strength. Polyethylene is made with a titanium catalyst, but HDPE is
made from a chromium catalyst.
Another potential material is called polystyrene (PS), with the recycle number 6, and can be either a
thermoplastic or thermoset. It is a aromatic polymer made from the monomer styrene, a liquid hydrocarbon that is
manufactured by petroleum. Styrene itself is a derivative of benzene and it’s a colorless oily liquid that
evaporates easily. Styrene is formed by the catalytic dehydrogenation of ethylbenzne where it is mixed in the gas
phase in high temperature steam. To produce ethylbenzene, benzene and ethylene are combined in a acid-
catalyzed chemical reaction. To go back to styrene formation, the ethylbenzene reacts with the steam, with help
from a catalyst, and removes the extra hydrogen in the monomer unit by turning into hydrogen gas, Figure 6.
Fig. 6: Formation of styrene from dehydrogenized ethylbenzene
Now, to create polystyrene (the result being styrene monomers interconnecting, Figure 7) is one carbon-carbon
double bond is replaced by a much stronger carbon-carbon single bond, with the help from a catalyst, where are
few thousand monomers connected in a typical chain of polystyrene.
Fig. 7: Polymerization of polystyrene
Polystyrene’s properties are determined by the short-range and large van der Waals attractions between the
polymer chains. These strong attractions are due to long hydrocarbon chains, ant thus, a high intermolecular
strength.
Now the last polymer material, Polydimethylsiloxane (PDMS), was also used in this report due to its
adhesive properties. PDMS belongs to a group of polymeric organosilicon compounds referred to as silicones.
PDMS (structure shown in Figure 8) is optically clear and is known to be inert, non-toxic, and non-flammable. It is
commonly used on the biomedical industry due to its inert properties.
17
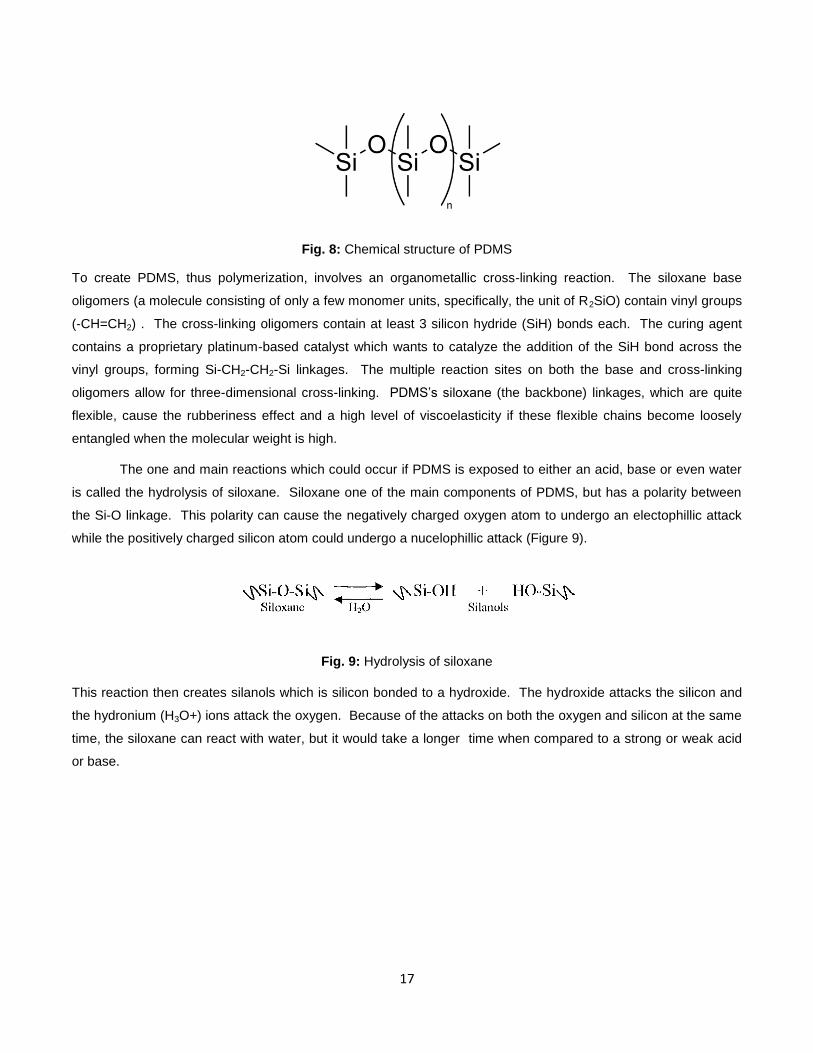
Fig. 8: Chemical structure of PDMS
To create PDMS, thus polymerization, involves an organometallic cross-linking reaction. The siloxane base
oligomers (a molecule consisting of only a few monomer units, specifically, the unit of R2SiO) contain vinyl groups
(-CH=CH2) . The cross-linking oligomers contain at least 3 silicon hydride (SiH) bonds each. The curing agent
contains a proprietary platinum-based catalyst which wants to catalyze the addition of the SiH bond across the
vinyl groups, forming Si-CH2-CH2-Si linkages. The multiple reaction sites on both the base and cross-linking
oligomers allow for three-dimensional cross-linking. PDMS’s siloxane (the backbone) linkages, which are quite
flexible, cause the rubberiness effect and a high level of viscoelasticity if these flexible chains become loosely
entangled when the molecular weight is high.
The one and main reactions which could occur if PDMS is exposed to either an acid, base or even water
is called the hydrolysis of siloxane. Siloxane one of the main components of PDMS, but has a polarity between
the Si-O linkage. This polarity can cause the negatively charged oxygen atom to undergo an electophillic attack
while the positively charged silicon atom could undergo a nucelophillic attack (Figure 9).
Fig. 9: Hydrolysis of siloxane
This reaction then creates silanols which is silicon bonded to a hydroxide. The hydroxide attacks the silicon and
the hydronium (H3O+) ions attack the oxygen. Because of the attacks on both the oxygen and silicon at the same
time, the siloxane can react with water, but it would take a longer time when compared to a strong or weak acid
or base.
18
Procedure
Materials Selection
In order to determine the best enclosing material for the temperature measurement system, Cambridge
University’s CES materials selection software was utilized. Before materials selection can begin, the overall
function, constraints, and objectives need to be outlined. Thus, for the wireless temperature sensor enclosure,
the function is to allow the temperature of the fermenting wine to be measured. The enclosure’s constraints are a
radio signal must be able to go through, must not deflect too much, and be corrosive resistant. The objectives of
the enclosure are minimize cost, minimize water absorption, and maximize durability against weak acids.
Now knowing the overall function, constraints, and objectives, CES was then utilized to pick the best
material. With the constraint on the radio signal being able to go through the material, a tree was made limiting
the materials to polymers. With the constraint on being corrosive resistant and the objectives of minimizing
water adsorption and maximizing durability to weak acids, a stage was created graphing percent water adsorption
(at 24 hours) versus poor to excellent resistance to weak acids. To reduce the amount of materials which
“passed”, the amount of water adsorbed was limited to less than 0.01 weight percent and only accounting for
materials which have excellent resistance to weak acids. To create a stiffness limited design with the panel
configuration minimizing cost, a stage was created graphing Young’s modulus versus density times price. With
this graph, the index was represented by a line with a slope of 3. With this slope line added to the
graph, if the slope line is moved up, the more stiff and the cheaper the materials are that pass. The slope was
moved to where the CES program’s slope line function allowed for almost half of the materials to “pass”.
Preliminary Test
With the top materials chosen from materials selection, two of the 14 “passing” materials, HDPE and
polystyrene, were used to undergo a preliminary environmental test to make sure the materials do not absorb
water or degrade over the two week wine fermentation period. To make the environment as similar as possible to
actual wine fermentation, Carl Rossi wine was used and was also elevated to 94 °F which is the maximum
temperature achieved during red wine fermentation.
In addition to these two materials, polydimethylsiloxane (PDMS), an inorganic elastomer, was also tested
due to using it as an adhesive for the design. The two materials which passed, polystyrene and HDPE, were
made into test samples with the dimensions of an inch in diameter and half an inch thick. The PDMS was cured
into a Petri dish and cut into a three quarter inch by three quarter inch by quarter inch thick test samples. For
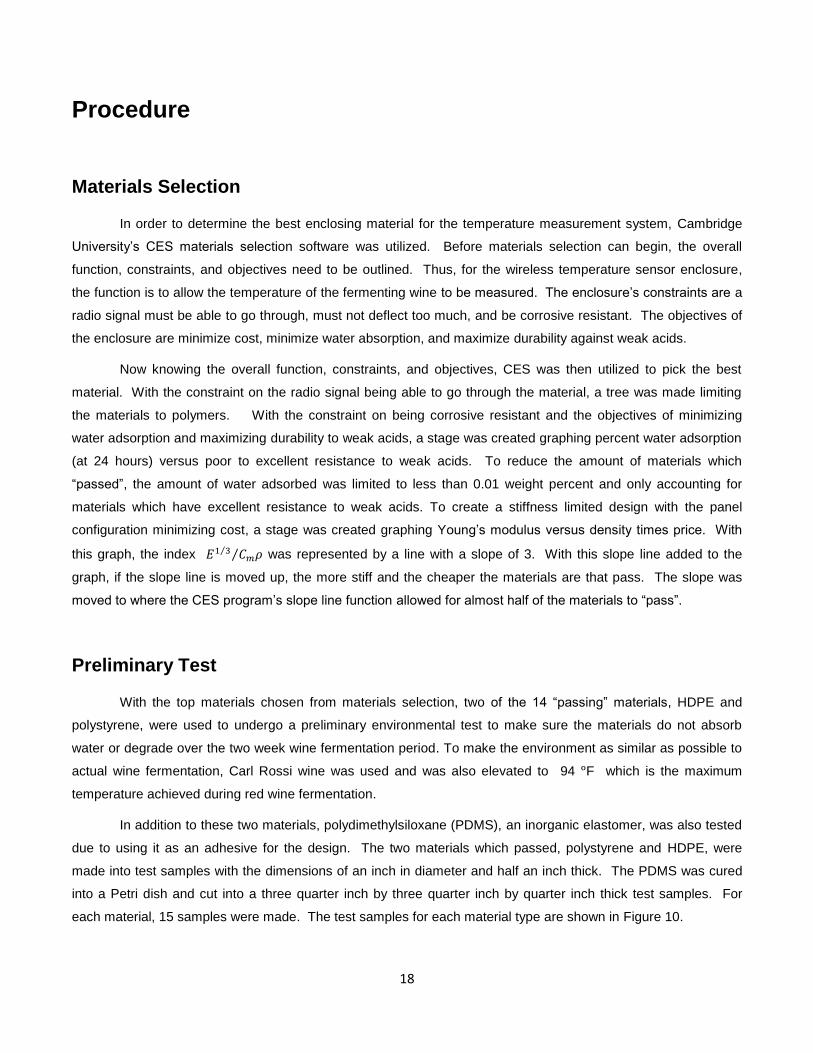
each material, 15 samples were made. The test samples for each material type are shown in Figure 10.
19
Fig. 10: PDMS (A), HDPE(B) and Polystyrene(C) test samples for environmental testing
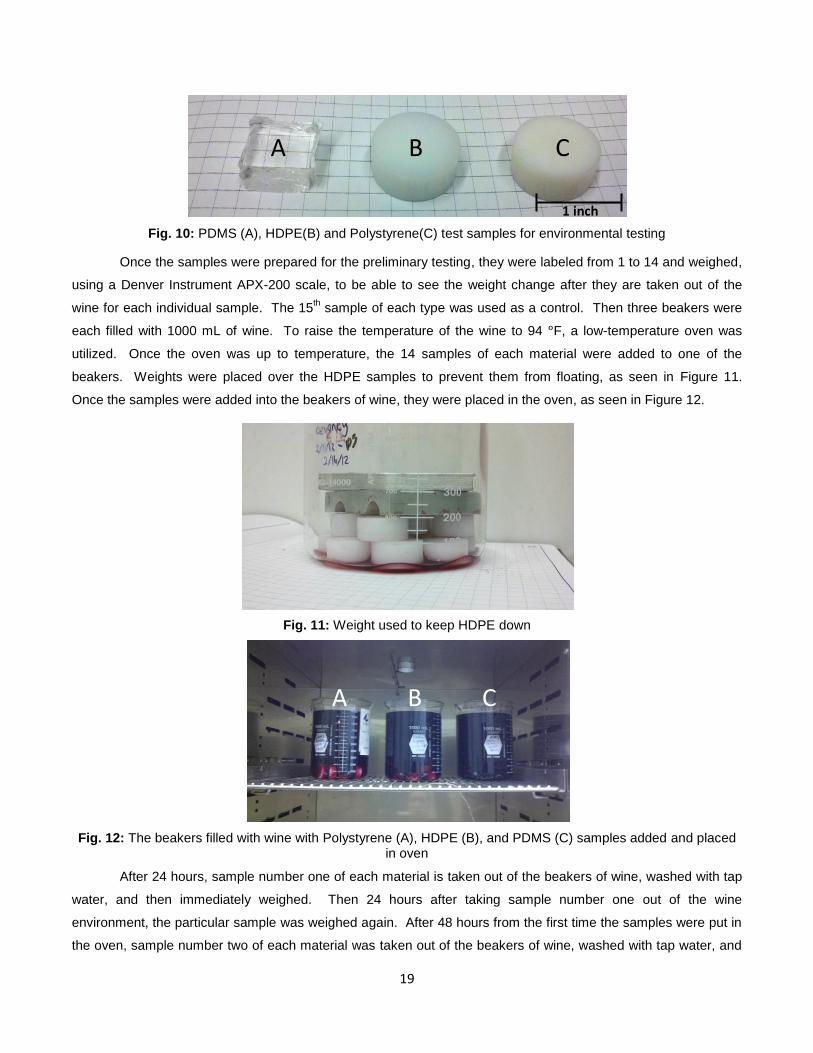
Once the samples were prepared for the preliminary testing, they were labeled from 1 to 14 and weighed,
using a Denver Instrument APX-200 scale, to be able to see the weight change after they are taken out of the
wine for each individual sample. The 15th sample of each type was used as a control. Then three beakers were
each filled with 1000 mL of wine. To raise the temperature of the wine to 94 °F, a low-temperature oven was
utilized. Once the oven was up to temperature, the 14 samples of each material were added to one of the
beakers. Weights were placed over the HDPE samples to prevent them from floating, as seen in Figure 11.
Once the samples were added into the beakers of wine, they were placed in the oven, as seen in Figure 12.
Fig. 11: Weight used to keep HDPE down
Fig. 12: The beakers filled with wine with Polystyrene (A), HDPE (B), and PDMS (C) samples added and placed in oven
After 24 hours, sample number one of each material is taken out of the beakers of wine, washed with tap
water, and then immediately weighed. Then 24 hours after taking sample number one out of the wine
environment, the particular sample was weighed again. After 48 hours from the first time the samples were put in
the oven, sample number two of each material was taken out of the beakers of wine, washed with tap water, and
A B C
A B C
1 inch
20
then immediately weighed. Then, again, after 24 hours, sample number two was weighed again. This same
procedure was done for each of the 14 days.
Chemical Degradation
In order to see if PDMS is truly the right material to use as the part of the design, PDMS was exposed in a
diluted solution of sodium hydroxide and citric acid and the mechanical, visual, and physical properties were
analyzed to make sure that PDMS will withstand the cleaning chemicals used at the pilot winery.
For testing, ASTM standard D543-06: Standard Practices for Evaluating the Resistance of Plastics to
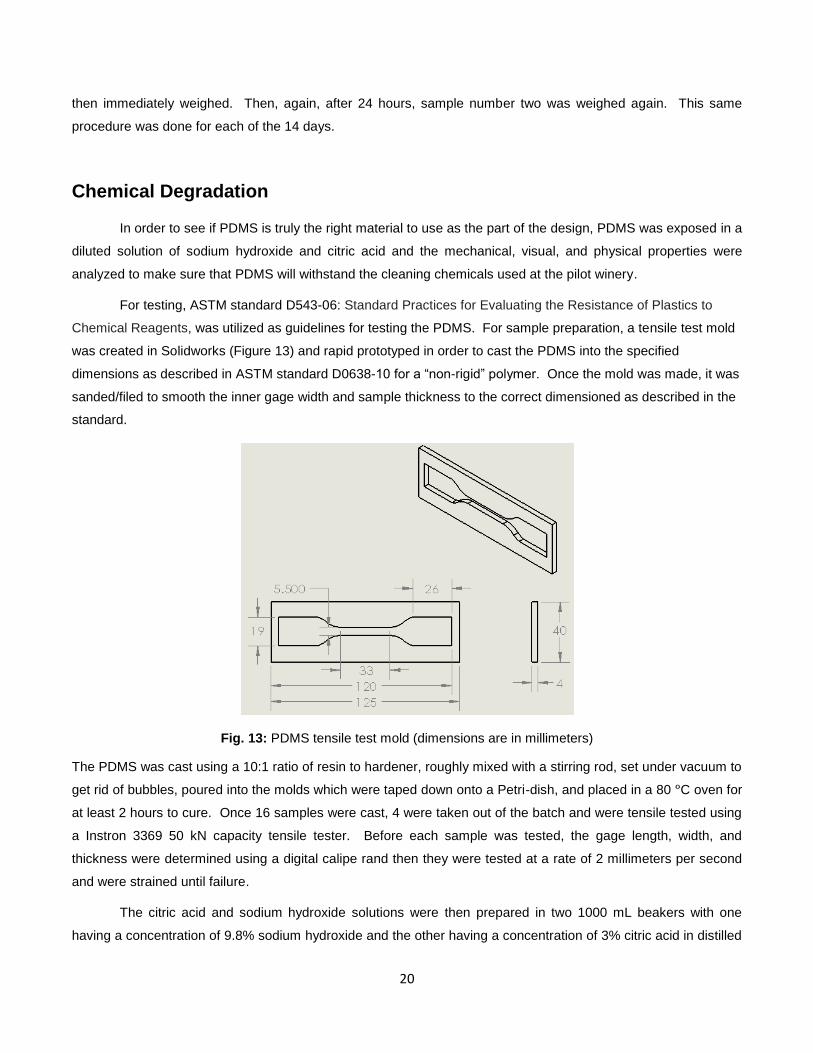
Chemical Reagents, was utilized as guidelines for testing the PDMS. For sample preparation, a tensile test mold
was created in Solidworks (Figure 13) and rapid prototyped in order to cast the PDMS into the specified
dimensions as described in ASTM standard D0638-10 for a “non-rigid” polymer. Once the mold was made, it was
sanded/filed to smooth the inner gage width and sample thickness to the correct dimensioned as described in the
standard.
Fig. 13: PDMS tensile test mold (dimensions are in millimeters)
The PDMS was cast using a 10:1 ratio of resin to hardener, roughly mixed with a stirring rod, set under vacuum to
get rid of bubbles, poured into the molds which were taped down onto a Petri-dish, and placed in a 80 °C oven for
at least 2 hours to cure. Once 16 samples were cast, 4 were taken out of the batch and were tensile tested using
a Instron 3369 50 kN capacity tensile tester. Before each sample was tested, the gage length, width, and
thickness were determined using a digital calipe rand then they were tested at a rate of 2 millimeters per second
and were strained until failure.
The citric acid and sodium hydroxide solutions were then prepared in two 1000 mL beakers with one
having a concentration of 9.8% sodium hydroxide and the other having a concentration of 3% citric acid in distilled
21
water. For distinction purposes, for each solution, the samples were marked 1 – 6 with 1 – 3 being the ones used
for weight and visual inspection and 4 – 6 for tensile testing. All of the samples were added to the solution after
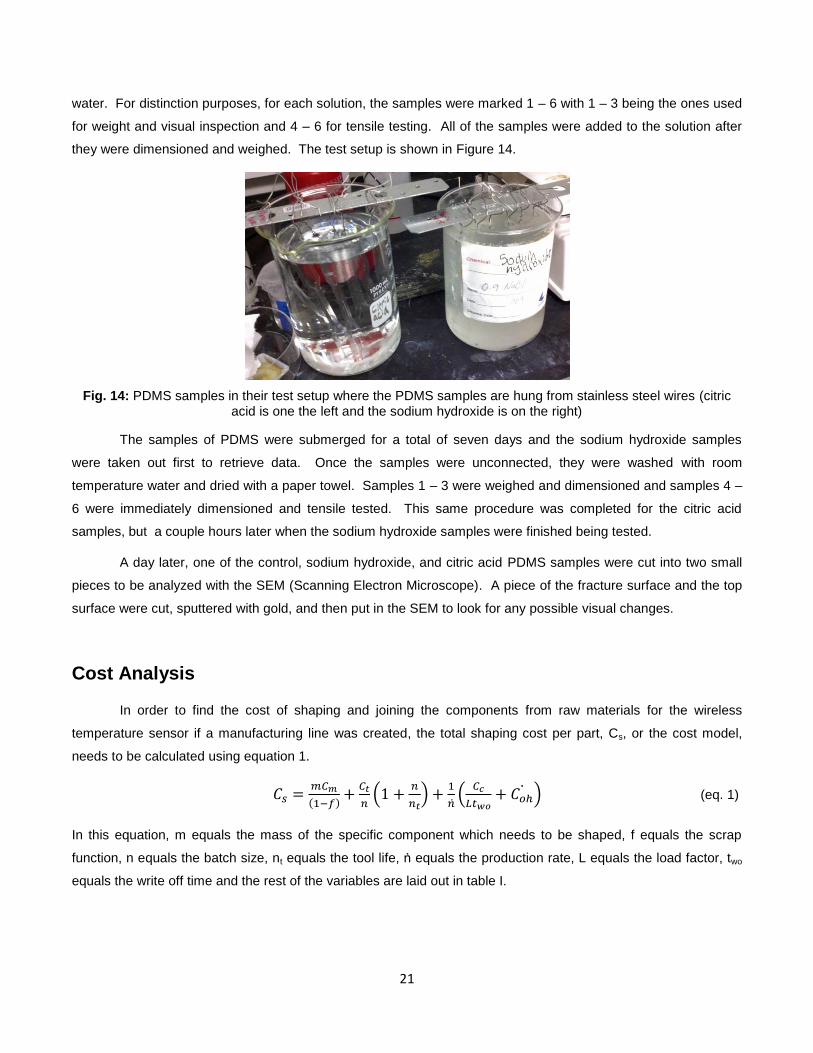
they were dimensioned and weighed. The test setup is shown in Figure 14.
Fig. 14: PDMS samples in their test setup where the PDMS samples are hung from stainless steel wires (citric acid is one the left and the sodium hydroxide is on the right)
The samples of PDMS were submerged for a total of seven days and the sodium hydroxide samples
were taken out first to retrieve data. Once the samples were unconnected, they were washed with room
temperature water and dried with a paper towel. Samples 1 – 3 were weighed and dimensioned and samples 4 –
6 were immediately dimensioned and tensile tested. This same procedure was completed for the citric acid
samples, but a couple hours later when the sodium hydroxide samples were finished being tested.
A day later, one of the control, sodium hydroxide, and citric acid PDMS samples were cut into two small
pieces to be analyzed with the SEM (Scanning Electron Microscope). A piece of the fracture surface and the top
surface were cut, sputtered with gold, and then put in the SEM to look for any possible visual changes.
Cost Analysis
In order to find the cost of shaping and joining the components from raw materials for the wireless
temperature sensor if a manufacturing line was created, the total shaping cost per part, Cs, or the cost model,
needs to be calculated using equation 1.
(eq. 1)
In this equation, m equals the mass of the specific component which needs to be shaped, f equals the scrap
function, n equals the batch size, nt equals the tool life, ṅ equals the production rate, L equals the load factor, two
equals the write off time and the rest of the variables are laid out in table I.
22
Table I: Definitions and units in the cost model
Resource Description Symbol Unit
Materials: Including consumables Cm $/kg Capital: Cost of tooling Ct $
Cost of equipment Cc $ Time: Overhead rate $/h
With this equation, a table of each part that needs to individually be manufactured, the tools that will
shape each part, the cost of replacing the tools, and the cost of the equipment was created to help with the
calculation of the shaping costs.
Once the overall cost of shaping the node enclosure was calculated, a graph was created to show the
batch size versus how much each overall component would cost. With the help of this graph, the point where the
graph beings to flatten out is the best batch size where the cost will be the lowest.
Life Cycle Analysis
Before a life cycle analysis can be completed, the goal and scope of the analysis needs to be defined.
The goal of this assessment was to analyze the life of the node and see if the node will have, hopefully, an low
impact on the environment. The scope is covering up to the resource consumption and emissions of the product
over its entire lifetime. With this method, however, the electronics involved with the sensor were not included in
the assessment due to being too complex to analyze.
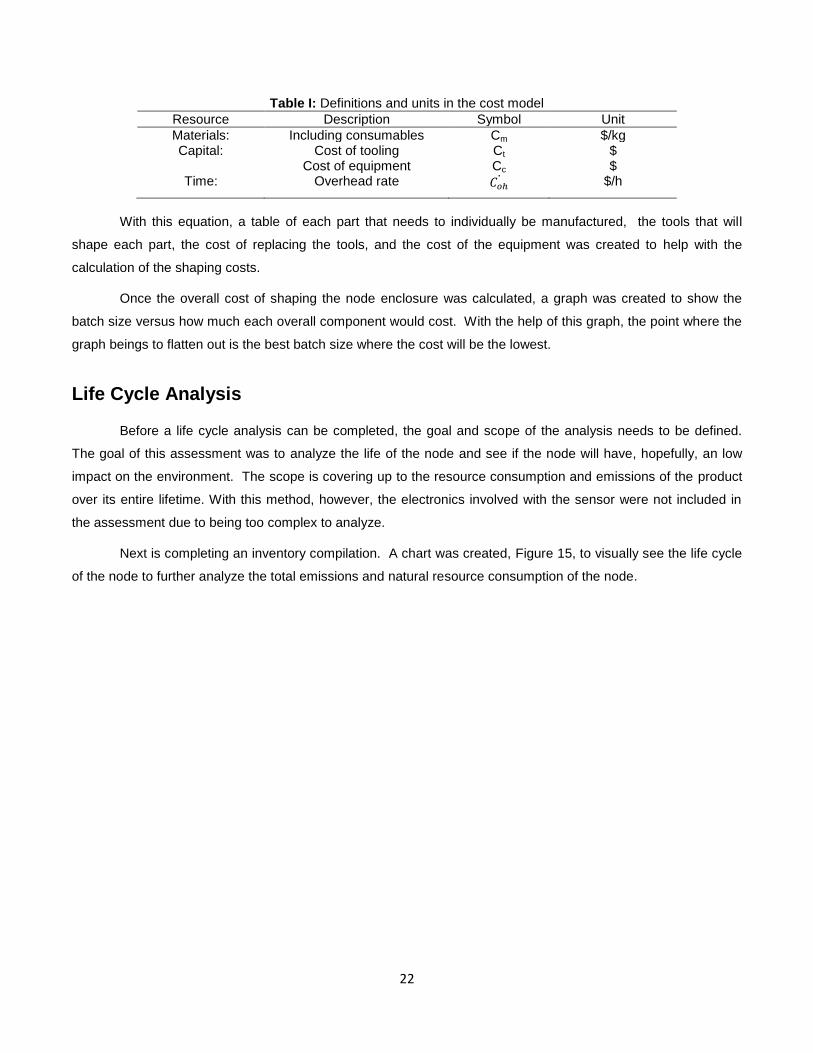
Next is completing an inventory compilation. A chart was created, Figure 15, to visually see the life cycle
of the node to further analyze the total emissions and natural resource consumption of the node.
23
Fig. 15: Inventory analysis for the materials used for the enclosure of the node
With the inventory compilation laid out, the next step is impact assessment. Now knowing the kind of
resource consumption and emissions which are involved with the materials for the system, the numbers for the
emissions can be estimated for each part of the material’s life.
Lastly is the interpretation of the inventory compilation. With the use of visually seeing the product’s life
and the numbers involved in the inventory compilation, a streamlined life cycle analysis matrix is formed. a
streamlined life cycle analysis matrix is much like a decision matrix but the life phases are at the column headers
and the impacts are the row headers. The ranking goes from 0 to 4 with 0 having the highest impact and 4 having
the least impact.
24
Results
Materials Selection
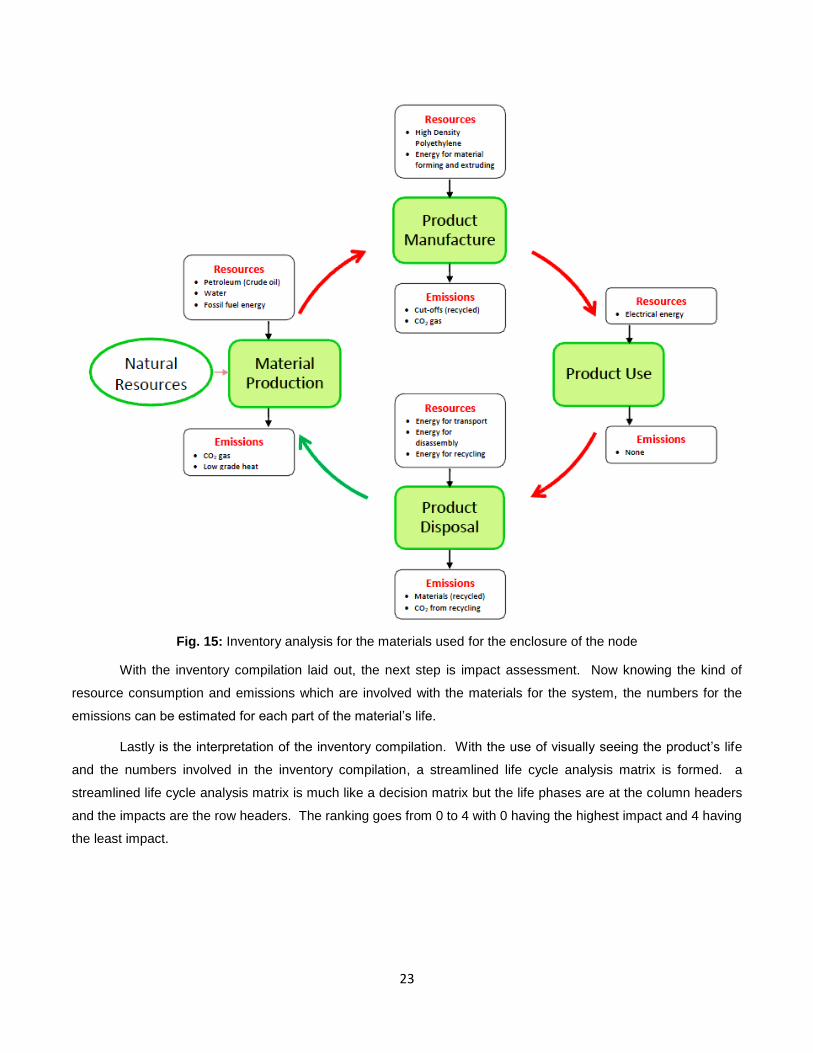
The best material for the node enclosure was found using the materials selection process on CES by
creating a limit tree, graphing water absorption versus resistance to weak acids (Figure 16) and then graphing
density times price versus Young’s modulus with an added slope line of 3 (Figure 17). This slope was used
because the index was represented due to using a stiffness limited design. With this slope line added
to the graph, if the slope line is moved up, the more stiff and the cheaper the materials are that pass.
Fig. 16: CES output for water adsorption versus resistance to weak acids
Fig. 17: CES output for the stiffness limited design with panel configuration minimizing cost
25
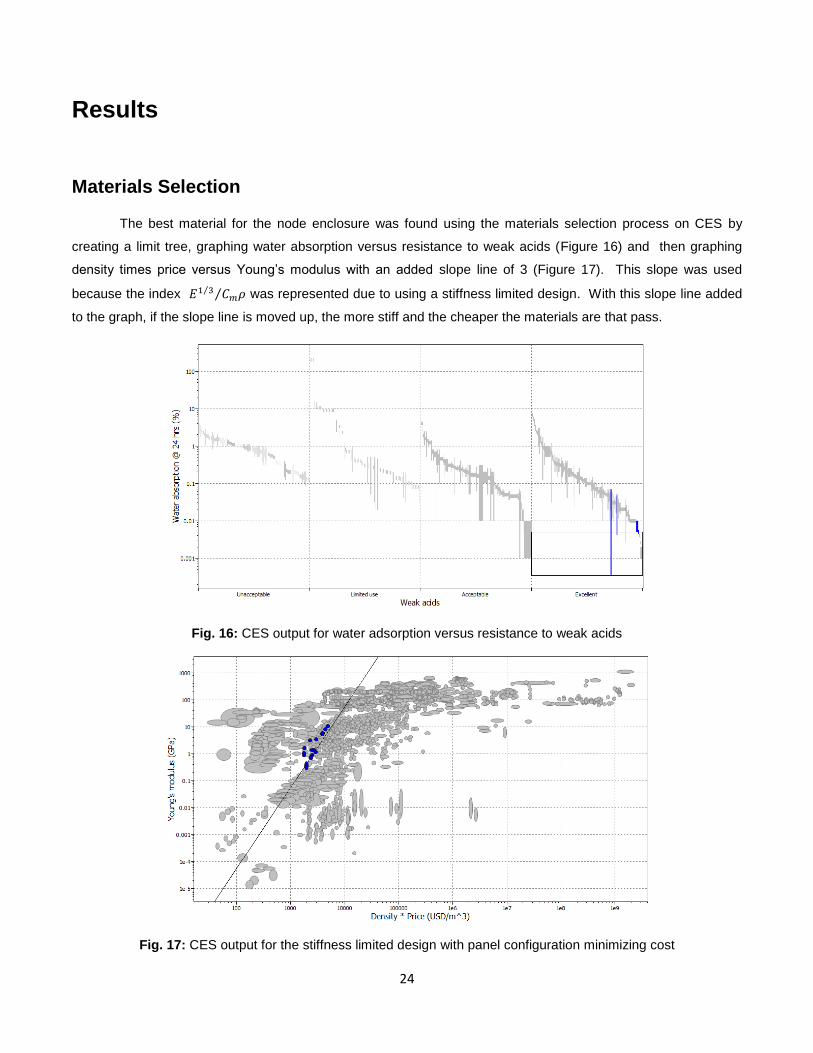
With these two graphs, and the limit tree, there was a total of 14 materials which passed of the stages (Figure 18)
including HDPE, Polypropylene (PP), Polystyrene (PS), and Polyvinylchloride (PVC).
Fig. 18: CES results for polymer materials which passed all the stages
With HDPE being the top three passing materials out of the 14, this polymer was chosen to potentially be the
enclosing the material for the node.
Preliminary Test
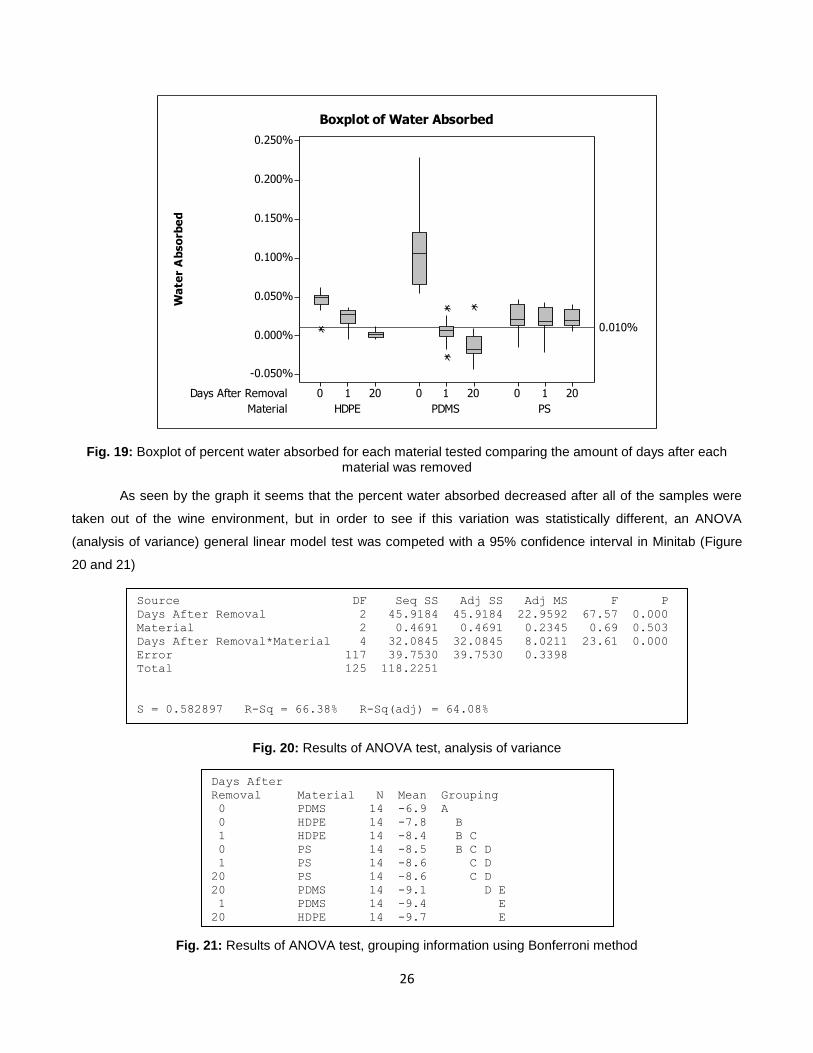
PS, HDPE, and PDMS samples were tested in wine at 94°F over a period of two weeks. Each day a
sample of each material was taken out of the wine and weighed. A day after the polymer samples were taken out
of the wine and a week after the two weeks of testing was completed, they were weighed again. Knowing the
weight before each sample was tested and the weight after they were taken out of the wine environment, a
percent weight change was calculated for each and plotted (Figure19) using Minitab software. To understand the
plot, the highest percent weight change can be due to the particular sample that was taken out after the last day
of the two week testing and the lowest percent weight change can be the particular sample that was taken out
after the first day of testing. Also, a reference line at 0.01% was added to the graph to show the limit used for the
materials selection process. The weight change based on the day taken out of the wine was not analyzed due to
the change being small, therefore, what was tested was overall, how much of the absorbed wine stayed and/or
evaporated when left out
26
Material
Days After Removal
PSPDMSHDPE
201020102010
0.250%
0.200%
0.150%
0.100%
0.050%
0.000%
-0.050%
Wa
ter
Ab
so
rbe
d
0.010%
Boxplot of Water Absorbed
Fig. 19: Boxplot of percent water absorbed for each material tested comparing the amount of days after each material was removed
As seen by the graph it seems that the percent water absorbed decreased after all of the samples were
taken out of the wine environment, but in order to see if this variation was statistically different, an ANOVA
(analysis of variance) general linear model test was competed with a 95% confidence interval in Minitab (Figure
20 and 21)
Fig. 20: Results of ANOVA test, analysis of variance
Fig. 21: Results of ANOVA test, grouping information using Bonferroni method
Days After
Removal Material N Mean Grouping
0 PDMS 14 -6.9 A
0 HDPE 14 -7.8 B
1 HDPE 14 -8.4 B C
0 PS 14 -8.5 B C D
1 PS 14 -8.6 C D
20 PS 14 -8.6 C D
20 PDMS 14 -9.1 D E
1 PDMS 14 -9.4 E
20 HDPE 14 -9.7 E
Source DF Seq SS Adj SS Adj MS F P
Days After Removal 2 45.9184 45.9184 22.9592 67.57 0.000
Material 2 0.4691 0.4691 0.2345 0.69 0.503
Days After Removal*Material 4 32.0845 32.0845 8.0211 23.61 0.000
Error 117 39.7530 39.7530 0.3398
Total 125 118.2251
S = 0.582897 R-Sq = 66.38% R-Sq(adj) = 64.08%
27
As shown by the two different results of the ANOVA test from Minitab, from Figure 20, the p-value was zero for
the days after removal, thus the null hypothesis that the days are equal can be rejected. From Figure 16, the
result that the days are different can also be shown more specifically by the grouping letter assigned to each
result of each material. It can be seen that HDPE’s day 20 was the only day which was statistically different
because day 0 and 1 had the same grouping letter. For PS, all of the days were statistically the same. Then for
PDMS, day 1 and 20 were statistically the same, but day 0 was statistically different. This means then that
HDPE’s percent weight change at day 20 was lower compared to day 0 and 1. For PS, the percent weight
change did not change. For PDMS, day 0 had a higher percent weight change compared to day 2 and 20.
Chemical Degradation
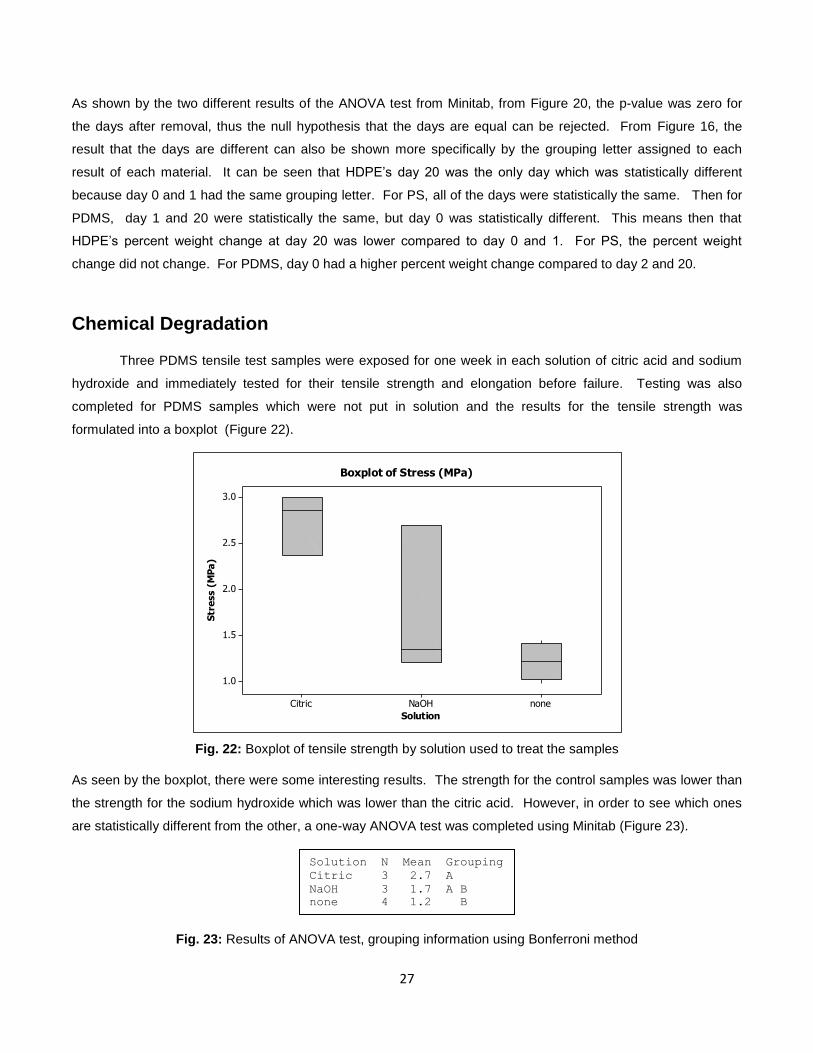
Three PDMS tensile test samples were exposed for one week in each solution of citric acid and sodium
hydroxide and immediately tested for their tensile strength and elongation before failure. Testing was also
completed for PDMS samples which were not put in solution and the results for the tensile strength was
formulated into a boxplot (Figure 22).
noneNaOHCitric
3.0
2.5
2.0
1.5
1.0
Solution
Str
ess (
MP
a)
Boxplot of Stress (MPa)
Fig. 22: Boxplot of tensile strength by solution used to treat the samples
As seen by the boxplot, there were some interesting results. The strength for the control samples was lower than
the strength for the sodium hydroxide which was lower than the citric acid. However, in order to see which ones
are statistically different from the other, a one-way ANOVA test was completed using Minitab (Figure 23).
Fig. 23: Results of ANOVA test, grouping information using Bonferroni method
Solution N Mean Grouping
Citric 3 2.7 A
NaOH 3 1.7 A B
none 4 1.2 B
28
It can be seen that the PDMS samples which were in the citric acid solution had a statistically higher strength
compared to the control, but the PDMS samples which were in the sodium hydroxide solution did not have a
strength that was statistically different between both the control and the citric acid samples. To understand why
the citric acid samples might have been much higher compared to the control samples, the one-way ANOVA test
was utilized to graph the residuals versus run order (Figure 24). The residual is difference between the mean
strength value and the strength that was measured for the particular run.
10987654321
1.00
0.75
0.50
0.25
0.00
-0.25
-0.50
Observation Order
Re
sid
ua
l
Versus Order(response is Stress (MPa))
Fig. 24: Representation of testing order’s effect on PDMS tensile sample’s tensile strength (Observation order 1-4 are the control samples, 5-7 are the NaOH samples, and 8-10 are the citric acids samples)
As seen by the graph, the run order had a significant effect on the responding strength value because the points
should be close to the zero line, but the points are all over the graph.
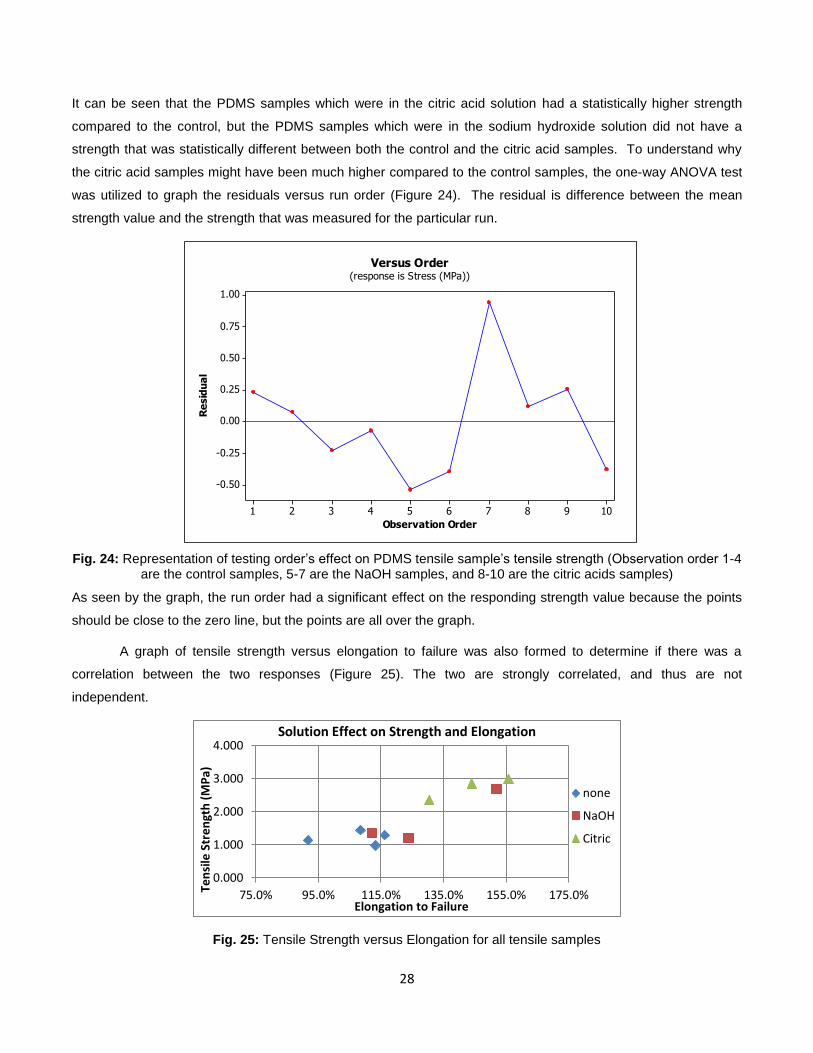
A graph of tensile strength versus elongation to failure was also formed to determine if there was a
correlation between the two responses (Figure 25). The two are strongly correlated, and thus are not
independent.
Fig. 25: Tensile Strength versus Elongation for all tensile samples
0.000
1.000
2.000
3.000
4.000
75.0% 95.0% 115.0% 135.0% 155.0% 175.0% Ten
sile
Str
en
gth
(M
Pa)
Elongation to Failure
Solution Effect on Strength and Elongation
none
NaOH
Citric
29
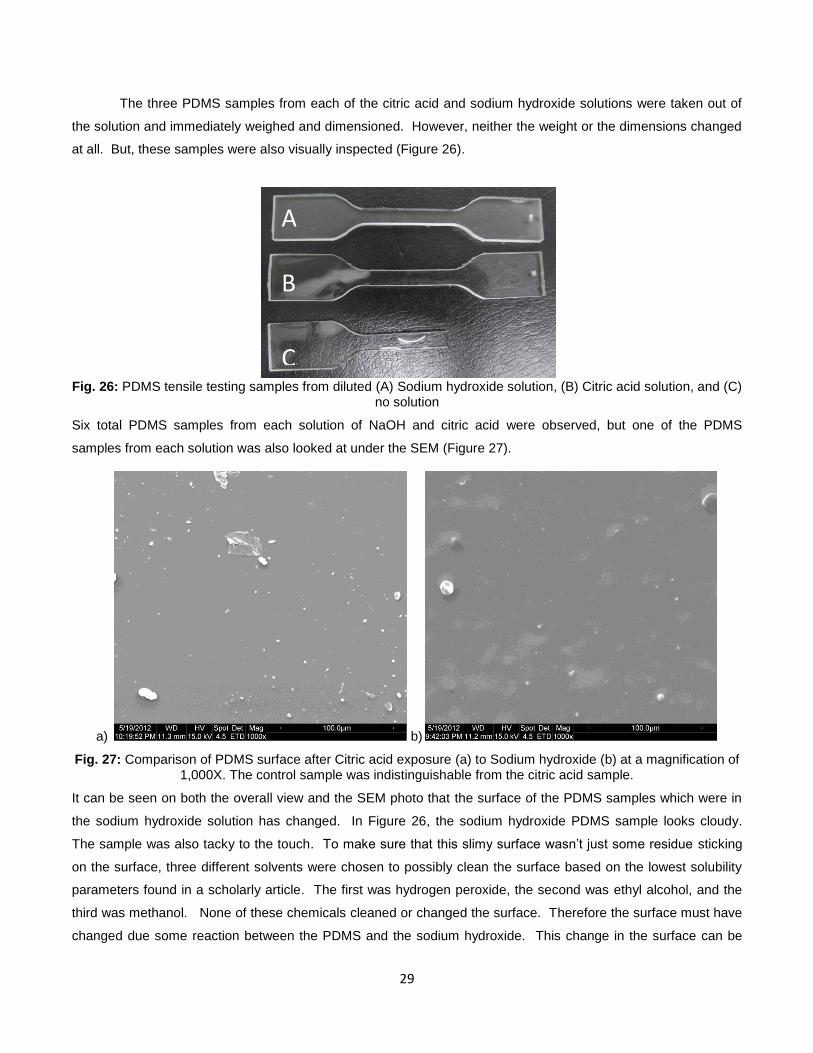
The three PDMS samples from each of the citric acid and sodium hydroxide solutions were taken out of
the solution and immediately weighed and dimensioned. However, neither the weight or the dimensions changed
at all. But, these samples were also visually inspected (Figure 26).
Fig. 26: PDMS tensile testing samples from diluted (A) Sodium hydroxide solution, (B) Citric acid solution, and (C)
no solution
Six total PDMS samples from each solution of NaOH and citric acid were observed, but one of the PDMS
samples from each solution was also looked at under the SEM (Figure 27).
a) b)
Fig. 27: Comparison of PDMS surface after Citric acid exposure (a) to Sodium hydroxide (b) at a magnification of 1,000X. The control sample was indistinguishable from the citric acid sample.
It can be seen on both the overall view and the SEM photo that the surface of the PDMS samples which were in
the sodium hydroxide solution has changed. In Figure 26, the sodium hydroxide PDMS sample looks cloudy.
The sample was also tacky to the touch. To make sure that this slimy surface wasn’t just some residue sticking
on the surface, three different solvents were chosen to possibly clean the surface based on the lowest solubility
parameters found in a scholarly article. The first was hydrogen peroxide, the second was ethyl alcohol, and the
third was methanol. None of these chemicals cleaned or changed the surface. Therefore the surface must have
changed due some reaction between the PDMS and the sodium hydroxide. This change in the surface can be
A B
C
30
proved by the SEM image because it can be seen that the surfaces are different between the citric acid and
sodium hydroxide PDMS samples. The citric acid’s surface looks smooth, but the sodium hydroxide surface looks
slightly bumpy.
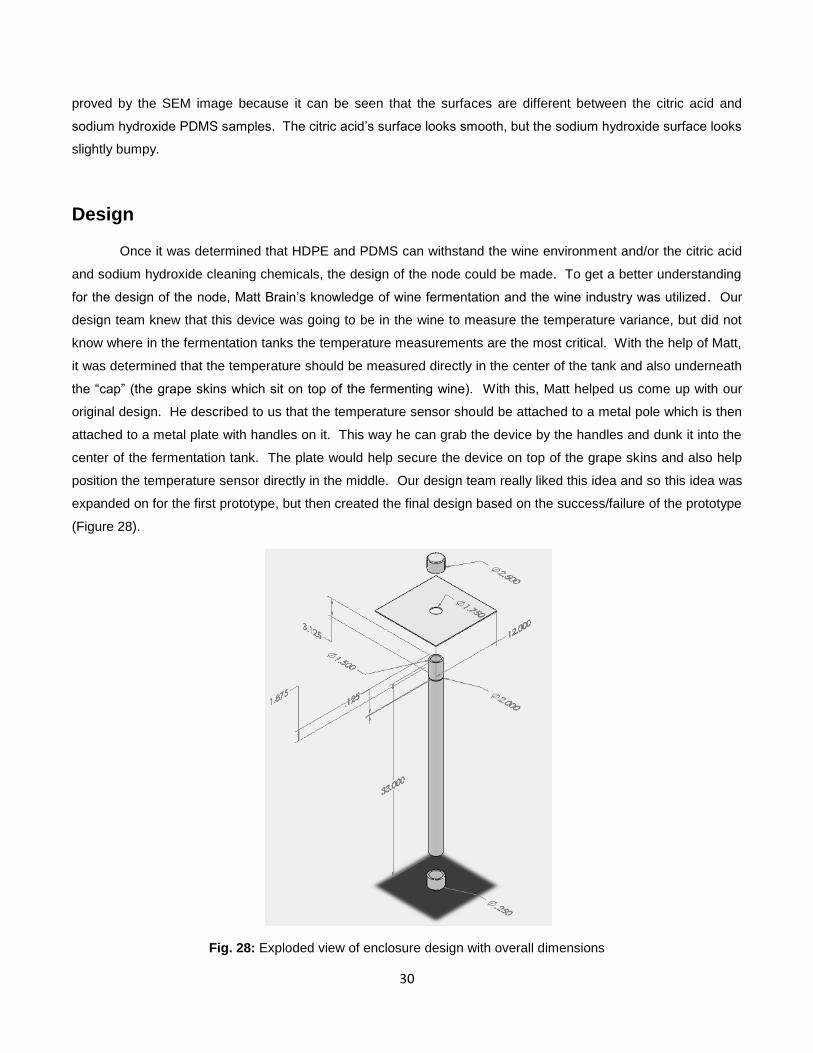
Design
Once it was determined that HDPE and PDMS can withstand the wine environment and/or the citric acid
and sodium hydroxide cleaning chemicals, the design of the node could be made. To get a better understanding
for the design of the node, Matt Brain’s knowledge of wine fermentation and the wine industry was utilized. Our
design team knew that this device was going to be in the wine to measure the temperature variance, but did not
know where in the fermentation tanks the temperature measurements are the most critical. With the help of Matt,
it was determined that the temperature should be measured directly in the center of the tank and also underneath
the “cap” (the grape skins which sit on top of the fermenting wine). With this, Matt helped us come up with our
original design. He described to us that the temperature sensor should be attached to a metal pole which is then
attached to a metal plate with handles on it. This way he can grab the device by the handles and dunk it into the
center of the fermentation tank. The plate would help secure the device on top of the grape skins and also help
position the temperature sensor directly in the middle. Our design team really liked this idea and so this idea was
expanded on for the first prototype, but then created the final design based on the success/failure of the prototype
(Figure 28).
Fig. 28: Exploded view of enclosure design with overall dimensions
31
This design still uses some of the key principles Matt Brain suggested, such as the plate, but utilizes HDPE as the
main enclosing material rather than some kind of metal. This design, which cannot be seen by the figure, has two
holes where the two temperature sensors go. One of the holes is a foot and a half down the pipe because,
according to Matt Brain, that is the maximum thickness of the cap and the other hole is in the bottom plug. With
this design, the PDMS is utilized as the adhesive to adhere the bottom plug to the bottom of the pipe and secure
the temperature sensors in place. The PDMS is also used to secure the plate in place. What cannot be seen by
Figure 28 is that the top and bottom plugs are threaded and the top and bottom of the pipe is also threaded. This
is included in the final design so the user can unscrew the top of the node to replace the batteries.
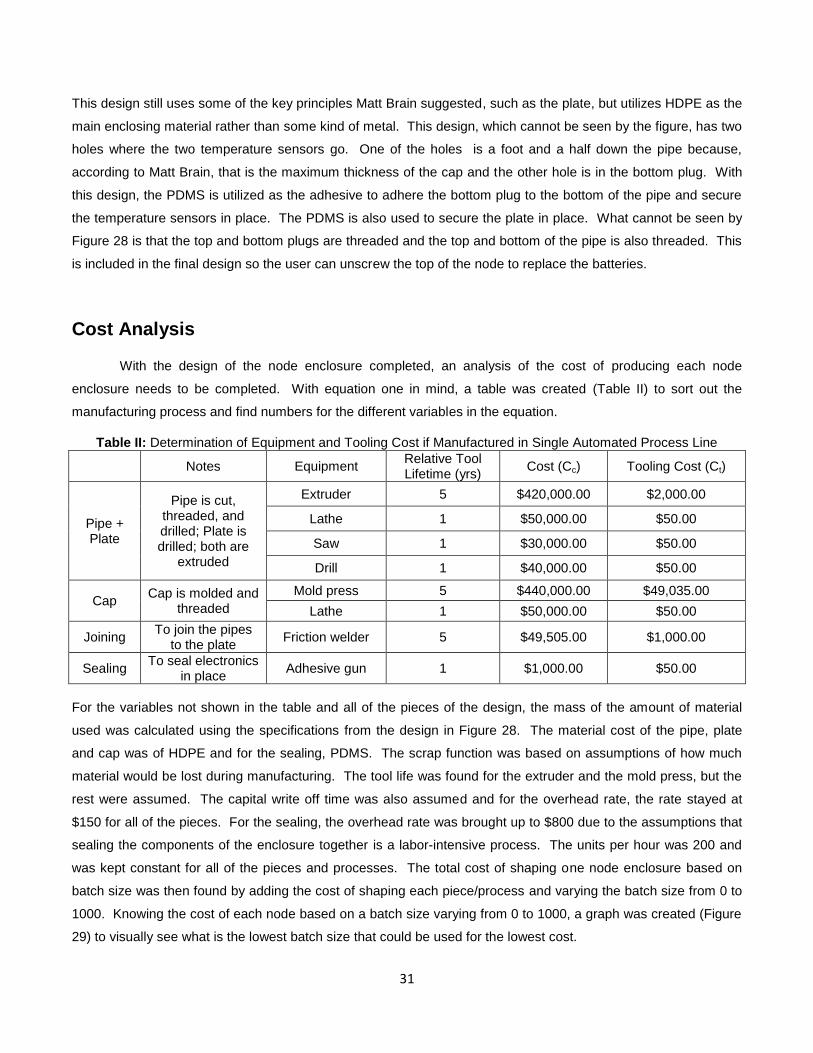
Cost Analysis
With the design of the node enclosure completed, an analysis of the cost of producing each node
enclosure needs to be completed. With equation one in mind, a table was created (Table II) to sort out the
manufacturing process and find numbers for the different variables in the equation.
Table II: Determination of Equipment and Tooling Cost if Manufactured in Single Automated Process Line
Notes Equipment
Relative Tool Lifetime (yrs)
Cost (Cc) Tooling Cost (Ct)
Pipe + Plate
Pipe is cut, threaded, and drilled; Plate is drilled; both are
extruded
Extruder 5 $420,000.00 $2,000.00
Lathe 1 $50,000.00 $50.00
Saw 1 $30,000.00 $50.00
Drill 1 $40,000.00 $50.00
Cap Cap is molded and
threaded
Mold press 5 $440,000.00 $49,035.00
Lathe 1 $50,000.00 $50.00
Joining To join the pipes
to the plate Friction welder 5 $49,505.00 $1,000.00
Sealing To seal electronics
in place Adhesive gun 1 $1,000.00 $50.00
For the variables not shown in the table and all of the pieces of the design, the mass of the amount of material
used was calculated using the specifications from the design in Figure 28. The material cost of the pipe, plate
and cap was of HDPE and for the sealing, PDMS. The scrap function was based on assumptions of how much
material would be lost during manufacturing. The tool life was found for the extruder and the mold press, but the
rest were assumed. The capital write off time was also assumed and for the overhead rate, the rate stayed at
$150 for all of the pieces. For the sealing, the overhead rate was brought up to $800 due to the assumptions that
sealing the components of the enclosure together is a labor-intensive process. The units per hour was 200 and
was kept constant for all of the pieces and processes. The total cost of shaping one node enclosure based on
batch size was then found by adding the cost of shaping each piece/process and varying the batch size from 0 to
1000. Knowing the cost of each node based on a batch size varying from 0 to 1000, a graph was created (Figure
29) to visually see what is the lowest batch size that could be used for the lowest cost.
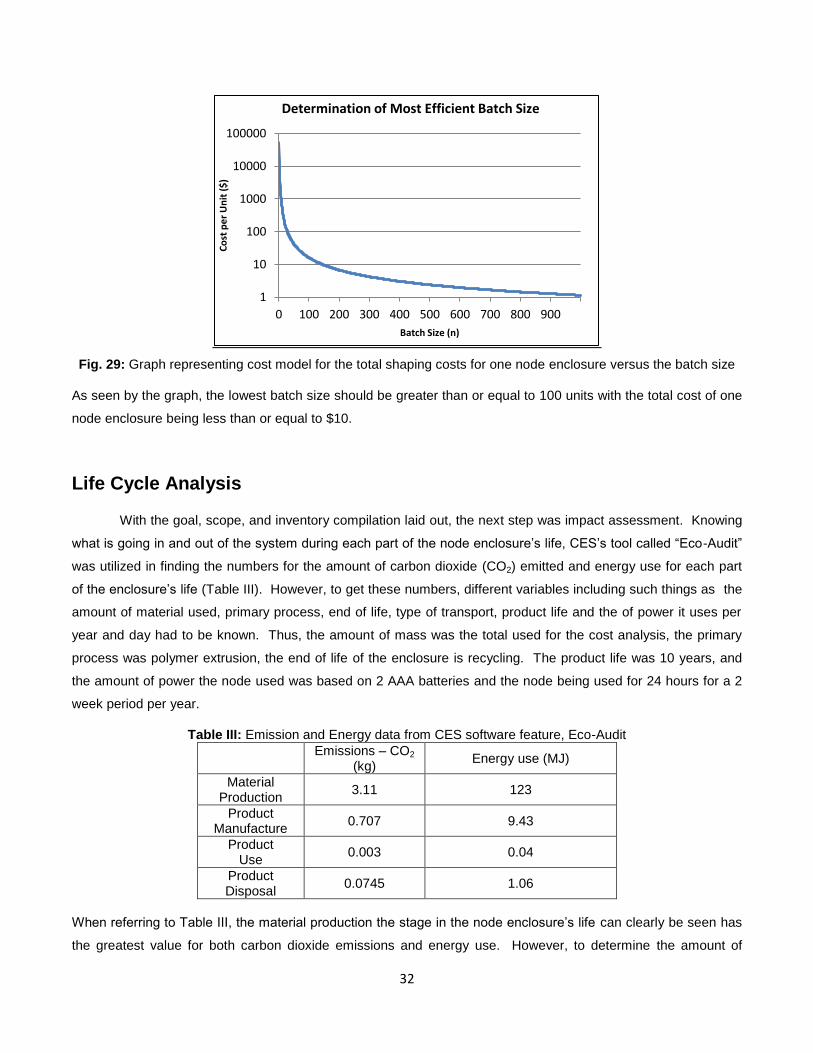
32
Fig. 29: Graph representing cost model for the total shaping costs for one node enclosure versus the batch size
As seen by the graph, the lowest batch size should be greater than or equal to 100 units with the total cost of one
node enclosure being less than or equal to $10.
Life Cycle Analysis
With the goal, scope, and inventory compilation laid out, the next step was impact assessment. Knowing
what is going in and out of the system during each part of the node enclosure’s life, CES’s tool called “Eco-Audit”
was utilized in finding the numbers for the amount of carbon dioxide (CO2) emitted and energy use for each part
of the enclosure’s life (Table III). However, to get these numbers, different variables including such things as the
amount of material used, primary process, end of life, type of transport, product life and the of power it uses per
year and day had to be known. Thus, the amount of mass was the total used for the cost analysis, the primary
process was polymer extrusion, the end of life of the enclosure is recycling. The product life was 10 years, and
the amount of power the node used was based on 2 AAA batteries and the node being used for 24 hours for a 2
week period per year.
Table III: Emission and Energy data from CES software feature, Eco-Audit
Emissions – CO2
(kg) Energy use (MJ)
Material Production
3.11 123
Product Manufacture
0.707 9.43
Product Use
0.003 0.04
Product Disposal
0.0745 1.06
When referring to Table III, the material production the stage in the node enclosure’s life can clearly be seen has
the greatest value for both carbon dioxide emissions and energy use. However, to determine the amount of
1
10
100
1000
10000
100000
0 100 200 300 400 500 600 700 800 900
Co
st p
er
Un
it (
$)
Batch Size (n)
Determination of Most Efficient Batch Size
33
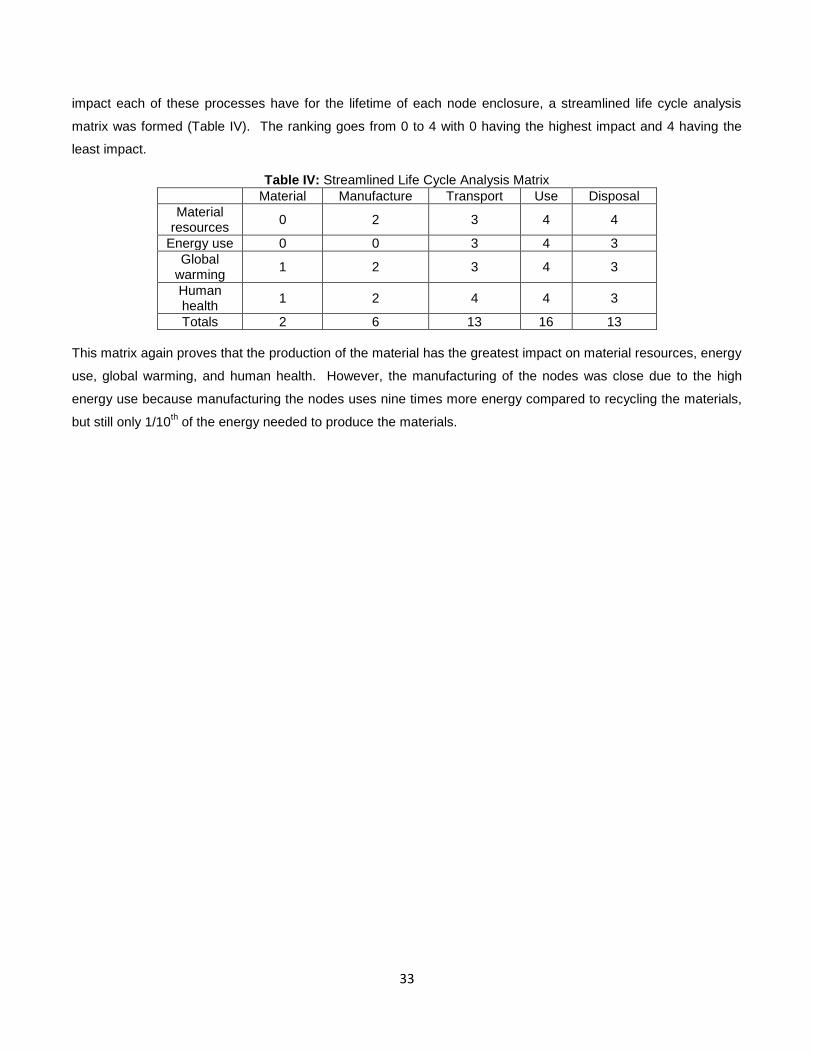
impact each of these processes have for the lifetime of each node enclosure, a streamlined life cycle analysis
matrix was formed (Table IV). The ranking goes from 0 to 4 with 0 having the highest impact and 4 having the
least impact.
Table IV: Streamlined Life Cycle Analysis Matrix
Material Manufacture Transport Use Disposal
Material resources
0 2 3 4 4
Energy use 0 0 3 4 3
Global warming
1 2 3 4 3
Human health
1 2 4 4 3
Totals 2 6 13 16 13
This matrix again proves that the production of the material has the greatest impact on material resources, energy
use, global warming, and human health. However, the manufacturing of the nodes was close due to the high
energy use because manufacturing the nodes uses nine times more energy compared to recycling the materials,
but still only 1/10th of the energy needed to produce the materials.
34
Discussion
Through the materials selection process it was found that HDPE was the best material to use for the node
enclosure based on water adsorption, weak acid resistance, cost, and stiffness. This result is what should be
expected because HDPE is the material used for the fermentation tanks themselves. Thus, having the node
enclosure being made out of the same material verifies that it will not affect the wine in a negative way and will be
able to be cleaned with the same cleaning chemicals used for cleaning the tanks after each fermentation process.
Why HDPE is such a good material to use for not only the node enclosure but also for the fermentation tanks is
because, first of all, it is cost effective. Another reason is that, compared to stainless steel tanks, on a
microscopic level, HDPE is much smoother and should therefore be more resistant to the formation of biofilms (an
aggregate of microorganisms in which cells adhere to each other on a surface, also referred to as slime). Plastic
is also porous to oxygen, a property not shared by stainless steel. During fermentation, this is not an issue
because any oxygen that can make it through the sides of the tank will be immediately scavenged by the yeast
during fermentation. HDPE tanks can even be molded in a certain way where the polymer can directly control
the amount of permeating oxygen for specific applications. The most common application for the controlled
oxygen permeation is wine storage because the plastic tanks are much cheaper, easier to stack, and are also
cleaner than wood barrels but can result in the same wine flavor by the addition of wood chips and having the
same oxygen permeation rate as a second year wine barrel.
The preliminary experiment was to help get a better idea of how HDPE, PS, and PDMS reacted with wine
during the two week fermentation period by the percent weight change. This preliminary experiment was to see if
the material gained weight due to water being adsorbed. In the results, the experiment showed that HDPE’s
weight change after 20 days was lower compared to day 0 and 1. This weight change is expected because at
day 20, the weight of the HDPE should be close to the original weight due to water being able to evaporate out of
the samples. For day 0 and 1 the weight change should be higher due to the water still being absorbed in the
material. For PS, the percent weight change did not change over time. This weight change might be due to PS
having stronger intermolecular forces compared to HDPE. Due to the stronger forces, the harder it is for the
water molecules to move though the material. For the PDMS, day 0 had a greater percent weight change
compared to day 1 and 20. This weight change is because of the inter-atomic space between the polymer chains.
This spacing is greater than the intermolecular space in both PS and HDPE because the cross-linking forces the
chains apart whereas the secondary bonding in PS and HDPE draws them closer. This larger space will
accommodate more water molecules allowing for water absorption. However, all of these changes in water
adsorption were around the required limit set in the materials selection process.
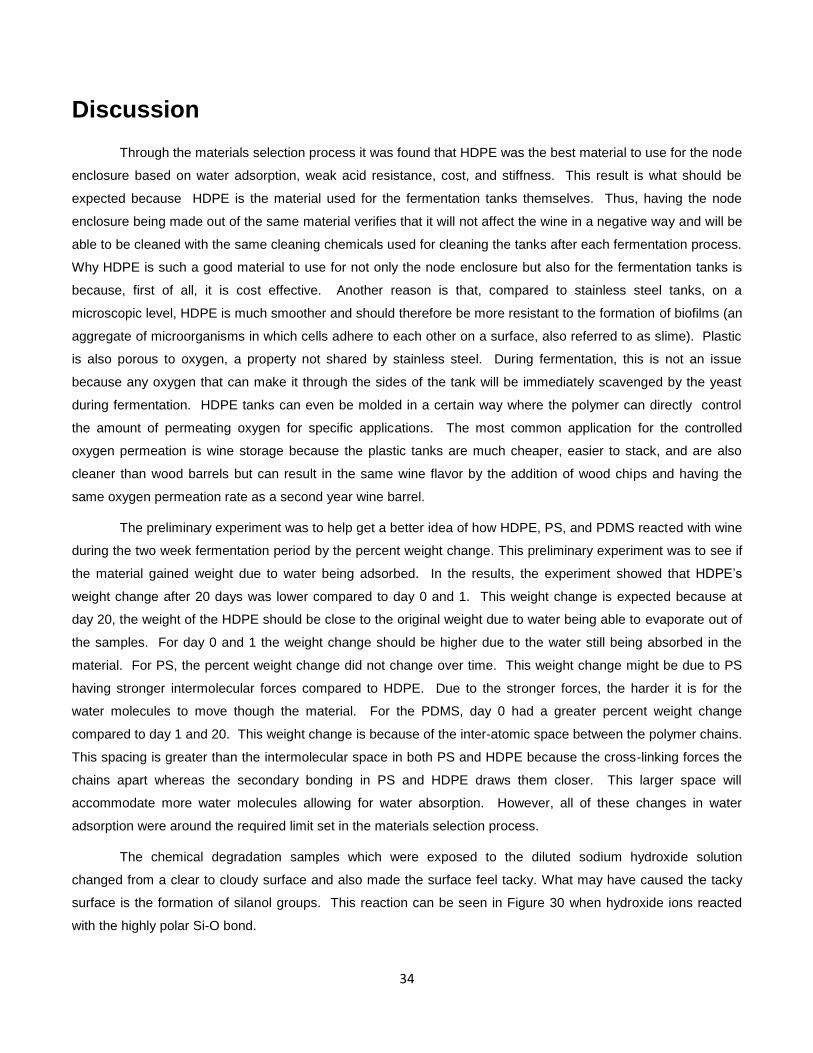
The chemical degradation samples which were exposed to the diluted sodium hydroxide solution
changed from a clear to cloudy surface and also made the surface feel tacky. What may have caused the tacky
surface is the formation of silanol groups. This reaction can be seen in Figure 30 when hydroxide ions reacted
with the highly polar Si-O bond.
35
Fig. 30: Depolymerization by hydroxide ions and silanol formation (silanol group is circled)
What may have caused the cloudy surface is the release of residual stresses at the surface. This release in
stresses could cause the surface to warp creating a bumpy as seen in Figure 27. This bumpy surface would
scatter the light causing a reduced light transmission leading to a less transparent appearance.
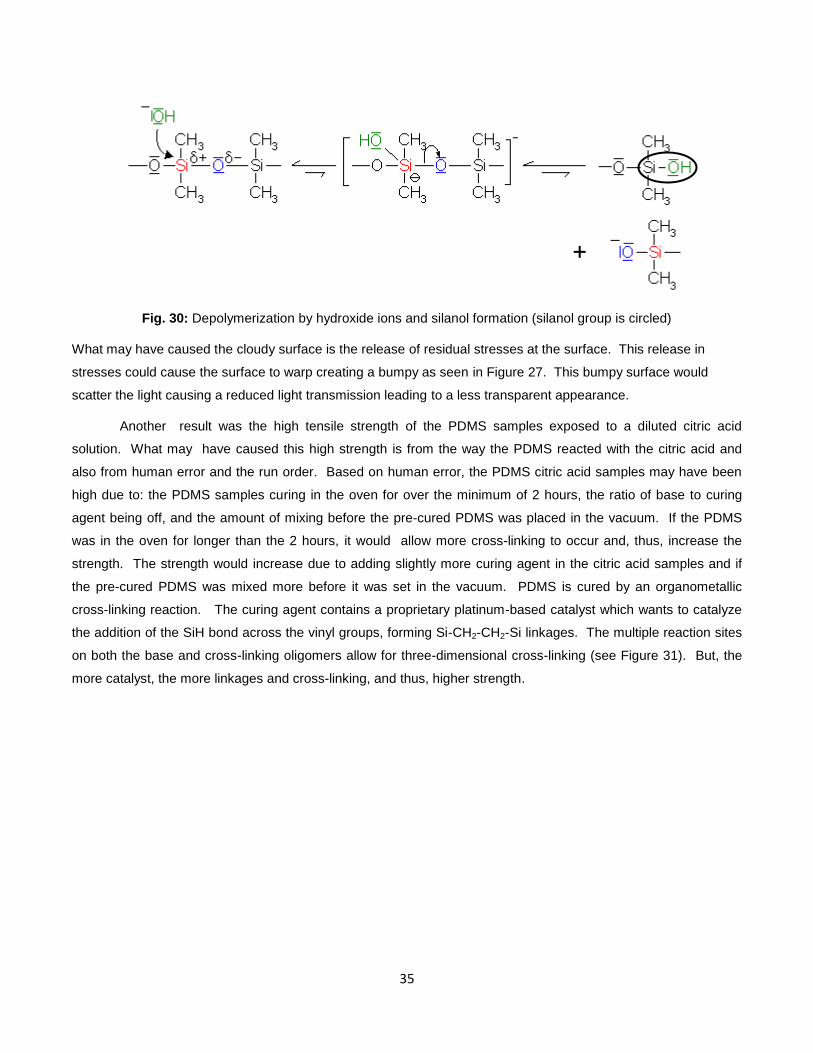
Another result was the high tensile strength of the PDMS samples exposed to a diluted citric acid
solution. What may have caused this high strength is from the way the PDMS reacted with the citric acid and
also from human error and the run order. Based on human error, the PDMS citric acid samples may have been
high due to: the PDMS samples curing in the oven for over the minimum of 2 hours, the ratio of base to curing
agent being off, and the amount of mixing before the pre-cured PDMS was placed in the vacuum. If the PDMS
was in the oven for longer than the 2 hours, it would allow more cross-linking to occur and, thus, increase the
strength. The strength would increase due to adding slightly more curing agent in the citric acid samples and if
the pre-cured PDMS was mixed more before it was set in the vacuum. PDMS is cured by an organometallic
cross-linking reaction. The curing agent contains a proprietary platinum-based catalyst which wants to catalyze
the addition of the SiH bond across the vinyl groups, forming Si-CH2-CH2-Si linkages. The multiple reaction sites
on both the base and cross-linking oligomers allow for three-dimensional cross-linking (see Figure 31). But, the
more catalyst, the more linkages and cross-linking, and thus, higher strength.
36
Fig. 31: Chemical reaction in the creation of the three-dimensional cross-linked PDMS
What could have also caused the change in strength for the citric PDMS samples is the run order. As
shown in the results section (Figure 24) from run 5 to 10 on the change in strength compared to the mean
became much more drastic. This means halfway through the runs of the NaOH samples and then onto the citric
acid samples, the strength changed due to either the machine warming up, the climate in the room changing, or
the samples were placed in the grips better than before. If the order was randomized, it would have distributed
the errors more evenly among all of the runs. This was not done for this test to being time-limited and the
requirement of needing the PDMS samples from both solutions to be tested immediately after the samples are
taken out of each solution. Thus, the NaOH was tested first due to taking the samples out right after the one
week mark and then the citric samples were taken out a couple hours later and then tested. This time gap could
have caused the large error, but also there was the problem of the samples not staying fixed in the grips of the
tensile tester. Once the citric acid PDMS samples were tested, the grip problem was resolved by having to grip
the samples down as hard as possible. This strong grip could have caused the strength to increase dramatically
because, before, there may have been slipping occurring and so the PDMS sample failed prematurely.
The increase in tensile strength could have also been due to a reaction between the citric acid or NaOH
and the PDMS. In this case, the formation of silanols at the surface of the PDMS samples reduced the residual
tensile stresses (as the siloxane linkages are broken) from the formation of the PDMS cross-linking, which would
then cause the PDMS to elongate more. Since the PDMS samples have a finite tensile strength, reducing the
residual tensile stresses would allow the samples to accommodate more tensile stress (in addition to the residual
stresses) than before prior to failure. This is because the sum of all tensile stresses both within and applied to the
37
samples cannot exceed the ultimate tensile strength of the samples. As a result, more tensile stress could be
applied externally to the samples. Therefore, the samples that undergo silanol formation (the citric acid and NaOH
samples) will exhibit a higher observed tensile strength as well as a higher elongation to failure. The higher tensile
strength and elongation is evidenced by a linear correlation between the strength and elongation of the samples
(Figure 25). Also, due to the formation of silanols, no observable changes were seen in the SEM micrographs;
these changes are atomic in scale, and are thus far too small to observe at the 100 μm scale (Figure 27).
The reason for doing a cost analysis was to see if the production of the node enclosure could get cheap
enough to possibly start a business. The overall goal was to create a low-cost temperature measurement system,
but the cost was further specified in the design constraints of being less than $100. The electronics themselves
were fixed at around $25 a piece so that material production cost had to be less than $75. However, before a
business can even start, the cost of the equipment and the profit need to be known. The cost analysis process
assists with finding the cost of equipment and determining the appropriate profit and, from the results, the cost of
the equipment would be around $1M, the cost of tooling would be $250 a year and around $50,000 every 5 years.
Thus, the initial cost (for the equipment) would be around $1.13M. To make the most profit, the business would
have to have a large batch size. In order to be conservative, if the bath size was around 100, the total cost of
shaping and attaching all of the pieces of the node enclosure together would be around $10. Thus, with the
electronics, each node would cost $35. In order to make a profit, the business could easily double the price to
$70 because it is still under that $100 limit proposed in the design constraints. Thus, a man who had a couple
million bucks to spend could easily start this business and make a great profit. The only thing to worry about is
the market, but that is out of my range of knowledge. However, this could project could be continued by a
business student next year to help create a well-defined go-to-market plan.
Society today is all about saving the environment and preventing global warming, and thus a life cycle
analysis would be beneficial to see the potential of this product. As seen in the results, the only process which
may be an issue is the process of making the HDPE itself. This process uses more energy and emits more CO2
because HDPE itself is made from crude oil. To make HDPE, intense heat is applied to petroleum to produce
ethylene gas. Then under controlled conditions, these gas molecules link together to form long chains to produce
polyethylene. Getting the petroleum up to the right temperature takes a lot of energy and if petroleum is burned, it
releases CO2. To possibly fix this problem, the manufacturing process could use only recycled HDPE because
the energy to recycle HDPE is 100 times less than the energy to make HDPE and emits 1/40th the amount of CO2.
38
Conclusions
Currently, the Cal Poly pilot winery cannot justify the high cost of commercial temperature sensors and
needs an affordable, flexible solution . Our multi-disciplinary team of two computer engineers and a materials
engineers’ intended goal was to create a low-cost wireless monitoring system for wine fermentation for the Cal
Poly pilot winery. My specific goal and contribution towards the project was to design, fabricate, and test the
enclosure for the wireless probes that are placed in the wine fermentation tanks, and the materials used for the
enclosure. To achieve this goal, I first went through the process of materials selection to pick the best materials
with the node enclosure’s function, objectives, and constraints in mind. The second was a preliminary test with
the top materials chosen from materials selection and the adhesive to be used for the design,
polydimethylsiloxane (PDMS), an inorganic elastomer. These materials were tested to make sure they don’t
absorb water or degrade over the two week wine fermentation period. Third, once the results were known from
the preliminary test, a chemical degradation test of PMDS was completed to make sure the visual, physical, and
mechanical properties didn’t change when the PDMS adhesive is submerged in the cleaning chemicals (citric acid
and NaOH) used at the winery. Fourth, a design was created now knowing the results of the PDMS degradation.
Fifth, a cost analysis was performed to estimate the cost of materials if a manufacturing line was created to sell
this product, and to determine if it is a worthy investment for the manufacturer and the pilot winery. Lastly, a life
cycle analysis was completed to make sure the materials processing for the node enclosure, the wireless
temperature sensor use, and disposal of the sensor minimally impact the environment. The following
conclusions were made:
(1) HDPE was chosen as the best material for the node enclosure.
(2) PDMS had the greatest difference in water adsorption between day 0 to day 1 and 20. HDPE had the
greatest difference in water adsorption between day 20 to day 0 and 1. PS did not change. All of
these changes in water adsorption were around the required limit set in the materials selection
process.
(3) The PDMS sample’s surface changed when exposed to a sodium hydroxide solution and the PDMS
samples which were exposed to a diluted citric acid solution had the greatest strength possibly due to
relaxation of residual stresses by the formation of silanols, but also possibly due to run order and
human error. However, all of these changes would not affect the reliability of the node enclosure.
(4) The design of the node enclosure was completed, but not built.
(5) The cost of making the node enclosure is reasonable enough to be a worthy investment due to only
costing $10 if the batch size is around 100 and the initial cost of the equipment and tooling being only
$1.13M.
(6) The process which has the greatest amount of emission and energy use is the process of making the
HDPE, but could be fixed if the manufacturer of the node enclosure only uses recycled HDPE.
Overall, the goal of picking and testing the materials to use for the node enclosure and the design of the
enclosure was achieved, but production of a prototype to test at the pilot winery was not achieved.
39
References
1. Ashby, M. F., Hugh Shercliff, and David Cebon. Materials: Engineering, Science, Processing and Design.
Oxford: Butterworth-Heinemann, 2007. Print.
2. Ashby, M. F. Materials and the Environment: Eco-informed Material Choice. Amsterdam: Butterworth-
Heinemann/Elsevier, 2009. Print.
3. Phillips, Curtis. "Product Review: Wine Tank Types." Wine Business .com. Wine Communications Group,
Mar. 2011. Web. <http://www.winebusiness.com/wbm/?go=getArticle&dataId=86288>.
4. Usansa, Ulaiwan. Effect of Alcoholic Fermentation Temperatures on Red Wine Flavor. Suranaree
University of Technology, 2003. Web. May 2012.
<http://sutir.sut.ac.th:8080/sutir/bitstream/123456789/1324/2/ulaiwan_fulltext.pdf>
5. Cutler, Lance. "The New Barrel? Wineries Try Oxygen-permeable Polyethylene Vessels."CBS Interactive.
CBS Interactive Business Network, 01 Apr. 2007. Web. 02 June 2012.
<http://findarticles.com/p/articles/mi_m3488/is_4_88/ai_n27206565/>.
6. Del Alamo, M. "Wine Aging in Controlled Permeability HDPE Tanks." Food Innova. University of
Valladolid, Oct. 2010. Web. 2 June 2012. <http://www.foodinnova.com/foodInnova/docu2/322.pdf>.
7. Campbell, Dean. "Uses of Polydimethylsiloxane (PDMS) Elastomer." UW-Madison MRSEC. University of
Wisconsin, 1999. Web. 02 June 2012. <http://mrsec.wisc.edu/Edetc/background/PDMS/index.html>.
8. Liza, Sheila. "Degradation Mechanisms of Siloxane-Based Thermal Interface Materials Under Reliability
Stress Conditions." Intel Technology. Web.
9. Retter, U. "Effect of Chemical Structure on Hydrolysis of Siloxane Alkyl Ammonium Bromides." Journal of
Colloid and Interface Science 202.2 (1998): 269-77. Print.
10. Patel, M. "Thermal Ageing Studies on Room-temperature Vulcanised Polysiloxane Rubbers."Polymer
Degradation and Stability (2001): 399-402. Print.
11. Cypryk, Marek, and Yitzhak Apeloig. "Mechanism of the Acid-Catalyzed Si−O Bond Cleavage in
Siloxanes and Siloxanols. A Theoretical Study." Organometallics 21.11 (2002): 2165-175. Print.
12. Wikipedia contributors. "Polydimethylsiloxane." Wikipedia, The Free Encyclopedia. Wikipedia, The Free
Encyclopedia, 12 May. 2012. Web. 4 Jun. 2012.
13. Wikipedia contributors. "High-density polyethylene." Wikipedia, The Free Encyclopedia. Wikipedia, The
Free Encyclopedia, 4 Jun. 2012. Web. 4 Jun. 2012.
14. Wikipedia contributors. "Polystyrene." Wikipedia, The Free Encyclopedia. Wikipedia, The Free
Encyclopedia, 3 Jun. 2012. Web. 4 Jun. 2012.
15. Wikipedia contributors. "Styrene." Wikipedia, The Free Encyclopedia. Wikipedia, The Free Encyclopedia,
26 May. 2012. Web. 4 Jun. 2012.
16. "TankNET® PL-1 Wireless Thermostat." TankNET® Web-Based Temperature Control and Fermentation
Management: PL-1 Wireless Thermostat. TankNET. Web. Feb. 2012.
<http://www.acrolon.com/products/pl1.aspx>.
40
17. "Wireless Sensor System Web-Based Monitoring." Wireless Sensor System. Omega Engineering, 2012.
Web. <http://www.omega.com/pptst/Zseries.html>.
18. "Number of U.S. Wineries Tops 5,300." Wine Business .com. Wine Communications Group, Feb. 2006.
Web. <http://www.winebusiness.com/wbm/?go=getArticle&dataId=42349>.
19. "Product Information: Sylgard 184 Silicone Elastomer." Lindberg-Lund. Dow Corning Corp., 1999. Web.
May 2012. <http://www.lindberg-lund.com/files/Tekniske%20datablad/DC-184-TD.pdf>.
20. "Digital Temperature Controller." - Fermentation Temperature Control. Northern Brewer, 2012. Web.
March 2012. <http://www.northernbrewer.com/shop/brewing/beer-brewing-equipment/fermenting-
equipment/fermentation-temperature-control/johnson-controls-a419-digital-temp-controller.html>.
21. "Chemical Resistance of Silicone Rubber Compared with That of Other Elastomers."Chemical Resistance
of Silicone Rubber Compared with That of Other Elastomers. University of Wuppertal. Web. May 2012.
<http://www.chemiedidaktik.uni-wuppertal.de/disido_cy/en/exp/prop07.htm>.
22. "Faqs and Benefits." Modern Wine Maturation and Storage. Flextank USA. Flextank USA, 2011. Web. 03
June 2012. <http://www.flextankusa.com/faqs.php>.
23. "How Do You Make HDPE?" Bottle2bottle. Bottle2bottle. Web. 03 June 2012.
<http://www.bottle2bottle.com/making-hdpe.asp>.
24. "Macro Bin - Half Ton | MoreWine." Macro Bin - Half Ton | MoreWine. More Flavor!, 2012. Web. 03 June
2012. <http://morewinemaking.com/view_product/19683/103207/Macro_Bin_-_Half_Ton>