Embed Size (px)
Citation preview
Review
Wireless-electrodeless quartz-crystal-microbalance biosensorsfor studying interactions among biomolecules: A review
By Hirotsugu OGI*1,†
(Communicated by Shun-ichi IWASAKI, M.J.A.)
Abstract: The mass sensitivity of quartz-crystal microbalance (QCM) was drasticallyimproved by removing electrodes and wires attached on the quartz surfaces. Instead of wireconnections, intended vibrations of quartz oscillators were excited and detected by antennasthrough electromagnetic waves. This noncontacting measurement is the key for ultrahigh-sensitivedetection of proteins in liquids as well as quantitative measurements. This review shows theprinciple of wireless QCMs, their applications to studying interactions among biomolecules andaggregation reactions of amyloid O peptides, and the next-generation MEMS QCM, the resonanceacoustic microbalance with naked embedded quartz (RAMNE-Q).
Keywords: biosensor, quartz crystal microbalance, affinity, MEMS
Introduction
It has been well recognized that quantitativeevaluation of interactions among biomolecules andbetween cell and proteins will achieve significantprogress in the protein design and drug discovery.For this purpose, various tag proteins have beendeveloped. However, conventional affinity tag sys-tems include large protein tags such as green-fluorescent proteins (9>27 kDa), FLAGs with spe-cific antibodies (9>150 kDa), and quantum dots(>920Å),1),2) and they affect the affinity to bio-molecules. Also, modifications of proteins for attach-ing tags could vary their biological properties.Furthermore, individual affinity tags require specificbuffer conditions, which will affect functions ofexamined proteins.3) Therefore, development of low-weight tags, which do not affect the functions ofproteins, has been intensively studied.4),5)
The label-free methods are, therefore, importantfor studying interactions between native biomole-cules. There are two representative methods. First isthe surface plasmon resonance (SPR) biosensor.6)–8)
In a conventional SPR measurement, receptorproteins are immobilized on a metallic thin filmdeposited on a glass plate, which is irradiated fromthe back surface through a prism by a light, and ananalyte is injected. The coupling condition betweenthe evanescent field generated by the incident lightand the surface plasmon wave at the metallic film isgoverned by the macroscopic electric properties inthe evanescent field, and the incident angle of thelight for exciting SPR changes during the bindingreaction between the receptor and target proteins.The incident angle varies as the binding reactionprogresses, allowing evaluation of kinetics of thebiomolecule reaction. The SPR method inherentlypossesses a disadvantage that it is insensitive toreactions, which proceed outside the evanescent field.Therefore, it is difficult to monitor a multistep inter-actions or interactions between cells and proteins.
The second method is the quartz-crystal-micro-balance (QCM) biosensor.9)–12) Receptor proteins areimmobilized on the quartz oscillator surface, andanalyte solutions are injected. When target proteinsare captured by the receptor proteins, the effectivemass of the oscillator increases, resulting in thedecrease in the resonance frequency of the oscillator.Then, an injection of washing solution will causedissociation of the target proteins from receptors,and the resonance frequency will recover. Thus, areal-time monitoring of association and dissociation
*1 Graduate School of Engineering, Osaka University,Osaka, Japan.
† Correspondence should be addressed: H. Ogi, GraduateSchool of Engineering, Osaka University, 1-3 Machikaneyama,Toyonaka, Osaka 560-8531, Japan (e-mail: [email protected]).
Proc. Jpn. Acad., Ser. B 89 (2013)No. 9] 401
doi: 10.2183/pjab.89.401©2013 The Japan Academy
reactions between biomolecules is possible, providingtheir binding affinity. Because the fractional fre-quency change ("f/f ) principally equals the ratio ofthe adsorbed mass to the oscillator mass,13),14) theQCM biosensor allows quantitative measurement forthe binding affinity. Unlike the SPR biosensors,QCM biosensors can detect any mass addition onthe quartz surface, and they are applicable tostudying interactions between larger biomaterials,such as cells, immobilized on the surface andsurrounding proteins.
The sensitivity of the QCM biosensor to theadded mass improves as the oscillator mass decreases.Remaining a sufficient active area for biochemicalreactions, the reduction of the oscillator mass isachieved by the reduction of its thickness, leading tothe increase in the fundamental resonance frequency(f1). Because the amount of the frequency change|"f | caused by adsorption of proteins is proportionalto the square of the fundamental resonance fre-quency,11),13) thinning the oscillator significantlyincreases the sensitivity. Besides, a high-frequencyQCM measurement is needed for quantitative analy-sis. The viscosity effect varies the resonance fre-quency15)–17) as well as the mass loading effect,making the quantitative evaluation of the adsorbedprotein mass complicated. Low-frequency QCMmeasurements are easily affected by the viscosityeffect, and the simultaneous measurement of reso-nance frequency and dissipation has been performedfor compensating for the frequency change due tothe viscosity effect.18)–21) Because the viscosity effectbecomes insignificant compared with the massloading effect at high frequencies,11),15),22) a higherfrequency QCM measurement is desired.
Previous studies usually used QCMs withfundamental resonance frequencies lower than10MHz.9),10),18)–21),23)–25) However, higher-frequencyQCM systems are recently developed. Natesanet al.26) used 16.5MHz QCM for detecting staph-ylococcal enterotoxin B and achieved the detectionlimit of 25 ng/mL. Furusawa et al.27),28) developed a27MHz QCM system to increase the sensitivity,although their method cannot adopt a flow-injection-analysis system. Uttenthaler et al.29) developed highfrequency QCMs with resonant frequencies from 39to 110MHz in the liquid. Those previous studiesneeded electrodes on both surfaces of the quartzcrystals for applying the effective electric field.However, gold electrodes deteriorate the mass sensi-tivity of QCM because of gold’s mass density muchlarger than that of quartz, and this influence becomes
marked as the fundamental resonance frequencyincreases. Furthermore, the active sensing region isrestricted near the center region where the electrodesare attached, and a large part of surface area remainsinactive, deteriorating the sensitivity. Thus, the elec-trodeless QCM biosensors are obviously preferable.
Wireless-electrodeless QCM (WE-QCM) sys-tems were recently developed, where a naked AT-cut quartz plate was driven by the line antenna or theflat antenna contactlessly,11) and achieved highfrequency QCMs with fundamental resonance fre-quencies up to 180MHz.30) This review article showsthe mechanism of the WE-QCM, its usefulness forbioassays, and its extension to microelectromechan-ical-system (MEMS) based chip fabrication.
Principle of WE-QCM
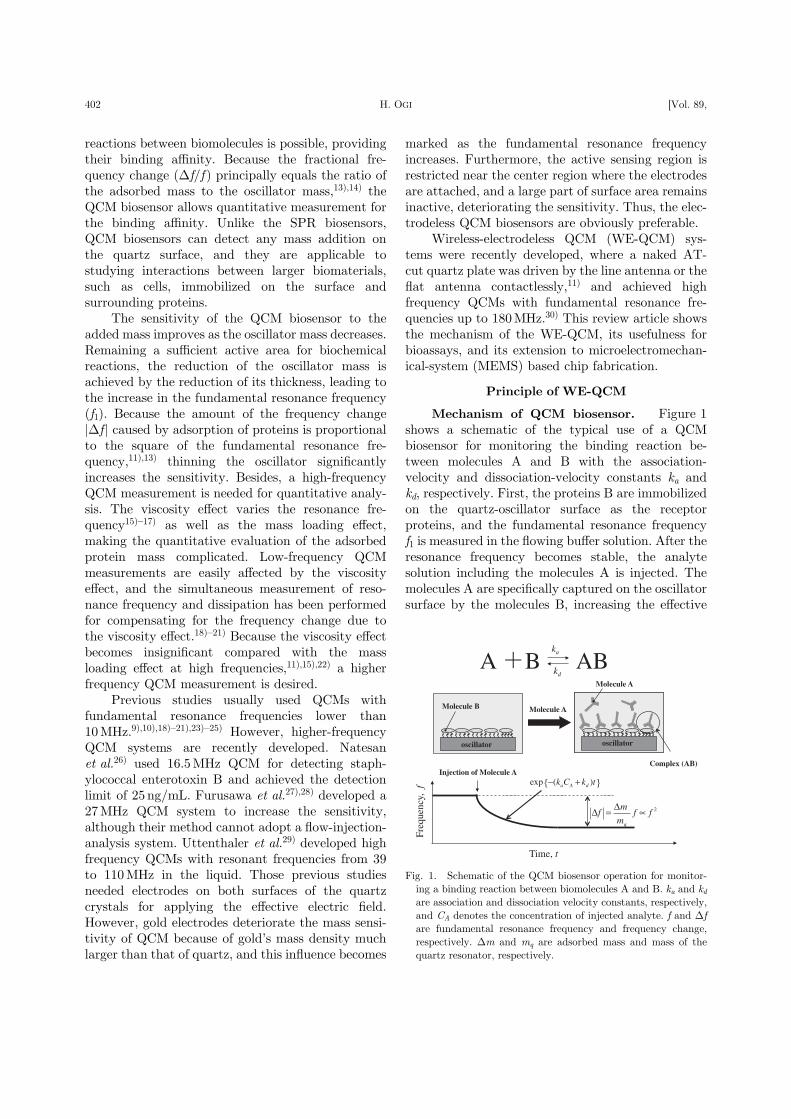
Mechanism of QCM biosensor. Figure 1shows a schematic of the typical use of a QCMbiosensor for monitoring the binding reaction be-tween molecules A and B with the association-velocity and dissociation-velocity constants ka andkd, respectively. First, the proteins B are immobilizedon the quartz-oscillator surface as the receptorproteins, and the fundamental resonance frequencyf1 is measured in the flowing buffer solution. After theresonance frequency becomes stable, the analytesolution including the molecules A is injected. Themolecules A are specifically captured on the oscillatorsurface by the molecules B, increasing the effective
oscillator
Molecule B
Freq
uenc
y, f
Time, t
Molecule A
Molecule A
Injection of Molecule A
oscillator
Complex (AB)
A B AB ka
kd
Δf = Δm
mq
f ∝ f 2
exp −(kaCA + kd )t{ }
Fig. 1. Schematic of the QCM biosensor operation for monitor-ing a binding reaction between biomolecules A and B. ka and kdare association and dissociation velocity constants, respectively,and CA denotes the concentration of injected analyte. f and "fare fundamental resonance frequency and frequency change,respectively. "m and mq are adsorbed mass and mass of thequartz resonator, respectively.
H. OGI [Vol. 89,402
mass of the oscillator and decreasing the resonancefrequency. The frequency decreases exponentiallywhen the binding reaction proceeds with a pseudo-first-order manner,10),14) and the exponential coef-ficient , is related to the reaction velocity constantsand the concentration of molecule A CA as
� ¼ kaCA þ kd ½1�Measurements of the exponential coefficients withvarious analyte concentrations, therefore, allow us todetermine the thermodynamic constants, and thenthe binding affinity (equilibrium constant) KA F
ka/kd, as well as the concentration of the targetprotein. Thus, the QCM biosensors enable the label-free assay.
Advantages of WE-QCM. The frequencychange "f1 of the fundamental mode of the quartzoscillator is principally related with the protein mass"m adsorbed on the quartz surface by the Sauerbreyequation:
�f1j j ¼ �m
mqf1 ¼ �svq
2�q� 1
d2q½2�
Hence, mq, ;q, vq, and dq denote the mass, the massdensity, the sound velocity (usually of the shearwave), and the thickness of the quartz resonator,respectively. ;s denotes the area mass density, whichis the mass of the adsorbed protein on the unitsurface area. Equation [2] obviously shows that themass sensitivity (|"f1/;s|) of a QCM is inverselyproportional to the square of the resonator thickness.(Note that the sensitivity is expressed by |"f1/;s| inthis paper and this does not equal to the signal-to-noise (S/N) ratio; the S/N ratio highly depends onmeasurement conditions and should be discussed inindividual measurements.) Therefore, thinning theoscillator significantly improves the sensitivity ofQCM. However, this has never been straightforwardbecause of the electrodes. Metallic electrodes wereindispensable for excitation and detection of vibra-tions of piezoelectric oscillators. The demand fordecreasing the electric resistance has made theelectrodes as thick as 100 nm or more. Attachmentof such heavy electrodes, however, increases inertiaresistance and also mechanical loss due to highdamping of metals, deteriorating the sensitivity.Especially, biosensing applications often use noble-metal electrodes because they show high affinity tothe thiol-mediated self-assembled monolayers, onwhich receptor proteins can be immobilized. Massdensities of noble metals (Au: 19,300 kg/m3, Pt:21,400 kg/m3) are much higher than that of quartz
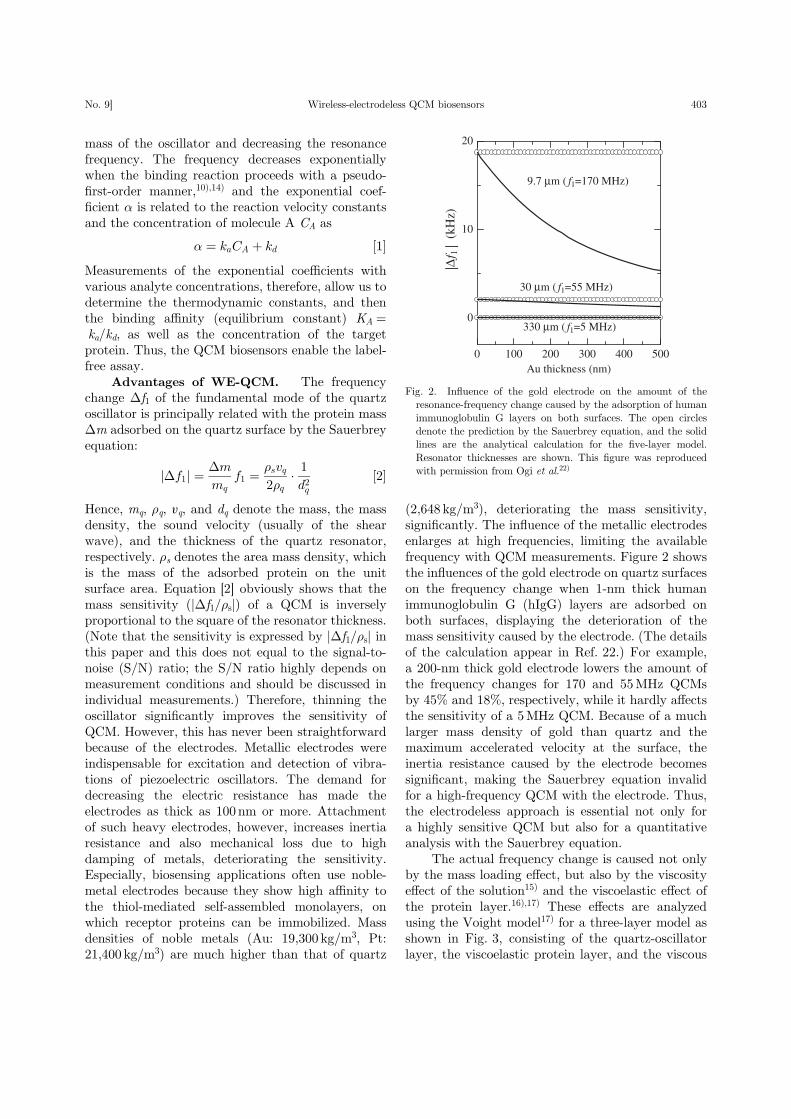
(2,648 kg/m3), deteriorating the mass sensitivity,significantly. The influence of the metallic electrodesenlarges at high frequencies, limiting the availablefrequency with QCM measurements. Figure 2 showsthe influences of the gold electrode on quartz surfaceson the frequency change when 1-nm thick humanimmunoglobulin G (hIgG) layers are adsorbed onboth surfaces, displaying the deterioration of themass sensitivity caused by the electrode. (The detailsof the calculation appear in Ref. 22.) For example,a 200-nm thick gold electrode lowers the amount ofthe frequency changes for 170 and 55MHz QCMsby 45% and 18%, respectively, while it hardly affectsthe sensitivity of a 5MHz QCM. Because of a muchlarger mass density of gold than quartz and themaximum accelerated velocity at the surface, theinertia resistance caused by the electrode becomessignificant, making the Sauerbrey equation invalidfor a high-frequency QCM with the electrode. Thus,the electrodeless approach is essential not only fora highly sensitive QCM but also for a quantitativeanalysis with the Sauerbrey equation.
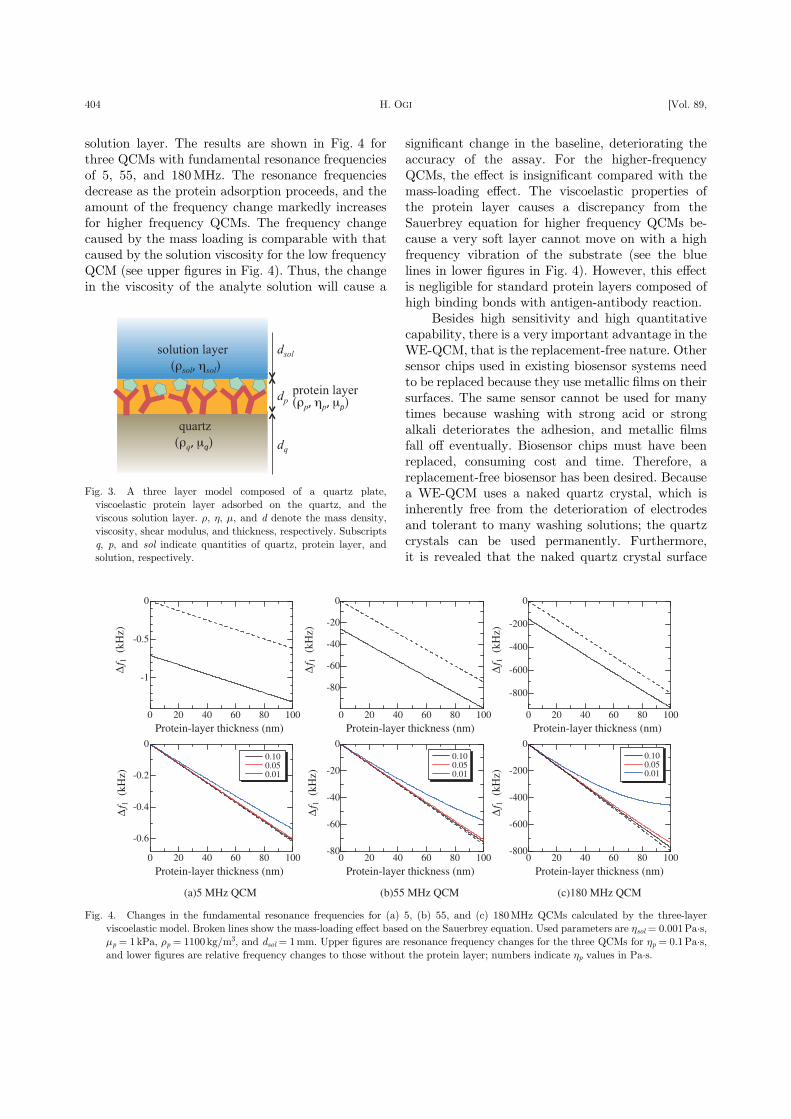
The actual frequency change is caused not onlyby the mass loading effect, but also by the viscosityeffect of the solution15) and the viscoelastic effect ofthe protein layer.16),17) These effects are analyzedusing the Voight model17) for a three-layer model asshown in Fig. 3, consisting of the quartz-oscillatorlayer, the viscoelastic protein layer, and the viscous
0 100 200 300 400 500
0
10
20
9.7 μm ( f1=170 MHz)
Au thickness (nm)
|Δf 1
| (
kHz)
30 μm ( f1=55 MHz)
330 μm ( f1=5 MHz)
Fig. 2. Influence of the gold electrode on the amount of theresonance-frequency change caused by the adsorption of humanimmunoglobulin G layers on both surfaces. The open circlesdenote the prediction by the Sauerbrey equation, and the solidlines are the analytical calculation for the five-layer model.Resonator thicknesses are shown. This figure was reproducedwith permission from Ogi et al.22)
Wireless-electrodeless QCM biosensorsNo. 9] 403
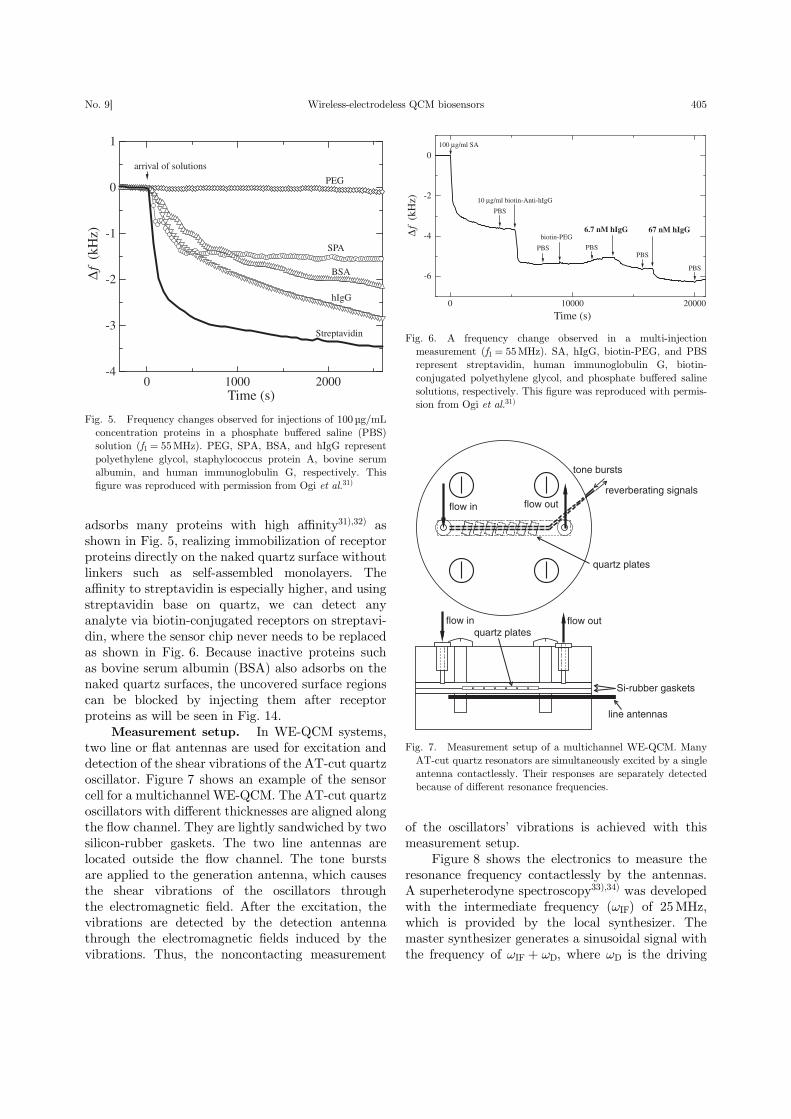
solution layer. The results are shown in Fig. 4 forthree QCMs with fundamental resonance frequenciesof 5, 55, and 180MHz. The resonance frequenciesdecrease as the protein adsorption proceeds, and theamount of the frequency change markedly increasesfor higher frequency QCMs. The frequency changecaused by the mass loading is comparable with thatcaused by the solution viscosity for the low frequencyQCM (see upper figures in Fig. 4). Thus, the changein the viscosity of the analyte solution will cause a
significant change in the baseline, deteriorating theaccuracy of the assay. For the higher-frequencyQCMs, the effect is insignificant compared with themass-loading effect. The viscoelastic properties ofthe protein layer causes a discrepancy from theSauerbrey equation for higher frequency QCMs be-cause a very soft layer cannot move on with a highfrequency vibration of the substrate (see the bluelines in lower figures in Fig. 4). However, this effectis negligible for standard protein layers composed ofhigh binding bonds with antigen-antibody reaction.
Besides high sensitivity and high quantitativecapability, there is a very important advantage in theWE-QCM, that is the replacement-free nature. Othersensor chips used in existing biosensor systems needto be replaced because they use metallic films on theirsurfaces. The same sensor cannot be used for manytimes because washing with strong acid or strongalkali deteriorates the adhesion, and metallic filmsfall off eventually. Biosensor chips must have beenreplaced, consuming cost and time. Therefore, areplacement-free biosensor has been desired. Becausea WE-QCM uses a naked quartz crystal, which isinherently free from the deterioration of electrodesand tolerant to many washing solutions; the quartzcrystals can be used permanently. Furthermore,it is revealed that the naked quartz crystal surface
Fig. 3. A three layer model composed of a quartz plate,viscoelastic protein layer adsorbed on the quartz, and theviscous solution layer. ;, 2, 7, and d denote the mass density,viscosity, shear modulus, and thickness, respectively. Subscriptsq, p, and sol indicate quantities of quartz, protein layer, andsolution, respectively.
0 20 40 60 80 100
-800
-600
-400
-200
0
Protein-layer thickness (nm)
Δf 1
(kH
z)
0 20 40 60 80 100
-0.6
-0.4
-0.2
0
Protein-layer thickness (nm)
Δf 1
(kH
z)
0.10 0.05 0.01
(a)5 MHz QCM (b)55 MHz QCM
0 20 40 60 80 100
-1
-0.5
0
Protein-layer thickness (nm)
Δf 1
(kH
z)
0 20 40 60 80 100
-80
-60
-40
-20
0
Protein-layer thickness (nm)
Δf 1
(kH
z)
0 20 40 60 80 100-80
-60
-40
-20
0
Protein-layer thickness (nm)
Δf 1
(kH
z)
0.10 0.05 0.01
0 20 40 60 80 100-800
-600
-400
-200
0
Protein-layer thickness (nm)
Δf 1
(kH
z)
0.10 0.05 0.01
(c)180 MHz QCM
Fig. 4. Changes in the fundamental resonance frequencies for (a) 5, (b) 55, and (c) 180MHz QCMs calculated by the three-layerviscoelastic model. Broken lines show the mass-loading effect based on the Sauerbrey equation. Used parameters are 2sol F 0.001Pa·s,7p F 1 kPa, ;p F 1100 kg/m3, and dsol F 1mm. Upper figures are resonance frequency changes for the three QCMs for 2p F 0.1Pa·s,and lower figures are relative frequency changes to those without the protein layer; numbers indicate 2p values in Pa·s.
H. OGI [Vol. 89,404
adsorbs many proteins with high affinity31),32) asshown in Fig. 5, realizing immobilization of receptorproteins directly on the naked quartz surface withoutlinkers such as self-assembled monolayers. Theaffinity to streptavidin is especially higher, and usingstreptavidin base on quartz, we can detect anyanalyte via biotin-conjugated receptors on streptavi-din, where the sensor chip never needs to be replacedas shown in Fig. 6. Because inactive proteins suchas bovine serum albumin (BSA) also adsorbs on thenaked quartz surfaces, the uncovered surface regionscan be blocked by injecting them after receptorproteins as will be seen in Fig. 14.
Measurement setup. In WE-QCM systems,two line or flat antennas are used for excitation anddetection of the shear vibrations of the AT-cut quartzoscillator. Figure 7 shows an example of the sensorcell for a multichannel WE-QCM. The AT-cut quartzoscillators with different thicknesses are aligned alongthe flow channel. They are lightly sandwiched by twosilicon-rubber gaskets. The two line antennas arelocated outside the flow channel. The tone burstsare applied to the generation antenna, which causesthe shear vibrations of the oscillators throughthe electromagnetic field. After the excitation, thevibrations are detected by the detection antennathrough the electromagnetic fields induced by thevibrations. Thus, the noncontacting measurement
of the oscillators’ vibrations is achieved with thismeasurement setup.
Figure 8 shows the electronics to measure theresonance frequency contactlessly by the antennas.A superheterodyne spectroscopy33),34) was developedwith the intermediate frequency (BIF) of 25MHz,which is provided by the local synthesizer. Themaster synthesizer generates a sinusoidal signal withthe frequency of BIF D BD, where BD is the driving
0 1000 2000-4
-3
-2
-1
0
1
Time (s)
Δf
(kH
z)
SPA
hIgG
BSA
Streptavidin
arrival of solutions
PEG
Fig. 5. Frequency changes observed for injections of 100 µg/mLconcentration proteins in a phosphate buffered saline (PBS)solution (f1 F 55MHz). PEG, SPA, BSA, and hIgG representpolyethylene glycol, staphylococcus protein A, bovine serumalbumin, and human immunoglobulin G, respectively. Thisfigure was reproduced with permission from Ogi et al.31)
0 10000 20000
-6
-4
-2
0
Time (s)
Δf
(kH
z)
100 μg/ml SA
PBS
10 μg/ml biotin-Anti-hIgG
PBS
biotin-PEG
PBS
6.7 nM hIgG
PBS
67 nM hIgG
PBS
Fig. 6. A frequency change observed in a multi-injectionmeasurement (f1 F 55MHz). SA, hIgG, biotin-PEG, and PBSrepresent streptavidin, human immunoglobulin G, biotin-conjugated polyethylene glycol, and phosphate buffered salinesolutions, respectively. This figure was reproduced with permis-sion from Ogi et al.31)
line antennas
Si-rubber gaskets
quartz plates
flow in flow out
flow in flow out
tone bursts
reverberating signals
quartz plates
Fig. 7. Measurement setup of a multichannel WE-QCM. ManyAT-cut quartz resonators are simultaneously excited by a singleantenna contactlessly. Their responses are separately detectedbecause of different resonance frequencies.
Wireless-electrodeless QCM biosensorsNo. 9] 405
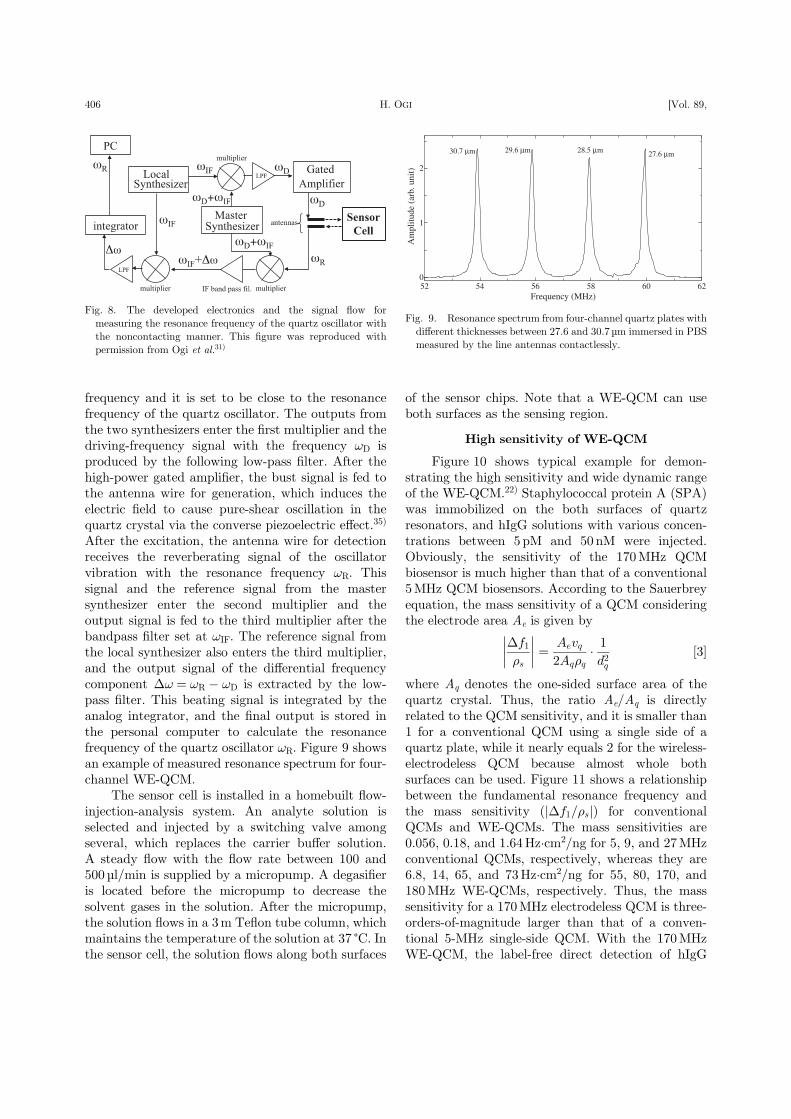
frequency and it is set to be close to the resonancefrequency of the quartz oscillator. The outputs fromthe two synthesizers enter the first multiplier and thedriving-frequency signal with the frequency BD isproduced by the following low-pass filter. After thehigh-power gated amplifier, the bust signal is fed tothe antenna wire for generation, which induces theelectric field to cause pure-shear oscillation in thequartz crystal via the converse piezoelectric effect.35)
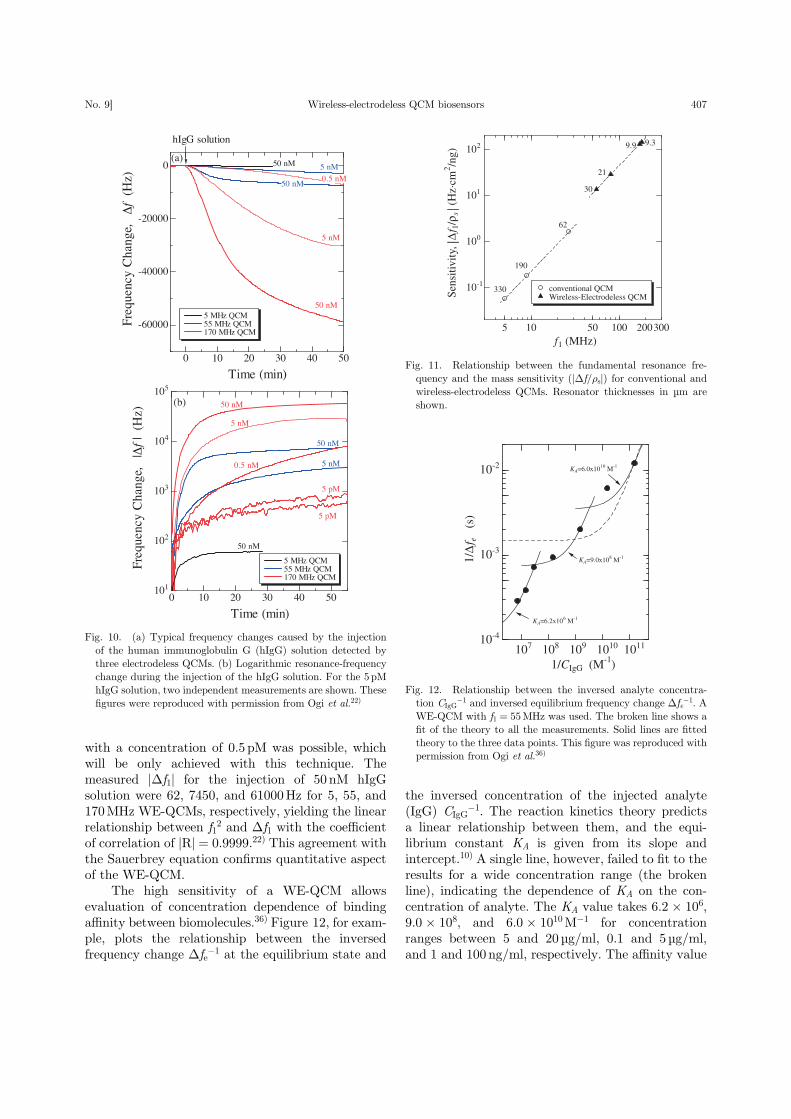
After the excitation, the antenna wire for detectionreceives the reverberating signal of the oscillatorvibration with the resonance frequency BR. Thissignal and the reference signal from the mastersynthesizer enter the second multiplier and theoutput signal is fed to the third multiplier after thebandpass filter set at BIF. The reference signal fromthe local synthesizer also enters the third multiplier,and the output signal of the differential frequencycomponent "B F BR ! BD is extracted by the low-pass filter. This beating signal is integrated by theanalog integrator, and the final output is stored inthe personal computer to calculate the resonancefrequency of the quartz oscillator BR. Figure 9 showsan example of measured resonance spectrum for four-channel WE-QCM.
The sensor cell is installed in a homebuilt flow-injection-analysis system. An analyte solution isselected and injected by a switching valve amongseveral, which replaces the carrier buffer solution.A steady flow with the flow rate between 100 and500 µl/min is supplied by a micropump. A degasifieris located before the micropump to decrease thesolvent gases in the solution. After the micropump,the solution flows in a 3m Teflon tube column, whichmaintains the temperature of the solution at 37 °C. Inthe sensor cell, the solution flows along both surfaces
of the sensor chips. Note that a WE-QCM can useboth surfaces as the sensing region.
High sensitivity of WE-QCM
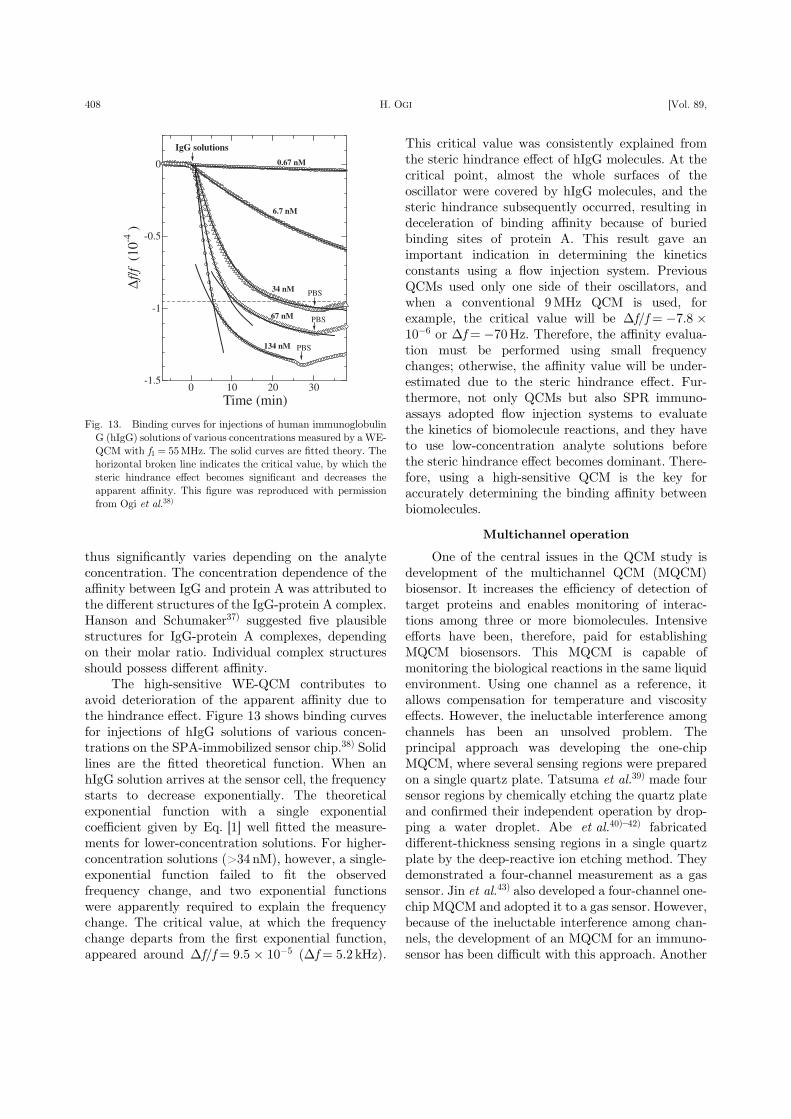
Figure 10 shows typical example for demon-strating the high sensitivity and wide dynamic rangeof the WE-QCM.22) Staphylococcal protein A (SPA)was immobilized on the both surfaces of quartzresonators, and hIgG solutions with various concen-trations between 5 pM and 50 nM were injected.Obviously, the sensitivity of the 170MHz QCMbiosensor is much higher than that of a conventional5MHz QCM biosensors. According to the Sauerbreyequation, the mass sensitivity of a QCM consideringthe electrode area Ae is given by
�f1�s
����
����¼ Aevq
2Aq�q� 1
d2q½3�
where Aq denotes the one-sided surface area of thequartz crystal. Thus, the ratio Ae/Aq is directlyrelated to the QCM sensitivity, and it is smaller than1 for a conventional QCM using a single side of aquartz plate, while it nearly equals 2 for the wireless-electrodeless QCM because almost whole bothsurfaces can be used. Figure 11 shows a relationshipbetween the fundamental resonance frequency andthe mass sensitivity (j�f1=�sj) for conventionalQCMs and WE-QCMs. The mass sensitivities are0.056, 0.18, and 1.64Hz·cm2/ng for 5, 9, and 27MHzconventional QCMs, respectively, whereas they are6.8, 14, 65, and 73Hz·cm2/ng for 55, 80, 170, and180MHz WE-QCMs, respectively. Thus, the masssensitivity for a 170MHz electrodeless QCM is three-orders-of-magnitude larger than that of a conven-tional 5-MHz single-side QCM. With the 170MHzWE-QCM, the label-free direct detection of hIgG
Fig. 8. The developed electronics and the signal flow formeasuring the resonance frequency of the quartz oscillator withthe noncontacting manner. This figure was reproduced withpermission from Ogi et al.31)
52 54 56 58 60 620
1
2
Am
plitu
de (
arb.
uni
t)
Frequency (MHz)
30.7 μm 29.6 μm 28.5 μm 27.6 μm
Fig. 9. Resonance spectrum from four-channel quartz plates withdifferent thicknesses between 27.6 and 30.7 µm immersed in PBSmeasured by the line antennas contactlessly.
H. OGI [Vol. 89,406
with a concentration of 0.5 pM was possible, whichwill be only achieved with this technique. Themeasured |"f1| for the injection of 50 nM hIgGsolution were 62, 7450, and 61000Hz for 5, 55, and170MHz WE-QCMs, respectively, yielding the linearrelationship between f12 and "f1 with the coefficientof correlation of |R| F 0.9999.22) This agreement withthe Sauerbrey equation confirms quantitative aspectof the WE-QCM.
The high sensitivity of a WE-QCM allowsevaluation of concentration dependence of bindingaffinity between biomolecules.36) Figure 12, for exam-ple, plots the relationship between the inversedfrequency change "fe!1 at the equilibrium state and
the inversed concentration of the injected analyte(IgG) CIgG
!1. The reaction kinetics theory predictsa linear relationship between them, and the equi-librium constant KA is given from its slope andintercept.10) A single line, however, failed to fit to theresults for a wide concentration range (the brokenline), indicating the dependence of KA on the con-centration of analyte. The KA value takes 6.2 # 106,9.0 # 108, and 6.0 # 1010M!1 for concentrationranges between 5 and 20 µg/ml, 0.1 and 5 µg/ml,and 1 and 100 ng/ml, respectively. The affinity value
10-1
100
101
102
f1 (MHz)
Sens
itivi
ty, |
Δf 1
/ρs| (
Hz·
cm2 /n
g)
conventional QCMWireless-Electrodeless QCM
330
190
30
21
9.9 9.3
20010050105 300
62
Fig. 11. Relationship between the fundamental resonance fre-quency and the mass sensitivity (|"f/;s|) for conventional andwireless-electrodeless QCMs. Resonator thicknesses in µm areshown.
Fig. 10. (a) Typical frequency changes caused by the injectionof the human immunoglobulin G (hIgG) solution detected bythree electrodeless QCMs. (b) Logarithmic resonance-frequencychange during the injection of the hIgG solution. For the 5pMhIgG solution, two independent measurements are shown. Thesefigures were reproduced with permission from Ogi et al.22)
107 108 109 1010 101110-4
10-3
10-2
1/CIgG (M-1)
1/Δ
f e
(s)
KA=6.2x10⁶ M-1
KA=9.0x10⁸ M-1
KA=6.0x10¹⁰ M-1
Fig. 12. Relationship between the inversed analyte concentra-tion CIgG
!1 and inversed equilibrium frequency change "fe!1. AWE-QCM with f1 F 55MHz was used. The broken line shows afit of the theory to all the measurements. Solid lines are fittedtheory to the three data points. This figure was reproduced withpermission from Ogi et al.36)
Wireless-electrodeless QCM biosensorsNo. 9] 407
thus significantly varies depending on the analyteconcentration. The concentration dependence of theaffinity between IgG and protein A was attributed tothe different structures of the IgG-protein A complex.Hanson and Schumaker37) suggested five plausiblestructures for IgG-protein A complexes, dependingon their molar ratio. Individual complex structuresshould possess different affinity.
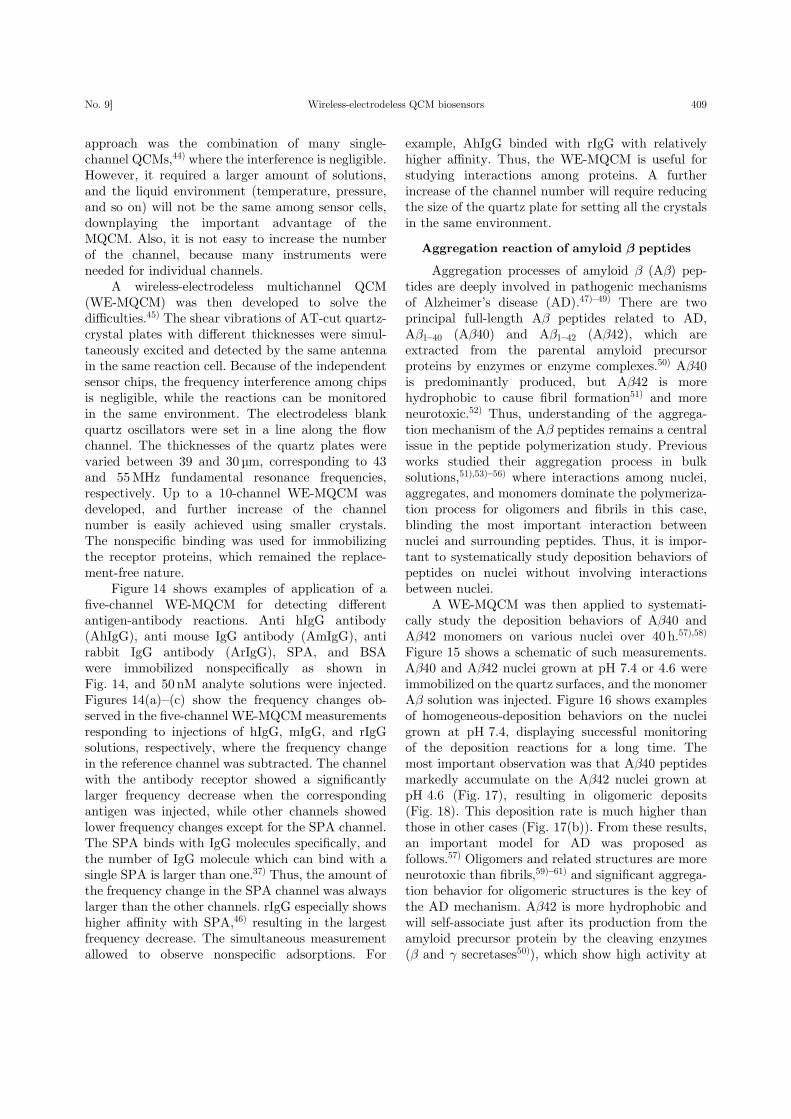
The high-sensitive WE-QCM contributes toavoid deterioration of the apparent affinity due tothe hindrance effect. Figure 13 shows binding curvesfor injections of hIgG solutions of various concen-trations on the SPA-immobilized sensor chip.38) Solidlines are the fitted theoretical function. When anhIgG solution arrives at the sensor cell, the frequencystarts to decrease exponentially. The theoreticalexponential function with a single exponentialcoefficient given by Eq. [1] well fitted the measure-ments for lower-concentration solutions. For higher-concentration solutions (>34 nM), however, a single-exponential function failed to fit the observedfrequency change, and two exponential functionswere apparently required to explain the frequencychange. The critical value, at which the frequencychange departs from the first exponential function,appeared around "f/f F 9.5 # 10!5 ("f F 5.2 kHz).
This critical value was consistently explained fromthe steric hindrance effect of hIgG molecules. At thecritical point, almost the whole surfaces of theoscillator were covered by hIgG molecules, and thesteric hindrance subsequently occurred, resulting indeceleration of binding affinity because of buriedbinding sites of protein A. This result gave animportant indication in determining the kineticsconstants using a flow injection system. PreviousQCMs used only one side of their oscillators, andwhen a conventional 9MHz QCM is used, forexample, the critical value will be "f/f F !7.8 #
10!6 or "f F !70Hz. Therefore, the affinity evalua-tion must be performed using small frequencychanges; otherwise, the affinity value will be under-estimated due to the steric hindrance effect. Fur-thermore, not only QCMs but also SPR immuno-assays adopted flow injection systems to evaluatethe kinetics of biomolecule reactions, and they haveto use low-concentration analyte solutions beforethe steric hindrance effect becomes dominant. There-fore, using a high-sensitive QCM is the key foraccurately determining the binding affinity betweenbiomolecules.
Multichannel operation
One of the central issues in the QCM study isdevelopment of the multichannel QCM (MQCM)biosensor. It increases the efficiency of detection oftarget proteins and enables monitoring of interac-tions among three or more biomolecules. Intensiveefforts have been, therefore, paid for establishingMQCM biosensors. This MQCM is capable ofmonitoring the biological reactions in the same liquidenvironment. Using one channel as a reference, itallows compensation for temperature and viscosityeffects. However, the ineluctable interference amongchannels has been an unsolved problem. Theprincipal approach was developing the one-chipMQCM, where several sensing regions were preparedon a single quartz plate. Tatsuma et al.39) made foursensor regions by chemically etching the quartz plateand confirmed their independent operation by drop-ping a water droplet. Abe et al.40)–42) fabricateddifferent-thickness sensing regions in a single quartzplate by the deep-reactive ion etching method. Theydemonstrated a four-channel measurement as a gassensor. Jin et al.43) also developed a four-channel one-chip MQCM and adopted it to a gas sensor. However,because of the ineluctable interference among chan-nels, the development of an MQCM for an immuno-sensor has been difficult with this approach. Another
0 10 20 30-1.5
-1
-0.5
0
Δ f/f
(10
-4 )
Time (min)
6.7 nM
34 nM
67 nM
134 nM PBS
PBS
PBS
IgG solutions
0.67 nM
Fig. 13. Binding curves for injections of human immunoglobulinG (hIgG) solutions of various concentrations measured by a WE-QCM with f1 F 55MHz. The solid curves are fitted theory. Thehorizontal broken line indicates the critical value, by which thesteric hindrance effect becomes significant and decreases theapparent affinity. This figure was reproduced with permissionfrom Ogi et al.38)
H. OGI [Vol. 89,408
approach was the combination of many single-channel QCMs,44) where the interference is negligible.However, it required a larger amount of solutions,and the liquid environment (temperature, pressure,and so on) will not be the same among sensor cells,downplaying the important advantage of theMQCM. Also, it is not easy to increase the numberof the channel, because many instruments wereneeded for individual channels.
A wireless-electrodeless multichannel QCM(WE-MQCM) was then developed to solve thedifficulties.45) The shear vibrations of AT-cut quartz-crystal plates with different thicknesses were simul-taneously excited and detected by the same antennain the same reaction cell. Because of the independentsensor chips, the frequency interference among chipsis negligible, while the reactions can be monitoredin the same environment. The electrodeless blankquartz oscillators were set in a line along the flowchannel. The thicknesses of the quartz plates werevaried between 39 and 30 µm, corresponding to 43and 55MHz fundamental resonance frequencies,respectively. Up to a 10-channel WE-MQCM wasdeveloped, and further increase of the channelnumber is easily achieved using smaller crystals.The nonspecific binding was used for immobilizingthe receptor proteins, which remained the replace-ment-free nature.
Figure 14 shows examples of application of afive-channel WE-MQCM for detecting differentantigen-antibody reactions. Anti hIgG antibody(AhIgG), anti mouse IgG antibody (AmIgG), antirabbit IgG antibody (ArIgG), SPA, and BSAwere immobilized nonspecifically as shown inFig. 14, and 50 nM analyte solutions were injected.Figures 14(a)–(c) show the frequency changes ob-served in the five-channel WE-MQCM measurementsresponding to injections of hIgG, mIgG, and rIgGsolutions, respectively, where the frequency changein the reference channel was subtracted. The channelwith the antibody receptor showed a significantlylarger frequency decrease when the correspondingantigen was injected, while other channels showedlower frequency changes except for the SPA channel.The SPA binds with IgG molecules specifically, andthe number of IgG molecule which can bind with asingle SPA is larger than one.37) Thus, the amount ofthe frequency change in the SPA channel was alwayslarger than the other channels. rIgG especially showshigher affinity with SPA,46) resulting in the largestfrequency decrease. The simultaneous measurementallowed to observe nonspecific adsorptions. For
example, AhIgG binded with rIgG with relativelyhigher affinity. Thus, the WE-MQCM is useful forstudying interactions among proteins. A furtherincrease of the channel number will require reducingthe size of the quartz plate for setting all the crystalsin the same environment.
Aggregation reaction of amyloid O peptides
Aggregation processes of amyloid O (AO) pep-tides are deeply involved in pathogenic mechanismsof Alzheimer’s disease (AD).47)–49) There are twoprincipal full-length AO peptides related to AD,AO1–40 (AO40) and AO1–42 (AO42), which areextracted from the parental amyloid precursorproteins by enzymes or enzyme complexes.50) AO40is predominantly produced, but AO42 is morehydrophobic to cause fibril formation51) and moreneurotoxic.52) Thus, understanding of the aggrega-tion mechanism of the AO peptides remains a centralissue in the peptide polymerization study. Previousworks studied their aggregation process in bulksolutions,51),53)–56) where interactions among nuclei,aggregates, and monomers dominate the polymeriza-tion process for oligomers and fibrils in this case,blinding the most important interaction betweennuclei and surrounding peptides. Thus, it is impor-tant to systematically study deposition behaviors ofpeptides on nuclei without involving interactionsbetween nuclei.
A WE-MQCM was then applied to systemati-cally study the deposition behaviors of AO40 andAO42 monomers on various nuclei over 40 h.57),58)
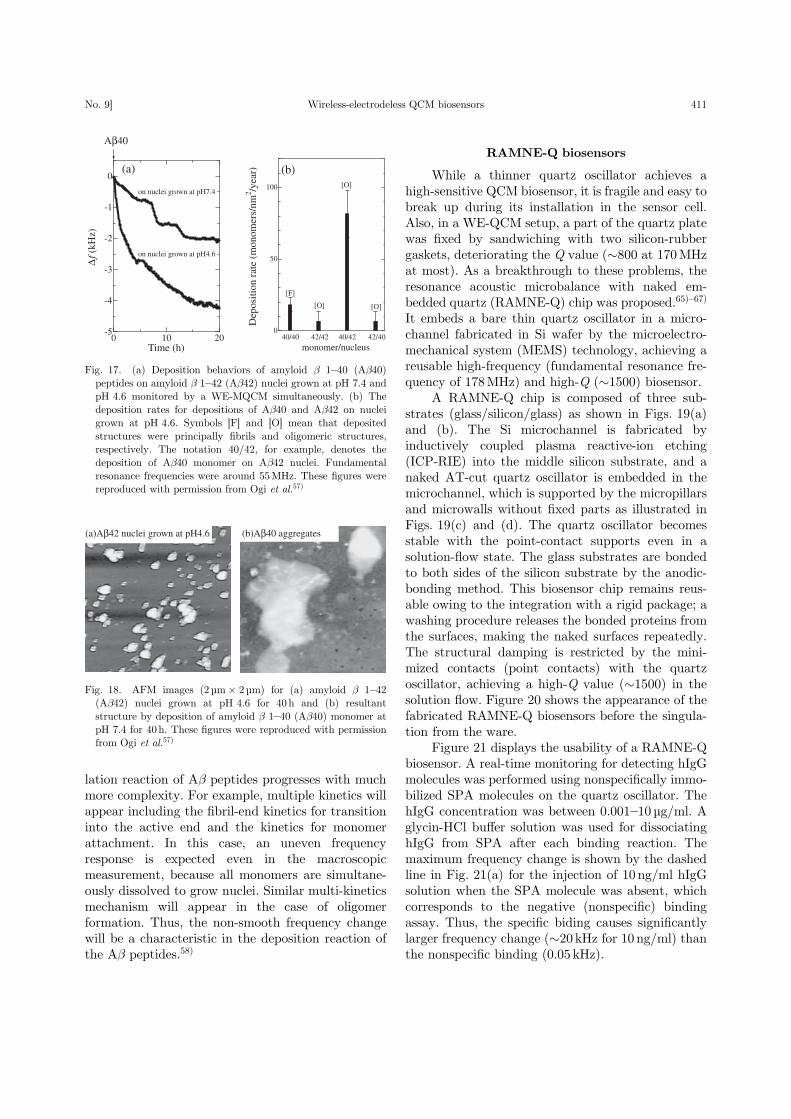
Figure 15 shows a schematic of such measurements.AO40 and AO42 nuclei grown at pH 7.4 or 4.6 wereimmobilized on the quartz surfaces, and the monomerAO solution was injected. Figure 16 shows examplesof homogeneous-deposition behaviors on the nucleigrown at pH 7.4, displaying successful monitoringof the deposition reactions for a long time. Themost important observation was that AO40 peptidesmarkedly accumulate on the AO42 nuclei grown atpH 4.6 (Fig. 17), resulting in oligomeric deposits(Fig. 18). This deposition rate is much higher thanthose in other cases (Fig. 17(b)). From these results,an important model for AD was proposed asfollows.57) Oligomers and related structures are moreneurotoxic than fibrils,59)–61) and significant aggrega-tion behavior for oligomeric structures is the key ofthe AD mechanism. AO42 is more hydrophobic andwill self-associate just after its production from theamyloid precursor protein by the cleaving enzymes(O and . secretases50)), which show high activity at
Wireless-electrodeless QCM biosensorsNo. 9] 409
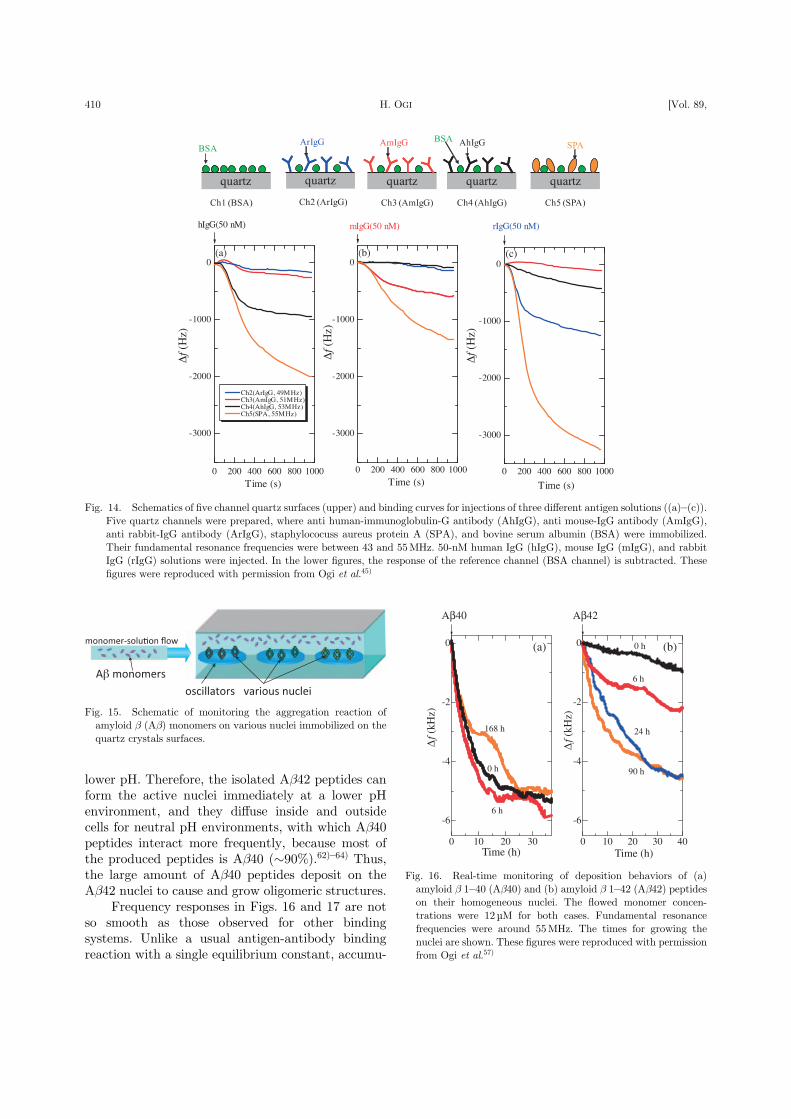
lower pH. Therefore, the isolated AO42 peptides canform the active nuclei immediately at a lower pHenvironment, and they diffuse inside and outsidecells for neutral pH environments, with which AO40peptides interact more frequently, because most ofthe produced peptides is AO40 (990%).62)–64) Thus,the large amount of AO40 peptides deposit on theAO42 nuclei to cause and grow oligomeric structures.
Frequency responses in Figs. 16 and 17 are notso smooth as those observed for other bindingsystems. Unlike a usual antigen-antibody bindingreaction with a single equilibrium constant, accumu-
Fig. 14. Schematics of five channel quartz surfaces (upper) and binding curves for injections of three different antigen solutions ((a)–(c)).Five quartz channels were prepared, where anti human-immunoglobulin-G antibody (AhIgG), anti mouse-IgG antibody (AmIgG),anti rabbit-IgG antibody (ArIgG), staphylococuss aureus protein A (SPA), and bovine serum albumin (BSA) were immobilized.Their fundamental resonance frequencies were between 43 and 55MHz. 50-nM human IgG (hIgG), mouse IgG (mIgG), and rabbitIgG (rIgG) solutions were injected. In the lower figures, the response of the reference channel (BSA channel) is subtracted. Thesefigures were reproduced with permission from Ogi et al.45)
Fig. 15. Schematic of monitoring the aggregation reaction ofamyloid O (AO) monomers on various nuclei immobilized on thequartz crystals surfaces.
0 10 20 30
-6
-4
-2
0
Δf (
kHz)
Time (h)
Aβ40
0 h
6 h
168 h
(a)
0 10 20 30 40
-6
-4
-2
0
Δf (
kHz)
Time (h)
Aβ42
0 h
6 h
90 h
24 h
(b)
Fig. 16. Real-time monitoring of deposition behaviors of (a)amyloid O 1–40 (AO40) and (b) amyloid O 1–42 (AO42) peptideson their homogeneous nuclei. The flowed monomer concen-trations were 12 µM for both cases. Fundamental resonancefrequencies were around 55MHz. The times for growing thenuclei are shown. These figures were reproduced with permissionfrom Ogi et al.57)
H. OGI [Vol. 89,410
lation reaction of AO peptides progresses with muchmore complexity. For example, multiple kinetics willappear including the fibril-end kinetics for transitioninto the active end and the kinetics for monomerattachment. In this case, an uneven frequencyresponse is expected even in the macroscopicmeasurement, because all monomers are simultane-ously dissolved to grow nuclei. Similar multi-kineticsmechanism will appear in the case of oligomerformation. Thus, the non-smooth frequency changewill be a characteristic in the deposition reaction ofthe AO peptides.58)
RAMNE-Q biosensors
While a thinner quartz oscillator achieves ahigh-sensitive QCM biosensor, it is fragile and easy tobreak up during its installation in the sensor cell.Also, in a WE-QCM setup, a part of the quartz platewas fixed by sandwiching with two silicon-rubbergaskets, deteriorating the Q value (9800 at 170MHzat most). As a breakthrough to these problems, theresonance acoustic microbalance with naked em-bedded quartz (RAMNE-Q) chip was proposed.65)–67)
It embeds a bare thin quartz oscillator in a micro-channel fabricated in Si wafer by the microelectro-mechanical system (MEMS) technology, achieving areusable high-frequency (fundamental resonance fre-quency of 178MHz) and high-Q (91500) biosensor.
A RAMNE-Q chip is composed of three sub-strates (glass/silicon/glass) as shown in Figs. 19(a)and (b). The Si microchannel is fabricated byinductively coupled plasma reactive-ion etching(ICP-RIE) into the middle silicon substrate, and anaked AT-cut quartz oscillator is embedded in themicrochannel, which is supported by the micropillarsand microwalls without fixed parts as illustrated inFigs. 19(c) and (d). The quartz oscillator becomesstable with the point-contact supports even in asolution-flow state. The glass substrates are bondedto both sides of the silicon substrate by the anodic-bonding method. This biosensor chip remains reus-able owing to the integration with a rigid package; awashing procedure releases the bonded proteins fromthe surfaces, making the naked surfaces repeatedly.The structural damping is restricted by the mini-mized contacts (point contacts) with the quartzoscillator, achieving a high-Q value (91500) in thesolution flow. Figure 20 shows the appearance of thefabricated RAMNE-Q biosensors before the singula-tion from the ware.
Figure 21 displays the usability of a RAMNE-Qbiosensor. A real-time monitoring for detecting hIgGmolecules was performed using nonspecifically immo-bilized SPA molecules on the quartz oscillator. ThehIgG concentration was between 0.001–10 µg/ml. Aglycin-HCl buffer solution was used for dissociatinghIgG from SPA after each binding reaction. Themaximum frequency change is shown by the dashedline in Fig. 21(a) for the injection of 10 ng/ml hIgGsolution when the SPA molecule was absent, whichcorresponds to the negative (nonspecific) bindingassay. Thus, the specific biding causes significantlylarger frequency change (920 kHz for 10 ng/ml) thanthe nonspecific binding (0.05 kHz).
0
50
100
40/40 42/42 42/40
[O]
[O]
[O]
[F]
monomer/nucleus
Dep
ositi
on r
ate
(mon
omer
s/nm
2 /yea
r)
0 10 20-5
-4
-3
-2
-1
0
Δf (
kHz)
Time (h)
Aβ40
on nuclei grown at pH7.4
on nuclei grown at pH4.6
(a) (b)
40/42
Fig. 17. (a) Deposition behaviors of amyloid O 1–40 (AO40)peptides on amyloid O 1–42 (AO42) nuclei grown at pH 7.4 andpH 4.6 monitored by a WE-MQCM simultaneously. (b) Thedeposition rates for depositions of AO40 and AO42 on nucleigrown at pH 4.6. Symbols [F] and [O] mean that depositedstructures were principally fibrils and oligomeric structures,respectively. The notation 40/42, for example, denotes thedeposition of AO40 monomer on AO42 nuclei. Fundamentalresonance frequencies were around 55MHz. These figures werereproduced with permission from Ogi et al.57)
(a)Aβ42 nuclei grown at pH4.6 (b)Aβ40 aggregates
Fig. 18. AFM images (2 µm # 2 µm) for (a) amyloid O 1–42(AO42) nuclei grown at pH 4.6 for 40 h and (b) resultantstructure by deposition of amyloid O 1–40 (AO40) monomer atpH 7.4 for 40h. These figures were reproduced with permissionfrom Ogi et al.57)
Wireless-electrodeless QCM biosensorsNo. 9] 411
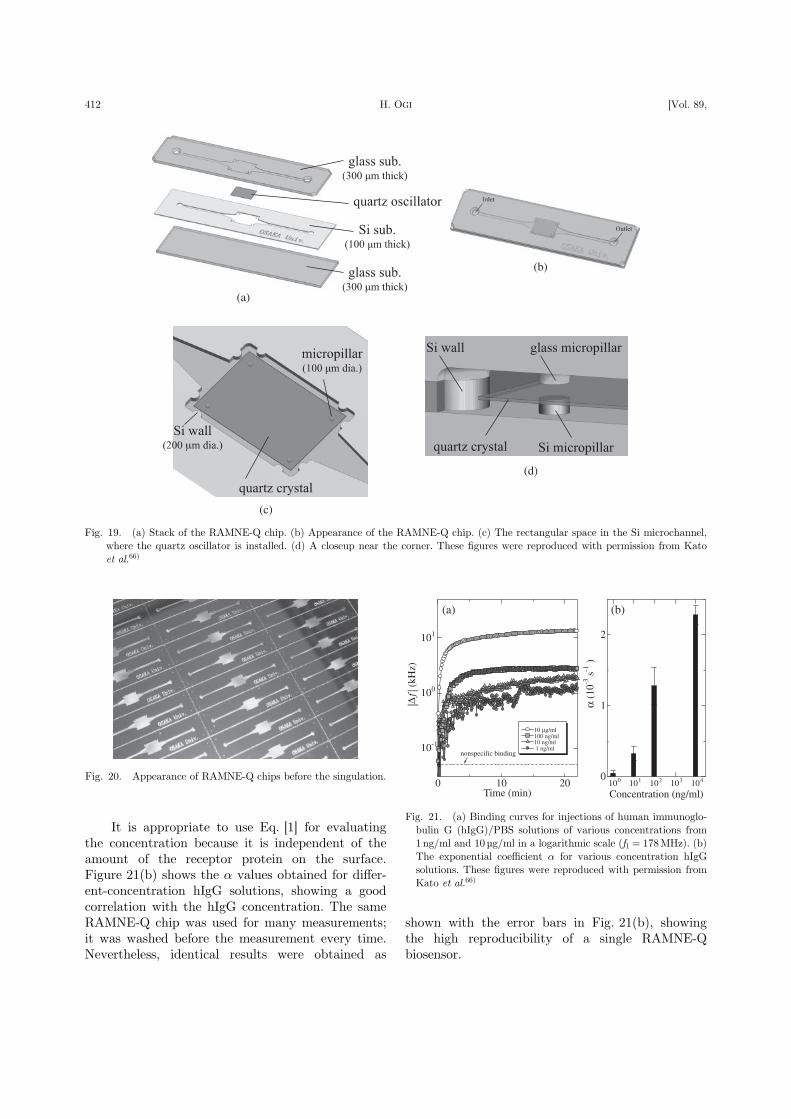
It is appropriate to use Eq. [1] for evaluatingthe concentration because it is independent of theamount of the receptor protein on the surface.Figure 21(b) shows the , values obtained for differ-ent-concentration hIgG solutions, showing a goodcorrelation with the hIgG concentration. The sameRAMNE-Q chip was used for many measurements;it was washed before the measurement every time.Nevertheless, identical results were obtained as
shown with the error bars in Fig. 21(b), showingthe high reproducibility of a single RAMNE-Qbiosensor.
(a)
(b)
(c)
(d)
Fig. 19. (a) Stack of the RAMNE-Q chip. (b) Appearance of the RAMNE-Q chip. (c) The rectangular space in the Si microchannel,where the quartz oscillator is installed. (d) A closeup near the corner. These figures were reproduced with permission from Katoet al.66)
Fig. 20. Appearance of RAMNE-Q chips before the singulation.0 10 20
10-1
100
101
|Δf|
(kH
z)
Time (min)
10 μg/ml100 ng/ml10 ng/ml 1 ng/ml
nonspecific binding
(a)
100 101 102 103 1040
1
2
Concentration (ng/ml)
α (1
0-3 s
-1 )
(b)
Fig. 21. (a) Binding curves for injections of human immunoglo-bulin G (hIgG)/PBS solutions of various concentrations from1ng/ml and 10µg/ml in a logarithmic scale (f1 F 178MHz). (b)The exponential coefficient , for various concentration hIgGsolutions. These figures were reproduced with permission fromKato et al.66)
H. OGI [Vol. 89,412
Sensitivity amplification with sandwich assays
As an important practical use, QCM biosensorsare expected to detect biomarkers. However, humanserum contains many blood proteins, and they areadsorbed on the sensor chip surfaces nonspecifically,making it difficult to extract from the totalfrequency response the small frequency changecaused by the binding of a target protein with thereceptor on the surface. Also, threshold concentra-tions are usually lower than the detection limit ofQCM biosensors. To overcome these difficulty, mass-amplified sandwich-assay methods were proposed.Gold nanoparticles were, for example, used for themass amplification in QCM assays.68)–70) However,high affinity of gold for proteins32) causes nonspecificadsorption on receptor proteins. Also, preparationof surface-modified particles takes longer. In theWE-QCM, a mass-amplification method using strep-tavidin was proposed,30) where streptavidin mole-cules quickly combines with biotins with extremelyhigh affinity. As a target protein, the C-reactiveprotein (CRP) was adopted, which is an importantbiomarker for checking inflammation. Its thresholdlevel is about 30 ng/ml, and a very quick assay isoften required in an emergency case to judge thecause of illness.
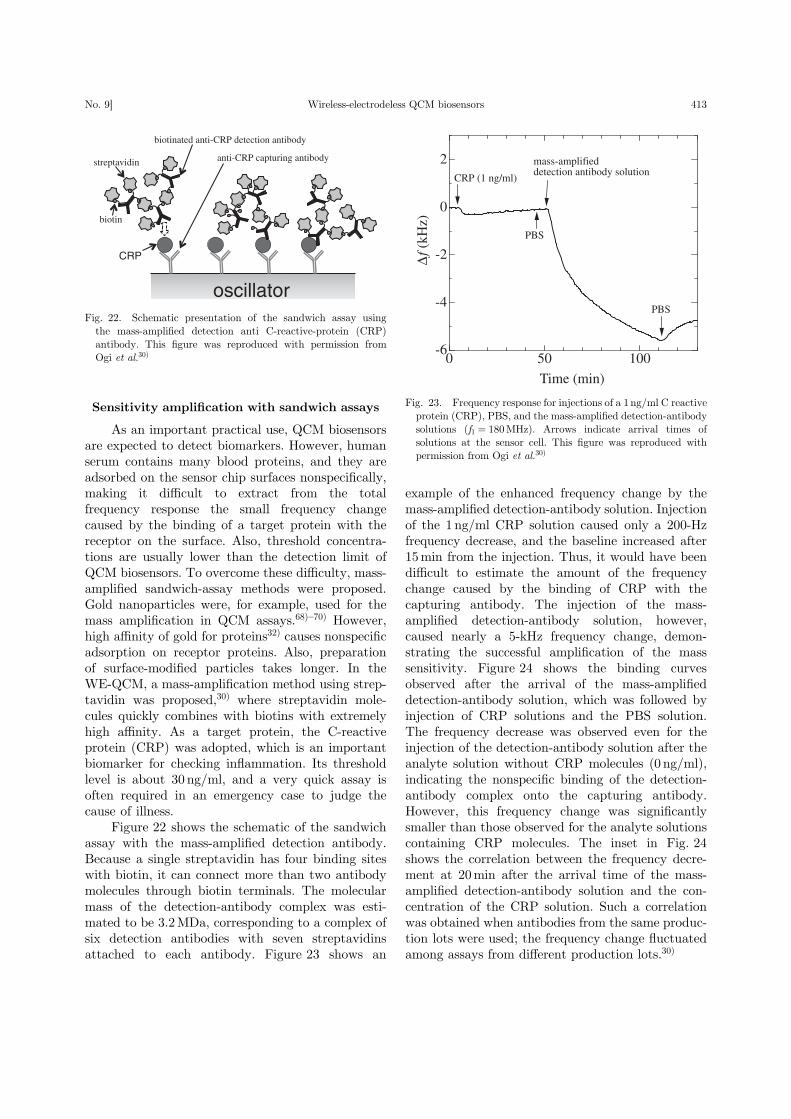
Figure 22 shows the schematic of the sandwichassay with the mass-amplified detection antibody.Because a single streptavidin has four binding siteswith biotin, it can connect more than two antibodymolecules through biotin terminals. The molecularmass of the detection-antibody complex was esti-mated to be 3.2MDa, corresponding to a complex ofsix detection antibodies with seven streptavidinsattached to each antibody. Figure 23 shows an
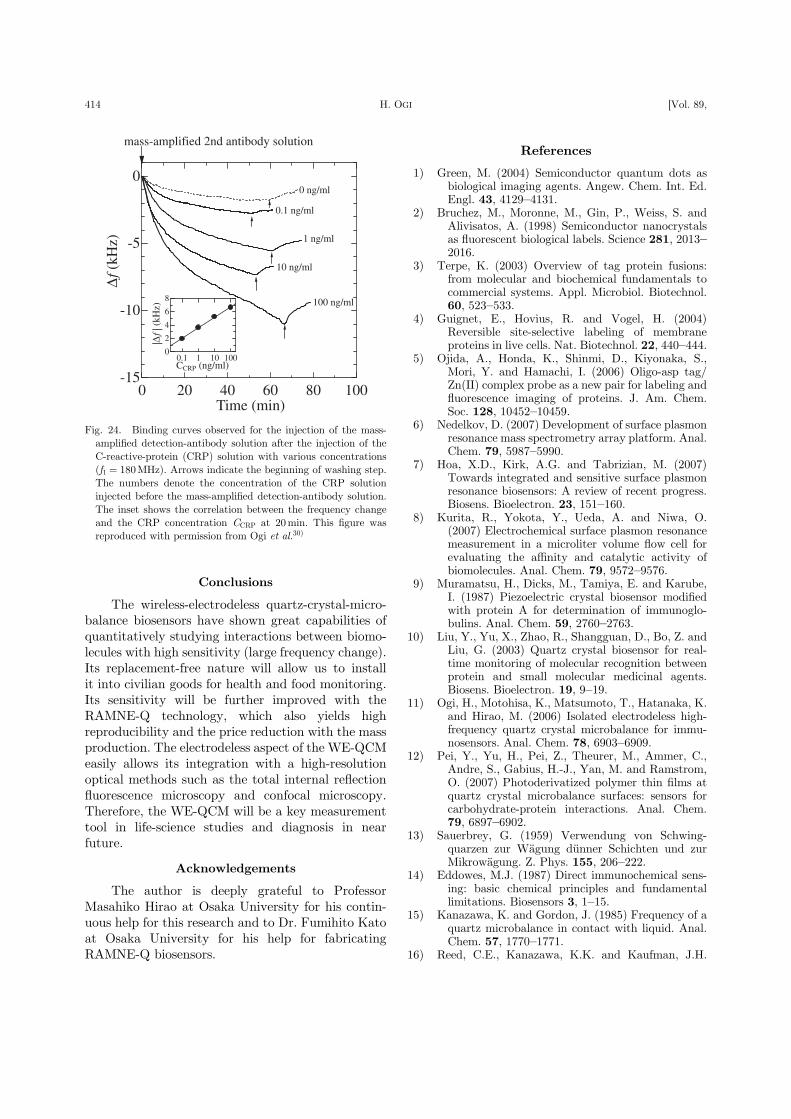
example of the enhanced frequency change by themass-amplified detection-antibody solution. Injectionof the 1 ng/ml CRP solution caused only a 200-Hzfrequency decrease, and the baseline increased after15min from the injection. Thus, it would have beendifficult to estimate the amount of the frequencychange caused by the binding of CRP with thecapturing antibody. The injection of the mass-amplified detection-antibody solution, however,caused nearly a 5-kHz frequency change, demon-strating the successful amplification of the masssensitivity. Figure 24 shows the binding curvesobserved after the arrival of the mass-amplifieddetection-antibody solution, which was followed byinjection of CRP solutions and the PBS solution.The frequency decrease was observed even for theinjection of the detection-antibody solution after theanalyte solution without CRP molecules (0 ng/ml),indicating the nonspecific binding of the detection-antibody complex onto the capturing antibody.However, this frequency change was significantlysmaller than those observed for the analyte solutionscontaining CRP molecules. The inset in Fig. 24shows the correlation between the frequency decre-ment at 20min after the arrival time of the mass-amplified detection-antibody solution and the con-centration of the CRP solution. Such a correlationwas obtained when antibodies from the same produc-tion lots were used; the frequency change fluctuatedamong assays from different production lots.30)
oscillator
biotinated anti-CRP detection antibody
CRP
streptavidin
biotin
anti-CRP capturing antibody
Fig. 22. Schematic presentation of the sandwich assay usingthe mass-amplified detection anti C-reactive-protein (CRP)antibody. This figure was reproduced with permission fromOgi et al.30) 0 50 100
-6
-4
-2
0
2
Time (min)
Δf (
kHz)
CRP (1 ng/ml)
mass-amplified detection antibody solution
PBS
PBS
Fig. 23. Frequency response for injections of a 1 ng/ml C reactiveprotein (CRP), PBS, and the mass-amplified detection-antibodysolutions (f1 F 180MHz). Arrows indicate arrival times ofsolutions at the sensor cell. This figure was reproduced withpermission from Ogi et al.30)
Wireless-electrodeless QCM biosensorsNo. 9] 413
Conclusions
The wireless-electrodeless quartz-crystal-micro-balance biosensors have shown great capabilities ofquantitatively studying interactions between biomo-lecules with high sensitivity (large frequency change).Its replacement-free nature will allow us to installit into civilian goods for health and food monitoring.Its sensitivity will be further improved with theRAMNE-Q technology, which also yields highreproducibility and the price reduction with the massproduction. The electrodeless aspect of the WE-QCMeasily allows its integration with a high-resolutionoptical methods such as the total internal reflectionfluorescence microscopy and confocal microscopy.Therefore, the WE-QCM will be a key measurementtool in life-science studies and diagnosis in nearfuture.
Acknowledgements
The author is deeply grateful to ProfessorMasahiko Hirao at Osaka University for his contin-uous help for this research and to Dr. Fumihito Katoat Osaka University for his help for fabricatingRAMNE-Q biosensors.
References
1) Green, M. (2004) Semiconductor quantum dots asbiological imaging agents. Angew. Chem. Int. Ed.Engl. 43, 4129–4131.
2) Bruchez, M., Moronne, M., Gin, P., Weiss, S. andAlivisatos, A. (1998) Semiconductor nanocrystalsas fluorescent biological labels. Science 281, 2013–2016.
3) Terpe, K. (2003) Overview of tag protein fusions:from molecular and biochemical fundamentals tocommercial systems. Appl. Microbiol. Biotechnol.60, 523–533.
4) Guignet, E., Hovius, R. and Vogel, H. (2004)Reversible site-selective labeling of membraneproteins in live cells. Nat. Biotechnol. 22, 440–444.
5) Ojida, A., Honda, K., Shinmi, D., Kiyonaka, S.,Mori, Y. and Hamachi, I. (2006) Oligo-asp tag/Zn(II) complex probe as a new pair for labeling andfluorescence imaging of proteins. J. Am. Chem.Soc. 128, 10452–10459.
6) Nedelkov, D. (2007) Development of surface plasmonresonance mass spectrometry array platform. Anal.Chem. 79, 5987–5990.
7) Hoa, X.D., Kirk, A.G. and Tabrizian, M. (2007)Towards integrated and sensitive surface plasmonresonance biosensors: A review of recent progress.Biosens. Bioelectron. 23, 151–160.
8) Kurita, R., Yokota, Y., Ueda, A. and Niwa, O.(2007) Electrochemical surface plasmon resonancemeasurement in a microliter volume flow cell forevaluating the affinity and catalytic activity ofbiomolecules. Anal. Chem. 79, 9572–9576.
9) Muramatsu, H., Dicks, M., Tamiya, E. and Karube,I. (1987) Piezoelectric crystal biosensor modifiedwith protein A for determination of immunoglo-bulins. Anal. Chem. 59, 2760–2763.
10) Liu, Y., Yu, X., Zhao, R., Shangguan, D., Bo, Z. andLiu, G. (2003) Quartz crystal biosensor for real-time monitoring of molecular recognition betweenprotein and small molecular medicinal agents.Biosens. Bioelectron. 19, 9–19.
11) Ogi, H., Motohisa, K., Matsumoto, T., Hatanaka, K.and Hirao, M. (2006) Isolated electrodeless high-frequency quartz crystal microbalance for immu-nosensors. Anal. Chem. 78, 6903–6909.
12) Pei, Y., Yu, H., Pei, Z., Theurer, M., Ammer, C.,Andre, S., Gabius, H.-J., Yan, M. and Ramstrom,O. (2007) Photoderivatized polymer thin films atquartz crystal microbalance surfaces: sensors forcarbohydrate-protein interactions. Anal. Chem.79, 6897–6902.
13) Sauerbrey, G. (1959) Verwendung von Schwing-quarzen zur Wägung dünner Schichten und zurMikrowägung. Z. Phys. 155, 206–222.
14) Eddowes, M.J. (1987) Direct immunochemical sens-ing: basic chemical principles and fundamentallimitations. Biosensors 3, 1–15.
15) Kanazawa, K. and Gordon, J. (1985) Frequency of aquartz microbalance in contact with liquid. Anal.Chem. 57, 1770–1771.
16) Reed, C.E., Kanazawa, K.K. and Kaufman, J.H.
0 20 40 60 80 100-15
-10
-5
0
Time (min)
Δf (
kHz)
0 ng/ml
0.1 ng/ml
1 ng/ml
100 ng/ml
10 ng/ml
mass-amplified 2nd antibody solution
0.1 1 10 1000
2
4
6
8
CCRP (ng/ml)
|Δf |
(kH
z)
Fig. 24. Binding curves observed for the injection of the mass-amplified detection-antibody solution after the injection of theC-reactive-protein (CRP) solution with various concentrations(f1 F 180MHz). Arrows indicate the beginning of washing step.The numbers denote the concentration of the CRP solutioninjected before the mass-amplified detection-antibody solution.The inset shows the correlation between the frequency changeand the CRP concentration CCRP at 20min. This figure wasreproduced with permission from Ogi et al.30)
H. OGI [Vol. 89,414
(1993) Physical description of a viscoelasticallyloaded AT-cut quartz resonator. J. Appl. Phys. 68,1993–2001.
17) Voinova, M.V., Jonson, M. and Kasemo, B. (1997)Dynamics of viscous amphiphilic films supportedby elastic solid substrates. J. Phys. Condens.Matter 9, 7799–7808.
18) Höök, F., Kasemo, B., Nylander, T., Fant, C., Sott,K. and Elwing, H. (2001) Variations in coupledwater, viscoelastic properties, and film thickness ofa mefp-1 protein film during adsorption and cross-linking: A quartz crystal microbalance with dis-sipation monitoring, ellipsometry, and surfaceplasmon resonance study. Anal. Chem. 73, 5796–5804.
19) Jonsson, M.P., Jönsson, P. and Höök, F. (2008)Simultaneous nanoplasmonic and quartz crystalmicrobalance sensing: Analysis of biomolecularconformational changes and quantification of thebound molecular mass. Anal. Chem. 80, 7988–7995.
20) Patel, A.R., Kanazawa, K.K. and Frank, C.W.(2009) Antibody binding to a tethered vesicleassembly using QCM-D. Anal. Chem. 81, 6021–6029.
21) Yan, M., Liu, C., Wang, D., Ni, J. and Cheng, J.(2011) Characterization of adsorption of humicacid onto alumina using quartz crystal micro-balance with dissipation. Langmuir 27, 9860–9865.
22) Ogi, H., Nagai, H., Fukunishi, Y., Hirao, M. andNishiyama, M. (2009) 170-MHz electrodelessquartz crystal microbalance biosensor: Capabilityand limitation of higher frequency measurement.Anal. Chem. 81, 8068–8073.
23) Guzmn, E., Ritacco, H., Ortega, F., Svitova, T.,Radke, C.J. and Rubio, R.G. (2009) Adsorptionkinetics and mechanical properties of ultrathinpolyelectrolyte multilayers: Liquid-supported ver-sus solid-supported films. J. Phys. Chem. B 113,7128–7137.
24) Kang, H. and Muramatsu, H. (2009) Monitoring ofcultured cell activity by the quartz crystal andthe micro CCD camera under chemical stressors.Biosens. Bioelectron. 24, 1318–1323.
25) Wang, S., Milam, J., Ohlin, A.C., Rambaran, V.H.,Clark, E., Ward, W., Seymour, L., Casey, W.H.,Holder, A.A. and Miao, W. (2009) Electrochemicaland electrogenerated chemiluminescent studies ofa trinuclear complex, [((phen)2Ru(dpp))2RhCl2]5D,and its interactions with calf thymus DNA. Anal.Chem. 81, 4068–4075.
26) Natesan, M., Cooper, M.A., Tran, J.P., Rivera, V.R.and Poli, M.A. (2009) Quantitative detection ofstaphylococcal enterotoxin B by resonant acousticprofiling. Anal. Chem. 81, 3896–3902.
27) Furusawa, H., Komatsu, M. and Okahata, Y. (2009)In situ monitoring of conformational changes ofand peptide bindings to calmodulin on a 27MHzquartz-crystal microbalance. Anal. Chem. 81,1841–1847.
28) Furusawa, H., Ozeki, T., Morita, M. and Okahata,Y. (2009) Added mass effect on immobilizations of
proteins on a 27MHz quartz crystal microbalancein aqueous solution. Anal. Chem. 81, 2268–2273.
29) Uttenthaler, E., Schr’aml, M., Mandel, J. and Drost,S. (2001) Ultrasensitive quartz crystal microba-lance sensors for detection of M13-Phages inliquids. Biosens. Bioelectron. 16, 735–743.
30) Ogi, H., Yanagida, T., Hirao, M. and Nishiyama, M.(2011) Replacement-free mass-amplified sandwichassay with 180-MHz electrodeless quartz-crystalmicrobalance biosensor. Biosens. Bioelectron. 26,4819–4822.
31) Ogi, H., Okamoto, K., Nagai, H., Fukunishi, Y. andHirao, M. (2009) Replacement-free electrodelessquartz crystal microbalance biosensor using non-specific-adsorption of streptavidin on quartz. Anal.Chem. 81, 4015–4020.
32) Ogi, H., Fukunishi, Y., Nagai, H., Okamoto, K.,Hirao, M. and Nishiyama, M. (2009) Nonspecific-adsorption behavior of polyethylenglycol andbovine serum albumin studied by 55-MHz wire-less–electrodeless quartz crystal microbalance.Biosens. Bioelectron. 24, 3148–3152.
33) Hirao, M., Ogi, H. and Fukuoka, H. (1993) Reso-nance EMAT system for acoustoelastic stressevaluation in sheet metals. Rev. Sci. Instrum. 64,3198–3205.
34) Petersen, G.L., Chick, B.B., Fortunko, C.M. andMirao, M. (1994) Resonance techniques andapparatus for elastic-wave velocity determinationin thin metal plates. Rev. Sci. Instrum. 65, 192–198.
35) Ogi, H., Niho, H. and Hirao, M. (2006) Internal-friction mapping on solids by resonance ultrasoundmicroscopy. Appl. Phys. Lett. 88, 141110.
36) Ogi, H., Motohisa, K., Hatanaka, K., Ohmori, T.,Hirao, M. and Nishiyama, M. (2007) Concentra-tion dependence of IgG–protein A affinity studiedby wireless-electrodeless QCM. Biosens. Bioelec-tron. 22, 3238–3242.
37) Hanson, D.C. and Schumaker, V.N. (1984) A modelfor the formation and interconversion of protein A-immunoglobulin G soluble complexes. J. Immunol.132, 1397–1409.
38) Ogi, H., Fukunishi, Y., Omori, T., Hatanaka, K.,Hirao, M. and Nishiyama, M. (2008) Effects of flowrate on sensitivity and affinity in flow injectionbiosensor systems studied by 55-MHz wirelessquartz crystal microbalance. Anal. Chem. 80,5494–5500.
39) Tatsuma, T., Watanabe, Y. and Oyama, N. (1999)Multichannel quartz crystal microbalance. Anal.Chem. 71, 3632–3636.
40) Abe, T. and Esashi, M. (2000) One-chip multi-channel quartz crystal microbalance (QCM) fab-ricated by Deep RIE. Sens. Actuators A Phys. 82,139–143.
41) Hung, V.N., Abe, T., Minh, P.N. and Esashi, M.(2002) Miniaturized, highly sensitive single-chipmultichannel quartz-crystal microbalance. Appl.Phys. Lett. 81, 5069–5071.
42) Hung, V.N., Abe, T., Minh, P.N. and Esashi, M.(2003) High-frequency one-chip multichannel
Wireless-electrodeless QCM biosensorsNo. 9] 415
quartz crystal microbalance fabricated by deepRIE. Sens. Actuators A Phys. 108, 91–96.
43) Jin, X., Huang, Y., Mason, A. and Zeng, X. (2009)Multichannel monolithic quartz crystal microba-lance gas sensor array. Anal. Chem. 81, 595–603.
44) Zhang, B., Mao, Q., Zhang, X., Jiang, T., Chen, M.,Yu, F. and Fu, W. (2004) A novel piezoelectricquartz micro-array immunosensor based on self-assembled monolayer for determination of humanchorionic gonadotropin. Biosens. Bioelectron. 19,711–720.
45) Ogi, H., Nagai, H., Fukunishi, Y., Yanagida, T.,Hirao, M. and Nishiyama, M. (2010) Multichannelwireless-electrodeless quartz-crystal microbalanceimmunosensor. Anal. Chem. 82, 3957–3962.
46) Hanson, D.C., Phillips, M.L. and Schumaker, V.N.(1984) Electron microscopic and hydrodynamicstudies of protein A-immunoglobulin G solublecomplexes. J. Immunol. 132, 1386–1396.
47) Lambert, M.P., Barlow, A.K., Chromy, B.A.,Edwards, C., Freed, R., Liosatos, M., Morgan,T.E., Rozovsky, I., Trommer, B., Viola, K.L.,Wals, P., Zhang, C., Finch, C.E., Krafft, G.A. andKlein, W.L. (1998) Diffusible, nonfibrillar ligandsderived from AO1–42 are potent central nervoussystem neurotoxins. Proc. Natl. Acad. Sci. U.S.A.95, 6448–6453.
48) Bucciantini, M., Giannoni, E., Chiti, F., Baroni, F.,Formigli, L., Zurdo, J., Taddei, N., Ramponi, G.,Dobson, C.M. and Stefani, M. (2002) Inherenttoxicity of aggregates implies a common mechan-ism for protein misfolding diseases. Nature 416,507–511.
49) Stefani, M. and Dobson, C.M. (2003) Proteinaggregation and aggregate toxicity: new insightsinto protein folding, misfolding diseases and bio-logical evolution. J. Mol. Med. 81, 678–699.
50) LaFerla, F.M., Green, K.N. and Oddo, S. (2007)Intracellular amyloid-beta in Alzheimer’s disease.Nat. Rev. Neurosci. 8, 499–509.
51) Jarrett, J.T., Berger, E.P. and Lansbury, P.T. Jr.(1993) The carboxy terminus of the O amyloidprotein is critical for the seeding of amyloidformation: Implications for the pathogenesis ofAlzheimer’s disease. Biochemistry 32, 4693–4697.
52) Takahashi, R.H., Milner, T.A., Li, F., Nam, E.E.,Edgar, M.A., Yamaguchi, H., Beal, M.F., Xu, H.,Greengard, P. and Gouras, G.K. (2002) Intra-neuronal Alzheimer AO42 accumulates in multi-vesicular bodies and is associated with synapticpathology. Am. J. Pathol. 161, 1869–1879.
53) Wood, S.J., Maleeff, B., Hart, T. and Wetzel, R.(1996) Physical, morphological and functionaldifferences between pH 5.8 and 7.4 aggregates ofthe Alzheimer’s amyloid peptide AO. J. Mol. Biol.256, 870–877.
54) Nybo, M., Svehag, S.-E. and Nielsen, E.H. (1999) Anultrastructural study of amyloid intermediates inAO1–42 fibrillogenesis. Scand. J. Immunol. 49, 219–223.
55) Bitan, G., Kirkitadze, M.D., Lomakin, A., Vollers,S.S., Benedek, G.B. and Teplow, D.B. (2003)
Amyloid O-protein (AO) assembly: AO40 andAO42 oligomerize through distinct pathways. Proc.Natl. Acad. Sci. U.S.A. 100, 330–335.
56) Benseny-Cases, N., Cocera, M. and Cladera, J.(2007) Conversion of non-fibrillar O-sheet oligo-mers into amyloid fibrils in Alzheimer’s diseaseamyloid peptide aggregation. Biochem. Biophys.Res. Commun. 361, 916–921.
57) Ogi, H., Fukunishi, Y., Yanagida, T., Yagi, H., Goto,Y., Fukushima, M., Uesugi, K. and Hirao, M.(2011) Seed-dependent deposition behavior ofAO peptides studied with wireless quartz-crystal-microbalance biosensor. Anal. Chem. 83, 4982–4988.
58) Ogi, H., Fukushima, M., Uesugi, K., Yagi, H., Goto,Y. and Hirao, M. (2013) Acceleration of depositionof AO1–40 peptide on ultrasonically formed AO1–42nucleus studied by wireless quartz-crystal-micro-balance biosensor. Biosens. Bioelectron. 40, 200–205.
59) Klein, W.L., Krafft, G.A. and Finch, C.E. (2001)Targeting small AO oligomers: the solution to anAlzheimer’s disease conundrum? Trends Neurosci.24, 219–224.
60) Mastrangelo, I.A., Ahmed, M., Sato, T., Liu, W.,Wang, C., Hough, P. and Smith, S.O. (2006) High-resolution atomic force microscopy of aoluble AO42oligomers. J. Mol. Biol. 358, 106–119.
61) Walsh, D.M., Klyubin, I., Fadeeva, J.V., Cullen,W.K., Anwyl, R., Wolfe, M.S., Rowan, M.J. andSelkoe, D.J. (2002) Naturally secreted oligomersof amyloid protein potently inhibit hippocampallong-term potentiation in vivo. Nature 416, 535–539.
62) Suzuki, N., Cheung, T.T., Cai, X.-D., Odaka, A.,Otvos, L. Jr., Eckman, C., Golde, T.E. andYounkin, S.G. (1994) An increased percentage oflong amyloid beta protein secreted by familialamyloid beta protein precursor (beta APP717)mutants. Science 264, 1336–1340.
63) Iwatsubo, T., Odaka, A., Suzuki, N., Mizusawa, H.,Nukina, N. and Ihara, Y. (1994) Visualization ofAO42(43) and AO40 in senile plaques with end-specific AO monoclonals: Evidence that an initiallydeposited species is AO42(43). Neuron 13, 45–53.
64) Gravina, S.A., Ho, L.B., Eckman, C.B., Long, K.E.,Otvos, L. Jr., Younkin, L.H., Suzuki, N. andYounkin, S.G. (1995) Amyloid O protein (AO) inAlzheimer’s disease brain. J. Biol. Chem. 270,7013–7016.
65) Kato, F., Ogi, H., Yanagida, T., Nishikawa, S.,Nishiyama, M. and Hirao, M. (2011) High-frequency electrodeless quartz crystal microbalancechip with a bare quartz resonator encapsulatedin a silicon microchannel. Jpn. J. Appl. Phys. 50,07HD03.
66) Kato, F., Ogi, H., Yanagida, T., Nishikawa, S.,Hirao, M. and Nishiyama, M. (2012) Resonanceacoustic microbalance with naked-embeddedquartz (RAMNE-Q) biosensor fabricated by micro-electromechanical-system process. Biosens. Bio-electron. 33, 139–145.
H. OGI [Vol. 89,416
67) Kato, F., Tsurimoto, K., Ogi, H. and Hirao, M.(2013) Application of sandwich assay to resonanceacoustic microbalance with naked-embeddedquartz biosensor for high-selectivity detection ofC-reactive protein. Jpn. J. Appl. Phys. 52,07HD11.
68) Mao, X., Yang, L., Su, X.-L. and Li, Y. (2006) Ananoparticle amplification based quartz crystalmicrobalance DNA sensor for detection of Esche-richia coli O157:H7. Biosens. Bioelectron. 21,1178–1185.
69) Zhu, Z., Su, Y., Li, J., Li, D., Zhang, J., Song, S.,
Zhao, Y., Li, G. and Fan, C. (2009) Highlysensitive electrochemical sensor for mercury(II)ions by using a mercury-specific oligonucleotideprobe and gold nanoparticle-based amplification.Anal. Chem. 81, 7660–7666.
70) Chen, Q., Tang, W., Wang, D., Wu, X., Li, N.and Liu, F. (2010) Amplified QCM-D biosensorfor protein based on aptamer-functionalized goldnanoparticles. Biosens. Bioelectron. 26, 575–579.
(Received July 2, 2013; accepted Sep. 2, 2013)
Profile
Hirotsugu Ogi was born in 1967 in Kyoto, Japan. He received BS and MS degreesfrom Osaka University in mechanical engineering in 1991 and 1993, respectively, andbecame a research associate at Osaka University in 1993. He received his Ph.D. in 1997from Osaka University for the study on electromagnetic acoustic resonance for materialscharacterization. He was invited from National Institute of Standards and Technology inU.S.A. as a guest researcher for fourteen months from July in 1997, where he studied onelastic and anelastic properties of materials. He became an Associate Professor at OsakaUniversity in 2000. He currently studies materials science and bioscience with hisoriginally developed acoustic methods. He was awarded JSPS Prize in 2012 for study onhigh-sensitive acoustic biosensors.
Wireless-electrodeless QCM biosensorsNo. 9] 417