Embed Size (px)
Citation preview

LHCb 2000-003 MUON 14 February 2000
1
Wire Pad Chamber for LHCb Muon System
B.Bochin, A.Kashshuk, V.Lazarev, N.Sagidova, E.Spiridenkov,G.Velichko, An. Vorobiev, A. Vorobyov
Petersburg Nuclear Physics Institute
Abstract
Wire pad chambers (WPC) have been proposed for the outer Region 4 ofthe LHCb Muon System. These are double gap MWPCs with small wire spacingallowing to obtain 99% detection efficiency in a 20 ns time window. Thechambers have a rectangular shape with the vertical dimension from 20 cm inStation 1 to 30 cm in Station 5. The horizontal dimensions will be different withthe maximal size of 3 meters in Station 5. The wires are in the vertical direction.The short wire length allows to use small wire spacing needed for high timeresolution. Also, this helps to obtain the uniform gas gain over the wholechamber area. The WPC has one row of the wire pads formed by grouping wiresin separate readout channels.
Four WPC prototypes have been built at PNPI and tested in the PS beamat CERN. Here we report on the results from these tests. Also, the results ofsimulation of the WPC performance are presented.

LHCb 2000-003 MUON 14 February 2000
2
1. Introduction
According to the LHCb Technical Proposal [1], the Cathode PadChambers (CPC) are considered as the candidates to be used in some areas ofthe Muon System. The first CPC prototype was constructed at PNPI and testedin the PS beam at CERN in November 1998. This was a single gap symmetricmulti-wire proportional chamber with the following geometry parameters:
total gas gap - 5 mm,wire spacing - 2 mm,wire diameter - 25 µm,wire length - 80 cm,sensitive area - 30×80 cm2.
One cathode plane contained pads of various sizes ranged from 1×2 cm2
to 4×8 cm2. The chamber operated with the Ar/CO2/CF4 gas mixture in variouscombinations of the components. The front-end electronics was designed and produced at PNPI. Eachchannel contained a preamplifier followed by an amplifier-shaper. There weretwo outputs from each channel: “fast” with a 10 ns peaking time and “slow”with a 20 ns peaking time of the shaped signal. The fast signal was sent to aleading edge discriminator and then to a TDC. The slow signal was sent to agated-ADC integrating the charge in a preset gate .
The results obtained with the pad sizes up to 32 cm2 were encouraging:the time resolution was around 5 ns (r.m.s.) with ≈ 99% registration efficiency ina 25 ns time window. The chamber could operate with high rate beams (105
particles/s·cm2). These results showed that with two planes of the CPCs onecould obtain the registration efficiency ns time window which isthe main requirement of the LHCb experiment.
The outer region (Region 4) of the LHCb Muon System contains padswith much larger sizes: from 4×20 cm2 in Station 1 (M1) to 25×30 cm2 in Station5 (M5). The larger capacitances of these pads lead to deterioration of the timeresolution. Therefore, the TP suggested subdivision of such pads into severalpads of smaller sizes thus increasing considerably the number of the front-endchannels. The described below Wire Pad Chamber (WPC) was proposed with thegoal to improve further the time resolution and efficiency of the chamber so itcould operate with pads of larger sizes. Another goal was to make the chamberdesign as simple as possible with high redundancy and low cost so it could beused in Region 4 of all Stations (M1÷M5). The first prototype WPC –1 was
LHCb 2000-003 MUON 14 February 2000
3
designed and constructed at PNPI and tested in the PS beam T11 at CERN inApril/May 1999. These tests were continued in October/November 1999 withthree new prototypes: WPC-1M, WPC-2, and WPC-3. Here we present theresults obtained in these tests.
2. WPC design
If compared with the first CPC prototype, the design of the WPCprototypes contained some new features. Two gas gaps (5 mm each) and asmaller wire spacing (1.5 mm) should provide better efficiency and timeresolution. The signals are taken from the wires that improves the signal-to-noise ratio thus allowing to work with larger pad sizes. The chambers have arectangular shape with the sensitive area of 16×150 cm2 (WPC-1 and WPC-3)and 16×24 cm2 (WPC-1M and WPC-2). The wires are wound along the shortside and grouped together to provide pads of various width with the constantlength of 16 cm.
The short wire length has important advantages: it allows to reduce thewire spacing without introducing the additional wire support structure. Also, itbecomes much easier to provide the constant gas gap along the wire length thatresults in high uniformity of the gas gain over the whole chamber surface.
Fig.1 shows a schematic view of the WPC prototypes. All the cathodesare made of 15 mm thick honeycomb panels with 1mm thick copper claddedFR4 plates glued to both sides of the panels. Such panels are industriallyproduced for the CMS Muon End Cap chambers, and the panels used to buildthe WPC prototypes were provided by the US/CMS collaboration. The anodewires of 30 µm in diameter were wound around the central cathode panel over2.5 mm spacers glued along both sides of the panel. The continuous winding wasperformed using a winding machine that provided a permanent wire tension(30 g) and quite precise wire spacing (1500±40 µm) along the whole length ofthe chamber (1.5 m). The wire spacing precision was further improved to±15 µm by placing temporary a high precision comb over the wires before theywere glued with epoxy to the spacers. After that, all the wires were soldered tothe strips on the anode bar placed at one edge of the panel. The length of thewire strips determined the size of the wire pads. The wires were cut at the endsof the strips.
Fig.2 shows the configuration of the wire pads in WPC-1 (pads A1-8, B1-8,C1-8, D1-8, E1-4) . The pad size varies from 1×16 cm2 to 8×16 cm2. Note that thepad sizes of 4×16 cm2 and 8×16 cm2 are most interesting for Region 4 of the

LHCb 2000-003 MUON 14 February 2000
4
Muon System. One side of each wire pad was connected to a common HV busthrough a 2MΩ resistor. The other side of each pad was connected through a1000 pF decoupling capacitor and a diode protection circuit to a preamplifier.All cathode planes were grounded in the WPC-1 prototype. The external plateswere also grounded providing additional shielding of the chamber. The design ofWPC-1M was identical. The difference was in the length of the chamber. WPC-1M contained only two 4×16 cm2 and two 8×16 cm2 wire pads (Fig.3).
The prototype WPC-2 contained four 2×16 cm2 and four 4×16 cm2 wirepads. In addition, the surface of the two cathode planes on external panels wassubdivided into cathode pads as shown in Fig.4. There were two rows of pads(CiA and CiB) that could be readout from both sides of the chamber. Each twoopposite pads from the two cathode planes were joined together into one readoutchannel. Such cathode pad structure is assumed to be in Region 3 of the MuonSystem. The prototype WPC-2 was designed specially for comparative study ofthe chamber performance in both WPC and CPC modes.
The prototype WPC-3 had the same sensitive area and wire pad structureas WPC-1. However, in addition to the wire pads, it contained also 1×150 cm2
strips on the external cathode panels, the opposite strips being joined togetherinto one readout channel.
All four prototypes contained similar wire pads, so they all could be usedto study the chamber performance in the WPC mode. In this report, we consideronly the results obtained with the wire pads, thus limiting ourselves byconsideration just Region 4 in Stations M1÷M5. Note, however, that this regioncovers 75% of the whole area of the Muon System.
3. Electronics
The WPC prototypes were equipped with the front-end electronics thatwas used in the previous tests of CPC-1. This electronics, based on discreteelements, was designed and constructed at PNPI. The WPC-2 prototype allowedalso the replacement the PNPI FE electronics by the FE electronics based on theSONY-chip [2] in both the cathode and the anode channels. This made itpossible to perform a comparison of these two types of FE electronics. Theresults will be presented in a separate report. As it was mentioned above, eachchannel of the PNPI FE electronics contained a fast (F) and a slow (S) outputs.The signal shaping was optimised for detection of the chamber current with thefollowing time dependence:
LHCb 2000-003 MUON 14 February 2000
5
0
0)(
tt
QtI
+∝ (1)
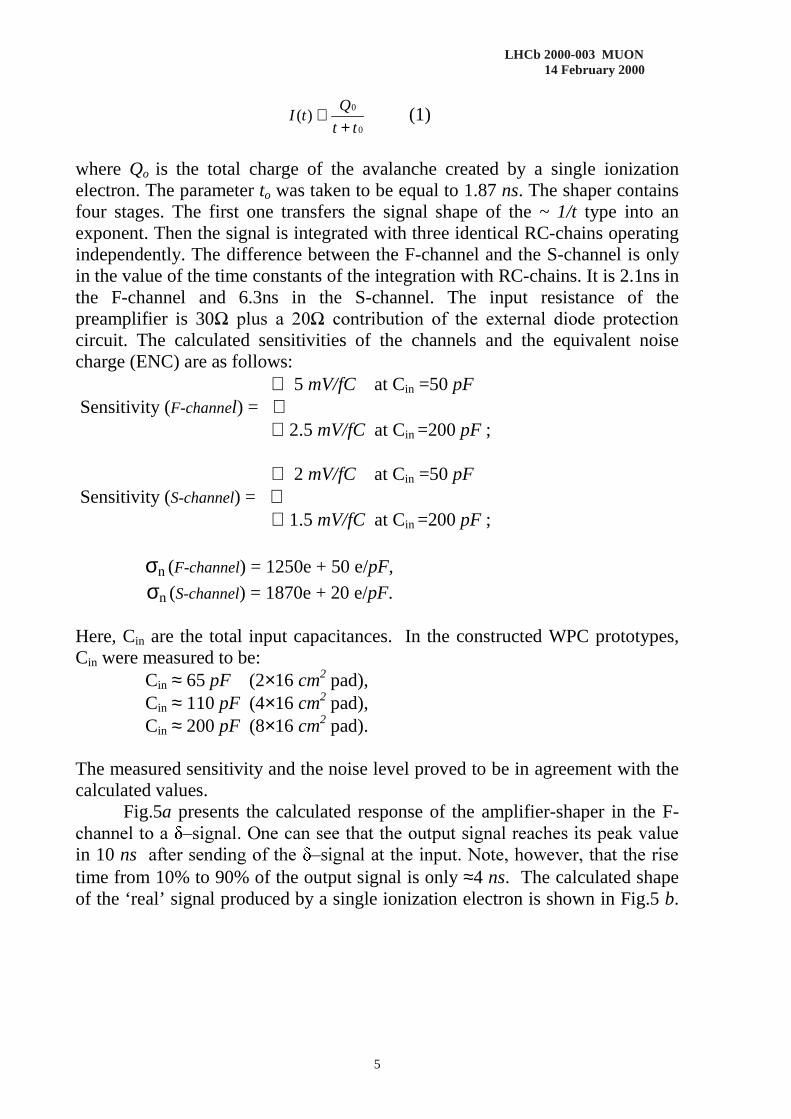
where Qo is the total charge of the avalanche created by a single ionizationelectron. The parameter to was taken to be equal to 1.87 ns. The shaper containsfour stages. The first one transfers the signal shape of the ~ 1/t type into anexponent. Then the signal is integrated with three identical RC-chains operatingindependently. The difference between the F-channel and the S-channel is onlyin the value of the time constants of the integration with RC-chains. It is 2.1ns inthe F-channel and 6.3ns in the S-channel. The input resistance of thepreamplifier is 30 circuit. The calculated sensitivities of the channels and the equivalent noisecharge (ENC) are as follows: 5 mV/fC at Cin =50 pF Sensitivity (F-channel) = 2.5 mV/fC at Cin =200 pF ;
2 mV/fC at Cin =50 pF Sensitivity (S-channel) = 1.5 mV/fC at Cin =200 pF ;
σn (F-channel) = 1250e + 50 e/pF,
σn (S-channel) = 1870e + 20 e/pF.
Here, Cin are the total input capacitances. In the constructed WPC prototypes,Cin were measured to be: Cin ≈ 65 pF (2×16 cm2 pad), Cin ≈ 110 pF (4×16 cm2 pad), Cin ≈ 200 pF (8×16 cm2 pad).
The measured sensitivity and the noise level proved to be in agreement with thecalculated values.
Fig.5a presents the calculated response of the amplifier-shaper in the F- in 10 ns ! time from 10% to 90% of the output signal is only ≈4 ns. The calculated shapeof the ‘real’ signal produced by a single ionization electron is shown in Fig.5 b.

LHCb 2000-003 MUON 14 February 2000
6
In this case the amplitude of the output signal is reduced by a factor of ≈10 andthe peak time is increased up to 15 ns with the rise time about 7 ns.
4. Simulation of WPC performance
Simulation of the WPC performance has been done using the programdeveloped at PNPI. Some details of the simulation program can be found in theLHCb Note [3] describing performance of the Micro-Cathode-Strip chambers(MCSC) which has much in common with the WPC in the part concerning thetime resolution of the chamber. Here we present only some concluding results ofthe WPC simulation.
Fig.6 presents the electric field map in WPC. It was assumed that thechamber is filled with the Ar(60%)+CO2(30%)+ CF4(10%) gas mixture with thehigh voltage HV=2700V. At this high voltage the gas gain is expected to be1.2×105 according to the previous measurements with this gas mixture (seechapter 5.3).
The simulation program starts with the distribution of the ionizationelectrons along the particle trajectory, then it considers the drift of the ionizationelectrons towards the anode wires taking into account the diffusion and theattachment of the ionization electrons to electro-negative gases (CF4 in ourcase). Then it calculates the avalanches produced by the ionization electrons.Finally, it calculates the time development of the charges induced on the cathodepads and on the anode wires and provides the signals at the outputs of thereadout channels. The signal shaping and the amplification in the readoutchannels were adjusted as in the real readout electronics in our measurements. Itwas accepted that the noise level in the fast channel was 4 mV (r.m.s.) and theinput resistance was 40 Ω. Note that in this analysis the double gap WPC wasconsidered as two independent single gap chambers with well controllable wirestaggering of one chamber with respect to another. The time distributions of thesignals exceeding a preset threshold in each chamber were calculated, and theoverall time distribution was determined as a convolution of the two spectra.Then the detection efficiency was found in various time windows: 25 ns, 20 ns,and 15 ns.
The calculation were performed for 9 GeV/c pions entering the chamberperpendicular to its surface with a variable coordinate Y along the axis in thewire plane perpendicular to the wire direction. The calculated mean number ofthe ionization electrons along the pion track in the 5mm gap was 47.3. Theelectric field in the drift space is about 7 kV/cm (Fig.6). This corresponds to the
LHCb 2000-003 MUON 14 February 2000
7
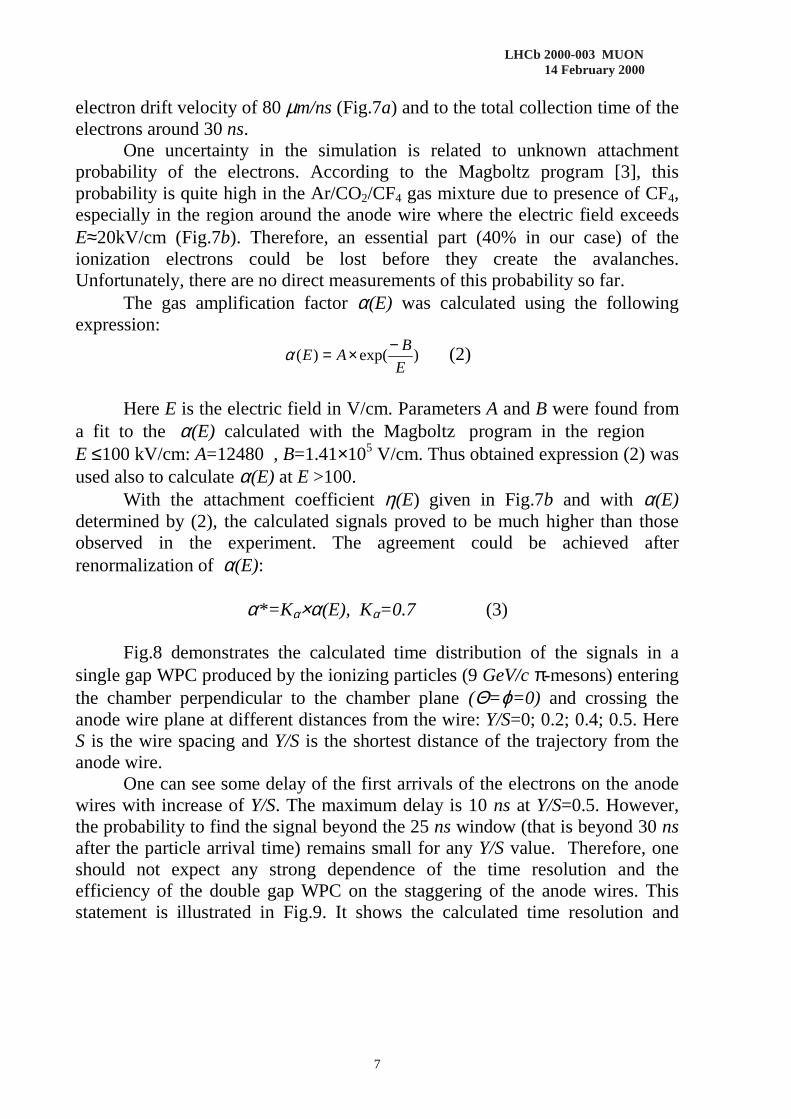
electron drift velocity of 80 µm/ns (Fig.7a) and to the total collection time of theelectrons around 30 ns.
One uncertainty in the simulation is related to unknown attachmentprobability of the electrons. According to the Magboltz program [3], thisprobability is quite high in the Ar/CO2/CF4 gas mixture due to presence of CF4,especially in the region around the anode wire where the electric field exceedsE≈20kV/cm (Fig.7b). Therefore, an essential part (40% in our case) of theionization electrons could be lost before they create the avalanches.Unfortunately, there are no direct measurements of this probability so far.
The gas amplification factor α(E) was calculated using the followingexpression:
)exp()(E
BAE
−×=α (2)
Here E is the electric field in V/cm. Parameters A and B were found froma fit to the α(E) calculated with the Magboltz program in the regionE ≤100 kV/cm: A=12480 , B=1.41×10⁵ V/cm. Thus obtained expression (2) wasused also to calculate α(E) at E >100.
With the attachment coefficient η(E) given in Fig.7b and with α(E)determined by (2), the calculated signals proved to be much higher than thoseobserved in the experiment. The agreement could be achieved afterrenormalization of α(E):
α*=Kα×α(E), Kα=0.7 (3)
Fig.8 demonstrates the calculated time distribution of the signals in asingle gap WPC produced by the ionizing particles (9 GeV/c π-mesons) enteringthe chamber perpendicular to the chamber plane (Θ=ϕ=0) and crossing theanode wire plane at different distances from the wire: Y/S=0; 0.2; 0.4; 0.5. HereS is the wire spacing and Y/S is the shortest distance of the trajectory from theanode wire.
One can see some delay of the first arrivals of the electrons on the anodewires with increase of Y/S. The maximum delay is 10 ns at Y/S=0.5. However,the probability to find the signal beyond the 25 ns window (that is beyond 30 nsafter the particle arrival time) remains small for any Y/S value. Therefore, oneshould not expect any strong dependence of the time resolution and theefficiency of the double gap WPC on the staggering of the anode wires. Thisstatement is illustrated in Fig.9. It shows the calculated time resolution and

LHCb 2000-003 MUON 14 February 2000
8
inefficiency of the double gap WPC for various staggering of the anode wireplanes. Such small dependence of the double gap WPC behavior on thestaggering of the anode wire planes is a valuable feature of this chamber.Otherwise, it would be difficult to keep the proper staggering in the all areas ofthe Muon System with different inclinations of the incoming particles.
Fig.9 shows also the dependence of the time resolution and efficiency onthe discriminator thresholds. Decreasing of the threshold from 30 mV to 20 mVleads to a noticeable improvement of the WPC performance. Note, that the20 mV threshold proved to be achievable in the real conditions of the beam testseven in the presence of some pickup noise in the experimental area.
Fig.10 presents the calculated WPC inefficiency in various time windowsfor staggering δ/S=0.5. As it follows from these calculations one can reach99.8%, 99.3%, and 97% efficiency in the time windows 25 ns, 20 ns, and 15 ns,respectively, with the double gap WPC operating with the gas gain of 1.2×10⁵.
5. Beam tests
5.1 Experimental setup
All the WPC prototypes have been tested at CERN in a 3 GeV/c negativepion beam at PS.
The layout of the experiment is shown in Fig.11. Beam particles weredetected with two scintillator counters: S1 (15cmx15cm) and S2 (20cmx20cm).The coincidence between these two counters in a 10 ns window provided atrigger signal:
TR1 = S1& S2
The constant-fraction discriminators (CFD) was used in both S1 and S2channels helping to reduce the time jitter of the trigger signal down to ≤1ns. Thebeam particles were detected also by two planes (H-horizontal and V-vertical) ofthe hodoscope counters, each plane containing 8 counters (1cm×8cm). Thefollowing information was registered by the acquisition system:
• Time arrivals and amplitudes of the signals from S1 and S2 measured withTDCs and ADCs;
• Time arrivals of the signals from all hodoscope counters measured withTDCs;
• Time arrivals of the signals from the WPC F-channels;

LHCb 2000-003 MUON 14 February 2000
9
• Integrated current signals from the WPC S-channels.
The signals from the WPC F-channels were sent to leading edgediscriminators (Le Croy 4416B) with adjusted thresholds, and the output signalsfrom the discriminators were registered with 16-bit TDCs (Le Croy 1176). Thecommon stop TDCs were stopped by TR1 signal and allowed to measure thetime intervals of 64 µs before the stop. The 14-bit ADCs (Le Croy 1182) gatedby the TR1 signal integrated the current signal in the 80 ns time window.
In addition, there was ungated data from the scalers detecting signals from allscintillator counters and from the WPC F-channels. The scalers provided twotypes of information: the total number of counts during the beam spill and thenumber of counts during a 1 sec interval in-between the beam spills. The beamspill was around 330 ms.
5.2 Off-line event selection
The main results of the data analysis are the ADC and TDC spectra of thesignals from the WPC S-channels and F-channels, respectively. The events wereselected after several cuts applied to the raw data from the beam definingscintillator counters and the hodoscope:
• Cut1. Shower rejection.- Large amplitudes in the ADC spectra from the S1 and S2 counterswere rejected. The pile-ups of two and more particles in a 20 ns timewindow were rejected in this way. Typically, about 10% of the eventswere rejected by this cut. The remaining events were considered asTR2-events.
• Cut2. Hodoscope selection.- Only signals in a 20ns time window in the TDC spectra wereselected.- There should be one and only one signal both in the H-plane and inthe V-plane of the Hodoscope. This helps to kill further the showers inthe beam.- A certain combination of the hodoscope counters could be selectedto define a beam spot.
The events passing Cut1 and Cut2 were considered as TR3-events. Nocuts have been applied to the signals from WPC.

LHCb 2000-003 MUON 14 February 2000
10
The number of the TR3-events was used in calculations of the efficienciesin the WPC S-channel and F-channel:
∑
∑==
3300
)(
TR
overflow
iN
Eff
ADCi
ADC (5)
∑
∑∆+
=3
1
1)(
TR
tt
tN
Eff
TDCi
TDC (6)
As an example, Fig.12 shows the ADC and TDC spectra of the signalsfrom a wire pad (W3 of 4×16 cm2 size) of the WPC-2 prototype. Themeasurements have been performed with the Ar(40%)+CO2(45%)+ CF4(15%)gas mixture at HV=3.15 kV corresponding to the gas gain of 2⋅105. The beamspot was selected to be inside the W3 pad. The pedestal in the ADC spectrum ispositioned in the channel 250 with a spread of 12 channels (r.m.s.) caused by theelectronics noise. The empty space in the region below the channel 500demonstrates high efficiency in the ADC-channel. Quantitatively, EffADC=99.9%
The time resolution in the TDC channel was found to be 2.9 ns (r.m.s.)with the efficiency of 99.8%, 99.7%, and 98.8% in the time windows of 25 ns,20 ns, and 15 ns, respectively. These results are in agreement with predictionsfollowed from our simulation studies.
5.3 Gas gain calibration
The absolute gas gain was measured by an ATLAS group at BNL with awire chamber having the same wire diameter, da=30µm, as in our WPC. Theyused an Ar(60%)+CO2(30%)+ CF4(10%) gas mixture and obtained the gas gainof 1.2×10⁵ at the electric field on the anode wire surface Ea=225kV/cm.
Note that the gas gain (G) is defined here as the ratio of the total chargeQtot collected by the anode wire to the total number of ionization electrons Qi
created by the incident particles:
i
tot
Q
QG = (7)

LHCb 2000-003 MUON 14 February 2000
11
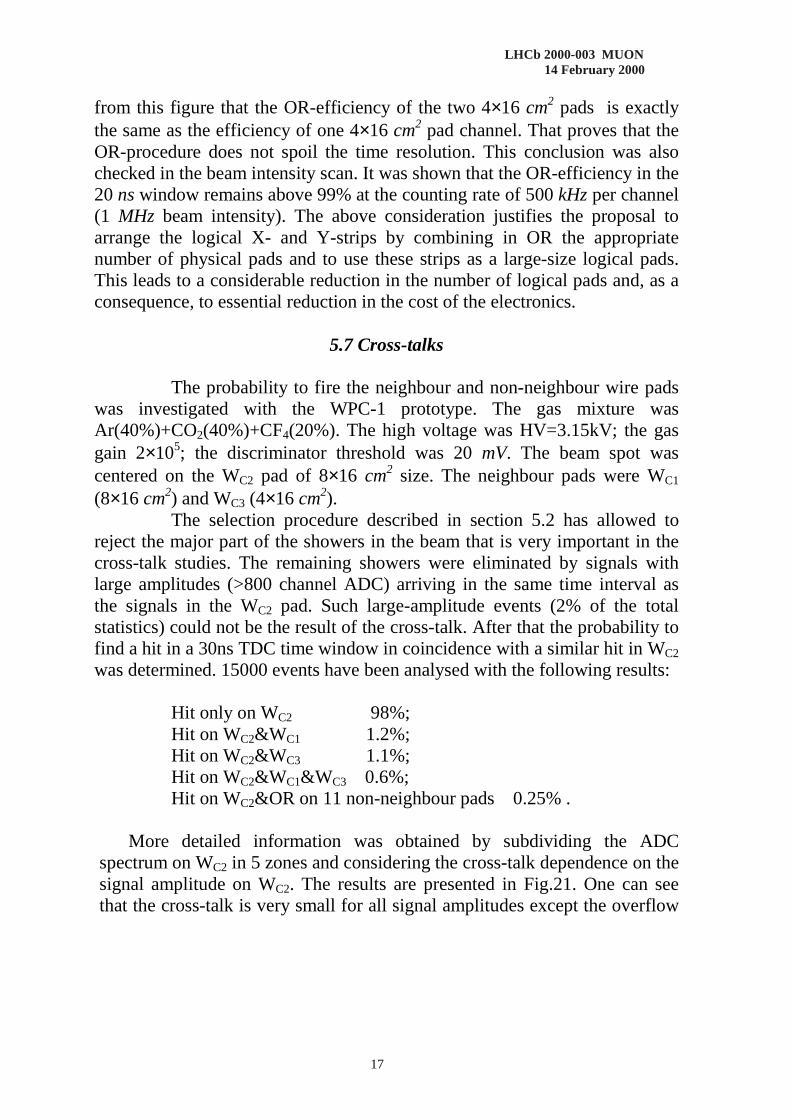
This definition ignores the fact that some part of the ionization electronsmay disappear due to attachment to the electronegative molecules withoutproducing the avalanches. To be comparable with the BNL results, weperformed measurements with the same gas mixture. The similar electric fieldon the anode wire surface Ea=225kV/cm is reached in WPC at HV=2.7kV(Fig.6). Therefore, the gas gain of 1.2×10⁵ is expected at HV=2.7kV in WPCfilled with the BNL gas mixture. Fig.13 shows the HV dependence of the meancharge determined from the ADC spectra (ADC_mean) for various wire pads.One can see from this figure that at HV=2.7kV the ADC_mean is aroundchannel 1000 for 2x16 cm2 and 4×16 cm2 pads and around channel 900 for thelargest pad of 8×16 cm2 size. We used these values for normalization of the gasgains measured with other gas mixtures.
5.4 Gas gain in various gas mixtures
The Ar/CO2/CF4 gas mixture is considered at present as the best choicefor the wire cathode strip chambers used in the CMS and ATLAS MuonSystems. This mixture provides fast collection of the ionization electrons (due toCO2 and CF4), very good ageing properties (due to CF4), and relatively low highvoltage (due to Ar). All these features are attractive also for application of thisgas mixture in the LHCb muon chambers where the time resolution and theageing properties are of primary importance. We have studied the Ar/CO2/CF4
gas mixtures with the goal to find the ratio of the components optimal for theLHCb muon chambers.
Fig.14 presents the HV-dependence of the measured gas gain in variousAr/CO2/CF4 gas mixtures. One can see that the gas gain depends strongly on theamount of Ar but it is not so sensitive to the replacement of CO2 by CF4. Withincrease of the high voltage, the gas gain is increasing up to a maximum valuearound 4×10⁵ (nearly the same in all studied gas mixtures) where the sparks anddark current start to appear.
We investigated also the gas mixture with CF4 replaced by C2H2F4
(freon). This freon is widely used now in RPCs and other devices showing highstability against sparking. The results are presented in Fig.15 demonstrating thecurrent produced by the beam in WPC as function of the high voltage. Note thatthe current around 1µA corresponds to the gas gain of 2×10⁵. One can see fromFig.15 that the gas gain as high as 106 can be reached with theAr(40%)+CO2(45%)+ C2H2F4(15%) gas mixture. The chamber shows stableoperation up to HV=3.6kV. The trips have been observed only at HV=3.7kV

LHCb 2000-003 MUON 14 February 2000
12
with immediate recovery after the trip. This allows, for example, to operateWPC with the gas gain up to 4×10⁵ (HV=3.4kV) with a sufficient plateau beforethe instability region. Such regime might be recommended for Region 4 of theMuon System where the ageing limitations could allow WPC operation withsuch gas gains.
Comparison of the ADC spectra showed that the replacement of 15% CF4
by 15% of C2H2F4 reduces the pulse height by a factor of 1.7. To restore thepulse height one should increase HV by ≈100V (see Table 3).
5.5 Time resolution
The high time resolution of the muon chambers is one of the mainrequirements of the LHCb experiment. In fact, it is required that the detectionefficiency of each Muon station should be ≥ 99% in the 20 ns time window.Assuming that each station contains two layers of the muon chambers, thisrequirement could be well satisfied if each layer provides ≥ 95% efficiency inthe 20 ns time window. In terms of the time resolution of the muon chambersthis means that the r.m.s. of the time distributions should be less than 5 ns.
In order to select the gas mixture, we compared the time resolutionsmeasured with various Ar/CO2/CF4 gas mixtures in identical conditions: thesame beam focused on the same pad at the same gas gain. The results arepresented in Table 2. The measurements were performed at the gas gain of1.2×105 with a 4×16 cm2 pad size. The beam was perpendicular to the chamberplane.
Table2.Time resolution of WPC with various Ar/CO2/CF4 gas mixtures.WPC-1 prototype.The wire pad size is 4×16cm2. Data corresponds to the same gas gain of1.2×105.
Time resolution, r.m.s.Gas mixtureAr/CO2/CF4 (ns)
40/40/2040/45/1540/50/1040/55/5
3.043.073.203.27
60/30/10 3.49
30/60/10 3.13

LHCb 2000-003 MUON 14 February 2000
13
The comparison shows that the time resolution with the gas mixturecontaining 60% of Ar is noticeable worse (by 0.4 ns). The time resolution withthe other gas mixtures is not much different, though with some preference to thelarger CF4 concentration. The disadvantage of the 30/60/10 gas mixture is thehigher voltage required to get the same gas gain. So our choice was theAr(40%)+CF4(x) +CO2(60%-x) gas mixture where x=10, 15, or 20%.
We made also comparison of the time resolution obtained with theAr(40%)+CO2(45%)+C2H2F4(15%) and Ar(40%)+CO2(45%)+CF4(15%) gasmixtures. The measurements have been performed with the larger pad size of8×16 cm2. Table 3 demonstrates the results of this comparison. One can see thatthe time resolution of WPC is the same (or slightly better) when CF4 is replacedby C2H2F4 and HV is increased by ~100V to restore the signal amplitude.However, the chamber can operate in this case at much higher HV withconsiderably improved time resolution (see also Fig.16). As an example, Fig.17demonstrates the ADC and TDC spectra measured with the WPC-1M prototypeat HV=3.45 kV. One can see that the time resolution becomes better than 3 ns(r.m.s.) even operating with the large pads of 8×16 size. This considerationshows a clear advantage of the freon containing gas mixture, especially if theexperimental conditions allow the chamber operation at high gas gains in theregion of 4×10⁵ .
Fig. 18 presents the time resolution and the time walk in function of thesignal amplitude. For this purpose, the ADC spectrum similar to that shown inFig. 12 was subdivided in 5 zones. The time resolution (TDC_r.m.s.) and thepeak position in the TDC spectrum (TDC_ mean) were determined for eachzone.
One can see that the time resolution is saturated on a level of r.m.s.=2.8 nsat the signal amplitudes ≥ 1500ch ADC. The essential deterioration of the timeresolution (r.m.s = 3.8 ns) is observed only in zone 1 (500≤ Q ≤ 1000ch).However, this zone contains only 5% of the ADC spectrum. The total time walkis 6 ns (TDC_ mean), but the time walk in the most populated regions 2, 3, and 4(85% of the events) is only 2 ns.
Our simulation studies showed that the time resolution of the double gapWPC should not depend strongly on the wire planes staggering and thus on thebeam inclination. The experiment showed that this expectation is correct.
Fig. 19a presents the measured HV-dependence of the time resolution(r.m.s.) for various θ-angles (θ=0°, 100 mrad, and 200 mrad). Here θ is the

LHCb 2000-003 MUON 14 February 2000
14
chamber rotation angle around the wire direction. One can see that the timeresolution proved to be practically independent on the θ-angle in the measuredθ-range.
Table 3.Time resolution of WPC with Ar(40%)+CO2(45%)+ CF4(15%) andAr(40%)+CO2(45%)+ C2H2F4(15%) gas mixtures.The measurements were performed with a 8×16cm2 wire pad.
Ar(40%)+CO2(45%)+ CF4(15%)
HV(kV)
3.05 3.1 3.15 3.20 3.25 3.3
ADCmean(ch.)
1190 1430 1720* 2075 2425
TDCr.m.s.(ns)
5.0 4.33 3.95 3.5 3.3
Ar(40%)+CO2(45%)+ C2H2F4(15%)
HV(kV)
3.15 3.20 3.25 3.30 3.35 3.4 3.45 3.5 3.55 3.60 3.65
ADCmean(ch.)
1217 1394 1654 1959 2343**2621
**2903
**3210
over Over
TDCr.m.s.(ns)
4.73 4.32 3.93 3.48 3.22 3.16 2.9 2.8
*) This “ADC_mean” corresponds to the gas gain of 2×10⁵;**) The numbers are underestimated due to ADC overflow (>4000 ch).The shaded areas correspond to the end of the regions of the WPC stableoperation.

LHCb 2000-003 MUON 14 February 2000
15
5.6 Detection efficiency
Fig.19b shows the HV-dependence of the detection efficiency in a 25 nswindow in the TDC spectra measured with the WPC-1 prototype at various θ-angles. The measurements were performed with the Ar(40%) + CO2 (50%) +CF4(10%) gas mixture. The wire pad size was 4×16 cm2, the discriminatorthreshold was set at 20 mV. The particles were selected with the hodoscope tobe inside the pad size. One can see that the efficiency is close to 100% with the plateau fromHV=3.0 kV (θ = 0°) or from HV=2.95 kV (θ = 100 mrad and 200 mrad) toHV=3.25 kV. Note that the gas gain is 1×10⁵ at HV=3.0 kV and 2×10⁵ atHV=3.15 kV. Comparison with Fig.19a shows strong correlation between thetime resolution and the efficiency: the efficiency in a 25 ns window becomesbetter than 99% when r.m.s.≤5 ns. Table 4 presents the results of the measurements of the detectionefficiency for high beam intensities. It is expected that the LHCb muonchambers should operate at high counting rates up to 300 kHz per channel.
Table 4. WPC efficiency measured at various beam intensities.EffTDC/ EffADCCounting
rate perchannel EffADC 30 ns 25 ns 20 ns 15 ns
κΗz % % % % %
54 99.68 99.9 99.85 99.8 98.5
117 99.52 100.0 99.95 99.95 99.0
255 99.54 99.93 99.83 99.6 98.5
365 99.43 99.95 99.95 99.9 98.5
420 99.42 99.8 99.7 99.6 98.0
510 99.46 99.8 99.8 99.6 97.5
700 98.22 99.75 99.7 99.6 97.9

LHCb 2000-003 MUON 14 February 2000
16
The measurements were performed with the WPC-1 prototype with the Ar(40%)+CO2(40%)+CF4(20%) gas mixture. The high voltage was HV=3.15 kVcorresponding to the gas gain of 2⋅105. The wire pad size was 4×16 cm2. Thebeam spot was selected by hodoscope to be inside the pad size. The beamdensity was varied from 4.5 kHz/cm2 to 100 kHz/cm2. At the same time the beamintensity (S1&S2 coincidences) was varied from 84 kHz to 1.1 MHz and thecounting rate in the pad channel was varied from 54 kHz to 700 kHz.
The EffADC was determined according to eq. (5). In spite of the hodoscopeselection, approximately 1% of the particles were detected by the neighbor pads,and they were subtracted from the number of TR3-events when calculating theEffADC. To exclude the influence of the missing particles, the EffTDC wascalculated as the ratio of the number of the events in the TDC window (30 ns, 25ns, 20 ns, or 15 ns) to that detected in the ADC channel (>350ch). One can seefrom Table 4 that the EffTDC in 20 ns window remains higher than 99.5% even atthe highest beam intensity. However, we should note here that thus obtained efficiency may beoverestimated as the dead time introduced by the signal width in the WPC F-channel can be shadowed by a 80 ns dead time in the TR1 circuit.
5.7 OR-signal efficiency
The maximal size of the physical pad is determined by two factors. One isthe pad capacitance value that deteriorates the time resolution. The other oneis maximal admittable occupancy per pad. The effect of large capacitance isillustrated by Fig.20 showing EffTDC in a 25 ns window vs high voltagemeasured with two different pad sizes - 4×16 cm2 and 8×16 cm2. One can seethat the plateau for the 8×16 cm2 pad is reduced by ≈100V that is notacceptable if we do not want to operate the chamber with the gas gainexceeding 2×10⁵. However, one can separate the large pad into two or moresmaller pads with separate FE electronics and join them by a logical OR afterthe discriminators. We have tested this procedure with the goal to see theresulted time resolution and efficiency. The experiment was performed withthe WPC-1M prototype. The beam was centered in-between the W3 and W4pads with the sizes of 4×16 cm2 each. The gas mixture wasAr(40%)+CO2(45%)+CF4(15%). The signals from the outputs of thediscriminators in the W3 and W4 were ORed and sent to a TDC. Themeasured efficiency in the 25 ns window is presented in Fig.20. One can see
LHCb 2000-003 MUON 14 February 2000
17
from this figure that the OR-efficiency of the two 4×16 cm2 pads is exactlythe same as the efficiency of one 4×16 cm2 pad channel. That proves that theOR-procedure does not spoil the time resolution. This conclusion was alsochecked in the beam intensity scan. It was shown that the OR-efficiency in the20 ns window remains above 99% at the counting rate of 500 kHz per channel(1 MHz beam intensity). The above consideration justifies the proposal toarrange the logical X- and Y-strips by combining in OR the appropriatenumber of physical pads and to use these strips as a large-size logical pads.This leads to a considerable reduction in the number of logical pads and, as aconsequence, to essential reduction in the cost of the electronics.
5.7 Cross-talks
The probability to fire the neighbour and non-neighbour wire padswas investigated with the WPC-1 prototype. The gas mixture wasAr(40%)+CO2(40%)+CF4(20%). The high voltage was HV=3.15kV; the gasgain 2×10⁵; the discriminator threshold was 20 mV. The beam spot wascentered on the WC2 pad of 8×16 cm2 size. The neighbour pads were WC1
(8×16 cm2) and WC3 (4×16 cm2).The selection procedure described in section 5.2 has allowed to
reject the major part of the showers in the beam that is very important in thecross-talk studies. The remaining showers were eliminated by signals withlarge amplitudes (>800 channel ADC) arriving in the same time interval asthe signals in the WC2 pad. Such large-amplitude events (2% of the totalstatistics) could not be the result of the cross-talk. After that the probability tofind a hit in a 30ns TDC time window in coincidence with a similar hit in WC2
was determined. 15000 events have been analysed with the following results:
Hit only on WC2 98%;Hit on WC2&WC1 1.2%;Hit on WC2&WC3 1.1%;Hit on WC2&WC1&WC3 0.6%;Hit on WC2&OR on 11 non-neighbour pads 0.25% .
More detailed information was obtained by subdividing the ADCspectrum on WC2 in 5 zones and considering the cross-talk dependence on thesignal amplitude on WC2. The results are presented in Fig.21. One can seethat the cross-talk is very small for all signal amplitudes except the overflow

LHCb 2000-003 MUON 14 February 2000
18
zone 5. It did not exceed 0.1% even on neighbour pads. But it is about 10%for the overflow signals, most of the cross-talk signals on WC1 and WC2 beingstrongly correlated. Such behaviour is explained in Fig.21. It shows theobserved shifts of the pedestals on the pads in coincidence with the signalson WC2. One can see that the shift is maximal on the neighbour pads and it isproportional to the signal amplitude on WC2.This shift is explained by thepad-to-pad capacitance coupling. At some signal level on WC2 , the shift isapproaching the discriminator threshold, thus producing the cross-talk signal.This picture agrees with direct observation of the signals in the scopeshowing that the amplitude of the cross-talk signal on the neighbour pad isaround 2% of the signal amplitude on the fired pad. Anyhow, the total cross-talk is quite small as it was expected for such design of the chamber.
6. Ageing
Detailed ageing studies of the wire chambers with the Ar/CO2/CF4 gasmixture have been performed at PNPI in the frame-work of the CMS End CapMuon System programme [4]. One should stress that the WPC/CPC chambersare made precisely from the same materials as the CMS chambers and use thesame gas mixture. Therefore, the results obtained for the CMS chambers aredirectly applicable to the WPC/CPC chambers proposed for the LHCb MuonSystem. These tests showed that with the gas mixtures Ar/CO2/CF4 in therelative proportions 30/50/20 as well as 40/50/10 the deterioration of thechamber performance (gas gain and the dark currents) was not obseved up to theaccumulated charges of 13 C/cm wire.
The global irradiation tests of the CMS chambers have been started lastyear at GIF facility at CERN. So far only a modest charge has been a collected(0.2 C/cm wire), but the tests will be continued in March/April 2000. Allowing alimit for the accumulated charge of 1 C/cm wire, one can calculate that theWPC/CPC chambers with the Ar/CO2/CF4 gas mixture operating at the gas gainof ≈2×10⁵ satisfy the ageing requirement over the whole Muon System acceptregion 1 and region 2 in Station M1. As concerns Regions 3 and 4 , the gas gaincould be considerably increased in these stations. Therefore, the Ar/CO2/C2H2F4
gas mixture seems very attractive as it allows safe WPC operation at high gasgains. Unfortunately, the ageing properties of this gas mixture are unknown atpresent. We are planning to perform the local ageing tests at PNPI with theAr/CO2/C2H2F4 gas mixtures using a WPC prototype. These tests will be started

LHCb 2000-003 MUON 14 February 2000
19
in March 2000. Also, global ageing tests of the WPC filled with theAr/CO2/C2H2F4 gas mixture are planned to be performed at GIF in March/April2000 in parallel with the CMS tests. These tests will show whether theAr/CO2/C2H2F4 gas mixture could be used only in the outer regions of the MuonSystem or it can be used also in the inner regions (with smaller gas gains)providing much larger plateau and thus increasing the redundancy of the MuonSystem.
7. Construction and cost
The WPC chambers are designed to make their construction as simple aspossible. The wires are wound along the short side of the chamber that make itpossible to use the small wire spacing (1.5mm) needed for good time resolutionwithout additional wire support structure. There is no severe requirement to theflatness of the cathode plane to be produced in industry.
The cost of materials in the double gap WPCs is estimated to be around1000 CHF per 1 m2 of chambers. The WPCs are proposed to be used in region 4of all Muon stations covering 75% of the total area of the Muon System, that isabout 325 m2. With two layers in each station, this gives 650 m2. The chambersizes will vary from 20×190 cm2 in station M1 to 30×300 cm2 in station M5.Each station will contain 96 chambers per layer. In total, there will be 960chambers in Region 4 of the whole Muon System.
The two layer structure of the Muon stations allows to arrange a simpleoverlapping in both X and Y directions leaving no dead zones in the whole area.The design of the CPCs in Region 3 being very similar with to the WPC design,there will be no problem in overlapping Region 3 and Region 4.
8. Conclusions
Four WPC prototypes have been constructed at PNPI and tested in the PSbeam at CERN. The performance of these prototypes proved to be in agreementwith the expectations followed from the simulation study. Most of themeasurements were performed with the Ar/CO2/CF4 gas mixture which providesfast collection of the ionization electrons and has very good ageing properties.Also, a new Ar/CO2/C2H2F4 gas mixture has been tested with remarkable results:this mixture proved to be as fast as the Ar/CO2/CF4 mixture. However, it ismuch more stable against discharges that allowed to extend the plateau byadditional 300 V and to operate the chamber with the gas gains up to 4×10⁵. The

LHCb 2000-003 MUON 14 February 2000
20
ageing properties of this new gas mixture will be studied in the near future. Wedo not expect any problems in Region 4 of the Muon System where the ageingrequirements are not so strong: the charge accumulated by the wires will notexceed 0.1 C/cm wire during 10 LHC years even at the gas gain of (4÷5)×105.The ageing tests will show if this gas mixture could be used also in the innerregions of the Muon System.
The results obtained in the beam tests can be shortly summarised asfollows:
• The detection efficiency in a double gap WPC with the wire padsizes up to 64 cm2 proved to be better than 99% (25 ns window) with a 300 Vplateau in the case of the Ar/CO2/CF4 gas mixture and with a 550 V plateau inthe case of the Ar/CO2/C2H2F4 gas mixture. Within this plateau, the gas gainvaries from 8×10⁴ up to 3×10⁵ (CF4 , HV=3.25 kV) or up to 1×10⁶ (C2H2F4,HV=3.6 kV), and the time resolution varies from 4.7 ns (r.m.s.) to 2.8 ns withabout 3 ns in the middle of the plateau.
• The higher gas gain attainable with the Ar/CO2/C2H2F4 gas mixtureallows to use wire pads of much larger sizes. In particular, it was demonstratedthat 99% efficiency in a 25 ns window is reached within a 400 V plateau withthe pad size of 128 cm2. The gas gain is 4×10⁵ in the middle of the plateau atHV= 3.4 kV.
• The time resolution and the efficiency remain practically unchanged upto the rates of 500 kHz per channel. (Note, however, a comment in the text aboutthe dead time introduced by the beam trigger).
• The cross-talks are quite low. The probability to fire the neigbouringpads is about 2%. The cross-talks with the non-neighbour pads are negligible.
The detection efficiency required for each muon station is 99% for 20 nstime window. The above consideration shows that this requirement is practicallysatisfied already with one WPC layer. With two WPC layers, the Muon Systemwill have a strong enough redundancy. Also, the two-layer structure of the muonstations and the uniform technology in all regions allow to construct the MuonSystem without any dead zones.
One should mention also some other advantages of the WPC technology:- Projectivity of pad sizes in the non-bending (Y) plane;- Flexibility of the pad sizes in the bending (X) plane;- Possibility to combine pads in OR into logical strips of various sizes
without deterioration the time resolution;

LHCb 2000-003 MUON 14 February 2000
21
- Non-flammable gas mixture with very good ageing properties provedexperimentally with the Ar/CO2/CF4 gas mixture. To be checked withthe Ar/CO2/C2H2F4 gas mixture.
One should point out that the presented here results were obtained withthe PNPI FE electronics specially designed for this chamber. This electronics ismade with discrete components. The next step is to find the appropriate FE chipthat could provide a similar performance. There are several candidates for suchchip, and the tests of these chips are on the way.
Acknowledgements
The authors would like to express their gratitude to the LHCb muon grouphelping in preparations and performing the beam tests at CERN. In particularly,we are thankful to the CERN group with B.Schmidt, R.Lindner, T.Schneider,J.Lamas Valverde and G.Corti who provided the data acquisition and beamtrigger systems, the gas supply lines, and other equipment needed in the test run.We would like to thank G.Carboni and his group from Rome II providing thehodoscope and also we would like to thank L. de Paula, M.Gandelman,E.Polycarpo and D.Moraes from UFRJ participating in the data taking and in thedata analysis. Many thanks to B.Schmidt and to W.Riegler for numerous andvaluable discussions, and to H.J.Hilke for discussions and for financial supportof this work.
References
1.LHCb Technical Proposal. CERN/LHCC 98-4, LHCC/P4, 20 February 1998.
2.O.Sasaki. ATLAS Internal Note, 1 Osctober 1999.
3.G.Velitchko. LHCb Internal Note 98-016, 2 February 1998.
4. CMS Note 1999/011.

LHCb 2000-003 MUON 14 February 2000
22
Fig.1. Cross-section view of WPC prototypes.Dimensions are in mm, wire spacing is 1.5mm, the wire diameter is 30 µm,
the wire length is 16 cm.
15
15
5
5
15
Honeycombpanels withCoppercladded FR4plates
Anode wires

LHCb 2000-003 MUON 14 February 2000
23
Fig.2. Wire pad structure in WPC-1.
HV bus
A1-8
HV
2MΩ
8×16 cm2
2MΩ
B1-8 C1-8 D1-8 E1-4
4×162×16 1×16
160
FEAmplifier-shaper
Decouplingcapacitor1000pF×5kV
16cm
8×16cm2 2×16cm2 1×16cm2 4×16cm2

LHCb 2000-003 MUON 14 February 2000
24
Fig.3. Wire pad structure in WPC-1M.
16 cm
8×16cm2 4×16cm2
W1 W2 W3 W4

LHCb 2000-003 MUON 14 February 2000
25
Fig.4. Wire and cathode pads in WPC-2.
16 cm
Two rows of Cathode pads:
4×8cm2 and 2×8cm2
One row of Wire pads:
W1 W2 W3 W4 W5 W6 W7 W8

LHCb 2000-003 MUON 14 February 2000
26
Fig.5a. Impulse response of the PNPI amplifier-shaper.Fast channel.
SPICE calculations for Qo=8fC, Cdet=50pF.
Fig.5b. Response to a signal with tail described by expression (1).Fast channel.
SPICE calculations for Qo=8fC, Cdet=50pF. Tpeak is shown with down arrow.
-4 mV
0
100ns

LHCb 2000-003 MUON 14 February 2000
27
Fig.6. Electric field map in WPC.

LHCb 2000-003 MUON 14 February 2000
28
Fig.7. Electron drift velocity (a), electron attachment coefficient (b), and gasamplification factor (c) calculated with the Magboltz program for
Ar(60%)+CO2(30%)+CF4(10%) gas mixture.The gas amplification factor was multiplied by Kα =0.7
to achieve agreement with experiment.
a)
b)
c)

LHCb 2000-003 MUON 14 February 2000
29
Fig.8. Calculated time distributions of signals from a single gap WPC forvarious distances of the particle trajectory from the anode wire
( t=0 corresponds to the particle entering time).Θ =0O,φ=0O ; Threshold = 30mV; Noise level = 4mV.
ns
nsns
ns
N N
N N

LHCb 2000-003 MUON 14 February 2000
30
Fig.9. Calculated time resolution and inefficiencies of the double gap WPCfor various staggering of the anode planes.
9GeV/c pions; Θ=ϕ=0°; Noise=4mV; Gas gain=1.2×10⁵.
r.m.s., ns
Ineff. (%) in 25 ns window Ineff. (%) in 20 ns window

LHCb 2000-003 MUON 14 February 2000
31
Fig.10. Calculated inefficiencies of the double gap WPCfor various time windows.
Staggering of the anode planes is δ/S=0.5. 9GeV/c pions; Θ=ϕ=0°; Noise=4mV; Gas gain=1.2×10⁵.
Time window (ns)

LHCb 2000-003 MUON 14 February 2000
32
Fig.11. Experimental setup.
S1, S2 – scintillator counters of 15×15 cm2 and 20×20 cm2 size, respectively;V&H Hodoscope – 8+8 scintillator counters of 1cm×8cm size each.
3 Gev/cpionbeam
≈2m≈ 2 m

LHCb 2000-003 MUON 14 February 2000
33
Fig.12. ADC and TDC spectra measured with WPC-2 prototype.Ar(40%)+CO2(45%)+ CF4(15%) gas mixture;
HV=3.15kV; Thersh=20mV; Gas gain=2×10⁵; ADC pedestal 250 ch.Beam spot is inside the W3 wire pad. Pad size is 4×16 cm2.
EffADC=99.9% and EffTDC in various time windows were determined according to equations(5) and (6), respectively. The fit parameters correspond to the Gaussian fit of the initial partof the time distribution. The real time goes from the right to the left side of the plot.
Run 5061, TR1=14948, TR2=11910, TR3=2992
ADC channelsCounts/ch.
Counts/ch.
TDC (ns)
ADC:Entries=2992Mean=2115RMS= 710.6Under=2Over= 380
TDC:Mean = 267.5RMS = 2.9
Fit parameters:Mean =268.7Sigma = 2.214
Eff 25 ns = 0.999Fff 20 ns = 0.998Eff 15 ns = 0.989
TDC sum = 2990
TDC (ns)
LHCb 2000-003 MUON 14 February 2000
34
Fig.13. Mean values of ADC spectra vs HV.Measurements performed with the gas mixture
Ar(60%)+CO2(30%)+CF4(10%) for various wire pads.ADC pedestals are subtracted.
Gas gain =1.2×10⁵ at HV = 2.7 kV.
Gas Gain Calibration
100
1000
10000
2.60 2.65 2.70 2.75 2.80 2.85 2.90 2.95
HV (kV)
B8 (8x16)
C3 (4x16)
B4 (2x16)
Mean ADC (channels)

LHCb 2000-003 MUON 14 February 2000
35
Fig.14. Gas gain vs HV for various Ar/CO2/CF4 gas mixtures.

LHCb 2000-003 MUON 14 February 2000
36
Fig.15. Beam induced current in WPC vs HV.The current around 1µA corresponds to the gas gain of 2×10⁵.
0
1
2
3
4
5
6
7
8
2.9 3 3.1 3.2 3.3 3.4 3.5 3.6 3.7
HV (kV)
I (m
icro
-Am
ps)
Ar(40%)+CO2(45%)+CF4(15%)
Ar(40%)+CO2(55%)+C2H2F4(5%)
Ar(40%)+CO2(50%)+C2H2F4(10%)
Ar(40%)+CO2(45%)+C2H2F4(15%)

LHCb 2000-003 MUON 14 February 2000
37
Fig.16. Time resolution of WPC with the Ar(40%)+CO2(45%)+ C2H2F4(15%)gas mixture vs high voltage.
WPC-1M prototype. Threshold 20 mV; 8×16 cm2 wire pad.
Beam spot is inside the pad size.The plateau of better than 99% efficiency in 25 ns window extends
from HV=3.2 kV to 3.6 kV.
Ar(40%)+CO2(45%)+C2H2F4(15%)
0
1
2
3
4
5
3.1 3.2 3.3 3.4 3.5 3.6 3.7
HV (kV)
Tim
e re
solu
tio
n (
RM
S),
ns
Unstableoperation region

LHCb 2000-003 MUON 14 February 2000
38
Fig.17. ADC and TDC spectra measured with WPC-1M prototype.Ar(40%)+CO2(45%)+ C2H2F4(15%) gas mixture;
HV=3.45kV; Thersh=20mV.Beam spot is inside the W2 wire pad. Pad size is 8×16 cm2.
Counts/ch.ADC channels
Counts/ch.
TDC (ns)
RUN 5406, TR1=29922, TR2=20740, Tr3=2732
ADC:Entries=2732Mean=2903RMS= 575.7Under=2Over= 831
TDC:Mean = 268.3RMS = 2.909
Fit parameters:Mean =269.8Sigma = 1.837
Eff 25 ns = 0.993Fff 20 ns = 0.992Eff 15 ns = 0.983
TDC sum = 2721
EffADC=0.999ADCsum =2730

LHCb 2000-003 MUON 14 February 2000
39
Fig.18. TDC mean and r.m.s. values vs ADC amplitude.HV=3.15 kV. Ar(40%)+CO2(50%)+CF4(10%).
TDC mean & r.m.s. vs ADC amplutude
1 2 3 4 5
ADC zone
TDC <mean>r.m.s.
zone channels. events 1 500..1000 304 2 1000..1500 1501 3 1500..2500 2608 4 2500..4000 872 5 overflow 587
269
275
273
271272
3.8 ns2.8 ns2.9 ns3.17 ns 2.8 ns
Ar(40%) + CO2(50%) + CF4(10%);
HV = 3.15 kV;
mean TDC
r.m.s. TDC
ADCchannels

LHCb 2000-003 MUON 14 February 2000
40
200 mrad
100 mrad
0 mrad
Voltage (kV)
Ano
de e
ffic
ienc
y
0.92
0.93
0.94
0.95
0.96
0.97
0.98
0.99
1
1.01
2.7 2.8 2.9 3 3.1 3.2 3.3 3.4
200 mrad
100 mrad
0 mrad
Voltage (kV)
Ano
de e
ffic
ienc
y
0.92
0.93
0.94
0.95
0.96
0.97
0.98
0.99
1
1.01
2.7 2.8 2.9 3 3.1 3.2 3.3 3.4
Fig.19. Time resolution (a), efficiency in 20 ns window (b), andefficiency in 25 ns window (c) vs HV measured with WPC-1 prototype for
various Θ -angles.Ar(40%)+CO2(50%)+CF4(10%); Threshold = 20 mV; Pad size 4×16 cm2.
Time Resolution
HV, kV
Pad size 4x16 cm2; Ar(40%) + CO2(50%) + CF4(10%); Tresh=20 mV ;
a)
b)
Unstableoperationregion
c)

LHCb 2000-003 MUON 14 February 2000
41
Fig.20. Comparison of efficiencies in 25 ns window for wire padsof various sizes in gas mixture Ar(40%)+CO2(45%)+CF4(15%).
WPC-1M prototype.
The figure illustrates possibility to combine the wire pads in ORwithout deterioration the detection efficiency.
9293
949596
979899
100101
2.85 2.9 2.95 3 3.05 3.1 3.15 3.2 3.25 3.3
HV (kV)
Eff
. in
25
ns
win
do
w (
%)
W2 (8x16) W3 (4x16) OR W3UW4
Unstableoperationregion

LHCb 2000-003 MUON 14 February 2000
42
Fig.21. Cross-talks in TDC channels.WPC-1M prototype.
The beam spot is inside wire pad WC2.Pad sequence: WC1(8×16 cm2)← WC2(8×16 cm2)→ WC3(4×16 cm2).
Gas gain 2×10⁵; Threshold 20 mV.
ADC
0.04%0.15%0.08%0.11%
9.6%
1 2 3 4 5
C1/8
Beam on pad C2/8
0 00.08%0.04%
10%
1 2 3 4 5
C3/4
0.18% 0.18%0.3% 0.24%
1.6%
1 2 3 4 5 ADC zone
Sum of 11 pads
500..1000 1100
1000..1500 3200
1500..2500 6800
2500..4000 2400
overflow 1600
channels events

LHCb 2000-003 MUON 14 February 2000
43
Fig.22. Cross-talk shift of ADC pedestals.ADC zones correspond to ADC channels:
1 500..10002 1000..15003 1500..25004 500..40005 ADC overflow
WPC-1M prototype. The beam spot is inside wire pad WC2.Pad sequence:
WB8(8×16 cm2)← WC1(8×16 cm2)← WC2(4×16 cm2)→ WC3(4×16 cm2)→ WC4(4×16 cm2)→ WC5(2×16 cm2.
˝
-10
0
10
20
30
40
50
60
1 2 3 4 5ADC zone
∆, c
h
B8/8
C1/8
C3/4
C4/4
C5/2
Pad sequence:B8/8 - C1/8 - C2/4 - C3/4 - C4/4; Beam on C2/4;
ADC ped.shift (ch.)