Embed Size (px)
Citation preview

Wire Holdings and Shear Strength
–Need an FEA
Hans Jostlein October 3, 2011

Abstract
We present data on integral CTE for a number of epoxies and substrates . We also have now data on shear strength between copper clad G10 and various epoxies. However these data are difficult to interpret without an FEA analysis of the shear samples because of concerns about stress concentration in the samples.
In the same vein, shear stresses on the surface of wires embedded in epoxy can be non-uniform, and depend critically on modulus and creep of the epoxy.
Finally, a case may be made for re-visiting holding wires by solder only.
IntroductionWe assume that the signal wires for Liquid Argon Time
Projection Chambers for the lbne experiment are connected to PC-type boards by soldering and in addition be anchored by epoxy to resist the stringing tension.
We found previously that soldering creeps and relaxes the wire tension over the long term; epoxies do not seem to creep.
When cooling down such an assembly from room temperature (RT) to liquid Argon temperature (87 K) the G10 substrate tends to shrink less than the epoxy. The resulting shear stress can lead to epoxy delamination from the substrate and subsequent wire holding failure.
The shear stress may also exceed the shear strength of the epoxy and allow wire slippage.
First some CTE Data
We have measured the integral sample shrinkage from room temperature to liquid nitrogen temperature.
The samples were gas-cooled slowly, while their length was indicated by a Mitutoyo Digimatic gage. The samples were connected to the gauge by a set of quartz tubes.

Comparisons
The epoxy CTE numbers should be compared those of the substrate, G10/ FR4. The substrate typically shrinks less than the epoxies, having an average CTE of 10 to 15 ppm/K.The epoxies range from 19 ppm (Stycast, a filled epoxy) to 60 ppm for the translucent Scotchweld 2216, which is unfilled.

Linearity of Shrinkage
Note that the last column gives an idea about the CTE variation over the temperature range covered her. Values near 1 would indicate a constant CTE; Values above 1 indicate a strong temperature dependence near room temperature with a shallower dependence when cold. Values below 1 indicate the reverse, a small temperature dependence when warm and a steeper one when cold. This effect is seen in the G10/FR4 substrates and, curiously, in the Masterbond 30 LTE, which is heavily filled, and has high density.
Shear Strength Data on Solder (a Reminder)
In October 2010 we posted results from holding wire by solder alone (and other data). We find that solder creeps over time (at least while warm). Here is an excerpt of that note:“ The following graph shows the ultimate wire tension (when the creep has stopped) and the creep distance (sum over both ends), as an average over between 10 and 50 wires. The standard deviation is the variation between wires in the group:

Ultimate Wire Tension versus Solder Pad Length
We see a clear increase in ultimate tension with wire length. When we calculate the ultimate shear stress we find it to be independent of the pad length, about 170 psi:
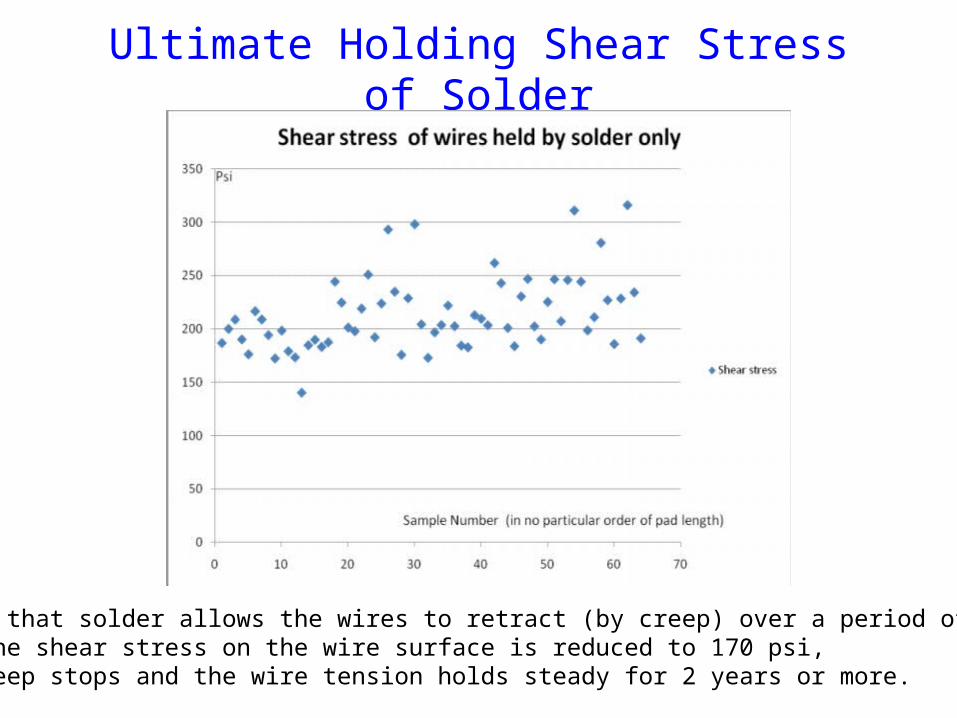
Ultimate Holding Shear Stress of Solder
We find that solder allows the wires to retract (by creep) over a period of a few weeks. When the shear stress on the wire surface is reduced to 170 psi, the creep stops and the wire tension holds steady for 2 years or more.

Epoxy Shear Strength Data
We now have Instron type data on lap shear samples.The samples were typically made from 1/8” thick G10, 1” wide, with a ¾ ” overlap.
Most were glued on their copper clad side, since we are most interested in shear adhesion to the Cu-Be wire, which should behave mostly like copper, being 98% copper.
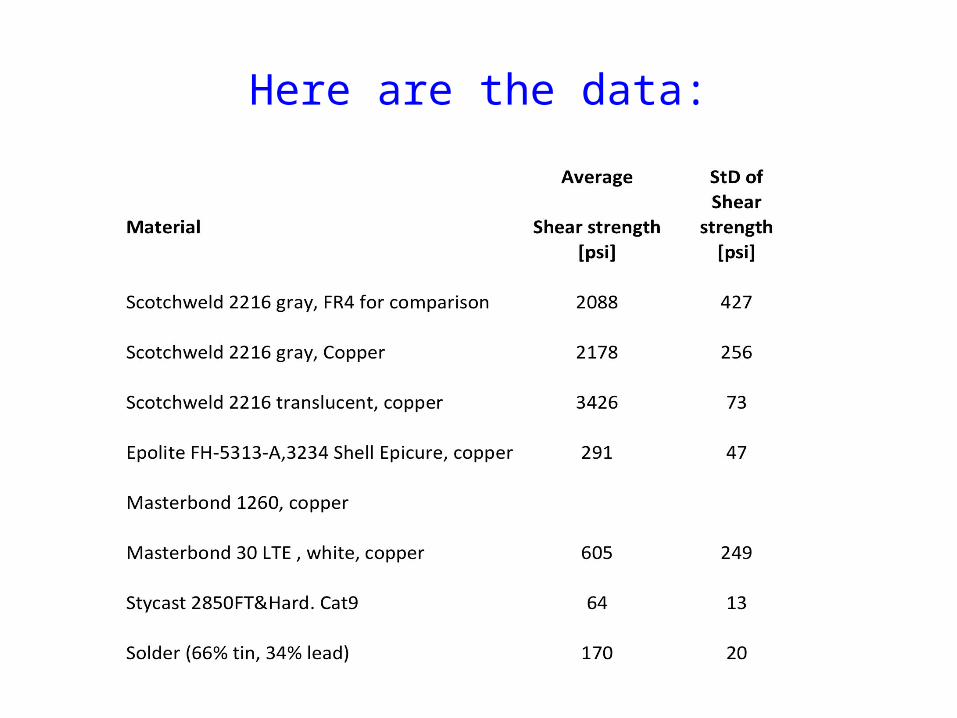
Here are the data:

Shear Stress Measurement Issues
A quick inspection of the table shows that the shear strength correlates poorly with the strength of the epoxies. However, clearly the softer epoxies (2216 translucent, 2216 gray) reach very high shear strength, while the hard ones (especially Stycast blue) do very poorly. In fact, half the Stycast samples broke during packaging.

Sample Size and Issues
Our shear samples were about 1” wide, with about a ¾ inch overlap, made from copper-clad G10, 1/8 “ thick.
We need to understand stress distribution in the samples before we can understand the results.

Ideal Samples
Let us start with the idealized case, where the substrates are infinitely stiff, and all deformation (pure shear) is in the glue joint:

Realistic Samples
It is quite difficult to make samples that provide constant shear stress over the whole area of a sample glue joint.
This stems from the role of the substrate compliance and the glue modulus and thickness:
If the shear motion of the glue joint is not large compared to the substrate stretch under test, then there is significant stress concentration at the two ends of the overlap.

Sample Issues
The shear stress is now peaking at both ends of the overlap region, and is small in between the peaks.
This comes from the ability of the substrate to elongate locally.
It is hard to provide conditions that avoid this stress concentration.
One would need an extremely thick substrate even if its modulus is higher than that of the glue.
Note aside: the shear modulus of G10 is that of the epoxy binder; the fibers are in layers that do not resist shear motion. Hence the shear modulus of the epoxy under test is likely to be similar to that of the substrate.

A Numerical Example
We can estimate the required substrate thickness as follows;:Take a glue joint of thickness t;A substrate of thickness T;An overlap length of length L;And assume an equal shear modulus for substrate and epoxy.The condition for even shear stress would be:

Example-B
t / L larger than T / LTwhich requiresT larger than L^2/t Let’s use numbers:T=0.1 mmL = 10 mmRequiring that T larger than (10^2) / 0.1=1000 mm, Which is clearly unreasonable.
FEA Needed
This is only a very rough guess to illustrate the problem.
We will need to make a (2-dimensional) FEA calculation to get a better idea of the amount of stress concentration for the various epoxies.
I have cylindrical samples that can be used to measure the epoxy modulus as an input. I

Shear Stress on the Wire
We face a similar problem with the shear stress on the wire surface.
When making a wire plane, typically the wire is tensioned by a winding machine and, possibly, also anchored by soldering, before the epoxy is applied.
While the epoxy cures, the wire is under uniform stress.
After cure, the wires outside the chamber area are cut, and the tension outside the epoxy is released:
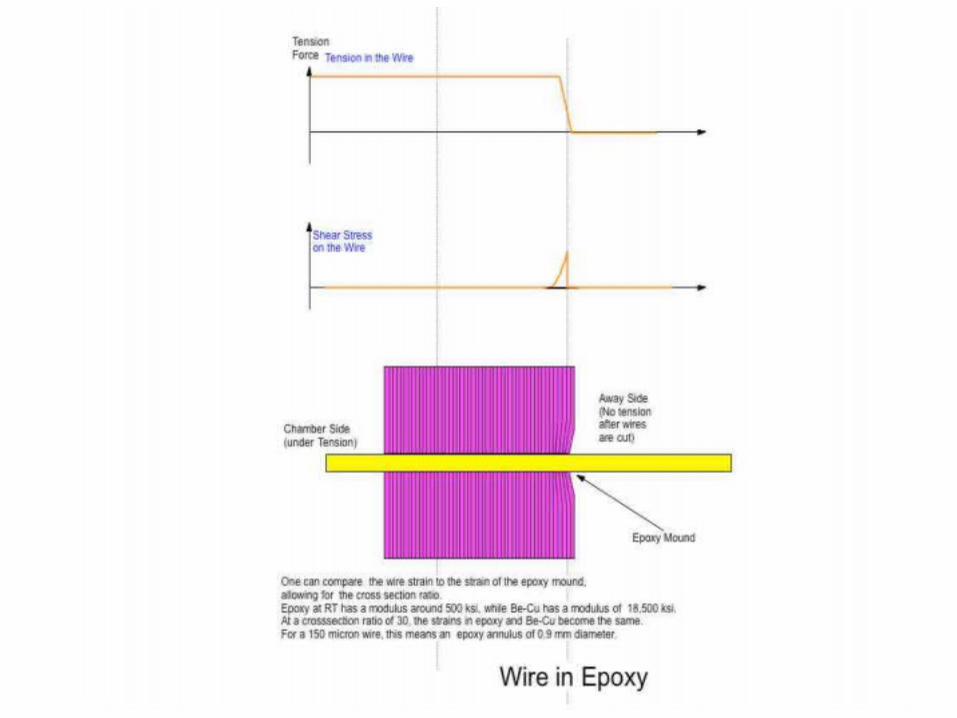

Shear Stress around the Wire
Similar to the issue with shear samples, the “free “ end of the wire transfers its tension to the epoxy over a short distance, often shorter than the length of the epoxy mound.

Stiffness Comparison
One can compare the wire strain to the strain of the epoxy mound, allowing for the cross section ratio.
Epoxy at RT has a modulus around 500 ksi, while Be-Cu has a modulus of 18,500 ksi.
At a cross section ratio of 30, the strains in epoxy and Be-Cu become the same.
For a 150 micron wire, this means an epoxy annulus of 0.5 mm radius.
Conclusions
We have now data on integral CTE and on shear strength of various candidate epoxies (and on tin solder) for holding the wires for a LAr TPC.
We know from tests that several of these candidates can hold wires without losing tension.
However, we need a quantitative understanding of shear stresses both in tests and in wire holding geometries.
Without a clear understanding it will be difficult to evaluate candidate epoxies (and solder alone) for optimum chamber design.