Embed Size (px)
Citation preview
CHAPTER IV
GLOBAL VALUE CHAINS:INVESTMENT AND TRADE
FOR DEVELOPMENT
World Investment Report 2013: Global Value Chains: Investment and Trade for Development122
About 60 per cent of
global trade, which today
amounts to more than $20
trillion, consists of trade
in intermediate goods
and services that are
incorporated at various
stages in the production
process of goods and
services for final consumption. The fragmentation
of production processes and the international
dispersion of tasks and activities within them have
led to the emergence of borderless production
systems – which may be sequential chains or
complex networks and which may be global,
regional or span only two countries. These systems
are commonly referred to as global value chains
(GVCs).
GVCs are typically coordinated by transnational
corporations (TNCs), with cross-border trade of
production inputs and outputs taking place within
their networks of affiliates, contractual partners
(in non-equity modes of international production,
or NEMs; see WIR11) and arm’s-length suppliers.
The phenomenon of international production
driven by TNCs engaging in efficiency-seeking
FDI is not entirely new – the theme of WIR93 was
integrated international production – however,
since around 2000, global trade and FDI have
both grown exponentially, significantly outpacing
global GDP growth, reflecting the rapid expansion
of international production in TNC-coordinated
networks.
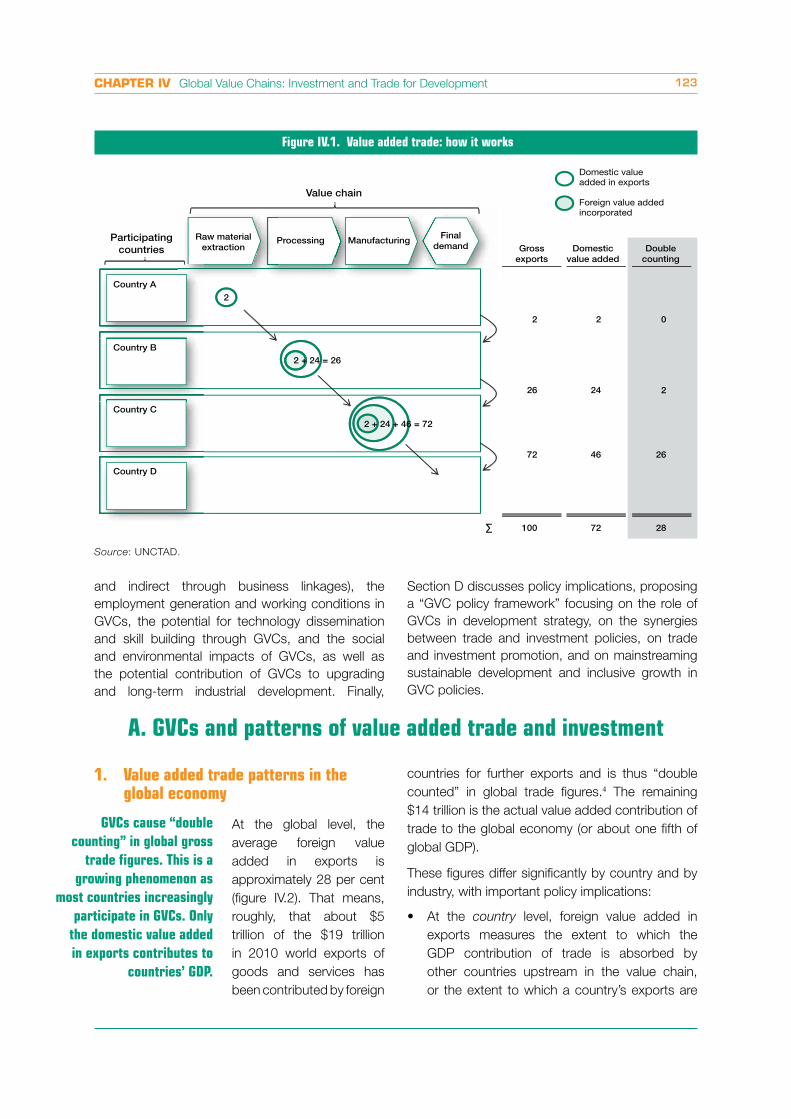
GVCs lead to a significant amount of double
counting in global trade. Raw material extracted in
one country may be exported first to an affiliate in a
second country for processing, then exported again
to a manufacturing plant in a third country, which
may then export the manufactured product to a
fourth for final consumption. The value of the raw
material counts only once as a GDP contribution in
the original country but is counted several times in
world exports.1
Recent advances in trade statistics aim to identify
the double counting in gross trade figures and
show where value is created in global production
INTRODUCTION
Global trade and FDI have
grown exponentially over
the last decade as firms
expanded international
production networks,
trading inputs and outputs
between affiliates and
partners in GVCs.
chains. Figure IV.1 shows a simplified example of
value added trade.
Value added trade statistics can lead to important
policy insights on GVCs, trade, investment and
development. For WIR13, in a collaborative effort
with the Eora project,2 UNCTAD built a value added
trade dataset: the UNCTAD-Eora GVC Database
(box IV.1).3 The database will be used in this chapter
to assess the patterns, drivers and determinants,
development impact and policy implications of
value added trade and investment.
GVCs are a concept taken up by different schools
of economic theory, development studies and
international business disciplines, with each
strand of scholars adopting different definitions
and boundaries of analysis. Table IV.1 illustrates
a number of important contrasts. This chapter
will attempt to bring together the various schools
of thought, borrowing concepts from different
disciplines and adding new cross-disciplinary
insights.
UNCTAD’s research objectives in this report are
to demonstrate how GVCs constitute the nexus
between investment and trade, to show the
importance of GVCs in today’s global economy and
especially their weight in developing countries, to
provide evidence for the impact of GVC participation
in developing countries, and to make concrete
recommendations to help policymakers maximize
the benefits of GVC participation for economic
growth and development while minimizing the
associated risks.
To this end, in the remainder of this chapter, Section
A describes GVC patterns at the global level and
in developing countries specifically, and shows
how FDI and TNC activities shape such patterns –
based on (and building on) value added trade data.
Section B borrows more from other GVC disciplines
and international business theory to discuss
firm-level drivers of GVC activity and locational
determinants, which are important for policymakers
in understanding the factors influencing country-
level GVC participation. Section C describes
the development impacts of GVC participation,
including the GDP contribution of GVCs (direct
CHAPTER IV Global Value Chains: Investment and Trade for Development 123
Figure IV.1. Value added trade: how it works
Source: UNCTAD.
Domestic valueadded in exports
Foreign value addedincorporated
Participatingcountries Gross
exportsDomestic
value addedDouble
counting
Value chain
Country A
Country B
Country C
Country D
Raw materialextraction
Finaldemand
Processing Manufacturing
2
2 + 24 = 26
2 + 24 + 46 = 72
2
26
72
100
2
24
46
72
0
2
26
28∑
and indirect through business linkages), the
employment generation and working conditions in
GVCs, the potential for technology dissemination
and skill building through GVCs, and the social
and environmental impacts of GVCs, as well as
the potential contribution of GVCs to upgrading
and long-term industrial development. Finally,
Section D discusses policy implications, proposing
a “GVC policy framework” focusing on the role of
GVCs in development strategy, on the synergies
between trade and investment policies, on trade
and investment promotion, and on mainstreaming
sustainable development and inclusive growth in
GVC policies.
A. GVCs and patterns of value added trade and investment
1. Value added trade patterns in the global economy
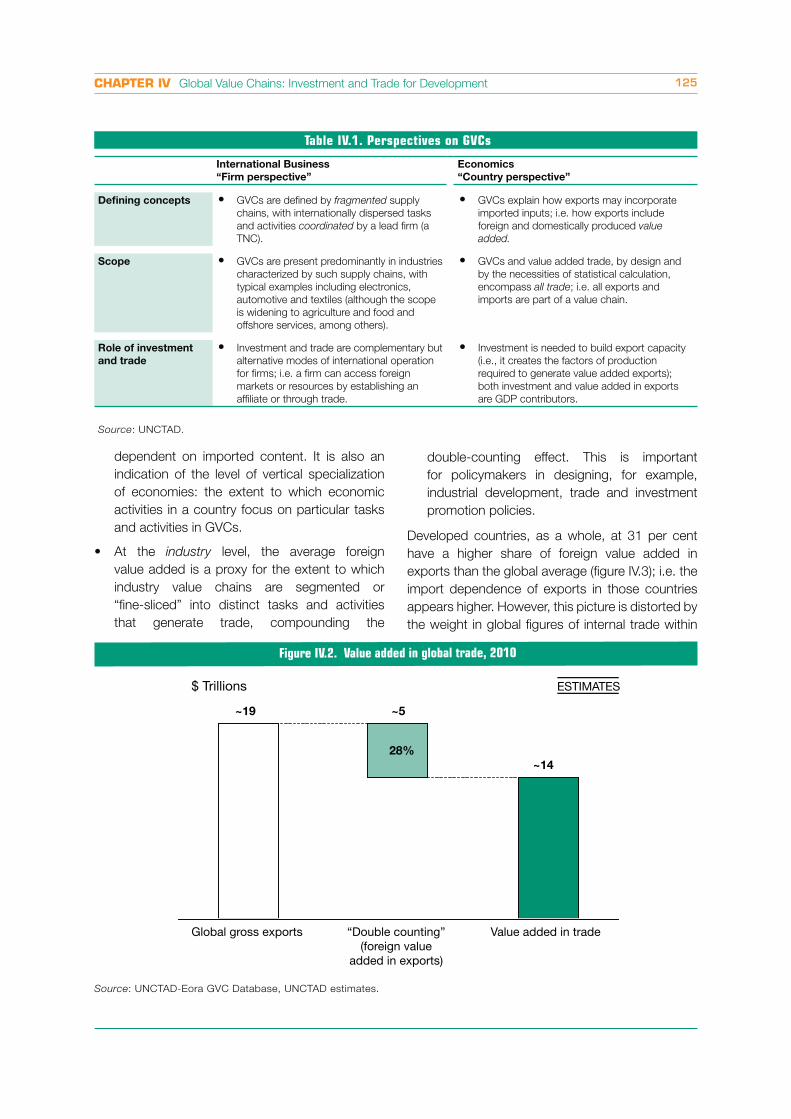
At the global level, the
average foreign value
added in exports is
approximately 28 per cent
(figure IV.2). That means,
roughly, that about $5
trillion of the $19 trillion
in 2010 world exports of
goods and services has
been contributed by foreign
GVCs cause “double
counting” in global gross
trade figures. This is a
growing phenomenon as
most countries increasingly
participate in GVCs. Only
the domestic value added
in exports contributes to
countries’ GDP.
countries for further exports and is thus “double
counted” in global trade figures.4 The remaining
$14 trillion is the actual value added contribution of
trade to the global economy (or about one fifth of
global GDP).
These figures differ significantly by country and by
industry, with important policy implications:
At the country level, foreign value added in
exports measures the extent to which the
GDP contribution of trade is absorbed by
other countries upstream in the value chain,
or the extent to which a country’s exports are
World Investment Report 2013: Global Value Chains: Investment and Trade for Development124
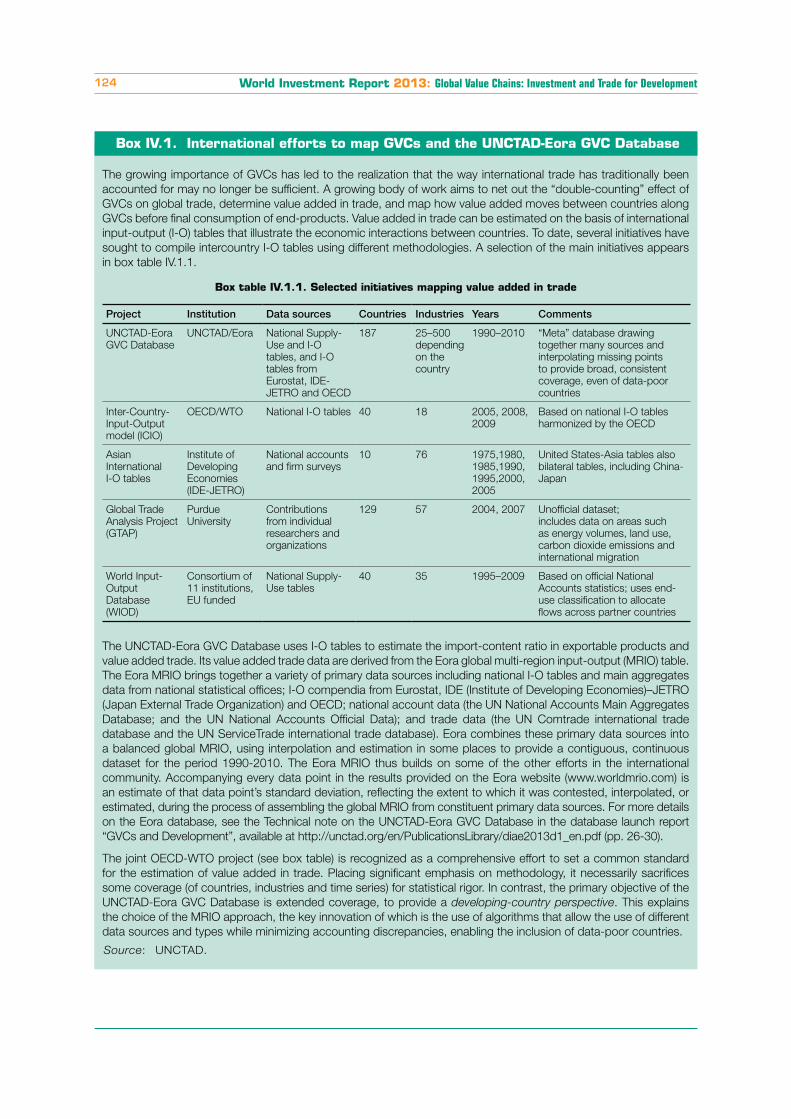
Box IV.1. International efforts to map GVCs and the UNCTAD-Eora GVC Database
The growing importance of GVCs has led to the realization that the way international trade has traditionally been
accounted for may no longer be sufficient. A growing body of work aims to net out the “double-counting” effect of
GVCs on global trade, determine value added in trade, and map how value added moves between countries along
GVCs before final consumption of end-products. Value added in trade can be estimated on the basis of international
input-output (I-O) tables that illustrate the economic interactions between countries. To date, several initiatives have
sought to compile intercountry I-O tables using different methodologies. A selection of the main initiatives appears
in box table IV.1.1.
Box table IV.1.1. Selected initiatives mapping value added in trade
Project Institution Data sources Countries Industries Years Comments
UNCTAD-Eora
GVC Database
UNCTAD/Eora National Supply-
Use and I-O
tables, and I-O
tables from
Eurostat, IDE-
JETRO and OECD
187 25–500
depending
on the
country
1990–2010 “Meta” database drawing
together many sources and
interpolating missing points
to provide broad, consistent
coverage, even of data-poor
countries
Inter-Country-
Input-Output
model (ICIO)
OECD/WTO National I-O tables 40 18 2005, 2008,
2009
Based on national I-O tables
harmonized by the OECD
Asian
International
I-O tables
Institute of
Developing
Economies
(IDE-JETRO)
National accounts
and firm surveys
10 76 1975,1980,
1985,1990,
1995,2000,
2005
United States-Asia tables also
bilateral tables, including China-
Japan
Global Trade
Analysis Project
(GTAP)
Purdue
University
Contributions
from individual
researchers and
organizations
129 57 2004, 2007 Unofficial dataset;
includes data on areas such
as energy volumes, land use,
carbon dioxide emissions and
international migration
World Input-
Output
Database
(WIOD)
Consortium of
11 institutions,
EU funded
National Supply-
Use tables
40 35 1995–2009 Based on official National
Accounts statistics; uses end-
use classification to allocate
flows across partner countries
The UNCTAD-Eora GVC Database uses I-O tables to estimate the import-content ratio in exportable products and
value added trade. Its value added trade data are derived from the Eora global multi-region input-output (MRIO) table.
The Eora MRIO brings together a variety of primary data sources including national I-O tables and main aggregates
data from national statistical offices; I-O compendia from Eurostat, IDE (Institute of Developing Economies)–JETRO
(Japan External Trade Organization) and OECD; national account data (the UN National Accounts Main Aggregates
Database; and the UN National Accounts Official Data); and trade data (the UN Comtrade international trade
database and the UN ServiceTrade international trade database). Eora combines these primary data sources into
a balanced global MRIO, using interpolation and estimation in some places to provide a contiguous, continuous
dataset for the period 1990-2010. The Eora MRIO thus builds on some of the other efforts in the international
community. Accompanying every data point in the results provided on the Eora website (www.worldmrio.com) is
an estimate of that data point’s standard deviation, reflecting the extent to which it was contested, interpolated, or
estimated, during the process of assembling the global MRIO from constituent primary data sources. For more details
on the Eora database, see the Technical note on the UNCTAD-Eora GVC Database in the database launch report
“GVCs and Development”, available at http://unctad.org/en/PublicationsLibrary/diae2013d1_en.pdf (pp. 26-30).
The joint OECD-WTO project (see box table) is recognized as a comprehensive effort to set a common standard
for the estimation of value added in trade. Placing significant emphasis on methodology, it necessarily sacrifices
some coverage (of countries, industries and time series) for statistical rigor. In contrast, the primary objective of the
UNCTAD-Eora GVC Database is extended coverage, to provide a developing-country perspective. This explains
the choice of the MRIO approach, the key innovation of which is the use of algorithms that allow the use of different
data sources and types while minimizing accounting discrepancies, enabling the inclusion of data-poor countries.
Source: UNCTAD.
CHAPTER IV Global Value Chains: Investment and Trade for Development 125
Table IV.1. Perspectives on GVCs
International Business
“Firm perspective”
Economics
“Country perspective”
Defining concepts GVCs are defined by fragmented supply
chains, with internationally dispersed tasks
and activities coordinated by a lead firm (a
TNC).
GVCs explain how exports may incorporate
imported inputs; i.e. how exports include
foreign and domestically produced value
added.
Scope GVCs are present predominantly in industries
characterized by such supply chains, with
typical examples including electronics,
automotive and textiles (although the scope
is widening to agriculture and food and
offshore services, among others).
GVCs and value added trade, by design and
by the necessities of statistical calculation,
encompass all trade; i.e. all exports and
imports are part of a value chain.
Role of investment
and trade
Investment and trade are complementary but
alternative modes of international operation
for firms; i.e. a firm can access foreign
markets or resources by establishing an
affiliate or through trade.
Investment is needed to build export capacity
(i.e., it creates the factors of production
required to generate value added exports);
both investment and value added in exports
are GDP contributors.
Source: UNCTAD.
dependent on imported content. It is also an
indication of the level of vertical specialization
of economies: the extent to which economic
activities in a country focus on particular tasks
and activities in GVCs.
At the industry level, the average foreign
value added is a proxy for the extent to which
industry value chains are segmented or
“fine-sliced” into distinct tasks and activities
that generate trade, compounding the
double-counting effect. This is important
for policymakers in designing, for example,
industrial development, trade and investment
promotion policies.
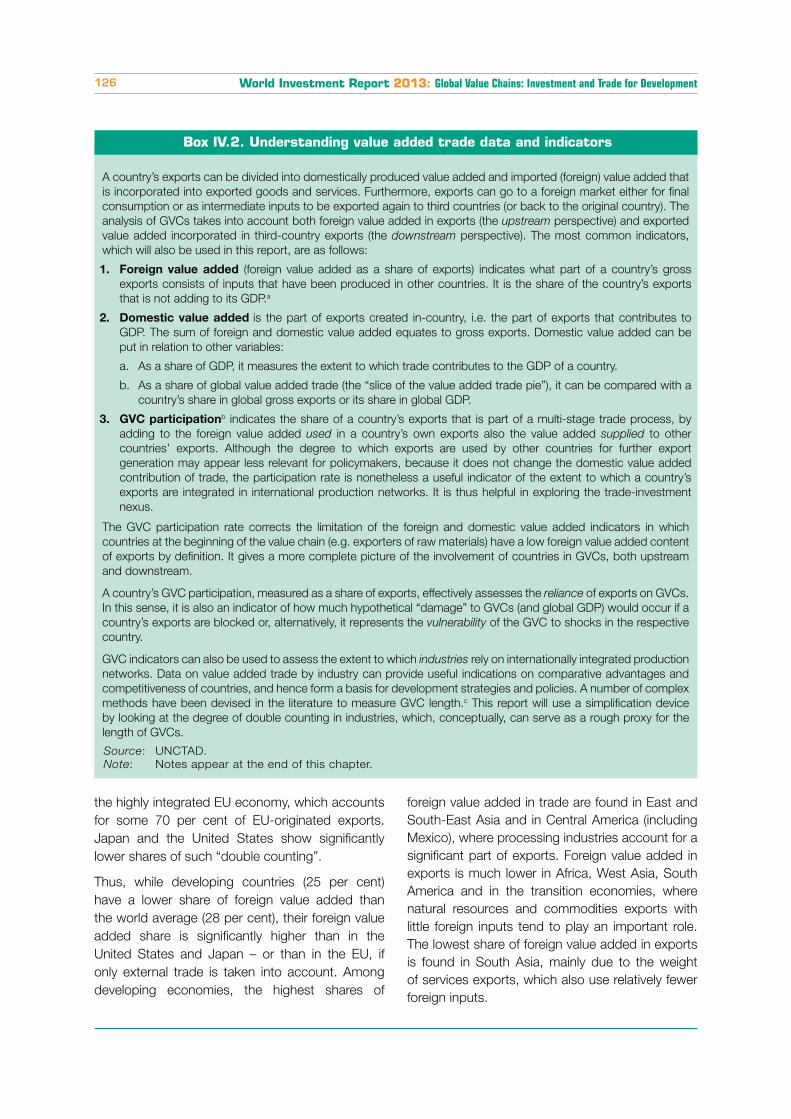
Developed countries, as a whole, at 31 per cent
have a higher share of foreign value added in
exports than the global average (figure IV.3); i.e. the
import dependence of exports in those countries
appears higher. However, this picture is distorted by
the weight in global figures of internal trade within
Figure IV.2. Value added in global trade, 2010
Source: UNCTAD-Eora GVC Database, UNCTAD estimates.
$ Trillions ESTIMATES
“Double counting”(foreign value
added in exports)
Global gross exports Value added in trade
~19 ~5
~14
28%
World Investment Report 2013: Global Value Chains: Investment and Trade for Development126
the highly integrated EU economy, which accounts
for some 70 per cent of EU-originated exports.
Japan and the United States show significantly
lower shares of such “double counting”.
Thus, while developing countries (25 per cent)
have a lower share of foreign value added than
the world average (28 per cent), their foreign value
added share is significantly higher than in the
United States and Japan – or than in the EU, if
only external trade is taken into account. Among
developing economies, the highest shares of
foreign value added in trade are found in East and
South-East Asia and in Central America (including
Mexico), where processing industries account for a
significant part of exports. Foreign value added in
exports is much lower in Africa, West Asia, South
America and in the transition economies, where
natural resources and commodities exports with
little foreign inputs tend to play an important role.
The lowest share of foreign value added in exports
is found in South Asia, mainly due to the weight
of services exports, which also use relatively fewer
foreign inputs.
Box IV.2. Understanding value added trade data and indicators
A country’s exports can be divided into domestically produced value added and imported (foreign) value added that
is incorporated into exported goods and services. Furthermore, exports can go to a foreign market either for final
consumption or as intermediate inputs to be exported again to third countries (or back to the original country). The
analysis of GVCs takes into account both foreign value added in exports (the upstream perspective) and exported
value added incorporated in third-country exports (the downstream perspective). The most common indicators,
which will also be used in this report, are as follows:
1. Foreign value added (foreign value added as a share of exports) indicates what part of a country’s gross
exports consists of inputs that have been produced in other countries. It is the share of the country’s exports
that is not adding to its GDP.a
2. Domestic value added is the part of exports created in-country, i.e. the part of exports that contributes to
GDP. The sum of foreign and domestic value added equates to gross exports. Domestic value added can be
put in relation to other variables:
a. As a share of GDP, it measures the extent to which trade contributes to the GDP of a country.
b. As a share of global value added trade (the “slice of the value added trade pie”), it can be compared with a
country’s share in global gross exports or its share in global GDP.
3. GVC participationb indicates the share of a country’s exports that is part of a multi-stage trade process, by
adding to the foreign value added used in a country’s own exports also the value added supplied to other
countries’ exports. Although the degree to which exports are used by other countries for further export
generation may appear less relevant for policymakers, because it does not change the domestic value added
contribution of trade, the participation rate is nonetheless a useful indicator of the extent to which a country’s
exports are integrated in international production networks. It is thus helpful in exploring the trade-investment
nexus.
The GVC participation rate corrects the limitation of the foreign and domestic value added indicators in which
countries at the beginning of the value chain (e.g. exporters of raw materials) have a low foreign value added content
of exports by definition. It gives a more complete picture of the involvement of countries in GVCs, both upstream
and downstream.
A country’s GVC participation, measured as a share of exports, effectively assesses the reliance of exports on GVCs.
In this sense, it is also an indicator of how much hypothetical “damage” to GVCs (and global GDP) would occur if a
country’s exports are blocked or, alternatively, it represents the vulnerability of the GVC to shocks in the respective
country.
GVC indicators can also be used to assess the extent to which industries rely on internationally integrated production
networks. Data on value added trade by industry can provide useful indications on comparative advantages and
competitiveness of countries, and hence form a basis for development strategies and policies. A number of complex
methods have been devised in the literature to measure GVC length.c This report will use a simplification device
by looking at the degree of double counting in industries, which, conceptually, can serve as a rough proxy for the
length of GVCs.
Source: UNCTAD.
Note: Notes appear at the end of this chapter.
CHAPTER IV Global Value Chains: Investment and Trade for Development 127
Figure IV.3. Share of foreign value added in exports, by region, 2010
25%
21%
21%
16%
31%
11%
30%
27%
14%
18%
11%
39%
31%
28%
14%
13%
14%
Developing-country average
Central America
Latin America and Caribbean
West Asia
South Asia
East and South-East Asia
Asia
Africa
Developing economies
Japan
United States
European Union
Developed economies
Global
Least developed countries
Transition economies
South America
Memorandum item:
Caribbean
Source: UNCTAD-Eora GVC Database.
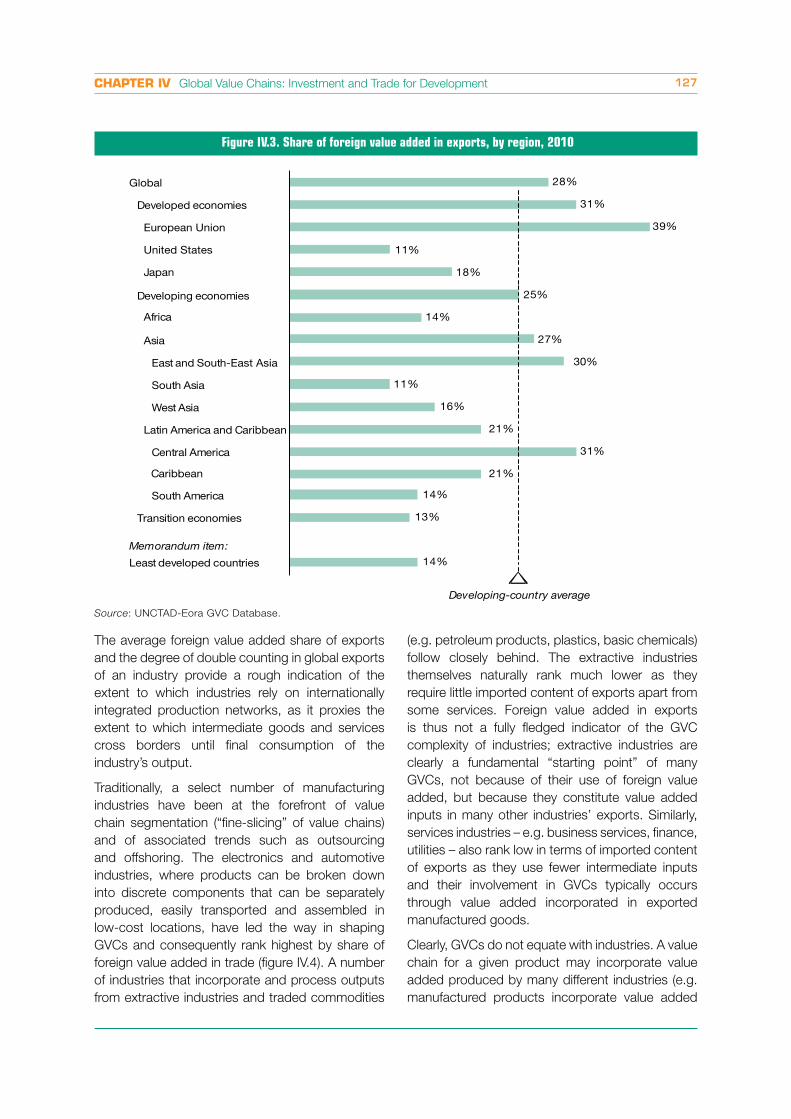
The average foreign value added share of exports
and the degree of double counting in global exports
of an industry provide a rough indication of the
extent to which industries rely on internationally
integrated production networks, as it proxies the
extent to which intermediate goods and services
cross borders until final consumption of the
industry’s output.
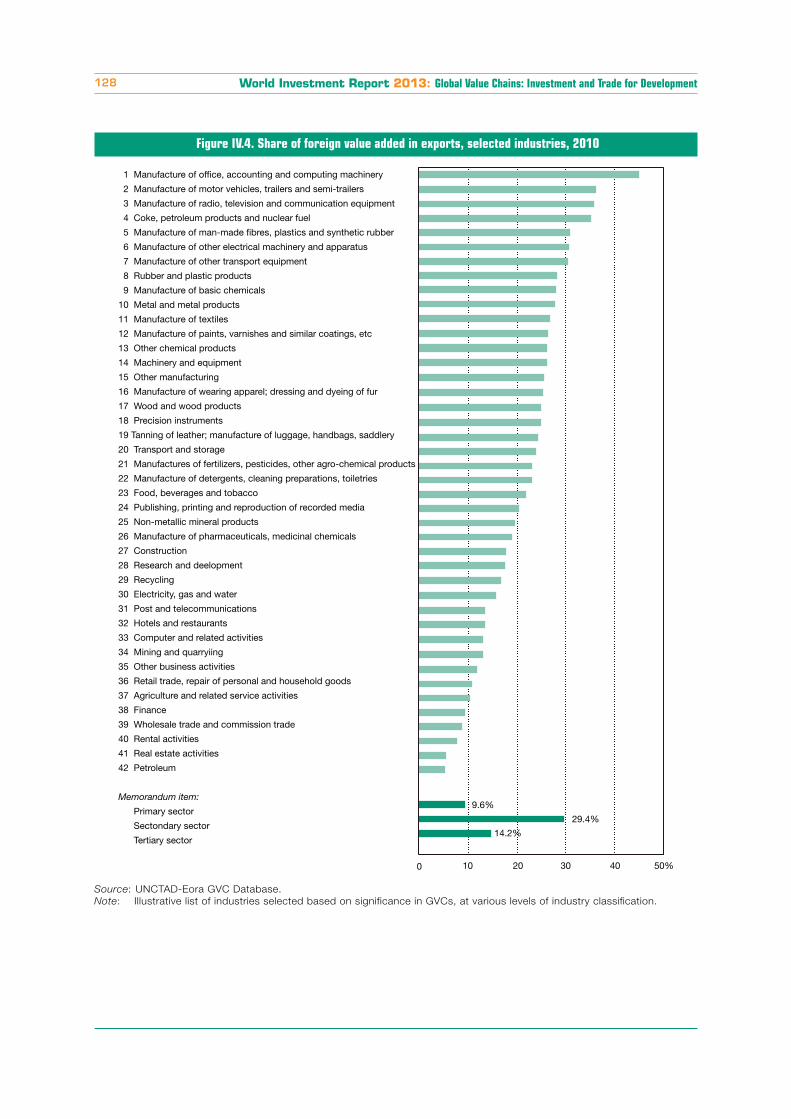
Traditionally, a select number of manufacturing
industries have been at the forefront of value
chain segmentation (“fine-slicing” of value chains)
and of associated trends such as outsourcing
and offshoring. The electronics and automotive
industries, where products can be broken down
into discrete components that can be separately
produced, easily transported and assembled in
low-cost locations, have led the way in shaping
GVCs and consequently rank highest by share of
foreign value added in trade (figure IV.4). A number
of industries that incorporate and process outputs
from extractive industries and traded commodities
(e.g. petroleum products, plastics, basic chemicals)
follow closely behind. The extractive industries
themselves naturally rank much lower as they
require little imported content of exports apart from
some services. Foreign value added in exports
is thus not a fully fledged indicator of the GVC
complexity of industries; extractive industries are
clearly a fundamental “starting point” of many
GVCs, not because of their use of foreign value
added, but because they constitute value added
inputs in many other industries’ exports. Similarly,
services industries – e.g. business services, finance,
utilities – also rank low in terms of imported content
of exports as they use fewer intermediate inputs
and their involvement in GVCs typically occurs
through value added incorporated in exported
manufactured goods.
Clearly, GVCs do not equate with industries. A value
chain for a given product may incorporate value
added produced by many different industries (e.g.
manufactured products incorporate value added
World Investment Report 2013: Global Value Chains: Investment and Trade for Development128
Figure IV.4. Share of foreign value added in exports, selected industries, 2010
Source: UNCTAD-Eora GVC Database.
Note: Illustrative list of industries selected based on significance in GVCs, at various levels of industry classification.
10 20 30 40 50%
1 Manufacture of office, accounting and computing machinery
2 Manufacture of motor vehicles, trailers and semi-trailers
3 Manufacture of radio, television and communication equipment
4 Coke, petroleum products and nuclear fuel
5 Manufacture of man-made fibres, plastics and synthetic rubber
6 Manufacture of other electrical machinery and apparatus
7 Manufacture of other transport equipment
8 Rubber and plastic products
9 Manufacture of basic chemicals
10 Metal and metal products
11 Manufacture of textiles
12 Manufacture of paints, varnishes and similar coatings, etc
13 Other chemical products
14 Machinery and equipment
15 Other manufacturing
16 Manufacture of wearing apparel; dressing and dyeing of fur
17 Wood and wood products
18 Precision instruments
19 Tanning of leather; manufacture of luggage, handbags, saddlery
20 Transport and storage
21 Manufactures of fertilizers, pesticides, other agro-chemical products
22 Manufacture of detergents, cleaning preparations, toiletries
23 Food, beverages and tobacco
24 Publishing, printing and reproduction of recorded media
25 Non-metallic mineral products
26 Manufacture of pharmaceuticals, medicinal chemicals
27 Construction
28 Research and deelopment
29 Recycling
30 Electricity, gas and water
31 Post and telecommunications
32 Hotels and restaurants
33 Computer and related activities
34 Mining and quarryiing
35 Other business activities
36 Retail trade, repair of personal and household goods
37 Agriculture and related service activities
38 Finance
39 Wholesale trade and commission trade
40 Rental activities
41 Real estate activities
42 Petroleum
Memorandum item:
Primary sector
Sectondary sector
Tertiary sector
29.4%
14.2%
9.6%
0
CHAPTER IV Global Value Chains: Investment and Trade for Development 129
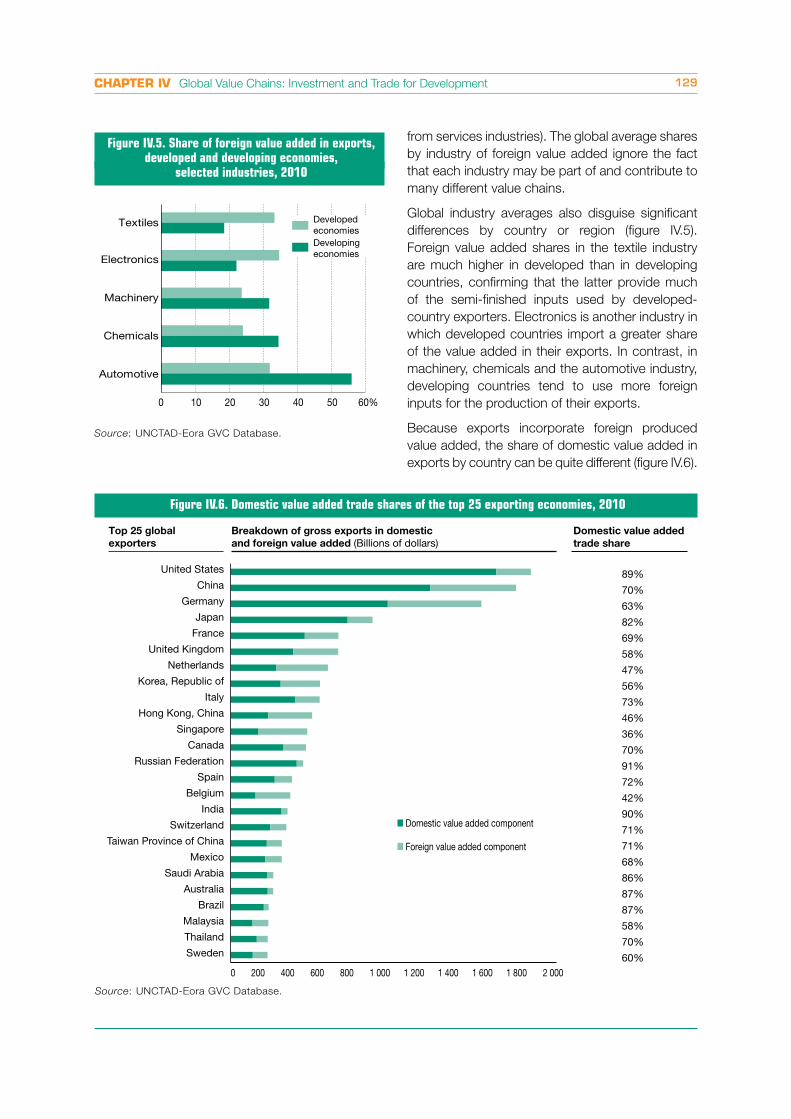
Figure IV.5. Share of foreign value added in exports, developed and developing economies,
selected industries, 2010
Source: UNCTAD-Eora GVC Database.
Textiles
Electronics
Machinery
Chemicals
Automotive
0 10 20 30 40 50 60%
Developed economiesDevelopingeconomies
from services industries). The global average shares
by industry of foreign value added ignore the fact
that each industry may be part of and contribute to
many different value chains.
Global industry averages also disguise significant
differences by country or region (figure IV.5).
Foreign value added shares in the textile industry
are much higher in developed than in developing
countries, confirming that the latter provide much
of the semi-finished inputs used by developed-
country exporters. Electronics is another industry in
which developed countries import a greater share
of the value added in their exports. In contrast, in
machinery, chemicals and the automotive industry,
developing countries tend to use more foreign
inputs for the production of their exports.
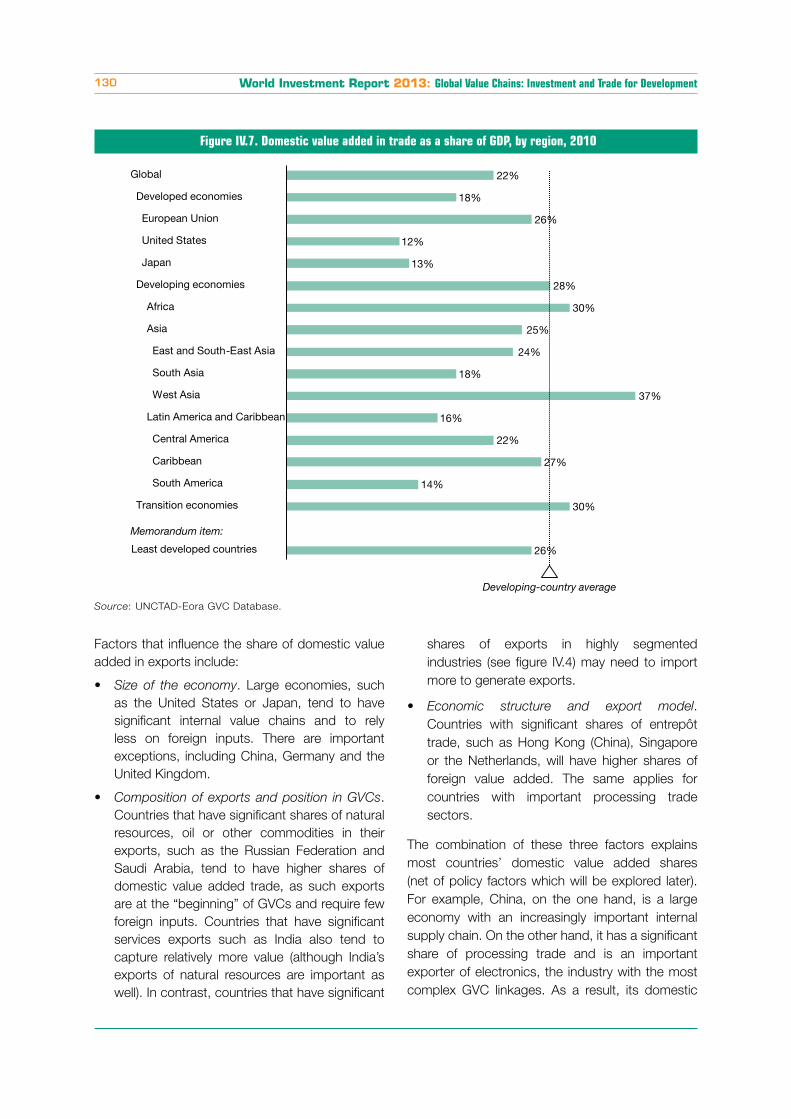
Because exports incorporate foreign produced
value added, the share of domestic value added in
exports by country can be quite different (figure IV.6).
Figure IV.6. Domestic value added trade shares of the top 25 exporting economies, 2010
Domestic value added component
Foreign value added component
United States
China
Germany
Japan
France
United Kingdom
Netherlands
Korea, Republic of
Italy
Hong Kong, China
Singapore
Canada
Russian Federation
Spain
Belgium
India
Switzerland
Taiwan Province of China
Mexico
Saudi Arabia
Australia
Brazil
Malaysia
Thailand
Sweden
Top 25 global
exporters
Breakdown of gross exports in domestic
and foreign value added (Billions of dollars)Domestic value added
trade share
89%
70%
63%
82%
69%
58%
47%
56%
73%
46%
36%
70%
91%
72%
42%
90%
71%
71%
68%
86%
87%
87%
58%
70%
60%0 200 400 600 800 1 000 1 200 1 400 1 600 1 800 2 000
Source: UNCTAD-Eora GVC Database.
World Investment Report 2013: Global Value Chains: Investment and Trade for Development130
Figure IV.7. Domestic value added in trade as a share of GDP, by region, 2010
Source: UNCTAD-Eora GVC Database.
26%
30%
14%
27%
22%
16%
37%
18%
24%
25%
30%
28%
13%
12%
26%
18%
22%
Memorandum item:
-East Asia
European Union
Least developed countries
Transition economies
South America
Caribbean
Central America
Latin America and Caribbean
West Asia
South Asia
East and South
Asia
Africa
Developing economies
Japan
United States
Developed economies
Global
Developing-country average
Factors that influence the share of domestic value
added in exports include:
Size of the economy. Large economies, such
as the United States or Japan, tend to have
significant internal value chains and to rely
less on foreign inputs. There are important
exceptions, including China, Germany and the
United Kingdom.
Composition of exports and position in GVCs.
Countries that have significant shares of natural
resources, oil or other commodities in their
exports, such as the Russian Federation and
Saudi Arabia, tend to have higher shares of
domestic value added trade, as such exports
are at the “beginning” of GVCs and require few
foreign inputs. Countries that have significant
services exports such as India also tend to
capture relatively more value (although India’s
exports of natural resources are important as
well). In contrast, countries that have significant
shares of exports in highly segmented
industries (see figure IV.4) may need to import
more to generate exports.
Economic structure and export model.
Countries with significant shares of entrepôt
trade, such as Hong Kong (China), Singapore
or the Netherlands, will have higher shares of
foreign value added. The same applies for
countries with important processing trade
sectors.
The combination of these three factors explains
most countries’ domestic value added shares
(net of policy factors which will be explored later).
For example, China, on the one hand, is a large
economy with an increasingly important internal
supply chain. On the other hand, it has a significant
share of processing trade and is an important
exporter of electronics, the industry with the most
complex GVC linkages. As a result, its domestic
CHAPTER IV Global Value Chains: Investment and Trade for Development 131
value added share balances at about the global
average of 72 per cent.
Domestic value added created from trade – the
actual contribution of trade to GDP after discounting
imported value added – can be significant relative to
the size of local economies. While the contribution
of trade to global GDP is about one fifth, this share
is higher in developing and transition economies
(figure IV.7). It is particularly high in Africa, West Asia
and the transition economies owing to the relative
importance of exports of natural resources there
and, in part, to the relatively small size of the local
“non-tradables” economy. The contribution of trade
to GDP is high also in East and South-East Asia; on
this measure, that region rivals the highly integrated
European market. This high share not only
reflects the export competitiveness of these Asian
economies but also their higher share of domestic
value added in trade compared with Europe.
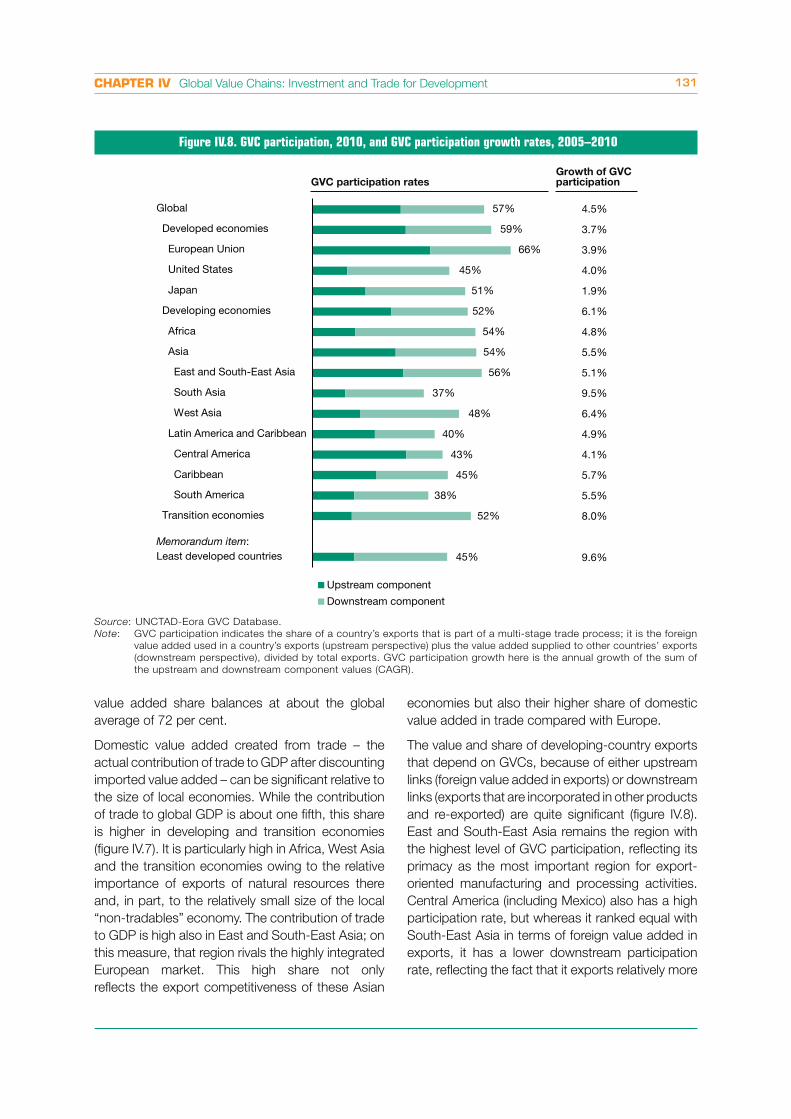
The value and share of developing-country exports
that depend on GVCs, because of either upstream
links (foreign value added in exports) or downstream
links (exports that are incorporated in other products
and re-exported) are quite significant (figure IV.8).
East and South-East Asia remains the region with
the highest level of GVC participation, reflecting its
primacy as the most important region for export-
oriented manufacturing and processing activities.
Central America (including Mexico) also has a high
participation rate, but whereas it ranked equal with
South-East Asia in terms of foreign value added in
exports, it has a lower downstream participation
rate, reflecting the fact that it exports relatively more
Figure IV.8. GVC participation, 2010, and GVC participation growth rates, 2005–2010
Source: UNCTAD-Eora GVC Database.
Note: GVC participation indicates the share of a country’s exports that is part of a multi-stage trade process; it is the foreign
value added used in a country’s exports (upstream perspective) plus the value added supplied to other countries’ exports
(downstream perspective), divided by total exports. GVC participation growth here is the annual growth of the sum of
the upstream and downstream component values (CAGR).
Least developed countriesMemorandum item:
Transition economies
South America
Caribbean
Central America
Latin America and Caribbean
West Asia
South Asia
East and South-East Asia
Asia
Africa
Developing economies
Japan
United States
European Union
Developed economies
Global
Growth of GVC participationGVC participation rates
45%
52%
38%
45%
43%
40%
48%
37%
56%
54%
54%
52%
51%
45%
66%
59%
57% 4.5%
3.7%
3.9%
4.0%
1.9%
6.1%
4.8%
5.5%
5.1%
9.5%
6.4%
4.9%
4.1%
5.5%
8.0%
9.6%
5.7%
Upstream component
Downstream component
World Investment Report 2013: Global Value Chains: Investment and Trade for Development132
to the United States domestic market rather than
for onward exports.
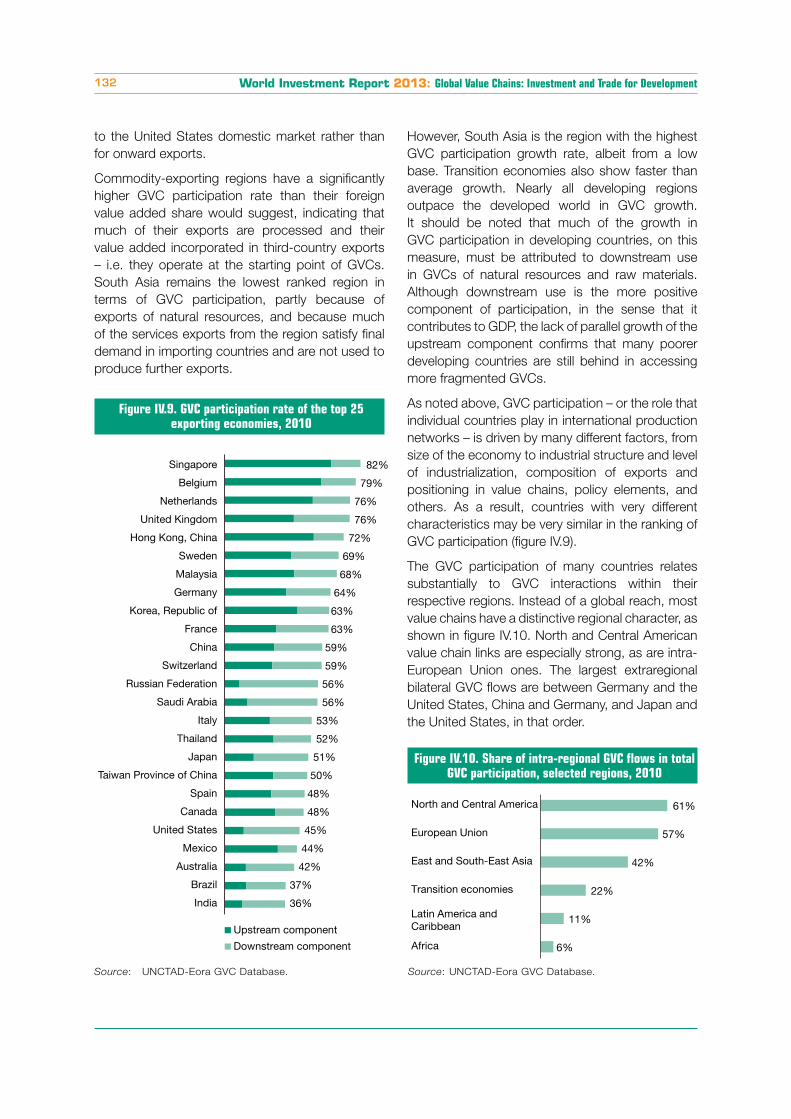
Commodity-exporting regions have a significantly
higher GVC participation rate than their foreign
value added share would suggest, indicating that
much of their exports are processed and their
value added incorporated in third-country exports
– i.e. they operate at the starting point of GVCs.
South Asia remains the lowest ranked region in
terms of GVC participation, partly because of
exports of natural resources, and because much
of the services exports from the region satisfy final
demand in importing countries and are not used to
produce further exports.
However, South Asia is the region with the highest
GVC participation growth rate, albeit from a low
base. Transition economies also show faster than
average growth. Nearly all developing regions
outpace the developed world in GVC growth.
It should be noted that much of the growth in
GVC participation in developing countries, on this
measure, must be attributed to downstream use
in GVCs of natural resources and raw materials.
Although downstream use is the more positive
component of participation, in the sense that it
contributes to GDP, the lack of parallel growth of the
upstream component confirms that many poorer
developing countries are still behind in accessing
more fragmented GVCs.
As noted above, GVC participation – or the role that
individual countries play in international production
networks – is driven by many different factors, from
size of the economy to industrial structure and level
of industrialization, composition of exports and
positioning in value chains, policy elements, and
others. As a result, countries with very different
characteristics may be very similar in the ranking of
GVC participation (figure IV.9).
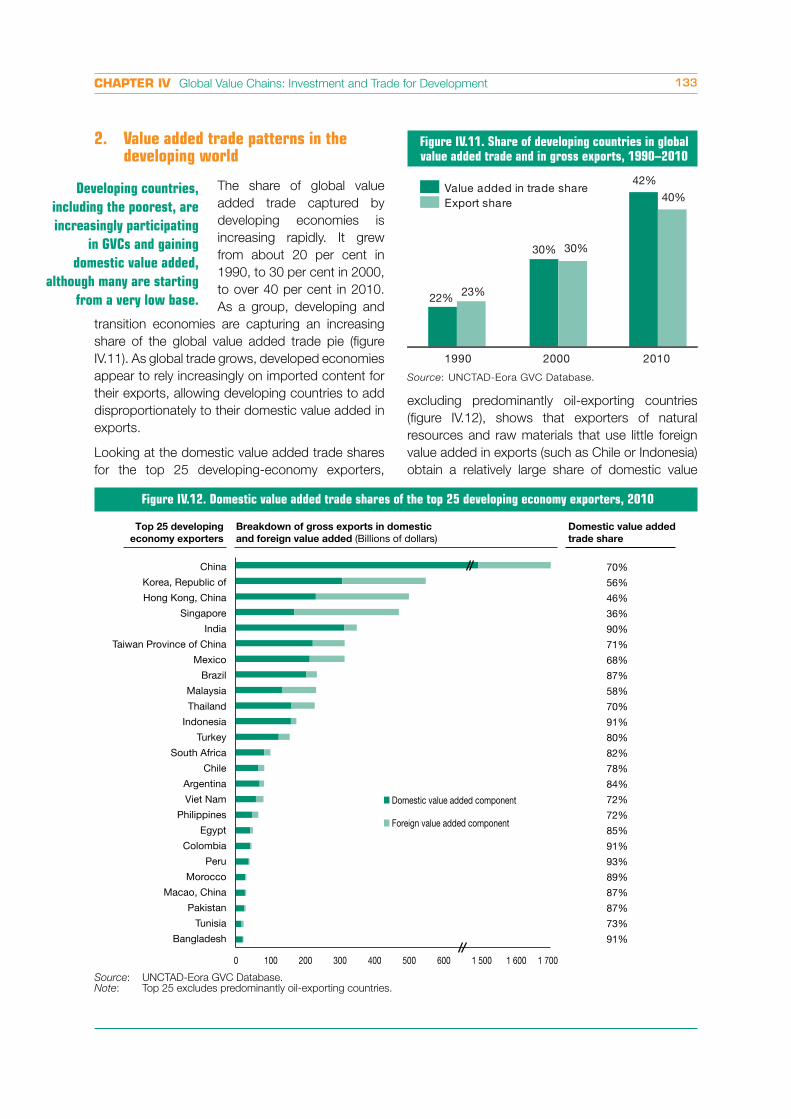
The GVC participation of many countries relates
substantially to GVC interactions within their
respective regions. Instead of a global reach, most
value chains have a distinctive regional character, as
shown in figure IV.10. North and Central American
value chain links are especially strong, as are intra-
European Union ones. The largest extraregional
bilateral GVC flows are between Germany and the
United States, China and Germany, and Japan and
the United States, in that order.
Figure IV.9. GVC participation rate of the top 25 exporting economies, 2010
Source: UNCTAD-Eora GVC Database.
Singapore
Belgium
Netherlands
United Kingdom
Hong Kong, China
Sweden
Malaysia
Germany
Korea, Republic of
France
China
Switzerland
Russian Federation
Saudi Arabia
Italy
Thailand
Japan
Taiwan Province of China
Spain
Canada
United States
Mexico
Australia
Brazil
India
82%
79%
76%
76%
72%
69%
68%
64%
63%
63%
59%
59%
56%
56%
53%
52%
51%
50%
48%
48%
45%
44%
42%
37%
36%
Upstream component
Downstream component
Figure IV.10. Share of intra-regional GVC flows in total GVC participation, selected regions, 2010
Source: UNCTAD-Eora GVC Database.
6%
11%
22%
42%
57%
61%
Africa
Latin America andCaribbean
Transition economies
East and South-East Asia
European Union
North and Central America
CHAPTER IV Global Value Chains: Investment and Trade for Development 133
Source: UNCTAD-Eora GVC Database.
Figure IV.11. Share of developing countries in global value added trade and in gross exports, 1990–2010
1990 2000 2010
Value added in trade shareExport share
30% 30%
42%
40%
22% 23%
2. Value added trade patterns in the developing world
The share of global value
added trade captured by
developing economies is
increasing rapidly. It grew
from about 20 per cent in
1990, to 30 per cent in 2000,
to over 40 per cent in 2010.
As a group, developing and
transition economies are capturing an increasing
share of the global value added trade pie (figure
IV.11). As global trade grows, developed economies
appear to rely increasingly on imported content for
their exports, allowing developing countries to add
disproportionately to their domestic value added in
exports.
Looking at the domestic value added trade shares
for the top 25 developing-economy exporters,
excluding predominantly oil-exporting countries
(figure IV.12), shows that exporters of natural
resources and raw materials that use little foreign
value added in exports (such as Chile or Indonesia)
obtain a relatively large share of domestic value
Developing countries,
including the poorest, are
increasingly participating
in GVCs and gaining
domestic value added,
although many are starting
from a very low base.
Top 25 developing
economy exporters
Domestic value added
trade share
70%
56%
46%
36%
90%
71%
68%
87%
58%
70%
91%
80%
82%
78%
84%
72%
72%
85%
91%
93%
89%
87%
87%
73%
91%
China
Korea, Republic of
Hong Kong, China
Singapore
India
Taiwan Province of China
Mexico
Brazil
Malaysia
Thailand
Indonesia
Turkey
South Africa
Chile
Argentina
Viet Nam
Philippines
Egypt
Colombia
Peru
Morocco
Macao, China
Pakistan
Tunisia
Bangladesh
0 100 200 300 400 500 600 1 500 1 600 1 700
Breakdown of gross exports in domestic
and foreign value added (Billions of dollars)
Domestic value added component
Foreign value added component
Figure IV.12. Domestic value added trade shares of the top 25 developing economy exporters, 2010
Source: UNCTAD-Eora GVC Database.Note: Top 25 excludes predominantly oil-exporting countries.
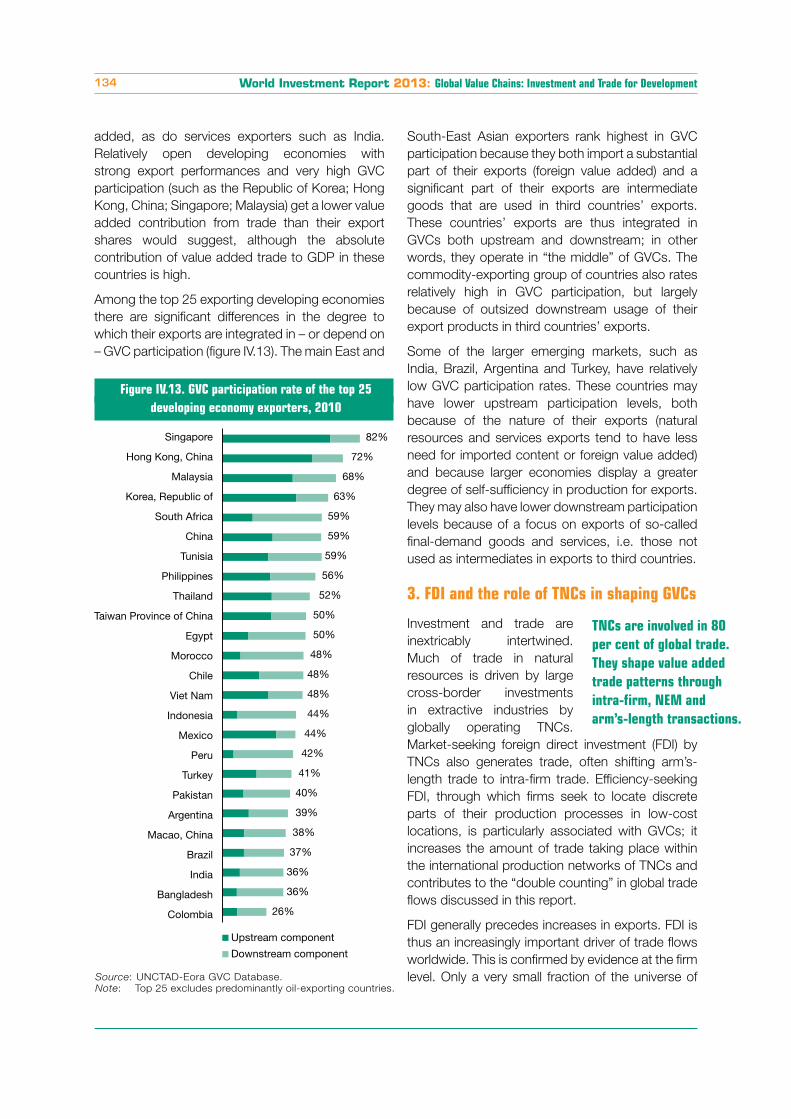
World Investment Report 2013: Global Value Chains: Investment and Trade for Development134
added, as do services exporters such as India.
Relatively open developing economies with
strong export performances and very high GVC
participation (such as the Republic of Korea; Hong
Kong, China; Singapore; Malaysia) get a lower value
added contribution from trade than their export
shares would suggest, although the absolute
contribution of value added trade to GDP in these
countries is high.
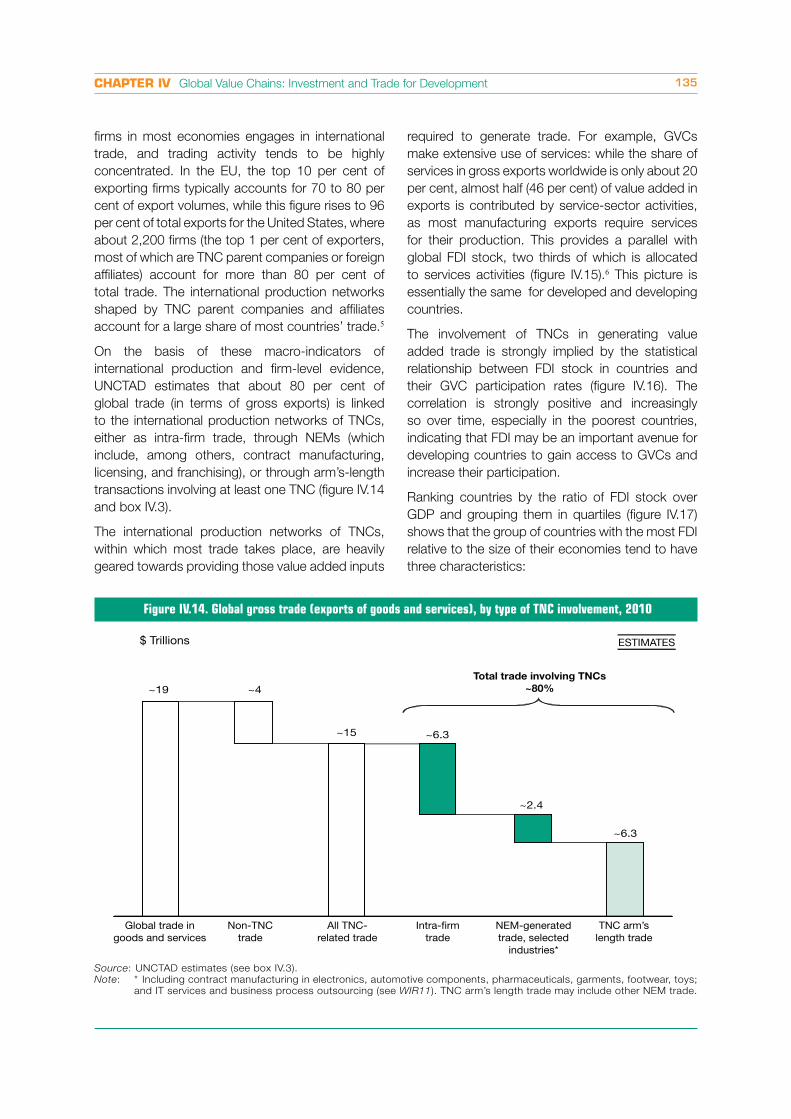
Among the top 25 exporting developing economies
there are significant differences in the degree to
which their exports are integrated in – or depend on
– GVC participation (figure IV.13). The main East and
South-East Asian exporters rank highest in GVC
participation because they both import a substantial
part of their exports (foreign value added) and a
significant part of their exports are intermediate
goods that are used in third countries’ exports.
These countries’ exports are thus integrated in
GVCs both upstream and downstream; in other
words, they operate in “the middle” of GVCs. The
commodity-exporting group of countries also rates
relatively high in GVC participation, but largely
because of outsized downstream usage of their
export products in third countries’ exports.
Some of the larger emerging markets, such as
India, Brazil, Argentina and Turkey, have relatively
low GVC participation rates. These countries may
have lower upstream participation levels, both
because of the nature of their exports (natural
resources and services exports tend to have less
need for imported content or foreign value added)
and because larger economies display a greater
degree of self-sufficiency in production for exports.
They may also have lower downstream participation
levels because of a focus on exports of so-called
final-demand goods and services, i.e. those not
used as intermediates in exports to third countries.
3. FDI and the role of TNCs in shaping GVCs
Investment and trade are
inextricably intertwined.
Much of trade in natural
resources is driven by large
cross-border investments
in extractive industries by
globally operating TNCs.
Market-seeking foreign direct investment (FDI) by
TNCs also generates trade, often shifting arm’s-
length trade to intra-firm trade. Efficiency-seeking
FDI, through which firms seek to locate discrete
parts of their production processes in low-cost
locations, is particularly associated with GVCs; it
increases the amount of trade taking place within
the international production networks of TNCs and
contributes to the “double counting” in global trade
flows discussed in this report.
FDI generally precedes increases in exports. FDI is
thus an increasingly important driver of trade flows
worldwide. This is confirmed by evidence at the firm
level. Only a very small fraction of the universe of
Figure IV.13. GVC participation rate of the top 25
developing economy exporters, 2010
Source: UNCTAD-Eora GVC Database.
Note: Top 25 excludes predominantly oil-exporting countries.
Singapore
Hong Kong, China
Malaysia
Korea, Republic of
South Africa
China
Tunisia
Philippines
Thailand
Taiwan Province of China
Egypt
Morocco
Chile
Viet Nam
Indonesia
Mexico
Peru
Turkey
Pakistan
Argentina
Macao, China
Brazil
India
Bangladesh
Colombia
82%
72%
68%
63%
59%
59%
59%
56%
52%
50%
50%
48%
48%
48%
44%
44%
42%
41%
40%
39%
38%
37%
36%
36%
26%
Upstream component
Downstream component
TNCs are involved in 80
per cent of global trade.
They shape value added
trade patterns through
intra-firm, NEM and
arm’s-length transactions.
CHAPTER IV Global Value Chains: Investment and Trade for Development 135
firms in most economies engages in international
trade, and trading activity tends to be highly
concentrated. In the EU, the top 10 per cent of
exporting firms typically accounts for 70 to 80 per
cent of export volumes, while this figure rises to 96
per cent of total exports for the United States, where
about 2,200 firms (the top 1 per cent of exporters,
most of which are TNC parent companies or foreign
affiliates) account for more than 80 per cent of
total trade. The international production networks
shaped by TNC parent companies and affiliates
account for a large share of most countries’ trade.5
On the basis of these macro-indicators of
international production and firm-level evidence,
UNCTAD estimates that about 80 per cent of
global trade (in terms of gross exports) is linked
to the international production networks of TNCs,
either as intra-firm trade, through NEMs (which
include, among others, contract manufacturing,
licensing, and franchising), or through arm’s-length
transactions involving at least one TNC (figure IV.14
and box IV.3).
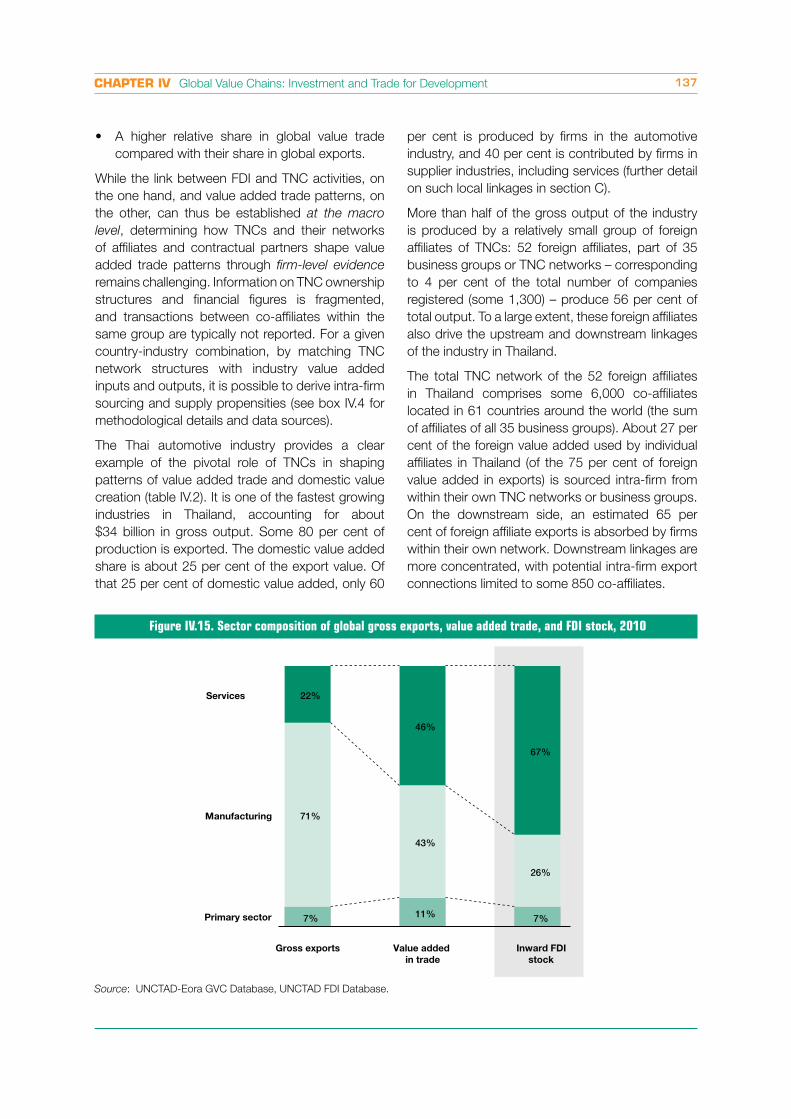
The international production networks of TNCs,
within which most trade takes place, are heavily
geared towards providing those value added inputs
required to generate trade. For example, GVCs
make extensive use of services: while the share of
services in gross exports worldwide is only about 20
per cent, almost half (46 per cent) of value added in
exports is contributed by service-sector activities,
as most manufacturing exports require services
for their production. This provides a parallel with
global FDI stock, two thirds of which is allocated
to services activities (figure IV.15).6 This picture is
essentially the same for developed and developing
countries.
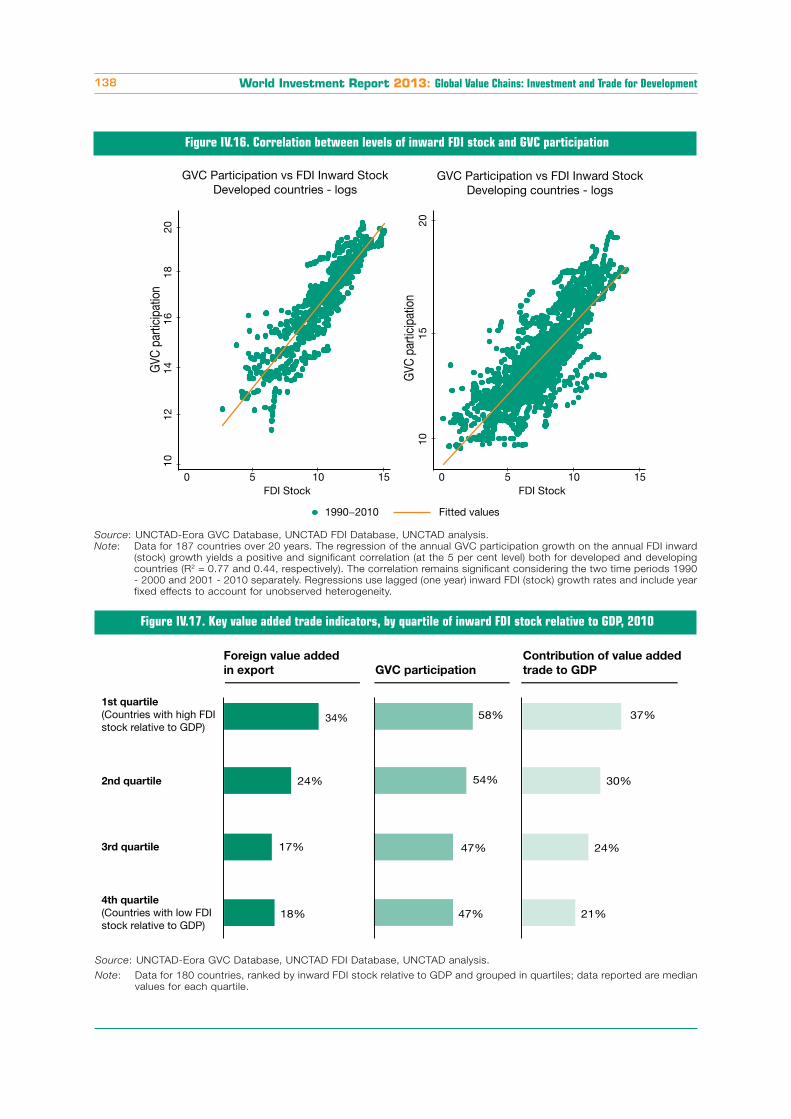
The involvement of TNCs in generating value
added trade is strongly implied by the statistical
relationship between FDI stock in countries and
their GVC participation rates (figure IV.16). The
correlation is strongly positive and increasingly
so over time, especially in the poorest countries,
indicating that FDI may be an important avenue for
developing countries to gain access to GVCs and
increase their participation.
Ranking countries by the ratio of FDI stock over
GDP and grouping them in quartiles (figure IV.17)
shows that the group of countries with the most FDI
relative to the size of their economies tend to have
three characteristics:
Figure IV.14. Global gross trade (exports of goods and services), by type of TNC involvement, 2010
Source: UNCTAD estimates (see box IV.3).
Note: * Including contract manufacturing in electronics, automotive components, pharmaceuticals, garments, footwear, toys;
and IT services and business process outsourcing (see WIR11). TNC arm’s length trade may include other NEM trade.
Global trade ingoods and services
Non-TNCtrade
Intra-firmtrade
NEM-generatedtrade, selected
industries*
TNC arm’slength trade
All TNC-related trade
Total trade involving TNCs
~80%
ESTIMATES$ Trillions
~19 ~4
~15 ~6.3
~2.4
~6.3
World Investment Report 2013: Global Value Chains: Investment and Trade for Development136
Box IV.3. Estimating trade within the international production networks of TNCs
The estimates for trade taking place with the international production networks of TNCs shown in figure IV.14 are
based on evidence about investment-trade links of individual countries and regions:a
In the United States, in 2010, affiliates of foreign TNCs accounted for 20 per cent of exports and 28 per cent
of imports of goods, while TNCs based in the United States accounted for 45 per cent of exports and 39 per
cent of imports. Thus some two thirds of both exports and imports of goods can be considered to be within
the international production networks of TNCs.
In Europe, also in 2010, French TNCs accounted for some 31 per cent of goods exports and 24 per cent of
imports, while foreign affiliates in France accounted for 34 per cent and 38 per cent, respectively. Thus some
64 per cent of total French exports and 62 per cent of total French imports of goods in 2009 can be consid-
ered to be within the international production networks of TNCs. Similar scattered evidence exists for other EU
countries.
In Japan, TNCs based there accounted for 85 per cent of exports of goods and services, while foreign affiliates
contributed a further 8 per cent. Thus 93 per cent of total Japanese exports of goods and services are linked
to TNCs.
In China, foreign affiliates accounted for some 50 per cent of exports and 48 per cent of imports in 2012. Add-
ing the trade activities of Chinese TNCs – although they are perhaps not as large as the share of their French
or United States counterparts given the lower (but growing) share of Chinese outward FDI – would lead to
estimates of trade within international production networks in excess of the United States share.
In developing countries as a group, it is likely that the share of trade within the production networks of TNCs is
higher, for two reasons: (i) the productivity curve of firms is steeper than in developed countries, meaning that
trade is likely to be even more concentrated in a small number of large exporters and importers with above-
average productivity, i.e. predominantly TNCs and their affiliates; (ii) the share of extractive industries in their
exports (at about 25 per cent) is significantly higher than the world average (about 17 per cent) and the extrac-
tion and trade of natural resources generally involves TNCs.
A significant share of this trade is intra-firm trade, the international flows of goods and services between parent
companies and their affiliates or among these affiliates, as opposed to arm’s-length trade between unrelated parties
(inter-firm trade). For example, the share of exports by United States affiliates abroad directed to other affiliated
firms, including parent firms, remained high at about 60 per cent over the past decade. Similarly, nearly half of the
exports of goods by foreign affiliates located in the United States are shipped to the foreign parent group and as
much as 70 per cent of their imports arrive from the foreign parent group. Japanese TNCs export 40 per cent of
their goods and services to their own affiliates abroad. Although further evidence on intra-firm trade is patchy, the
general consensus is that intra-firm trade accounts on average for about 30 per cent of a country’s exports, with
large variations across countries.
These explanations focus for the most part on merchandise trade. There is evidence that TNC involvement in
services trade, with a growing share of intra-firm trade in services (e.g. corporate functions, financial services), is even
higher. Where it does not occur in the form of intra-firm trade, services trade often takes place in NEM relationships
(information technology and business process outsourcing, call centres, etc.). NEMs as a whole (including contract
manufacturing activities) are estimated to be worth over $2 trillion (see WIR11).
Arm’s-length trade by TNCs (exports to and imports from unrelated parties in data from the OECD’s Activity of
Multinational Enterprises database) is estimated to be worth about $6 trillion, the residual. Non-TNC-related trade
includes all transactions between firms that have only domestic operations, anonymous transactions on commodity
exchanges, etc.
Source: UNCTAD.
Note: Notes appear at the end of this chapter.
Higher foreign value added in their exports
(foreign affiliates of TNCs producing for exports
tend to use value added produced by other
parts of the TNC production network);
Higher GVC participation (foreign affiliates
of TNCs not only use foreign inputs in their
production, but also supply to other parts of
the TNC network for further exports); and
CHAPTER IV Global Value Chains: Investment and Trade for Development 137
A higher relative share in global value trade
compared with their share in global exports.
While the link between FDI and TNC activities, on
the one hand, and value added trade patterns, on
the other, can thus be established at the macro
level, determining how TNCs and their networks
of affiliates and contractual partners shape value
added trade patterns through firm-level evidence
remains challenging. Information on TNC ownership
structures and financial figures is fragmented,
and transactions between co-affiliates within the
same group are typically not reported. For a given
country-industry combination, by matching TNC
network structures with industry value added
inputs and outputs, it is possible to derive intra-firm
sourcing and supply propensities (see box IV.4 for
methodological details and data sources).
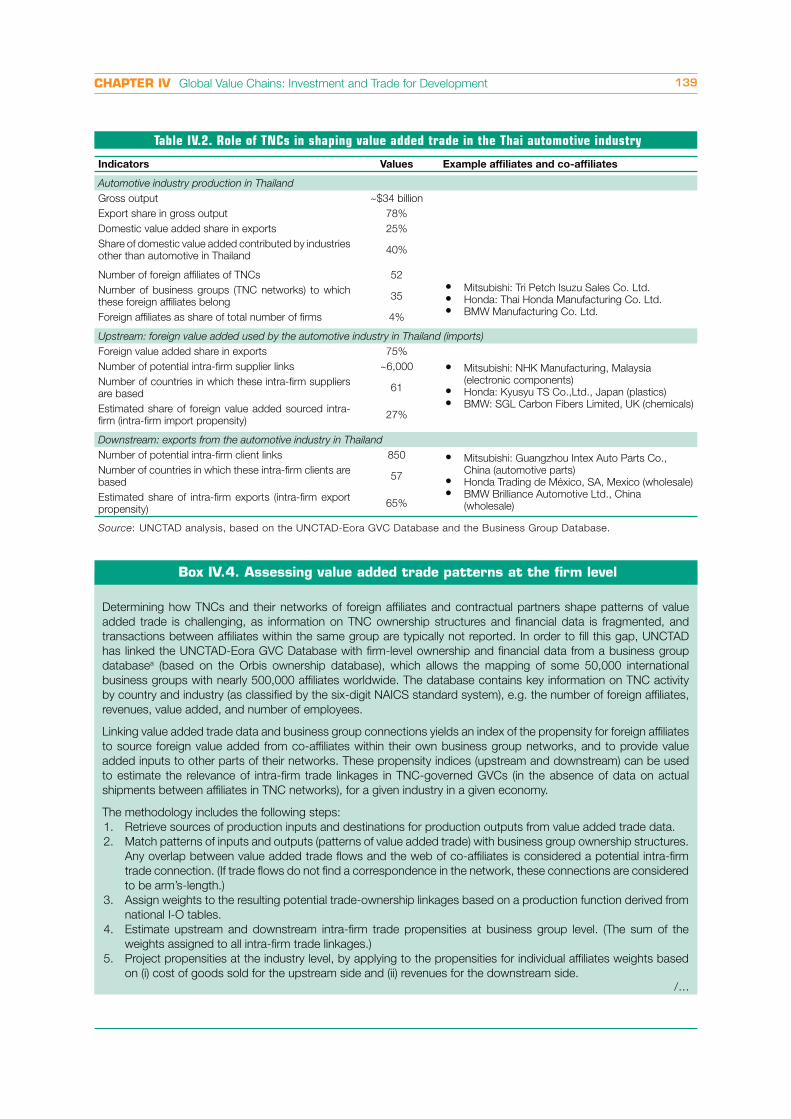
The Thai automotive industry provides a clear
example of the pivotal role of TNCs in shaping
patterns of value added trade and domestic value
creation (table IV.2). It is one of the fastest growing
industries in Thailand, accounting for about
$34 billion in gross output. Some 80 per cent of
production is exported. The domestic value added
share is about 25 per cent of the export value. Of
that 25 per cent of domestic value added, only 60
per cent is produced by firms in the automotive
industry, and 40 per cent is contributed by firms in
supplier industries, including services (further detail
on such local linkages in section C).
More than half of the gross output of the industry
is produced by a relatively small group of foreign
affiliates of TNCs: 52 foreign affiliates, part of 35
business groups or TNC networks – corresponding
to 4 per cent of the total number of companies
registered (some 1,300) – produce 56 per cent of
total output. To a large extent, these foreign affiliates
also drive the upstream and downstream linkages
of the industry in Thailand.
The total TNC network of the 52 foreign affiliates
in Thailand comprises some 6,000 co-affiliates
located in 61 countries around the world (the sum
of affiliates of all 35 business groups). About 27 per
cent of the foreign value added used by individual
affiliates in Thailand (of the 75 per cent of foreign
value added in exports) is sourced intra-firm from
within their own TNC networks or business groups.
On the downstream side, an estimated 65 per
cent of foreign affiliate exports is absorbed by firms
within their own network. Downstream linkages are
more concentrated, with potential intra-firm export
connections limited to some 850 co-affiliates.
Figure IV.15. Sector composition of global gross exports, value added trade, and FDI stock, 2010
Source: UNCTAD-Eora GVC Database, UNCTAD FDI Database.
7% 11% 7%
71%
43%
26%
22%
46%
67%
Gross exports Value added
in trade
Inward FDI
stock
Services
Manufacturing
Primary sector
World Investment Report 2013: Global Value Chains: Investment and Trade for Development138
Source: UNCTAD-Eora GVC Database, UNCTAD FDI Database, UNCTAD analysis.
Note: Data for 187 countries over 20 years. The regression of the annual GVC participation growth on the annual FDI inward
(stock) growth yields a positive and significant correlation (at the 5 per cent level) both for developed and developing
countries (R2 = 0.77 and 0.44, respectively). The correlation remains significant considering the two time periods 1990
- 2000 and 2001 - 2010 separately. Regressions use lagged (one year) inward FDI (stock) growth rates and include year
fixed effects to account for unobserved heterogeneity.
Figure IV.16. Correlation between levels of inward FDI stock and GVC participation
1012
1614
1820
0 5 10 15FDI Stock
1015
20
0 5 10 15FDI Stock
1990−2010 Fitted values
GVC Participation vs FDI Inward StockDeveloped countries - logs
GVC Participation vs FDI Inward StockDeveloping countries - logs
GVC
par
ticip
atio
n
GVC
par
ticip
atio
n
Figure IV.17. Key value added trade indicators, by quartile of inward FDI stock relative to GDP, 2010
Source: UNCTAD-Eora GVC Database, UNCTAD FDI Database, UNCTAD analysis.
Note: Data for 180 countries, ranked by inward FDI stock relative to GDP and grouped in quartiles; data reported are median
values for each quartile.
1st quartile
(Countries with high FDIstock relative to GDP)
2nd quartile
3rd quartile
4th quartile
(Countries with low FDIstock relative to GDP)
34%
24%
17%
18%
Foreign value added
in export GVC participation
Contribution of value added
trade to GDP
58%
54%
47%
47%
37%
30%
24%
21%
CHAPTER IV Global Value Chains: Investment and Trade for Development 139
Table IV.2. Role of TNCs in shaping value added trade in the Thai automotive industry
Indicators Values Example affiliates and co-affiliates
Automotive industry production in Thailand
Gross output ~$34 billion
Mitsubishi: Tri Petch Isuzu Sales Co. Ltd.
Honda: Thai Honda Manufacturing Co. Ltd.
BMW Manufacturing Co. Ltd.
Export share in gross output 78%
Domestic value added share in exports 25%
Share of domestic value added contributed by industries
other than automotive in Thailand40%
Number of foreign affiliates of TNCs 52
Number of business groups (TNC networks) to which
these foreign affiliates belong35
Foreign affiliates as share of total number of firms 4%
Upstream: foreign value added used by the automotive industry in Thailand (imports)
Foreign value added share in exports 75%
Mitsubishi: NHK Manufacturing, Malaysia
(electronic components)
Honda: Kyusyu TS Co.,Ltd., Japan (plastics)
BMW: SGL Carbon Fibers Limited, UK (chemicals)
Number of potential intra-firm supplier links ~6,000
Number of countries in which these intra-firm suppliers
are based61
Estimated share of foreign value added sourced intra-
firm (intra-firm import propensity)27%
Downstream: exports from the automotive industry in Thailand
Number of potential intra-firm client links 850 Mitsubishi: Guangzhou Intex Auto Parts Co.,
China (automotive parts)
Honda Trading de México, SA, Mexico (wholesale)
BMW Brilliance Automotive Ltd., China
(wholesale)
Number of countries in which these intra-firm clients are
based57
Estimated share of intra-firm exports (intra-firm export
propensity)65%
Source: UNCTAD analysis, based on the UNCTAD-Eora GVC Database and the Business Group Database.
Box IV.4. Assessing value added trade patterns at the firm level
Determining how TNCs and their networks of foreign affiliates and contractual partners shape patterns of value
added trade is challenging, as information on TNC ownership structures and financial data is fragmented, and
transactions between affiliates within the same group are typically not reported. In order to fill this gap, UNCTAD
has linked the UNCTAD-Eora GVC Database with firm-level ownership and financial data from a business group
databasea (based on the Orbis ownership database), which allows the mapping of some 50,000 international
business groups with nearly 500,000 affiliates worldwide. The database contains key information on TNC activity
by country and industry (as classified by the six-digit NAICS standard system), e.g. the number of foreign affiliates,
revenues, value added, and number of employees.
Linking value added trade data and business group connections yields an index of the propensity for foreign affiliates
to source foreign value added from co-affiliates within their own business group networks, and to provide value
added inputs to other parts of their networks. These propensity indices (upstream and downstream) can be used
to estimate the relevance of intra-firm trade linkages in TNC-governed GVCs (in the absence of data on actual
shipments between affiliates in TNC networks), for a given industry in a given economy.
The methodology includes the following steps:
1. Retrieve sources of production inputs and destinations for production outputs from value added trade data.
2. Match patterns of inputs and outputs (patterns of value added trade) with business group ownership structures.
Any overlap between value added trade flows and the web of co-affiliates is considered a potential intra-firm
trade connection. (If trade flows do not find a correspondence in the network, these connections are considered
to be arm’s-length.)
3. Assign weights to the resulting potential trade-ownership linkages based on a production function derived from
national I-O tables.
4. Estimate upstream and downstream intra-firm trade propensities at business group level. (The sum of the
weights assigned to all intra-firm trade linkages.)
5. Project propensities at the industry level, by applying to the propensities for individual affiliates weights based
on (i) cost of goods sold for the upstream side and (ii) revenues for the downstream side./...
World Investment Report 2013: Global Value Chains: Investment and Trade for Development140
B. GVC governance and locational determinants
In the period immediately after
the Second World War, an
international political economy
grounded in concepts of national
independence, self-sufficiency
and import substitution led to
international trade essentially
being conducted between
autonomous enterprises, with
TNC activity mostly in the form of “multi-domestic”,
host-country-oriented affiliates. This began to
change in the late 1960s and 1970s, with the
initial footfalls of offshore production by Japanese,
European and United States manufacturing TNCs in
South-East Asia, pursuing cost-cutting strategies in
the wake of recession and competitive pressures in
their home (and later global) markets. Subsequent
decades have inexorably built on the dynamic of
these incipient GVCs, with technological progress
(e.g. modern information and communication
technology, international quality standards), political
factors (e.g. liberalization and privatization policies,
China’s emergence as a global manufacturing
base) and investor strategies (e.g. fine-slicing of
operations and offshoring of every segment or
subsegment of their value chains, a greater use
of cross-border non-equity modes) jointly – and
interconnectedly – leading to the trade-investment
nexus of today.
TNC’s decisions on
where to locate and
with whom to partner
are decisions on where
to invest and from
where to trade. These
decisions drive patterns
of value added in GVCs.
As seen in the previous section, trade within the
ambit of TNCs in this nexus includes, first, cross-
border intra-company trade; second, trade
governed by contracts between TNCs and their
NEM partners; and finally, cross-border inter-
company arm’s-length transactions in which TNCs
are either supplied with inputs by independent
companies or, in turn, supply them (or serve final
consumer markets). TNCs simultaneously make
decisions on whether to conduct operations
internally or externally (i.e. outsource them to other
firms either through contracts or markets) and
determine if they should be located in their home
country or geographically dispersed.
Because such decisions directly impact on
investment, production, and value added creation
and retention in host countries, this section looks,
first, at how TNCs manage their GVCs, including
trade flows and, second, at which factors are
key locational determinants at each segment or
stage within a GVC. TNCs’ orchestration and
coordination of their GVCs, can significantly affect
the strategies of national governments and local
firms. For instance, inasmuch as TNCs relocate
segments of their value chains (or activities within
them) to new host countries, countries keen to
attract FDI or other forms of TNC participation must
formulate their investment promotion policies in
line with segment-specific determinants in order to
focus their resources more effectively.
Box IV.4. Assessing value added trade patterns at the firm level (concluded)
The methodology has a number of limitations. The first is the underlying assumption that any ownership connection
in business groups that matches with a value added trade link translates into an intra-firm trade link; i.e. all inputs
sourced from a country in which a co-affiliate is present (and carries out the matching economic activity) are assumed
to be sourced from that co-affiliate. This assumption is validated by earlier studies that found that 80 per cent of
company transactions with countries in which an affiliate is present are intra-firm transactions.b The second limitation
relates to the assumption that all firms in the industry share the same production function. As a consequence, the
method cannot discriminate the foreign input share between foreign affiliate and domestic firms. Foreign affiliates
can be assumed to have higher foreign value added than domestic firms.
Despite these limitations, and the fact that the current method can treat only one industry/country combination at a
time, this approach – one of the first systematic (not based on case studies) analyses of the role of TNCs in GVCs –
can provide insights into how TNC group structures shape patterns of value added trade.
Source: UNCTAD.
Note: Notes appear at the end of this chapter.
CHAPTER IV Global Value Chains: Investment and Trade for Development 141
Box IV.5. GVC governance: systems, processes and tools
A significant part of TNCs’ capabilities or assets in today’s GVCs are related to how they manage, control and
coordinate their global networks. Consequently, TNCs design their corporate structures, management processes,
functional services and associated procedures and tools to govern GVCs with a number of aims in mind:
First, the transmission of goals and requirements related to products, processes and activities — along with
relevant technologies, skills, technical specifications, etc. – to affiliates, contract partners and independent
firms (for arm’s-length transactions);
Second, to maintain and enhance, as much as possible, their power balance over these same firms; and
Third, to maximize their appropriation of the total value added in the GVC.
In order to manage GVCs and meet their overall aims, TNCs have evolved and reconfigured their corporate services
and support processes. They have become full-fledged international infrastructures for the management of far-
flung activities, encompassing affiliates, NEMs and arm’s-length transaction networks. This infrastructure is adapted
by each and every TNC, as appropriate. Differences in industry drivers and dynamics, as well as TNC strategic
responses to these, lead to a variety of GVC patterns – so their governance also necessarily varies considerably.
Which particular corporate service or process is outsourced depends on whether it is “core” (i.e. crucial for competitive
advantage) or not, the value of doing so (e.g. can external institutions better train a TNC’s NEM partners, or indeed
its own affiliates), the costs, the availability of suitable NEM partners and other locational determinants. In terms
of “core” infrastructure, usually the vision, control and supervisory functions are retained at the TNC headquarters
(although they can, in principle, be positioned in different global locations), while supply chain management and
support functions can be separated into core and non-core elements, depending on the circumstances of the TNC
and its GVC. For instance, distribution and logistics are increasingly seen by TNCs as non-core and outsourced,
often to globally integrated logistics TNCs that specialize in offering such services. DHL (Germany), for example,
is such a logistics TNC and provides support to major TNCs in different global locations with logistical and supply
chain solutions.
Supply chain management strategy is at the heart of TNC’s coordination of their GVCs. Of course, the structures
of supply chain strategies vary on the basis of contextual factors e.g. demand variation, product life-cycles and
managerial objectives.a Whether elements of supply chain management are located in the home country, set
up in critical international locations for global management purposes, designed to favour a strategy of regional
value chains or fully farmed out to partner firms at the host country level depends on the specifics of a GVC. For
instance, IBM (United States) has moved from a structure defined by regional divisions in the 1960s and 1970s
(with product sales in 150 countries), through a globally integrated firm in the 1980s and 1990s, to one in which
“supply chain management analytics” within a network structure are at the heart of how it operates today. Along
the way, it has integrated over 30 supply chains into one and focuses particular attention on areas such as risk
management, visibility, cost containment and sustainability. This process, supported by ICT-based services has
improved coordination, reduced costs and boosted profitability.b
Source: UNCTAD.
Note: Notes appear at the end of this chapter.
1. GVC governance: the orchestration of fragmented and internationally dispersed operations
TNCs are increasingly able
to fine-slice activities and
operations in their value
chains, and place them
in the most cost-effective
location, domestically
and globally (WIR11).
This situation presents
companies with a potentially highly fragmented
organizational architecture or GVC configuration.
It might include multiple operations, activities and
tasks; numerous affiliates (FDI), contractual partner
firms (NEMs) and arm’s-length transactions, each
of these modes on their own or in combination;
and, finally, a geographical dispersion of GVC
segments, activities and modes of governance.
Ultimately, effective GVC governance requires
absolute attention to communication, information
flows and logistics across the global TNC network.
Such expansive GVCs, in which TNCs must
simultaneously manage complex, fragmented,
geographically dispersed production processes
and flows in trade and investment, have to be
TNCs manage GVCs through
complex webs of supplier
relationships and various
governance modes.
Different governance modes
have different development
implications.
World Investment Report 2013: Global Value Chains: Investment and Trade for Development142
organized, orchestrated and coordinated in line
with companies’ strategic objectives (see box
IV.5). GVCs can be large and complex, and they
extend far beyond manufacturing. For instance,
even the relatively simple GVC of Starbuck’s
(United States), based on one service (the sale
of coffee), requires the management of a value
chain that spans all continents; directly employs
150,000 people; sources coffee from thousands
of traders, agents and contract farmers across the
developing world; manufactures coffee in over 30
plants, mostly in alliance with partner firms, usually
close to final market; distributes the coffee to retail
outlets through over 50 major central and regional
warehouses and distribution centres; and operates
some 17,000 retail stores in over 50 countries
across the globe.7 This GVC has to be efficient and
profitable, while following strict product/service
standards for quality. It is supported by a large
array of services, including those connected to
supply chain management and human resources
management/development, both within the firm
itself and in relation to suppliers and other partners.
The trade flows involved are immense, including
the movement of agricultural goods, manufactured
produce, and technical and managerial services.
The decision on whether a company opts for
FDI, NEMs or arm’s-length transactions (or a
combination of these), as governance modes in its
GVC is dictated by elements such as transaction
costs, power relations and the risks inherent
in externalization (WIR11). Scholars focusing
on global value chain analysis as an organizing
conceptual framework, argue that the complexity
of this knowledge, whether it can be easily codified
for transmission and the capabilities of suppliers
or partner firms have implications for the particular
governance mode chosen to manage a GVC (or
part of one). This, in turn, requires TNCs to develop
and utilize capabilities most appropriate to the
mode, i.e. FDI, arm’s-length transactions or NEMs.8
(i) Foreign Direct Investment (FDI)
In the case of FDI, a TNC has to be able to effectively
coordinate and integrate affiliate activities. In GVCs
where knowledge flows are complex, but not easy
to codify (they may be tacit or not easily separable
because of the co-specialization of assets), and if
the capabilities of potential partners or arm’s-length
suppliers are low, then internalization of operations
through FDI is the governance mode most likely to
prevail.Managing these activities within a company is
itself complex and involves considerable costs, and
TNCs have developed complex strategic corporate
support infrastructures to manage their operations,
i.e. “HQ functions” such as human resources,
accounting and operations management. These
further enhance a company’s ability to organize,
coordinate and manage globally dispersed affiliates
operating in a range of segments along its GVC. In
the GVC literature, this mode is commonly referred
to as “hierarchy” and is applied in the case of cross-
border vertical integration along different sectors of
a value chain.9
(ii) Arm’s-length transactions
TNCs’ reliance on arm’s-length transactions
internationally requires a capacity to source
from or service a fully independent company at
a distance. This mode of governance is most
suitable for standardized products for which it
is possible to exchange information on a good
or service – prices, specifications (maybe based
on international standards), quality assurance –
between buyers and suppliers in a simple way. This
market mode of GVC governance is a significant
feature in some GVCs and requires relatively simple
coordination capabilities, namely the ability to
source (procurement) and service at a distance, as
well as procedures for monitoring compliance.
(iii) Non-equity modes (NEMs)
TNCs use NEMs for governance in GVCs when
the complexity of the buyer-seller relationship leads
to increased coordination costs and transactional
interdependence. The use of NEMs within TNC
GVC networks is today highly developed (WIR11),
but the mechanisms for coordinating them vary.
This variety can be captured by treating these
mechanisms as subcategories of NEMs (or NEM
modes of governance). In the GVC literature there
are three principal types of NEM: captive, modular
and relational. A particular NEM supplier is not
tied to any one of these modes; depending on its
capabilities, it could potentially operate in each of
them simultaneously with different TNCs.
In the case of captive NEMs, a TNC responds to the
limited capabilities of potential suppliers or partners
by providing clear, codified instructions for tasks
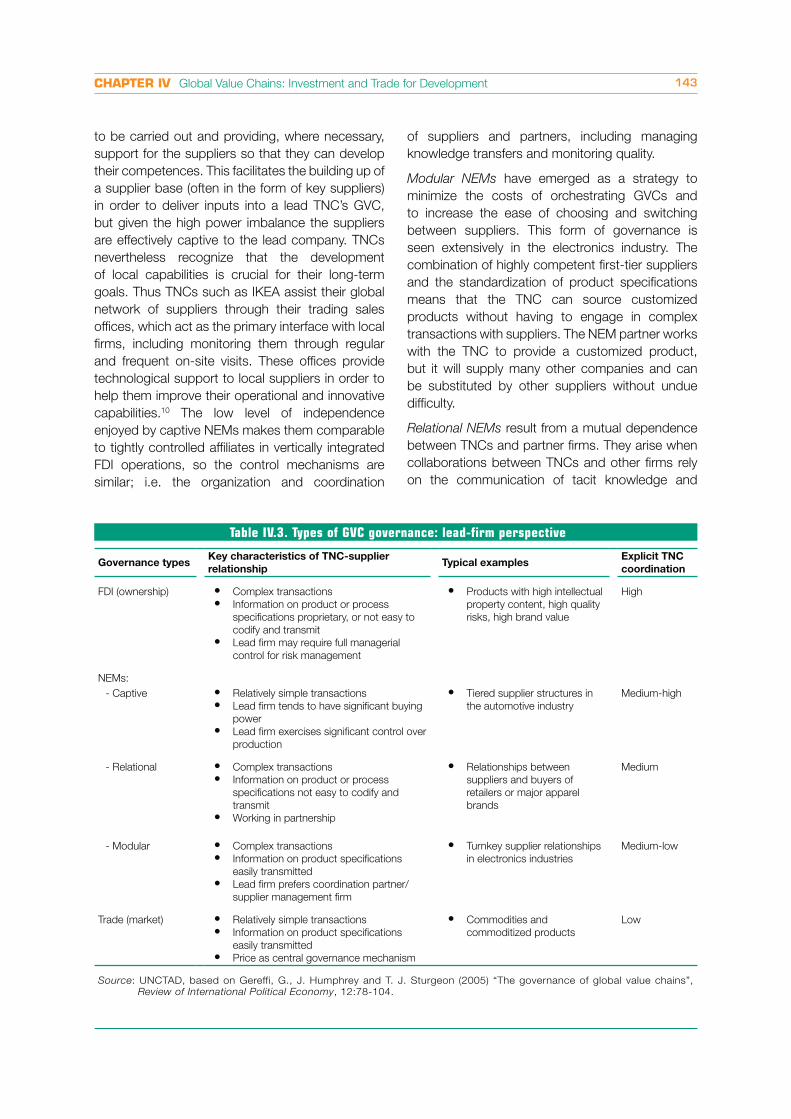
CHAPTER IV Global Value Chains: Investment and Trade for Development 143
to be carried out and providing, where necessary,
support for the suppliers so that they can develop
their competences. This facilitates the building up of
a supplier base (often in the form of key suppliers)
in order to deliver inputs into a lead TNC’s GVC,
but given the high power imbalance the suppliers
are effectively captive to the lead company. TNCs
nevertheless recognize that the development
of local capabilities is crucial for their long-term
goals. Thus TNCs such as IKEA assist their global
network of suppliers through their trading sales
offices, which act as the primary interface with local
firms, including monitoring them through regular
and frequent on-site visits. These offices provide
technological support to local suppliers in order to
help them improve their operational and innovative
capabilities.10 The low level of independence
enjoyed by captive NEMs makes them comparable
to tightly controlled affiliates in vertically integrated
FDI operations, so the control mechanisms are
similar; i.e. the organization and coordination
Table IV.3. Types of GVC governance: lead-firm perspective
Governance typesKey characteristics of TNC-supplier
relationshipTypical examples
Explicit TNC
coordination
FDI (ownership) Complex transactions
Information on product or process
specifications proprietary, or not easy to
codify and transmit
Lead firm may require full managerial
control for risk management
Products with high intellectual
property content, high quality
risks, high brand value
High
NEMs:
- Captive Relatively simple transactions
Lead firm tends to have significant buying
power
Lead firm exercises significant control over
production
Tiered supplier structures in
the automotive industry
Medium-high
- Relational Complex transactions
Information on product or process
specifications not easy to codify and
transmit
Working in partnership
Relationships between
suppliers and buyers of
retailers or major apparel
brands
Medium
- Modular Complex transactions
Information on product specifications
easily transmitted
Lead firm prefers coordination partner/
supplier management firm
Turnkey supplier relationships
in electronics industries
Medium-low
Trade (market) Relatively simple transactions
Information on product specifications
easily transmitted
Price as central governance mechanism
Commodities and
commoditized products
Low
Source: UNCTAD, based on Gereffi, G., J. Humphrey and T. J. Sturgeon (2005) “The governance of global value chains”,
Review of International Political Economy, 12:78-104.
of suppliers and partners, including managing
knowledge transfers and monitoring quality.
Modular NEMs have emerged as a strategy to
minimize the costs of orchestrating GVCs and
to increase the ease of choosing and switching
between suppliers. This form of governance is
seen extensively in the electronics industry. The
combination of highly competent first-tier suppliers
and the standardization of product specifications
means that the TNC can source customized
products without having to engage in complex
transactions with suppliers. The NEM partner works
with the TNC to provide a customized product,
but it will supply many other companies and can
be substituted by other suppliers without undue
difficulty.
Relational NEMs result from a mutual dependence
between TNCs and partner firms. They arise when
collaborations between TNCs and other firms rely
on the communication of tacit knowledge and
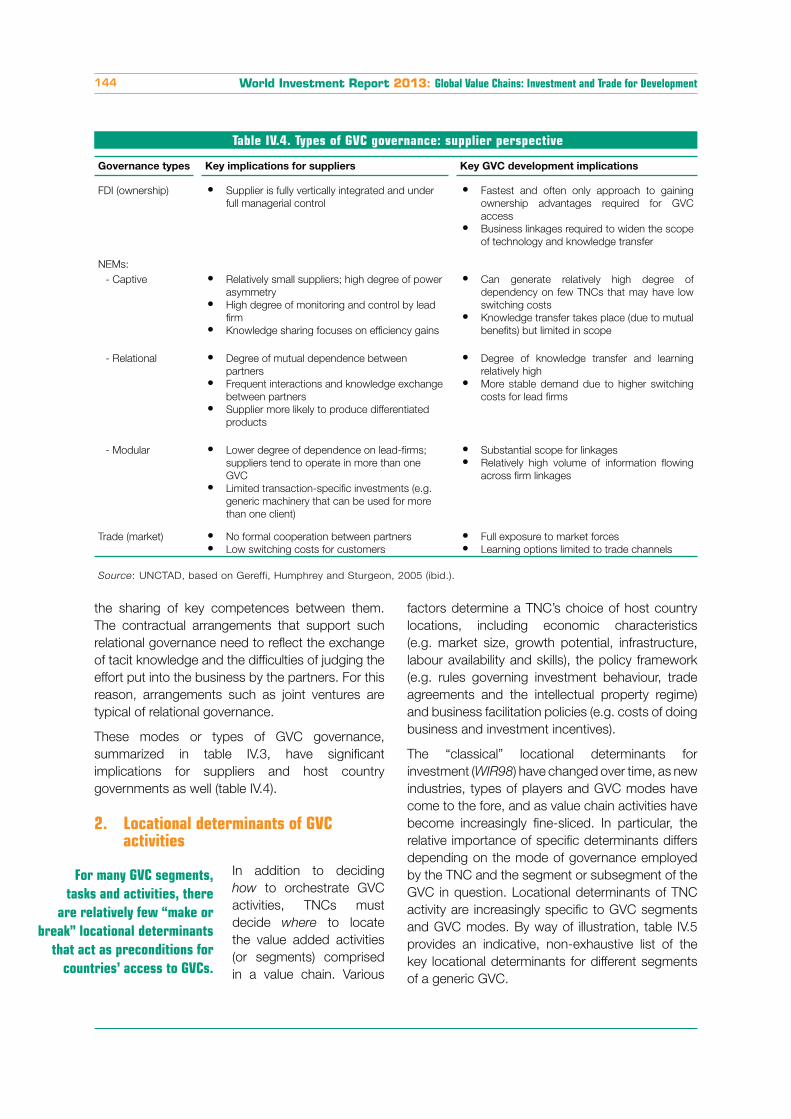
World Investment Report 2013: Global Value Chains: Investment and Trade for Development144
Table IV.4. Types of GVC governance: supplier perspective
Governance types Key implications for suppliers Key GVC development implications
FDI (ownership) Supplier is fully vertically integrated and under
full managerial control
Fastest and often only approach to gaining
ownership advantages required for GVC
access
Business linkages required to widen the scope
of technology and knowledge transfer
NEMs:
- Captive Relatively small suppliers; high degree of power
asymmetry
High degree of monitoring and control by lead
firm
Knowledge sharing focuses on efficiency gains
Can generate relatively high degree of
dependency on few TNCs that may have low
switching costs
Knowledge transfer takes place (due to mutual
benefits) but limited in scope
- Relational Degree of mutual dependence between
partners
Frequent interactions and knowledge exchange
between partners
Supplier more likely to produce differentiated
products
Degree of knowledge transfer and learning
relatively high
More stable demand due to higher switching
costs for lead firms
- Modular Lower degree of dependence on lead-firms;
suppliers tend to operate in more than one
GVC
Limited transaction-specific investments (e.g.
generic machinery that can be used for more
than one client)
Substantial scope for linkages
Relatively high volume of information flowing
across firm linkages
Trade (market) No formal cooperation between partners
Low switching costs for customers
Full exposure to market forces
Learning options limited to trade channels
Source: UNCTAD, based on Gereffi, Humphrey and Sturgeon, 2005 (ibid.).
the sharing of key competences between them.
The contractual arrangements that support such
relational governance need to reflect the exchange
of tacit knowledge and the difficulties of judging the
effort put into the business by the partners. For this
reason, arrangements such as joint ventures are
typical of relational governance.
These modes or types of GVC governance,
summarized in table IV.3, have significant
implications for suppliers and host country
governments as well (table IV.4).
2. Locational determinants of GVC activities
In addition to deciding
how to orchestrate GVC
activities, TNCs must
decide where to locate
the value added activities
(or segments) comprised
in a value chain. Various
factors determine a TNC’s choice of host country
locations, including economic characteristics
(e.g. market size, growth potential, infrastructure,
labour availability and skills), the policy framework
(e.g. rules governing investment behaviour, trade
agreements and the intellectual property regime)
and business facilitation policies (e.g. costs of doing
business and investment incentives).
The “classical” locational determinants for
investment (WIR98) have changed over time, as new
industries, types of players and GVC modes have
come to the fore, and as value chain activities have
become increasingly fine-sliced. In particular, the
relative importance of specific determinants differs
depending on the mode of governance employed
by the TNC and the segment or subsegment of the
GVC in question. Locational determinants of TNC
activity are increasingly specific to GVC segments
and GVC modes. By way of illustration, table IV.5
provides an indicative, non-exhaustive list of the
key locational determinants for different segments
of a generic GVC.
For many GVC segments,
tasks and activities, there
are relatively few “make or
break” locational determinants
that act as preconditions for
countries’ access to GVCs.
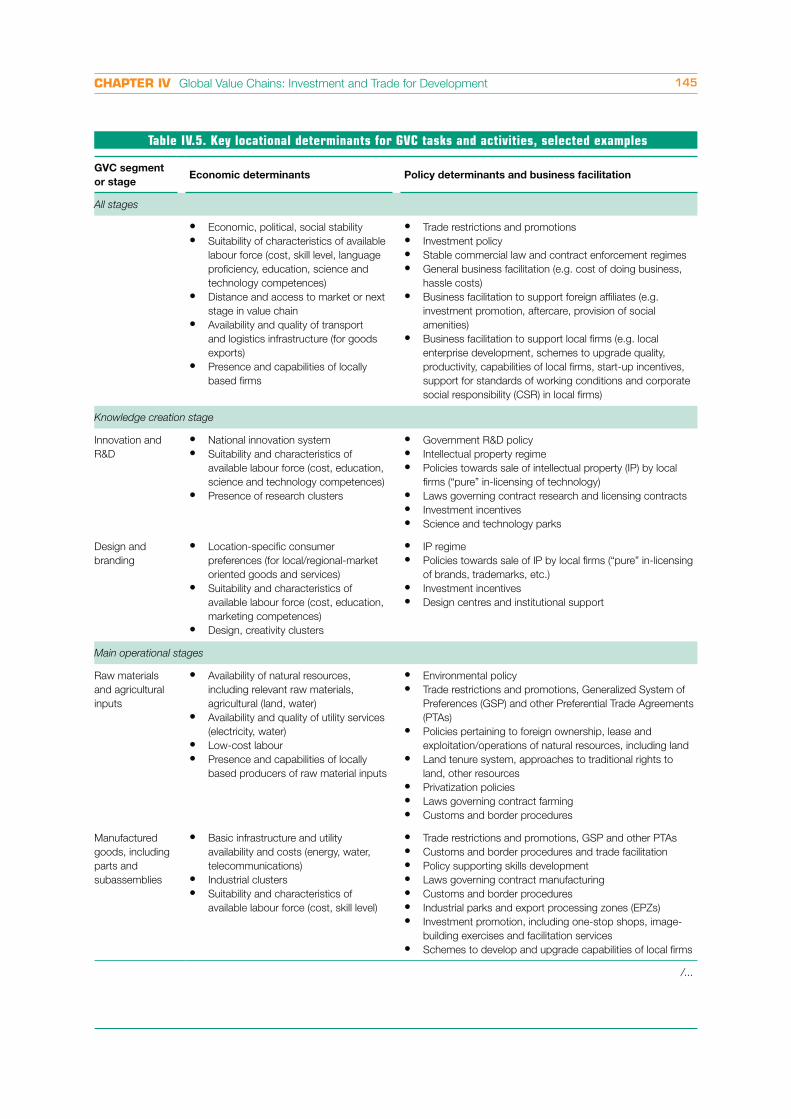
CHAPTER IV Global Value Chains: Investment and Trade for Development 145
Table IV.5. Key locational determinants for GVC tasks and activities, selected examples
GVC segment
or stageEconomic determinants Policy determinants and business facilitation
All stages
Economic, political, social stability
Suitability of characteristics of available
labour force (cost, skill level, language
proficiency, education, science and
technology competences)
Distance and access to market or next
stage in value chain
Availability and quality of transport
and logistics infrastructure (for goods
exports)
Presence and capabilities of locally
based firms
Trade restrictions and promotions
Investment policy
Stable commercial law and contract enforcement regimes
General business facilitation (e.g. cost of doing business,
hassle costs)
Business facilitation to support foreign affiliates (e.g.
investment promotion, aftercare, provision of social
amenities)
Business facilitation to support local firms (e.g. local
enterprise development, schemes to upgrade quality,
productivity, capabilities of local firms, start-up incentives,
support for standards of working conditions and corporate
social responsibility (CSR) in local firms)
Knowledge creation stage
Innovation and
R&D
National innovation system
Suitability and characteristics of
available labour force (cost, education,
science and technology competences)
Presence of research clusters
Government R&D policy
Intellectual property regime
Policies towards sale of intellectual property (IP) by local
firms (“pure” in-licensing of technology)
Laws governing contract research and licensing contracts
Investment incentives
Science and technology parks
Design and
branding
Location-specific consumer
preferences (for local/regional-market
oriented goods and services)
Suitability and characteristics of
available labour force (cost, education,
marketing competences)
Design, creativity clusters
IP regime
Policies towards sale of IP by local firms (“pure” in-licensing
of brands, trademarks, etc.)
Investment incentives
Design centres and institutional support
Main operational stages
Raw materials
and agricultural
inputs
Availability of natural resources,
including relevant raw materials,
agricultural (land, water)
Availability and quality of utility services
(electricity, water)
Low-cost labour
Presence and capabilities of locally
based producers of raw material inputs
Environmental policy
Trade restrictions and promotions, Generalized System of
Preferences (GSP) and other Preferential Trade Agreements
(PTAs)
Policies pertaining to foreign ownership, lease and
exploitation/operations of natural resources, including land
Land tenure system, approaches to traditional rights to
land, other resources
Privatization policies
Laws governing contract farming
Customs and border procedures
Manufactured
goods, including
parts and
subassemblies
Basic infrastructure and utility
availability and costs (energy, water,
telecommunications)
Industrial clusters
Suitability and characteristics of
available labour force (cost, skill level)
Trade restrictions and promotions, GSP and other PTAs
Customs and border procedures and trade facilitation
Policy supporting skills development
Laws governing contract manufacturing
Customs and border procedures
Industrial parks and export processing zones (EPZs)
Investment promotion, including one-stop shops, image-
building exercises and facilitation services
Schemes to develop and upgrade capabilities of local firms
/...
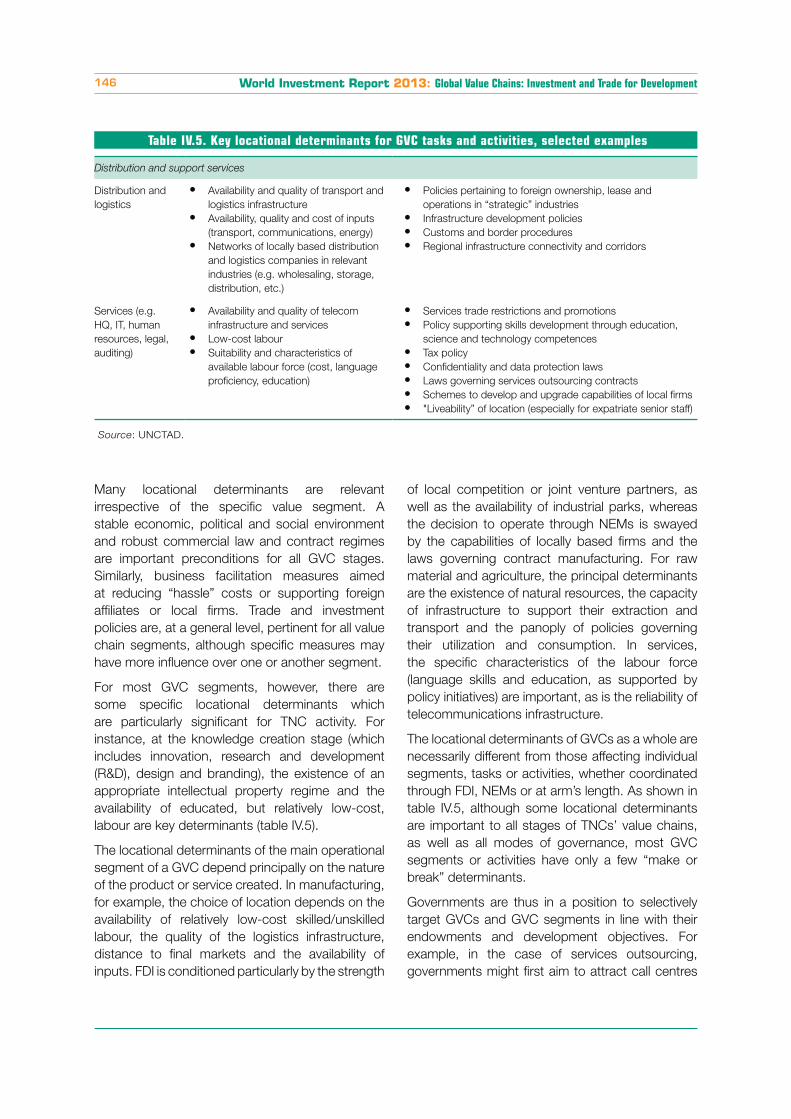
World Investment Report 2013: Global Value Chains: Investment and Trade for Development146
Table IV.5. Key locational determinants for GVC tasks and activities, selected examples
Distribution and support services
Distribution and
logistics
Availability and quality of transport and
logistics infrastructure
Availability, quality and cost of inputs
(transport, communications, energy)
Networks of locally based distribution
and logistics companies in relevant
industries (e.g. wholesaling, storage,
distribution, etc.)
Policies pertaining to foreign ownership, lease and
operations in “strategic” industries
Infrastructure development policies
Customs and border procedures
Regional infrastructure connectivity and corridors
Services (e.g.
HQ, IT, human
resources, legal,
auditing)
Availability and quality of telecom
infrastructure and services
Low-cost labour
Suitability and characteristics of
available labour force (cost, language
proficiency, education)
Services trade restrictions and promotions
Policy supporting skills development through education,
science and technology competences
Tax policy
Confidentiality and data protection laws
Laws governing services outsourcing contracts
Schemes to develop and upgrade capabilities of local firms
"Liveability” of location (especially for expatriate senior staff)
Source: UNCTAD.
Many locational determinants are relevant
irrespective of the specific value segment. A
stable economic, political and social environment
and robust commercial law and contract regimes
are important preconditions for all GVC stages.
Similarly, business facilitation measures aimed
at reducing “hassle” costs or supporting foreign
affiliates or local firms. Trade and investment
policies are, at a general level, pertinent for all value
chain segments, although specific measures may
have more influence over one or another segment.
For most GVC segments, however, there are
some specific locational determinants which
are particularly significant for TNC activity. For
instance, at the knowledge creation stage (which
includes innovation, research and development
(R&D), design and branding), the existence of an
appropriate intellectual property regime and the
availability of educated, but relatively low-cost,
labour are key determinants (table IV.5).
The locational determinants of the main operational
segment of a GVC depend principally on the nature
of the product or service created. In manufacturing,
for example, the choice of location depends on the
availability of relatively low-cost skilled/unskilled
labour, the quality of the logistics infrastructure,
distance to final markets and the availability of
inputs. FDI is conditioned particularly by the strength
of local competition or joint venture partners, as
well as the availability of industrial parks, whereas
the decision to operate through NEMs is swayed
by the capabilities of locally based firms and the
laws governing contract manufacturing. For raw
material and agriculture, the principal determinants
are the existence of natural resources, the capacity
of infrastructure to support their extraction and
transport and the panoply of policies governing
their utilization and consumption. In services,
the specific characteristics of the labour force
(language skills and education, as supported by
policy initiatives) are important, as is the reliability of
telecommunications infrastructure.
The locational determinants of GVCs as a whole are
necessarily different from those affecting individual
segments, tasks or activities, whether coordinated
through FDI, NEMs or at arm’s length. As shown in
table IV.5, although some locational determinants
are important to all stages of TNCs’ value chains,
as well as all modes of governance, most GVC
segments or activities have only a few “make or
break” determinants.
Governments are thus in a position to selectively
target GVCs and GVC segments in line with their
endowments and development objectives. For
example, in the case of services outsourcing,
governments might first aim to attract call centres
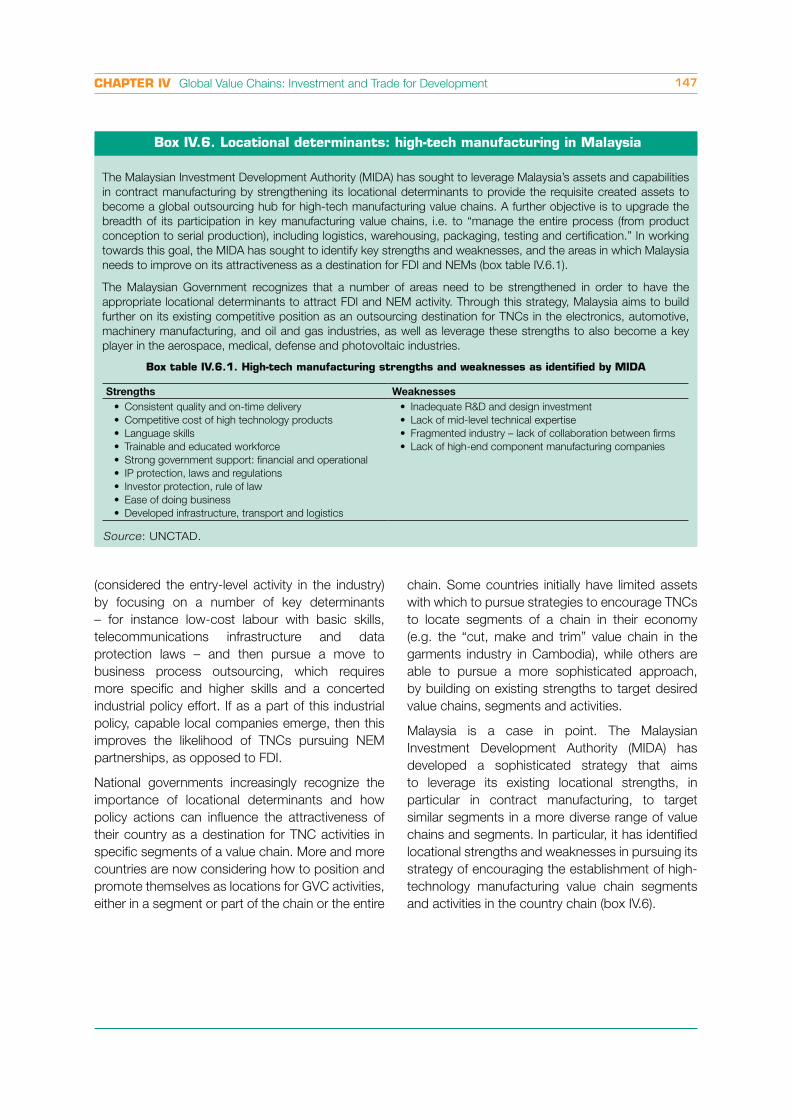
CHAPTER IV Global Value Chains: Investment and Trade for Development 147
(considered the entry-level activity in the industry)
by focusing on a number of key determinants
– for instance low-cost labour with basic skills,
telecommunications infrastructure and data
protection laws – and then pursue a move to
business process outsourcing, which requires
more specific and higher skills and a concerted
industrial policy effort. If as a part of this industrial
policy, capable local companies emerge, then this
improves the likelihood of TNCs pursuing NEM
partnerships, as opposed to FDI.
National governments increasingly recognize the
importance of locational determinants and how
policy actions can influence the attractiveness of
their country as a destination for TNC activities in
specific segments of a value chain. More and more
countries are now considering how to position and
promote themselves as locations for GVC activities,
either in a segment or part of the chain or the entire
Box IV.6. Locational determinants: high-tech manufacturing in Malaysia
The Malaysian Investment Development Authority (MIDA) has sought to leverage Malaysia’s assets and capabilities
in contract manufacturing by strengthening its locational determinants to provide the requisite created assets to
become a global outsourcing hub for high-tech manufacturing value chains. A further objective is to upgrade the
breadth of its participation in key manufacturing value chains, i.e. to “manage the entire process (from product
conception to serial production), including logistics, warehousing, packaging, testing and certification.” In working
towards this goal, the MIDA has sought to identify key strengths and weaknesses, and the areas in which Malaysia
needs to improve on its attractiveness as a destination for FDI and NEMs (box table IV.6.1).
The Malaysian Government recognizes that a number of areas need to be strengthened in order to have the
appropriate locational determinants to attract FDI and NEM activity. Through this strategy, Malaysia aims to build
further on its existing competitive position as an outsourcing destination for TNCs in the electronics, automotive,
machinery manufacturing, and oil and gas industries, as well as leverage these strengths to also become a key
player in the aerospace, medical, defense and photovoltaic industries.
Box table IV.6.1. High-tech manufacturing strengths and weaknesses as identified by MIDA
Strengths Weaknesses
Source: UNCTAD.
chain. Some countries initially have limited assets
with which to pursue strategies to encourage TNCs
to locate segments of a chain in their economy
(e.g. the “cut, make and trim” value chain in the
garments industry in Cambodia), while others are
able to pursue a more sophisticated approach,
by building on existing strengths to target desired
value chains, segments and activities.
Malaysia is a case in point. The Malaysian
Investment Development Authority (MIDA) has
developed a sophisticated strategy that aims
to leverage its existing locational strengths, in
particular in contract manufacturing, to target
similar segments in a more diverse range of value
chains and segments. In particular, it has identified
locational strengths and weaknesses in pursuing its
strategy of encouraging the establishment of high-
technology manufacturing value chain segments
and activities in the country chain (box IV.6).
World Investment Report 2013: Global Value Chains: Investment and Trade for Development148
GVCs are an expression of
globalization. They spread
economic activities across a
broader range of countries.
As such, they can accelerate
the catch-up of developing
countries’ GDP and income
levels and lead to greater
convergence between
economies. At the global
level, that is the essential development contribution
of GVCs.
At the level of individual developing economies, the
experience is obviously much more heterogeneous.
This section explores the role that GVCs play in the
development process of countries. As firms within
countries gain access to value chains, this affects
their value added creation, employment generation
and potential for learning and productivity growth.
GVCs can also affect the social configuration of
countries and the environment. Not all these effects
are necessarily positive. Lead firms in GVCs – TNCs
– tend to control higher value added activities (from
innovation and technological activities to branding
and new product development), while other firms
(often operating under contractual arrangements in
developing countries) engaged in routine assembly
tasks or services within GVCs may earn less, have
fewer opportunities to grow and be more vulnerable
to business cycles. A summary of the main areas of
development impact of GVCs appears in table IV.6.
The potential impact of GVC participation for host
countries’ economic growth and development
depends on two main factors.
The first is the nature of the GVC itself. Is
it the type of chain that presents potential
for learning and upgrading? Will it enable
capabilities to be acquired by firms that can
be applied to the production of other products
or services? In the garments industry, Mexican
firms have been able to acquire new skills and
functions, becoming full-package suppliers,11
while it seems very difficult for firms in sub-
Saharan Africa supplying garments under
the African Growth and Opportunity Act
programme to move beyond cut, make and
trim.
The second factor is the business and
institutional environment in the host economy.
Is there an environment conducive to firm-level
learning and have investments been made in
technical management skills? Are firms willing
to invest in developing new skills, improving
their capabilities and searching for new market
opportunities? Local firms’ capabilities and
competences determine their ability to gain
access to cross-border value chains, and to be
able to learn, benefit from and upgrade within
GVCs. Government policies can facilitate this
process.
Although indicators of the development impact of
GVCs are well established – for example, UNCTAD
developed and tested a set of GVC impact indicators
in partnership with the G-2012 – the measurement of
GVC impact on host countries is difficult, not least
because of the multiplicity of actors involved in the
GVC (directly in terms of the value chain modularity
encompassing integrated firms, retailers, lead firms,
suppliers, subcontractors, or indirectly in the rest of
the economy) and the spatial scope of value chains
(not just globally but within countries, at the local,
subregional or country level). A novel contribution
of the section is that UNCTAD combines empirical
evidence drawn primarily from the UNCTAD-Eora
GVC Database, with case study evidence drawn
from UNCTAD field work on GVCs in developing
countries, together with existing knowledge from
the vast literature and case studies produced by
scholars in pertinent fields, including economics,
international business, development studies and
sociology, reflecting the multidisciplinary nature of
the topic.
1. Local value capture
Production for exports
directly generates value
added and contributes to
GDP. However, as shown
in Section A, local value
added contributions and
income generation in GVCs
can be limited through the
use of foreign value added
in exports. In developing countries, on average,
Value capture in GVCs
depends on the use of
imported contents, on the
role of foreign affiliates in
value added creation and
on TNC policies with regard
to income repatriation and
transfer pricing.
GVCs can make a contribu-
tion to development through
direct GDP and employment
gains and by providing
opportunities for indus-
trial upgrading, but these
benefits are not automatic
and there are risks involved
in GVC participation.
C. Development implications of GVCs
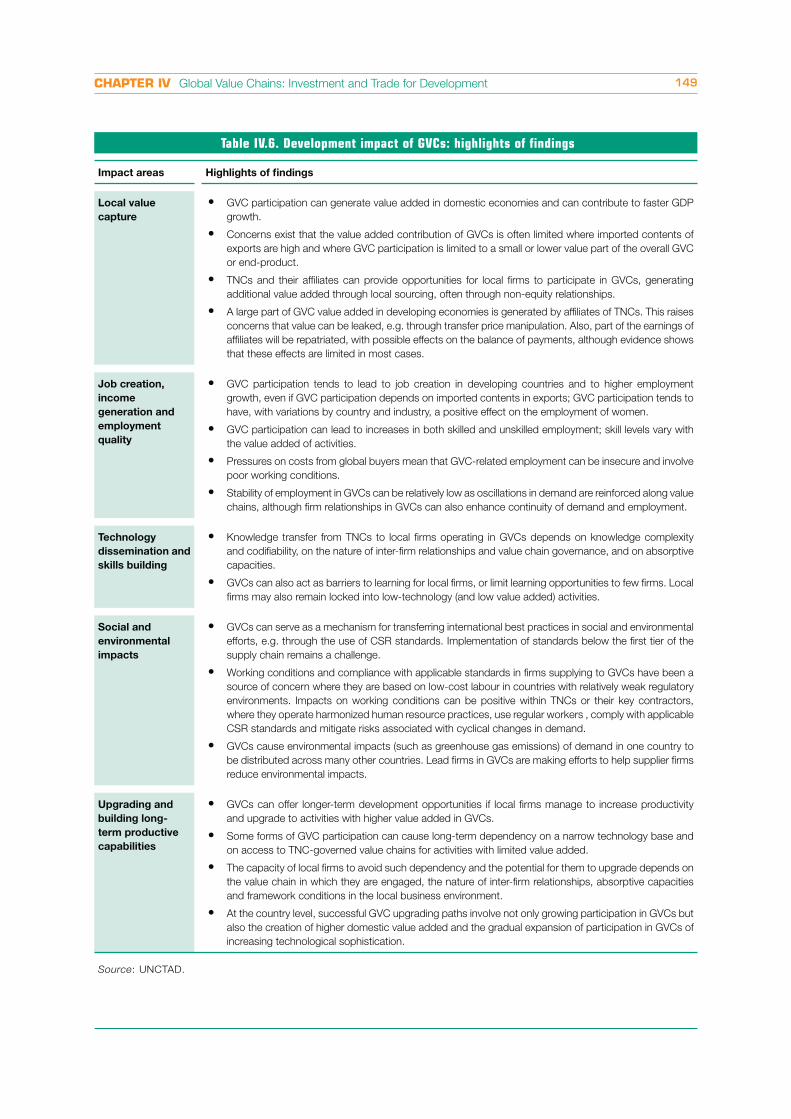
CHAPTER IV Global Value Chains: Investment and Trade for Development 149
Table IV.6. Development impact of GVCs: highlights of findings
Impact areas Highlights of findings
Local value
capture
GVC participation can generate value added in domestic economies and can contribute to faster GDP
growth.
Concerns exist that the value added contribution of GVCs is often limited where imported contents of
exports are high and where GVC participation is limited to a small or lower value part of the overall GVC
or end-product.
TNCs and their affiliates can provide opportunities for local firms to participate in GVCs, generating
additional value added through local sourcing, often through non-equity relationships.
A large part of GVC value added in developing economies is generated by affiliates of TNCs. This raises
concerns that value can be leaked, e.g. through transfer price manipulation. Also, part of the earnings of
affiliates will be repatriated, with possible effects on the balance of payments, although evidence shows
that these effects are limited in most cases.
Job creation,
income
generation and
employment
quality
GVC participation tends to lead to job creation in developing countries and to higher employment
growth, even if GVC participation depends on imported contents in exports; GVC participation tends to
have, with variations by country and industry, a positive effect on the employment of women.
GVC participation can lead to increases in both skilled and unskilled employment; skill levels vary with
the value added of activities.
Pressures on costs from global buyers mean that GVC-related employment can be insecure and involve
poor working conditions.
Stability of employment in GVCs can be relatively low as oscillations in demand are reinforced along value
chains, although firm relationships in GVCs can also enhance continuity of demand and employment.
Technology
dissemination and
skills building
Knowledge transfer from TNCs to local firms operating in GVCs depends on knowledge complexity
and codifiability, on the nature of inter-firm relationships and value chain governance, and on absorptive
capacities.
GVCs can also act as barriers to learning for local firms, or limit learning opportunities to few firms. Local
firms may also remain locked into low-technology (and low value added) activities.
Social and
environmental
impacts
GVCs can serve as a mechanism for transferring international best practices in social and environmental
efforts, e.g. through the use of CSR standards. Implementation of standards below the first tier of the
supply chain remains a challenge.
Working conditions and compliance with applicable standards in firms supplying to GVCs have been a
source of concern where they are based on low-cost labour in countries with relatively weak regulatory
environments. Impacts on working conditions can be positive within TNCs or their key contractors,
where they operate harmonized human resource practices, use regular workers , comply with applicable
CSR standards and mitigate risks associated with cyclical changes in demand.
GVCs cause environmental impacts (such as greenhouse gas emissions) of demand in one country to
be distributed across many other countries. Lead firms in GVCs are making efforts to help supplier firms
reduce environmental impacts.
Upgrading and
building long-
term productive
capabilities
GVCs can offer longer-term development opportunities if local firms manage to increase productivity
and upgrade to activities with higher value added in GVCs.
Some forms of GVC participation can cause long-term dependency on a narrow technology base and
on access to TNC-governed value chains for activities with limited value added.
The capacity of local firms to avoid such dependency and the potential for them to upgrade depends on
the value chain in which they are engaged, the nature of inter-firm relationships, absorptive capacities
and framework conditions in the local business environment.
At the country level, successful GVC upgrading paths involve not only growing participation in GVCs but
also the creation of higher domestic value added and the gradual expansion of participation in GVCs of
increasing technological sophistication.
Source: UNCTAD.
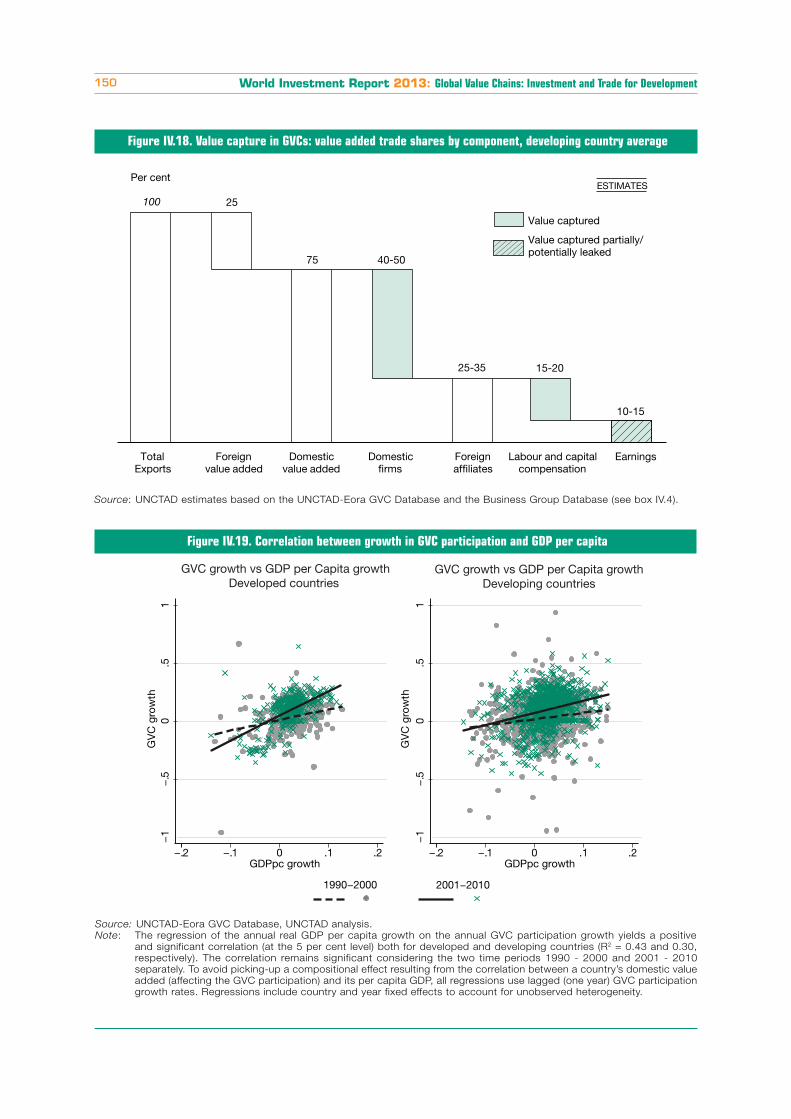
World Investment Report 2013: Global Value Chains: Investment and Trade for Development150
Figure IV.18. Value capture in GVCs: value added trade shares by component, developing country average
Source: UNCTAD estimates based on the UNCTAD-Eora GVC Database and the Business Group Database (see box IV.4).
Total Exports
Foreignvalue added
Domesticvalue added
Domesticfirms
Foreignaffiliates
Labour and capital compensation
Earnings
Value captured
Value captured partially/ potentially leaked
ESTIMATES
100
40-50
15-2025-35
10-15
25
75
Per cent
Figure IV.19. Correlation between growth in GVC participation and GDP per capita
Source: UNCTAD-Eora GVC Database, UNCTAD analysis.
Note: The regression of the annual real GDP per capita growth on the annual GVC participation growth yields a positive
and significant correlation (at the 5 per cent level) both for developed and developing countries (R2 = 0.43 and 0.30,
respectively). The correlation remains significant considering the two time periods 1990 - 2000 and 2001 - 2010
separately. To avoid picking-up a compositional effect resulting from the correlation between a country’s domestic value
added (affecting the GVC participation) and its per capita GDP, all regressions use lagged (one year) GVC participation
growth rates. Regressions include country and year fixed effects to account for unobserved heterogeneity.
GV
C g
row
th−
1−
.50
.51
−.2 −.1 0 .1 .2GDPpc growth
−1
−.5
0.5
1G
VC
gro
wth
−.2 −.1 0 .1 .2GDPpc growth
2001−20101990−2000
GVC growth vs GDP per Capita growthDeveloped countries
GVC growth vs GDP per Capita growthDeveloping countries
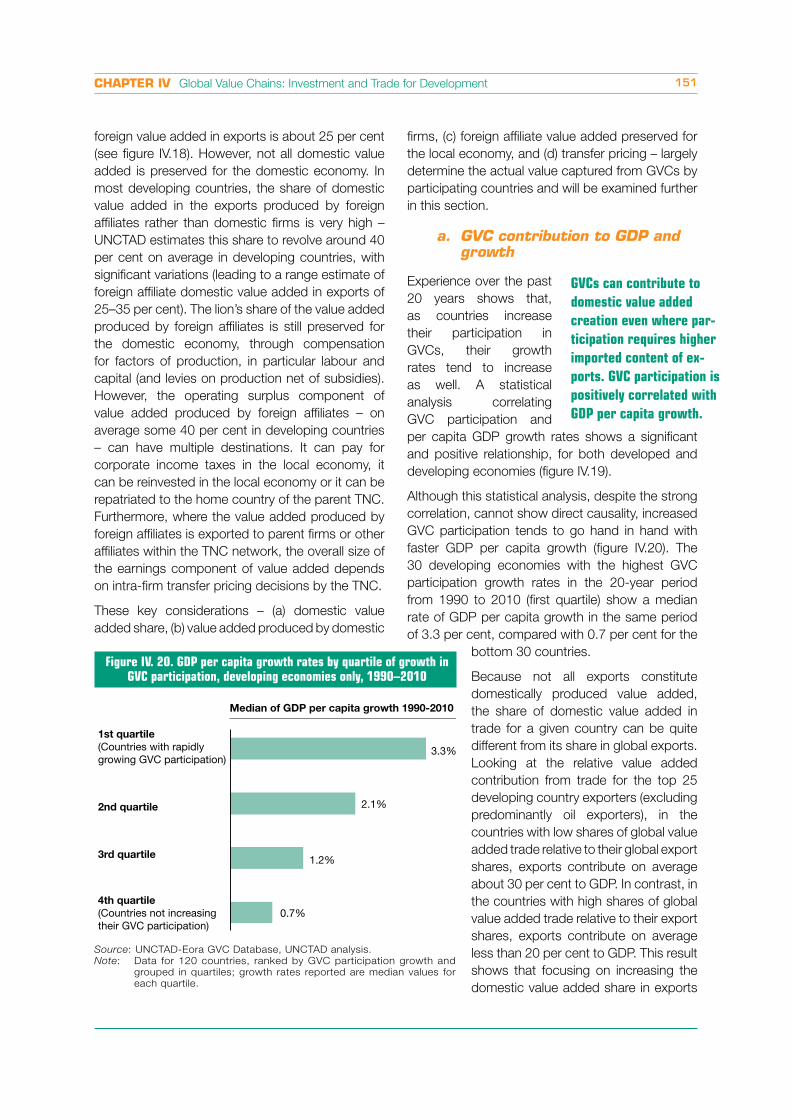
CHAPTER IV Global Value Chains: Investment and Trade for Development 151
foreign value added in exports is about 25 per cent
(see figure IV.18). However, not all domestic value
added is preserved for the domestic economy. In
most developing countries, the share of domestic
value added in the exports produced by foreign
affiliates rather than domestic firms is very high –
UNCTAD estimates this share to revolve around 40
per cent on average in developing countries, with
significant variations (leading to a range estimate of
foreign affiliate domestic value added in exports of
25–35 per cent). The lion’s share of the value added
produced by foreign affiliates is still preserved for
the domestic economy, through compensation
for factors of production, in particular labour and
capital (and levies on production net of subsidies).
However, the operating surplus component of
value added produced by foreign affiliates – on
average some 40 per cent in developing countries
– can have multiple destinations. It can pay for
corporate income taxes in the local economy, it
can be reinvested in the local economy or it can be
repatriated to the home country of the parent TNC.
Furthermore, where the value added produced by
foreign affiliates is exported to parent firms or other
affiliates within the TNC network, the overall size of
the earnings component of value added depends
on intra-firm transfer pricing decisions by the TNC.
These key considerations – (a) domestic value
added share, (b) value added produced by domestic
firms, (c) foreign affiliate value added preserved for
the local economy, and (d) transfer pricing – largely
determine the actual value captured from GVCs by
participating countries and will be examined further
in this section.
a. GVC contribution to GDP and growth
Experience over the past
20 years shows that,
as countries increase
their participation in
GVCs, their growth
rates tend to increase
as well. A statistical
analysis correlating
GVC participation and
per capita GDP growth rates shows a significant
and positive relationship, for both developed and
developing economies (figure IV.19).
Although this statistical analysis, despite the strong
correlation, cannot show direct causality, increased
GVC participation tends to go hand in hand with
faster GDP per capita growth (figure IV.20). The
30 developing economies with the highest GVC
participation growth rates in the 20-year period
from 1990 to 2010 (first quartile) show a median
rate of GDP per capita growth in the same period
of 3.3 per cent, compared with 0.7 per cent for the
bottom 30 countries.
Because not all exports constitute
domestically produced value added,
the share of domestic value added in
trade for a given country can be quite
different from its share in global exports.
Looking at the relative value added
contribution from trade for the top 25
developing country exporters (excluding
predominantly oil exporters), in the
countries with low shares of global value
added trade relative to their global export
shares, exports contribute on average
about 30 per cent to GDP. In contrast, in
the countries with high shares of global
value added trade relative to their export
shares, exports contribute on average
less than 20 per cent to GDP. This result
shows that focusing on increasing the
domestic value added share in exports
Median of GDP per capita growth 1990-2010
1st quartile
(Countries with rapidlygrowing GVC participation)
4th quartile
(Countries not increasingtheir GVC participation)
2nd quartile
3rd quartile
3.3%
2.1%
1.2%
0.7%
Figure IV. 20. GDP per capita growth rates by quartile of growth in GVC participation, developing economies only, 1990–2010
Source: UNCTAD-Eora GVC Database, UNCTAD analysis.
Note: Data for 120 countries, ranked by GVC participation growth and
grouped in quartiles; growth rates reported are median values for
each quartile.
GVCs can contribute to
domestic value added
creation even where par-
ticipation requires higher
imported content of ex-
ports. GVC participation is
positively correlated with
GDP per capita growth.
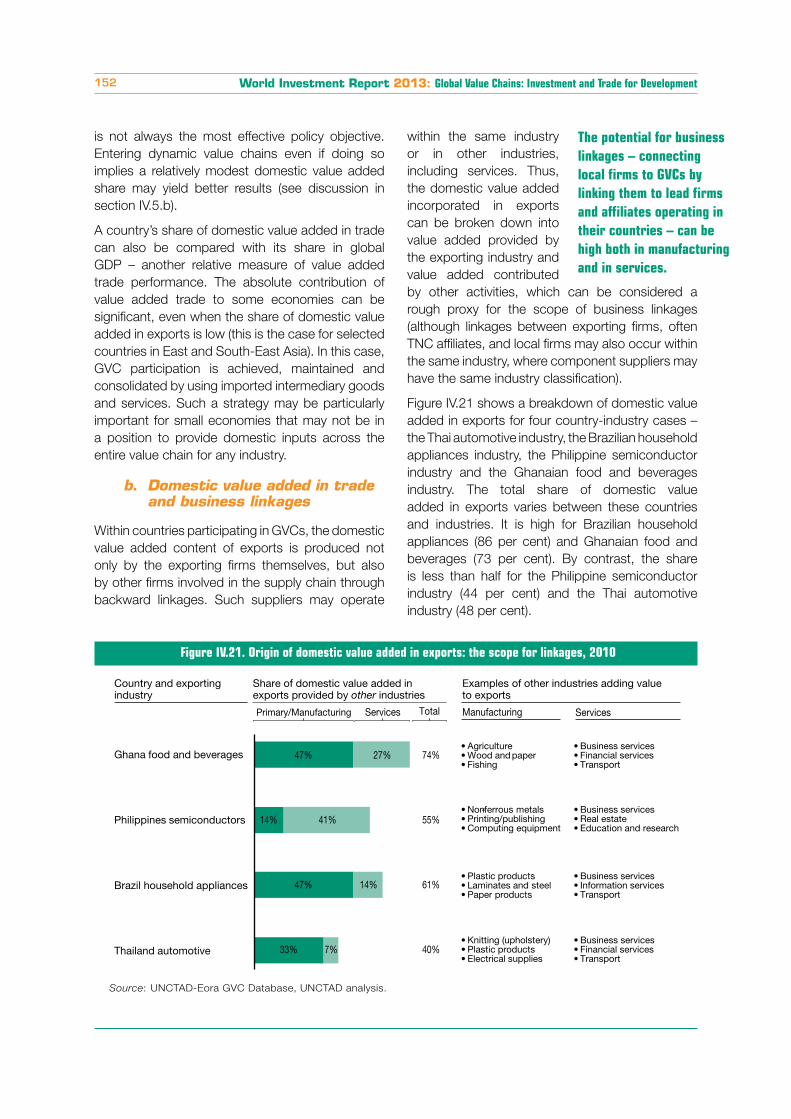
World Investment Report 2013: Global Value Chains: Investment and Trade for Development152
is not always the most effective policy objective.
Entering dynamic value chains even if doing so
implies a relatively modest domestic value added
share may yield better results (see discussion in
section IV.5.b).
A country’s share of domestic value added in trade
can also be compared with its share in global
GDP – another relative measure of value added
trade performance. The absolute contribution of
value added trade to some economies can be
significant, even when the share of domestic value
added in exports is low (this is the case for selected
countries in East and South-East Asia). In this case,
GVC participation is achieved, maintained and
consolidated by using imported intermediary goods
and services. Such a strategy may be particularly
important for small economies that may not be in
a position to provide domestic inputs across the
entire value chain for any industry.
b. Domestic value added in trade and business linkages
Within countries participating in GVCs, the domestic
value added content of exports is produced not
only by the exporting firms themselves, but also
by other firms involved in the supply chain through
backward linkages. Such suppliers may operate
within the same industry
or in other industries,
including services. Thus,
the domestic value added
incorporated in exports
can be broken down into
value added provided by
the exporting industry and
value added contributed
by other activities, which can be considered a
rough proxy for the scope of business linkages
(although linkages between exporting firms, often
TNC affiliates, and local firms may also occur within
the same industry, where component suppliers may
have the same industry classification).
Figure IV.21 shows a breakdown of domestic value
added in exports for four country-industry cases –
the Thai automotive industry, the Brazilian household
appliances industry, the Philippine semiconductor
industry and the Ghanaian food and beverages
industry. The total share of domestic value
added in exports varies between these countries
and industries. It is high for Brazilian household
appliances (86 per cent) and Ghanaian food and
beverages (73 per cent). By contrast, the share
is less than half for the Philippine semiconductor
industry (44 per cent) and the Thai automotive
industry (48 per cent).
Figure IV.21. Origin of domestic value added in exports: the scope for linkages, 2010
Source: UNCTAD-Eora GVC Database, UNCTAD analysis.
Thailand automotive
Brazil household appliances
Philippines semiconductors
Ghana food and beverages
7%
14%
41%
27%
33%
47%
14%
47%
40%
61%
55%
74%
Country and exporting industry
Share of domestic value added in Examples of other industries adding value to exports
AgricultureWood and paperFishing
Business servicesFinancial servicesTransport
Non-ferrous metalsPrinting/publishingComputing equipment
Business servicesReal estateEducation and research
Plastic productsLaminates and steelPaper products
Business servicesInformation servicesTransport
Knitting (upholstery)Plastic productsElectrical supplies
Business servicesFinancial servicesTransport
exports provided by other industries
Primary/Manufacturing Manufacturing ServicesServices Total
The potential for business
linkages – connecting
local firms to GVCs by
linking them to lead firms
and affiliates operating in
their countries – can be
high both in manufacturing
and in services.
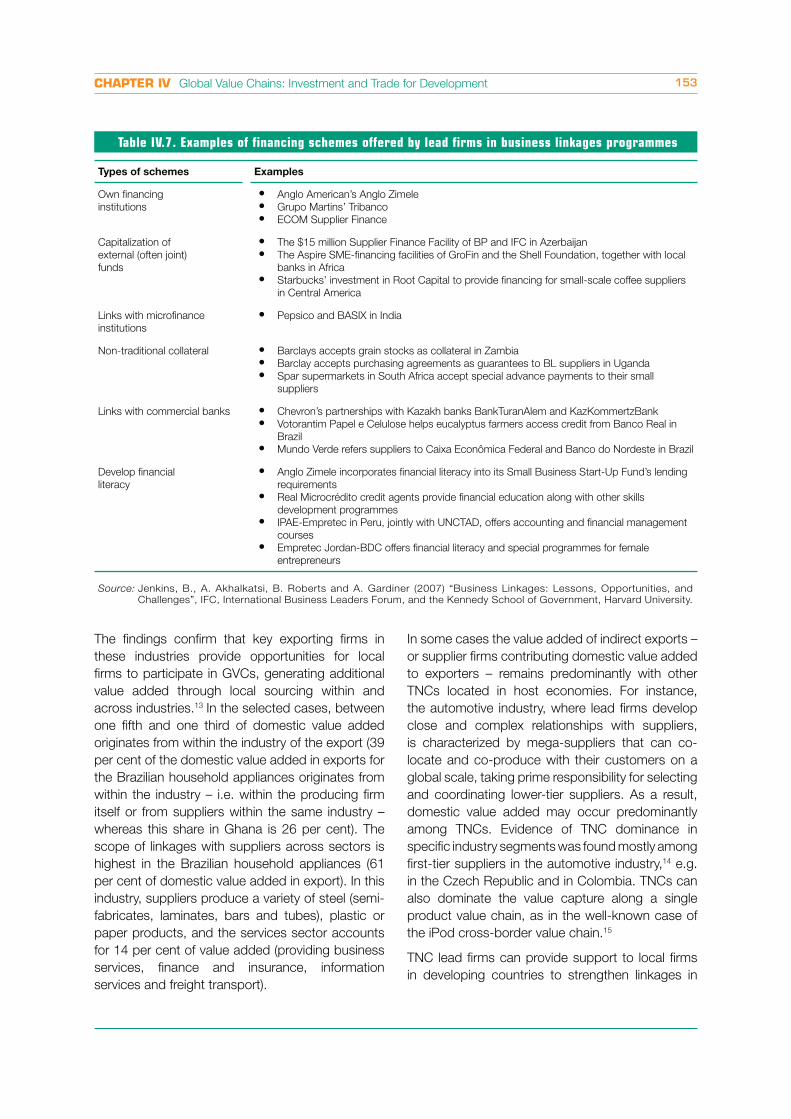
CHAPTER IV Global Value Chains: Investment and Trade for Development 153
Table IV.7. Examples of financing schemes offered by lead firms in business linkages programmes
Types of schemes Examples
Own financing
institutions
Anglo American’s Anglo Zimele
Grupo Martins’ Tribanco
ECOM Supplier Finance
Capitalization of
external (often joint)
funds
The $15 million Supplier Finance Facility of BP and IFC in Azerbaijan
The Aspire SME-financing facilities of GroFin and the Shell Foundation, together with local
banks in Africa
Starbucks’ investment in Root Capital to provide financing for small-scale coffee suppliers
in Central America
Links with microfinance
institutions
Pepsico and BASIX in India
Non-traditional collateral Barclays accepts grain stocks as collateral in Zambia
Barclay accepts purchasing agreements as guarantees to BL suppliers in Uganda
Spar supermarkets in South Africa accept special advance payments to their small
suppliers
Links with commercial banks Chevron’s partnerships with Kazakh banks BankTuranAlem and KazKommertzBank
Votorantim Papel e Celulose helps eucalyptus farmers access credit from Banco Real in
Brazil
Mundo Verde refers suppliers to Caixa Econômica Federal and Banco do Nordeste in Brazil
Develop financial
literacy
Anglo Zimele incorporates financial literacy into its Small Business Start-Up Fund’s lending
requirements
Real Microcrédito credit agents provide financial education along with other skills
development programmes
IPAE-Empretec in Peru, jointly with UNCTAD, offers accounting and financial management
courses
Empretec Jordan-BDC offers financial literacy and special programmes for female
entrepreneurs
Source: Jenkins, B., A. Akhalkatsi, B. Roberts and A. Gardiner (2007) “Business Linkages: Lessons, Opportunities, and
Challenges”, IFC, International Business Leaders Forum, and the Kennedy School of Government, Harvard University.
The findings confirm that key exporting firms in
these industries provide opportunities for local
firms to participate in GVCs, generating additional
value added through local sourcing within and
across industries.13 In the selected cases, between
one fifth and one third of domestic value added
originates from within the industry of the export (39
per cent of the domestic value added in exports for
the Brazilian household appliances originates from
within the industry – i.e. within the producing firm
itself or from suppliers within the same industry –
whereas this share in Ghana is 26 per cent). The
scope of linkages with suppliers across sectors is
highest in the Brazilian household appliances (61
per cent of domestic value added in export). In this
industry, suppliers produce a variety of steel (semi-
fabricates, laminates, bars and tubes), plastic or
paper products, and the services sector accounts
for 14 per cent of value added (providing business
services, finance and insurance, information
services and freight transport).
In some cases the value added of indirect exports –
or supplier firms contributing domestic value added
to exporters – remains predominantly with other
TNCs located in host economies. For instance,
the automotive industry, where lead firms develop
close and complex relationships with suppliers,
is characterized by mega-suppliers that can co-
locate and co-produce with their customers on a
global scale, taking prime responsibility for selecting
and coordinating lower-tier suppliers. As a result,
domestic value added may occur predominantly
among TNCs. Evidence of TNC dominance in
specific industry segments was found mostly among
first-tier suppliers in the automotive industry,14 e.g.
in the Czech Republic and in Colombia. TNCs can
also dominate the value capture along a single
product value chain, as in the well-known case of
the iPod cross-border value chain.15
TNC lead firms can provide support to local firms
in developing countries to strengthen linkages in
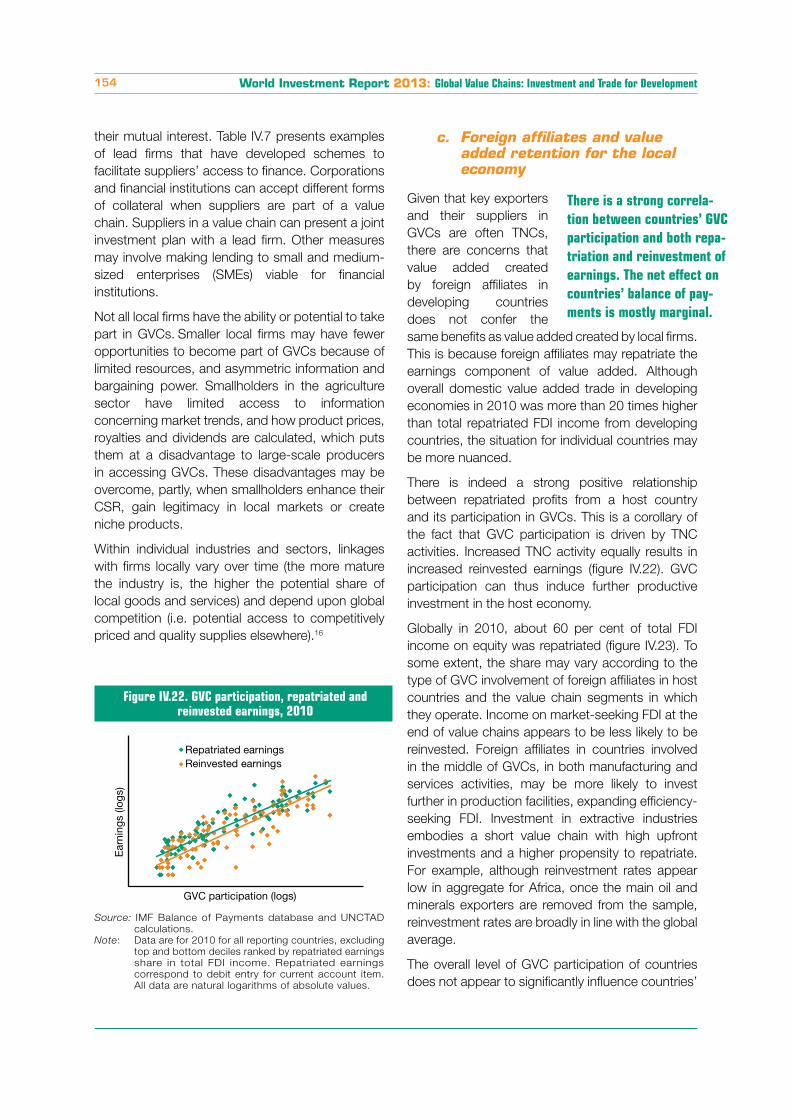
World Investment Report 2013: Global Value Chains: Investment and Trade for Development154
their mutual interest. Table IV.7 presents examples
of lead firms that have developed schemes to
facilitate suppliers’ access to finance. Corporations
and financial institutions can accept different forms
of collateral when suppliers are part of a value
chain. Suppliers in a value chain can present a joint
investment plan with a lead firm. Other measures
may involve making lending to small and medium-
sized enterprises (SMEs) viable for financial
institutions.
Not all local firms have the ability or potential to take
part in GVCs. Smaller local firms may have fewer
opportunities to become part of GVCs because of
limited resources, and asymmetric information and
bargaining power. Smallholders in the agriculture
sector have limited access to information
concerning market trends, and how product prices,
royalties and dividends are calculated, which puts
them at a disadvantage to large-scale producers
in accessing GVCs. These disadvantages may be
overcome, partly, when smallholders enhance their
CSR, gain legitimacy in local markets or create
niche products.
Within individual industries and sectors, linkages
with firms locally vary over time (the more mature
the industry is, the higher the potential share of
local goods and services) and depend upon global
competition (i.e. potential access to competitively
priced and quality supplies elsewhere).16
Figure IV.22. GVC participation, repatriated and reinvested earnings, 2010
Source: IMF Balance of Payments database and UNCTAD
calculations.
Note: Data are for 2010 for all reporting countries, excluding
top and bottom deciles ranked by repatriated earnings
share in total FDI income. Repatriated earnings
correspond to debit entry for current account item.
All data are natural logarithms of absolute values.
GVC participation (logs)
Repatriated earningsReinvested earnings
Ear
ning
s (lo
gs)
c. Foreign affiliates and value added retention for the local economy
Given that key exporters
and their suppliers in
GVCs are often TNCs,
there are concerns that
value added created
by foreign affiliates in
developing countries
does not confer the
same benefits as value added created by local firms.
This is because foreign affiliates may repatriate the
earnings component of value added. Although
overall domestic value added trade in developing
economies in 2010 was more than 20 times higher
than total repatriated FDI income from developing
countries, the situation for individual countries may
be more nuanced.
There is indeed a strong positive relationship
between repatriated profits from a host country
and its participation in GVCs. This is a corollary of
the fact that GVC participation is driven by TNC
activities. Increased TNC activity equally results in
increased reinvested earnings (figure IV.22). GVC
participation can thus induce further productive
investment in the host economy.
Globally in 2010, about 60 per cent of total FDI
income on equity was repatriated (figure IV.23). To
some extent, the share may vary according to the
type of GVC involvement of foreign affiliates in host
countries and the value chain segments in which
they operate. Income on market-seeking FDI at the
end of value chains appears to be less likely to be
reinvested. Foreign affiliates in countries involved
in the middle of GVCs, in both manufacturing and
services activities, may be more likely to invest
further in production facilities, expanding efficiency-
seeking FDI. Investment in extractive industries
embodies a short value chain with high upfront
investments and a higher propensity to repatriate.
For example, although reinvestment rates appear
low in aggregate for Africa, once the main oil and
minerals exporters are removed from the sample,
reinvestment rates are broadly in line with the global
average.
The overall level of GVC participation of countries
does not appear to significantly influence countries’
There is a strong correla-
tion between countries’ GVC
participation and both repa-
triation and reinvestment of
earnings. The net effect on
countries’ balance of pay-
ments is mostly marginal.
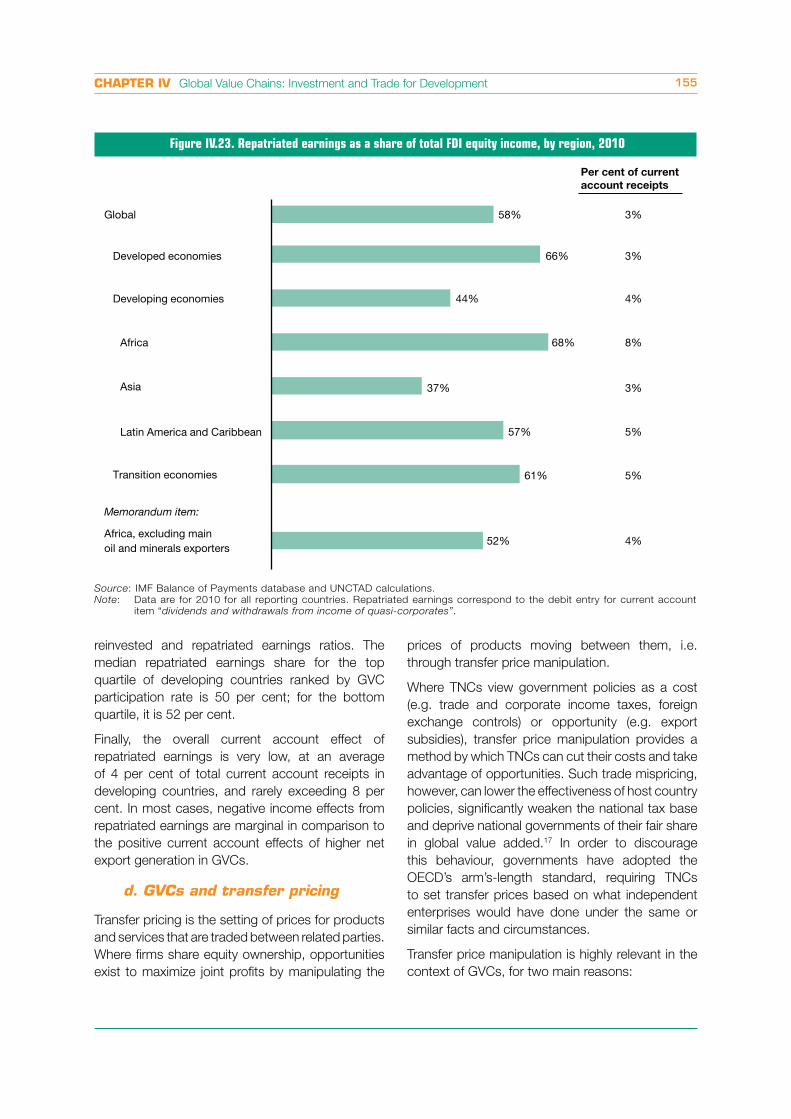
CHAPTER IV Global Value Chains: Investment and Trade for Development 155
Figure IV.23. Repatriated earnings as a share of total FDI equity income, by region, 2010
Source: IMF Balance of Payments database and UNCTAD calculations.
Note: Data are for 2010 for all reporting countries. Repatriated earnings correspond to the debit entry for current account
item “dividends and withdrawals from income of quasi-corporates”.
reinvested and repatriated earnings ratios. The
median repatriated earnings share for the top
quartile of developing countries ranked by GVC
participation rate is 50 per cent; for the bottom
quartile, it is 52 per cent.
Finally, the overall current account effect of
repatriated earnings is very low, at an average
of 4 per cent of total current account receipts in
developing countries, and rarely exceeding 8 per
cent. In most cases, negative income effects from
repatriated earnings are marginal in comparison to
the positive current account effects of higher net
export generation in GVCs.
d. GVCs and transfer pricing
Transfer pricing is the setting of prices for products
and services that are traded between related parties.
Where firms share equity ownership, opportunities
exist to maximize joint profits by manipulating the
prices of products moving between them, i.e.
through transfer price manipulation.
Where TNCs view government policies as a cost
(e.g. trade and corporate income taxes, foreign
exchange controls) or opportunity (e.g. export
subsidies), transfer price manipulation provides a
method by which TNCs can cut their costs and take
advantage of opportunities. Such trade mispricing,
however, can lower the effectiveness of host country
policies, significantly weaken the national tax base
and deprive national governments of their fair share
in global value added.17 In order to discourage
this behaviour, governments have adopted the
OECD’s arm’s-length standard, requiring TNCs
to set transfer prices based on what independent
enterprises would have done under the same or
similar facts and circumstances.
Transfer price manipulation is highly relevant in the
context of GVCs, for two main reasons:
52%
61%
57%
37%
68%
44%
66%
58%
Africa, excluding main oil and minerals exporters
Transition economies
Latin America and Caribbean
Asia
Africa
Developing economies
Developed economies
Global
Memorandum item:
Per cent of current
account receipts
3%
3%
4%
8%
3%
5%
5%
4%
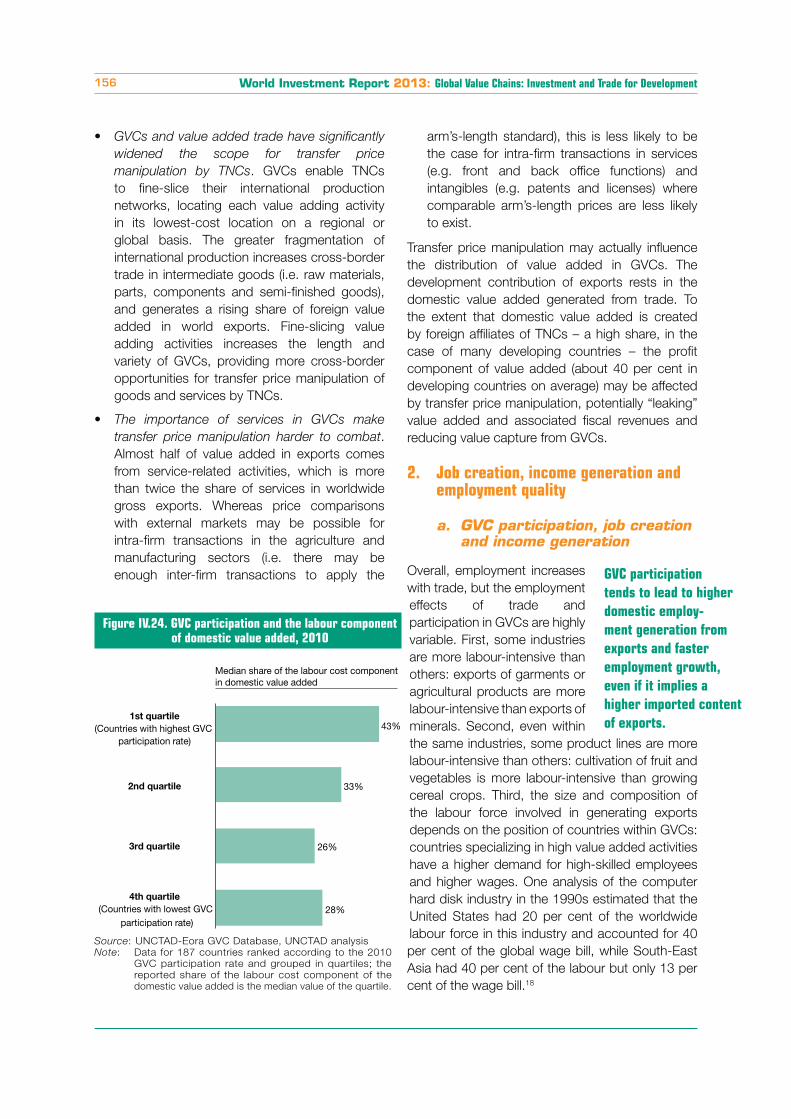
World Investment Report 2013: Global Value Chains: Investment and Trade for Development156
GVCs and value added trade have significantly
widened the scope for transfer price
manipulation by TNCs. GVCs enable TNCs
to fine-slice their international production
networks, locating each value adding activity
in its lowest-cost location on a regional or
global basis. The greater fragmentation of
international production increases cross-border
trade in intermediate goods (i.e. raw materials,
parts, components and semi-finished goods),
and generates a rising share of foreign value
added in world exports. Fine-slicing value
adding activities increases the length and
variety of GVCs, providing more cross-border
opportunities for transfer price manipulation of
goods and services by TNCs.
The importance of services in GVCs make
transfer price manipulation harder to combat.
Almost half of value added in exports comes
from service-related activities, which is more
than twice the share of services in worldwide
gross exports. Whereas price comparisons
with external markets may be possible for
intra-firm transactions in the agriculture and
manufacturing sectors (i.e. there may be
enough inter-firm transactions to apply the
1st quartile
(Countries with highest GVC participation rate)
2nd quartile
3rd quartile
4th quartile
(Countries with lowest GVC participation rate)
28%
26%
33%
43%
Median share of the labour cost componentin domestic value added
arm’s-length standard), this is less likely to be
the case for intra-firm transactions in services
(e.g. front and back office functions) and
intangibles (e.g. patents and licenses) where
comparable arm’s-length prices are less likely
to exist.
Transfer price manipulation may actually influence
the distribution of value added in GVCs. The
development contribution of exports rests in the
domestic value added generated from trade. To
the extent that domestic value added is created
by foreign affiliates of TNCs – a high share, in the
case of many developing countries – the profit
component of value added (about 40 per cent in
developing countries on average) may be affected
by transfer price manipulation, potentially “leaking”
value added and associated fiscal revenues and
reducing value capture from GVCs.
2. Job creation, income generation and employment quality
a. GVC participation, job creation and income generation
Overall, employment increases
with trade, but the employment
effects of trade and
participation in GVCs are highly
variable. First, some industries
are more labour-intensive than
others: exports of garments or
agricultural products are more
labour-intensive than exports of
minerals. Second, even within
the same industries, some product lines are more
labour-intensive than others: cultivation of fruit and
vegetables is more labour-intensive than growing
cereal crops. Third, the size and composition of
the labour force involved in generating exports
depends on the position of countries within GVCs:
countries specializing in high value added activities
have a higher demand for high-skilled employees
and higher wages. One analysis of the computer
hard disk industry in the 1990s estimated that the
United States had 20 per cent of the worldwide
labour force in this industry and accounted for 40
per cent of the global wage bill, while South-East
Asia had 40 per cent of the labour but only 13 per
cent of the wage bill.18
Figure IV.24. GVC participation and the labour component of domestic value added, 2010
Source: UNCTAD-Eora GVC Database, UNCTAD analysis
Note: Data for 187 countries ranked according to the 2010
GVC participation rate and grouped in quartiles; the
reported share of the labour cost component of the
domestic value added is the median value of the quartile.
GVC participation
tends to lead to higher
domestic employ-
ment generation from
exports and faster
employment growth,
even if it implies a
higher imported content
of exports.
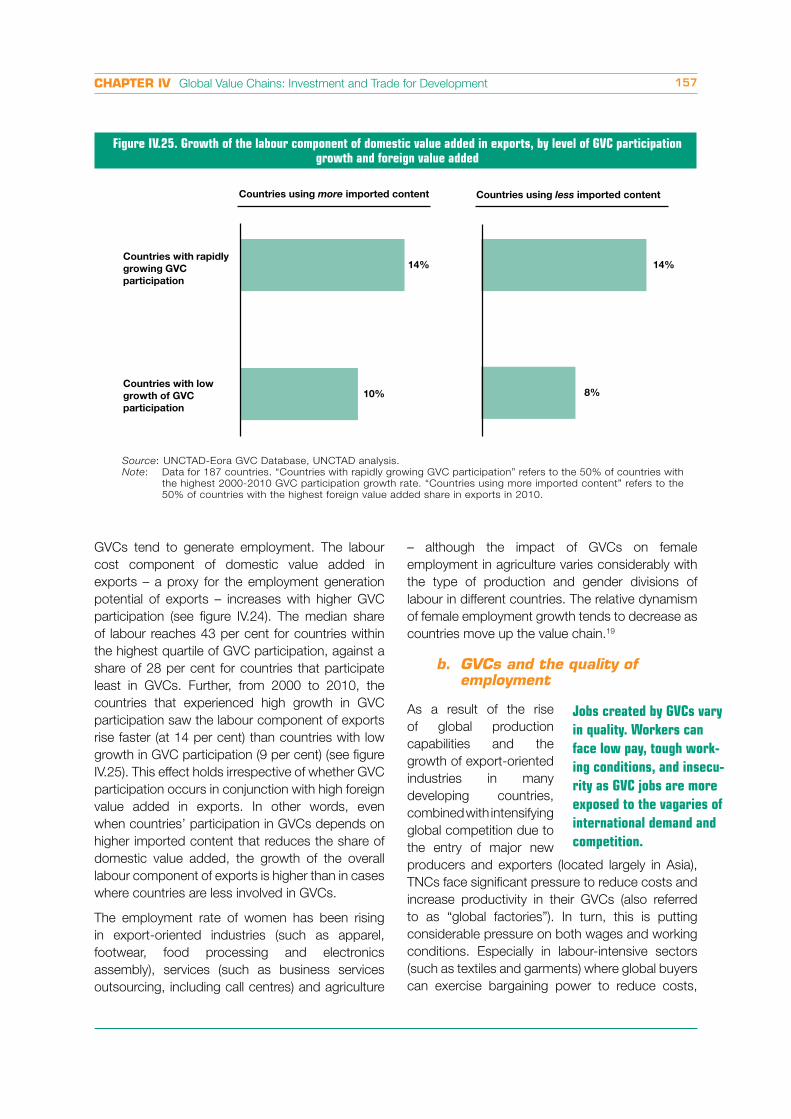
CHAPTER IV Global Value Chains: Investment and Trade for Development 157
Figure IV.25. Growth of the labour component of domestic value added in exports, by level of GVC participation growth and foreign value added
Countries using more imported content
Countries with rapidly
growing GVC
participation
Countries with low
growth of GVC
participation
Countries using less imported content
10%
14%
8%
14%
Source: UNCTAD-Eora GVC Database, UNCTAD analysis.
Note: Data for 187 countries. “Countries with rapidly growing GVC participation” refers to the 50% of countries with
the highest 2000-2010 GVC participation growth rate. “Countries using more imported content” refers to the
50% of countries with the highest foreign value added share in exports in 2010.
GVCs tend to generate employment. The labour
cost component of domestic value added in
exports – a proxy for the employment generation
potential of exports – increases with higher GVC
participation (see figure IV.24). The median share
of labour reaches 43 per cent for countries within
the highest quartile of GVC participation, against a
share of 28 per cent for countries that participate
least in GVCs. Further, from 2000 to 2010, the
countries that experienced high growth in GVC
participation saw the labour component of exports
rise faster (at 14 per cent) than countries with low
growth in GVC participation (9 per cent) (see figure
IV.25). This effect holds irrespective of whether GVC
participation occurs in conjunction with high foreign
value added in exports. In other words, even
when countries’ participation in GVCs depends on
higher imported content that reduces the share of
domestic value added, the growth of the overall
labour component of exports is higher than in cases
where countries are less involved in GVCs.
The employment rate of women has been rising
in export-oriented industries (such as apparel,
footwear, food processing and electronics
assembly), services (such as business services
outsourcing, including call centres) and agriculture
– although the impact of GVCs on female
employment in agriculture varies considerably with
the type of production and gender divisions of
labour in different countries. The relative dynamism
of female employment growth tends to decrease as
countries move up the value chain.19
b. GVCs and the quality of employment
As a result of the rise
of global production
capabilities and the
growth of export-oriented
industries in many
developing countries,
combined with intensifying
global competition due to
the entry of major new
producers and exporters (located largely in Asia),
TNCs face significant pressure to reduce costs and
increase productivity in their GVCs (also referred
to as “global factories”). In turn, this is putting
considerable pressure on both wages and working
conditions. Especially in labour-intensive sectors
(such as textiles and garments) where global buyers
can exercise bargaining power to reduce costs,
Jobs created by GVCs vary
in quality. Workers can
face low pay, tough work-
ing conditions, and insecu-
rity as GVC jobs are more
exposed to the vagaries of
international demand and
competition.
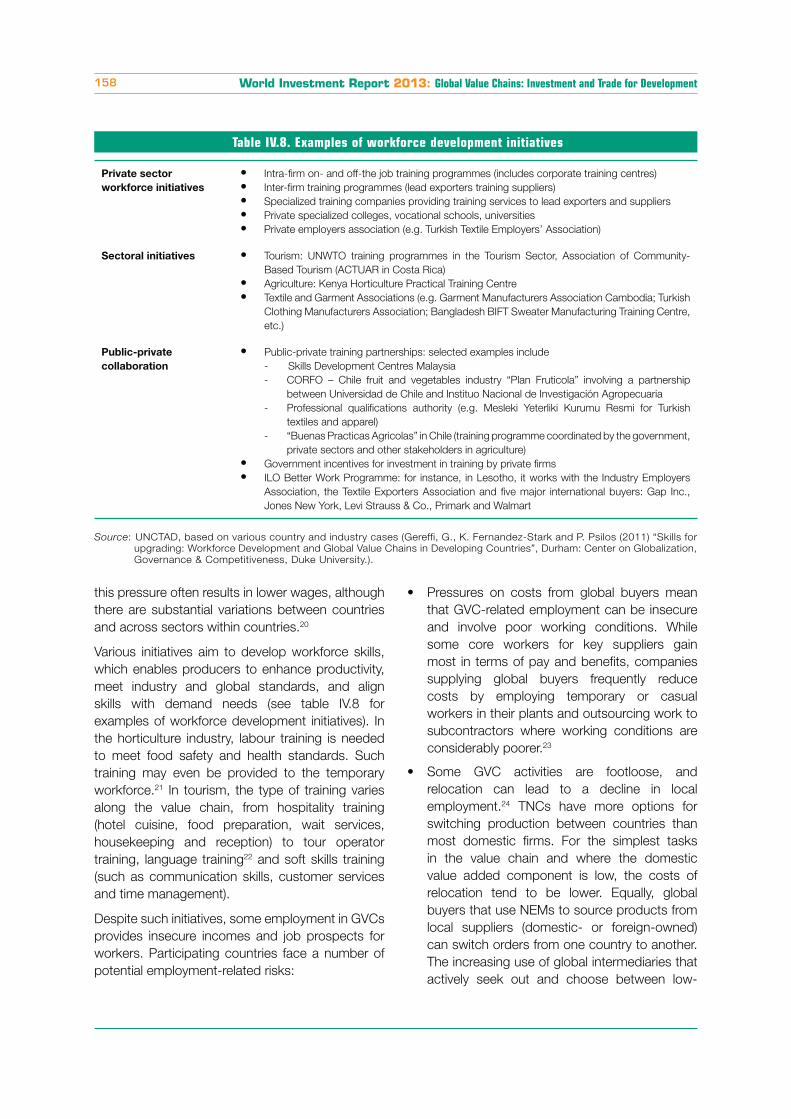
World Investment Report 2013: Global Value Chains: Investment and Trade for Development158
Table IV.8. Examples of workforce development initiatives
Private sector
workforce initiatives
Intra-firm on- and off-the job training programmes (includes corporate training centres)
Inter-firm training programmes (lead exporters training suppliers)
Specialized training companies providing training services to lead exporters and suppliers
Private specialized colleges, vocational schools, universities
Private employers association (e.g. Turkish Textile Employers’ Association)
Sectoral initiatives Tourism: UNWTO training programmes in the Tourism Sector, Association of Community-
Based Tourism (ACTUAR in Costa Rica)
Agriculture: Kenya Horticulture Practical Training Centre
Textile and Garment Associations (e.g. Garment Manufacturers Association Cambodia; Turkish
Clothing Manufacturers Association; Bangladesh BIFT Sweater Manufacturing Training Centre,
etc.)
Public-private
collaboration
Public-private training partnerships: selected examples include
- Skills Development Centres Malaysia
- CORFO – Chile fruit and vegetables industry “Plan Fruticola” involving a partnership
between Universidad de Chile and Instituo Nacional de Investigación Agropecuaria
- Professional qualifications authority (e.g. Mesleki Yeterliki Kurumu Resmi for Turkish
textiles and apparel)
- “Buenas Practicas Agricolas” in Chile (training programme coordinated by the government,
private sectors and other stakeholders in agriculture)
Government incentives for investment in training by private firms
ILO Better Work Programme: for instance, in Lesotho, it works with the Industry Employers
Association, the Textile Exporters Association and five major international buyers: Gap Inc.,
Jones New York, Levi Strauss & Co., Primark and Walmart
Source: UNCTAD, based on various country and industry cases (Gereffi, G., K. Fernandez-Stark and P. Psilos (2011) “Skills for
upgrading: Workforce Development and Global Value Chains in Developing Countries”, Durham: Center on Globalization,
Governance & Competitiveness, Duke University.).
this pressure often results in lower wages, although
there are substantial variations between countries
and across sectors within countries.20
Various initiatives aim to develop workforce skills,
which enables producers to enhance productivity,
meet industry and global standards, and align
skills with demand needs (see table IV.8 for
examples of workforce development initiatives). In
the horticulture industry, labour training is needed
to meet food safety and health standards. Such
training may even be provided to the temporary
workforce.21 In tourism, the type of training varies
along the value chain, from hospitality training
(hotel cuisine, food preparation, wait services,
housekeeping and reception) to tour operator
training, language training22 and soft skills training
(such as communication skills, customer services
and time management).
Despite such initiatives, some employment in GVCs
provides insecure incomes and job prospects for
workers. Participating countries face a number of
potential employment-related risks:
Pressures on costs from global buyers mean
that GVC-related employment can be insecure
and involve poor working conditions. While
some core workers for key suppliers gain
most in terms of pay and benefits, companies
supplying global buyers frequently reduce
costs by employing temporary or casual
workers in their plants and outsourcing work to
subcontractors where working conditions are
considerably poorer.23
Some GVC activities are footloose, and
relocation can lead to a decline in local
employment.24 TNCs have more options for
switching production between countries than
most domestic firms. For the simplest tasks
in the value chain and where the domestic
value added component is low, the costs of
relocation tend to be lower. Equally, global
buyers that use NEMs to source products from
local suppliers (domestic- or foreign-owned)
can switch orders from one country to another.
The increasing use of global intermediaries that
actively seek out and choose between low-
CHAPTER IV Global Value Chains: Investment and Trade for Development 159
cost locations for order fulfilment increases this
pressure. Conversely, the more production is
embedded in the local economy and the more
the local supplier base has been built up, the
greater the costs of switching locations.
Export-oriented employment in general is more
subject to fluctuations in global demand and
supply, and therefore influenced by factors
occurring far from where employment takes
place. GVC-related jobs can be lost in case
of demand fluctuation and economic crisis.25
Fluctuation in demand can be seasonal (as in
the fashion industry), resulting from weather
conditions (in the food industry), or caused by
economic downturns and crisis. Temporary
workers are more at risk of losing their job, but
permanent workers can be affected too.
For subcontractors at the end of the value
chain, which are often used as “pop-up”
suppliers to provide additional capacity, these
fluctuations in demand are particularly harmful
as they are the marginal producers whose
output is most likely to be cut. This effect is
further exacerbated by lags between demand
fluctuations and order fluctuations, resulting in
greater variation upstream in the supply chain
with negative consequences on suppliers in
developing countries, a phenomenon referred
to as the “bullwhip effect”.26
3. Technology dissemination and skills building
a. Technology dissemination and learning under different GVC governance structures
Business relations and
governance structures
in value chains are
determined by the
complexity of information
and knowledge transfer
required to sustain transactions, the codifiability
of information and knowledge, and the ease with
which it can be transferred, as well as by firms’
capabilities and competence (Section B). The types
of governance structures in GVCs are thus an
indication of the potential for technology and skills
transfer between various actors in the chain, and
related learning mechanisms (see table IV.9).
When operating through pure market transactions,
suppliers learn from the demands placed upon
them by buyers and from feedback about their
performance. Learning by exporting can be an
effective way for companies to acquire capabilities,
but it requires investment by these companies so
that they can respond to the challenges that they
encounter. Firms can even benefit from learning
by importing. In Uganda, firms learned through
the process of importing pharmaceuticals to start
activities in packaging, assembly and original
equipment manufacturing.27 In this case, imports of
products provided an initial impetus for domestic
economic activity.
Other forms of GVC governance structure are
more conducive to learning. Value chain modularity occurs when it is possible to codify specifications
for complex products. In this case, turnkey
suppliers have sufficient competences to engage in
full-package activities.28 Although this reduces the
need for buyers to engage in inter-firm technology
transfer, local suppliers learn through the need
to comply with firm or industry standards, and
technology transfer is embodied in standards,
codes and technical definitions.
By contrast, in relational value chains, specifications
cannot be codified, transactions are complex,
and the capabilities of the suppliers are high.
In this case, suppliers possess complementary
competences of interest to buyers, and tacit
knowledge must be exchanged between buyers
and sellers. Both buyers and suppliers benefit from
mutual learning, predominantly arising from face-
to-face interactions.
In captive value chains, complexity and the ability to
codify specifications are high, but suppliers do not
possess the needed competences. This encourages
technology transfer from buyers but can lead to
transactional dependencies, with suppliers locked
into supply relationships. For example, TNCs may
establish very structured supplier development
programmes in which local partners receive training
and transfers of technology. These are designed
to increase the capabilities of the local supply
base. In order to protect their investments in these
suppliers, companies may ensure a high degree of
The governance structure of
GVCs affects the scope for
and methods of knowledge
transfer to developing-country
firms operating in GVCs.
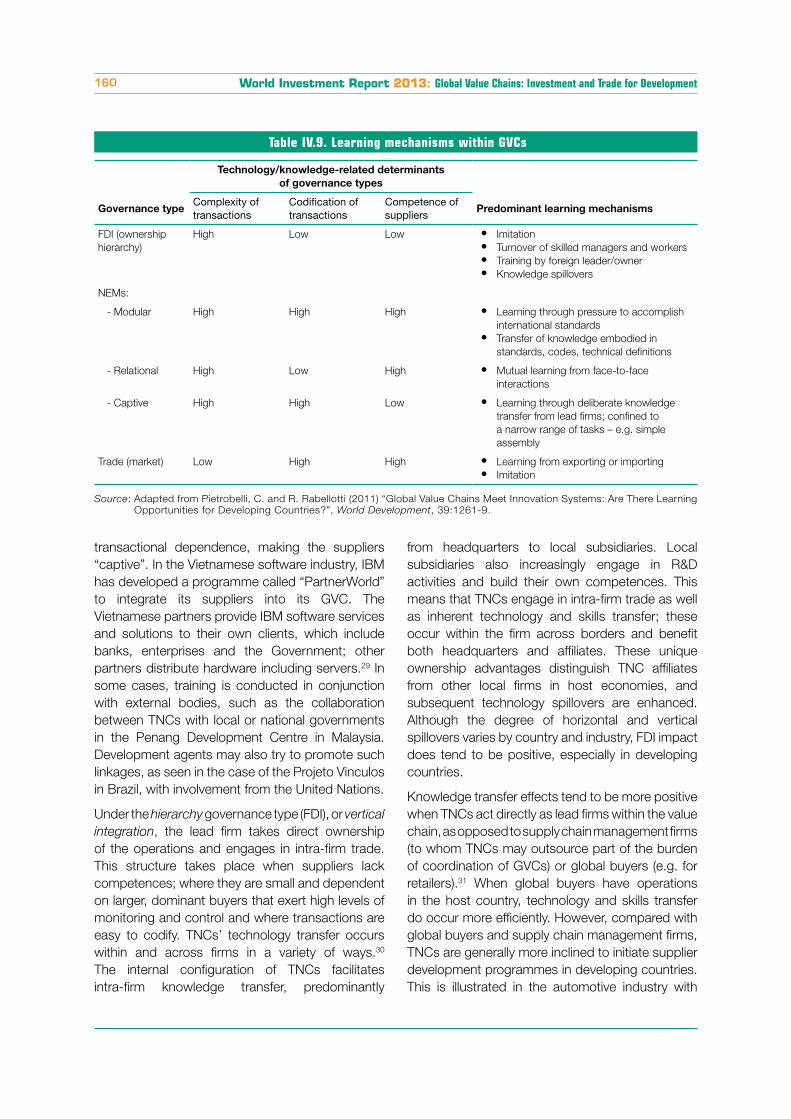
World Investment Report 2013: Global Value Chains: Investment and Trade for Development160
Table IV.9. Learning mechanisms within GVCs
Technology/knowledge-related determinants
of governance types
Governance typeComplexity of transactions
Codification of transactions
Competence of suppliers
Predominant learning mechanisms
FDI (ownership
hierarchy)
High Low Low Imitation
Turnover of skilled managers and workers
Training by foreign leader/owner
Knowledge spillovers
NEMs:
- Modular High High High Learning through pressure to accomplish
international standards
Transfer of knowledge embodied in
standards, codes, technical definitions
- Relational High Low High Mutual learning from face-to-face
interactions
- Captive High High Low Learning through deliberate knowledge
transfer from lead firms; confined to
a narrow range of tasks – e.g. simple
assembly
Trade (market) Low High High Learning from exporting or importing
Imitation
Source: Adapted from Pietrobelli, C. and R. Rabellotti (2011) “Global Value Chains Meet Innovation Systems: Are There Learning
Opportunities for Developing Countries?”, World Development, 39:1261-9.
transactional dependence, making the suppliers
“captive”. In the Vietnamese software industry, IBM
has developed a programme called “PartnerWorld”
to integrate its suppliers into its GVC. The
Vietnamese partners provide IBM software services
and solutions to their own clients, which include
banks, enterprises and the Government; other
partners distribute hardware including servers.29 In
some cases, training is conducted in conjunction
with external bodies, such as the collaboration
between TNCs with local or national governments
in the Penang Development Centre in Malaysia.
Development agents may also try to promote such
linkages, as seen in the case of the Projeto Vinculos
in Brazil, with involvement from the United Nations.
Under the hierarchy governance type (FDI), or vertical
integration, the lead firm takes direct ownership
of the operations and engages in intra-firm trade.
This structure takes place when suppliers lack
competences; where they are small and dependent
on larger, dominant buyers that exert high levels of
monitoring and control and where transactions are
easy to codify. TNCs’ technology transfer occurs
within and across firms in a variety of ways.30
The internal configuration of TNCs facilitates
intra-firm knowledge transfer, predominantly
from headquarters to local subsidiaries. Local
subsidiaries also increasingly engage in R&D
activities and build their own competences. This
means that TNCs engage in intra-firm trade as well
as inherent technology and skills transfer; these
occur within the firm across borders and benefit
both headquarters and affiliates. These unique
ownership advantages distinguish TNC affiliates
from other local firms in host economies, and
subsequent technology spillovers are enhanced.
Although the degree of horizontal and vertical
spillovers varies by country and industry, FDI impact
does tend to be positive, especially in developing
countries.
Knowledge transfer effects tend to be more positive
when TNCs act directly as lead firms within the value
chain, as opposed to supply chain management firms
(to whom TNCs may outsource part of the burden
of coordination of GVCs) or global buyers (e.g. for
retailers).31 When global buyers have operations
in the host country, technology and skills transfer
do occur more efficiently. However, compared with
global buyers and supply chain management firms,
TNCs are generally more inclined to initiate supplier
development programmes in developing countries.
This is illustrated in the automotive industry with
CHAPTER IV Global Value Chains: Investment and Trade for Development 161
AB Volvo and its suppliers across Asia and Latin
America, as well as with IKEA in the home-furnishing
industry.
b. Learning in GVCs: challenges and pitfalls
There are caveats to
knowledge transfer:32 (i)
learning is not costless
(access to external
knowledge means that
local firms use resources to
identify, absorb and utilize
knowledge);33 (ii) not all knowledge is useful (the
knowledge imparted by global buyers is specific
to the products bought and may not be useful for
the local firm in developing its own product lines
and competences); (iii) even for lead firms there are
risks involved in knowledge sharing (especially if
the knowledge recipient possesses the resources
and competences to become a competitor);34 and
(iv) transfer is not automatic (to facilitate transfer,
mechanisms must be put in place in both the
transferor and the recipient).
Local firms’ competences and absorptive capacity
affect technology and skills transfer within GVCs. For local firms to develop, they need to engage in
internal investment in equipment, organizational
arrangements and people. Local firms can then
either try to penetrate markets in which their global
buyers do not operate (with the proviso that entering
new markets requires additional capabilities that
local firms may not have) or move into functions
which their global buyers are willing to relinquish.
The first case was illustrated by electronic contract
manufacturers from Taiwan Province of China,
including Acer, which applied knowledge learned
from one part of its production to supply customers
in other markets.
A number of actions can be adopted by local
firms to enhance the potential for and assimilation
of knowledge transfer.35 One is to operate across
value chains. Another is linked to strategies to raise
local firms’ bargaining power (e.g. diversification of
buyers, proactive internal technology development
to expand their product portfolio). Collective actions
by local producers in developing countries can also
facilitate knowledge transfer and absorption. This
can take place in industry clusters, where SMEs
combine knowledge and technical resources to
improve their export potential or facilitate adoption
of standards.
For developing countries, the development of lower-
tier suppliers is critical, not all suppliers have similar
access to technology.36 In the automotive sector,
tier 1 suppliers are typically dominated by a small
number of foreign TNCs, particularly so since the
emergence of global mega-suppliers that meet the
needs of their customers across many countries
has undermined the position of mostly domestically
oriented local companies. Domestic suppliers tend
to be numerous in tier 2 and tier 3. However, the
highly concentrated structure of the industry means
there is little room for knowledge transfer to lower-
tier suppliers (which operate predominantly through
market transactions). In Mexico, very few, if any, of
the SMEs in the second and third tiers have been
able to leverage their links to GVCs as springboards
for their own internationalization. Market pressures
and the introduction of international standards
do encourage suppliers to improve both product
and processes when they first join GVCs, but
the use of modularization (driving suppliers to
produce standardized components) limits access
for the lower-tier suppliers to the new information,
knowledge and activities of assemblers and top-tier
suppliers.37
4. Social and environmental impacts
The social impact of
GVCs has been mixed.
Positive impacts have
been achieved through
strengthened formal
job opportunities and
poverty reduction along
with the dissemination of
environmental management systems and cleaner
technology. However, the downward pricing
pressure found in many GVCs has led to significant
negative social and environmental impacts.
Addressing these issues at the firm level throughout
a GVC is a key challenge of CSR initiatives. TNC
CSR programmes have had some successes, but
their limited ability to influence practices must be
complemented by public policies.
Learning in GVCs is not
automatic. It depends on
numerous factors, including
local absorptive capacities.
Skills transfers to lower tier
suppliers are often limited
TNC CSR programmes have
had some successes, but
their ability to mitigate
negative social and environ-
mental impacts in GVCs is
limited and must be comple-
mented by public policies.
World Investment Report 2013: Global Value Chains: Investment and Trade for Development162
a. CSR challenges in GVCs
For many years, TNCs
have been working,
primarily at the first-
tier level, to promote
improved social and
environmental impacts,
but the nature of
GVCs makes this work
complicated and its uneven success is due at
least in part to differences in GVC structures.
TNC efforts beyond the first-tier level of suppliers
are especially fraught with challenges and require
public policy assistance and collective action
within multi-stakeholder initiatives. The 2013 Rana
Plaza disaster in Bangladesh demonstrates that
TNC CSR programmes alone are not sufficient to
address the challenges faced; public sector and
multi-stakeholder support for suppliers is key to
improving social and environmental impacts.
Buyer-driven GVCs are typically focused on reduced
sourcing costs, and in many labour-intensive
industries this means significant downward
pressure on labour costs. Some suppliers are
achieving reduced labour costs through violations
of national and international labour standards and
human rights laws. Practices such as forced labour,
child labour, failure to pay minimum wage and illegal
overtime work are typical challenges in a number
of industries. In addition to downward pressure on
wages, the drive for reduced costs often results
in significant occupational safety and health
violations. Common examples in factories include
inadequate or non-existent fire safety features,
leading to a number of well-publicized deaths in
factory fires, and poor ventilation systems leading
to chemical exposures and “dust disease” illnesses
(pneumoconioses) that the ILO characterizes as a
“hidden epidemic”.38
Similarly, downward pricing pressure has created
economic incentives for violating environmental
regulations and industry best practices, leading
to the increased release of disease-causing
pollutants and climate-change-related emissions.
Cutting costs by engaging in negative social and
environmental practices is a particularly acute
trend in developing countries, which often lack
the regulatory infrastructure to ensure compliance
with their laws and/or have lower social and
environmental standards in place as a result of the
competitive pressures of GVCs.
For more than a decade, large global companies,
whether they be TNCs with operations in many
countries or global buyers working through
NEMs, have faced increasing pressures to take
responsibility for these social and environmental
challenges in the value chain. These pressures
are particularly strong in sectors such as food,
electronics and garments, where consumers can
perceive a direct relationship between the products
they buy and the conditions under which those
products are produced.
Companies have responded to these pressures
by adopting a range of standards and codes of
conduct. In most companies, these codes are
supported by specific staff with responsibility for the
code’s implementation and complemented by CSR
management systems (including supplier oversight
programmes) and corporate reporting. Despite the
advancement of CSR management practices in
recent years, addressing social and environmental
problems in value chains remains a challenge.
The international instruments of the United Nations
(e.g. ILO Core Labour Standards, the UN Guiding
Principles on Business and Human Rights)
represent a global consensus on CSR and are
commonly cited by TNCs in their company codes of
conduct.39 While there is strong consensus on the
normative dimension of what should be done, the
practical implementation of CSR standards is the
key challenge, especially in the context of complex
GVCs and when working with suppliers beyond the
first tier.
The impact of supplier codes of conduct on
GVC members is not uniform; rather, most of it is
concentrated on first-tier suppliers. At this level,
TNCs in many industries have more influence and
are engaged in a number of monitoring activities.
Some companies require their suppliers to undergo
an audit before the first contract is established and
then expect their suppliers to be monitored every
three to four years. In other industries, suppliers
can be inspected as frequently as every six months.
Implementing good CSR
practices throughout a GVC is
challenging. Reaching beyond
first-tier suppliers remains
difficult. And from a supplier
perspective, compliance
efforts can be costly.
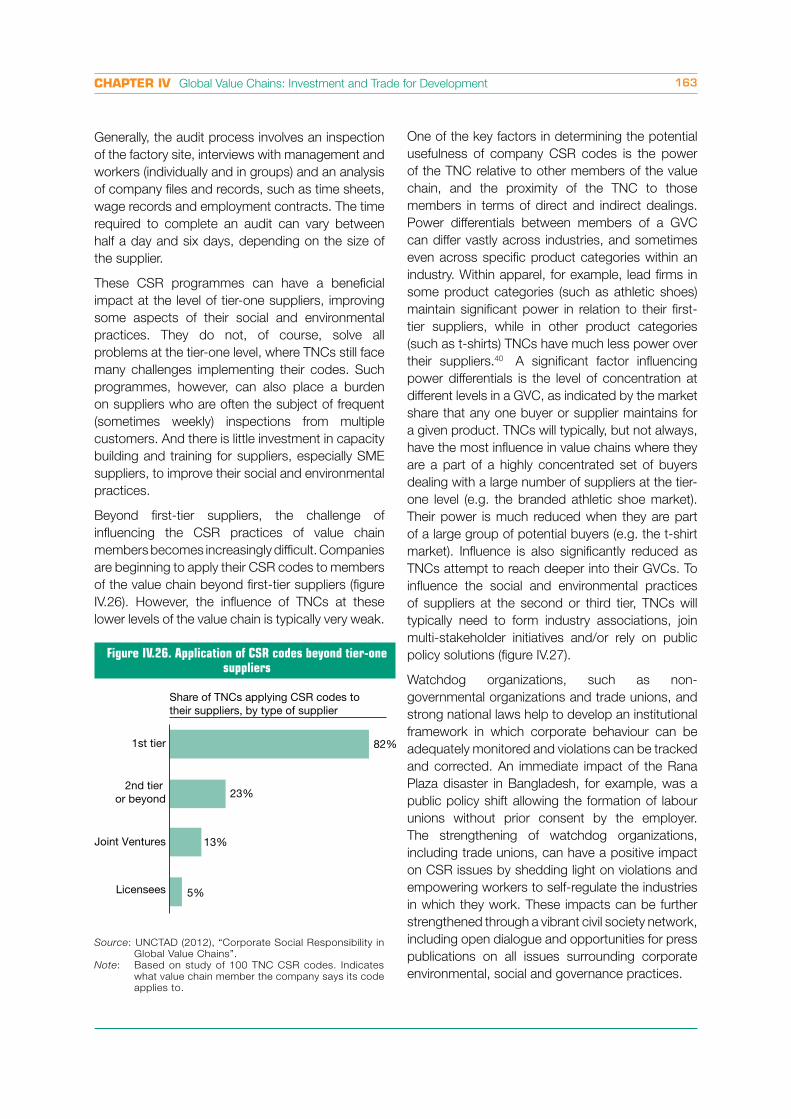
CHAPTER IV Global Value Chains: Investment and Trade for Development 163
Generally, the audit process involves an inspection
of the factory site, interviews with management and
workers (individually and in groups) and an analysis
of company files and records, such as time sheets,
wage records and employment contracts. The time
required to complete an audit can vary between
half a day and six days, depending on the size of
the supplier.
These CSR programmes can have a beneficial
impact at the level of tier-one suppliers, improving
some aspects of their social and environmental
practices. They do not, of course, solve all
problems at the tier-one level, where TNCs still face
many challenges implementing their codes. Such
programmes, however, can also place a burden
on suppliers who are often the subject of frequent
(sometimes weekly) inspections from multiple
customers. And there is little investment in capacity
building and training for suppliers, especially SME
suppliers, to improve their social and environmental
practices.
Beyond first-tier suppliers, the challenge of
influencing the CSR practices of value chain
members becomes increasingly difficult. Companies
are beginning to apply their CSR codes to members
of the value chain beyond first-tier suppliers (figure
IV.26). However, the influence of TNCs at these
lower levels of the value chain is typically very weak.
One of the key factors in determining the potential
usefulness of company CSR codes is the power
of the TNC relative to other members of the value
chain, and the proximity of the TNC to those
members in terms of direct and indirect dealings.
Power differentials between members of a GVC
can differ vastly across industries, and sometimes
even across specific product categories within an
industry. Within apparel, for example, lead firms in
some product categories (such as athletic shoes)
maintain significant power in relation to their first-
tier suppliers, while in other product categories
(such as t-shirts) TNCs have much less power over
their suppliers.40 A significant factor influencing
power differentials is the level of concentration at
different levels in a GVC, as indicated by the market
share that any one buyer or supplier maintains for
a given product. TNCs will typically, but not always,
have the most influence in value chains where they
are a part of a highly concentrated set of buyers
dealing with a large number of suppliers at the tier-
one level (e.g. the branded athletic shoe market).
Their power is much reduced when they are part
of a large group of potential buyers (e.g. the t-shirt
market). Influence is also significantly reduced as
TNCs attempt to reach deeper into their GVCs. To
influence the social and environmental practices
of suppliers at the second or third tier, TNCs will
typically need to form industry associations, join
multi-stakeholder initiatives and/or rely on public
policy solutions (figure IV.27).
Watchdog organizations, such as non-
governmental organizations and trade unions, and
strong national laws help to develop an institutional
framework in which corporate behaviour can be
adequately monitored and violations can be tracked
and corrected. An immediate impact of the Rana
Plaza disaster in Bangladesh, for example, was a
public policy shift allowing the formation of labour
unions without prior consent by the employer.
The strengthening of watchdog organizations,
including trade unions, can have a positive impact
on CSR issues by shedding light on violations and
empowering workers to self-regulate the industries
in which they work. These impacts can be further
strengthened through a vibrant civil society network,
including open dialogue and opportunities for press
publications on all issues surrounding corporate
environmental, social and governance practices.
Figure IV.26. Application of CSR codes beyond tier-one suppliers
Source: UNCTAD (2012), “Corporate Social Responsibility in
Global Value Chains”.
Note: Based on study of 100 TNC CSR codes. Indicates
what value chain member the company says its code
applies to.
Share of TNCs applying CSR codes to their suppliers, by type of supplier
Licensees
Joint Ventures
2nd tier or beyond
1st tier 82%
5%
13%
23%
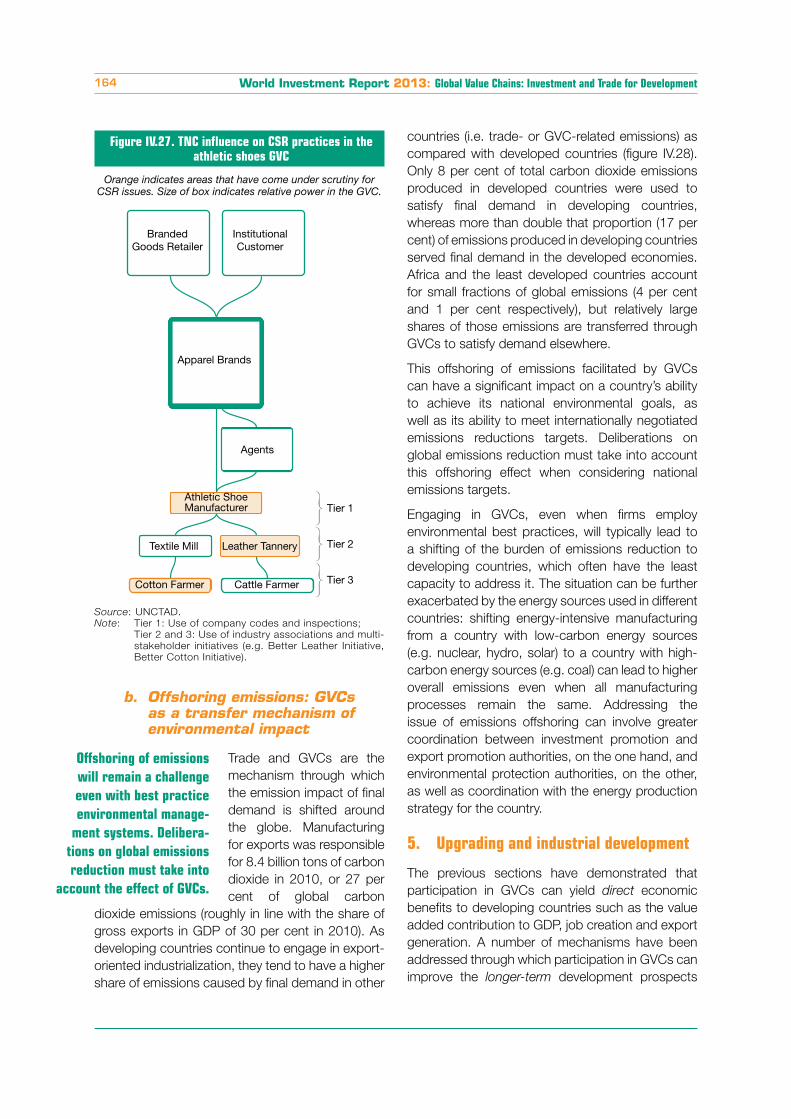
World Investment Report 2013: Global Value Chains: Investment and Trade for Development164
Orange indicates areas that have come under scrutiny for CSR issues. Size of box indicates relative power in the GVC.
Figure IV.27. TNC influence on CSR practices in the athletic shoes GVC
Source: UNCTAD.
Note: Tier 1: Use of company codes and inspections;
Tier 2 and 3: Use of industry associations and multi-
stakeholder initiatives (e.g. Better Leather Initiative,
Better Cotton Initiative).
BrandedGoods Retailer
InstitutionalCustomer
Apparel Brands
Agents
Athletic ShoeManufacturer
Textile Mill Leather Tannery
Cotton Farmer Cattle Farmer
Tier 1
Tier 2
Tier 3
b. Offshoring emissions: GVCs as a transfer mechanism of environmental impact
Trade and GVCs are the
mechanism through which
the emission impact of final
demand is shifted around
the globe. Manufacturing
for exports was responsible
for 8.4 billion tons of carbon
dioxide in 2010, or 27 per
cent of global carbon
dioxide emissions (roughly in line with the share of
gross exports in GDP of 30 per cent in 2010). As
developing countries continue to engage in export-
oriented industrialization, they tend to have a higher
share of emissions caused by final demand in other
countries (i.e. trade- or GVC-related emissions) as
compared with developed countries (figure IV.28).
Only 8 per cent of total carbon dioxide emissions
produced in developed countries were used to
satisfy final demand in developing countries,
whereas more than double that proportion (17 per
cent) of emissions produced in developing countries
served final demand in the developed economies.
Africa and the least developed countries account
for small fractions of global emissions (4 per cent
and 1 per cent respectively), but relatively large
shares of those emissions are transferred through
GVCs to satisfy demand elsewhere.
This offshoring of emissions facilitated by GVCs
can have a significant impact on a country’s ability
to achieve its national environmental goals, as
well as its ability to meet internationally negotiated
emissions reductions targets. Deliberations on
global emissions reduction must take into account
this offshoring effect when considering national
emissions targets.
Engaging in GVCs, even when firms employ
environmental best practices, will typically lead to
a shifting of the burden of emissions reduction to
developing countries, which often have the least
capacity to address it. The situation can be further
exacerbated by the energy sources used in different
countries: shifting energy-intensive manufacturing
from a country with low-carbon energy sources
(e.g. nuclear, hydro, solar) to a country with high-
carbon energy sources (e.g. coal) can lead to higher
overall emissions even when all manufacturing
processes remain the same. Addressing the
issue of emissions offshoring can involve greater
coordination between investment promotion and
export promotion authorities, on the one hand, and
environmental protection authorities, on the other,
as well as coordination with the energy production
strategy for the country.
5. Upgrading and industrial development
The previous sections have demonstrated that
participation in GVCs can yield direct economic
benefits to developing countries such as the value
added contribution to GDP, job creation and export
generation. A number of mechanisms have been
addressed through which participation in GVCs can
improve the longer-term development prospects
Offshoring of emissions
will remain a challenge
even with best practice
environmental manage-
ment systems. Delibera-
tions on global emissions
reduction must take into
account the effect of GVCs.
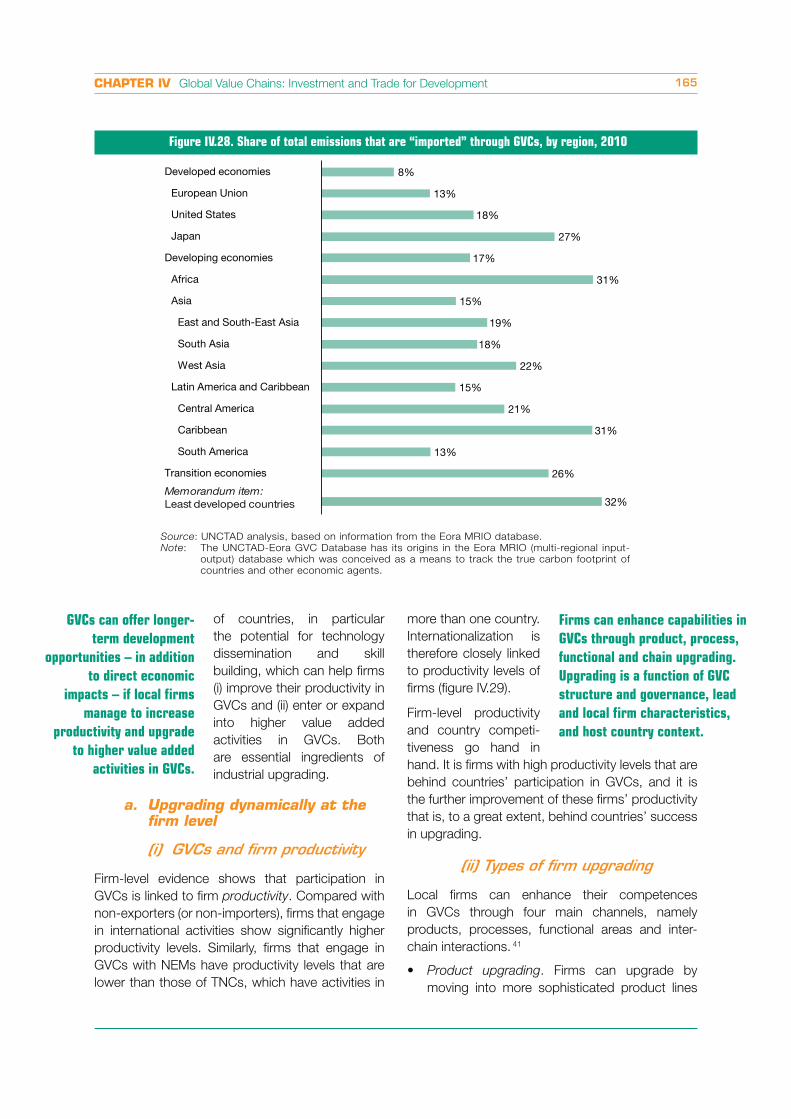
CHAPTER IV Global Value Chains: Investment and Trade for Development 165
of countries, in particular
the potential for technology
dissemination and skill
building, which can help firms
(i) improve their productivity in
GVCs and (ii) enter or expand
into higher value added
activities in GVCs. Both
are essential ingredients of
industrial upgrading.
a. Upgrading dynamically at the firm level
(i) GVCs and firm productivity
Firm-level evidence shows that participation in
GVCs is linked to firm productivity. Compared with
non-exporters (or non-importers), firms that engage
in international activities show significantly higher
productivity levels. Similarly, firms that engage in
GVCs with NEMs have productivity levels that are
lower than those of TNCs, which have activities in
more than one country.
Internationalization is
therefore closely linked
to productivity levels of
firms (figure IV.29).
Firm-level productivity
and country competi-
tiveness go hand in
hand. It is firms with high productivity levels that are
behind countries’ participation in GVCs, and it is
the further improvement of these firms’ productivity
that is, to a great extent, behind countries’ success
in upgrading.
(ii) Types of firm upgrading
Local firms can enhance their competences
in GVCs through four main channels, namely
products, processes, functional areas and inter-
chain interactions. 41
Product upgrading. Firms can upgrade by
moving into more sophisticated product lines
Figure IV.28. Share of total emissions that are “imported” through GVCs, by region, 2010
Source: UNCTAD analysis, based on information from the Eora MRIO database.
Note: The UNCTAD-Eora GVC Database has its origins in the Eora MRIO (multi-regional input-
output) database which was conceived as a means to track the true carbon footprint of
countries and other economic agents.
GVCs can offer longer-
term development
opportunities – in addition
to direct economic
impacts – if local firms
manage to increase
productivity and upgrade
to higher value added
activities in GVCs.
8%
13%
18%
27%
17%
31%
15%
19%
18%
22%
15%
21%
31%
13%
26%
32%
Developed economies
European Union
United States
Japan
Developing economies
Africa
Asia
East and South-East Asia
South Asia
West Asia
Latin America and Caribbean
Central America
Caribbean
South America
Transition economies
Least developed countriesMemorandum item:
Firms can enhance capabilities in
GVCs through product, process,
functional and chain upgrading.
Upgrading is a function of GVC
structure and governance, lead
and local firm characteristics,
and host country context.
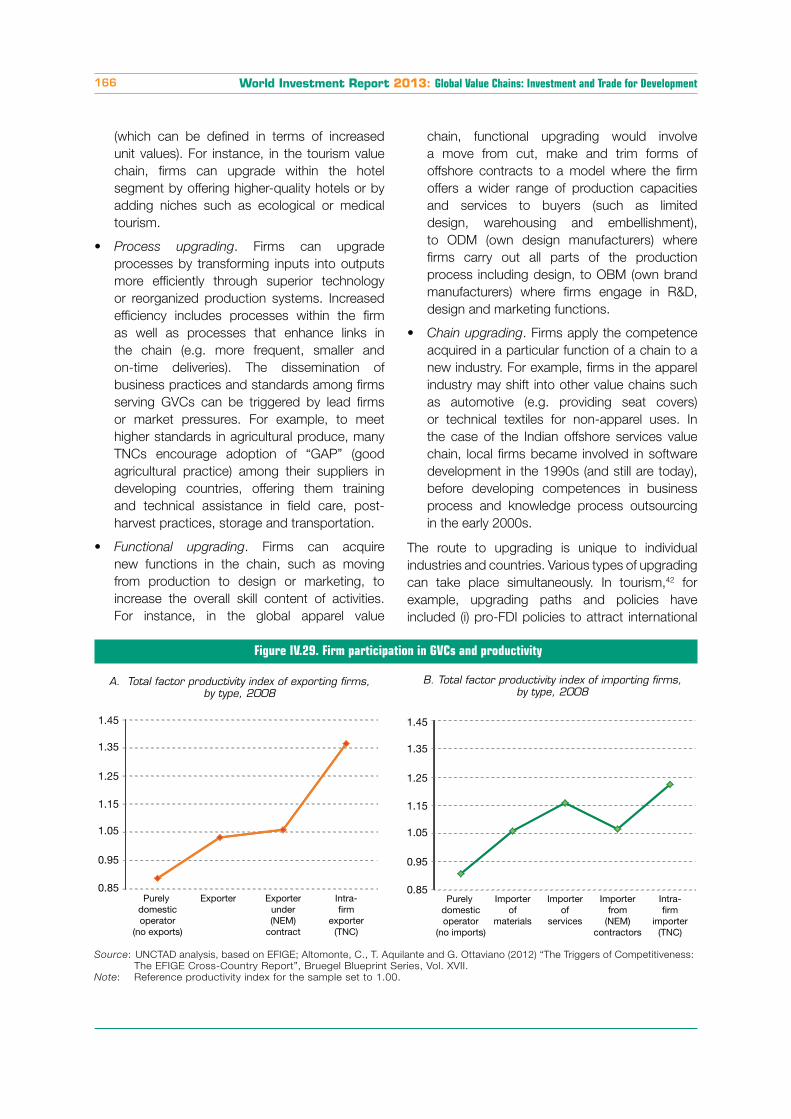
World Investment Report 2013: Global Value Chains: Investment and Trade for Development166
(which can be defined in terms of increased
unit values). For instance, in the tourism value
chain, firms can upgrade within the hotel
segment by offering higher-quality hotels or by
adding niches such as ecological or medical
tourism.
Process upgrading. Firms can upgrade
processes by transforming inputs into outputs
more efficiently through superior technology
or reorganized production systems. Increased
efficiency includes processes within the firm
as well as processes that enhance links in
the chain (e.g. more frequent, smaller and
on-time deliveries). The dissemination of
business practices and standards among firms
serving GVCs can be triggered by lead firms
or market pressures. For example, to meet
higher standards in agricultural produce, many
TNCs encourage adoption of “GAP” (good
agricultural practice) among their suppliers in
developing countries, offering them training
and technical assistance in field care, post-
harvest practices, storage and transportation.
Functional upgrading. Firms can acquire
new functions in the chain, such as moving
from production to design or marketing, to
increase the overall skill content of activities.
For instance, in the global apparel value
chain, functional upgrading would involve
a move from cut, make and trim forms of
offshore contracts to a model where the firm
offers a wider range of production capacities
and services to buyers (such as limited
design, warehousing and embellishment),
to ODM (own design manufacturers) where
firms carry out all parts of the production
process including design, to OBM (own brand
manufacturers) where firms engage in R&D,
design and marketing functions.
Chain upgrading. Firms apply the competence
acquired in a particular function of a chain to a
new industry. For example, firms in the apparel
industry may shift into other value chains such
as automotive (e.g. providing seat covers)
or technical textiles for non-apparel uses. In
the case of the Indian offshore services value
chain, local firms became involved in software
development in the 1990s (and still are today),
before developing competences in business
process and knowledge process outsourcing
in the early 2000s.
The route to upgrading is unique to individual
industries and countries. Various types of upgrading
can take place simultaneously. In tourism,42 for
example, upgrading paths and policies have
included (i) pro-FDI policies to attract international
Figure IV.29. Firm participation in GVCs and productivity
Source: UNCTAD analysis, based on EFIGE; Altomonte, C., T. Aquilante and G. Ottaviano (2012) “The Triggers of Competitiveness:
The EFIGE Cross-Country Report”, Bruegel Blueprint Series, Vol. XVII.
Note: Reference productivity index for the sample set to 1.00.
1.45
1.35
1.25
1.15
1.05
0.95
0.85Purely
domesticoperator
(no exports)
Exporter Exporterunder(NEM)
contract
Intra-firm
exporter(TNC)
A. Total factor productivity index of exporting firms, by type, 2008
B. Total factor productivity index of importing firms, by type, 2008
1.45
1.35
1.25
1.15
1.05
0.95
0.85Purely
domesticoperator
(no imports)
Importerof
materials
Importerfrom
(NEM)contractors
Intra-firm
importer(TNC)
Importerof
services
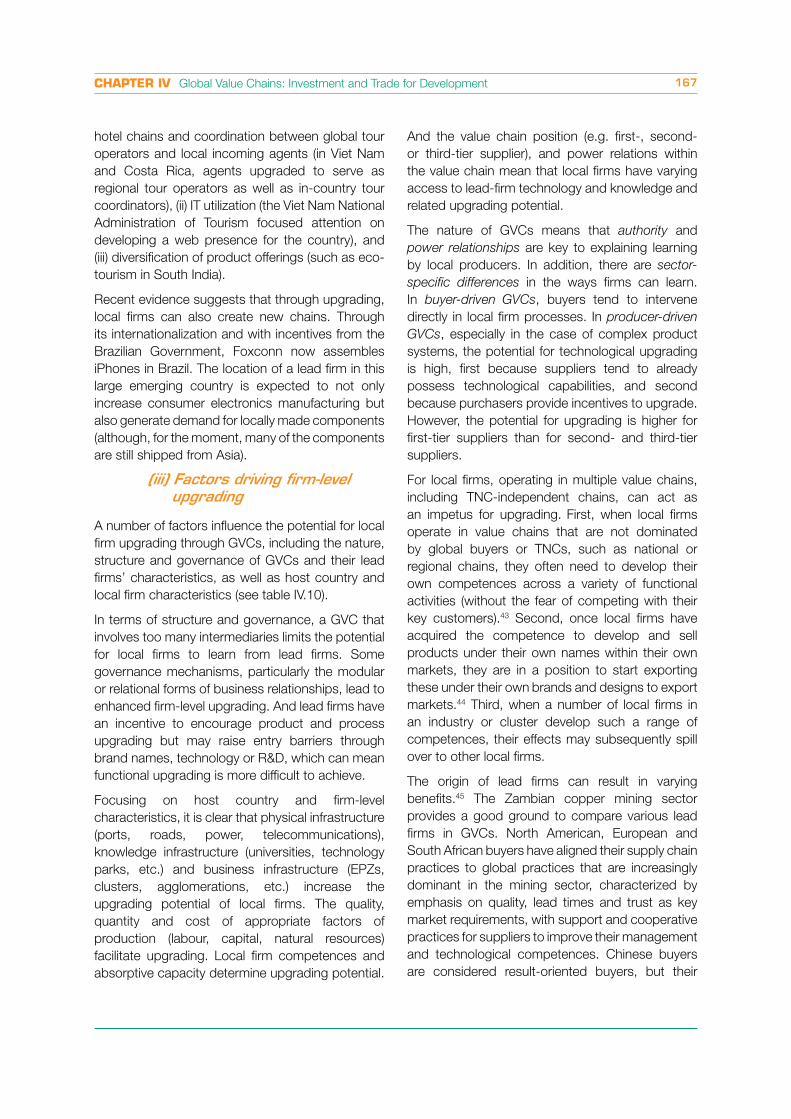
CHAPTER IV Global Value Chains: Investment and Trade for Development 167
hotel chains and coordination between global tour
operators and local incoming agents (in Viet Nam
and Costa Rica, agents upgraded to serve as
regional tour operators as well as in-country tour
coordinators), (ii) IT utilization (the Viet Nam National
Administration of Tourism focused attention on
developing a web presence for the country), and
(iii) diversification of product offerings (such as eco-
tourism in South India).
Recent evidence suggests that through upgrading,
local firms can also create new chains. Through
its internationalization and with incentives from the
Brazilian Government, Foxconn now assembles
iPhones in Brazil. The location of a lead firm in this
large emerging country is expected to not only
increase consumer electronics manufacturing but
also generate demand for locally made components
(although, for the moment, many of the components
are still shipped from Asia).
(iii) Factors driving firm-level upgrading
A number of factors influence the potential for local
firm upgrading through GVCs, including the nature,
structure and governance of GVCs and their lead
firms’ characteristics, as well as host country and
local firm characteristics (see table IV.10).
In terms of structure and governance, a GVC that
involves too many intermediaries limits the potential
for local firms to learn from lead firms. Some
governance mechanisms, particularly the modular
or relational forms of business relationships, lead to
enhanced firm-level upgrading. And lead firms have
an incentive to encourage product and process
upgrading but may raise entry barriers through
brand names, technology or R&D, which can mean
functional upgrading is more difficult to achieve.
Focusing on host country and firm-level
characteristics, it is clear that physical infrastructure
(ports, roads, power, telecommunications),
knowledge infrastructure (universities, technology
parks, etc.) and business infrastructure (EPZs,
clusters, agglomerations, etc.) increase the
upgrading potential of local firms. The quality,
quantity and cost of appropriate factors of
production (labour, capital, natural resources)
facilitate upgrading. Local firm competences and
absorptive capacity determine upgrading potential.
And the value chain position (e.g. first-, second-
or third-tier supplier), and power relations within
the value chain mean that local firms have varying
access to lead-firm technology and knowledge and
related upgrading potential.
The nature of GVCs means that authority and
power relationships are key to explaining learning
by local producers. In addition, there are sector-
specific differences in the ways firms can learn.
In buyer-driven GVCs, buyers tend to intervene
directly in local firm processes. In producer-driven
GVCs, especially in the case of complex product
systems, the potential for technological upgrading
is high, first because suppliers tend to already
possess technological capabilities, and second
because purchasers provide incentives to upgrade.
However, the potential for upgrading is higher for
first-tier suppliers than for second- and third-tier
suppliers.
For local firms, operating in multiple value chains,
including TNC-independent chains, can act as
an impetus for upgrading. First, when local firms
operate in value chains that are not dominated
by global buyers or TNCs, such as national or
regional chains, they often need to develop their
own competences across a variety of functional
activities (without the fear of competing with their
key customers).43 Second, once local firms have
acquired the competence to develop and sell
products under their own names within their own
markets, they are in a position to start exporting
these under their own brands and designs to export
markets.44 Third, when a number of local firms in
an industry or cluster develop such a range of
competences, their effects may subsequently spill
over to other local firms.
The origin of lead firms can result in varying
benefits.45 The Zambian copper mining sector
provides a good ground to compare various lead
firms in GVCs. North American, European and
South African buyers have aligned their supply chain
practices to global practices that are increasingly
dominant in the mining sector, characterized by
emphasis on quality, lead times and trust as key
market requirements, with support and cooperative
practices for suppliers to improve their management
and technological competences. Chinese buyers
are considered result-oriented buyers, but their
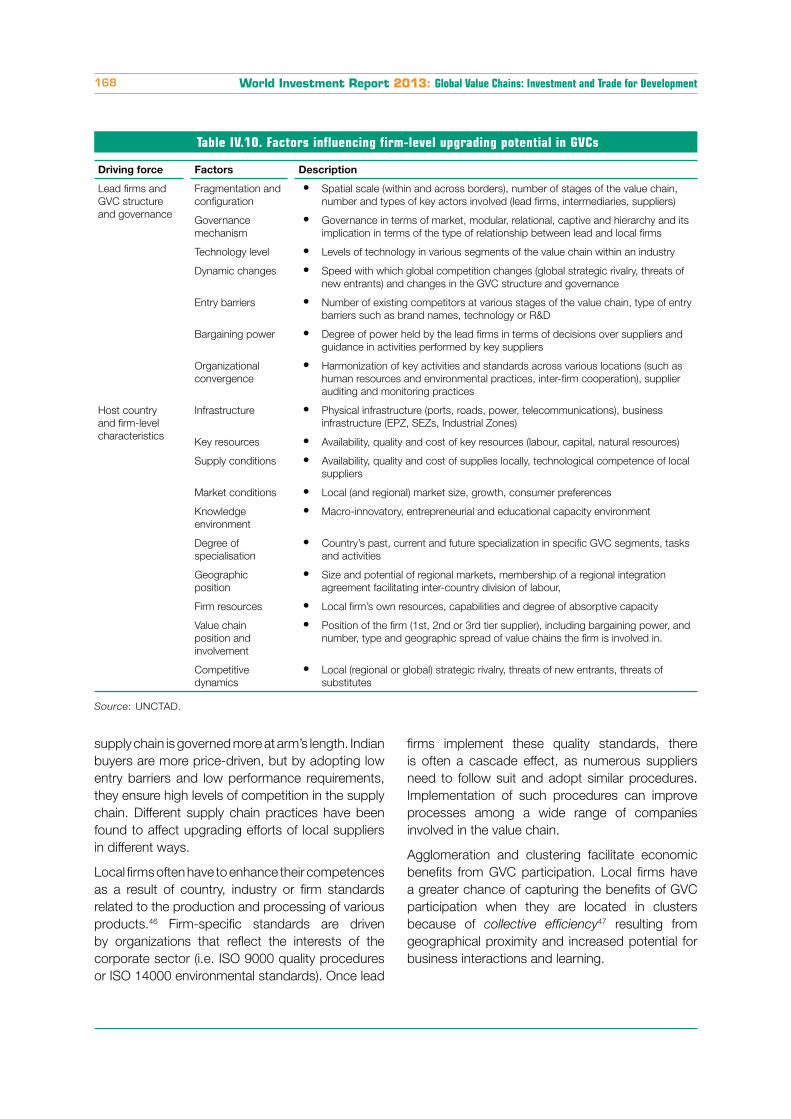
World Investment Report 2013: Global Value Chains: Investment and Trade for Development168
Table IV.10. Factors influencing firm-level upgrading potential in GVCs
Driving force Factors Description
Lead firms and
GVC structure
and governance
Fragmentation and
configuration
Spatial scale (within and across borders), number of stages of the value chain,
number and types of key actors involved (lead firms, intermediaries, suppliers)
Governance
mechanism
Governance in terms of market, modular, relational, captive and hierarchy and its
implication in terms of the type of relationship between lead and local firms
Technology level Levels of technology in various segments of the value chain within an industry
Dynamic changes Speed with which global competition changes (global strategic rivalry, threats of
new entrants) and changes in the GVC structure and governance
Entry barriers Number of existing competitors at various stages of the value chain, type of entry
barriers such as brand names, technology or R&D
Bargaining power Degree of power held by the lead firms in terms of decisions over suppliers and
guidance in activities performed by key suppliers
Organizational
convergence
Harmonization of key activities and standards across various locations (such as
human resources and environmental practices, inter-firm cooperation), supplier
auditing and monitoring practices
Host country
and firm-level
characteristics
Infrastructure Physical infrastructure (ports, roads, power, telecommunications), business
infrastructure (EPZ, SEZs, Industrial Zones)
Key resources Availability, quality and cost of key resources (labour, capital, natural resources)
Supply conditions Availability, quality and cost of supplies locally, technological competence of local
suppliers
Market conditions Local (and regional) market size, growth, consumer preferences
Knowledge
environment
Macro-innovatory, entrepreneurial and educational capacity environment
Degree of
specialisation
Country’s past, current and future specialization in specific GVC segments, tasks
and activities
Geographic
position
Size and potential of regional markets, membership of a regional integration
agreement facilitating inter-country division of labour,
Firm resources Local firm’s own resources, capabilities and degree of absorptive capacity
Value chain
position and
involvement
Position of the firm (1st, 2nd or 3rd tier supplier), including bargaining power, and
number, type and geographic spread of value chains the firm is involved in.
Competitive
dynamics
Local (regional or global) strategic rivalry, threats of new entrants, threats of
substitutes
Source: UNCTAD.
supply chain is governed more at arm’s length. Indian
buyers are more price-driven, but by adopting low
entry barriers and low performance requirements,
they ensure high levels of competition in the supply
chain. Different supply chain practices have been
found to affect upgrading efforts of local suppliers
in different ways.
Local firms often have to enhance their competences
as a result of country, industry or firm standards
related to the production and processing of various
products.46 Firm-specific standards are driven
by organizations that reflect the interests of the
corporate sector (i.e. ISO 9000 quality procedures
or ISO 14000 environmental standards). Once lead
firms implement these quality standards, there
is often a cascade effect, as numerous suppliers
need to follow suit and adopt similar procedures.
Implementation of such procedures can improve
processes among a wide range of companies
involved in the value chain.
Agglomeration and clustering facilitate economic
benefits from GVC participation. Local firms have
a greater chance of capturing the benefits of GVC
participation when they are located in clusters
because of collective efficiency47 resulting from
geographical proximity and increased potential for
business interactions and learning.
CHAPTER IV Global Value Chains: Investment and Trade for Development 169
(iv) Upgrading risks
Local firms may find themselves locked into low
value added activities despite having successfully
gone through product and process upgrading,
because functional upgrading is more difficult to
achieve. This can result from a number of factors,
namely prevailing business practices of lead firms,48
global competitive dynamics of value chains and
local firms acting inefficiently by maximizing short-
term profits at the cost of long-term efficiency, as
well as the routines of contractors involved in the
value chain.49
Access to various functions may be more
contentious if local producers start engaging in
activities conducted by the lead firms.50 In such
cases, power relations may limit knowledge flows
within the chain. Local firms become tied into
relationships that prevent functional upgrading,
especially when they depend on powerful buyers
for large orders. This is illustrated in the Sinos Valley
shoe cluster in southern Brazil. In the 1960s, new
buyers from the United States drove a change in
the configuration of the cluster from numerous
small producers to larger producers that could
deliver larger volumes of standardized products.
This affected power relations within the cluster.
Process standards and product quality rose, as
local firms gained access to international markets.
The early 1990s saw the rise of rival Chinese
producers and downward price pressure. Despite
this competition, large producers in the Sinos
Valley were reluctant to move up to areas of design
and marketing for fear of consequences from the
cluster’s main buyers, which represented nearly
40 per cent of the total cluster exports. It became
apparent that the Brazilian producers achieved
high production standards but lagged behind in
terms of innovative design. These competences
were instead developed by firms targeting the local
Brazilian market or regional Latin American export
markets.
Other risks associated with upgrading relate to
the impact of the upgrading process. Economic
upgrading can have detrimental social impacts.51 This can take place, for instance, when greater
process efficiency leads to an increased use of
casual labour. In a few cases (as in the agro-food
sector of some countries), process improvements
have been accompanied by weak pro-poor,
environmental and gender outcomes.
Rising standards in an industry can also create
barriers to entry into the value chain for local firms.52
In the horticultural industry, new supplier countries
often start in export markets where standards are
less stringent. To upgrade, e.g. from production to
packing, suppliers must first understand the market
(especially when buyer-driven), invest in new
technologies (for instance, to meet high hygiene
standards in packhouse operations, they need to
set up on-site laboratories for product and staff
health tests), and have access to a local packaging
industry that can supply appropriate containers.
Where a good local packing supply industry does
not exist, value loss can occur initially as producers
shop their products to neighbouring countries for
repackaging before final exports.
b. Upgrading at the country level and GVC development paths
(i) Participation in GVCs and domestic value added creation
When firms enter or
expand into higher value
added activities in GVCs,
they create more domestic
value added from trade
for the country in which
they are based. This is not
automatic. Participation
in GVCs often implies
entering more fragmented
value chains that are, by
definition, characterized
by a higher use of foreign value added inputs. At
the entry level, the share of domestic value added
in exports thus tends to decrease initially when
countries increase GVC participation, although
the absolute value of the contribution of exports to
GDP is likely to increase.
This conceptual trade-off between GVC
participation and domestic value added creation
from trade is shown in figure IV.30. At the country
level, as seen in section A, GVC participation
Most developing coun-
tries have increased their
participation in GVCs over
the past 20 years, usually at
the cost of a higher share
of foreign value added in
exports. The optimal policy
outcome is higher GVC par-
ticipation and higher domes-
tic value added creation.
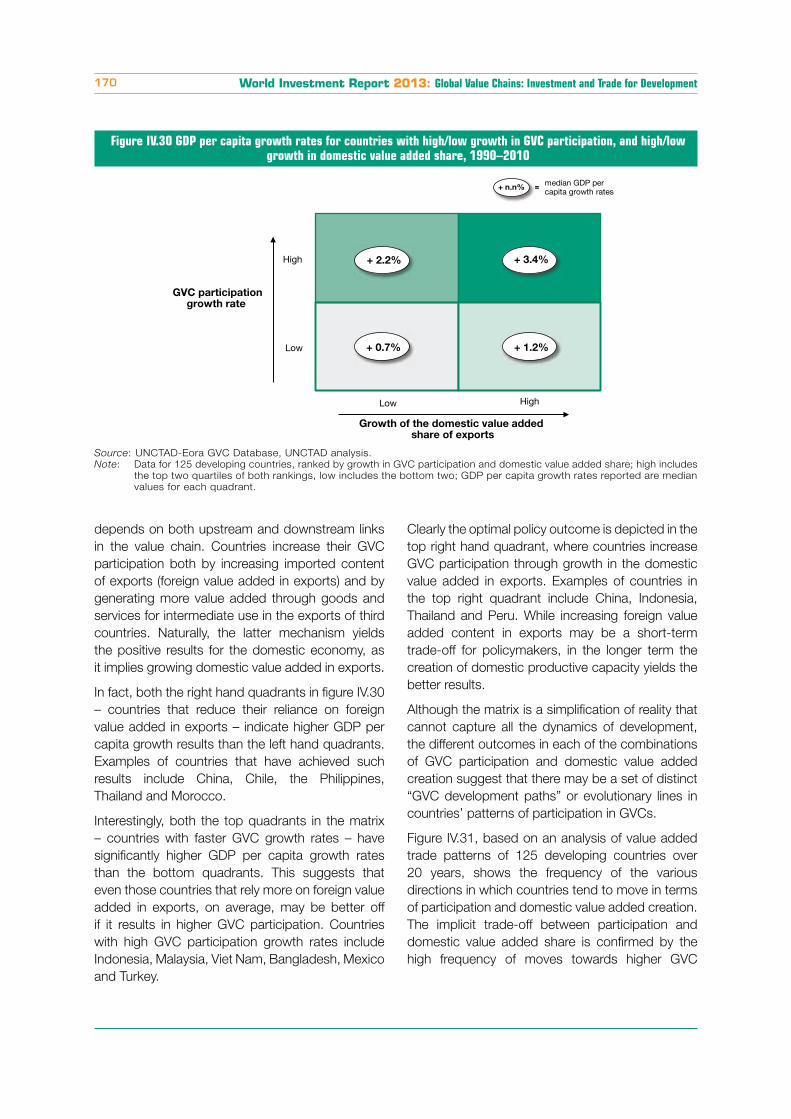
World Investment Report 2013: Global Value Chains: Investment and Trade for Development170
depends on both upstream and downstream links
in the value chain. Countries increase their GVC
participation both by increasing imported content
of exports (foreign value added in exports) and by
generating more value added through goods and
services for intermediate use in the exports of third
countries. Naturally, the latter mechanism yields
the positive results for the domestic economy, as
it implies growing domestic value added in exports.
In fact, both the right hand quadrants in figure IV.30
– countries that reduce their reliance on foreign
value added in exports – indicate higher GDP per
capita growth results than the left hand quadrants.
Examples of countries that have achieved such
results include China, Chile, the Philippines,
Thailand and Morocco.
Interestingly, both the top quadrants in the matrix
– countries with faster GVC growth rates – have
significantly higher GDP per capita growth rates
than the bottom quadrants. This suggests that
even those countries that rely more on foreign value
added in exports, on average, may be better off
if it results in higher GVC participation. Countries
with high GVC participation growth rates include
Indonesia, Malaysia, Viet Nam, Bangladesh, Mexico
and Turkey.
Clearly the optimal policy outcome is depicted in the
top right hand quadrant, where countries increase
GVC participation through growth in the domestic
value added in exports. Examples of countries in
the top right quadrant include China, Indonesia,
Thailand and Peru. While increasing foreign value
added content in exports may be a short-term
trade-off for policymakers, in the longer term the
creation of domestic productive capacity yields the
better results.
Although the matrix is a simplification of reality that
cannot capture all the dynamics of development,
the different outcomes in each of the combinations
of GVC participation and domestic value added
creation suggest that there may be a set of distinct
“GVC development paths” or evolutionary lines in
countries’ patterns of participation in GVCs.
Figure IV.31, based on an analysis of value added
trade patterns of 125 developing countries over
20 years, shows the frequency of the various
directions in which countries tend to move in terms
of participation and domestic value added creation.
The implicit trade-off between participation and
domestic value added share is confirmed by the
high frequency of moves towards higher GVC
Source: UNCTAD-Eora GVC Database, UNCTAD analysis.
Note: Data for 125 developing countries, ranked by growth in GVC participation and domestic value added share; high includes
the top two quartiles of both rankings, low includes the bottom two; GDP per capita growth rates reported are median
values for each quadrant.
Figure IV.30 GDP per capita growth rates for countries with high/low growth in GVC participation, and high/low growth in domestic value added share, 1990–2010
GVC participation growth rate
Growth of the domestic value added share of exports
Low
Low
High
High
+ 2.2% + 3.4%
+ 0.7% + 1.2%
+ n.n%median GDP per capita growth rates=
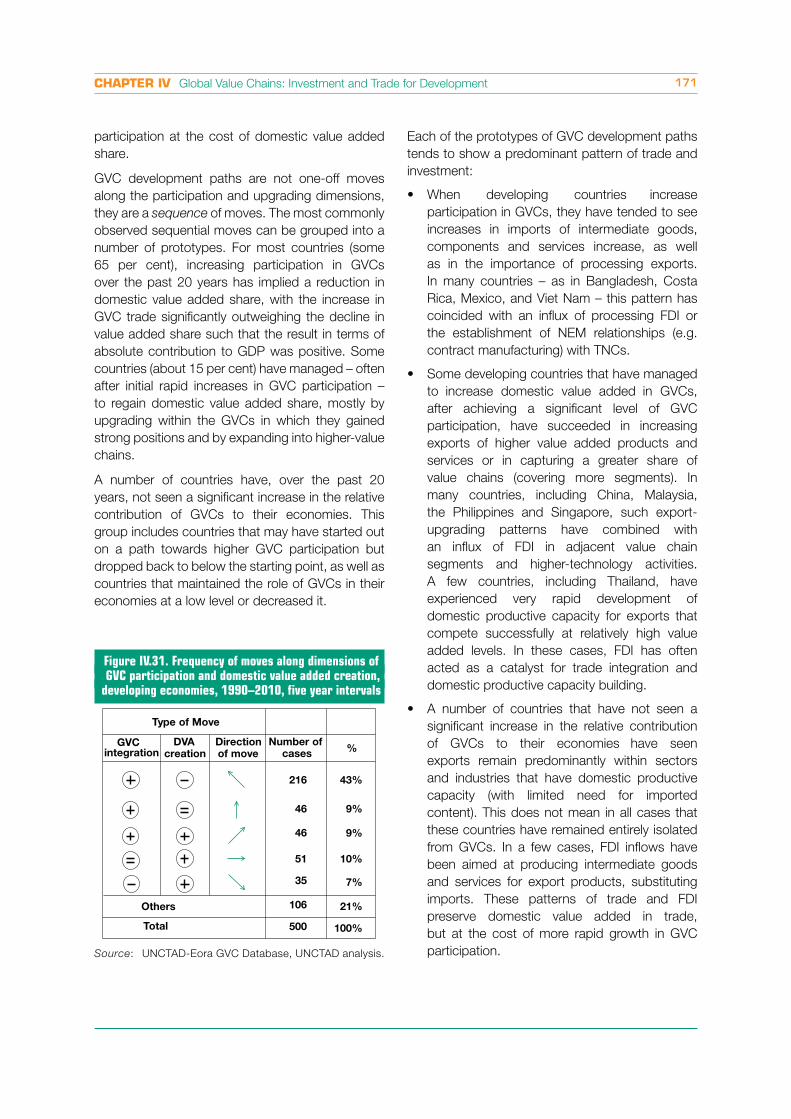
CHAPTER IV Global Value Chains: Investment and Trade for Development 171
Figure IV.31. Frequency of moves along dimensions of GVC participation and domestic value added creation,developing economies, 1990–2010, five year intervals
Type of Move
DVA creation
GVC integration
Total
Others
Number of cases
%
500 100%
46 9%
46 9%
216 43%
51 10%
35 7%
21%106
Direction of move
Source: UNCTAD-Eora GVC Database, UNCTAD analysis.
participation at the cost of domestic value added
share.
GVC development paths are not one-off moves
along the participation and upgrading dimensions,
they are a sequence of moves. The most commonly
observed sequential moves can be grouped into a
number of prototypes. For most countries (some
65 per cent), increasing participation in GVCs
over the past 20 years has implied a reduction in
domestic value added share, with the increase in
GVC trade significantly outweighing the decline in
value added share such that the result in terms of
absolute contribution to GDP was positive. Some
countries (about 15 per cent) have managed – often
after initial rapid increases in GVC participation –
to regain domestic value added share, mostly by
upgrading within the GVCs in which they gained
strong positions and by expanding into higher-value
chains.
A number of countries have, over the past 20
years, not seen a significant increase in the relative
contribution of GVCs to their economies. This
group includes countries that may have started out
on a path towards higher GVC participation but
dropped back to below the starting point, as well as
countries that maintained the role of GVCs in their
economies at a low level or decreased it.
Each of the prototypes of GVC development paths
tends to show a predominant pattern of trade and
investment:
When developing countries increase
participation in GVCs, they have tended to see
increases in imports of intermediate goods,
components and services increase, as well
as in the importance of processing exports.
In many countries – as in Bangladesh, Costa
Rica, Mexico, and Viet Nam – this pattern has
coincided with an influx of processing FDI or
the establishment of NEM relationships (e.g.
contract manufacturing) with TNCs.
Some developing countries that have managed
to increase domestic value added in GVCs,
after achieving a significant level of GVC
participation, have succeeded in increasing
exports of higher value added products and
services or in capturing a greater share of
value chains (covering more segments). In
many countries, including China, Malaysia,
the Philippines and Singapore, such export-
upgrading patterns have combined with
an influx of FDI in adjacent value chain
segments and higher-technology activities.
A few countries, including Thailand, have
experienced very rapid development of
domestic productive capacity for exports that
compete successfully at relatively high value
added levels. In these cases, FDI has often
acted as a catalyst for trade integration and
domestic productive capacity building.
A number of countries that have not seen a
significant increase in the relative contribution
of GVCs to their economies have seen
exports remain predominantly within sectors
and industries that have domestic productive
capacity (with limited need for imported
content). This does not mean in all cases that
these countries have remained entirely isolated
from GVCs. In a few cases, FDI inflows have
been aimed at producing intermediate goods
and services for export products, substituting
imports. These patterns of trade and FDI
preserve domestic value added in trade,
but at the cost of more rapid growth in GVC
participation.
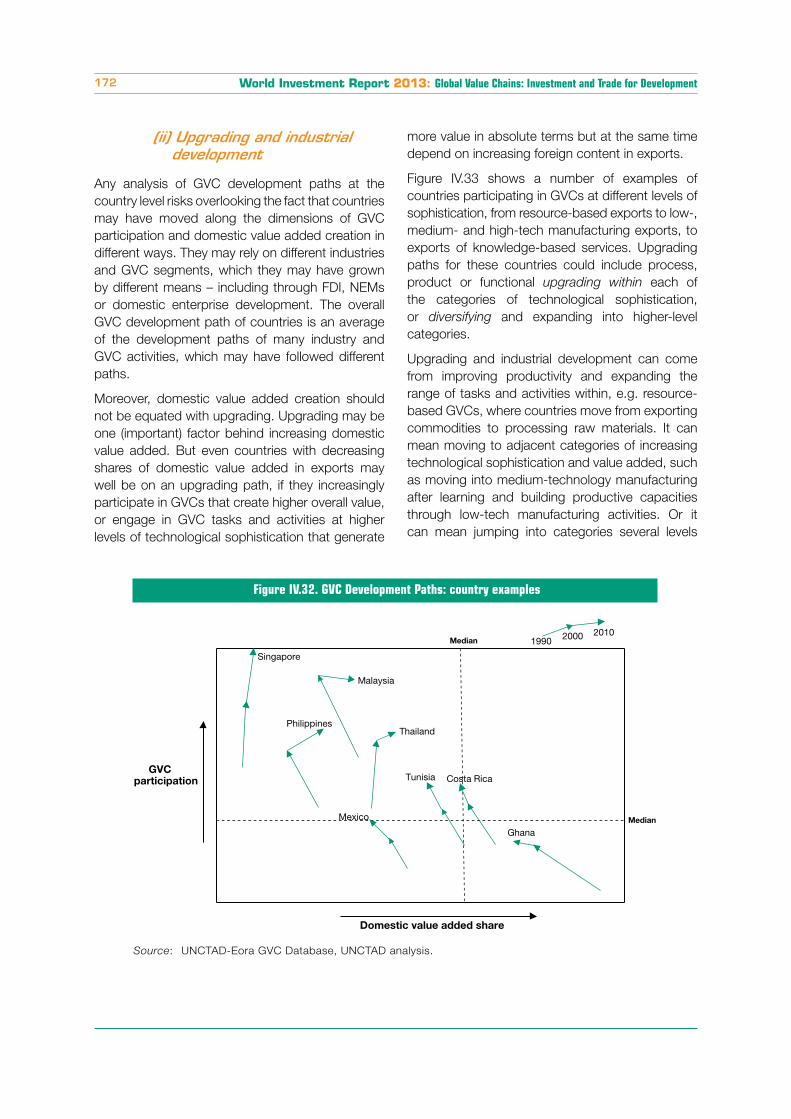
World Investment Report 2013: Global Value Chains: Investment and Trade for Development172
Figure IV.32. GVC Development Paths: country examples
Source: UNCTAD-Eora GVC Database, UNCTAD analysis.
Malaysia
PhilippinesThailand
Ghana
Tunisia Costa RicaGVC
participation
1990 2000 2010
Domestic value added share
Median
Median
Singapore
Mexico
(ii) Upgrading and industrial development
Any analysis of GVC development paths at the
country level risks overlooking the fact that countries
may have moved along the dimensions of GVC
participation and domestic value added creation in
different ways. They may rely on different industries
and GVC segments, which they may have grown
by different means – including through FDI, NEMs
or domestic enterprise development. The overall
GVC development path of countries is an average
of the development paths of many industry and
GVC activities, which may have followed different
paths.
Moreover, domestic value added creation should
not be equated with upgrading. Upgrading may be
one (important) factor behind increasing domestic
value added. But even countries with decreasing
shares of domestic value added in exports may
well be on an upgrading path, if they increasingly
participate in GVCs that create higher overall value,
or engage in GVC tasks and activities at higher
levels of technological sophistication that generate
more value in absolute terms but at the same time
depend on increasing foreign content in exports.
Figure IV.33 shows a number of examples of
countries participating in GVCs at different levels of
sophistication, from resource-based exports to low-,
medium- and high-tech manufacturing exports, to
exports of knowledge-based services. Upgrading
paths for these countries could include process,
product or functional upgrading within each of
the categories of technological sophistication,
or diversifying and expanding into higher-level
categories.
Upgrading and industrial development can come
from improving productivity and expanding the
range of tasks and activities within, e.g. resource-
based GVCs, where countries move from exporting
commodities to processing raw materials. It can
mean moving to adjacent categories of increasing
technological sophistication and value added, such
as moving into medium-technology manufacturing
after learning and building productive capacities
through low-tech manufacturing activities. Or it
can mean jumping into categories several levels
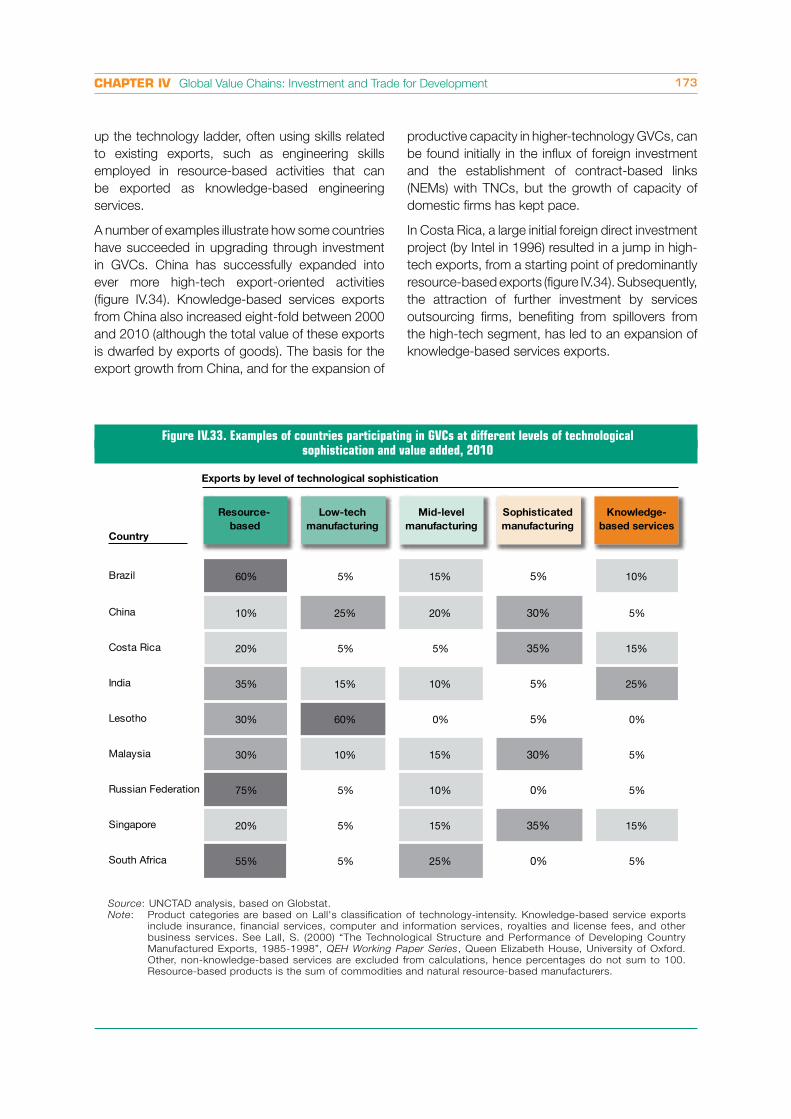
CHAPTER IV Global Value Chains: Investment and Trade for Development 173
Figure IV.33. Examples of countries participating in GVCs at different levels of technological sophistication and value added, 2010
Source: UNCTAD analysis, based on Globstat.
Note: Product categories are based on Lall's classification of technology-intensity. Knowledge-based service exports
include insurance, financial services, computer and information services, royalties and license fees, and other
business services. See Lall, S. (2000) “The Technological Structure and Performance of Developing Country
Manufactured Exports, 1985-1998”, QEH Working Paper Series, Queen Elizabeth House, University of Oxford.
Other, non-knowledge-based services are excluded from calculations, hence percentages do not sum to 100.
Resource-based products is the sum of commodities and natural resource-based manufacturers.
Resource-
based
Low-tech
manufacturing
Mid-level
manufacturing
Sophisticated
manufacturing
Knowledge-
based services
Exports by level of technological sophistication
Brazil
China
Costa Rica
India
Lesotho
Malaysia
Russian Federation
Singapore
South Africa
Country
60% 5% 15% 5% 10%
10% 25% 20% 30% 5%
20% 5% 5% 35% 15%
35% 15% 10% 5% 25%
30% 60% 0% 5% 0%
30% 10% 15% 30% 5%
75% 5% 10% 0% 5%
20% 5% 15% 35% 15%
55% 5% 25% 0% 5%
up the technology ladder, often using skills related
to existing exports, such as engineering skills
employed in resource-based activities that can
be exported as knowledge-based engineering
services.
A number of examples illustrate how some countries
have succeeded in upgrading through investment
in GVCs. China has successfully expanded into
ever more high-tech export-oriented activities
(figure IV.34). Knowledge-based services exports
from China also increased eight-fold between 2000
and 2010 (although the total value of these exports
is dwarfed by exports of goods). The basis for the
export growth from China, and for the expansion of
productive capacity in higher-technology GVCs, can
be found initially in the influx of foreign investment
and the establishment of contract-based links
(NEMs) with TNCs, but the growth of capacity of
domestic firms has kept pace.
In Costa Rica, a large initial foreign direct investment
project (by Intel in 1996) resulted in a jump in high-
tech exports, from a starting point of predominantly
resource-based exports (figure IV.34). Subsequently,
the attraction of further investment by services
outsourcing firms, benefiting from spillovers from
the high-tech segment, has led to an expansion of
knowledge-based services exports.
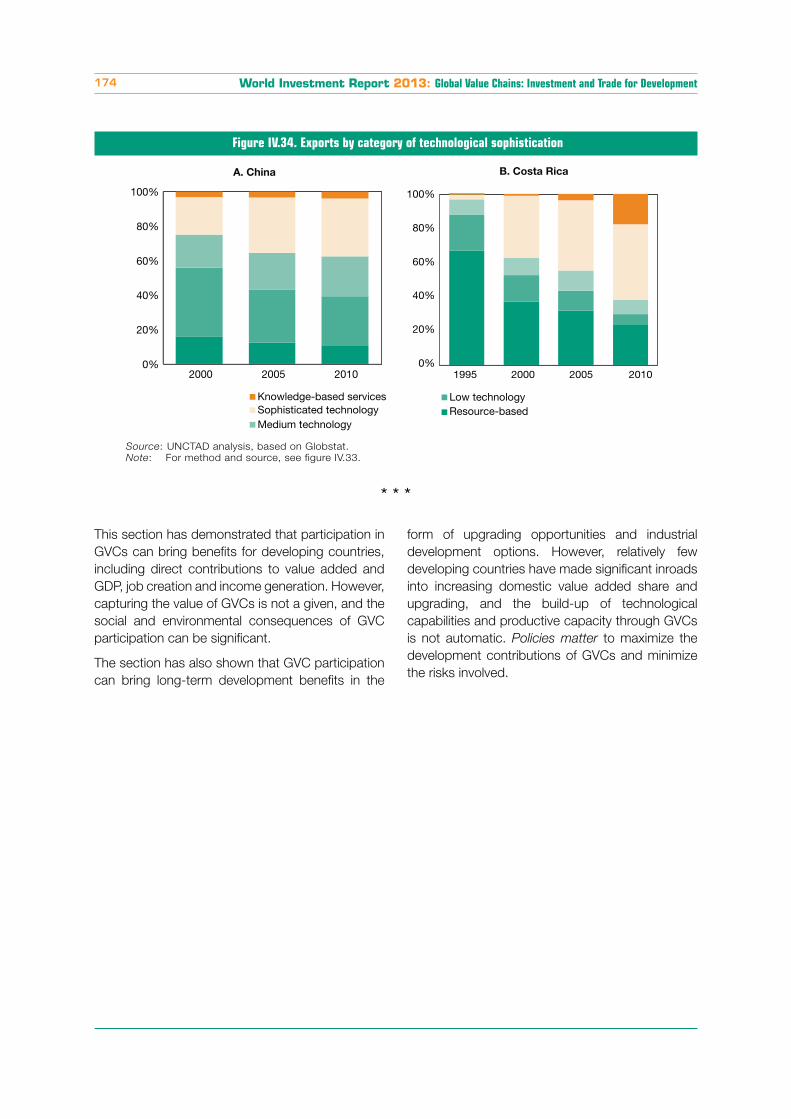
World Investment Report 2013: Global Value Chains: Investment and Trade for Development174
This section has demonstrated that participation in
GVCs can bring benefits for developing countries,
including direct contributions to value added and
GDP, job creation and income generation. However,
capturing the value of GVCs is not a given, and the
social and environmental consequences of GVC
participation can be significant.
The section has also shown that GVC participation
can bring long-term development benefits in the
form of upgrading opportunities and industrial
development options. However, relatively few
developing countries have made significant inroads
into increasing domestic value added share and
upgrading, and the build-up of technological
capabilities and productive capacity through GVCs
is not automatic. Policies matter to maximize the
development contributions of GVCs and minimize
the risks involved.
Figure IV.34. Exports by category of technological sophistication
Source: UNCTAD analysis, based on Globstat.
Note: For method and source, see figure IV.33.
0%
20%
40%
60%
80%
100%
2000 2005 2010
Knowledge-based services Sophisticated technology
Medium technology
0%
20%
40%
60%
80%
100%
Low technology Resource-based
2000 2005 20101995
A. China B. Costa Rica
* * *
CHAPTER IV Global Value Chains: Investment and Trade for Development 175
D. Policy implications of GVCs
As shown in the preceding
sections, participation
in GVCs can generate
considerable economic
development benefits
but also involve risks.
The potential social
and environmental consequences of GVCs, and
the experience of some countries with limited
local value capture from GVCs, have led many
developing-country policymakers to ask the
legitimate question; are active promotion of GVCs
and GVC-led development strategies the only
available options or are there alternatives?
Active promotion of GVCs and GVC-led
development strategies imply the encouragement
and provision of support to economic activities
aimed at generating exports in fragmented and
geographically dispersed industry value chains,
based on a narrower set of endowments and
competitive advantages. And they imply active
policies to encourage learning from GVC activities in
which a country is present, to support the process
of upgrading towards higher value added activities
and diversifying into higher value added chains.
The alternative, by implication, is an industrial
development strategy aimed at building domestic
productive capacity, including for exports, in all
stages of production (extending to the substitution
of imported content of exports) to develop a
vertically integrated industry that remains relatively
independent from the key actors of GVCs for its
learning and upgrading processes.
As seen in the previous sections, almost all countries
have increased their GVC participation over the
past two decades, but a significant group (about 20
per cent) has not seen a relevant increase in GVC
growth relative to the size of their economies. Some
countries, those with either significant resource-
based exports, or sufficient growth potential based
on domestic demand, or a combination of both
size and resource factors, have seen economic
performance in line with the most successful GVC-
led-growth countries.
Countries can make a strategic
choice whether or not to actively
promote GVC participation.
However, the key question for
most is how to incorporate GVCs
in development strategy.
It thus appears that countries can make a strategic
choice whether to promote or not to promote GVC
participation. To do so, they need to carefully weigh
the pros and cons of GVC participation, and the
costs and benefits of proactive policies to promote
GVCs or GVC-led development strategies, in line
with their specific situation and factor endowments.
It should be noted that promoting GVC participation
implies targeting specific GVC segments, i.e. GVC
promotion is often selective by nature. Moreover,
promotion of GVC participation is only one aspect
of country’s overall development strategy.
However, for the majority of smaller developing
economies with limited resource endowments there
is often little alternative to development strategies
that incorporate a degree of participation in GVCs.
The question for those countries is not whether to
participate in GVCs, but how.
To help answer that question, a number of key
policy challenges can be distilled from the findings
presented in the previous sections on patterns of
value added trade and investment, drivers and
locational determinants for GVC activities, and the
development impact of GVCs:
Most developing countries are increasingly
participating in GVCs, but many are still at
an early stage of GVC development. An
encouraging aspect of GVCs is that the
prerequisites for the development of activities
within value chains, and the determinants of
investment in such activities, are generally
fewer than the prerequisites for industries as
a whole. Nevertheless, a key challenge for
policymakers remains how to gain access and
connect local firms to GVCs.
GVC links in developing countries can play
an important role in developing economies, in
particular by contributing to GDP, employment
and growth. The scope for these potential
contributions depends on the configuration
and governance of GVCs and on the economic
context in GVC participant countries (including
productive capacities and firm capabilities). The
policy challenge is thus how to maximize the
development benefits from GVC participation.
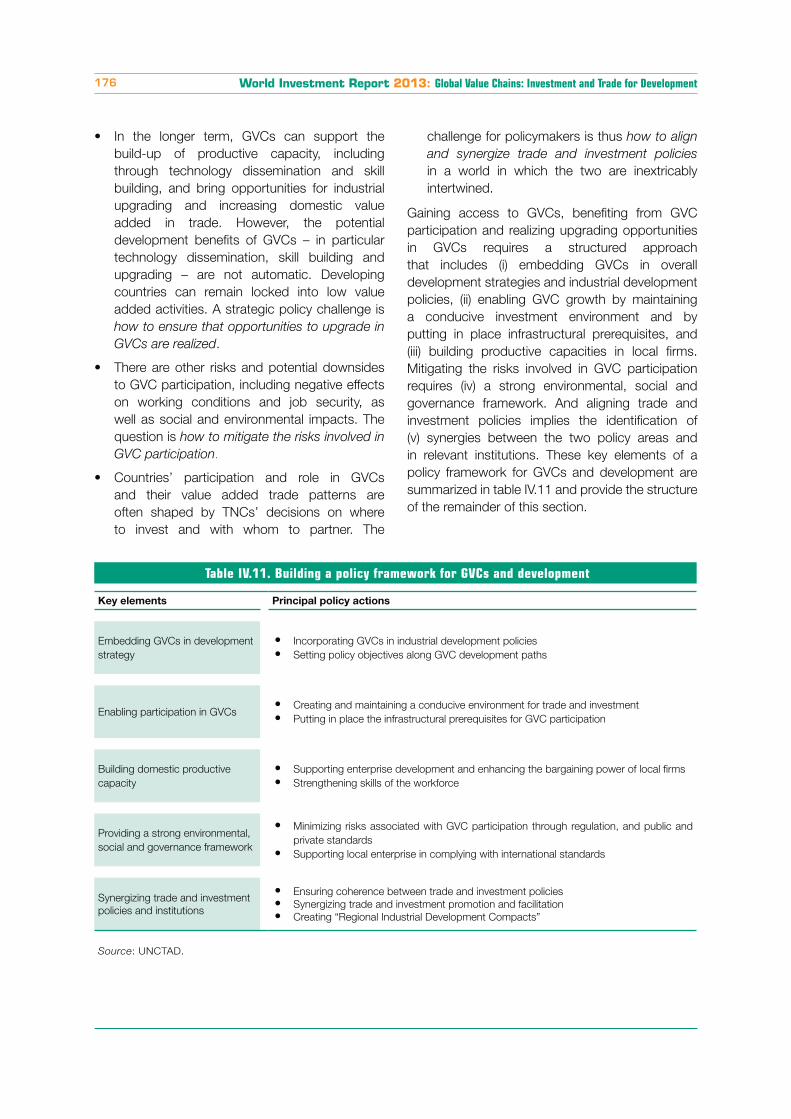
World Investment Report 2013: Global Value Chains: Investment and Trade for Development176
In the longer term, GVCs can support the
build-up of productive capacity, including
through technology dissemination and skill
building, and bring opportunities for industrial
upgrading and increasing domestic value
added in trade. However, the potential
development benefits of GVCs – in particular
technology dissemination, skill building and
upgrading – are not automatic. Developing
countries can remain locked into low value
added activities. A strategic policy challenge is how to ensure that opportunities to upgrade in
GVCs are realized.
There are other risks and potential downsides
to GVC participation, including negative effects
on working conditions and job security, as
well as social and environmental impacts. The
question is how to mitigate the risks involved in
GVC participation.
Countries’ participation and role in GVCs
and their value added trade patterns are
often shaped by TNCs’ decisions on where
to invest and with whom to partner. The
challenge for policymakers is thus how to align
and synergize trade and investment policies in a world in which the two are inextricably
intertwined.
Gaining access to GVCs, benefiting from GVC
participation and realizing upgrading opportunities
in GVCs requires a structured approach
that includes (i) embedding GVCs in overall
development strategies and industrial development
policies, (ii) enabling GVC growth by maintaining
a conducive investment environment and by
putting in place infrastructural prerequisites, and
(iii) building productive capacities in local firms.
Mitigating the risks involved in GVC participation
requires (iv) a strong environmental, social and
governance framework. And aligning trade and
investment policies implies the identification of
(v) synergies between the two policy areas and
in relevant institutions. These key elements of a
policy framework for GVCs and development are
summarized in table IV.11 and provide the structure
of the remainder of this section.
Table IV.11. Building a policy framework for GVCs and development
Key elements Principal policy actions
Embedding GVCs in development
strategy
Incorporating GVCs in industrial development policies
Setting policy objectives along GVC development paths
Enabling participation in GVCsCreating and maintaining a conducive environment for trade and investment
Putting in place the infrastructural prerequisites for GVC participation
Building domestic productive
capacity
Supporting enterprise development and enhancing the bargaining power of local firms
Strengthening skills of the workforce
Providing a strong environmental,
social and governance framework
Minimizing risks associated with GVC participation through regulation, and public and
private standards
Supporting local enterprise in complying with international standards
Synergizing trade and investment
policies and institutions
Ensuring coherence between trade and investment policies
Synergizing trade and investment promotion and facilitation
Creating “Regional Industrial Development Compacts”
Source: UNCTAD.
CHAPTER IV Global Value Chains: Investment and Trade for Development 177
1. Embedding GVCs in development strategy
In most developing
countries, economic
development requires not
just increased productivity
of the existing industrial
structure but also a change
in the structure of production
(e.g. diversifying from a
resource-based economy
into manufacturing and services), involving industrial
transformation and higher value-added activity. As
production is increasingly organized within GVCs,
development is likely to occur within such chains.
Economic upgrading in GVCs – moving into higher
value added functions within chains and into more
technologically sophisticated value chains – is
thus an important channel of development and
industrialization.
Industrial policies focused on final goods and
services are less effective in a global economy
characterized by GVCs.53 GVCs require a new
approach to industrial development, one based
on new markets, new products and new skills.
Policymakers must understand the key elements of
a GVC-based approach to industrial development:54
GVCs require more finely targeted policies.
GVC-based industrial development policies
require a shift away from traditional industrial
policies aimed at developing production
capacity for final goods and services.
Improvements in competitiveness do not
necessarily arise from the development of
integrated industries, but from upgrading to
higher value tasks within industries. Measures
aimed at encouraging the development of
a vertically integrated industry can be an
inefficient use of scarce resources.
GVCs increase the need for policies dealing
with the risk of the middle-income trap. The
fragmentation of industries increases the risk of
“thin” industrialization, where a country enters
an industry, but only in its low-value and low-
skill aspects, such as assembly of electronics
products or call centres in the services sector,
without the ability to upgrade (see Section
C). Although countries can also get stuck
GVCs imply a new role for
trade and investment in
industrial development
strategies, which should
be based on countries’
starting points and growth
opportunities along GVC
development paths.
producing low value added final goods, in
GVCs the risk of getting stuck in low-value
added tasks and activities is arguably greater.
GVCs require a new approach to trade
policies in industrial development strategies.
Protective trade policies can backfire in the
context of GVCs if imports are crucial for
exports, and non-tariff barriers to a country’s
imports can have a negative impact on its
export competitiveness. To the extent that
intermediate goods and services produced
abroad are necessary for the production of
a country’s own exports, GVC participation
requires easy and cheap access to such
imports, especially on a regional basis and in
a South-South context, as imports for export
production involve a high degree of regional
trade (see Section A).
GVCs increase the importance of regional
production networks. The rationale for regional
integration is no longer just market expansion;
it is now also based on the organization of
GVCs. For developing countries, whereas
export-oriented industrial policies were typically
focused on exports to advanced economies,
GVC-based industrialization relies on stronger
ties with the supply base in neighbouring
developing economies. As an industrialization
strategy, GVC-based industrial development
(unlike export orientation) can thus also be
utilized to promote upgrading for regional
markets.
GVCs strengthen the rationale for governments
to seek mutually beneficial partnerships
with lead firms for industrial development.
Upgrading in GVCs and moving into higher
value added activities involves raising
productivity and skills and the introduction of
new technologies, which requires connecting
closely with lead firms. At the same time,
while traditional trade policy was based on the
assumption that industry value added accrued
to the domestic economy, value capture in
GVCs depends on power relationships in the
chain. In this respect, competition policies
take on a crucial role in surveying such power
relationships and preventing or sanctioning
anti-competitive behaviours by lead firms as
countries increase GVC participation.
World Investment Report 2013: Global Value Chains: Investment and Trade for Development178
GVCs require institutional support for
social and environmental upgrading. Active
intervention is needed for industrial upgrading
within GVCs to translate into sustainable
social gains, including employment and
wage growth and improved labour and
environmental standards. As highlighted in
Section C, industrial upgrading does not
always necessarily bring social upgrading.
Joint economic and social upgrading can be
facilitated by multi-stakeholder initiatives and
linkages between firms, workers and small-
scale producers.
GVCs require a more dynamic view of
industrial development. The location of tasks
and activities within GVCs is determined by
dynamic factors – including relative labour
productivity and cost, as well as other
determinants – and as such can shift around
the international production networks of TNCs
(they can be footloose), causing disruption in
industrial upgrading processes and negative
social impacts. On the one hand, industrial
policies and trade and investment strategies
can include measures to improve stickiness,
e.g. by building partnerships with investors
and creating GVC clusters (focusing on
complementary tasks in GVCs, rather than
generic industrial clusters), including regional
GVC clusters through regional government
partnerships (cross-border industrial coop-
eration). On the other, industrial policies
should aim to develop long-term competitive
advantages along GVCs by selectively
investing in building and improving investment
determinants (e.g. skill development, access
to finance, trade facilitation) for higher value-
added activities and by building partnerships
with investors for co-creation of markets, co-
development of skills, co-establishment of
clusters, co-nurturing of new value chains (e.g.
green GVCs).
A starting point for the incorporation of GVCs
in development strategy is an understanding of
countries’ current positioning in GVCs. Two key
variables determining countries’ positioning are
(i) the level of participation of domestic economic
activity in GVCs and domestic value creation (see
the matrix in the previous section) and (ii) the existing
presence and strengths of the economy in GVCs
of different degrees of technological sophistication
and value, from resource-based activities to low-,
medium- and high-tech activities, to knowledge-
based activities positioned at the high-value ends
of chains, e.g. design, innovation, R&D, marketing
and branding.
These two variables (i) and (ii), discussed empirically
in section C, are mapped in figure IV.35, which
offers a tool for policymakers to assess their
economy’s position along GVC development paths.
A country’s position can be plotted by looking at the
distribution of its exports by level of sophistication,
at the imported contents of exports and at domestic
value added created. From the starting point,
policymakers can set objectives for growth along
GVC development paths for strategic positioning.
For countries with a resource-based economy,
GVC development typically implies increasing
GVC participation through diversification into more
fragmented value chains and increased exports
of intermediate goods and services, often starting
with manufacturing exports at the lower end of
technological sophistication, on the basis of low-
cost labour. This pattern mostly results in increased
GVC participation and a lower share of domestic
value added in exports (but higher absolute levels
of domestic value added creation). Alternatively,
GVC development for resource-based economies
can occur by attracting investment in processing
activities, increasing domestic value added, where
advantages from proximity to resources outweigh
economies of scale.
Upgrading mostly implies, first, upgrading products
and processes, increasing productivity and value
added creation within existing GVC segments and
activities, before functional and chain upgrading
opportunities materialize, allowing countries to
move into GVCs at higher levels of technological
sophistication. Moving into more sophisticated
and fragmented GVCs often implies higher foreign
content in exports. Paradoxically, upgrading may
often result in a lower domestic value added
share in exports, especially in early stages of
GVC participation. Subsequently, upgrading
opportunities will aim to increase domestic value
added share – although more important than the
domestic value added share is the absolute GDP
contribution of GVCs (see section A).
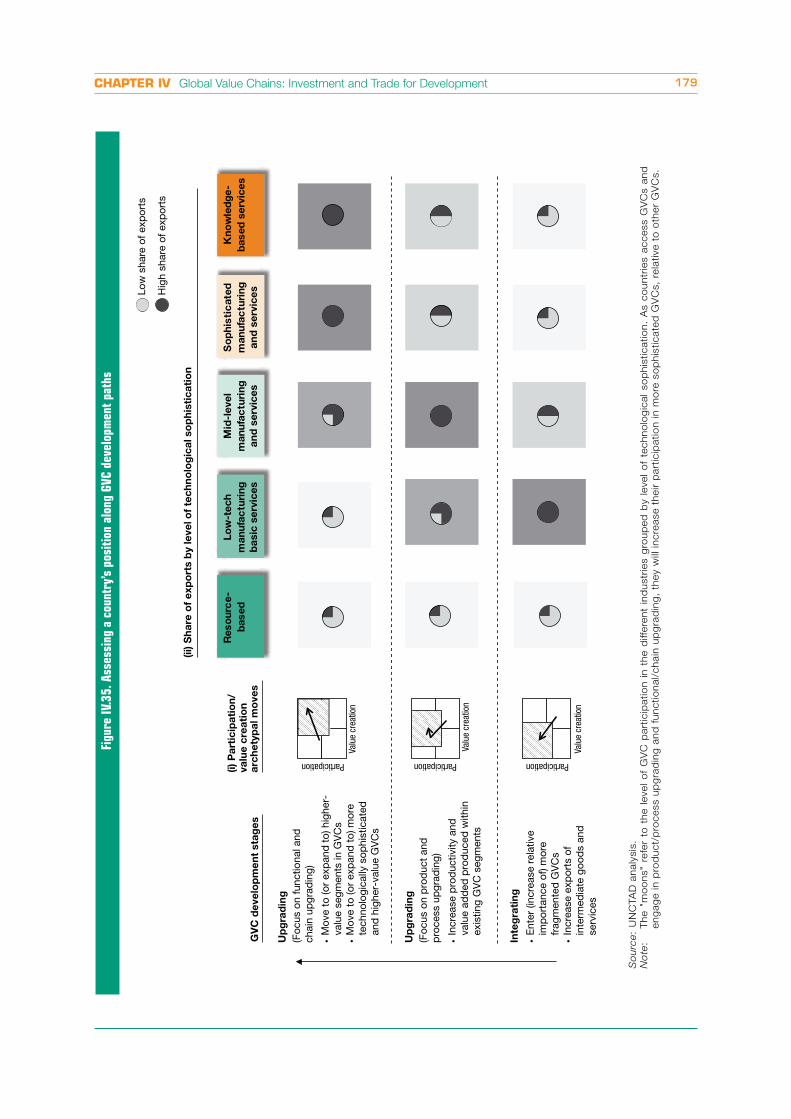
CHAPTER IV Global Value Chains: Investment and Trade for Development 179
Figu
re I
V.35
. Ass
essi
ng a
cou
ntry
’s p
osit
ion
alon
g G
VC d
evel
opm
ent
path
s
So
urc
e:
UN
CTA
D a
naly
sis
.
No
te:
T
he "
mo
on
s"
refe
r to
th
e l
evel
of
GV
C p
art
icip
atio
n i
n t
he d
iffe
ren
t in
du
str
ies g
rou
ped
by l
evel
of
tech
no
log
ical
so
ph
isticatio
n.
As c
ou
ntr
ies a
ccess G
VC
s a
nd
en
gag
e in
pro
du
ct/
pro
cess u
pg
rad
ing
an
d f
un
ctio
nal/
ch
ain
up
gra
din
g,
they w
ill in
cre
ase t
heir
part
icip
atio
n in
mo
re s
op
his
ticate
d G
VC
s,
rela
tive t
o o
ther
GV
Cs.
Low
sha
re o
f exp
orts
Hig
h sh
are
of e
xpor
ts
va
lue
cre
ati
on
(i)
Pa
rtic
ipa
tio
n/
arc
he
typ
al m
ove
s
(ii) S
ha
re o
f e
xp
ort
s b
y le
ve
l o
f te
ch
no
log
ica
l so
ph
isti
ca
tio
n
GV
C d
eve
lop
me
nt
sta
ge
s
Valu
e cr
eatio
n
Valu
e cr
eatio
n
Valu
e cr
eatio
nParticipation Participation Participation
Re
so
urc
e-
ba
se
d
Lo
w-t
ec
h
ma
nu
fac
turi
ng
ba
sic
se
rvic
es
Mid
-le
ve
l
ma
nu
fac
turi
ng
an
d s
erv
ice
s
So
ph
isti
ca
ted
ma
nu
fac
turi
ng
an
d s
erv
ice
s
Kn
ow
led
ge
-
ba
se
d s
erv
ice
s
Up
gra
din
g
(Foc
us o
n fu
nctio
nal a
ndch
ain
upgr
adin
g)
Mov
e to
(or
exp
and
to) h
ighe
r-va
lue
segm
ents
in G
VC
sM
ove
to (o
r ex
pan
d t
o) m
ore
tech
nolo
gica
lly s
ophi
stic
ated
and
hig
her-
valu
e G
VC
s
Up
gra
din
g
(Foc
us o
n p
rod
uct
and
pro
cess
up
grad
ing)
Incr
ease
pro
duc
tivity
and
valu
e ad
ded
pro
duc
ed w
ithin
exis
ting
GV
C s
egm
ents
Inte
gra
tin
g
Ent
er (i
ncre
ase
rela
tive
imp
orta
nce
of) m
ore
frag
men
ted
GV
Cs
Incr
ease
exp
orts
of
inte
rmed
iate
goo
ds
and
serv
ices
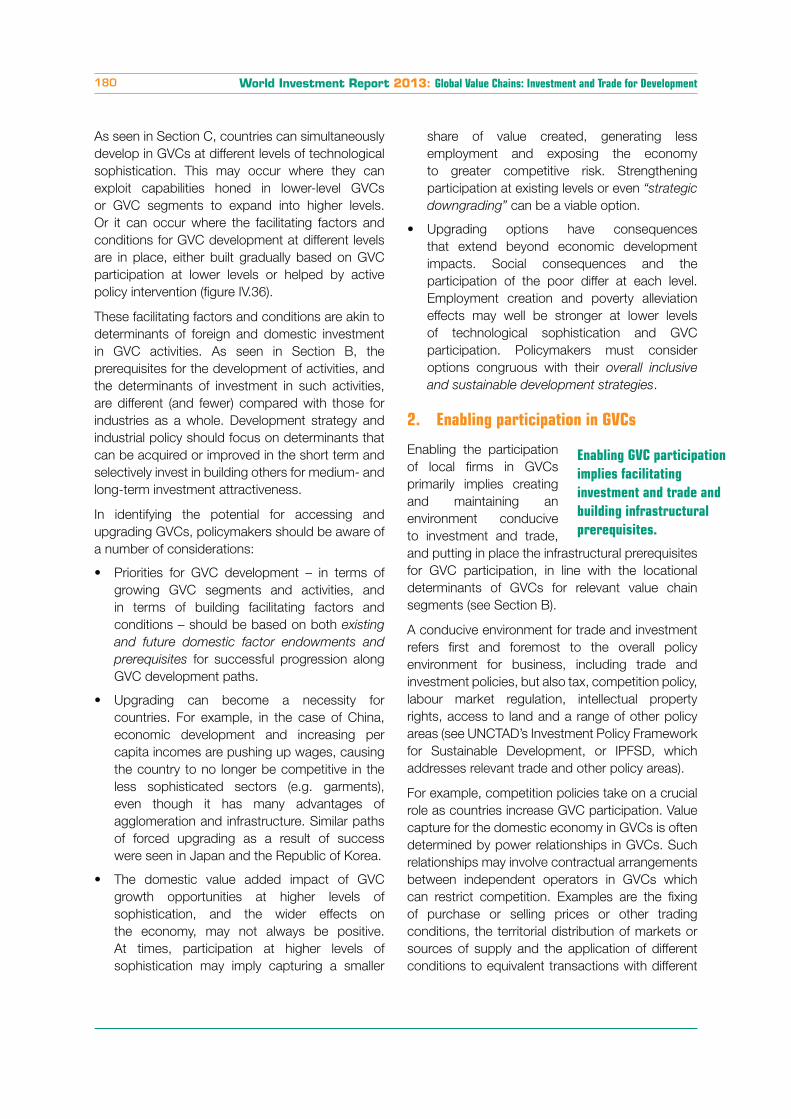
World Investment Report 2013: Global Value Chains: Investment and Trade for Development180
As seen in Section C, countries can simultaneously
develop in GVCs at different levels of technological
sophistication. This may occur where they can
exploit capabilities honed in lower-level GVCs
or GVC segments to expand into higher levels.
Or it can occur where the facilitating factors and
conditions for GVC development at different levels
are in place, either built gradually based on GVC
participation at lower levels or helped by active
policy intervention (figure IV.36).
These facilitating factors and conditions are akin to
determinants of foreign and domestic investment
in GVC activities. As seen in Section B, the
prerequisites for the development of activities, and
the determinants of investment in such activities,
are different (and fewer) compared with those for
industries as a whole. Development strategy and
industrial policy should focus on determinants that
can be acquired or improved in the short term and
selectively invest in building others for medium- and
long-term investment attractiveness.
In identifying the potential for accessing and
upgrading GVCs, policymakers should be aware of
a number of considerations:
Priorities for GVC development – in terms of
growing GVC segments and activities, and
in terms of building facilitating factors and
conditions – should be based on both existing
and future domestic factor endowments and
prerequisites for successful progression along
GVC development paths.
Upgrading can become a necessity for
countries. For example, in the case of China,
economic development and increasing per
capita incomes are pushing up wages, causing
the country to no longer be competitive in the
less sophisticated sectors (e.g. garments),
even though it has many advantages of
agglomeration and infrastructure. Similar paths
of forced upgrading as a result of success
were seen in Japan and the Republic of Korea.
The domestic value added impact of GVC
growth opportunities at higher levels of
sophistication, and the wider effects on
the economy, may not always be positive.
At times, participation at higher levels of
sophistication may imply capturing a smaller
share of value created, generating less
employment and exposing the economy
to greater competitive risk. Strengthening
participation at existing levels or even “strategic
downgrading” can be a viable option.
Upgrading options have consequences
that extend beyond economic development
impacts. Social consequences and the
participation of the poor differ at each level.
Employment creation and poverty alleviation
effects may well be stronger at lower levels
of technological sophistication and GVC
participation. Policymakers must consider
options congruous with their overall inclusive
and sustainable development strategies.
2. Enabling participation in GVCs
Enabling the participation
of local firms in GVCs
primarily implies creating
and maintaining an
environment conducive
to investment and trade,
and putting in place the infrastructural prerequisites
for GVC participation, in line with the locational
determinants of GVCs for relevant value chain
segments (see Section B).
A conducive environment for trade and investment
refers first and foremost to the overall policy
environment for business, including trade and
investment policies, but also tax, competition policy,
labour market regulation, intellectual property
rights, access to land and a range of other policy
areas (see UNCTAD’s Investment Policy Framework
for Sustainable Development, or IPFSD, which
addresses relevant trade and other policy areas).
For example, competition policies take on a crucial
role as countries increase GVC participation. Value
capture for the domestic economy in GVCs is often
determined by power relationships in GVCs. Such
relationships may involve contractual arrangements
between independent operators in GVCs which
can restrict competition. Examples are the fixing
of purchase or selling prices or other trading
conditions, the territorial distribution of markets or
sources of supply and the application of different
conditions to equivalent transactions with different
Enabling GVC participation
implies facilitating
investment and trade and
building infrastructural
prerequisites.
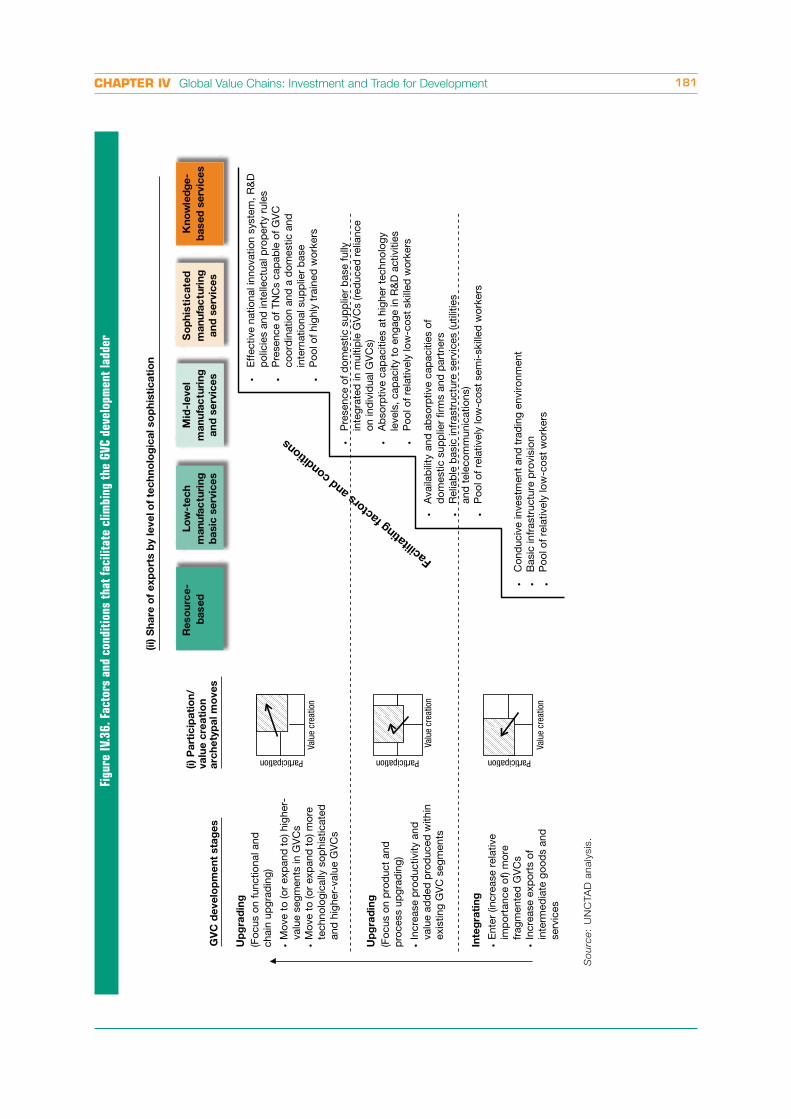
CHAPTER IV Global Value Chains: Investment and Trade for Development 181
Figu
re I
V.36
. Fac
tors
and
con
diti
ons
that
fac
ilita
te c
limbi
ng t
he G
VC d
evel
opm
ent
ladd
er
So
urc
e:
UN
CTA
D a
naly
sis
.
va
lue
cre
ati
on
(i)
Pa
rtic
ipa
tio
n/
arc
he
typ
al m
ove
s
(ii) S
ha
re o
f e
xp
ort
s b
y le
ve
l o
f te
ch
no
log
ica
l so
ph
isti
ca
tio
n
Valu
e cr
eatio
n
Valu
e cr
eatio
n
Valu
e cr
eatio
n
Participation Participation Participation
Re
so
urc
e-
ba
se
d
Lo
w-t
ec
h
ma
nu
fac
turi
ng
ba
sic
se
rvic
es
Mid
-le
ve
l
ma
nu
fac
turi
ng
an
d s
erv
ice
s
So
ph
isti
ca
ted
ma
nu
fac
turi
ng
an
d s
erv
ice
s
Kn
ow
led
ge
-
ba
se
d s
erv
ice
s
Eff
ectiv
e na
tiona
l inn
ovat
ion
syst
em, R
&D
pol
icie
s an
d in
telle
ctua
l pro
per
ty r
ules
Pre
senc
e of
TN
Cs
cap
able
of G
VC
coor
din
atio
n an
d a
dom
estic
and
in
tern
atio
nal s
upp
lier
bas
eP
ool o
f hig
hly
trai
ned
wor
kers
Ava
ilab
ility
and
ab
sorp
tive
cap
aciti
es o
fd
omes
tic s
upp
lier
firm
s an
d p
artn
ers
Rel
iab
le b
asic
infr
astr
uctu
re s
ervi
ces
(util
ities
and
tel
ecom
mun
icat
ions
)P
ool o
f rel
ativ
ely
low
-cos
t se
mi-
skill
ed w
orke
rs
Con
duc
ive
inve
stm
ent a
nd tr
adin
g en
viro
nmen
t B
asic
infr
astr
uctu
re p
rovi
sion
Poo
l of r
elat
ivel
y lo
w-c
ost
wor
kers
Facilita
ting fa
ctors
and c
onditions
Pre
senc
e of
dom
estic
sup
plie
r b
ase
fully
inte
grat
ed in
mul
tiple
GV
Cs
(red
uced
rel
ianc
eon
ind
ivid
ual G
VC
s)A
bso
rptiv
e ca
pac
ities
at
high
er t
echn
olog
yle
vels
, cap
acity
to
enga
ge in
R&
D a
ctiv
ities
Poo
l of r
elat
ivel
y lo
w-c
ost
skill
ed w
orke
rs
GV
C d
eve
lop
me
nt
sta
ge
s
Up
gra
din
g
(Foc
us o
n fu
nctio
nal a
ndch
ain
upgr
adin
g)
Mov
e to
(or
exp
and
to) h
ighe
r-va
lue
segm
ents
in G
VC
sM
ove
to (o
r ex
pan
d t
o) m
ore
tech
nolo
gica
lly s
ophi
stic
ated
and
hig
her-
valu
e G
VC
s
Up
gra
din
g
(Foc
us o
n p
rod
uct
and
pro
cess
up
grad
ing)
Incr
ease
pro
duc
tivity
and
valu
e ad
ded
pro
duc
ed w
ithin
exis
ting
GV
C s
egm
ents
Inte
gra
tin
g
Ent
er (i
ncre
ase
rela
tive
imp
orta
nce
of) m
ore
frag
men
ted
GV
Cs
Incr
ease
exp
orts
of
inte
rmed
iate
goo
ds
and
serv
ices
World Investment Report 2013: Global Value Chains: Investment and Trade for Development182
trading parties. Competition policies can play
a crucial role in preventing or sanctioning such
anti-competitive behaviours. GVCs thus require
enhanced competition-law enforcement.
Beyond the general policy framework for trade and
investment, trade facilitation specifically is key to
the creation of a conducive environment for trade
and investment. The international community aims
to make progress on the trade facilitation agenda in
a new WTO agreement. The importance of trade-
facilitating measures, such as fast, efficient port
and customs procedures, has risen exponentially
with the growth of GVCs in which goods now
cross borders multiple times, first as inputs and
ultimately as final products. The WTO estimates
that the cost of trading across borders amounts
to some $2 trillion, two thirds of which is a result
of border and customs procedures, and notes
that the gain in global trade from smoother border
procedures could be higher than the gain from tariff
reduction. UNCTAD has provided active assistance
to developing countries on trade facilitation and
on border and customs procedures since the
early 1980s, through various capacity-building
programmes including ASYCUDA, the automated
system for customs data, which is now used in over
90 countries.55
Trade facilitation measures are usually
uncontroversial, not coming at the expense of firms,
political constituents or other policy imperatives. The
benefits of trade facilitation measures tend to have a
positive ripple effect on the economy, as imports and
exports are less costly and flow more freely across
borders in GVCs. Comprehensive trade facilitation
reform is more effective than isolated or piecemeal
measures. The most beneficial areas for reforms
tend to be reducing or eliminating the “procedural
obstacles” to trade, such as harmonising and
simplifying documents, streamlining procedures,
automating processes, ensuring the availability of
trade-related information and providing advance
rulings on customs matters.56
Investment facilitation measures can be equally
important for building up productive capacity for
exports. The most important facilitation measures
relate to entry and establishment processes, e.g.
procedures for the start-up of foreign-invested
businesses, registration and licensing procedures,
and access to industrial land, as well as procedures
for the hiring of key personnel (including foreign
workers) and the payment of taxes.57 UNCTAD’s
work in investment facilitation includes assistance
to investment authorities and investment promotion
agencies (IPAs), as well as the e-Regulation
programme – deployed in 27 countries – which
helps governments (including subnational
administrations) to simplify procedures for investors
and businesses, and to automate procedures
where possible.58
Providing reliable infrastructure (e.g. roads,
ports, airports, telecommunications, broadband
connectivity) is crucial for attracting GVC activities.
Improvements in technology and decreasing data
transmission costs can facilitate the sourcing of
services, in particular, “knowledge work” such as
data entry, research and development or remotely
supplied consultancy services. Energy and
transportation costs are an issue in particular for
those countries that are connected to GVCs over
longer distances. Developing good communication
and transport links can also contribute to the
“stickiness” of GVC operations.
Methods that governments have employed to
improve infrastructure in support of local GVC
development include public-private partnerships
(PPPs) in infrastructure – such as roads,
telecommunication, office buildings and the
establishment of industrial clusters. Such GVC-
targeted PPP initiatives can help firms, including
SMEs, to better connect to GVCs and increase the
attractiveness of domestic suppliers.59 In particular
the establishment of industrial parks for GVC
activities – with good communication and transport
links – can be instrumental, including at the
regional level. As value chains are often regional in
nature, international partnerships for infrastructure
development can be particularly beneficial.
Governments can usefully promote inter-agency
cooperation for export and investment promotion
in regional partnerships, including through the
redefinition of export processing zones (EPZs) to
satisfy the needs of regional value chains. Regional
development banks can also play a role, bolstering
investment-export links in those sectors that are
strategic for the enhancement of value added in
CHAPTER IV Global Value Chains: Investment and Trade for Development 183
regional value chains. By pooling risks, regional
groups of developing economies can improve
their terms of access to donor funding, leveraged
technical assistance and global capital markets.60
Building the infrastructural prerequisites to enable
GVC participation and building productive capacity
(the subject of the next section), are the two key
elements of the WTO initiative Aid for Trade. Aid for
Trade is aimed at lowering the cost of trade, thereby
raising a recipient country’s export competitiveness.
The majority of infrastructure support under Aid for
Trade relates to improvements in ports, railroads
and roads, although some of the aid in this category
involves utilities and communication infrastructure.
Aid for productive capacity is more varied and
includes training programmes, machinery and
equipment, support for cooperatives and other
forms. Aid for Trade can therefore represent an
important vehicle for the international community
to help developing countries access GVCs. To do
so, a priority area should be trade facilitation, as
the implementation of reforms, such as customs
reforms, can be very costly for developing countries.
To help countries to increase GVC participation
and reap the benefits of GVCs for long-term
development, Aid for Trade could also be better
targeted to ensure that the benefits accrue to
intended recipients (see box IV.7). In addition, the
programme could adopt a wider set of objectives
in addition to boosting trade, including diversifying
trade, increasing participation in GVCs, reducing the
price of imported inputs and moving to higher value-
added segments in GVCs. Doing that would imply
not just addressing barriers to trade, but explicitly
addressing investment issues, as well as a broader
range of barriers to GVC participation, focusing
on, e.g. improving the business environment,
strengthening the services sector, supporting
adherence to standards in production, increasing
the legal security of investment, fostering innovation
and enabling companies to find new markets and
new buyers.
3. Building domestic productive capacity
GVC participation requires the prior build-up of a
minimum level of productive capacity in order to
step on the first rung of the GVC development
ladder. Subsequently, the sequence of economic
roles in GVCs involves
an expanding set of
capabilities that developing
countries must aim to attain
in pursuing an upgrading
trajectory in diverse
industries, by developing
the capabilities of local enterprise and of the local
workforce. 61
A number of focus areas are key for proactive
enterprise development policies in support of GVC
participation and upgrading:
Enterprise clustering. Enterprise agglomeration
may determine “collective efficiency” that in
turn enhances the productivity and overall
performance of clustered firms. It is particularly
relevant for SMEs in developing countries,
which often participate in clusters and value
chains at the same time, with the local and
global dimensions operating simultaneously.
Both offer opportunities to foster
competitiveness via learning and upgrading.
Linkages development. Domestic and
international inter-firm and inter-institution
linkages can provide local SMEs with the
necessary externalities to cope with the
dual challenge of knowledge creation and
internationalization, needed for successful
participation in value chains as first, second or
third-tier suppliers.
Science and technology support and an
effective IP rights framework. Technical
support organizations in standards, metrology,
quality, testing, R&D, productivity and SME
extension are increasingly needed to complete
and improve the technology systems with
which firms operate and grow. Appropriate
levels of IP protection can help give lead
firms confidence in employing advanced
technologies in GVC relations, and provide
incentives for local firms to develop or adapt
their own technologies.
Business development services. A range
of services can facilitate GVC-related trade
and investment, and generate spillover
effects. Such services might include business
development services centres (BDSCs) and
capacity-building facilities to help local firms
Proactive enterprise develop-
ment policies and a strategy
for workforce and skills de-
velopment are key to improv-
ing the chances of successful
upgrading in GVCs.
World Investment Report 2013: Global Value Chains: Investment and Trade for Development184
Box IV.7. Targeting Aid for Trade at the upstream part of GVCs
A key concern related to Aid for Trade, stemming from the rise of GVCs, is that gains resulting from lower trade
costs may mostly flow downstream – that is, to TNC lead firms in GVCs – rather than to supplier firms in developing
countries and to their workers and communities.
In general, the economic gains from GVCs are not distributed equally along the chain. The ability of local firms and
workers to capture value depends to a significant extent on power relationships in the chain. TNCs with a multitude
of potential supply sources will be in a strong position to dictate contractual terms with suppliers. Also, the greater
the depth of the supply chain, the greater the capacity of TNCs to exploit the segmentation of labour markets,
such that non-organized workers, among which women, seasonal workers or homeworkers can be paid less. The
benefits from Aid for Trade may thus largely accrue to lead firms in a chain and not to the workers, small producers
and local communities that are the intended beneficiaries.
Aid can enter a value chain at different points. A port improvement will lower transport costs at the border, affecting
mostly the link between a first-tier supplier and a lead firm. Aid to build a refrigerated warehouse for a local agricultural
cooperative or to train garment workers enters the value chain at or near the bottom of the chain. Other forms of aid
may enter at other points in the chain: a road linking a rural region to an international trade hub, for example, may
strengthen the link between small suppliers and a first-tier supplier. Because few of the benefits of aid travel down
the supply chain, if the goal of Aid for Trade is to benefit those at the bottom, it needs to be targeted at that point
of the chain.
Aid might be targeted more directly at workers in one of two ways. The first is by improving their productivity
by investing in training or providing technology. Such measures will increase the overall economic efficiency of
the chain, leaving more of the benefits at lower ends in the chain. The second is by empowering workers and
small producers in relationship with buyers further up the chain, e.g. by facilitating collective action, supporting the
establishment of agricultural cooperatives or associations of female garment workers. Such interventions might not
increase the overall economic efficiency of the value chain, but they do have the potential to alter the allocations of
gains within the chain.
Source: UNCTAD, based on Mayer, F. and W. Milberg (2013), “Aid for Trade in a World of Global Value Chains:
Chain Power”, working paper, Sanford School of Public Policy, Duke University.
meet technical standards and improve their
understanding of international trade rules and
practices.
Entrepreneurship promotion. Entrepreneurial
development policies aim to support existing
entrepreneurs and encourage new enterprise
creation, thereby supporting development.
University and public research institute spin-
offs, incubator programmes and other forms
of clustering; managerial and entrepreneurial
training; and venture capital support are some
of the tools of entrepreneurship development
policy. A detailed discussion on all the
elements of entrepreneurship development
policies can be found in UNCTAD’s
Entrepreneurship Policy Framework.62
Access to finance for SMEs. Inclusive finance
initiatives and programmes to increase access
to finance for micro, small and medium-sized
enterprises are fundamental mechanisms
for supporting the development of domestic
productive capacity and directing development
efforts at the upstream end of value chains
where they most directly benefit local firms,
small producers and workers.
Enterprise development and workforce skills
development go hand in hand. Without sufficient
investment in skills, technological progress and
involvement of local firms in GVCs may not translate
into productivity growth, and countries can no
longer compete in an increasingly knowledge-
based global economy. An effective skills strategy
is key to engagement and upgrading in GVCs and
to the necessary adjustment:
Skills strategies in GVCs should be based on
a thorough understanding of the economy’s
position in GVCs and the most likely trajectory
of upgrading, which will determine skill
requirements.
GVC skill strategies should recognize the rising
importance of training to comply with product
CHAPTER IV Global Value Chains: Investment and Trade for Development 185
and process standards and internationally
recognized certifications.
International partnerships are more important
in GVC skill strategies because lead firms act
as gatekeepers to enforce skill requirements
and product quality.
In addition, as discussed in Section C, GVC
participation and upgrading processes imply
economic adjustments. Skill strategies should
facilitate this adjustment process and help
displaced workers find new jobs. Social policies
and a well-functioning labour market, including re-
employment and vocational training programmes,
can also help this process.
A broad package of labour and product market
reforms is more likely to deliver larger overall gains
in job creation and labour market performance
than piecemeal reforms. Several countries have
recently announced or implemented reforms to
tackle labour market duality – a risk in GVCs, as
discussed in Section C – by reducing the gap in
employment protection between permanent and
temporary workers. Such reforms, accompanied by
re-employment programmes and adequate safety
nets, promote labour adaptability and facilitate the
adjustment of the labour market to the dynamics
of GVCs.
Finally, success in both enterprise and workforce
development is influenced by power relationships
in GVCs. Policymakers should consider options
to strengthen the bargaining power of domestic
producers relative to their foreign GVC partners,
to help them obtain a fair distribution of rents
and to facilitate their access to higher value
added activities in GVCs. There are several
ways to strengthen the bargaining position of
local firms in GVCs. First, supporting collective
bargaining, including the formation of domestic
producer associations, can help to create a better
counterweight to the negotiating power of TNCs.
Second, host countries can develop specific laws
and regulations for individual GVC activities, such
as contract farming. Third, governments can offer
training courses on bargaining or provide model
contracts, covering the economic aspects of GVC
participation (e.g. distribution of business risks),
financial considerations (e.g. taxation) and legal
elements (implications of the contract) (WIR11).
4. Providing a strong environmental, social and governance framework
a. Social, environmental and safety and health issues
Strong social and
environmental policies to
minimize risks associated
with GVCs are essential to
maximizing the sustainable
development impact of
GVC activities, creating
better jobs and improving environmental practices
while also promoting the stable business and
investment climate required for GVC development.
At a minimum – and in line with the United Nations
Guiding Principles on Business and Human Rights
– host countries have an obligation to protect
the human rights. They also need to ensure that
GVC partners respect international core labour
standards as embodied in ILO Conventions. Equally
important are the establishment and enforcement
of occupational safety and health standards in
GVC production sites (such as safe construction
standards and fire protection) alongside strong
environmental protection standards. Lead firms in
GVCs, TNCs and their home countries can make
an important contribution to safer production
by working with suppliers to boost their capacity
to comply with host country regulations and
international standards, strengthening the capacity
of watchdog organizations such as trade unions
and civil society groups, and avoiding suppliers that
persistently fail to work towards full compliance
with such regulations and standards.
In the medium and long run, upgrading strategies
of developing countries that involve a move towards
more value added GVC activities and services are
likely to contribute to raising living standards in host
countries over time, including an improvement of
social and environmental conditions. In the short run,
regulatory measures must address urgent safety
and health issues – such as those found in the wake
of the recent Rana Plaza tragedy in Bangladesh.
That instance led the Government of Bangladesh
to change laws to allow garment workers to form
trade unions without prior permission from factory
Addressing social, safety
and environmental
risks associated with
GVCs requires effective
regulation, social dialogue
and an active civil society.
World Investment Report 2013: Global Value Chains: Investment and Trade for Development186
owners, and to announce a plan to raise the
minimum wage for garment workers.
In addition to adopting and enforcing domestic
laws, government procurement policies that require
compliance with international core labour and
human rights standards in GVCs can further foster
such compliance among TNCs and their suppliers.
Governments can also promote the use of multi-
stakeholder industry-specific standards such as
those developed by the Marine Stewardship Council
or Forest Stewardship Council. Governments may
wish to incorporate some aspects of successful
voluntary multi-stakeholder standards into
regulatory initiatives in order to scale up compliance.
When designing and enhancing their domestic policy
framework related to socially and environmentally
sustainable GVC activities, host countries can derive
guidance from various international principles and
standards. They cover social, human rights, health,
economic and environmental risks associated
with GVCs (table IV.12).63 More international
coordination in the promotion and implementation
of these standards would help to alleviate the
“first mover” problem, as countries may hesitate
to move forward unilaterally out of fear of losing
a perceived GVC-related competitive advantage.
Even without such international coordination, host
countries are increasingly realizing that a social and
environmental framework in line with international
standards enhances international competitiveness
because consumers pay increasing attention to
production conditions in developing countries.
Similarly, companies engaged in GVC activities
have an interest in showing compliance with
higher standards for commercial and reputational
reasons.64
In many industries, SMEs must often comply with
CSR standards imposed by TNCs as a condition
of entry into GVCs (WIR12). However, enterprise
development programmes in most countries do
not provide any form of capacity-building to assist
SMEs in meeting these standards. Meanwhile, in
some GVCs, as many as half of all potential suppliers
can be rejected because of CSR concerns. The
capacity constraints SMEs (in particular developing-
country SMEs) face in meeting these private sector
CSR codes can present a significant competitive
challenge. Promoting capacity-building through
existing enterprise development programmes can
help SMEs to better meet the demands of their
clients, while improving their overall contribution to
sustainable development.
Dozens of industry-specific multi-stakeholder
initiatives are currently influencing sustainability
practices throughout GVCs (WIR11). These include
such initiatives as the Fair Labour Association in
the apparel industry, and the International Cocoa
Initiative in the cocoa/chocolate industry. Each of
these initiatives provides practical, market-tested
approaches to promoting sustainable business
practices throughout a GVC, typically affecting
multiple members in the chain.
Policymakers can enhance the sustainable
development benefits of GVCs by promoting the
adoption and further development of such sector-
specific initiatives. In some countries, governments
require certification to one or more of the standards
promoted by these sustainability initiatives as a
condition for investment in certain sectors or for
government procurement. This can be a useful
policy approach that promotes wider adoption
of a standard, while allowing for the flexible and
dynamic development of a multi-stakeholder-driven
process. Governments can also participate in the
development of such standards by contributing
directly as stakeholders, or by hosting or otherwise
providing material support to the process that
develops the standard. Ultimately, governments
should note that CSR programmes will not be
sufficient to meet all of the social and environmental
challenges found in complex GVCs – public policy
solutions will be required to complement private
sector and multi-stakeholder initiatives.
b. Transforming EPZs into centres of excellence for sustainable business
TNCs around the world are increasingly demanding
that their products be produced in line with
international social and environmental standards.
Suppliers are under pressure to adapt to CSR
policies in order to ensure their continuing role in
GVCs (WIR12). As EPZs are an important hub in
GVCs, policy makers could consider adopting
improved CSR policies, support services and
infrastructure in EPZs, transforming them into
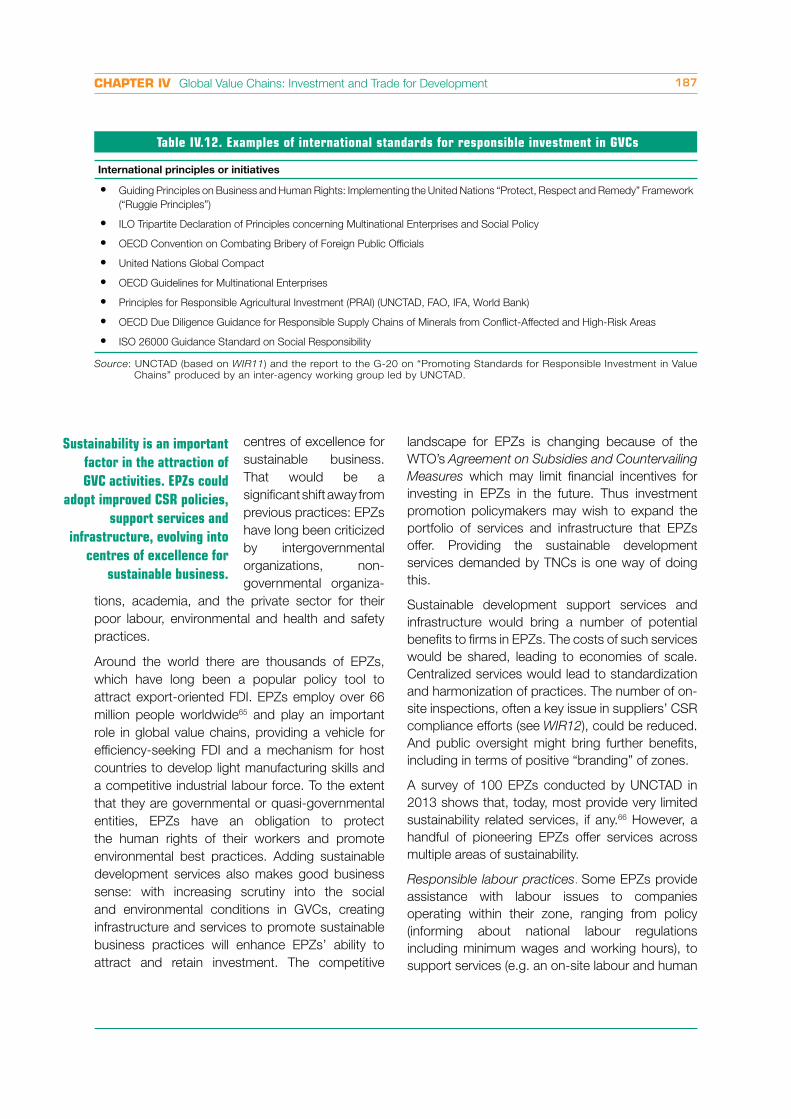
CHAPTER IV Global Value Chains: Investment and Trade for Development 187
Table IV.12. Examples of international standards for responsible investment in GVCs
International principles or initiatives
Guiding Principles on Business and Human Rights: Implementing the United Nations “Protect, Respect and Remedy” Framework
(“Ruggie Principles”)
ILO Tripartite Declaration of Principles concerning Multinational Enterprises and Social Policy
OECD Convention on Combating Bribery of Foreign Public Officials
United Nations Global Compact
OECD Guidelines for Multinational Enterprises
Principles for Responsible Agricultural Investment (PRAI) (UNCTAD, FAO, IFA, World Bank)
OECD Due Diligence Guidance for Responsible Supply Chains of Minerals from Conflict-Affected and High-Risk Areas
ISO 26000 Guidance Standard on Social Responsibility
Source: UNCTAD (based on WIR11) and the report to the G-20 on “Promoting Standards for Responsible Investment in Value
Chains” produced by an inter-agency working group led by UNCTAD.
centres of excellence for
sustainable business.
That would be a
significant shift away from
previous practices: EPZs
have long been criticized
by intergovernmental
organizations, non-
governmental organiza-
tions, academia, and the private sector for their
poor labour, environmental and health and safety
practices.
Around the world there are thousands of EPZs,
which have long been a popular policy tool to
attract export-oriented FDI. EPZs employ over 66
million people worldwide65 and play an important
role in global value chains, providing a vehicle for
efficiency-seeking FDI and a mechanism for host
countries to develop light manufacturing skills and
a competitive industrial labour force. To the extent
that they are governmental or quasi-governmental
entities, EPZs have an obligation to protect
the human rights of their workers and promote
environmental best practices. Adding sustainable
development services also makes good business
sense: with increasing scrutiny into the social
and environmental conditions in GVCs, creating
infrastructure and services to promote sustainable
business practices will enhance EPZs’ ability to
attract and retain investment. The competitive
Sustainability is an important
factor in the attraction of
GVC activities. EPZs could
adopt improved CSR policies,
support services and
infrastructure, evolving into
centres of excellence for
sustainable business.
landscape for EPZs is changing because of the
WTO’s Agreement on Subsidies and Countervailing
Measures which may limit financial incentives for
investing in EPZs in the future. Thus investment
promotion policymakers may wish to expand the
portfolio of services and infrastructure that EPZs
offer. Providing the sustainable development
services demanded by TNCs is one way of doing
this.
Sustainable development support services and
infrastructure would bring a number of potential
benefits to firms in EPZs. The costs of such services
would be shared, leading to economies of scale.
Centralized services would lead to standardization
and harmonization of practices. The number of on-
site inspections, often a key issue in suppliers’ CSR
compliance efforts (see WIR12), could be reduced.
And public oversight might bring further benefits,
including in terms of positive “branding” of zones.
A survey of 100 EPZs conducted by UNCTAD in
2013 shows that, today, most provide very limited
sustainability related services, if any.66 However, a
handful of pioneering EPZs offer services across
multiple areas of sustainability.
Responsible labour practices. Some EPZs provide
assistance with labour issues to companies
operating within their zone, ranging from policy
(informing about national labour regulations
including minimum wages and working hours), to
support services (e.g. an on-site labour and human
World Investment Report 2013: Global Value Chains: Investment and Trade for Development188
resources bureau that assists in resolving labour
disputes), to infrastructure (e.g. labour inspectors).
The majority only state the legal obligations of
employers towards their employees. Some EPZs
maintain clear policies on labour practices, including
minimum wage standards, regulations on working
hours, and trade unions. In most cases these stated
labour standards conform to local and national laws,
however, in a few cases these standards are higher.
Very few EPZs explicitly indicate the availability of
services to assist companies in implementation,
although some indicate that labour inspectors
are present within the EPZ. The Zonamerica,
in Uruguay, provides management assistance
services through skills training for employees as
well as training on business ethics.
Environmental sustainability. Sustainability policies
can include standards concerning land, air, and water
pollution, waste, noise and the use of energy. Some
zones have relatively well developed environmental
reporting requirements under which companies
are required to report their anticipated amounts of
wastes, pollutants, and even the decibel level of
noise that is expected to be produced. This is the
case in approximately half of the zones in Turkey,
two of the three zones in South Africa, several in
India, the United Arab Emirates, and Morocco,
and to a degree in zones in Argentina and China.
In addition to policies, some EPZs provide support
services and infrastructure to assist companies and
ensure standards are complied with. Most common
is the availability of hazardous waste management
systems, including methods for how waste should
be disposed of properly, which can be found in
EPZs in, for example, Argentina, Saudi Arabia,
South Africa, the Republic of Korea and Turkey. Only
a few EPZs provide recycling services (South Africa,
Saudi Arabia, Uruguay, and two in the Republic of
Korea and Turkey). To complement standard energy
services, a few EPZs offer alternative low-carbon
energy services to the companies operating within
their zone, including EPZs in Saudi Arabia, South
Africa, the Republic of Korea and Turkey. Some
EPZs located in China’s “low carbon cities” provide
a broad package of environmental sustainability
services including the development of alternative
sources of energy, enhanced waste management
systems, grey water recycling and waste recycling
systems. In addition, several EPZs around the world
have been certified to the ISO 14001 environmental
management system standard, including locations
in China and India. The EPZ authority of Kenya has
launched a strategic plan to achieve ISO 14001
certification for all of its zones.
Health and safety. Very few EPZs have stated
policies and regulations on employee occupational
safety and health (OSH) and few, if any, EPZs
provide services to assist companies in developing
improved OSH practices. A notable exception is
the Zonamerica, which offers labour risk prevention
programs. Elsewhere, support is generally limited
to infrastructure. Medical clinics or on site medical
personnel are available in approximately half
of all EPZs, offering assistance during medical
emergencies as well as routine medical exams.
The majority of EPZs offer firefighting services for all
factories within the EPZ. Nearly all EPZs include 24
hour surveillance and security.
Good governance: combating corruption. Very few
EPZs offer any services to assist companies in
combating corruption. One EPZ from South Africa
has a clear no tolerance policy for corruption, and
offers contact phone numbers for companies to raise
complaints. However, the service is not explicitly
geared towards corruption-related complaints. Very
few EPZs make note of any structured system for
curbing corruption, or advertise systems in place to
assist companies.
Policymakers should consider broadening the
availability of sustainable development related
policies, services and infrastructure in EPZs to
assist companies in meeting stakeholder demands
for improved CSR practices and meeting the
expectations of TNC CSR policies and standards.
This should also strengthen the State’s ability to
promote environmental best practices and meet its
obligation to protect the human rights of workers.
EPZs pursuing this path should also improve their
reporting to better communicate the sustainable
development services available for companies
operating within zones.
International organizations can assist countries
in transforming EPZs through the establishment
of benchmarks, exchanges of best practices,
and capacity-building programmes to assist the
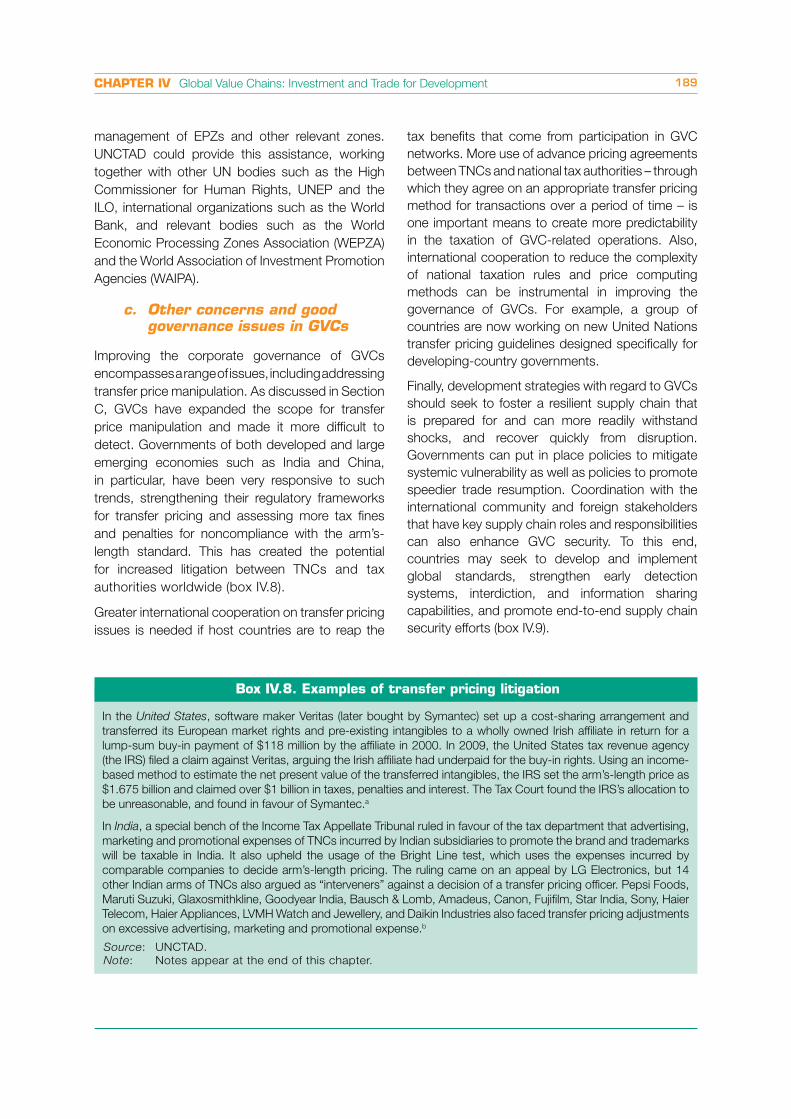
CHAPTER IV Global Value Chains: Investment and Trade for Development 189
management of EPZs and other relevant zones.
UNCTAD could provide this assistance, working
together with other UN bodies such as the High
Commissioner for Human Rights, UNEP and the
ILO, international organizations such as the World
Bank, and relevant bodies such as the World
Economic Processing Zones Association (WEPZA)
and the World Association of Investment Promotion
Agencies (WAIPA).
c. Other concerns and good governance issues in GVCs
Improving the corporate governance of GVCs
encompasses a range of issues, including addressing
transfer price manipulation. As discussed in Section
C, GVCs have expanded the scope for transfer
price manipulation and made it more difficult to
detect. Governments of both developed and large
emerging economies such as India and China,
in particular, have been very responsive to such
trends, strengthening their regulatory frameworks
for transfer pricing and assessing more tax fines
and penalties for noncompliance with the arm’s-
length standard. This has created the potential
for increased litigation between TNCs and tax
authorities worldwide (box IV.8).
Greater international cooperation on transfer pricing
issues is needed if host countries are to reap the
tax benefits that come from participation in GVC
networks. More use of advance pricing agreements
between TNCs and national tax authorities – through
which they agree on an appropriate transfer pricing
method for transactions over a period of time – is
one important means to create more predictability
in the taxation of GVC-related operations. Also,
international cooperation to reduce the complexity
of national taxation rules and price computing
methods can be instrumental in improving the
governance of GVCs. For example, a group of
countries are now working on new United Nations
transfer pricing guidelines designed specifically for
developing-country governments.
Finally, development strategies with regard to GVCs
should seek to foster a resilient supply chain that
is prepared for and can more readily withstand
shocks, and recover quickly from disruption.
Governments can put in place policies to mitigate
systemic vulnerability as well as policies to promote
speedier trade resumption. Coordination with the
international community and foreign stakeholders
that have key supply chain roles and responsibilities
can also enhance GVC security. To this end,
countries may seek to develop and implement
global standards, strengthen early detection
systems, interdiction, and information sharing
capabilities, and promote end-to-end supply chain
security efforts (box IV.9).
Box IV.8. Examples of transfer pricing litigation
In the United States, software maker Veritas (later bought by Symantec) set up a cost-sharing arrangement and
transferred its European market rights and pre-existing intangibles to a wholly owned Irish affiliate in return for a
lump-sum buy-in payment of $118 million by the affiliate in 2000. In 2009, the United States tax revenue agency
(the IRS) filed a claim against Veritas, arguing the Irish affiliate had underpaid for the buy-in rights. Using an income-
based method to estimate the net present value of the transferred intangibles, the IRS set the arm’s-length price as
$1.675 billion and claimed over $1 billion in taxes, penalties and interest. The Tax Court found the IRS’s allocation to
be unreasonable, and found in favour of Symantec.a
In India, a special bench of the Income Tax Appellate Tribunal ruled in favour of the tax department that advertising,
marketing and promotional expenses of TNCs incurred by Indian subsidiaries to promote the brand and trademarks
will be taxable in India. It also upheld the usage of the Bright Line test, which uses the expenses incurred by
comparable companies to decide arm’s-length pricing. The ruling came on an appeal by LG Electronics, but 14
other Indian arms of TNCs also argued as “interveners” against a decision of a transfer pricing officer. Pepsi Foods,
Maruti Suzuki, Glaxosmithkline, Goodyear India, Bausch & Lomb, Amadeus, Canon, Fujifilm, Star India, Sony, Haier
Telecom, Haier Appliances, LVMH Watch and Jewellery, and Daikin Industries also faced transfer pricing adjustments
on excessive advertising, marketing and promotional expense.b
Source: UNCTAD.
Note: Notes appear at the end of this chapter.
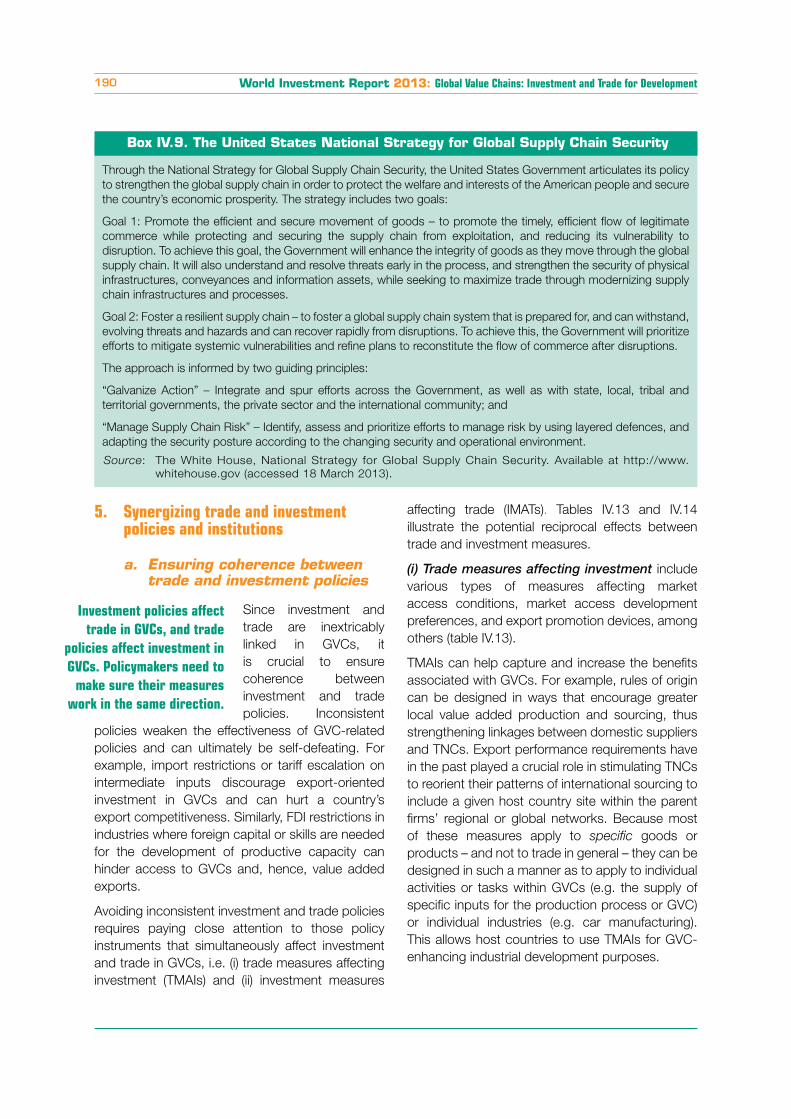
World Investment Report 2013: Global Value Chains: Investment and Trade for Development190
Box IV.9. The United States National Strategy for Global Supply Chain Security
Through the National Strategy for Global Supply Chain Security, the United States Government articulates its policy
to strengthen the global supply chain in order to protect the welfare and interests of the American people and secure
the country’s economic prosperity. The strategy includes two goals:
Goal 1: Promote the efficient and secure movement of goods – to promote the timely, efficient flow of legitimate
commerce while protecting and securing the supply chain from exploitation, and reducing its vulnerability to
disruption. To achieve this goal, the Government will enhance the integrity of goods as they move through the global
supply chain. It will also understand and resolve threats early in the process, and strengthen the security of physical
infrastructures, conveyances and information assets, while seeking to maximize trade through modernizing supply
chain infrastructures and processes.
Goal 2: Foster a resilient supply chain – to foster a global supply chain system that is prepared for, and can withstand,
evolving threats and hazards and can recover rapidly from disruptions. To achieve this, the Government will prioritize
efforts to mitigate systemic vulnerabilities and refine plans to reconstitute the flow of commerce after disruptions.
The approach is informed by two guiding principles:
“Galvanize Action” – Integrate and spur efforts across the Government, as well as with state, local, tribal and
territorial governments, the private sector and the international community; and
“Manage Supply Chain Risk” – Identify, assess and prioritize efforts to manage risk by using layered defences, and
adapting the security posture according to the changing security and operational environment.
Source: The White House, National Strategy for Global Supply Chain Security. Available at http://www.
whitehouse.gov (accessed 18 March 2013).
5. Synergizing trade and investment policies and institutions
a. Ensuring coherence between trade and investment policies
Since investment and
trade are inextricably
linked in GVCs, it
is crucial to ensure
coherence between
investment and trade
policies. Inconsistent
policies weaken the effectiveness of GVC-related
policies and can ultimately be self-defeating. For
example, import restrictions or tariff escalation on
intermediate inputs discourage export-oriented
investment in GVCs and can hurt a country’s
export competitiveness. Similarly, FDI restrictions in
industries where foreign capital or skills are needed
for the development of productive capacity can
hinder access to GVCs and, hence, value added
exports.
Avoiding inconsistent investment and trade policies
requires paying close attention to those policy
instruments that simultaneously affect investment
and trade in GVCs, i.e. (i) trade measures affecting
investment (TMAIs) and (ii) investment measures
affecting trade (IMATs). Tables IV.13 and IV.14
illustrate the potential reciprocal effects between
trade and investment measures.
(i) Trade measures affecting investment include
various types of measures affecting market
access conditions, market access development
preferences, and export promotion devices, among
others (table IV.13).
TMAIs can help capture and increase the benefits
associated with GVCs. For example, rules of origin
can be designed in ways that encourage greater
local value added production and sourcing, thus
strengthening linkages between domestic suppliers
and TNCs. Export performance requirements have
in the past played a crucial role in stimulating TNCs
to reorient their patterns of international sourcing to
include a given host country site within the parent
firms’ regional or global networks. Because most
of these measures apply to specific goods or
products – and not to trade in general – they can be
designed in such a manner as to apply to individual
activities or tasks within GVCs (e.g. the supply of
specific inputs for the production process or GVC)
or individual industries (e.g. car manufacturing).
This allows host countries to use TMAIs for GVC-
enhancing industrial development purposes.
Investment policies affect
trade in GVCs, and trade
policies affect investment in
GVCs. Policymakers need to
make sure their measures
work in the same direction.
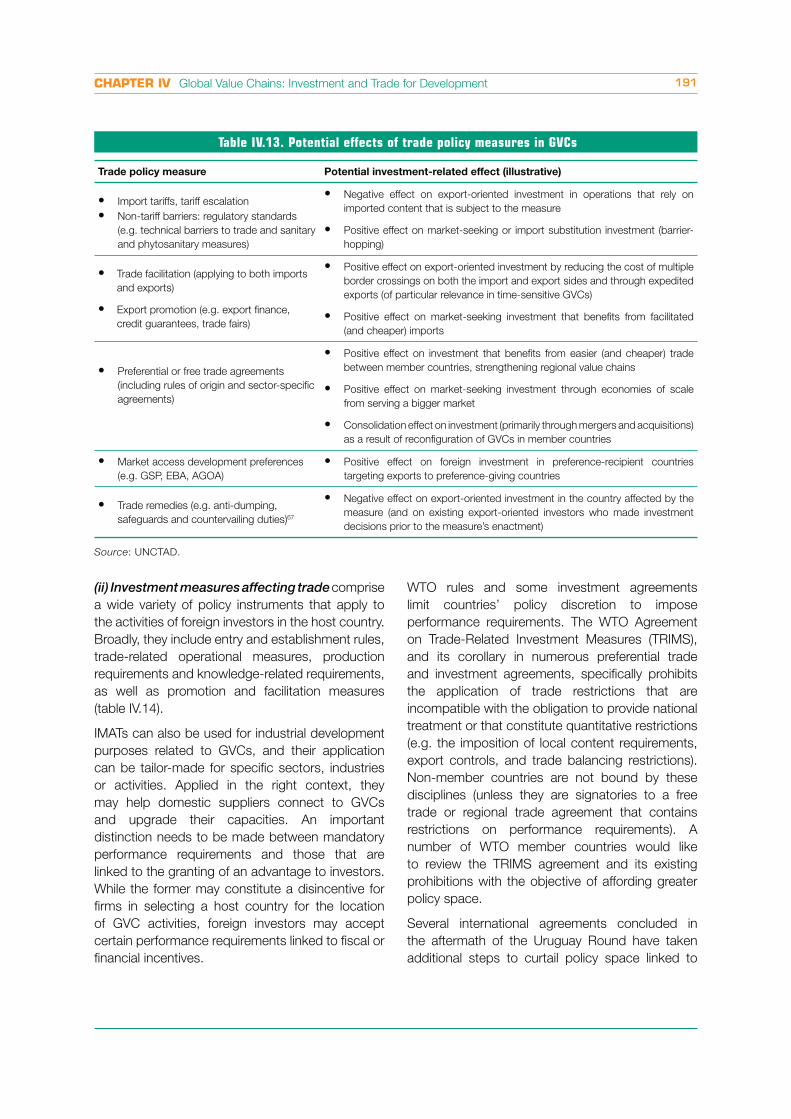
CHAPTER IV Global Value Chains: Investment and Trade for Development 191
Table IV.13. Potential effects of trade policy measures in GVCs
Trade policy measure Potential investment-related effect (illustrative)
Import tariffs, tariff escalation
Non-tariff barriers: regulatory standards
(e.g. technical barriers to trade and sanitary
and phytosanitary measures)
Negative effect on export-oriented investment in operations that rely on
imported content that is subject to the measure
Positive effect on market-seeking or import substitution investment (barrier-
hopping)
Trade facilitation (applying to both imports
and exports)
Export promotion (e.g. export finance,
credit guarantees, trade fairs)
Positive effect on export-oriented investment by reducing the cost of multiple
border crossings on both the import and export sides and through expedited
exports (of particular relevance in time-sensitive GVCs)
Positive effect on market-seeking investment that benefits from facilitated
(and cheaper) imports
Preferential or free trade agreements
(including rules of origin and sector-specific
agreements)
Positive effect on investment that benefits from easier (and cheaper) trade
between member countries, strengthening regional value chains
Positive effect on market-seeking investment through economies of scale
from serving a bigger market
Consolidation effect on investment (primarily through mergers and acquisitions)
as a result of reconfiguration of GVCs in member countries
Market access development preferences
(e.g. GSP, EBA, AGOA)
Positive effect on foreign investment in preference-recipient countries
targeting exports to preference-giving countries
Trade remedies (e.g. anti-dumping,
safeguards and countervailing duties)67
Negative effect on export-oriented investment in the country affected by the
measure (and on existing export-oriented investors who made investment
decisions prior to the measure’s enactment)
Source: UNCTAD.
(ii) Investment measures affecting trade comprise
a wide variety of policy instruments that apply to
the activities of foreign investors in the host country.
Broadly, they include entry and establishment rules,
trade-related operational measures, production
requirements and knowledge-related requirements,
as well as promotion and facilitation measures
(table IV.14).
IMATs can also be used for industrial development
purposes related to GVCs, and their application
can be tailor-made for specific sectors, industries
or activities. Applied in the right context, they
may help domestic suppliers connect to GVCs
and upgrade their capacities. An important
distinction needs to be made between mandatory
performance requirements and those that are
linked to the granting of an advantage to investors.
While the former may constitute a disincentive for
firms in selecting a host country for the location
of GVC activities, foreign investors may accept
certain performance requirements linked to fiscal or
financial incentives.
WTO rules and some investment agreements
limit countries’ policy discretion to impose
performance requirements. The WTO Agreement
on Trade-Related Investment Measures (TRIMS),
and its corollary in numerous preferential trade
and investment agreements, specifically prohibits
the application of trade restrictions that are
incompatible with the obligation to provide national
treatment or that constitute quantitative restrictions
(e.g. the imposition of local content requirements,
export controls, and trade balancing restrictions).
Non-member countries are not bound by these
disciplines (unless they are signatories to a free
trade or regional trade agreement that contains
restrictions on performance requirements). A
number of WTO member countries would like
to review the TRIMS agreement and its existing
prohibitions with the objective of affording greater
policy space.
Several international agreements concluded in
the aftermath of the Uruguay Round have taken
additional steps to curtail policy space linked to
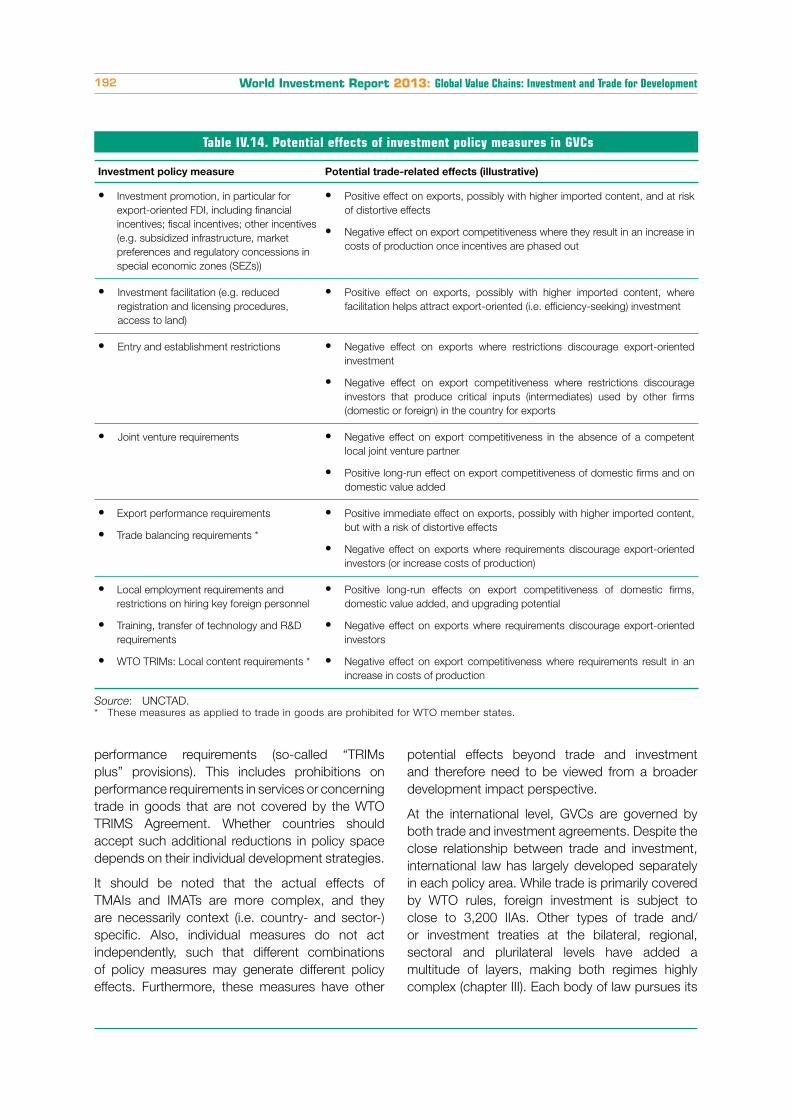
World Investment Report 2013: Global Value Chains: Investment and Trade for Development192
Table IV.14. Potential effects of investment policy measures in GVCs
Investment policy measure Potential trade-related effects (illustrative)
Investment promotion, in particular for
export-oriented FDI, including financial
incentives; fiscal incentives; other incentives
(e.g. subsidized infrastructure, market
preferences and regulatory concessions in
special economic zones (SEZs))
Positive effect on exports, possibly with higher imported content, and at risk
of distortive effects
Negative effect on export competitiveness where they result in an increase in
costs of production once incentives are phased out
Investment facilitation (e.g. reduced
registration and licensing procedures,
access to land)
Positive effect on exports, possibly with higher imported content, where
facilitation helps attract export-oriented (i.e. efficiency-seeking) investment
Entry and establishment restrictions Negative effect on exports where restrictions discourage export-oriented
investment
Negative effect on export competitiveness where restrictions discourage
investors that produce critical inputs (intermediates) used by other firms
(domestic or foreign) in the country for exports
Joint venture requirements Negative effect on export competitiveness in the absence of a competent
local joint venture partner
Positive long-run effect on export competitiveness of domestic firms and on
domestic value added
Export performance requirements
Trade balancing requirements *
Positive immediate effect on exports, possibly with higher imported content,
but with a risk of distortive effects
Negative effect on exports where requirements discourage export-oriented
investors (or increase costs of production)
Local employment requirements and
restrictions on hiring key foreign personnel
Training, transfer of technology and R&D
requirements
WTO TRIMs: Local content requirements *
Positive long-run effects on export competitiveness of domestic firms,
domestic value added, and upgrading potential
Negative effect on exports where requirements discourage export-oriented
investors
Negative effect on export competitiveness where requirements result in an
increase in costs of production
Source: UNCTAD.* These measures as applied to trade in goods are prohibited for WTO member states.
performance requirements (so-called “TRIMs
plus” provisions). This includes prohibitions on
performance requirements in services or concerning
trade in goods that are not covered by the WTO
TRIMS Agreement. Whether countries should
accept such additional reductions in policy space
depends on their individual development strategies.
It should be noted that the actual effects of
TMAIs and IMATs are more complex, and they
are necessarily context (i.e. country- and sector-)
specific. Also, individual measures do not act
independently, such that different combinations
of policy measures may generate different policy
effects. Furthermore, these measures have other
potential effects beyond trade and investment
and therefore need to be viewed from a broader
development impact perspective.
At the international level, GVCs are governed by
both trade and investment agreements. Despite the
close relationship between trade and investment,
international law has largely developed separately
in each policy area. While trade is primarily covered
by WTO rules, foreign investment is subject to
close to 3,200 IIAs. Other types of trade and/
or investment treaties at the bilateral, regional,
sectoral and plurilateral levels have added a
multitude of layers, making both regimes highly
complex (chapter III). Each body of law pursues its
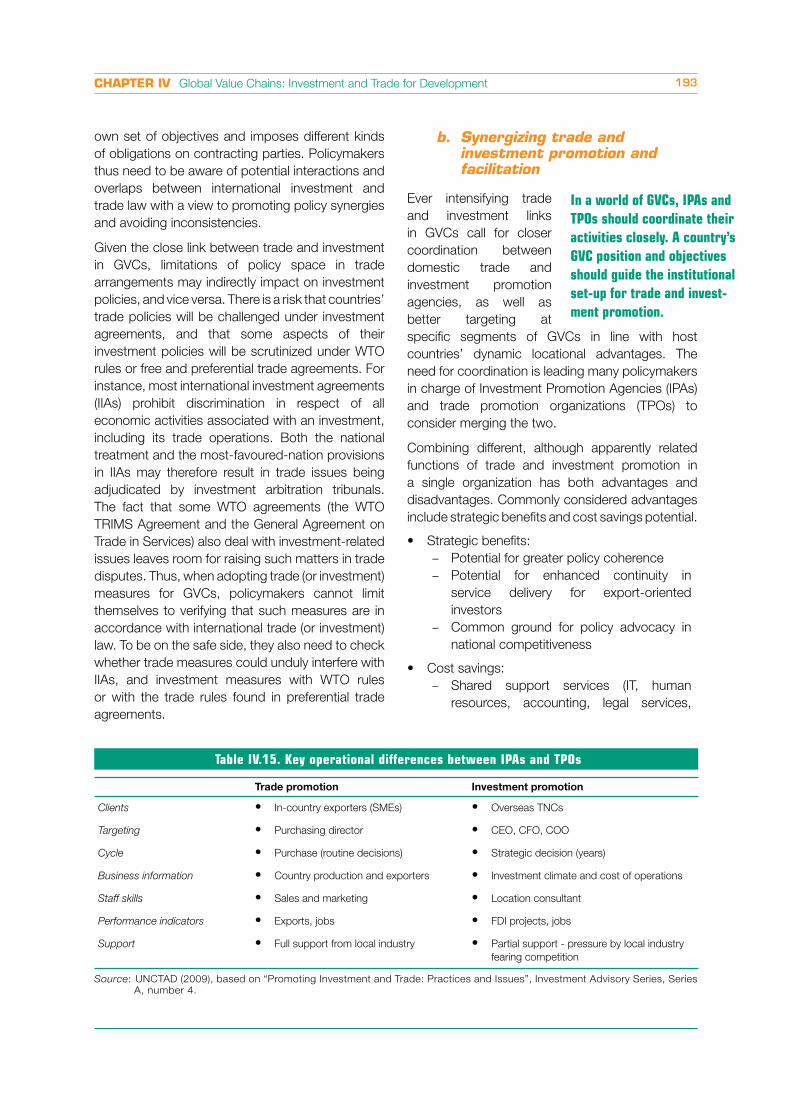
CHAPTER IV Global Value Chains: Investment and Trade for Development 193
own set of objectives and imposes different kinds
of obligations on contracting parties. Policymakers
thus need to be aware of potential interactions and
overlaps between international investment and
trade law with a view to promoting policy synergies
and avoiding inconsistencies.
Given the close link between trade and investment
in GVCs, limitations of policy space in trade
arrangements may indirectly impact on investment
policies, and vice versa. There is a risk that countries’
trade policies will be challenged under investment
agreements, and that some aspects of their
investment policies will be scrutinized under WTO
rules or free and preferential trade agreements. For
instance, most international investment agreements
(IIAs) prohibit discrimination in respect of all
economic activities associated with an investment,
including its trade operations. Both the national
treatment and the most-favoured-nation provisions
in IIAs may therefore result in trade issues being
adjudicated by investment arbitration tribunals.
The fact that some WTO agreements (the WTO
TRIMS Agreement and the General Agreement on
Trade in Services) also deal with investment-related
issues leaves room for raising such matters in trade
disputes. Thus, when adopting trade (or investment)
measures for GVCs, policymakers cannot limit
themselves to verifying that such measures are in
accordance with international trade (or investment)
law. To be on the safe side, they also need to check
whether trade measures could unduly interfere with
IIAs, and investment measures with WTO rules
or with the trade rules found in preferential trade
agreements.
b. Synergizing trade and investment promotion and facilitation
Ever intensifying trade
and investment links
in GVCs call for closer
coordination between
domestic trade and
investment promotion
agencies, as well as
better targeting at
specific segments of GVCs in line with host
countries’ dynamic locational advantages. The
need for coordination is leading many policymakers
in charge of Investment Promotion Agencies (IPAs)
and trade promotion organizations (TPOs) to
consider merging the two.
Combining different, although apparently related
functions of trade and investment promotion in
a single organization has both advantages and
disadvantages. Commonly considered advantages
include strategic benefits and cost savings potential.
Strategic benefits:
– Potential for greater policy coherence
– Potential for enhanced continuity in
service delivery for export-oriented
investors
– Common ground for policy advocacy in
national competitiveness
Cost savings:
– Shared support services (IT, human
resources, accounting, legal services,
In a world of GVCs, IPAs and
TPOs should coordinate their
activities closely. A country’s
GVC position and objectives
should guide the institutional
set-up for trade and invest-
ment promotion.
Table IV.15. Key operational differences between IPAs and TPOs
Trade promotion Investment promotion
Clients In-country exporters (SMEs) Overseas TNCs
Targeting Purchasing director CEO, CFO, COO
Cycle Purchase (routine decisions) Strategic decision (years)
Business information Country production and exporters Investment climate and cost of operations
Staff skills Sales and marketing Location consultant
Performance indicators Exports, jobs FDI projects, jobs
Support Full support from local industry Partial support - pressure by local industry
fearing competition
Source: UNCTAD (2009), based on “Promoting Investment and Trade: Practices and Issues”, Investment Advisory Series, Series
A, number 4.
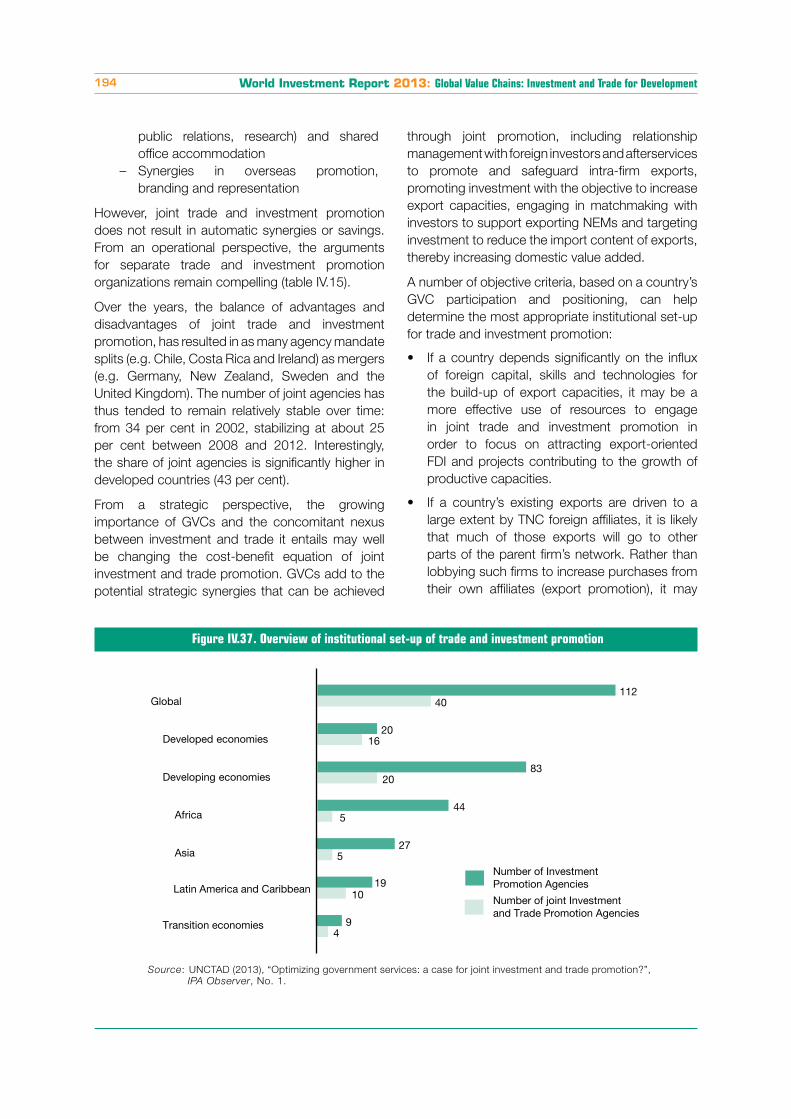
World Investment Report 2013: Global Value Chains: Investment and Trade for Development194
public relations, research) and shared
office accommodation
– Synergies in overseas promotion,
branding and representation
However, joint trade and investment promotion
does not result in automatic synergies or savings.
From an operational perspective, the arguments
for separate trade and investment promotion
organizations remain compelling (table IV.15).
Over the years, the balance of advantages and
disadvantages of joint trade and investment
promotion, has resulted in as many agency mandate
splits (e.g. Chile, Costa Rica and Ireland) as mergers
(e.g. Germany, New Zealand, Sweden and the
United Kingdom). The number of joint agencies has
thus tended to remain relatively stable over time:
from 34 per cent in 2002, stabilizing at about 25
per cent between 2008 and 2012. Interestingly,
the share of joint agencies is significantly higher in
developed countries (43 per cent).
From a strategic perspective, the growing
importance of GVCs and the concomitant nexus
between investment and trade it entails may well
be changing the cost-benefit equation of joint
investment and trade promotion. GVCs add to the
potential strategic synergies that can be achieved
through joint promotion, including relationship
management with foreign investors and afterservices
to promote and safeguard intra-firm exports,
promoting investment with the objective to increase
export capacities, engaging in matchmaking with
investors to support exporting NEMs and targeting
investment to reduce the import content of exports,
thereby increasing domestic value added.
A number of objective criteria, based on a country’s
GVC participation and positioning, can help
determine the most appropriate institutional set-up
for trade and investment promotion:
If a country depends significantly on the influx
of foreign capital, skills and technologies for
the build-up of export capacities, it may be a
more effective use of resources to engage
in joint trade and investment promotion in
order to focus on attracting export-oriented
FDI and projects contributing to the growth of
productive capacities.
If a country’s existing exports are driven to a
large extent by TNC foreign affiliates, it is likely
that much of those exports will go to other
parts of the parent firm’s network. Rather than
lobbying such firms to increase purchases from
their own affiliates (export promotion), it may
Figure IV.37. Overview of institutional set-up of trade and investment promotion
Transition economies
Latin America and Caribbean
Asia
Africa
Developing economies
Developed economies
Global
Number of Investment Promotion Agencies
Number of joint Investment and Trade Promotion Agencies
4
10
5
5
20
16
40
9
27
44
83
20
112
19
Source: UNCTAD (2013), “Optimizing government services: a case for joint investment and trade promotion?”,
IPA Observer, No. 1.
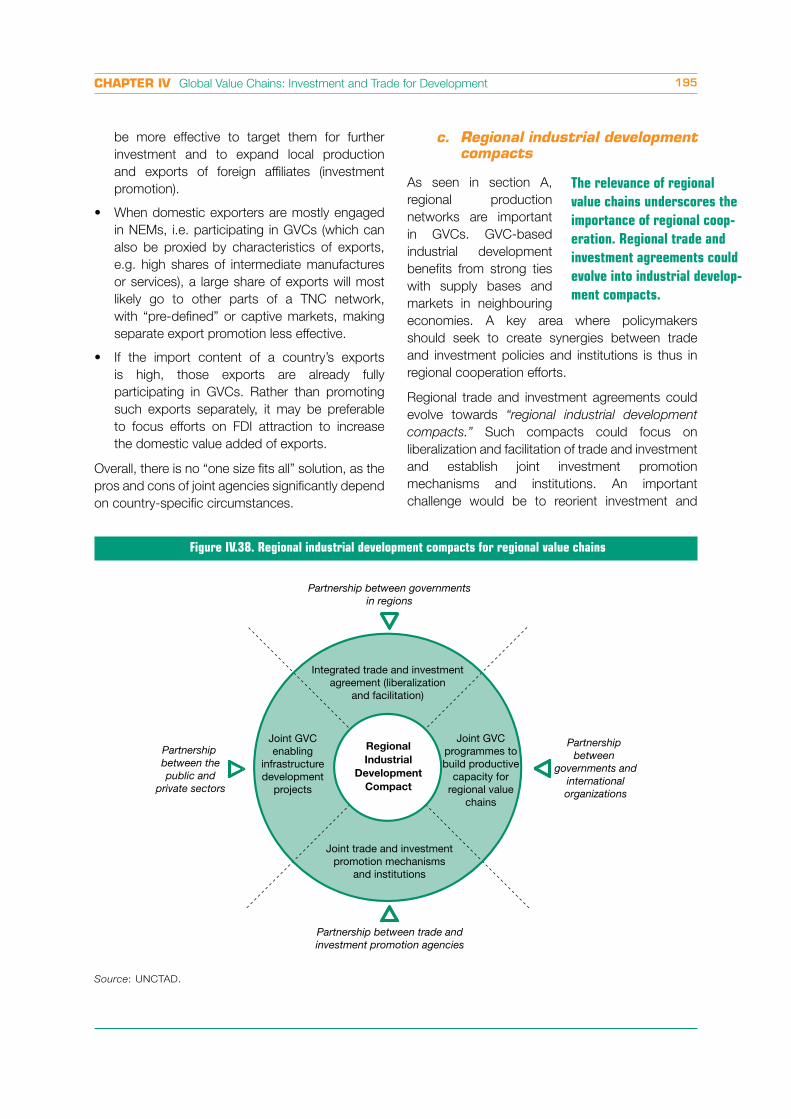
CHAPTER IV Global Value Chains: Investment and Trade for Development 195
Figure IV.38. Regional industrial development compacts for regional value chains
Source: UNCTAD.
Regional Industrial
Development Compact
Partnership between governmentsin regions
Partnership between thepublic and
private sectors
Partnership between
governments andinternationalorganizations
Partnership between trade andinvestment promotion agencies
Integrated trade and investmentagreement (liberalization
and facilitation)
Joint trade and investmentpromotion mechanisms
and institutions
Joint GVCenabling
infrastructuredevelopment
projects
Joint GVCprogrammes tobuild productive
capacity forregional value
chains
be more effective to target them for further
investment and to expand local production
and exports of foreign affiliates (investment
promotion).
When domestic exporters are mostly engaged
in NEMs, i.e. participating in GVCs (which can
also be proxied by characteristics of exports,
e.g. high shares of intermediate manufactures
or services), a large share of exports will most
likely go to other parts of a TNC network,
with “pre-defined” or captive markets, making
separate export promotion less effective.
If the import content of a country’s exports
is high, those exports are already fully
participating in GVCs. Rather than promoting
such exports separately, it may be preferable
to focus efforts on FDI attraction to increase
the domestic value added of exports.
Overall, there is no “one size fits all” solution, as the
pros and cons of joint agencies significantly depend
on country-specific circumstances.
c. Regional industrial development compacts
As seen in section A,
regional production
networks are important
in GVCs. GVC-based
industrial development
benefits from strong ties
with supply bases and
markets in neighbouring
economies. A key area where policymakers
should seek to create synergies between trade
and investment policies and institutions is thus in
regional cooperation efforts.
Regional trade and investment agreements could
evolve towards “regional industrial development
compacts.” Such compacts could focus on
liberalization and facilitation of trade and investment
and establish joint investment promotion
mechanisms and institutions. An important
challenge would be to reorient investment and
The relevance of regional
value chains underscores the
importance of regional coop-
eration. Regional trade and
investment agreements could
evolve into industrial develop-
ment compacts.
World Investment Report 2013: Global Value Chains: Investment and Trade for Development196
Concluding remarks: GVC policy development – towards a sound strategic framework
This chapter has shown
that GVCs are now a
pervasive phenomenon in
the global economy. Most
countries are increasingly
participating in GVCs, to
different degrees and at
various stages and levels in
the chains.
GVCs and patterns of value added trade are shaped
to a significant extent by TNCs – from mining
TNCs to manufacturing or retail TNCs. Successful
participation in GVCs for countries thus often hinges
on the extent to which they can attract investment
or the extent to which local firms manage to interact
with TNC lead firms.
GVCs can bring a number of economic development
benefits. They lead to direct economic impacts,
in terms of value added, employment, income
and exports. They can also contribute to longer-
term economic development through technology
and skills dissemination and industrial upgrading.
However, none of these benefits are automatic,
and countries can remain stuck in low-value
activities, unable to upgrade and capture more
value for economic development. In addition,
GVC participation can exert negative social and
GVC policy development
should begin with the
strategic positioning of
countries along GVCs, based
on an assessment of the
current position in GVCs and
opportunities for growth.
environmental effects, including on wages and
working conditions, on safety and health issues
for workers, on the community, on emissions and
others.
An important question facing policymakers is
whether or not to actively promote GVC participation
and adopt a GVC-led development strategy. For
many countries, however, the question is less
whether to promote GVC participation, but rather
how to gain access to GVCs, maximize the benefits
from participation, minimize the risks and upgrade
in GVCs.
The policy section of this chapter has set out the
main policy challenges stemming from the rise of
GVCs and outlined a new GVC-based approach
to industrial development policies with new roles
for trade and investment policies. Key elements
of the approach – the GVC Policy Framework –
include (i) embedding GVCs in a country’s overall
development strategy, (ii) enabling participation in
GVCs, (iii) building domestic productive capacity,
(iv) providing a strong environmental, social and
governance framework, and (v) synergizing trade
and investment policies and institutions.
The starting point for strategy development is
a clear understanding of the starting premise.
Policymakers designing a GVC development
export promotion strategies from a focus on
isolated activities as suppliers of GVCs to the needs
of emerging regional markets.
Regional industrial development compacts could
include in their scope all policy areas important
for enabling GVC development, such as the
harmonization, mutual recognition or approximation
of regulatory standards and the consolidation of
private standards on environmental, social and
governance issues. And they could take steps in
crucial policy areas such as the free movement of
workers (the issue of migration and visas is crucial
in value chains, which require people to be able to
travel easily between countries to visit suppliers
or work for periods in local operations to provide
technical assistance) and services liberalization
(particularly logistics and transportation), as regional
value chains require intensified regional cooperation
on a wider front.
Regional industrial development compacts could
aim to create cross-border industrial clusters through
joint investments in GVC-enabling infrastructure
and productive capacity building. Establishing such
compacts implies working in partnership, between
governments of the region to harmonize trade
and investment regulations, between investment
and trade promotion agencies for joint promotion
efforts, between governments and international
organizations for technical assistance and capacity-
building, and between the public and private sector
for investment in regional value chain infrastructure
and productive capacity (figure IV.38).
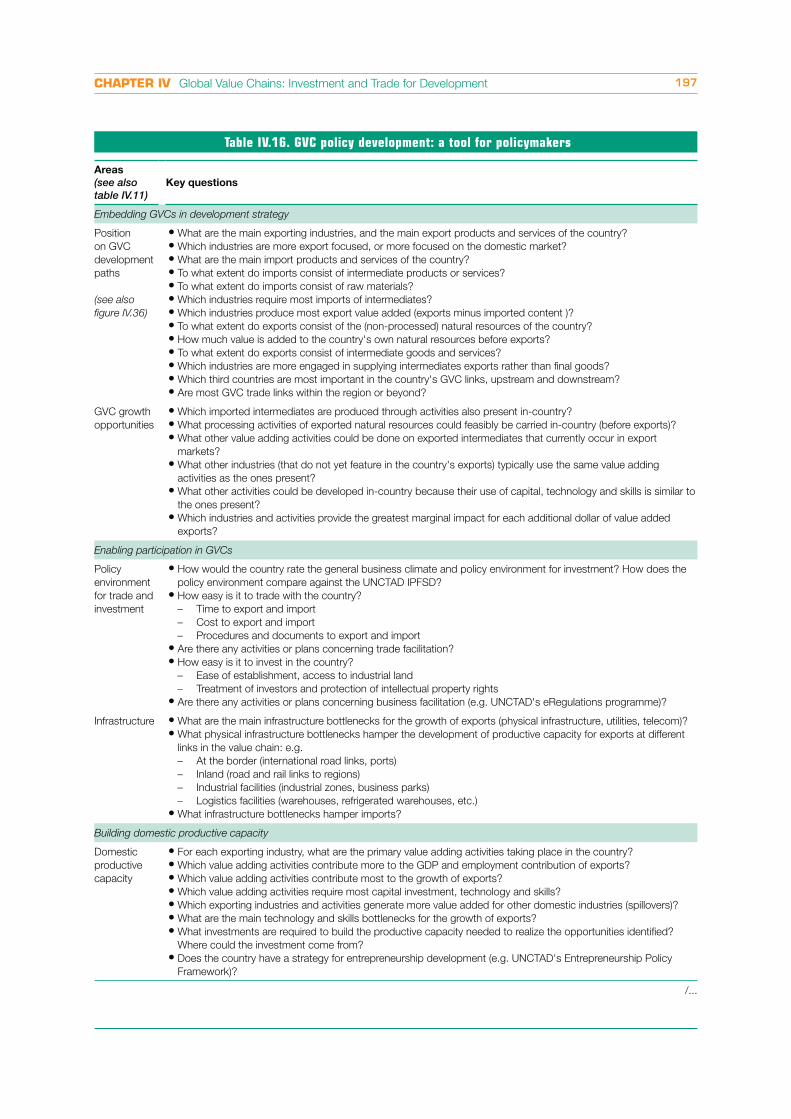
CHAPTER IV Global Value Chains: Investment and Trade for Development 197
Table IV.16. GVC policy development: a tool for policymakers
Areas
(see also table IV.11)
Key questions
Embedding GVCs in development strategy
Position
on GVC
development
paths
(see also
figure IV.36)
What are the main exporting industries, and the main export products and services of the country?
Which industries are more export focused, or more focused on the domestic market?
What are the main import products and services of the country?
To what extent do imports consist of intermediate products or services?
To what extent do imports consist of raw materials?
Which industries require most imports of intermediates?
Which industries produce most export value added (exports minus imported content )?
To what extent do exports consist of the (non-processed) natural resources of the country?
How much value is added to the country's own natural resources before exports?
To what extent do exports consist of intermediate goods and services?
Which industries are more engaged in supplying intermediates exports rather than final goods?
Which third countries are most important in the country's GVC links, upstream and downstream?
Are most GVC trade links within the region or beyond?
GVC growth
opportunities
Which imported intermediates are produced through activities also present in-country?
What processing activities of exported natural resources could feasibly be carried in-country (before exports)?
What other value adding activities could be done on exported intermediates that currently occur in export
markets?
What other industries (that do not yet feature in the country's exports) typically use the same value adding
activities as the ones present?
What other activities could be developed in-country because their use of capital, technology and skills is similar to
the ones present?
Which industries and activities provide the greatest marginal impact for each additional dollar of value added
exports?
Enabling participation in GVCs
Policy
environment
for trade and
investment
How would the country rate the general business climate and policy environment for investment? How does the
policy environment compare against the UNCTAD IPFSD?
How easy is it to trade with the country?
– Time to export and import
– Cost to export and import
– Procedures and documents to export and import
Are there any activities or plans concerning trade facilitation?
How easy is it to invest in the country?
– Ease of establishment, access to industrial land
– Treatment of investors and protection of intellectual property rights
Are there any activities or plans concerning business facilitation (e.g. UNCTAD's eRegulations programme)?
Infrastructure What are the main infrastructure bottlenecks for the growth of exports (physical infrastructure, utilities, telecom)?
What physical infrastructure bottlenecks hamper the development of productive capacity for exports at different
links in the value chain: e.g.
– At the border (international road links, ports)
– Inland (road and rail links to regions)
– Industrial facilities (industrial zones, business parks)
– Logistics facilities (warehouses, refrigerated warehouses, etc.)
What infrastructure bottlenecks hamper imports?
Building domestic productive capacity
Domestic
productive
capacity
For each exporting industry, what are the primary value adding activities taking place in the country?
Which value adding activities contribute more to the GDP and employment contribution of exports?
Which value adding activities contribute most to the growth of exports?
Which value adding activities require most capital investment, technology and skills?
Which exporting industries and activities generate more value added for other domestic industries (spillovers)?
What are the main technology and skills bottlenecks for the growth of exports?
What investments are required to build the productive capacity needed to realize the opportunities identified?
Where could the investment come from?
Does the country have a strategy for entrepreneurship development (e.g. UNCTAD's Entrepreneurship Policy
Framework)?
/...
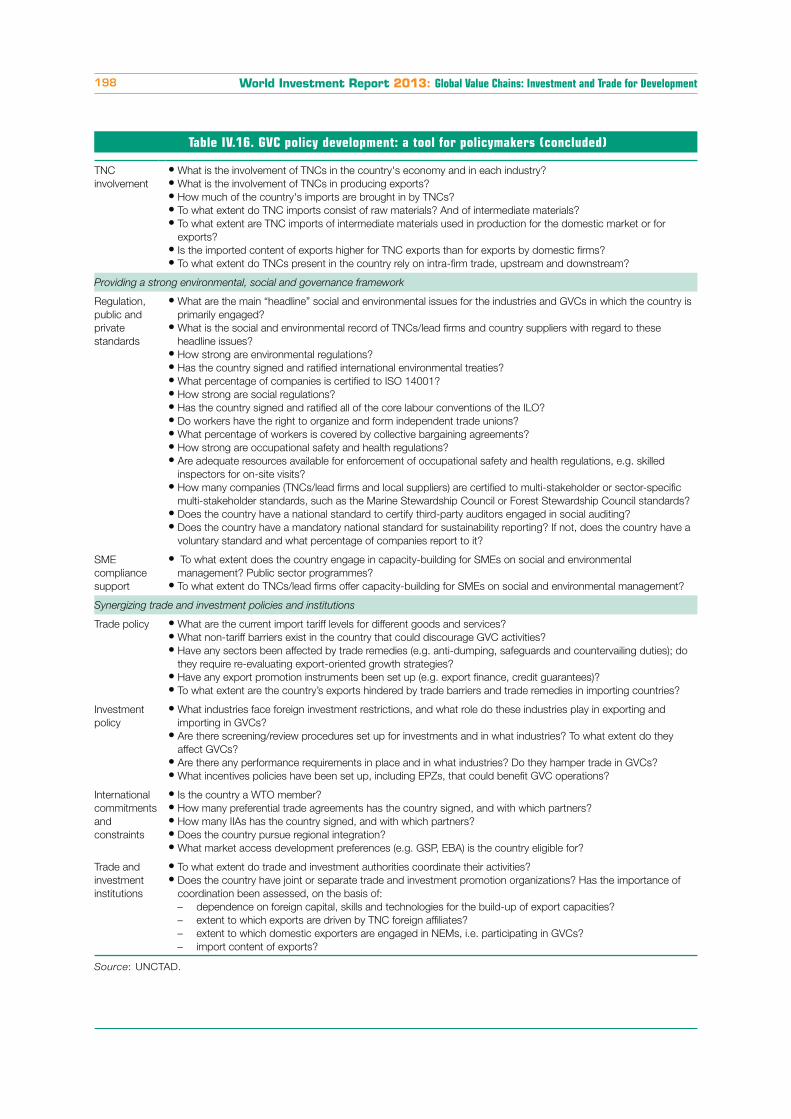
World Investment Report 2013: Global Value Chains: Investment and Trade for Development198
Table IV.16. GVC policy development: a tool for policymakers (concluded)
TNC
involvement
What is the involvement of TNCs in the country's economy and in each industry?
What is the involvement of TNCs in producing exports?
How much of the country's imports are brought in by TNCs?
To what extent do TNC imports consist of raw materials? And of intermediate materials?
To what extent are TNC imports of intermediate materials used in production for the domestic market or for
exports?
Is the imported content of exports higher for TNC exports than for exports by domestic firms?
To what extent do TNCs present in the country rely on intra-firm trade, upstream and downstream?
Providing a strong environmental, social and governance framework
Regulation,
public and
private
standards
What are the main “headline” social and environmental issues for the industries and GVCs in which the country is
primarily engaged?
What is the social and environmental record of TNCs/lead firms and country suppliers with regard to these
headline issues?
How strong are environmental regulations?
Has the country signed and ratified international environmental treaties?
What percentage of companies is certified to ISO 14001?
How strong are social regulations?
Has the country signed and ratified all of the core labour conventions of the ILO?
Do workers have the right to organize and form independent trade unions?
What percentage of workers is covered by collective bargaining agreements?
How strong are occupational safety and health regulations?
Are adequate resources available for enforcement of occupational safety and health regulations, e.g. skilled
inspectors for on-site visits?
How many companies (TNCs/lead firms and local suppliers) are certified to multi-stakeholder or sector-specific
multi-stakeholder standards, such as the Marine Stewardship Council or Forest Stewardship Council standards?
Does the country have a national standard to certify third-party auditors engaged in social auditing?
Does the country have a mandatory national standard for sustainability reporting? If not, does the country have a
voluntary standard and what percentage of companies report to it?
SME
compliance
support
To what extent does the country engage in capacity-building for SMEs on social and environmental
management? Public sector programmes?
To what extent do TNCs/lead firms offer capacity-building for SMEs on social and environmental management?
Synergizing trade and investment policies and institutions
Trade policy What are the current import tariff levels for different goods and services?
What non-tariff barriers exist in the country that could discourage GVC activities?
Have any sectors been affected by trade remedies (e.g. anti-dumping, safeguards and countervailing duties); do
they require re-evaluating export-oriented growth strategies?
Have any export promotion instruments been set up (e.g. export finance, credit guarantees)?
To what extent are the country’s exports hindered by trade barriers and trade remedies in importing countries?
Investment
policy
What industries face foreign investment restrictions, and what role do these industries play in exporting and
importing in GVCs?
Are there screening/review procedures set up for investments and in what industries? To what extent do they
affect GVCs?
Are there any performance requirements in place and in what industries? Do they hamper trade in GVCs?
What incentives policies have been set up, including EPZs, that could benefit GVC operations?
International
commitments
and
constraints
Is the country a WTO member?
How many preferential trade agreements has the country signed, and with which partners?
How many IIAs has the country signed, and with which partners?
Does the country pursue regional integration?
What market access development preferences (e.g. GSP, EBA) is the country eligible for?
Trade and
investment
institutions
To what extent do trade and investment authorities coordinate their activities?
Does the country have joint or separate trade and investment promotion organizations? Has the importance of
coordination been assessed, on the basis of:
– dependence on foreign capital, skills and technologies for the build-up of export capacities?
– extent to which exports are driven by TNC foreign affiliates?
– extent to which domestic exporters are engaged in NEMs, i.e. participating in GVCs?
– import content of exports?
Source: UNCTAD.
CHAPTER IV Global Value Chains: Investment and Trade for Development 199
strategy should have the clearest possible picture
of where their economy stands in relation to each of
the elements of the GVC Policy Framework outlined
in this chapter, to inform their strategic positioning
based on factor endowments, dynamic capabilities
and broader development vision.
Table IV.16 provides a tool to help policymakers
assess their economy’s current positioning in
GVCs, the opportunities for growth, the strengths
and weaknesses in enabling factors and productive
capabilities for GVC participation, the social,
environmental and governance framework, and
the trade and investment policy context. The
table does so by asking a series of questions, the
answers to which should paint a clearer picture of
Notes
GVC strengths, weaknesses, opportunities and
threats. Some questions can be answered through
empirical metrics, others can only be answered
in a qualitative manner. The list is by no means
exhaustive; it is meant only to guide the assessment
process.
The tool can be read in concomitance with the earlier
figure IV.36, which plots a GVC development path
along the axes of increasing levels of technological
sophistication on the one hand, and increasing
levels of GVC participation and value creation on
the other. Policymakers should aim to determine
where their economy stands, where it can go and
how it can get there.
1 In reality the GVC structure is not necessarily characterized
by a linear sequencing of value added activities (“snake”
configuration): it can be structured around one or more
assembly hubs with parts entering from different production
sites (“spider” configuration). However, this difference, while
important from a conceptual perspective, does not affect the
analytical treatment of value added data and double counting
effects. See Baldwin, R. and A. Venables (2010) “Spiders and
snakes: offshoring and agglomeration in the global economy”,
NBER Working Papers, No. 16611, National Bureau of
Economic Research, Inc.2 The Eora project, originally funded by the Australian Research
Council, based at the University of Sydney and comprising
an international team of researchers, developed the so-called
“world multi-region input-output database” that is the basis for
the generation of the value added trade estimates in the GVC
Database discussed in this chapter. For details, see http://
www.worldmrio.com/. 3 The UNCTAD-Eora GVC Database was launched earlier in
2013 in a WIR13 Preview Report available at http://unctad.org/
en/PublicationsLibrary/diae2013d1_en.pdf.4 Equating foreign value added with the double counting
in global trade figures is a simplification. Some further
double counting takes place within domestic value added,
as exported value added can re-enter countries to be
incorporated in further exports, and so forth. Such circular
double counting can be significant in some countries and
some industries, but is marginal in most. 5 These findings are consistent across all countries surveyed by
the economic analysis over the recent years. See Bernard, A.
B. et al. (2007) “Firms in International Trade”, NBER Working
Papers No. 13054, NBER, Inc. Also see Ottaviano, G. and T.
Mayer (2007) “Happy few: the internationalisation of European
firms. New facts based on firm-level evidence”. Open Access
publications from Sciences Po, hdl: 2441/10147, Sciences Po.6 FDI stock in services is still more than 35 per cent of the total
if only non-financial sector FDI is considered (although financial
sector FDI is not only a value chain in its own right but also
provides crucial services to other GVCs).7 See Cooke, J. A. (2010) “From bean to cup: How Starbucks
transformed its supply chain”, Supply Chain Quarterly, Quarter
4.
8 Gereffi, G., J. Humphrey and T. Sturgeon (2005) “The
governance of global value chains”, Review of International
Political Economy, 12: 78-104.9 Horizontal diversification of a segment or subsegment of a
value chain is also important but less well covered in the GVC
literature. In the case of FDI, this commonly involves affiliates
that replicate TNC segments in host economies (with no or
little cross-segment vertical linkages), e.g. in manufacturing,
extractive or services operations aimed at equivalent markets
in host countries. Horizontal diversification can also be
considered to apply to host country operations by lead TNCs
which are essentially NEMs to other organizations.10 Ivarsson, I. and C. G. Alvstam (2010) “Supplier Upgrading in
the Home-furnishing Value Chain: An Empirical Study of IKEA’s
Sourcing in China and South East Asia”, World Development,
38: 1575-87.11 Bair, J. and Gereffi, G. (2002) “NAFTA and the Apparel
Commodity Chain: Corporate Strategies, Interfirm Networks,
and Industrial Upgrading”, in G. Gereffi, D. Spener, and J.
Bair (eds.), Free Trade and Uneven Development: The North
American Apparel Industry after NAFTA. (Philadelphia, Temple
University Press: 23–50.)12 An Inter-Agency Working Group coordinated by UNCTAD
supported the G-20 in developing key indicators for
measuring and maximizing the economic and employment
impact of private sector investment in value chains. Key
indicators comprise (i) economic value added (with value
added and gross fixed capital formation, exports, number
of business entities, fiscal revenues), (ii) job creation (total
employment, employment by category, wages), and (iii)
sustainable development (social impact, environmental
impact, development impact). For a full presentation, visit
http://unctad.org/en/Pages/DIAE/G-20/measuring-impact-of-
investment.aspx. 13 Variation in backward linkages was also highlighted in a recent
study of 809 TNC affiliates across Eastern Europe (Croatia,
Slovenia, Poland, Romania and the former East Germany) in
manufacturing industries. About 48 per cent of inputs were
bought from domestic suppliers (both foreign and locally
owned). The highest share was found in East Germany and
the lowest for Romania. The share of local suppliers was
highest (55 per cent) in the medium- to low-tech industries.
World Investment Report 2013: Global Value Chains: Investment and Trade for Development200
See Giroud, A., B. Jindra and P. Marek (2012) “Heterogeneous
FDI in Transition Economies - A Novel Approach to Assess
the Developmental Impact of Backward Linkages”, World
Development, 40:2206. 14 Rugraff, E. (2010) “Foreign direct investment and supplier-
oriented upgrading in the Czech motor vehicle industry”,
Regional Studies, 44. This study showed that Czech-owned
companies represent half of 173 first-tier suppliers in the
automotive industry but account for only one fifth of the
employees. Also see UNCTAD (2010) “Integrating Developing
Countries’ SMEs into Global Value Chains”. It contains the
example of the Colombian automobile industry, where 60 per
cent of value added originates from car assembly which is
performed by lead firms (TNC-led). By contrast, SMEs only
account for less than 40 per cent of the total value.15 Dedrick, J., K. L. Kraemer and G. Linden (2009) “Who profits
from innovation in global value chains? A study of the iPod
and notebook PCs”, Industrial and Corporate Change, 19:81-
116. The authors apply a product-level approach to identify
the financial value embedded in products and show how it
is distributed across multiple participants in the supply chain
across borders, from design and branding to component
manufacturing to assembly to distribution and sales.16 For evidence on and examples of linkages in sub-Saharan
Africa, see Morris, M., et al. (2012). “One thing leads to
another – Commodities, linkages and industrial development”,
Resources Policy, 37:408-16.17 See UNCTAD 1999. Transfer Pricing: UNCTAD Series on
Issues in International Investment Agreements. Geneva and
New York. United Nations.18 Gourevitch, P., R. Bohn, and D. McKendrick (1997) Who
Is Us?: the Nationality of Production in the Hard Disk Drive
Industry, Report 97-01. La Jolla, CA: The Information Storage
Industry Center, University of California. Available at http://isic.
ucsd.edu/papers/whoisus.shtml.19 Tejani, S. (2011) “The gender dimension of special economic
zones”, in Special Economic Zones: Progress, Emerging
Challenges, and Future Directions. Washington D.C: The
World Bank; Braunstein, E. (2012) “Neoliberal Development
Macroeconomics. A Consideration of its Gendered
Employment Effects”, UNRISD Research Paper 2012–1,
Geneva: United Nations; Staritz, C. and J. G. Reis (2013)
Global Value Chains, Economic Upgrading, and Gender.
Case Studies of the horticulture, Tourism and Call Center
Industries. Washington, D.C.: The World Bank.; Tejani, S. and
W. Milberg (2010) Global defeminization? Industrial upgrading,
occupational segmentation and manufacturing employment
in Middle-Income countries. New York: Schwartz Centre for
Economic Policy Analysis; Aguayo-Tellez, E. (2011) The Impact
of Trade Liberalization Policies and FDI on Gender Inequality: A
Literature Review. Washington, D.C.: World Bank.20 The few cross-country and cross-industry studies available in
this area highlight notable differences in impact and find that
(i) employment growth is not linked with comparable growth in
real wages, and even in some case it is linked to declines in
wages; (ii) upgrading in terms of real wages varies by country.
Downgrading in terms of real wages is not uncommon.
See, e.g., Milberg, W. and D. Winkler (2013) Outsourcing
Economics: Global Value Chains in Capitalist Development.
New York: Cambridge University Press; and Bernhardt, T. and
W. Milberg (2011) “Does economic upgrading generate social
upgrading? Insights from the Horticulture, Apparel, Mobile
Phones and Tourism Sectors”, Capturing the Gains Working
Paper, No. 2011/07.21 This is illustrated by the example of Chile’s National Labour
Skills Certification System. See Fernandez-Stark, K., S.
Frederick and G. Gereffi (2011) “The apparel global value
chain: economic upgrading and workforce development”,
Center on Globalization, Governance & Competitiveness, Duke
University, November 2011.22 As an example, in Costa Rica, the Instituto Nacional de
Aprendizaje offered 25,000 scholarships in 2007 for English-
language training, while the Asociación Costarricense de
Profesionales de Turismo provides members with access to
Mandarin Chinese, French and Italian classes. See Christian,
M., K. Fernandez-Stark, G. Ahmed and G. Gereffi (2011)
“The Tourism Global Value Chain: Economic Upgrading and
Workforce Development”, in Skills for Upgrading: Workforce
Development and Global Value Chains in Developing
Countries, Durham: Duke University, Center on Globalization,
Governance and Competitiveness.23 Bair, J. and G. Gereffi (2003) “Upgrading, uneven development,
and jobs in the North American apparel industry”, Global
Networks, 3:143–69; Barrientos, S., G. Gereffi and A. Rossi
(2012) “Economic and social upgrading in global production
networks: A new paradigm for a changing world”, International
Labour Review, 150:319-40. See also Barrientos, S., G.
Gereffi and A. Rossi (2011) “Labour Chains: Analysing the
Role of Labour Contractors in Global Production Networks”,
International Labour Review, Volume 150, Issue 3-4, pages
319–340, December 2011.24 Henderson, J., P. Dicken, M. Hess, N. Coe and H. W. Yeung
(2002) “Global production networks and the analysis of
economic development”, Review of International Political
Economy, 9:436-64; also Rugraff (ibid.).25 Trade in intermediate goods is more volatile than trade
in either capital or consumption goods, suggesting that
recessions and economic crises affect material, parts and
component shipments more than final goods (see Sturgeon, T.
J. and O. Memedovic (2011) “Mapping Global Value Chains:
Intermediate Goods Trade and Structural Change in the
World Economy”. Vienna: UNIDO). With regard to the effect
of economic crises, in the clothing industry, as a result of the
2008 crisis it is estimated that millions of jobs were lost globally
because of slower demand in Europe and the United States.
The number of job losses amounted to between 11 and 15
million in the first quarter of 2010, with the highest losses
experienced in China (10 million), India (1 million), Pakistan
(200,000), Indonesia (100,000), Mexico (80,000), Cambodia
(75,000) and Viet Nam (30,000). See Staritz, C. (2011) “Making
the Cut? Low-Income Countries and the Global Clothing Value
Chain in a Post-Quota and Post-Crisis World”. Washington, D.
C.: The World Bank.26 Arnold, C. E. (2010) “Where the Low Road and the High Road
Meet: Flexible Employment in Global Value Chains”, Journal
of Contemporary Asia, 40:612. The study notes that larger
producers use sub-contractors to mediate the instability of
international contracts, passing on uncertainty to smaller firms
and their workforces.27 Haakonsson, S. J. (2009) “Learning by importing in global
value chains: upgrading and South-South strategies in the
Ugandan pharmaceutical industry”, Development Southern
Africa, 26:499-516.28 Gereffi, G. and O. Memedovic (2003) “The Global Apparel
Value Chain: What prospects for upgrading by developing
countries?”. Vienna, Austria: UNIDO.29 UNCTAD (2010) “Integrating Developing Countries’ SMEs into
Global Value Chains”.30 Dunning, J. and S. Lundan (2008) Multinational Enterprises
and the Global Economy, Second Edition. Cheltenham:
Edward Elgar Publishing Ltd.; Cantwell, J. and R. Mudambi
(2005) “MNE competence-creating subsidiary mandates”,
Strategic Management Journal, 26 (12): 1109-1128; for a
review of vertical spillovers, see Havranek, T. and Z. Irsova
(2011) “Estimating vertical spillovers from FDI: Why results
vary and what the true effect is”, Journal of International
Economics, 85(2): 234–244.31 Ivarsson, I. and C. G. Alvstam (2009) “Local Technology
Linkages and Supplier Upgrading in Global Value Chains: The
Case of Swedish Engineering TNCs in Emerging Markets”,
Competition and Change, 13:368–88; Ivarsson, I. and C. G.
Alvstam, 2010 (ibid.). Furthermore, a study of 1,385 firms in
Thailand shows that the presence of global buyers in the local
market reduces behavioural uncertainty and increases the
CHAPTER IV Global Value Chains: Investment and Trade for Development 201
likelihood of success in the selection of partners, leading to
knowledge-intensive value chain agreements (Saliola, F. and A.
Zanfei (2009) “Multinational firms, global value chains and the
organization of knowledge transfer”, Research Policy, 38:369).32 Zanfei, A. (2012) “Effects, Not Externalities”, The European
Journal of Development Research, 24:8-14; Pietrobelli, C.
and R. Rabellotti (ibid.); Kaplinsky, R. (2010) The role of
standards in global value chains. Washington, D.C.: The World
Bank; Narula, R. and N. Driffield (2012) “Does FDI Cause
Development? The Ambiguity of the Evidence and Why it
Matters”, The European Journal of Development Research,
24:1–7.33 Bell, M. and M. Albu (1999) ”Knowledge Systems and
Technological Dynamism in Industrial Clusters in Developing
Countries”, World Development 27.9: 1715–34.34 Sturgeon, T. J. and J. Lee (2004) Industry Co-Evolution:
A Comparison of Taiwan and North America’s Electronics
Contract Manufacturers. ITEC Research Paper Series 04-03,
Kyoto: Doshisha University. Available at http://itec.doshisha-u.
jp/03_publication/01_workingpaper/2004/ITECRPS0403.pdf.35 Ivarsson, I. and C. G. Alvstam, 2010 (ibid.); Navas-Alemán, L.
(2011) “The Impact of Operating in Multiple Value Chains for
Upgrading: The Case of the Brazilian Furniture and Footwear
Industries”, World Development, 39:1386-97. A good analysis
is made in the case of the South African furniture and timber
firms in an effort to comply with environmental certification
(Morris, M. and N. Dunne (2004) “Driving environmental
certification: its impact on the furniture and timber products
value chain in South Africa”, Geoforum, 35:251–66.).36 Gereffi, G., J. Humphrey and T. J. Sturgeon, 2005 (ibid.);
Giuliani, E., C. Pietrobelli and R. Rabellotti (2005) “Upgrading
in Global Value Chains: Lessons from Latin American
Clusters”, World Development, 33:549-73.; Humphrey, J.
and O. Memedovic (2003) “The Global Automotive Industry
Value Chain: What Prospects for Upgrading by Developing
Countries”, UNIDO Sectorial Studies Series, Working Paper.
Vienna: UNIDO; Gentile-Lüdecke, S. and A. Giroud (2012)
“Knowledge Transfer from TNCs and Upgrading of Domestic
Firms: The Polish Automotive Sector”, World Development,
40(4): 796–807.37 Humphrey, J. (2003) “Globalisation and Supply Chain
Networks: The Auto Industry in Brazil and India”, Global
Networks 3.2: 121–41.38 ILO (2013) Presentation on the World Day for Safety and
Health at Work, 28 April. http://www.ilo.org.39 UNCTAD (2012) “Corporate Social Responsibility in Global
Value Chains”, p. 8.40 UNCTAD (2013), “Corporate Social Responsibility: a Value
Chain Specific Approach”, forthcoming.41 Humphrey, J. and H. Schmitz (2002) “How does insertion in
global value chains affect upgrading in industrial clusters?”,
Regional Studies, 36:1017-27; Gereffi, G., et al., 2001 (ibid.).42 Christian, M. et al. (2011) (ibid.).43 This is well illustrated by the two Mexican footwear clusters of
Guadalajara and León. They operate in chains dominated by
United States buyers as well as in the domestic market. While
United States buyers control design and product development
for products sold in the United States market, local buyers and
producers co-operate and share competences domestically for
provision of products within the Mexican market (Giuliani, E. et
al., 2005 (ibid.)).44 In the Brazilian furniture and footwear industries, producers
operating in multiple chains (as opposed to those solely
exporting) have a higher propensity to engage in functional
upgrading (as well as product and process upgrading) –
because they use the domestic or regional markets to learn
how to design and market their products, before exporting
them under their own brands and designs to the United States
market (Navas-Alemàn, L., 2011 (ibid.)).45 Fessehaie, J. (2012) “What determines the breadth and depth
of Zambia’s backward linkages to copper mining? The role of
public policy and value chain dynamics”, Resources Policy,
37:443–51.46 Kaplinsky, R, et al., 2011 (ibid.); van Dijk, M. P. and J.
Trienekens (2012) Global Value Chains - Linking Local
Producers from Developing Countries to International Markets.
Amsterdam University Press, p. 210.47 Giuliani, E. et al., 2005 (ibid.).48 Humphrey, J. and H. Schmitz, 2002 (ibid.); Guiliani, E. et al.,
2005 (ibid.). 49 Hanlin, R. and C. Hanlin (2012) “The view from below: ‘lock-
in’ and local procurement in the African gold mining sector”,
Resources Policy, 37:468–74.50 Humphrey, J. and H. Schmitz, 2002 (ibid.) suggest that in
the case of garment production, local producers will not face
obstacles when moving from assembly of imported inputs to
increased local production and sources. However, a move up
to design and sale of own branded merchandise is less likely to
be facilitated by global buyers.51 Bernhardt, T. and W. Milberg, 2011 (ibid.); Whittaker, D.
H., T. Zhu, T. J. Sturgeon, M. H. Tsai and T. Okita (2010)
“Compressed development”, Studies in Comparative
International Development, 45:439-67.; Barrientos, S. et al.,
2008 (ibid.); Milberg, W. and D. Winkler, 2011 (ibid.); Rossi,
A.(2011) “Economic and social upgrading in global production
networks: the case of the garment industry in Morocco”,
Doctoral thesis, University of Sussex. 52 Fernandez-Stark, K. et al., 2011 (ibid.).53 Baldwin, R. (2011) “Trade And Industrialisation After
Globalisation’s 2nd Unbundling: How Building And Joining A
Supply Chain Are Different And Why It Matters”, NBER Working
Papers, No. 17716. This paper was one of the first to make
the argument that GVCs have transformed the nature of
industrialisation and called for more research.54 Based on W. Milberg, X. Jiang, and G. Gereffi (forthcoming),
Industrial Policy in the Era of Vertically Specialized
Industrialization.55 See www.asycuda.org. 56 UNCTAD (2009) “Non-tariff measures: Evidence from Selected
Developing Countries and Future Research Agenda”. On the
potential impact of automated processes, see also UNCTAD’s
2011 Information Economy Report “ICTs as an Enabler for
Private Sector Development”.57 See UNCTAD’s Investment Policy Framework for Sustainable
Development (IPFSD) for a complete discussion. Available at
http://investmentpolicyhub.unctad.org.58 See www.eRegulations.org. 59 See van Dijk M. and J. Trienekens, 2012 (ibid.).60 See UNCTAD (2012) “Report of the Multi-year Expert Meeting
on International Cooperation: South–South Cooperation
and Regional Integration” on its fourth session (Geneva,
24–25 October). Available at http://unctad.org/meetings/en/
SessionalDocuments/ciimem2d12_en.pdf.61 Gereffi, G. (2009), “Chains for Change: Third Max Havelaar
Lectures”, Rotterdam School of Management, p. 52. Available
at http://www.maxhavelaarlecture.org.62 Available at http://unctad.org/en/Pages/DIAE/
Entrepreneurship.63 See UNCTAD (2011) “Promoting standards for responsible
investment in value chains”, September. Available at www.
unctad.org/csr. 64 Gereffi, G. et al., (2009) (ibid.).65 Milberg, W. and M. Amengual (2008) “Economic development
and working conditions in export processing zones: A survey
of trends”. Geneva: ILO.66 UNCTAD (2013) “Transforming Export Processing Zones
into Centres for Excellence for Sustainable Development”
forthcoming. This research was focused on government run
industrial parks, even when these are termed differently in
different markets (e.g. ‘special economic zones’, etc.). To
evaluate the role of sustainable development services within
EPZs a sample of 100 EPZs from around the world was
World Investment Report 2013: Global Value Chains: Investment and Trade for Development202
surveyed. Following an initial focus on developing countries
of the G20 the research was broadened to search for best
practices from additional countries around the world.67 Classified as contingent trade-protective measures in
UNCTAD’s 2012 Classification of NTMs, available at www.
unctad.org.
Box IV.2a This variable is related to an active literature on measuring
vertical specialization, with the first indicator calculated being
the value of imported inputs in the overall (gross) exports
of a country. The refinement to this indicator of vertical
specialization corrects for the fact that the value of (gross)
imports used by country A to produce exports (as retrieved
from “standard” I-O tables) in reality might incorporate the
domestic value added of country A that has been used as
an input by country B, from which country A then sources,
allowing instead only for the foreign value added of country B
to enter in the calculation of country A’s inputs nets out this
effect. See Hummels, D., J. Ishii and K.-M. Yi (2001) “The
nature and growth of vertical specialization in world trade”,
Journal of International Economics 54(1): 75–96; and Johnson,
R.C. and G. Noguera (2012) “Accounting for intermediates:
Production sharing and trade in value-added”, Journal of
International Economics 86(2), 224–236.b This indicator was first introduced in Koopman, R., W. Powers,
Z. Wang and S.-J. Wei (2011) “Give credit to where credit is
due: tracing value added in global production chains”, NBER
Working Papers Series, No. 16426, September 2010, revised
September 2011.c See Fally, T. (2011) “On the Fragmentation of Production in the
US”, University of Colorado-Boulder, July.
Box IV. 3a Estimates are based on data from the United States Bureau
of Economic Affairs (“U.S. Affiliates of Foreign Companies
and U.S. Multinational Companies”, 2012); China Ministry
of Commerce; OECD; IDE-JETRO. Data for Europe from
Altomonte, C., F. Di Mauro, G. Ottaviano, A. Rungi, and V.
Vicard (2012) “Global Value Chains during the Great Trade
Collapse: A Bullwhip Effect?”, ECB Working Paper Series, No.
1412.
Box IV. 4a As constructed by Altomonte, C. and A. Rungi (2013)
“Business Groups as Hierarchies of Firms: Determinants
of Vertical Integration and Performance”, Working Papers
2013.33, Fondazione Eni Enrico Mattei. This dataset uses a
definition of control as established in international standards for
multinational corporations, where control is assumed if (directly
or indirectly, e.g. via another controlled affiliate) the parent
exceeds the majority (50.01 per cent) of voting rights (i.e.
majority ownership) of the affiliate and can thus be considered
as the Ultimate Beneficial Owner.b Altomonte, C. et al., 2012 (ibid.)
Box IV. 5a See Engel. B (2011) “10 best practices you should be doing
now”, Supply Chain Quarterly, Quarter 1. Perez, D. (2013)
“Supply chain strategies: Which one hits the mark?”, Supply
Chain Quarterly, Quarter 1.b See Cooke, J. A. (2012) “From many to one: IBM’s unified
supply chain”, Supply Chain Quarterly, Quarter 4.
Box IV. 8 a See Reuters, “Factbox: Major U.S. Tax Court transfer pricing
cases”, 17 June 2012. Available at http://www.reuters.com
(accessed 10 January 2013).b See http://www.tax-news.com/news/IndianTribunal_Reaches_
Key_Transfer_Pricing_Decision (accessed on 25 May 2013).


![[WIR-1286]868MHz LORA Wireless Module - …robokits.download/datasheets/WIR_1286.pdf · [WIR-1286]868MHz LORA Wireless Module Page 1 LORA 868MHz Wireless serial link [WIR-1286] Contents](https://img.pdfslide.us/doc/110x75/5b8250287f8b9aad638e4423/wir-1286868mhz-lora-wireless-module-wir-1286868mhz-lora-wireless-module.jpg)