Embed Size (px)
Citation preview
© 2012 WIPRO LTD | WWW.WIPRO.COM 1
Wipro – Presentation
to Investors
October – December, 2012
© 2012 WIPRO LTD | WWW.WIPRO.COM 2
Safe Harbor
This presentation may contain certain “forward looking” statements, which
involve a number of risks, uncertainties and other factors that could cause
actual results to differ materially from those that may be projected by these
forward looking statements. These uncertainties have been detailed in the
reports filed by Wipro with the Securities and Exchange Commission and
these filings are available at www.sec.gov. This presentation also contains
references to findings of various reports available in the public domain.
Wipro makes no representation as to their accuracy or that the company
subscribes to those findings.
© 2012 WIPRO LTD | WWW.WIPRO.COM 3
Agenda
Our track record on performance
Overall Market Opportunity
Our Strategy
Demerger Scheme
© 2012 WIPRO LTD | WWW.WIPRO.COM 4
Track Record on Performance
© 2012 WIPRO LTD | WWW.WIPRO.COM 5
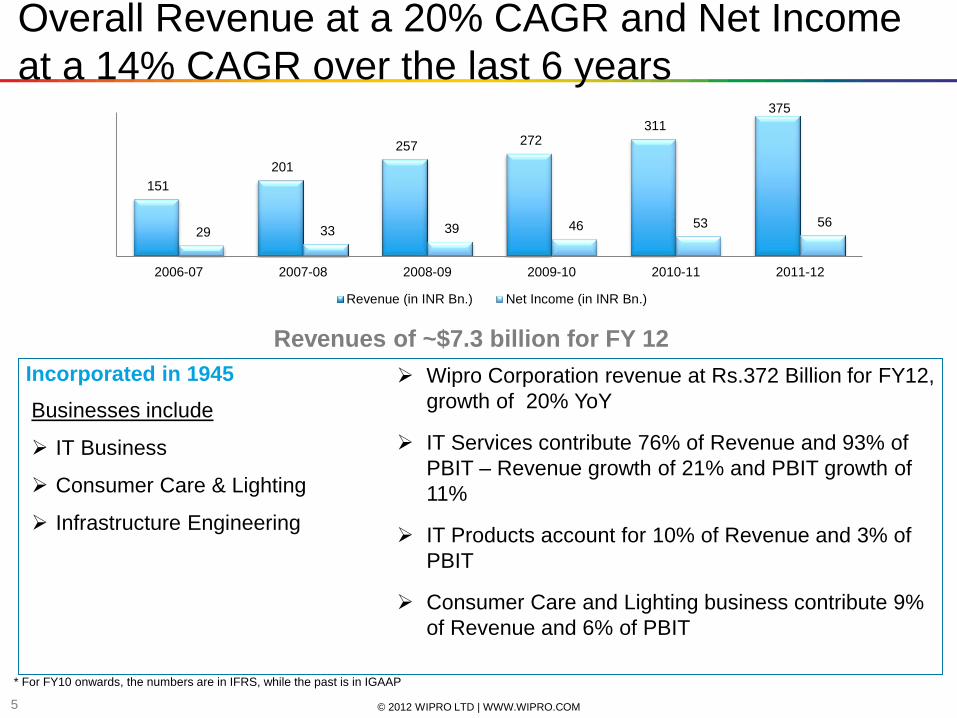
Overall Revenue at a 20% CAGR and Net Income
at a 14% CAGR over the last 6 years
Incorporated in 1945
Businesses include
IT Business
Consumer Care & Lighting
Infrastructure Engineering
Wipro Corporation revenue at Rs.372 Billion for FY12,
growth of 20% YoY
IT Services contribute 76% of Revenue and 93% of
PBIT – Revenue growth of 21% and PBIT growth of
11%
IT Products account for 10% of Revenue and 3% of
PBIT
Consumer Care and Lighting business contribute 9%
of Revenue and 6% of PBIT
* For FY10 onwards, the numbers are in IFRS, while the past is in IGAAP
Revenues of ~$7.3 billion for FY 12
151
201
257 272 311
375
29 33 39 46 53 56
2006-07 2007-08 2008-09 2009-10 2010-11 2011-12
Revenue (in INR Bn.) Net Income (in INR Bn.)
© 2012 WIPRO LTD | WWW.WIPRO.COM 6
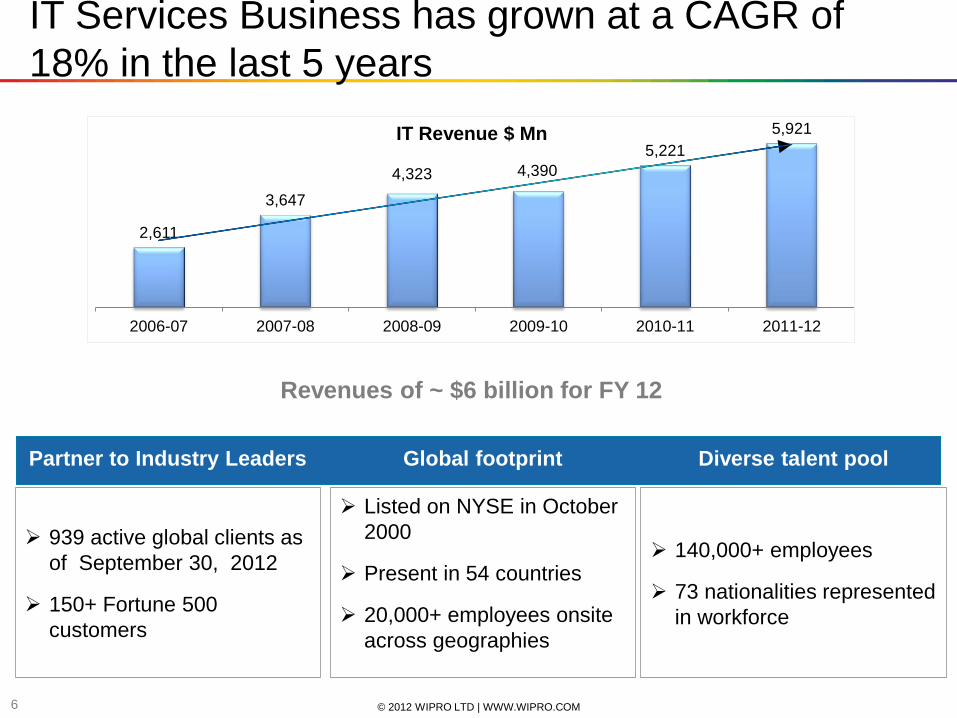
IT Services Business has grown at a CAGR of
18% in the last 5 years
939 active global clients as
of September 30, 2012
150+ Fortune 500
customers
Listed on NYSE in October
2000
Present in 54 countries
20,000+ employees onsite
across geographies
140,000+ employees
73 nationalities represented
in workforce
Partner to Industry Leaders Global footprint Diverse talent pool
Revenues of ~ $6 billion for FY 12
2,611
3,647
4,323 4,390
5,221
5,921
2006-07 2007-08 2008-09 2009-10 2010-11 2011-12
IT Revenue $ Mn
© 2012 WIPRO LTD | WWW.WIPRO.COM 7
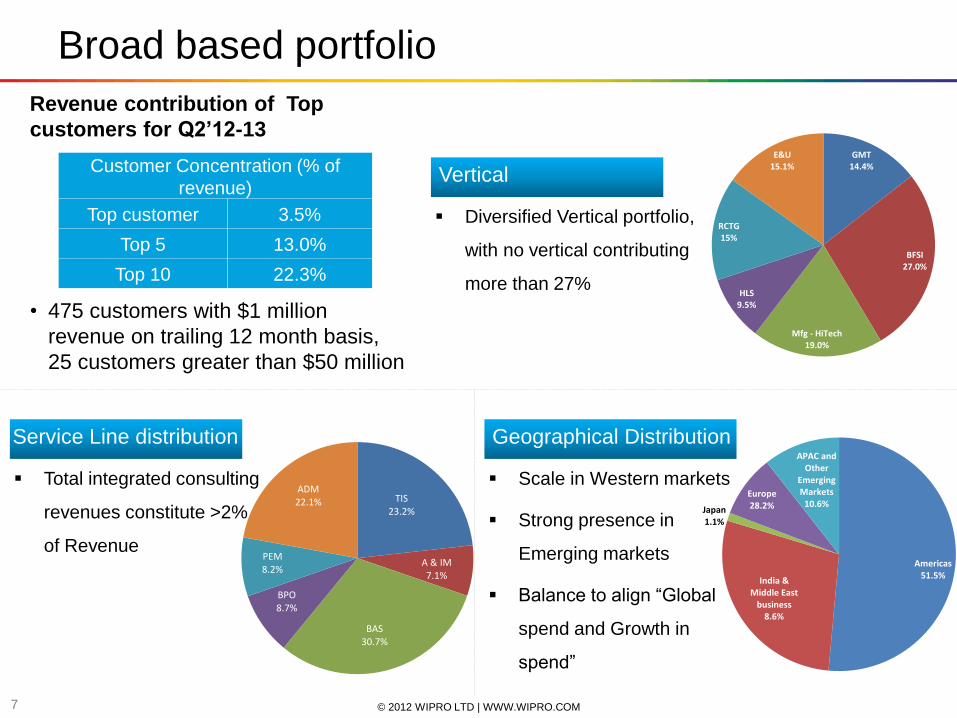
Broad based portfolio
Customer Concentration (% of
revenue)
Top customer 3.5%
Top 5 13.0%
Top 10 22.3%
• 475 customers with $1 million
revenue on trailing 12 month basis,
25 customers greater than $50 million
Revenue contribution of Top
customers for Q2’12-13
Diversified Vertical portfolio,
with no vertical contributing
more than 27%
Vertical
Total integrated consulting
revenues constitute >2%
of Revenue
Service Line distribution
Scale in Western markets
Strong presence in
Emerging markets
Balance to align “Global
spend and Growth in
spend”
Geographical Distribution APAC and
emerging
markets 9
%
America
52%
India & Middle
East 10%
Europe 28%
GMT 14.4%
BFSI 27.0%
Mfg - HiTech 19.0%
HLS 9.5%
RCTG 15%
E&U 15.1%
Americas 51.5%
India & Middle East
business 8.6%
Japan 1.1%
Europe 28.2%
APAC and Other
Emerging Markets
10.6% TIS
23.2%
A & IM 7.1%
BAS 30.7%
BPO 8.7%
PEM 8.2%
ADM 22.1%
© 2012 WIPRO LTD | WWW.WIPRO.COM 8
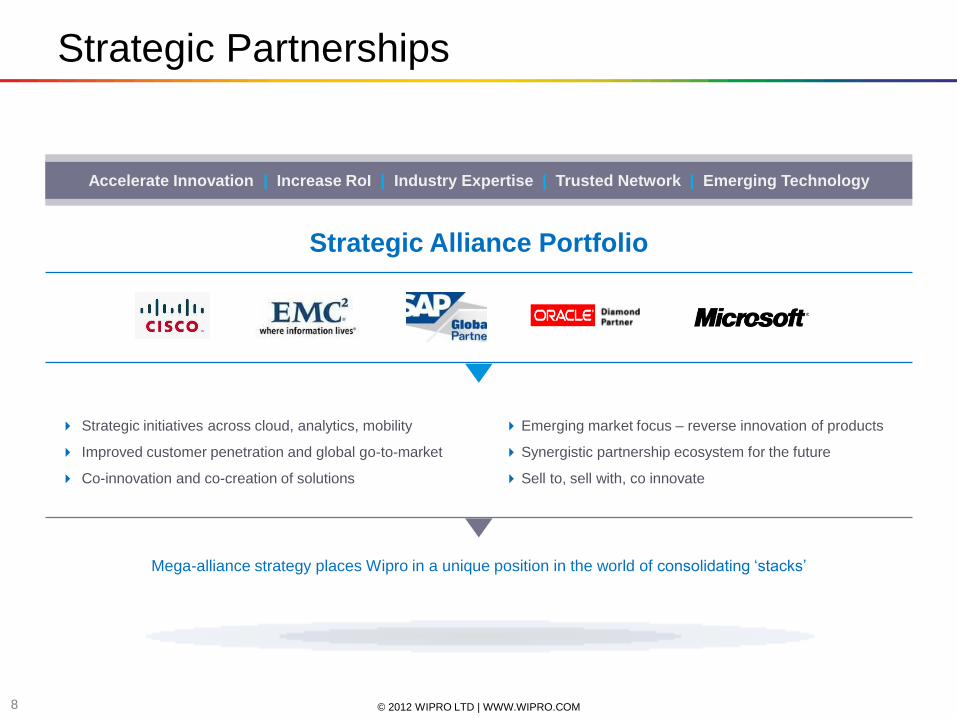
Accelerate Innovation | Increase RoI | Industry Expertise | Trusted Network | Emerging Technology
Strategic Partnerships
Strategic Alliance Portfolio
Mega-alliance strategy places Wipro in a unique position in the world of consolidating „stacks‟
Strategic initiatives across cloud, analytics, mobility
Improved customer penetration and global go-to-market
Co-innovation and co-creation of solutions
Emerging market focus – reverse innovation of products
Synergistic partnership ecosystem for the future
Sell to, sell with, co innovate

© 2012 WIPRO LTD | WWW.WIPRO.COM 9
Overall Market Opportunity
© 2012 WIPRO LTD | WWW.WIPRO.COM 10
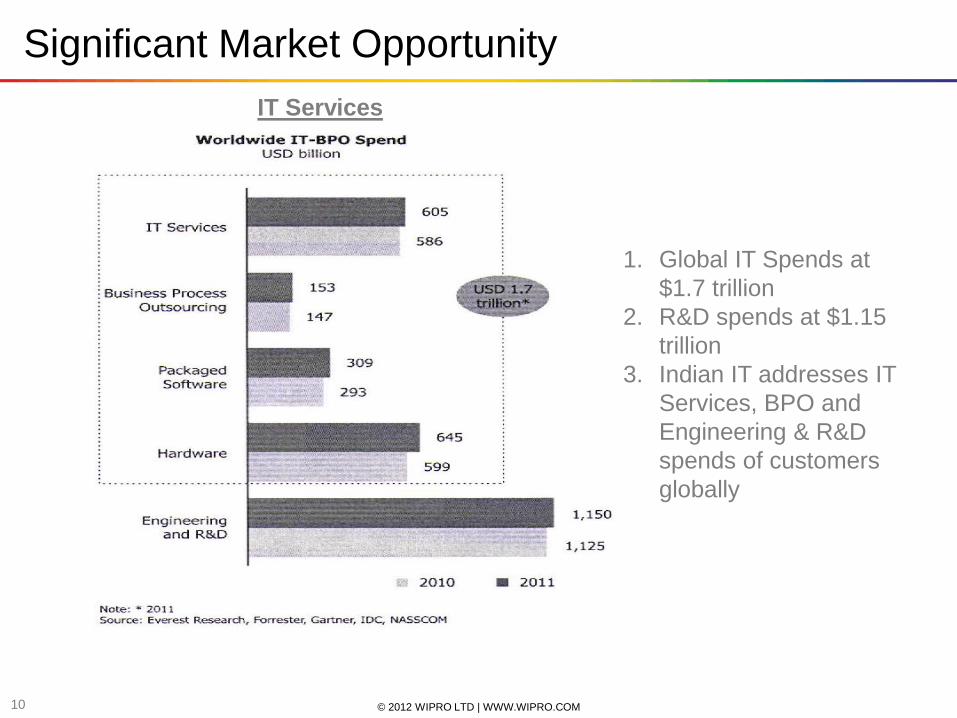
Significant Market Opportunity
1. Global IT Spends at
$1.7 trillion
2. R&D spends at $1.15
trillion
3. Indian IT addresses IT
Services, BPO and
Engineering & R&D
spends of customers
globally
IT Services
© 2012 WIPRO LTD | WWW.WIPRO.COM 11
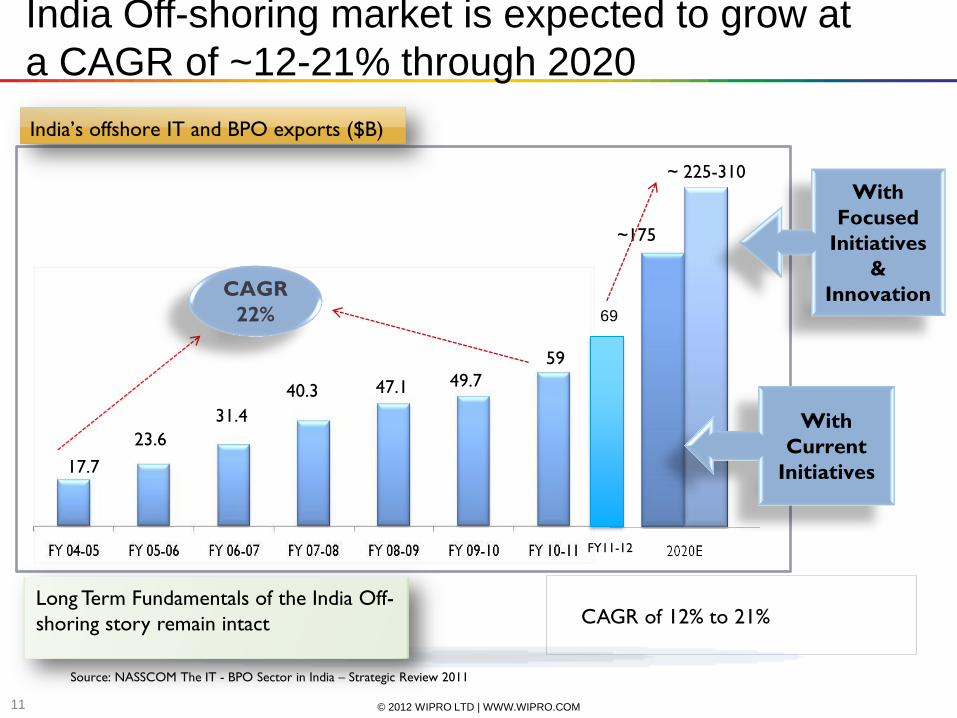
India Off-shoring market is expected to grow at
a CAGR of ~12-21% through 2020
~ 225-310
~175
India’s offshore IT and BPO exports ($B)
With
Focused
Initiatives
&
Innovation
With
Current
Initiatives
CAGR of 12% to 21%
Source: NASSCOM The IT - BPO Sector in India – Strategic Review 2011
Long Term Fundamentals of the India Off-
shoring story remain intact
23.6
17.7
31.4
40.3
59
47.1 49.7
CAGR
22%
FY11-12
69
© 2012 WIPRO LTD | WWW.WIPRO.COM 12
Our Strategy
© 2012 WIPRO LTD | WWW.WIPRO.COM 13
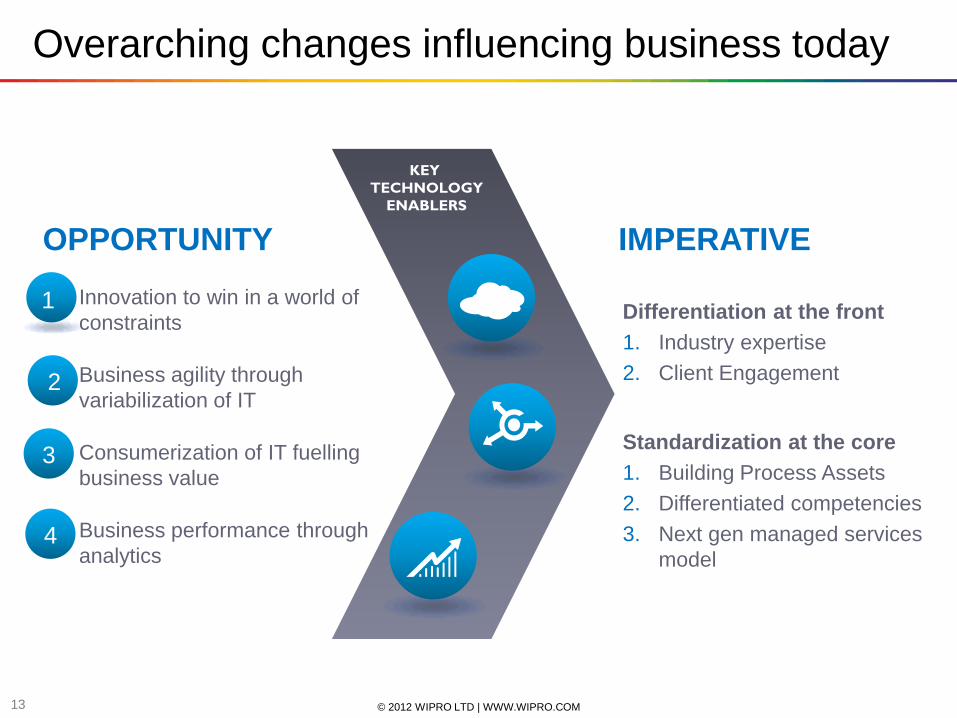
Differentiation at the front
1. Industry expertise
2. Client Engagement
Standardization at the core
1. Building Process Assets
2. Differentiated competencies
3. Next gen managed services
model
IMPERATIVE OPPORTUNITY
Innovation to win in a world of
constraints
Business agility through
variabilization of IT
Consumerization of IT fuelling
business value
Business performance through
analytics
Overarching changes influencing business today
KEY
TECHNOLOGY
ENABLERS
1
2
3
4
© 2012 WIPRO LTD | WWW.WIPRO.COM 14
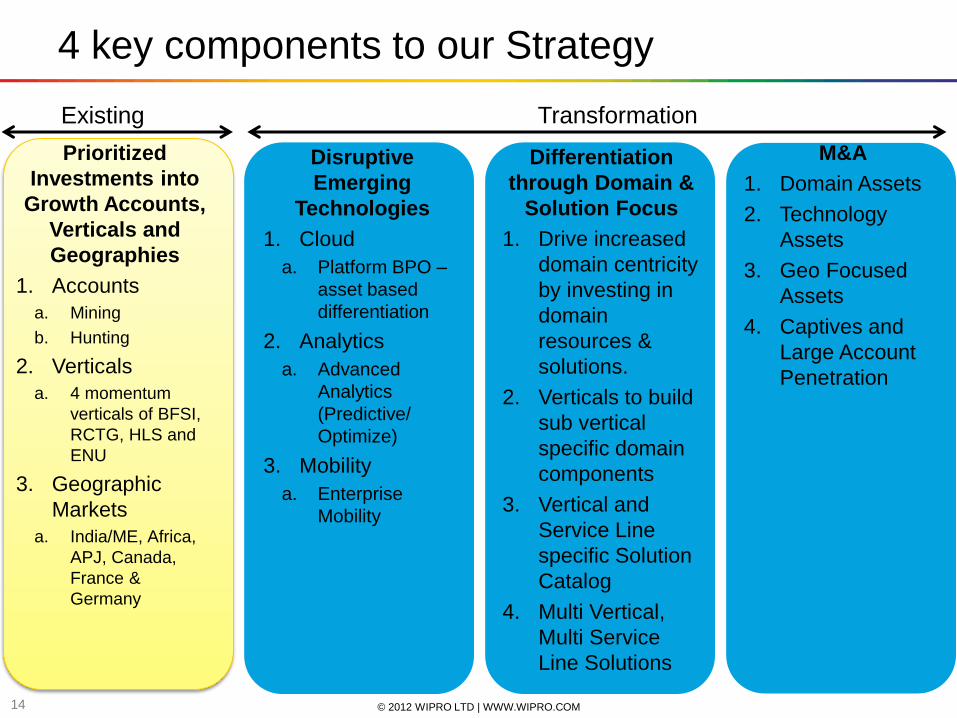
4 key components to our Strategy
Prioritized
Investments into
Growth Accounts,
Verticals and
Geographies
1. Accounts
a. Mining
b. Hunting
2. Verticals
a. 4 momentum
verticals of BFSI,
RCTG, HLS and
ENU
3. Geographic
Markets
a. India/ME, Africa,
APJ, Canada,
France &
Germany
Disruptive
Emerging
Technologies
1. Cloud
a. Platform BPO –
asset based
differentiation
2. Analytics
a. Advanced
Analytics
(Predictive/
Optimize)
3. Mobility
a. Enterprise
Mobility
Differentiation
through Domain &
Solution Focus
1. Drive increased
domain centricity
by investing in
domain
resources &
solutions.
2. Verticals to build
sub vertical
specific domain
components
3. Vertical and
Service Line
specific Solution
Catalog
4. Multi Vertical,
Multi Service
Line Solutions
M&A
1. Domain Assets
2. Technology
Assets
3. Geo Focused
Assets
4. Captives and
Large Account
Penetration
Existing Transformation
© 2012 WIPRO LTD | WWW.WIPRO.COM 15
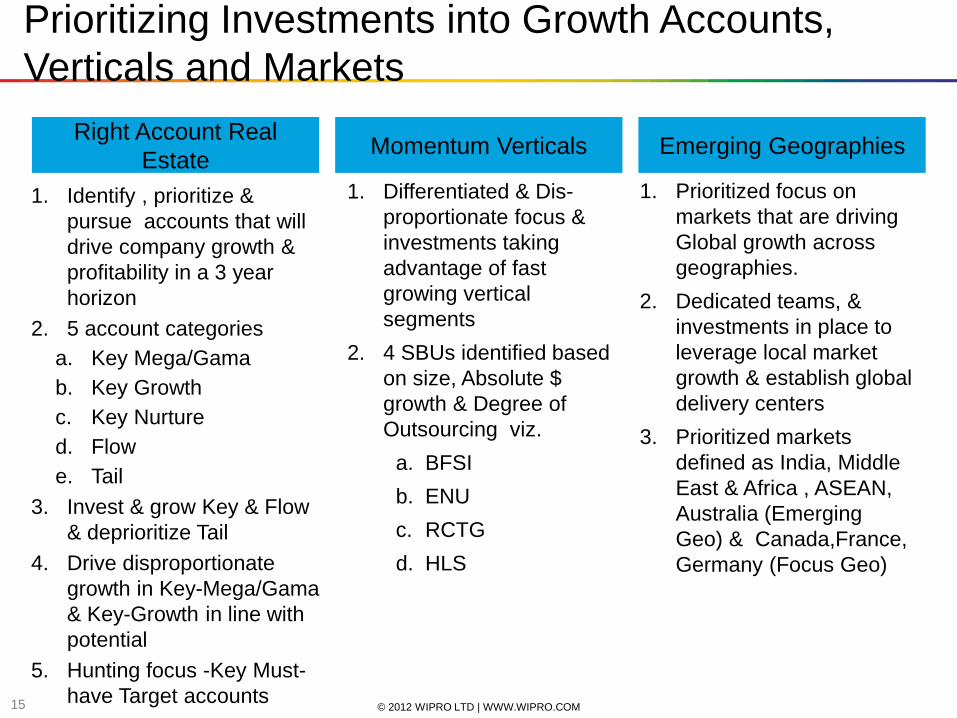
Prioritizing Investments into Growth Accounts,
Verticals and Markets
Right Account Real
Estate Momentum Verticals Emerging Geographies
1. Identify , prioritize &
pursue accounts that will
drive company growth &
profitability in a 3 year
horizon
2. 5 account categories
a. Key Mega/Gama
b. Key Growth
c. Key Nurture
d. Flow
e. Tail
3. Invest & grow Key & Flow
& deprioritize Tail
4. Drive disproportionate
growth in Key-Mega/Gama
& Key-Growth in line with
potential
5. Hunting focus -Key Must-
have Target accounts
1. Differentiated & Dis-
proportionate focus &
investments taking
advantage of fast
growing vertical
segments
2. 4 SBUs identified based
on size, Absolute $
growth & Degree of
Outsourcing viz.
a. BFSI
b. ENU
c. RCTG
d. HLS
1. Prioritized focus on
markets that are driving
Global growth across
geographies.
2. Dedicated teams, &
investments in place to
leverage local market
growth & establish global
delivery centers
3. Prioritized markets
defined as India, Middle
East & Africa , ASEAN,
Australia (Emerging
Geo) & Canada,France,
Germany (Focus Geo)
© 2012 WIPRO LTD | WWW.WIPRO.COM 16
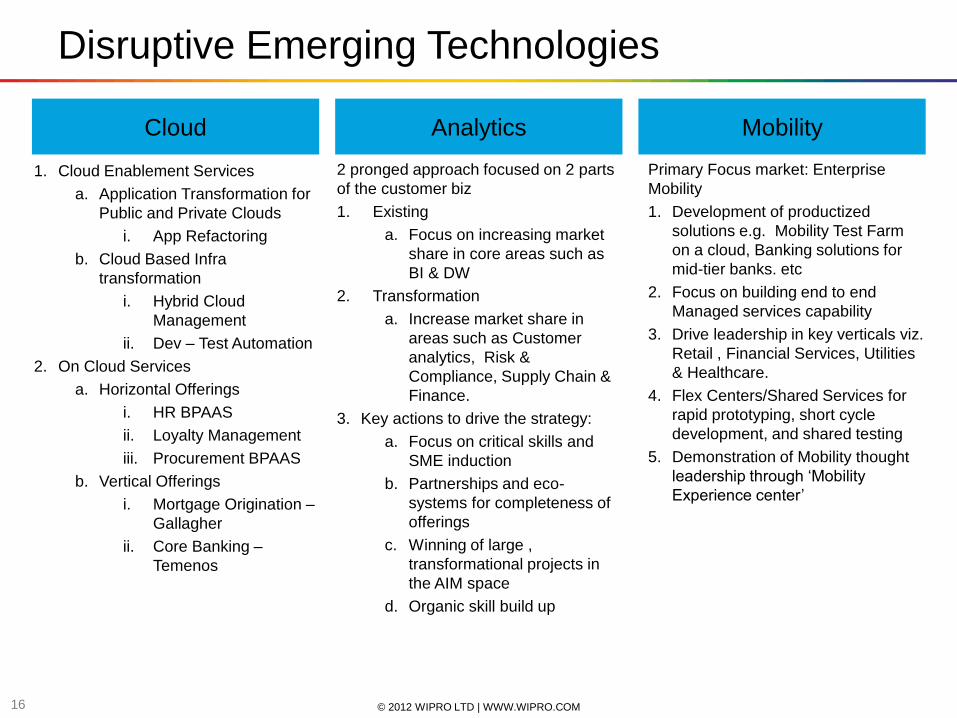
Disruptive Emerging Technologies
Cloud Analytics Mobility
1. Cloud Enablement Services
a. Application Transformation for
Public and Private Clouds
i. App Refactoring
b. Cloud Based Infra
transformation
i. Hybrid Cloud
Management
ii. Dev – Test Automation
2. On Cloud Services
a. Horizontal Offerings
i. HR BPAAS
ii. Loyalty Management
iii. Procurement BPAAS
b. Vertical Offerings
i. Mortgage Origination –
Gallagher
ii. Core Banking –
Temenos
Primary Focus market: Enterprise
Mobility
1. Development of productized
solutions e.g. Mobility Test Farm
on a cloud, Banking solutions for
mid-tier banks. etc
2. Focus on building end to end
Managed services capability
3. Drive leadership in key verticals viz.
Retail , Financial Services, Utilities
& Healthcare.
4. Flex Centers/Shared Services for
rapid prototyping, short cycle
development, and shared testing
5. Demonstration of Mobility thought
leadership through „Mobility
Experience center‟
2 pronged approach focused on 2 parts
of the customer biz
1. Existing
a. Focus on increasing market
share in core areas such as
BI & DW
2. Transformation
a. Increase market share in
areas such as Customer
analytics, Risk &
Compliance, Supply Chain &
Finance.
3. Key actions to drive the strategy:
a. Focus on critical skills and
SME induction
b. Partnerships and eco-
systems for completeness of
offerings
c. Winning of large ,
transformational projects in
the AIM space
d. Organic skill build up
© 2012 WIPRO LTD | WWW.WIPRO.COM 17
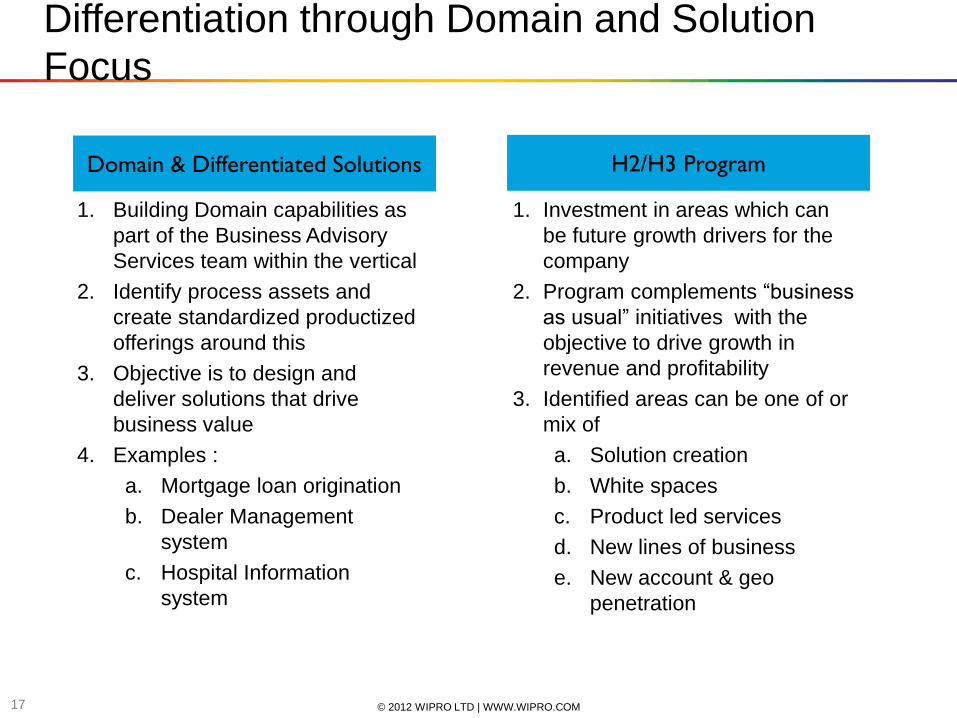
Differentiation through Domain and Solution
Focus
Domain & Differentiated Solutions
1. Building Domain capabilities as
part of the Business Advisory
Services team within the vertical
2. Identify process assets and
create standardized productized
offerings around this
3. Objective is to design and
deliver solutions that drive
business value
4. Examples :
a. Mortgage loan origination
b. Dealer Management
system
c. Hospital Information
system
1. Investment in areas which can
be future growth drivers for the
company
2. Program complements “business
as usual” initiatives with the
objective to drive growth in
revenue and profitability
3. Identified areas can be one of or
mix of
a. Solution creation
b. White spaces
c. Product led services
d. New lines of business
e. New account & geo
penetration
H2/H3 Program
© 2012 WIPRO LTD | WWW.WIPRO.COM 18
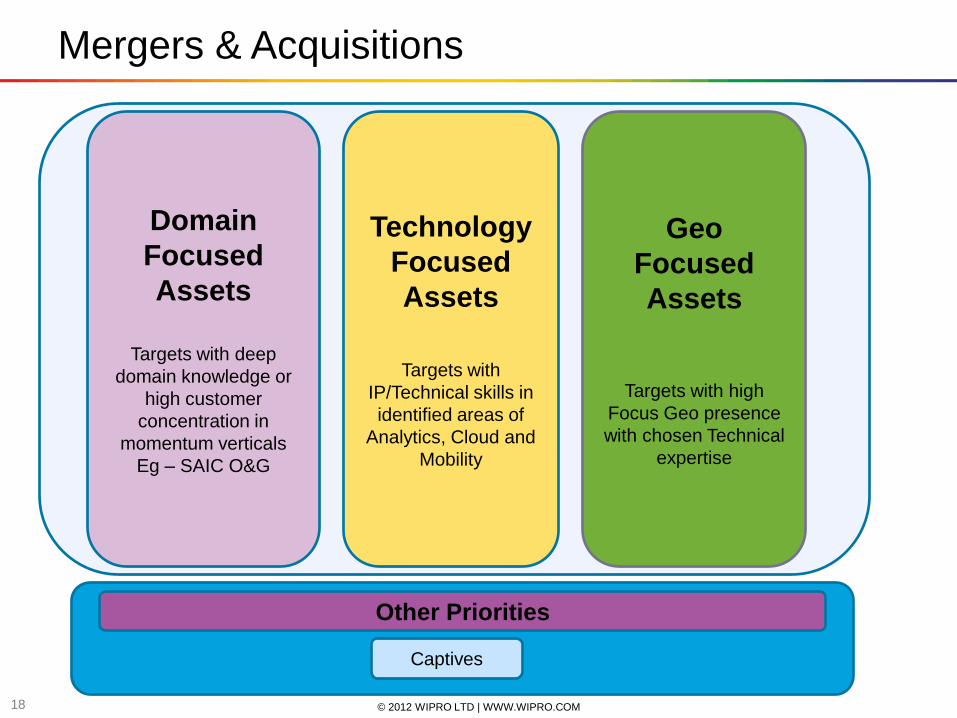
Mergers & Acquisitions
Domain
Focused
Assets
Targets with deep
domain knowledge or
high customer
concentration in
momentum verticals
Eg – SAIC O&G
Technology
Focused
Assets
Targets with
IP/Technical skills in
identified areas of
Analytics, Cloud and
Mobility
Geo
Focused
Assets
Targets with high
Focus Geo presence
with chosen Technical
expertise
Captives
Other Priorities
© 2012 WIPRO LTD | WWW.WIPRO.COM 19
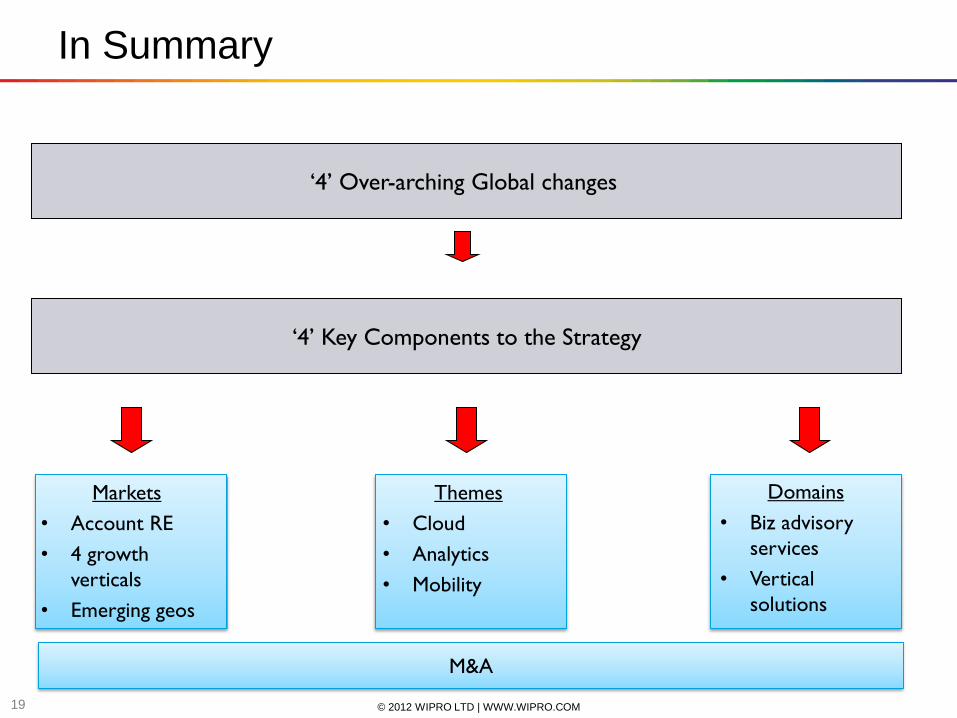
In Summary
‘4’ Over-arching Global changes
‘4’ Key Components to the Strategy
Themes
• Cloud
• Analytics
• Mobility
Domains
• Biz advisory
services
• Vertical
solutions
Markets
• Account RE
• 4 growth
verticals
• Emerging geos
M&A
© 2012 WIPRO LTD | WWW.WIPRO.COM 20
Demerger Scheme
© 2012 WIPRO LTD | WWW.WIPRO.COM 21
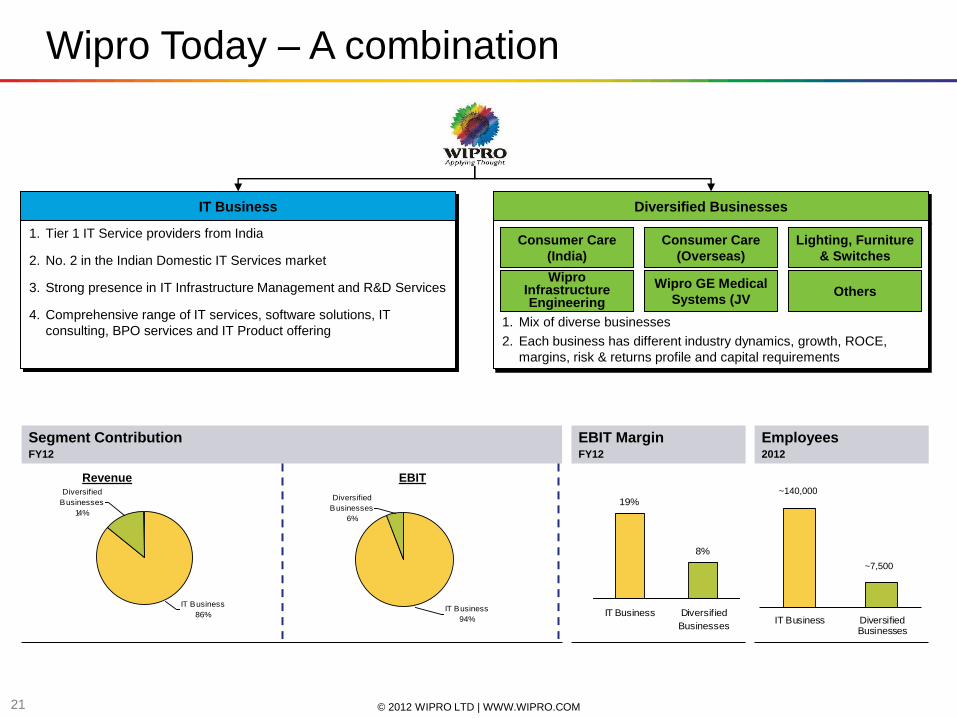
IT Business Diversified Businesses
1. Tier 1 IT Service providers from India
2. No. 2 in the Indian Domestic IT Services market
3. Strong presence in IT Infrastructure Management and R&D Services
4. Comprehensive range of IT services, software solutions, IT
consulting, BPO services and IT Product offering 1. Mix of diverse businesses
2. Each business has different industry dynamics, growth, ROCE,
margins, risk & returns profile and capital requirements
Wipro Today – A combination
Wipro Infrastructure Engineering
Wipro GE Medical
Systems (JV Others
Consumer Care
(India)
Consumer Care
(Overseas)
Lighting, Furniture
& Switches
Employees 2012
EBIT Margin FY12
19%
8%
IT Business Diversif ied
BusinessesIT Business Diversified
Businesses
~140,000
Segment Contribution FY12
Diversified
Businesses
14%
IT Business
86%
Diversified
Businesses
6%
IT Business
94%
Revenue EBIT
~7,500
© 2012 WIPRO LTD | WWW.WIPRO.COM 22
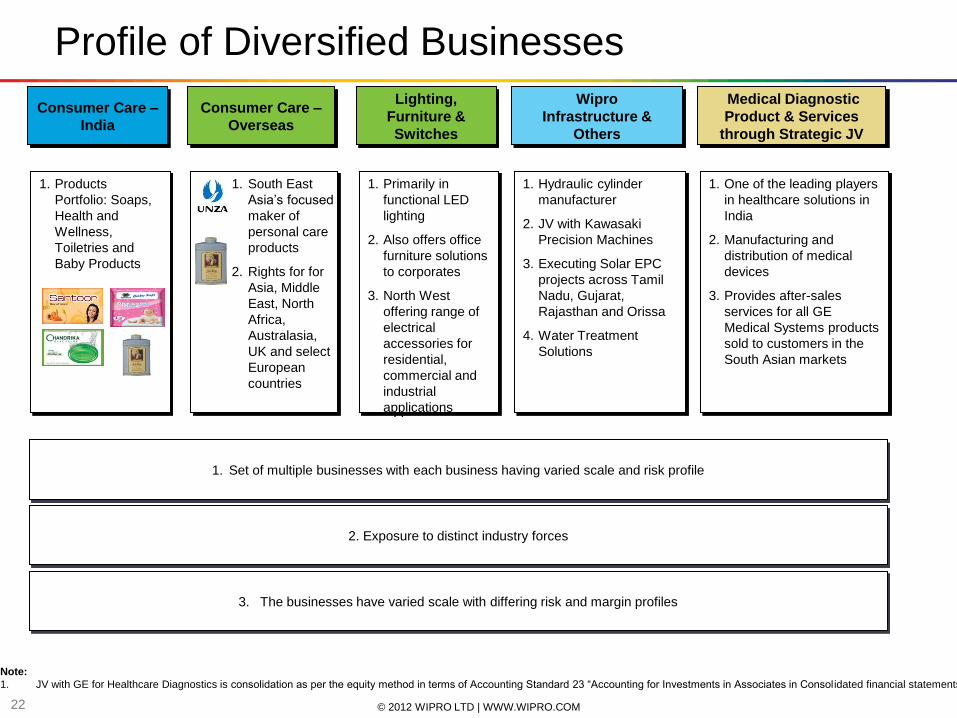
1. Products
Portfolio: Soaps,
Health and
Wellness,
Toiletries and
Baby Products
Profile of Diversified Businesses
Lighting,
Furniture &
Switches
Wipro
Infrastructure &
Others
Consumer Care –
India
Consumer Care –
Overseas
1. Primarily in
functional LED
lighting
2. Also offers office
furniture solutions
to corporates
3. North West
offering range of
electrical
accessories for
residential,
commercial and
industrial
applications
1. South East
Asia‟s focused
maker of
personal care
products
2. Rights for for
Asia, Middle
East, North
Africa,
Australasia,
UK and select
European
countries
1. Hydraulic cylinder
manufacturer
2. JV with Kawasaki
Precision Machines
3. Executing Solar EPC
projects across Tamil
Nadu, Gujarat,
Rajasthan and Orissa
4. Water Treatment
Solutions
1. Set of multiple businesses with each business having varied scale and risk profile
2. Exposure to distinct industry forces
3. The businesses have varied scale with differing risk and margin profiles
Note:
1. JV with GE for Healthcare Diagnostics is consolidation as per the equity method in terms of Accounting Standard 23 “Accounting for Investments in Associates in Consol idated financial statements
Medical Diagnostic
Product & Services
through Strategic JV
1. One of the leading players
in healthcare solutions in
India
2. Manufacturing and
distribution of medical
devices
3. Provides after-sales
services for all GE
Medical Systems products
sold to customers in the
South Asian markets
© 2012 WIPRO LTD | WWW.WIPRO.COM 23
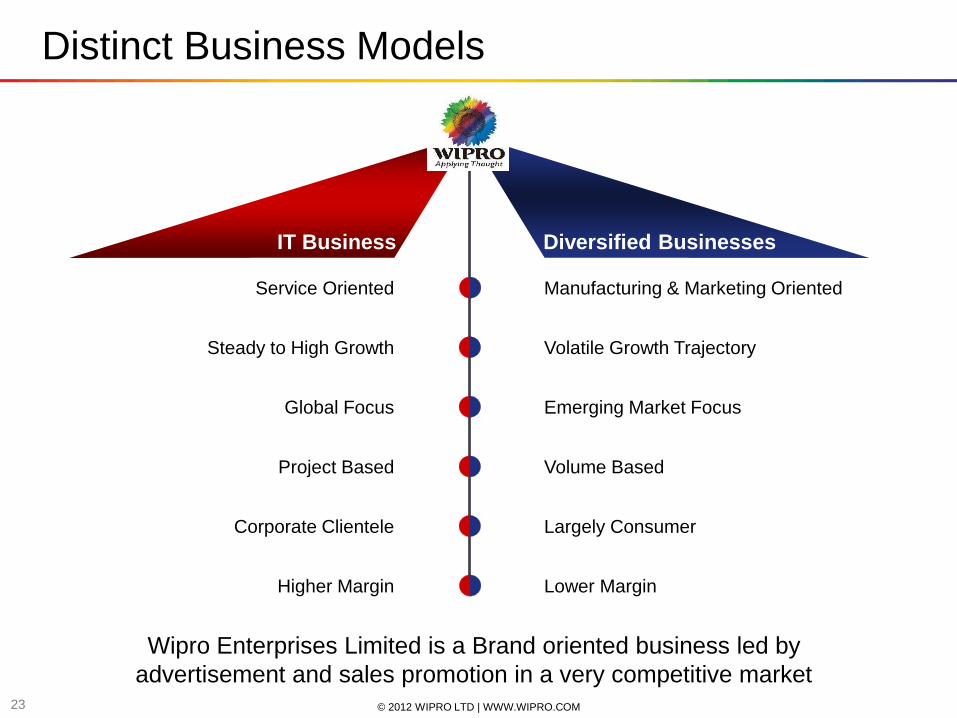
Distinct Business Models
IT Business Diversified Businesses
Service Oriented Manufacturing & Marketing Oriented
Steady to High Growth Volatile Growth Trajectory
Global Focus Emerging Market Focus
Project Based Volume Based
Corporate Clientele Largely Consumer
Higher Margin Lower Margin
Wipro Enterprises Limited is a Brand oriented business led by
advertisement and sales promotion in a very competitive market

© 2012 WIPRO LTD | WWW.WIPRO.COM 24
Proposed Restructuring
Current Structure Post Demerger & Exchange(1)
ADRs
Promoter &
Promoter
Group
Public
(excluding
ADRs)
Wipro Limited
IT
Business
Diversified
Businesses
ADRs
Promoter &
Promoter
Group
Public
(excluding
ADRs)
Wipro Limited) (IT Business)
Wipro Enterprise Limited (Diversified Businesses)
Note:
1. Emerging shareholding is a function of the option exercised by the public shareholders
A transformational step to unlock shareholder value and take Wipro to the next level of growth
© 2012 WIPRO LTD | WWW.WIPRO.COM 25
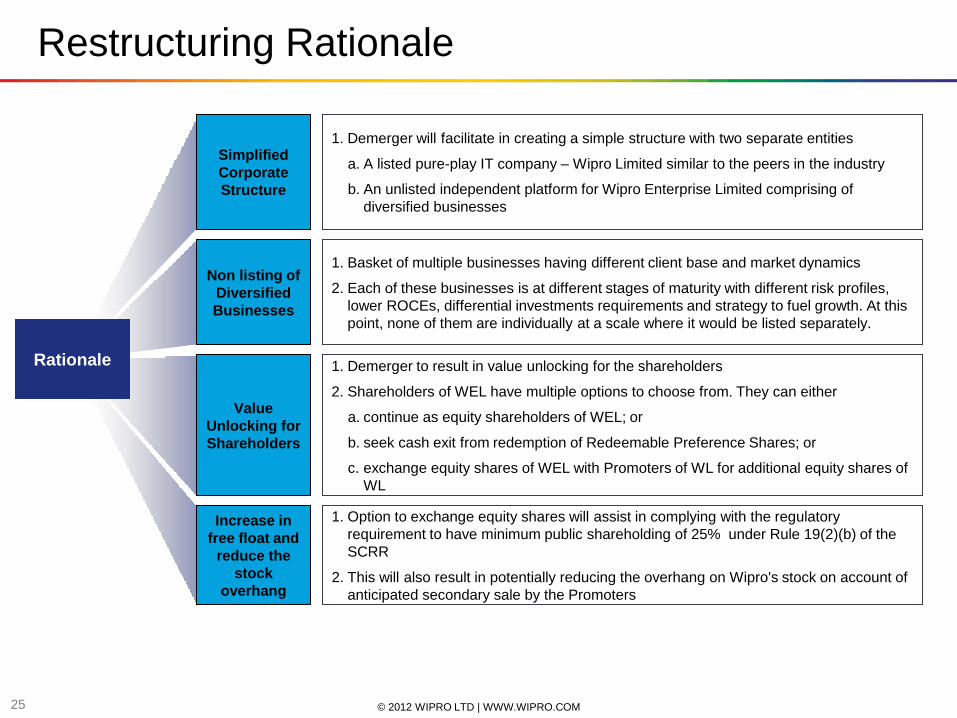
Restructuring Rationale
1. Demerger will facilitate in creating a simple structure with two separate entities
a. A listed pure-play IT company – Wipro Limited similar to the peers in the industry
b. An unlisted independent platform for Wipro Enterprise Limited comprising of
diversified businesses
1. Demerger to result in value unlocking for the shareholders
2. Shareholders of WEL have multiple options to choose from. They can either
a. continue as equity shareholders of WEL; or
b. seek cash exit from redemption of Redeemable Preference Shares; or
c. exchange equity shares of WEL with Promoters of WL for additional equity shares of
WL
1. Option to exchange equity shares will assist in complying with the regulatory
requirement to have minimum public shareholding of 25% under Rule 19(2)(b) of the
SCRR
2. This will also result in potentially reducing the overhang on Wipro's stock on account of
anticipated secondary sale by the Promoters
Rationale
1. Basket of multiple businesses having different client base and market dynamics
2. Each of these businesses is at different stages of maturity with different risk profiles,
lower ROCEs, differential investments requirements and strategy to fuel growth. At this
point, none of them are individually at a scale where it would be listed separately.
Simplified
Corporate
Structure
Value
Unlocking for
Shareholders
Increase in
free float and
reduce the
stock
overhang
Non listing of
Diversified
Businesses
© 2012 WIPRO LTD | WWW.WIPRO.COM 26
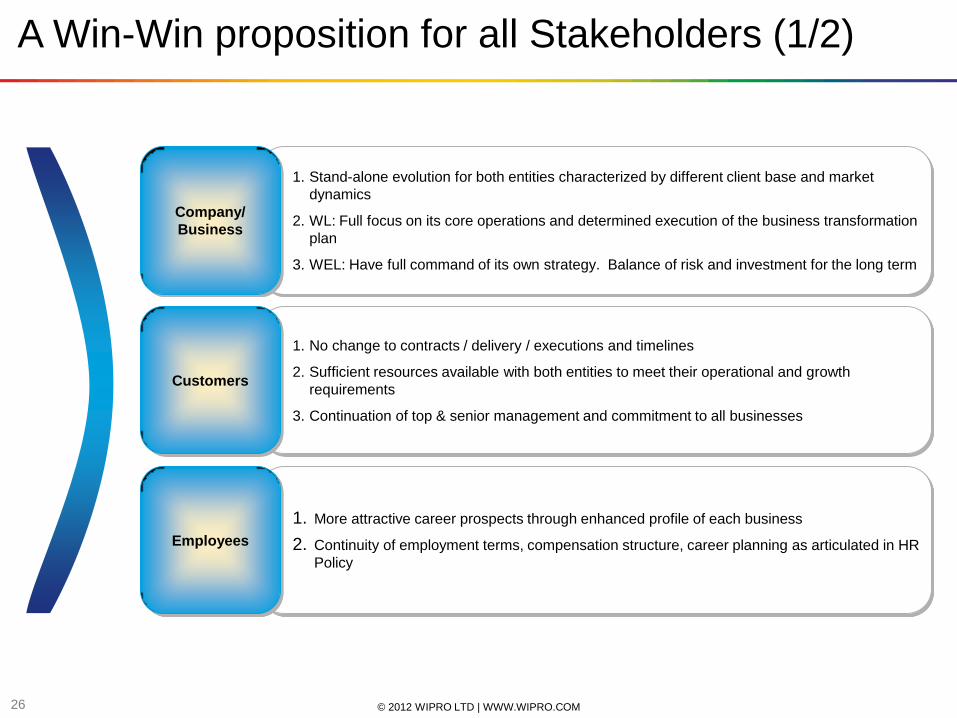
A Win-Win proposition for all Stakeholders (1/2)
1. Stand-alone evolution for both entities characterized by different client base and market
dynamics
2. WL: Full focus on its core operations and determined execution of the business transformation
plan
3. WEL: Have full command of its own strategy. Balance of risk and investment for the long term
Company/
Business
1. No change to contracts / delivery / executions and timelines
2. Sufficient resources available with both entities to meet their operational and growth
requirements
3. Continuation of top & senior management and commitment to all businesses
Customers
1. More attractive career prospects through enhanced profile of each business
2. Continuity of employment terms, compensation structure, career planning as articulated in HR
Policy
Employees
© 2012 WIPRO LTD | WWW.WIPRO.COM 27
1. WL and WEL both to continue with high quality governance standards
2. De-merger will be carried out in a transparent manner under the oversight of a committee of
Independent Directors and Trust maintaining high standard of corporate governance
High on
Governance
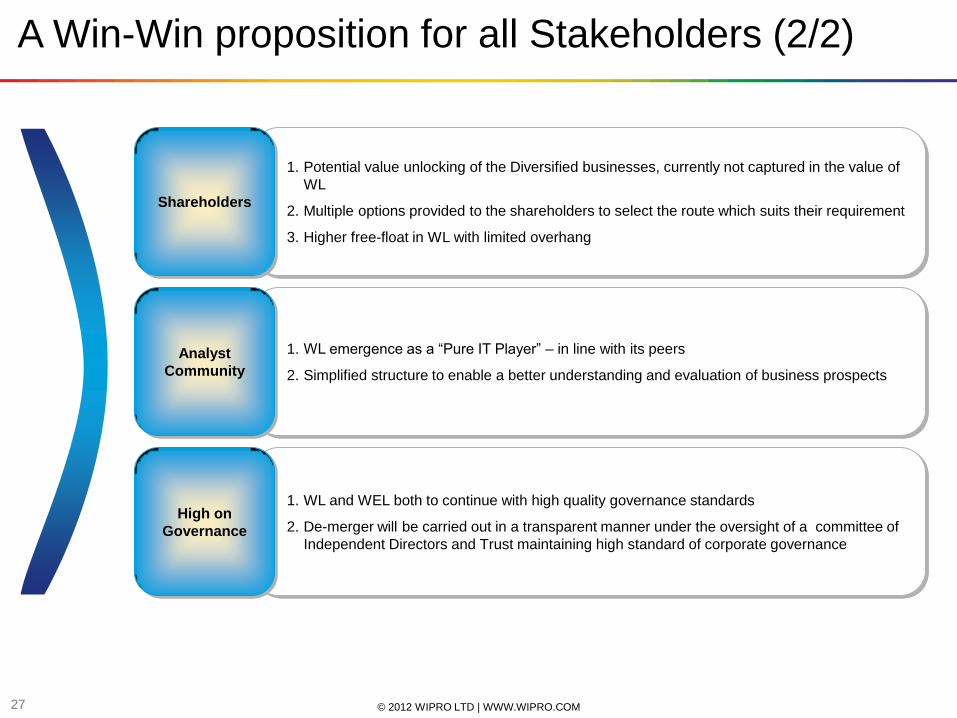
1. Potential value unlocking of the Diversified businesses, currently not captured in the value of
WL
2. Multiple options provided to the shareholders to select the route which suits their requirement
3. Higher free-float in WL with limited overhang
Shareholders
1. WL emergence as a “Pure IT Player” – in line with its peers
2. Simplified structure to enable a better understanding and evaluation of business prospects
Analyst
Community
A Win-Win proposition for all Stakeholders (2/2)
© 2012 WIPRO LTD | WWW.WIPRO.COM 28
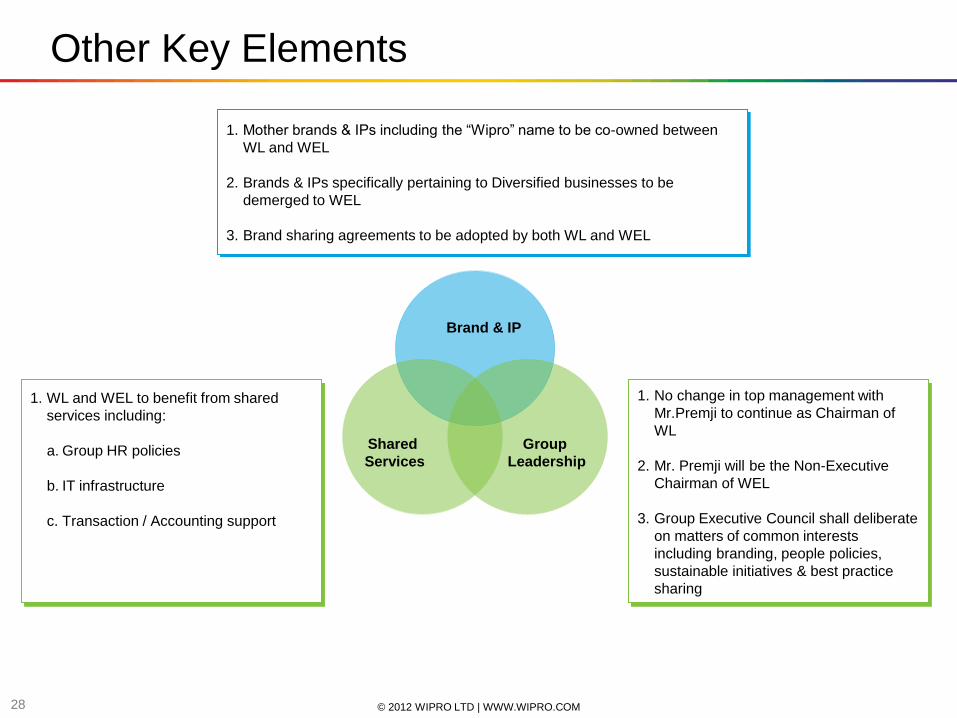
Other Key Elements
Brand & IP
Group
Leadership
Shared
Services
1. Mother brands & IPs including the “Wipro” name to be co-owned between
WL and WEL
2. Brands & IPs specifically pertaining to Diversified businesses to be
demerged to WEL
3. Brand sharing agreements to be adopted by both WL and WEL
1. No change in top management with
Mr.Premji to continue as Chairman of
WL
2. Mr. Premji will be the Non-Executive
Chairman of WEL
3. Group Executive Council shall deliberate
on matters of common interests
including branding, people policies,
sustainable initiatives & best practice
sharing
1. WL and WEL to benefit from shared
services including:
a. Group HR policies
b. IT infrastructure
c. Transaction / Accounting support
© 2012 WIPRO LTD | WWW.WIPRO.COM 29
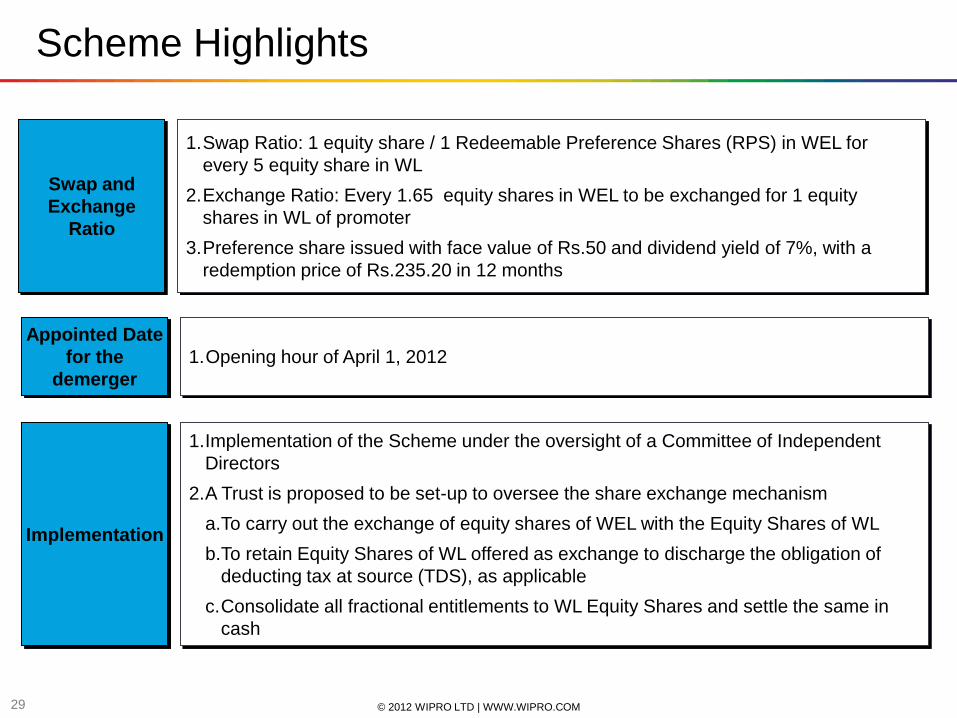
Scheme Highlights
1.Opening hour of April 1, 2012
Appointed Date
for the
demerger
1.Swap Ratio: 1 equity share / 1 Redeemable Preference Shares (RPS) in WEL for
every 5 equity share in WL
2.Exchange Ratio: Every 1.65 equity shares in WEL to be exchanged for 1 equity
shares in WL of promoter
3.Preference share issued with face value of Rs.50 and dividend yield of 7%, with a
redemption price of Rs.235.20 in 12 months
Swap and
Exchange
Ratio
1.Implementation of the Scheme under the oversight of a Committee of Independent
Directors
2.A Trust is proposed to be set-up to oversee the share exchange mechanism
a.To carry out the exchange of equity shares of WEL with the Equity Shares of WL
b.To retain Equity Shares of WL offered as exchange to discharge the obligation of
deducting tax at source (TDS), as applicable
c.Consolidate all fractional entitlements to WL Equity Shares and settle the same in
cash
Implementation
© 2012 WIPRO LTD | WWW.WIPRO.COM 30
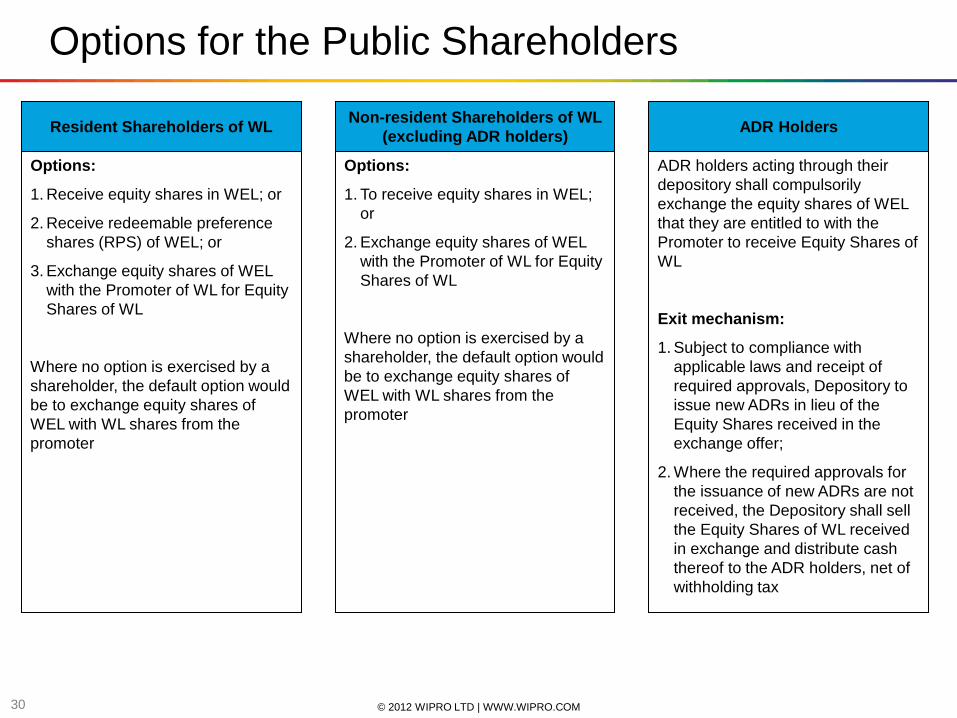
Options:
1. Receive equity shares in WEL; or
2. Receive redeemable preference
shares (RPS) of WEL; or
3. Exchange equity shares of WEL
with the Promoter of WL for Equity
Shares of WL
Where no option is exercised by a
shareholder, the default option would
be to exchange equity shares of
WEL with WL shares from the
promoter
Options:
1. To receive equity shares in WEL;
or
2. Exchange equity shares of WEL
with the Promoter of WL for Equity
Shares of WL
Where no option is exercised by a
shareholder, the default option would
be to exchange equity shares of
WEL with WL shares from the
promoter
ADR holders acting through their
depository shall compulsorily
exchange the equity shares of WEL
that they are entitled to with the
Promoter to receive Equity Shares of
WL
Exit mechanism:
1. Subject to compliance with
applicable laws and receipt of
required approvals, Depository to
issue new ADRs in lieu of the
Equity Shares received in the
exchange offer;
2. Where the required approvals for
the issuance of new ADRs are not
received, the Depository shall sell
the Equity Shares of WL received
in exchange and distribute cash
thereof to the ADR holders, net of
withholding tax
Options for the Public Shareholders
Resident Shareholders of WL Non-resident Shareholders of WL
(excluding ADR holders) ADR Holders
© 2012 WIPRO LTD | WWW.WIPRO.COM 31
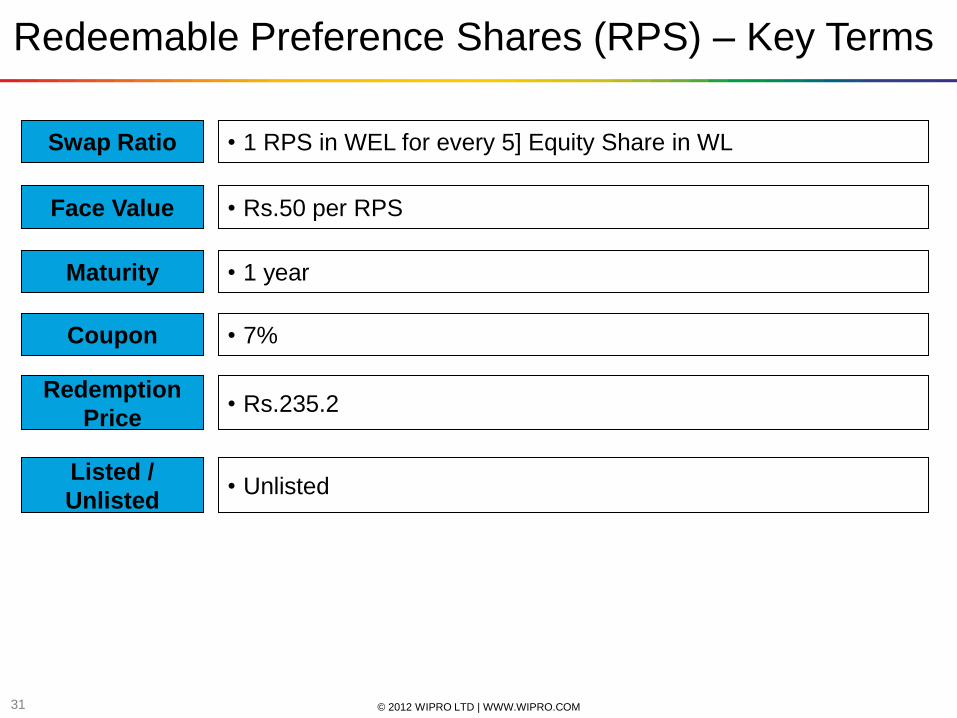
Redeemable Preference Shares (RPS) – Key Terms
Swap Ratio • 1 RPS in WEL for every 5] Equity Share in WL
Face Value • Rs.50 per RPS
Maturity • 1 year
Coupon • 7%
Redemption
Price • Rs.235.2
Listed /
Unlisted • Unlisted
© 2012 WIPRO LTD | WWW.WIPRO.COM 32
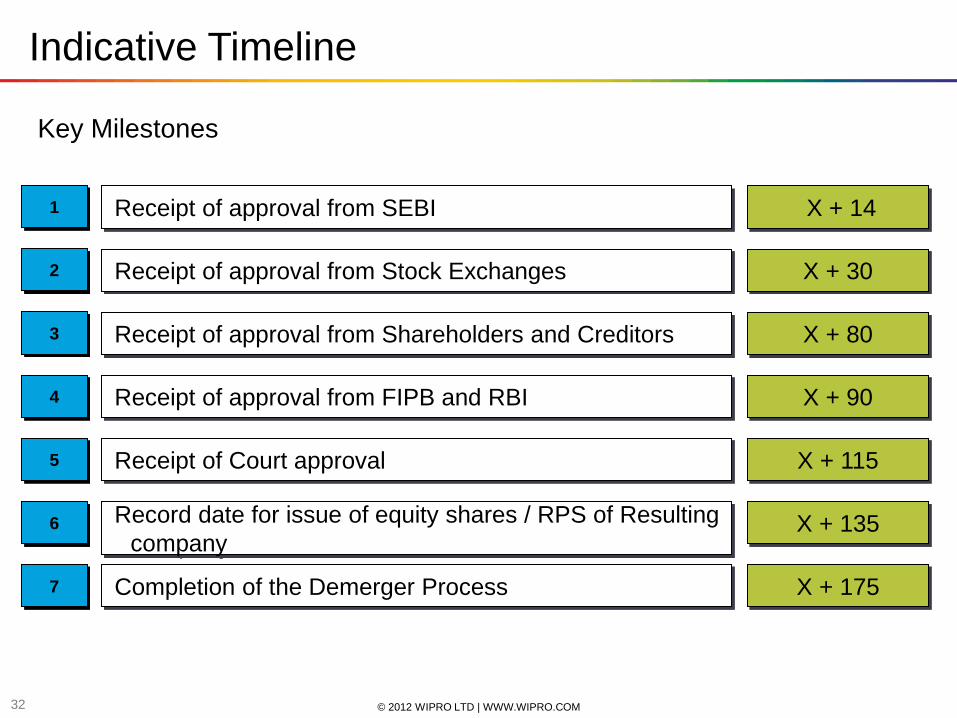
Indicative Timeline
X + 14 Receipt of approval from SEBI
X + 30 Receipt of approval from Stock Exchanges
X + 80 Receipt of approval from Shareholders and Creditors
X + 90 Receipt of approval from FIPB and RBI
X + 115 Receipt of Court approval
X + 135 Record date for issue of equity shares / RPS of Resulting
company
X + 175 Completion of the Demerger Process
1
2
3
4
5
6
7
Key Milestones
© 2012 WIPRO LTD | WWW.WIPRO.COM 33
33
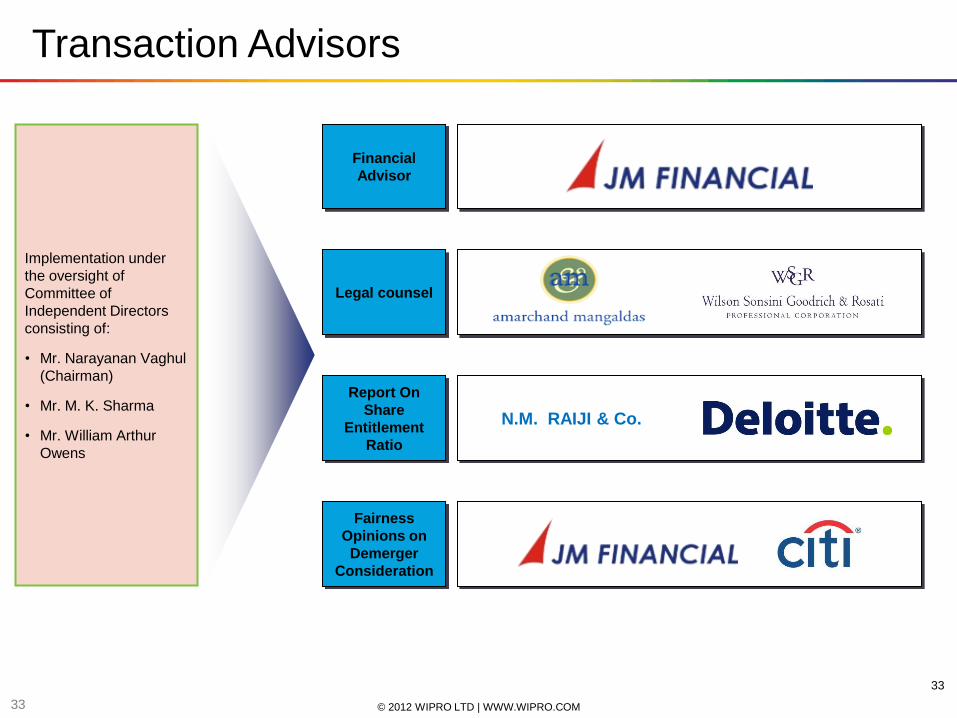
Transaction Advisors
Financial
Advisor
Fairness
Opinions on
Demerger
Consideration
Legal counsel
Report On
Share
Entitlement
Ratio
Implementation under
the oversight of
Committee of
Independent Directors
consisting of:
• Mr. Narayanan Vaghul
(Chairman)
• Mr. M. K. Sharma
• Mr. William Arthur
Owens
N.M. RAIJI & Co.

© 2012 WIPRO LTD | WWW.WIPRO.COM 34
Annexure - Key Highlights of IT and Other Businesses
© 2012 WIPRO LTD | WWW.WIPRO.COM 35
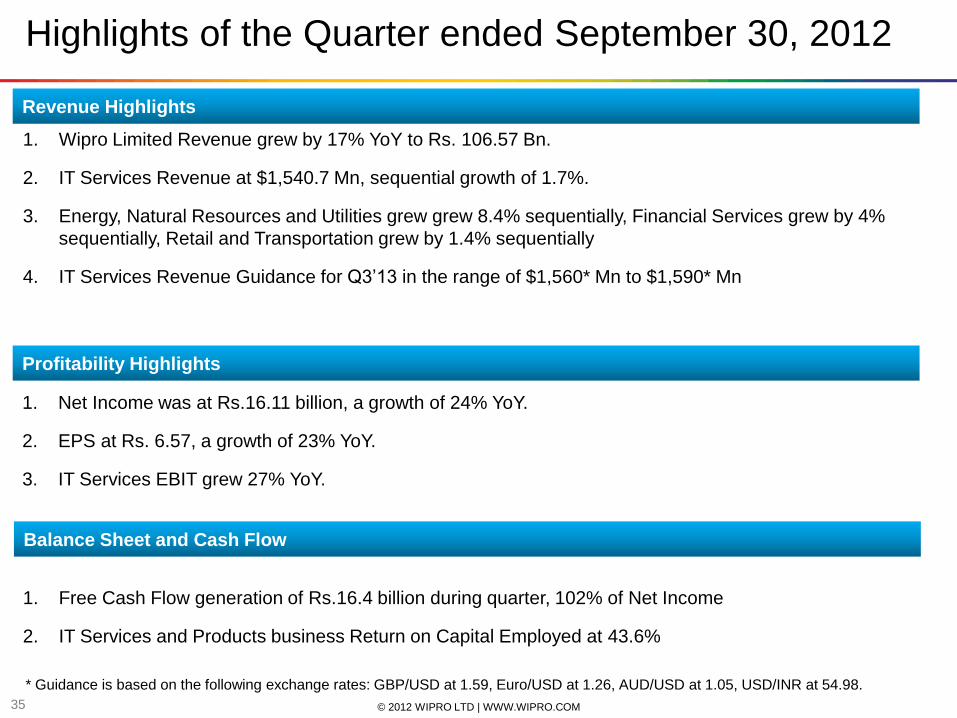
Highlights of the Quarter ended September 30, 2012
Revenue Highlights
1. Wipro Limited Revenue grew by 17% YoY to Rs. 106.57 Bn.
2. IT Services Revenue at $1,540.7 Mn, sequential growth of 1.7%.
3. Energy, Natural Resources and Utilities grew grew 8.4% sequentially, Financial Services grew by 4%
sequentially, Retail and Transportation grew by 1.4% sequentially
4. IT Services Revenue Guidance for Q3‟13 in the range of $1,560* Mn to $1,590* Mn
Profitability Highlights
1. Net Income was at Rs.16.11 billion, a growth of 24% YoY.
2. EPS at Rs. 6.57, a growth of 23% YoY.
3. IT Services EBIT grew 27% YoY.
Balance Sheet and Cash Flow
1. Free Cash Flow generation of Rs.16.4 billion during quarter, 102% of Net Income
2. IT Services and Products business Return on Capital Employed at 43.6%
* Guidance is based on the following exchange rates: GBP/USD at 1.59, Euro/USD at 1.26, AUD/USD at 1.05, USD/INR at 54.98.
© 2012 WIPRO LTD | WWW.WIPRO.COM 36
Non IT Business Highlights for the Quarter Ended
September 30, 2012
Wipro Consumer Care and Lighting (WCCL)
1. Revenue growth in Q2 of 26% YoY and EBIT growth of 29% YoY.
2. Santoor continues to be the the Number 1 Brand in the Combined South + West Regions with a market
share of 14%.
3. Aramusk the male Toiletry brand has introduced a wide range of Deodorants. Yardley UK business got
into our fold from 1st Aug 2012 and overall Yardley as a Brand grew well across all the Markets of India,
Middle East and UK.
4. In the International business growth was driven by Indonesia, Vietnam, China and Middle East. Our
brands Enchanteur and Romano continue to lead the growths.
Wipro Infrastructure Engineering (WIN)
1. Globally, WIN‟s pace of revenue grew on YOY basis despite softness in across geos and segments in
Q2. In India Implementation of recently announced reforms will help facilitate a gradual recovery but
much depends on the ground action
2. In our key growth market of Brazil, it is poised for high growth trajectory helped by the stimulus,
increasing local content from current levels. We are continuing to gain significant traction with all our
customers and are seen as the supplier of choice due to our competitiveness and global presence
© 2012 WIPRO LTD | WWW.WIPRO.COM 37
Thank You