Embed Size (px)
Citation preview
1
WIPRO LIMITED AND SUBSIDIARIES
CONDENSED CONSOLIDATED INTERIM FINANCIAL STATEMENTS UNDER IFRS AS OF AND FOR THE THREE AND NINE MONTHS ENDED DECEMBER 31, 2012
2
WIPRO LIMITED AND SUBSIDIARIES
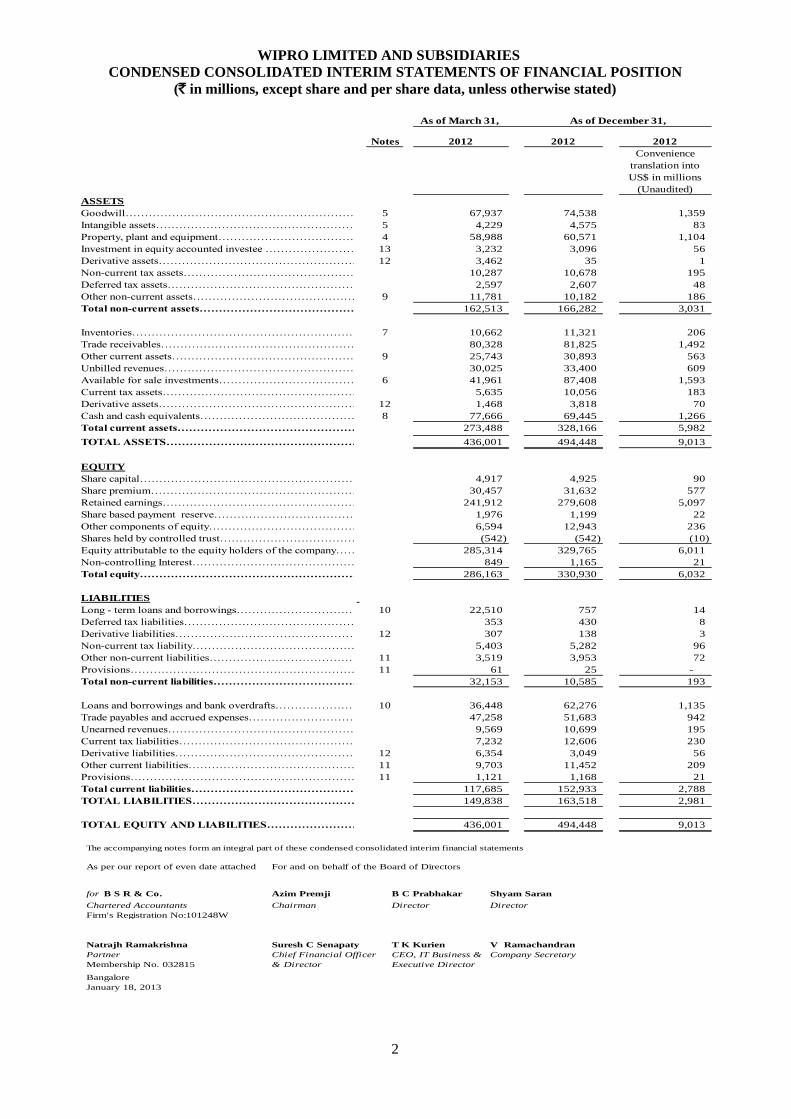
CONDENSED CONSOLIDATED INTERIM STATEMENTS OF FINANCIAL POSITION
(` in millions, except share and per share data, unless otherwise stated)
As of March 31,
Notes 2012 2012 2012
Convenience
translation into
US$ in millions
(Unaudited)
ASSETS
Goodwill…………………………………………………………………………………………………………………… 5 67,937 74,538 1,359
Intangible assets…………………………………………………………………………………………………………………… 5 4,229 4,575 83
Property, plant and equipment…………………………………………………………………………………………………………………… 4 58,988 60,571 1,104
Investment in equity accounted investee …………………………………………………………………………………………………………………… 13 3,232 3,096 56
Derivative assets…………………………………………………………………………………………………………………… 12 3,462 35 1
Non-current tax assets…………………………………………………………………………………………………………………… 10,287 10,678 195
Deferred tax assets…………………………………………………………………………………………………………………… 2,597 2,607 48
Other non-current assets…………………………………………………………………………………………………………………… 9 11,781 10,182 186
Total non-current assets…………………………………………………………………………………………………………………… 162,513 166,282 3,031
Inventories…………………………………………………………………………………………………………………… 7 10,662 11,321 206
Trade receivables…………………………………………………………………………………………………………………… 80,328 81,825 1,492
Other current assets…………………………………………………………………………………………………………………… 9 25,743 30,893 563
Unbilled revenues…………………………………………………………………………………………………………………… 30,025 33,400 609
Available for sale investments…………………………………………………………………………………………………………………… 6 41,961 87,408 1,593
Current tax assets…………………………………………………………………………………………………………………… 5,635 10,056 183
Derivative assets…………………………………………………………………………………………………………………… 12 1,468 3,818 70
Cash and cash equivalents…………………………………………………………………………………………………………………… 8 77,666 69,445 1,266
Total current assets…………………………………………………………………………………………………………………… 273,488 328,166 5,982
TOTAL ASSETS…………………………………………………………………………………………………………………… 436,001 494,448 9,013
EQUITY
Share capital…………………………………………………………………………………………………………………… 4,917 4,925 90
Share premium…………………………………………………………………………………………………………………… 30,457 31,632 577
Retained earnings…………………………………………………………………………………………………………………… 241,912 279,608 5,097
Share based payment reserve…………………………………………………………………………………………………………………… 1,976 1,199 22
Other components of equity…………………………………………………………………………………………………………………… 6,594 12,943 236
Shares held by controlled trust…………………………………………………………………………………………………………………… (542) (542) (10)
Equity attributable to the equity holders of the company…………………………………………………………………………………………………………………… 285,314 329,765 6,011
Non-controlling Interest…………………………………………………………………………………………………………………… 849 1,165 21
Total equity…………………………………………………………………………………………………………………… 286,163 330,930 6,032
LIABILITIES
Long - term loans and borrowings…………………………………………………………………………………………………………………… 10 22,510 757 14
Deferred tax liabilities…………………………………………………………………………………………………………………… 353 430 8
Derivative liabilities…………………………………………………………………………………………………………………… 12 307 138 3
Non-current tax liability…………………………………………………………………………………………………………………… 5,403 5,282 96
Other non-current liabilities…………………………………………………………………………………………………………………… 11 3,519 3,953 72
Provisions…………………………………………………………………………………………………………………… 11 61 25 -
Total non-current liabilities…………………………………………………………………………………………………………………… 32,153 10,585 193
Loans and borrowings and bank overdrafts…………………………………………………………………………………………………………………… 10 36,448 62,276 1,135
Trade payables and accrued expenses…………………………………………………………………………………………………………………… 47,258 51,683 942
Unearned revenues…………………………………………………………………………………………………………………… 9,569 10,699 195
Current tax liabilities…………………………………………………………………………………………………………………… 7,232 12,606 230
Derivative liabilities…………………………………………………………………………………………………………………… 12 6,354 3,049 56
Other current liabilities…………………………………………………………………………………………………………………… 11 9,703 11,452 209
Provisions…………………………………………………………………………………………………………………… 11 1,121 1,168 21
Total current liabilities…………………………………………………………………………………………………………………… 117,685 152,933 2,788
TOTAL LIABILITIES…………………………………………………………………………………………………………………… 149,838 163,518 2,981
TOTAL EQUITY AND LIABILITIES…………………………………………………………………………………………………………………… 436,001 494,448 9,013
As of December 31,
The accompanying notes form an integral part of these condensed consolidated interim financial statements
As per our report of even date attached For and on behalf of the Board of Directors
for B S R & Co. Azim Premji B C Prabhakar Shyam Saran
Chartered Accountants Chairman Director Director
Firm's Registration No:101248W
Natrajh Ramakrishna Suresh C Senapaty T K Kurien V Ramachandran
Partner Chief Financial Officer CEO, IT Business & Company Secretary
Membership No. 032815 & Director Executive Director
Bangalore
January 18, 2013
3
WIPRO LIMITED AND SUBSIDIARIES
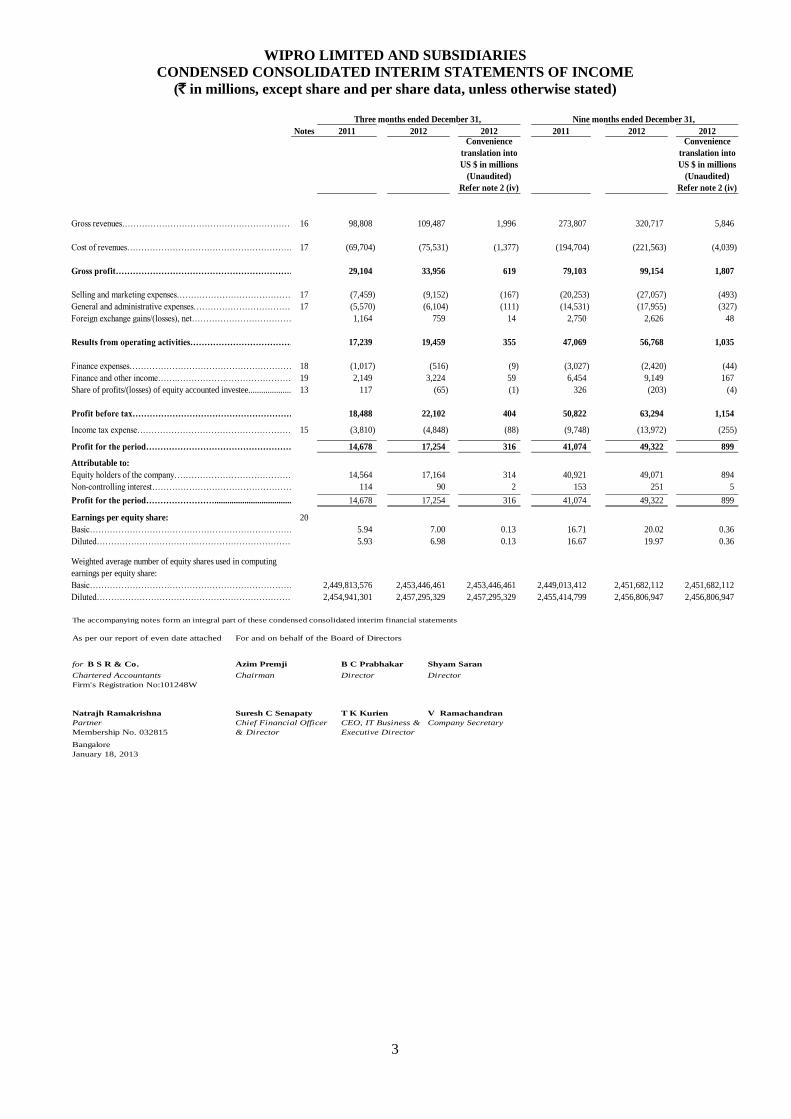
CONDENSED CONSOLIDATED INTERIM STATEMENTS OF INCOME
(` in millions, except share and per share data, unless otherwise stated)
Notes 2011 2012 2012 2011 2012 2012
Gross revenues……………………………………………………………….16 98,808 109,487 1,996 273,807 320,717 5,846
Cost of revenues…………………………………………………………….17 (69,704) (75,531) (1,377) (194,704) (221,563) (4,039)
Gross profit…………………………………………………………………. 29,104 33,956 619 79,103 99,154 1,807
Selling and marketing expenses…………………………………………………17 (7,459) (9,152) (167) (20,253) (27,057) (493)
General and administrative expenses…………………………………………..17 (5,570) (6,104) (111) (14,531) (17,955) (327)
Foreign exchange gains/(losses), net……………………………………………… 1,164 759 14 2,750 2,626 48
Results from operating activities………………………………………………………… 17,239 19,459 355 47,069 56,768 1,035
Finance expenses…………………………………………………….18 (1,017) (516) (9) (3,027) (2,420) (44)
Finance and other income…….…………………………………….19 2,149 3,224 59 6,454 9,149 167
Share of profits/(losses) of equity accounted investee..........................13 117 (65) (1) 326 (203) (4)
Profit before tax…………………………………………………………….. 18,488 22,102 404 50,822 63,294 1,154
Income tax expense……………………………………………………………15 (3,810) (4,848) (88) (9,748) (13,972) (255)
Profit for the period………………………………………………………………………. 14,678 17,254 316 41,074 49,322 899
Attributable to:
Equity holders of the company………………………………………………………………. 14,564 17,164 314 40,921 49,071 894
Non-controlling interest……………………………………………………………………. 114 90 2 153 251 5
Profit for the period…………………….................................... 14,678 17,254 316 41,074 49,322 899
Earnings per equity share: 20
Basic……………………………………………………………………………………… 5.94 7.00 0.13 16.71 20.02 0.36
Diluted……………………………………………………………………………………. 5.93 6.98 0.13 16.67 19.97 0.36
Weighted average number of equity shares used in computing
earnings per equity share:
Basic………………………………………………………………………………….. 2,449,813,576 2,453,446,461 2,453,446,461 2,449,013,412 2,451,682,112 2,451,682,112
Diluted……………………………………………………………………………………. 2,454,941,301 2,457,295,329 2,457,295,329 2,455,414,799 2,456,806,947 2,456,806,947
Convenience
translation into
US $ in millions
(Unaudited)
Refer note 2 (iv)
Convenience
translation into
US $ in millions
(Unaudited)
Refer note 2 (iv)
Three months ended December 31, Nine months ended December 31,
The accompanying notes form an integral part of these condensed consolidated interim financial statements
As per our report of even date attached For and on behalf of the Board of Directors
for B S R & Co. Azim Premji B C Prabhakar Shyam Saran
Chartered Accountants Chairman Director Director
Firm's Registration No:101248W
Natrajh Ramakrishna Suresh C Senapaty T K Kurien V Ramachandran
Partner Chief Financial Officer CEO, IT Business & Company Secretary
Membership No. 032815 & Director Executive Director
Bangalore
January 18, 2013
4
WIPRO LIMITED AND SUBSIDIARIES
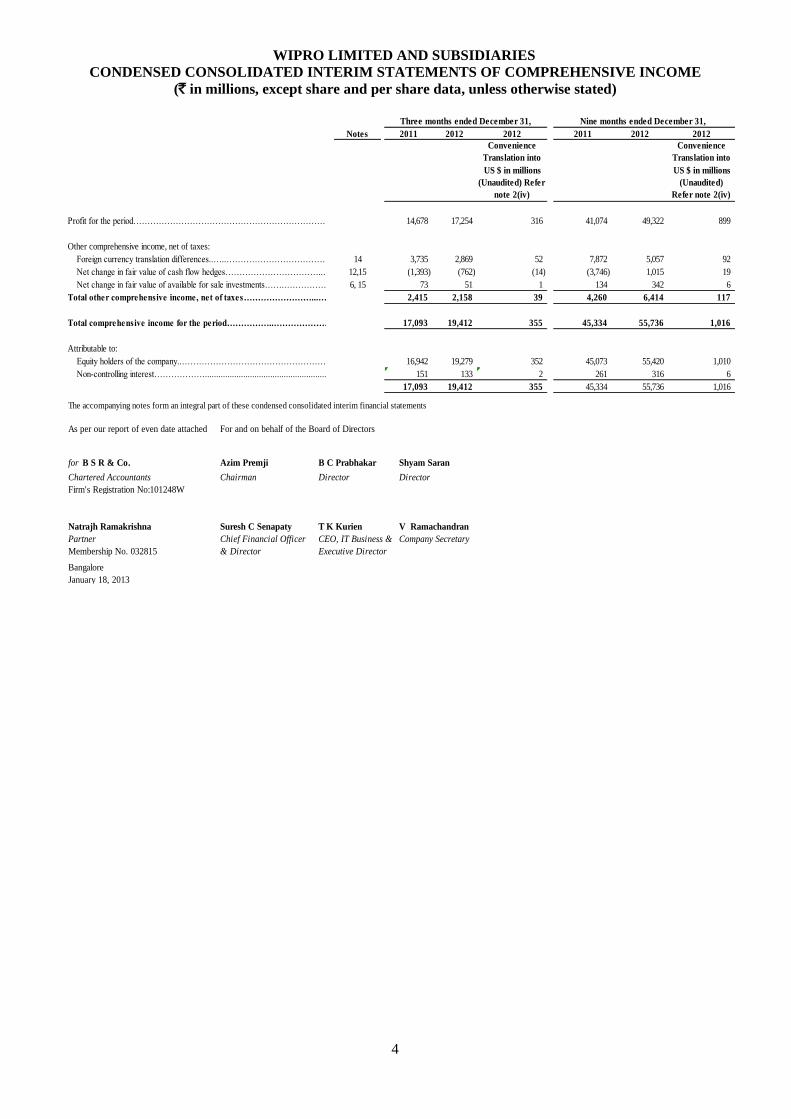
CONDENSED CONSOLIDATED INTERIM STATEMENTS OF COMPREHENSIVE INCOME
(` in millions, except share and per share data, unless otherwise stated)
Notes 2011 2012 2012 2011 2012 2012
Convenience
Translation into
Convenience
Translation into
US $ in millions
(Unaudited) Refer
note 2(iv)
US $ in millions
(Unaudited)
Refer note 2(iv)
Profit for the period…………………………………………………………………………………………. 14,678 17,254 316 41,074 49,322 899
Other comprehensive income, net of taxes:
Foreign currency translation differences..…..…………………………………………. 14 3,735 2,869 52 7,872 5,057 92
Net change in fair value of cash flow hedges……………………………..…………….. 12,15 (1,393) (762) (14) (3,746) 1,015 19
Net change in fair value of available for sale investments…….………………………….. 6, 15 73 51 1 134 342 6
Total other comprehensive income, net of taxes……………………...……… 2,415 2,158 39 4,260 6,414 117
Total comprehensive income for the period……………..…………………………………………………… 17,093 19,412 355 45,334 55,736 1,016
Attributable to:
Equity holders of the company..…………………………………………………………. 16,942 19,279 352 45,073 55,420 1,010
Non-controlling interest………………..................................................................... 151 133 2 261 316 6
17,093 19,412 355 45,334 55,736 1,016
Three months ended December 31, Nine months ended December 31,
The accompanying notes form an integral part of these condensed consolidated interim financial statements
As per our report of even date attached For and on behalf of the Board of Directors
for B S R & Co. Azim Premji B C Prabhakar Shyam Saran
Chartered Accountants Chairman Director Director
Firm's Registration No:101248W
Natrajh Ramakrishna Suresh C Senapaty T K Kurien V Ramachandran
Partner Chief Financial Officer CEO, IT Business & Company Secretary
Membership No. 032815 & Director Executive Director
Bangalore
January 18, 2013
5
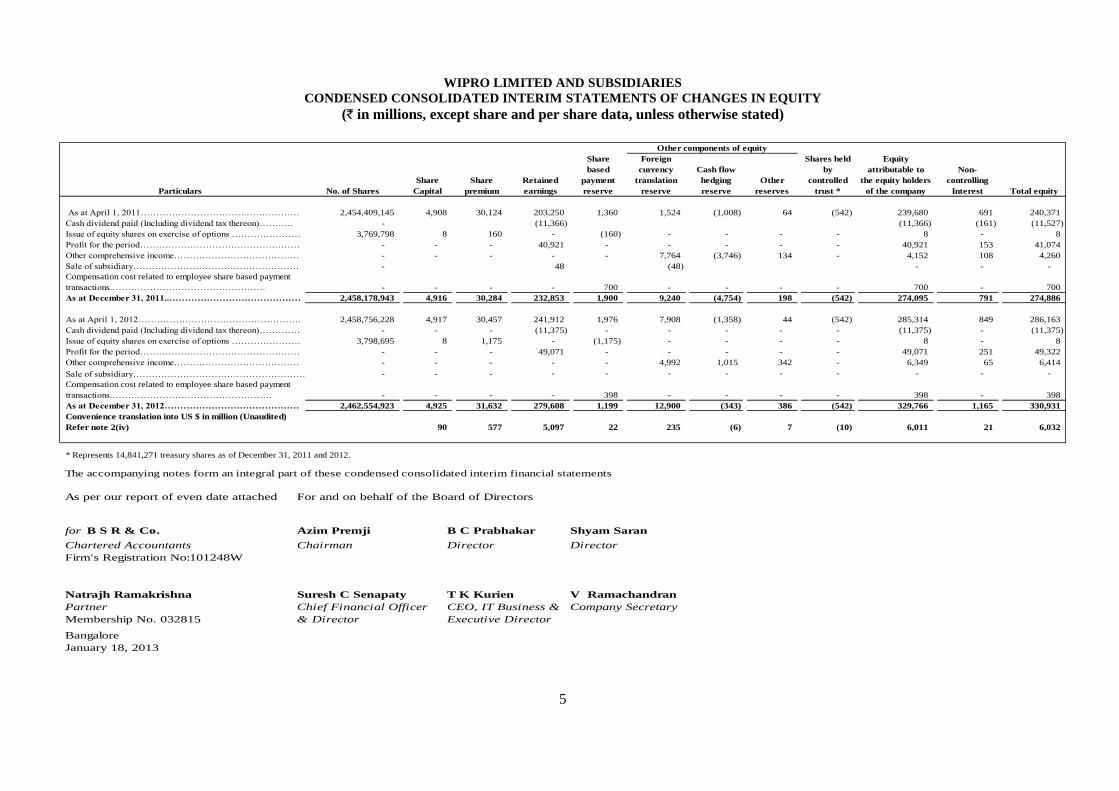
WIPRO LIMITED AND SUBSIDIARIES
CONDENSED CONSOLIDATED INTERIM STATEMENTS OF CHANGES IN EQUITY
(` in millions, except share and per share data, unless otherwise stated)
Particulars No. of Shares
Share
Capital
Share
premium
Retained
earnings
Share
based
payment
reserve
Foreign
currency
translation
reserve
Cash flow
hedging
reserve
Other
reserves
Shares held
by
controlled
trust *
Non-
controlling
Interest Total equity
As at April 1, 2011…………………………….…………………………………………….. 2,454,409,145 4,908 30,124 203,250 1,360 1,524 (1,008) 64 (542) 239,680 691 240,371
Cash dividend paid (Including dividend tax thereon)……….. - (11,366) (11,366) (161) (11,527)
Issue of equity shares on exercise of options ……………………………. 3,769,798 8 160 - (160) - - - - 8 - 8
Profit for the period……………………………………………………………………….. - - - 40,921 - - - - - 40,921 153 41,074
Other comprehensive income…………………………………………………….. - - - - - 7,764 (3,746) 134 - 4,152 108 4,260
Sale of subsidiary…………………………………………………………………………… - 48 (48) - - -
Compensation cost related to employee share based payment
transactions.…………………………………………. - - - - 700 - - - - 700 - 700
As at December 31, 2011..………………………………………… 2,458,178,943 4,916 30,284 232,853 1,900 9,240 (4,754) 198 (542) 274,095 791 274,886
As at April 1, 2012…………………………………………………………………………….. 2,458,756,228 4,917 30,457 241,912 1,976 7,908 (1,358) 44 (542) 285,314 849 286,163
Cash dividend paid (Including dividend tax thereon)………………… - - - (11,375) - - - - - (11,375) - (11,375)
Issue of equity shares on exercise of options ……………………………. 3,798,695 8 1,175 - (1,175) - - - - 8 - 8
Profit for the period……………………………………………………………………….. - - - 49,071 - - - - - 49,071 251 49,322
Other comprehensive income…………………………………………………….. - - - - - 4,992 1,015 342 - 6,349 65 6,414
Sale of subsidiary……………………………………………………………………………- - - - - - - - - - - -
Compensation cost related to employee share based payment
transactions.…………………………………………… - - - - 398 - - - - 398 - 398
As at December 31, 2012………………………………………… 2,462,554,923 4,925 31,632 279,608 1,199 12,900 (343) 386 (542) 329,766 1,165 330,931
Convenience translation into US $ in million (Unaudited)
Refer note 2(iv) 90 577 5,097 22 235 (6) 7 (10) 6,011 21 6,032
* Represents 14,841,271 treasury shares as of December 31, 2011 and 2012.
Other components of equity
Equity
attributable to
the equity holders
of the company
The accompanying notes form an integral part of these condensed consolidated interim financial statements
As per our report of even date attached For and on behalf of the Board of Directors
for B S R & Co. Azim Premji B C Prabhakar Shyam Saran
Chartered Accountants Chairman Director Director
Firm's Registration No:101248W
Natrajh Ramakrishna Suresh C Senapaty T K Kurien V Ramachandran
Partner Chief Financial Officer CEO, IT Business & Company Secretary
Membership No. 032815 & Director Executive Director
Bangalore
January 18, 2013
6
WIPRO LIMITED AND SUBSIDIARIES
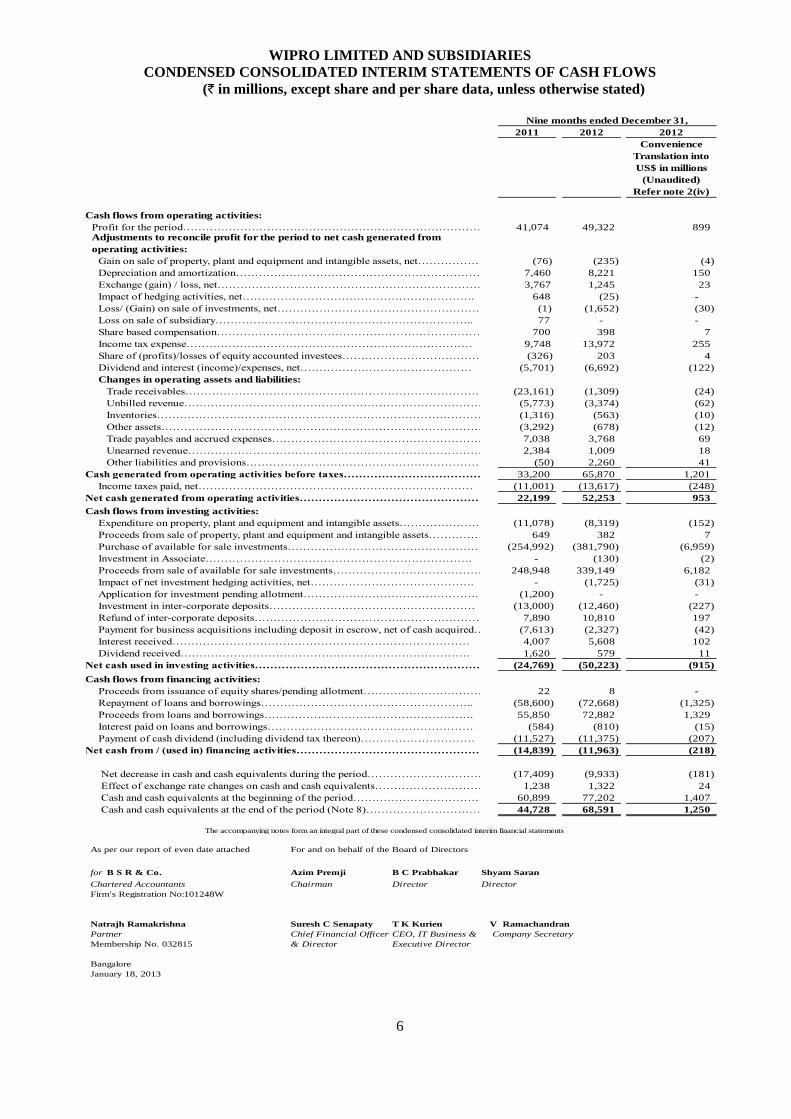
CONDENSED CONSOLIDATED INTERIM STATEMENTS OF CASH FLOWS
(` in millions, except share and per share data, unless otherwise stated)
2011 2012 2012
Convenience
Translation into
US$ in millions
(Unaudited)
Refer note 2(iv)
Cash flows from operating activities:
Profit for the period………………………………………………………………………………………… 41,074 49,322 899 Adjustments to reconcile profit for the period to net cash generated from
operating activities:
Gain on sale of property, plant and equipment and intangible assets, net………………………………………………………………………………………… (76) (235) (4)
Depreciation and amortization………………………………………………………………………………………… 7,460 8,221 150
Exchange (gain) / loss, net………………………………………………………………………………………… 3,767 1,245 23
Impact of hedging activities, net……………………………………………………. 648 (25) -
Loss/ (Gain) on sale of investments, net……………………………………………………………… (1) (1,652) (30)
Loss on sale of subsidiary………………………………………………………….. 77 - -
Share based compensation………………………………………………………………………………………… 700 398 7
Income tax expense………………………………………………………………… 9,748 13,972 255
Share of (profits)/losses of equity accounted investees………………………………………………………………………………………… (326) 203 4
Dividend and interest (income)/expenses, net……………………………………… (5,701) (6,692) (122)
Changes in operating assets and liabilities:
Trade receivables………………………………………………………………………………………… (23,161) (1,309) (24)
Unbilled revenue………………………………………………………………………………………… (5,773) (3,374) (62)
Inventories………………………………………………………………………………………… (1,316) (563) (10)
Other assets………………………………………………………………………………………… (3,292) (678) (12)
Trade payables and accrued expenses………………………………………………………………………………………… 7,038 3,768 69
Unearned revenue………………………………………………………………………………………… 2,384 1,009 18
Other liabilities and provisions………………………………………………………………………………………… (50) 2,260 41
Cash generated from operating activities before taxes………………………………………………………………………………………… 33,200 65,870 1,201
Income taxes paid, net……………………………………………………………… (11,001) (13,617) (248)
Net cash generated from operating activities………………………………………………………………………………. 22,199 52,253 953
Cash flows from investing activities:
Expenditure on property, plant and equipment and intangible assets………………………………………………………………………………………… (11,078) (8,319) (152)
Proceeds from sale of property, plant and equipment and intangible assets………………………………………………………………………………………… 649 382 7
Purchase of available for sale investments………………………………………………………………………………………… (254,992) (381,790) (6,959)
Investment in Associate……………………………………………………………. - (130) (2)
Proceeds from sale of available for sale investments………………………………………………………………………………………… 248,948 339,149 6,182
Impact of net investment hedging activities, net……………………………………. - (1,725) (31)
Application for investment pending allotment………………………………………. (1,200) - -
Investment in inter-corporate deposits……………………………………………… (13,000) (12,460) (227)
Refund of inter-corporate deposits………………………………………………………………………………………… 7,890 10,810 197
Payment for business acquisitions including deposit in escrow, net of cash acquired………………………………………………………………………………………… (7,613) (2,327) (42)
Interest received…………………………………………………………………… 4,007 5,608 102
Dividend received…………………………………………………………………. 1,620 579 11
Net cash used in investing activities………………………………………………………………………………………… (24,769) (50,223) (915)
Cash flows from financing activities:
Proceeds from issuance of equity shares/pending allotment………………………………………………………………………………………… 22 8 -
Repayment of loans and borrowings……………………………………………….. (58,600) (72,668) (1,325)
Proceeds from loans and borrowings………………………………………………. 55,850 72,882 1,329
Interest paid on loans and borrowings……………………………………………… (584) (810) (15)
Payment of cash dividend (including dividend tax thereon)………………………… (11,527) (11,375) (207)
Net cash from / (used in) financing activities………………………………………………………………………………………… (14,839) (11,963) (218)
Net decrease in cash and cash equivalents during the period………………………………………………………………………………………… (17,409) (9,933) (181)
Effect of exchange rate changes on cash and cash equivalents………………………………………………………………………………………… 1,238 1,322 24
Cash and cash equivalents at the beginning of the period………………………………………………………………………………………… 60,899 77,202 1,407
Cash and cash equivalents at the end of the period (Note 8)………………………………………………………………………………………… 44,728 68,591 1,250
Nine months ended December 31,
As per our report of even date attached
for B S R & Co. Azim Premji B C Prabhakar Shyam Saran
Chartered Accountants Chairman Director Director
Firm's Registration No:101248W
Natrajh Ramakrishna Suresh C Senapaty T K Kurien V Ramachandran
Partner Chief Financial Officer CEO, IT Business & Company Secretary
Membership No. 032815 & Director Executive Director
Bangalore
January 18, 2013
The accompanying notes form an integral part of these condensed consolidated interim financial statements
For and on behalf of the Board of Directors
7
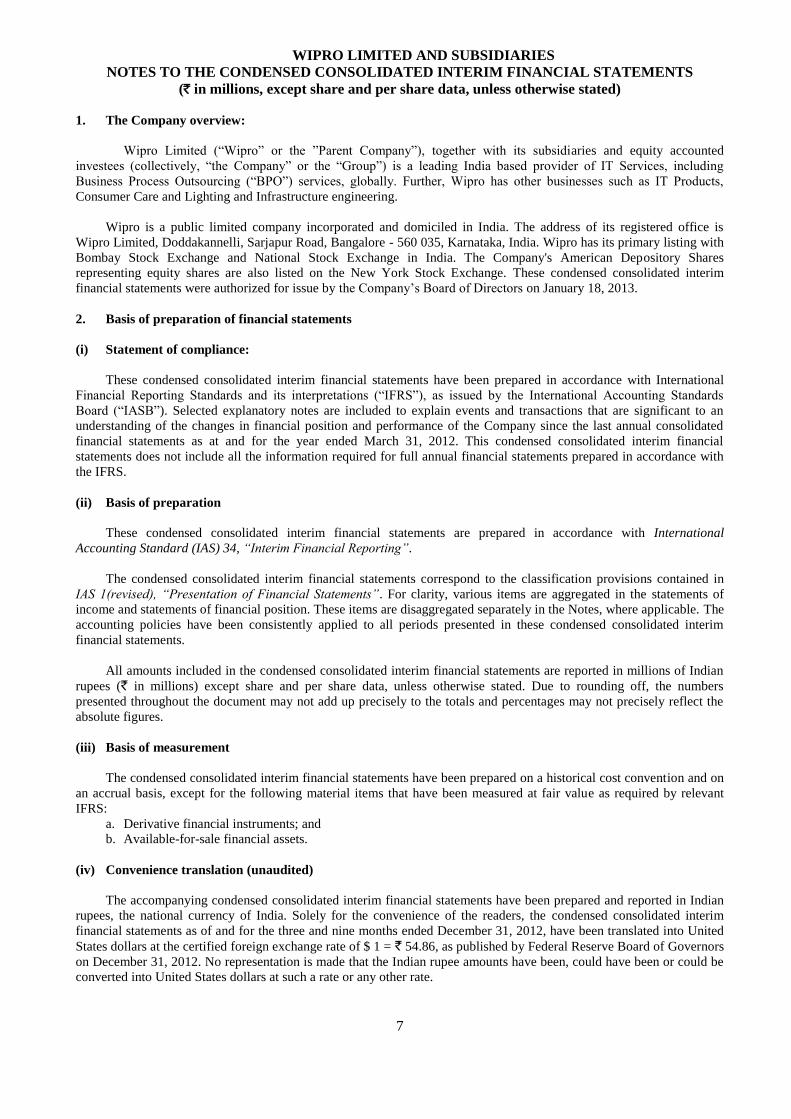
WIPRO LIMITED AND SUBSIDIARIES
NOTES TO THE CONDENSED CONSOLIDATED INTERIM FINANCIAL STATEMENTS
(` in millions, except share and per share data, unless otherwise stated)
1. The Company overview:
Wipro Limited (“Wipro” or the ”Parent Company”), together with its subsidiaries and equity accounted
investees (collectively, “the Company” or the “Group”) is a leading India based provider of IT Services, including
Business Process Outsourcing (“BPO”) services, globally. Further, Wipro has other businesses such as IT Products,
Consumer Care and Lighting and Infrastructure engineering.
Wipro is a public limited company incorporated and domiciled in India. The address of its registered office is
Wipro Limited, Doddakannelli, Sarjapur Road, Bangalore - 560 035, Karnataka, India. Wipro has its primary listing with
Bombay Stock Exchange and National Stock Exchange in India. The Company's American Depository Shares
representing equity shares are also listed on the New York Stock Exchange. These condensed consolidated interim
financial statements were authorized for issue by the Company‟s Board of Directors on January 18, 2013.
2. Basis of preparation of financial statements
(i) Statement of compliance:
These condensed consolidated interim financial statements have been prepared in accordance with International
Financial Reporting Standards and its interpretations (“IFRS”), as issued by the International Accounting Standards
Board (“IASB”). Selected explanatory notes are included to explain events and transactions that are significant to an
understanding of the changes in financial position and performance of the Company since the last annual consolidated
financial statements as at and for the year ended March 31, 2012. This condensed consolidated interim financial
statements does not include all the information required for full annual financial statements prepared in accordance with
the IFRS.
(ii) Basis of preparation
These condensed consolidated interim financial statements are prepared in accordance with International
Accounting Standard (IAS) 34, ―Interim Financial Reporting‖.
The condensed consolidated interim financial statements correspond to the classification provisions contained in
IAS 1(revised), ―Presentation of Financial Statements‖. For clarity, various items are aggregated in the statements of
income and statements of financial position. These items are disaggregated separately in the Notes, where applicable. The
accounting policies have been consistently applied to all periods presented in these condensed consolidated interim
financial statements.
All amounts included in the condensed consolidated interim financial statements are reported in millions of Indian
rupees (` in millions) except share and per share data, unless otherwise stated. Due to rounding off, the numbers
presented throughout the document may not add up precisely to the totals and percentages may not precisely reflect the
absolute figures.
(iii) Basis of measurement
The condensed consolidated interim financial statements have been prepared on a historical cost convention and on
an accrual basis, except for the following material items that have been measured at fair value as required by relevant
IFRS:
a. Derivative financial instruments; and
b. Available-for-sale financial assets.
(iv) Convenience translation (unaudited)
The accompanying condensed consolidated interim financial statements have been prepared and reported in Indian
rupees, the national currency of India. Solely for the convenience of the readers, the condensed consolidated interim
financial statements as of and for the three and nine months ended December 31, 2012, have been translated into United
States dollars at the certified foreign exchange rate of $ 1 = ` 54.86, as published by Federal Reserve Board of Governors
on December 31, 2012. No representation is made that the Indian rupee amounts have been, could have been or could be
converted into United States dollars at such a rate or any other rate.
8
(v) Use of estimates and judgment
The preparation of the condensed consolidated interim financial statements in conformity with IFRSs requires
management to make judgments, estimates and assumptions that affect the application of accounting policies and the
reported amounts of assets, liabilities, income and expenses. Actual results may differ from those estimates.
Estimates and underlying assumptions are reviewed on a periodic basis. Revisions to accounting estimates are
recognized in the period in which the estimates are revised and in any future periods affected. In particular, information
about significant areas of estimation, uncertainty and critical judgments in applying accounting policies that have the
most significant effect on the amounts recognized in the condensed consolidated interim financial statements is included
in the following notes:
a) Revenue recognition: The Company uses the percentage of completion method using the input (cost expended)
method to measure progress towards completion in respect of fixed price contracts. Percentage of completion
method accounting relies on estimates of total expected contract revenue and costs. This method is followed
when reasonably dependable estimates of the revenues and costs applicable to various elements of the contract
can be made. Key factors that are reviewed in estimating the future costs to complete include estimates of future
labour costs and productivity efficiencies. Because the financial reporting of these contracts depends on
estimates that are assessed continually during the term of these contracts, recognized revenue and profit are
subject to revisions as the contract progresses to completion. When estimates indicate that a loss will be
incurred, the loss is provided for in the period in which the loss becomes probable. To date, the Company has
not incurred a material loss on any fixed-price and fixed-timeframe contract.
b) Goodwill: Goodwill is tested for impairment at least annually and when events occur or changes in
circumstances indicate that the recoverable amount of the cash generating unit is less than its carrying value.
The recoverable amount of cash generating units is determined based on higher of value-in-use and fair value
less cost to sell. The calculation involves use of significant estimates and assumptions which includes revenue
growth rates and operating margins used to calculate projected future cash flows, risk-adjusted discount rate,
future economic and market conditions.
c) Income taxes: The major tax jurisdictions for the Company are India and the United States of America.
Significant judgments are involved in determining the provision for income taxes including judgment on
whether tax positions are probable of being sustained in tax assessments. A tax assessment can involve complex
issues, which can only be resolved over extended time periods. Though, the Company considers all these issues
in estimating income taxes, there could be an unfavorable resolution of such issues.
d) Deferred taxes: Deferred tax is recorded on temporary differences between the tax bases of assets and liabilities
and their carrying amounts, at the rates that have been enacted or substantively enacted. The ultimate realization
of deferred tax assets is dependent upon the generation of future taxable profits during the periods in which
those temporary differences and tax loss carry-forwards become deductible. The Company considers the
expected reversal of deferred tax liabilities and projected future taxable income in making this assessment. The
amount of the deferred income tax assets considered realizable, however, could be reduced in the near term if
estimates of future taxable income during the carry-forward period are reduced.
e) Business combination: In accounting for business combinations, judgment is required in identifying whether an
identifiable intangible asset is to be recorded separately from goodwill. Additionally, estimating the acquisition
date fair value of the identifiable assets acquired and liabilities assumed involves management judgment. These
measurements are based on information available at the acquisition date and are based on expectations and
assumptions that have been deemed reasonable by management. Changes in these judgments, estimates, and
assumptions can materially affect the results of operations.
f) Other estimates: The preparation of financial statements involves estimates and assumptions that affect the
reported amount of assets, liabilities, disclosure of contingent liabilities at the date of financial statements and
the reported amount of revenues and expenses for the reporting period. Specifically, the Company estimates the
uncollectability of accounts receivable by analyzing historical payment patterns, customer concentrations,
customer credit-worthiness and current economic trends. If the financial condition of a customer deteriorates,
additional allowances may be required. Similarly, the Company provides for inventory obsolescence, excess
inventory and inventories with carrying values in excess of net realizable value based on assessment of the
future demand, market conditions and specific inventory management initiatives. If market conditions and actual
demands are less favorable than the Company‟s estimates, additional inventory provisions may be required. In
all cases inventory is carried at the lower of historical cost and net realizable value. The stock compensation
expense is determined based on the Company‟s estimate of equity instruments that will eventually vest.
9
3. Significant accounting policies
Please refer to the Company‟s Annual Report for the year ended March 31, 2012 for a discussion of the
Company‟s critical accounting policies.
New Accounting standards adopted by the Company:
The Company adopted an amendment to IFRS 7 ―Disclosures – Transfers of financial assets‖ („IFRS 7‟)
effective April 1, 2012. The purpose of the amendment is to enhance the existing disclosures in IFRS 7 when an asset is
transferred but is not derecognized and introduce new disclosures for assets that are derecognized but the entity continues
to have a continuing exposure to the asset after the sale. Adoption of amendment to IFRS 7 did not have a material effect
on these condensed consolidated interim financial statements.
New Accounting standards not yet adopted by the Company:
In December, 2011, the IASB issued an amendment to IFRS 7 ―Disclosures – offsetting financial assets and
financial liabilities‖. The amended standard requires additional disclosures where financial assets and financial liabilities
are offset in the balance sheet. These disclosures would provide users with information that is useful in (a) evaluating the
effect or potential effect of netting arrangements on an entity‟s financial position and (b) analyzing and comparing
financial statements prepared in accordance with IFRSs and U.S. GAAP. The amendment is effective retrospectively for
fiscal years beginning on or after January 1, 2013. Earlier application is permitted. The Company is evaluating the
impact, these amendments will have on the Company‟s condensed consolidated interim financial statements.
In November 2009, the IASB issued the chapter of IFRS 9 ―Financial Instruments relating to the classification
and measurement of financial assets‖. The new standard represents the first phase of a three-phase project to replace IAS
39 ―Financial Instruments: Recognition and Measurement‖ (IAS 39) with IFRS 9 Financial Instruments (IFRS 9). IFRS
9 uses a single approach to determine whether a financial asset is measured at amortized cost or fair value, replacing the
many different rules in IAS 39. The approach in IFRS 9 is based on how an entity manages its financial assets (its
business model) and the contractual cash flow characteristics of the financial assets. In October 2010, the IASB added the
requirement relating to classification and measurement of financial liabilities to IFRS 9. Under the amendment, an entity
measuring its financial liability at fair value, can present the amount of fair value change in the liability attributable to
change in the liabilities credit risk in other comprehensive income. Further the IASB also decided to carry-forward
unchanged from IAS 39 requirements relating to de-recognition of financial assets and financial liabilities. IFRS 9 is
effective for fiscal years beginning on or after January 1, 2015. Earlier application is permitted. The Company is
evaluating the impact, these amendments will have on the Company‟s condensed consolidated interim financial
statements.
In May 2011, the IASB issued IFRS 10‖ Consolidated Financial Statements‖. The new standard establishes
principles for the presentation and preparation of consolidated financial statements when an entity controls one or more
other entities. IFRS 10 replaces the consolidation requirements in SIC-12 ―Consolidation—Special Purpose Entities‖ and
IAS 27 ―Consolidated and Separate Financial Statements‖. IFRS 10 builds on existing principles by identifying the
concept of control as the determining factor in whether an entity should be included within the consolidated financial
statements of the parent company. The standard provides additional guidance to assist in the determination of control
where this is difficult to assess. IFRS 10 is effective for fiscal years beginning on or after January 1, 2013. Earlier
application is permitted. The Company is evaluating the impact, these amendments will have on the Company‟s
condensed consolidated interim financial statements.
In May 2011, the IASB issued IFRS 13 ―Fair Value Measurement‖. The new standard defines fair value, sets
out in a single IFRS a framework for measuring fair value and requires disclosures about fair value measurements. IFRS
13 applies when other IFRSs require or permit fair value measurements. It does not introduce any new requirements to
measure an asset or a liability at fair value or change what is measured at fair value in IFRSs or address how to present
changes in fair value. IFRS 13 is effective for fiscal years beginning on or after January 1, 2013. Early application is
permitted. The Company is evaluating the impact, these amendments will have on the Company‟s condensed
consolidated interim financial statements.
In June 2011, the IASB issued Amendment to IAS 1 ―Presentation of Financial Statements‖ that will improve
and align the presentation of items of other comprehensive income (OCI) in financial statements prepared in accordance
with International Financial Reporting Standards (IFRSs). The amendments require companies preparing financial
statements in accordance with IFRSs to group together items within OCI that may be reclassified to the profit or loss
section of the income statement. The amendments will also reaffirm existing requirements that items in OCI and profit or
loss should be presented as either a single statement or two consecutive statements. This amendment is effective for fiscal
years beginning on or after July 1, 2012. Earlier adoption is permitted. The Company is evaluating the impact, these
amendments will have on the Company‟s condensed consolidated interim financial statements.
10
In June 2011, the IASB issued IAS 19 (Amended) ―Employee Benefits‖. The new standard has eliminated an
option to defer the recognition of gains and losses through re-measurements and requires such gain or loss to be
recognized through other comprehensive income in the year of occurrence to reduce volatility. The amended standard
requires immediate recognition of effects of any plan amendments. Further it also requires return on assets in profit or
loss to be restricted to government bond yields or corporate bond yields, considered for valuation of Projected Benefit
Obligation, irrespective of actual portfolio allocations. The actual return from the portfolio in excess of such yields is
recognized through Other Comprehensive Income. The amendment is effective retrospectively for fiscal years beginning
on or after January 1, 2013. Earlier adoption is permitted. The Company is evaluating the impact, these amendments will
have on the Company‟s condensed consolidated interim financial statements.
In December, 2011, the IASB issued an amendment to IAS 32 ―Offsetting financial assets and financial
liabilities‖. The purpose of the amendment is to clarify some of the requirements for offsetting financial assets and
financial liabilities on the statements of financial position. This includes clarifying the meaning of “currently has a
legally enforceable right to set-off” and also the application of the IAS 32 offsetting criteria to settlement systems (such
as central clearing house systems) which apply gross settlement mechanisms that are not simultaneous. The amendment
is effective retrospectively for fiscal years beginning on or after January 1, 2014. Earlier application is permitted. The
Company is evaluating the impact these amendments will have on the Company‟s condensed consolidated interim
financial statements
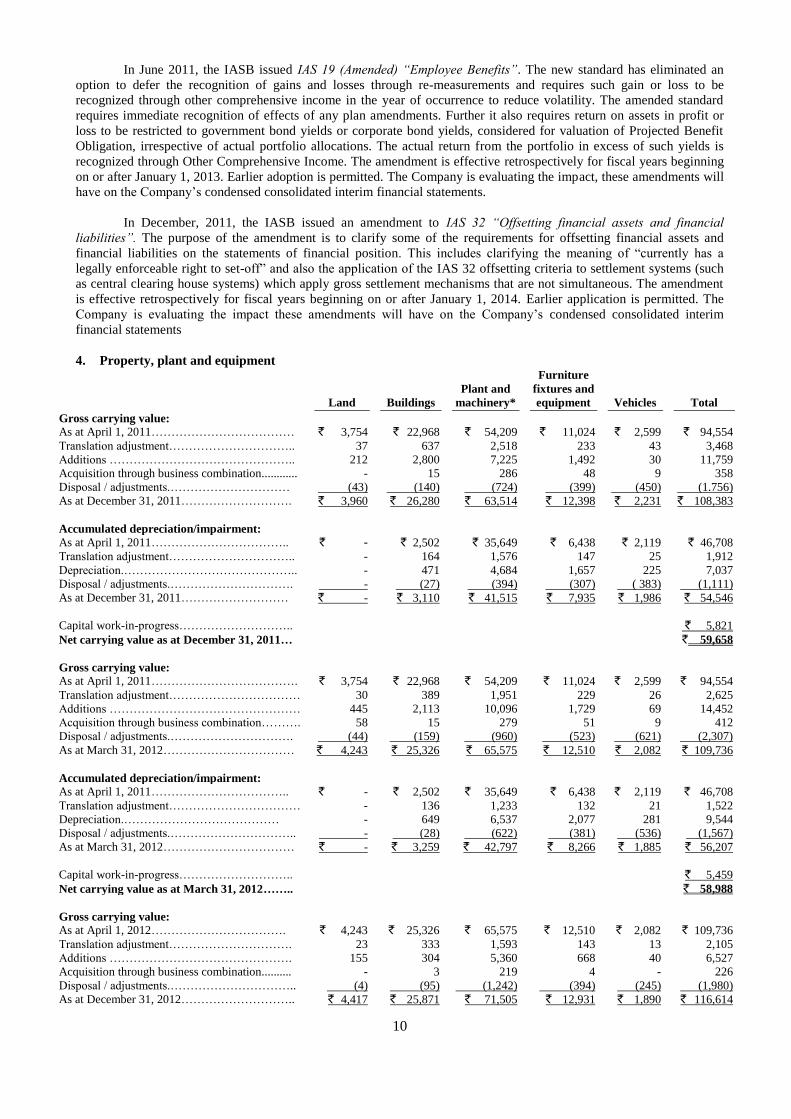
4. Property, plant and equipment
Land Buildings
Plant and
machinery*
Furniture
fixtures and
equipment Vehicles Total
Gross carrying value:
As at April 1, 2011……………………………… ` 3,754 ` 22,968 ` 54,209 ` 11,024 ` 2,599 ` 94,554
Translation adjustment………………………….. 37 637 2,518 233 43 3,468
Additions ……………………………………….. 212 2,800 7,225 1,492 30 11,759
Acquisition through business combination............ - 15 286 48 9 358
Disposal / adjustments.………………………… (43) (140) (724) (399) (450) (1.756)
As at December 31, 2011………………………. ` 3,960 ` 26,280 ` 63,514 ` 12,398 ` 2,231 ` 108,383
Accumulated depreciation/impairment:
As at April 1, 2011…………………………….. ` - ` 2,502 ` 35,649 ` 6,438 ` 2,119 ` 46,708
Translation adjustment………………………….. - 164 1,576 147 25 1,912
Depreciation.…………………………………….. - 471 4,684 1,657 225 7,037
Disposal / adjustments.…………………………. - (27) (394) (307) ( 383) (1,111)
As at December 31, 2011……………………… ` - ` 3,110 ` 41,515 ` 7,935 ` 1,986 ` 54,546
Capital work-in-progress……………………….. ` 5,821
Net carrying value as at December 31, 2011… ` 59,658
Gross carrying value:
As at April 1, 2011………………………………. ` 3,754 ` 22,968 ` 54,209 ` 11,024 ` 2,599 ` 94,554
Translation adjustment…………………………… 30 389 1,951 229 26 2,625
Additions ………………………………………… 445 2,113 10,096 1,729 69 14,452
Acquisition through business combination………. 58 15 279 51 9 412
Disposal / adjustments.…………………………. (44) (159) (960) (523) (621) (2,307)
As at March 31, 2012…………………………… ` 4,243 ` 25,326 ` 65,575 ` 12,510 ` 2,082 ` 109,736
Accumulated depreciation/impairment:
As at April 1, 2011…………………………….. ` - ` 2,502 ` 35,649 ` 6,438 ` 2,119 ` 46,708
Translation adjustment…………………………… - 136 1,233 132 21 1,522
Depreciation.………………………………… - 649 6,537 2,077 281 9,544
Disposal / adjustments.………………………….. - (28) (622) (381) (536) (1,567)
As at March 31, 2012…………………………… ` - ` 3,259 ` 42,797 ` 8,266 ` 1,885 ` 56,207
Capital work-in-progress……………………….. ` 5,459
Net carrying value as at March 31, 2012…….. ` 58,988
Gross carrying value:
As at April 1, 2012……………………………. ` 4,243 ` 25,326 ` 65,575 ` 12,510 ` 2,082 ` 109,736
Translation adjustment…………………………. 23 333 1,593 143 13 2,105
Additions ………………………………………. 155 304 5,360 668 40 6,527
Acquisition through business combination.......... - 3 219 4 - 226
Disposal / adjustments.………………………….. (4) (95) (1,242) (394) (245) (1,980)
As at December 31, 2012……………………….. ` 4,417 ` 25,871 ` 71,505 ` 12,931 ` 1,890 ` 116,614
11
Land Buildings
Plant and
machinery*
Furniture
fixtures and
equipment Vehicles Total
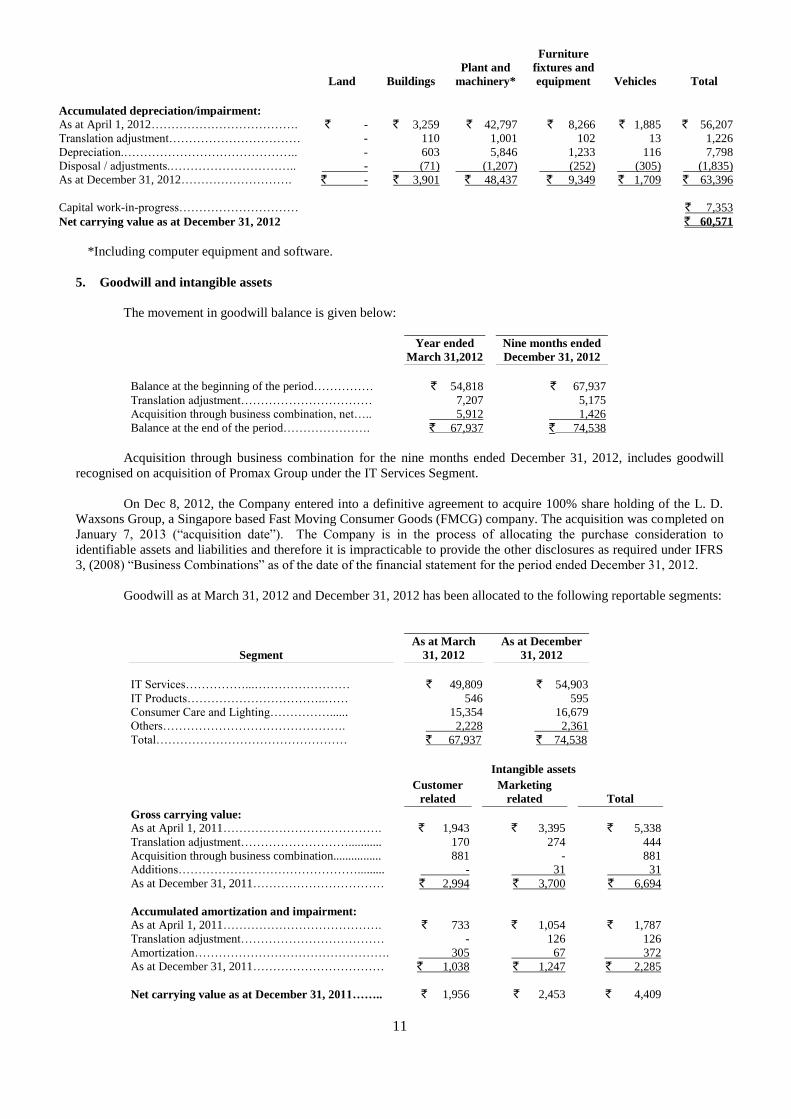
Accumulated depreciation/impairment:
As at April 1, 2012………………………………. ` - ` 3,259 ` 42,797 ` 8,266 ` 1,885 ` 56,207
Translation adjustment…………………………… - 110 1,001 102 13 1,226
Depreciation.…………………………………….. - 603 5,846 1,233 116 7,798
Disposal / adjustments.………………………….. - (71) (1,207) (252) (305) (1,835)
As at December 31, 2012………………………. ` - ` 3,901 ` 48,437 ` 9,349 ` 1,709 ` 63,396
Capital work-in-progress………………………… ` 7,353
Net carrying value as at December 31, 2012 ` 60,571
*Including computer equipment and software.
5. Goodwill and intangible assets
The movement in goodwill balance is given below:
Year ended
March 31,2012
Nine months ended
December 31, 2012
Balance at the beginning of the period…………… ` 54,818 ` 67,937
Translation adjustment…………………………… 7,207 5,175
Acquisition through business combination, net….. 5,912 1,426
Balance at the end of the period…………………. ` 67,937 ` 74,538
Acquisition through business combination for the nine months ended December 31, 2012, includes goodwill
recognised on acquisition of Promax Group under the IT Services Segment.
On Dec 8, 2012, the Company entered into a definitive agreement to acquire 100% share holding of the L. D.
Waxsons Group, a Singapore based Fast Moving Consumer Goods (FMCG) company. The acquisition was completed on
January 7, 2013 (“acquisition date”). The Company is in the process of allocating the purchase consideration to
identifiable assets and liabilities and therefore it is impracticable to provide the other disclosures as required under IFRS
3, (2008) “Business Combinations” as of the date of the financial statement for the period ended December 31, 2012.
Goodwill as at March 31, 2012 and December 31, 2012 has been allocated to the following reportable segments:
Segment
As at March
31, 2012
As at December
31, 2012
IT Services……………...…………………… ` 49,809 ` 54,903
IT Products……………………………..…… 546 595
Consumer Care and Lighting……………...... 15,354 16,679
Others………………………………………. 2,228 2,361
Total………………………………………… ` 67,937 ` 74,538
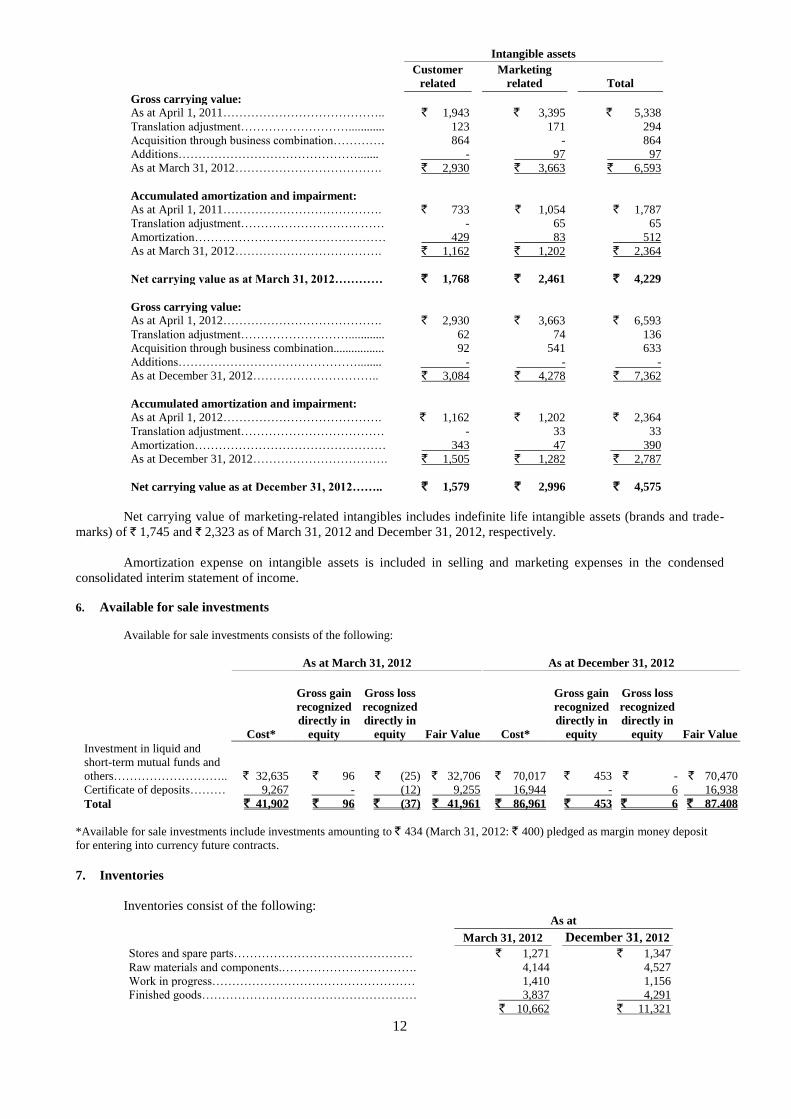
Intangible assets
Customer
related
Marketing
related Total
Gross carrying value:
As at April 1, 2011…………………………………. ` 1,943 ` 3,395 ` 5,338
Translation adjustment………………………........... 170 274 444
Acquisition through business combination................ 881 - 881
Additions………………………………………......... - 31 31
As at December 31, 2011…………………………… ` 2,994 ` 3,700 ` 6,694
Accumulated amortization and impairment:
As at April 1, 2011…………………………………. ` 733 ` 1,054 ` 1,787
Translation adjustment……………………………… - 126 126
Amortization…………………………………………. 305 67 372
As at December 31, 2011…………………………… ` 1,038 ` 1,247 ` 2,285
Net carrying value as at December 31, 2011…….. ` 1,956 ` 2,453 ` 4,409
12
Intangible assets
Customer
related
Marketing
related Total
Gross carrying value:
As at April 1, 2011………………………………….. ` 1,943 ` 3,395 ` 5,338
Translation adjustment………………………............ 123 171 294
Acquisition through business combination…………. 864 - 864
Additions………………………………………....... - 97 97
As at March 31, 2012………………………………. ` 2,930 ` 3,663 ` 6,593
Accumulated amortization and impairment:
As at April 1, 2011…………………………………. ` 733 ` 1,054 ` 1,787
Translation adjustment……………………………… - 65 65
Amortization………………………………………… 429 83 512
As at March 31, 2012………………………………. ` 1,162 ` 1,202 ` 2,364
Net carrying value as at March 31, 2012………… ` 1,768 ` 2,461 ` 4,229
Gross carrying value:
As at April 1, 2012…………………………………. ` 2,930 ` 3,663 ` 6,593
Translation adjustment………………………............ 62 74 136
Acquisition through business combination................. 92 541 633
Additions………………………………………........ - - -
As at December 31, 2012………………………….. ` 3,084 ` 4,278 ` 7,362
Accumulated amortization and impairment:
As at April 1, 2012…………………………………. ` 1,162 ` 1,202 ` 2,364
Translation adjustment……………………………… - 33 33
Amortization………………………………………… 343 47 390
As at December 31, 2012……………………………. ` 1,505 ` 1,282 ` 2,787
Net carrying value as at December 31, 2012…….. ` 1,579 ` 2,996 ` 4,575
Net carrying value of marketing-related intangibles includes indefinite life intangible assets (brands and trade-
marks) of ` 1,745 and ` 2,323 as of March 31, 2012 and December 31, 2012, respectively.
Amortization expense on intangible assets is included in selling and marketing expenses in the condensed
consolidated interim statement of income.
6. Available for sale investments
Available for sale investments consists of the following:
As at March 31, 2012 As at December 31, 2012
Cost*
Gross gain
recognized
directly in
equity
Gross loss
recognized
directly in
equity Fair Value Cost*
Gross gain
recognized
directly in
equity
Gross loss
recognized
directly in
equity Fair Value
Investment in liquid and
short-term mutual funds and
others……………………….. ` 32,635 ` 96 ̀ (25) ` 32,706 ` 70,017 ` 453 ` - ` 70,470
Certificate of deposits……… 9,267 - (12) 9,255 16,944 - 6 16,938
Total ` 41,902 ` 96 ̀ (37) ` 41,961 ` 86,961 ` 453 ` 6 ` 87.408
*Available for sale investments include investments amounting to ` 434 (March 31, 2012: ` 400) pledged as margin money deposit
for entering into currency future contracts.
7. Inventories
Inventories consist of the following: As at
March 31, 2012 December 31, 2012
Stores and spare parts……………………………………… ` 1,271 ` 1,347
Raw materials and components.……………………………. 4,144 4,527
Work in progress…………………………………………… 1,410 1,156
Finished goods……………………………………………… 3,837 4,291
` 10,662 ` 11,321
13
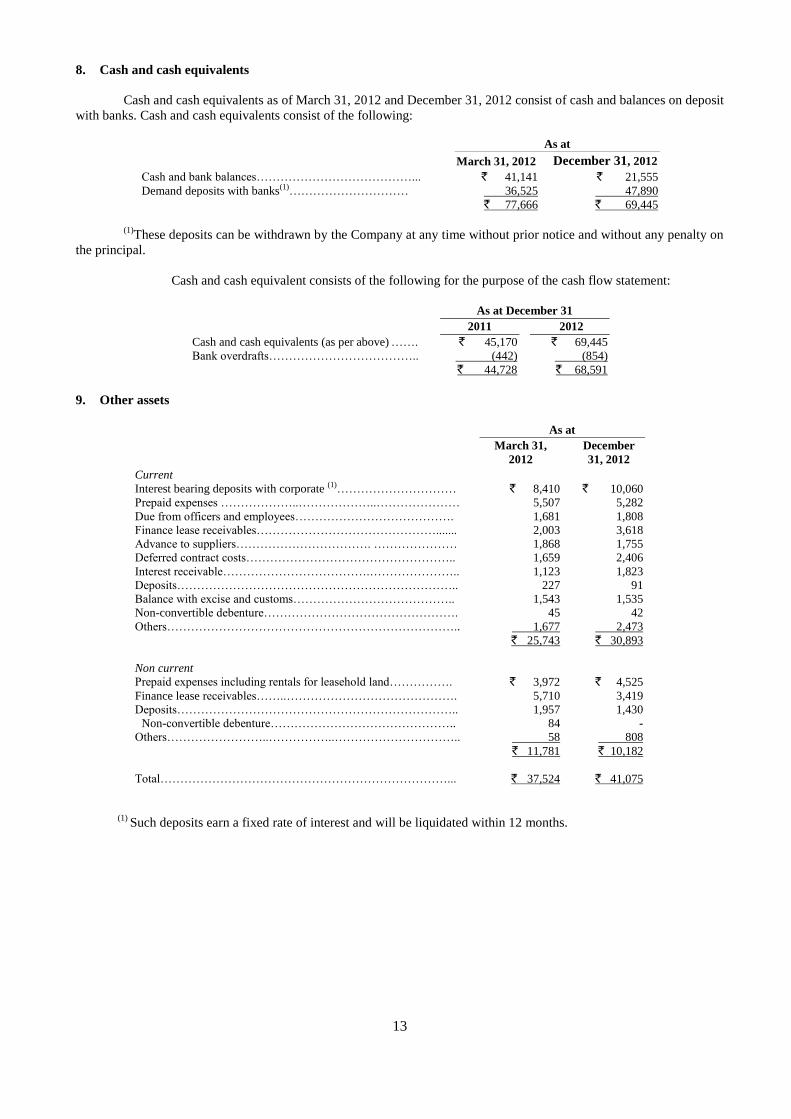
8. Cash and cash equivalents
Cash and cash equivalents as of March 31, 2012 and December 31, 2012 consist of cash and balances on deposit
with banks. Cash and cash equivalents consist of the following:
As at
March 31, 2012 December 31, 2012
Cash and bank balances…………………………………... ` 41,141 ` 21,555
Demand deposits with banks(1)………………………… 36,525 47,890
` 77,666 ` 69,445
(1)These deposits can be withdrawn by the Company at any time without prior notice and without any penalty on
the principal.
Cash and cash equivalent consists of the following for the purpose of the cash flow statement:
As at December 31
2011 2012
Cash and cash equivalents (as per above) ……. ` 45,170 ` 69,445
Bank overdrafts……………………………….. (442) (854)
` 44,728 ` 68,591
9. Other assets
As at
March 31,
2012
December
31, 2012
Current
Interest bearing deposits with corporate (1)………………………… ` 8,410 ` 10,060
Prepaid expenses ………………..………………..………………… 5,507 5,282
Due from officers and employees…………………………………. 1,681 1,808
Finance lease receivables………………………………………....... 2,003 3,618
Advance to suppliers……………………………. ………………… 1,868 1,755
Deferred contract costs…………………………………………….. 1,659 2,406
Interest receivable……………………………….………………….. 1,123 1,823
Deposits…………………………………………………………….. 227 91
Balance with excise and customs………………………………….. 1,543 1,535
Non-convertible debenture…………………………………………. 45 42
Others……………………………………………………………….. 1,677 2,473
` 25,743 ` 30,893
Non current
Prepaid expenses including rentals for leasehold land……………. ` 3,972 ` 4,525
Finance lease receivables……..……………………………………. 5,710 3,419
Deposits…………………………………………………………….. 1,957 1,430
Non-convertible debenture……………………………………….. 84 -
Others……………………..……………..………………………….. 58 808
` 11,781 ` 10,182
Total………………………………………………………………... ` 37,524 ` 41,075
(1) Such deposits earn a fixed rate of interest and will be liquidated within 12 months.
14
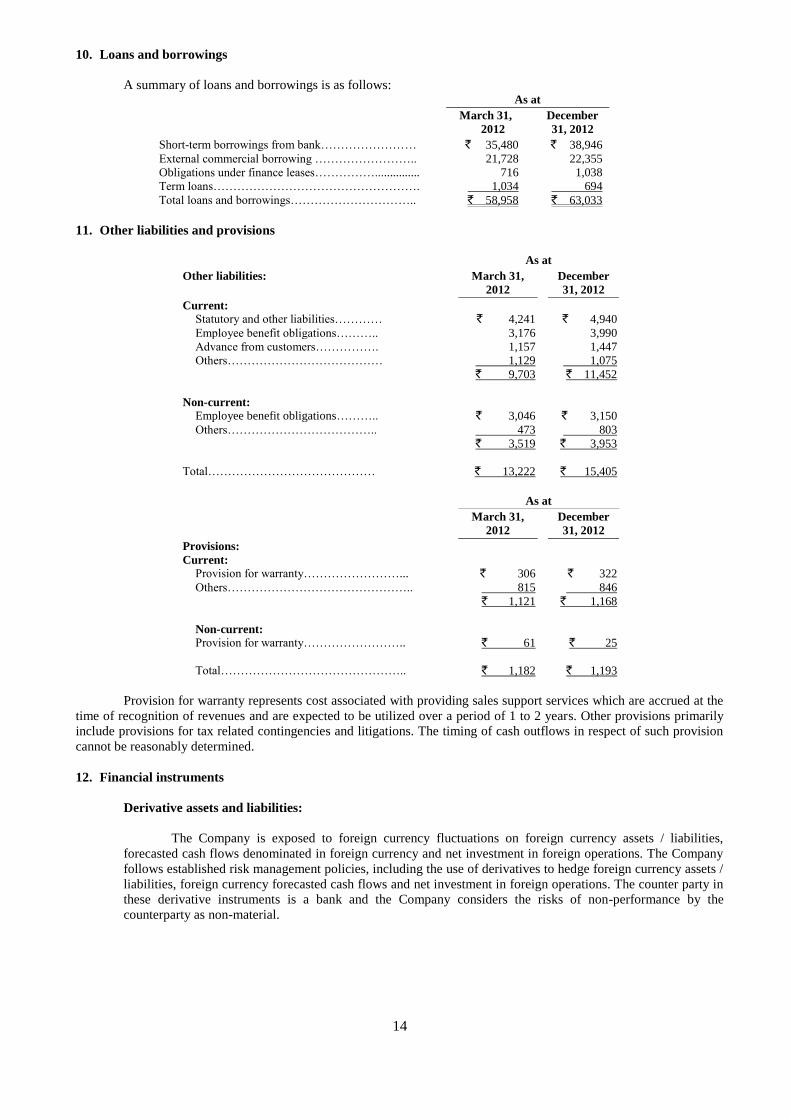
10. Loans and borrowings
A summary of loans and borrowings is as follows: As at
March 31,
2012
December
31, 2012
Short-term borrowings from bank…………………… ` 35,480 ` 38,946
External commercial borrowing …………………….. 21,728 22,355
Obligations under finance leases……………............... 716 1,038
Term loans……………………………………………. 1,034 694
Total loans and borrowings………………………….. ` 58,958 ` 63,033
11. Other liabilities and provisions
As at
Other liabilities: March 31,
2012
December
31, 2012
Current:
Statutory and other liabilities………… ` 4,241 ` 4,940
Employee benefit obligations……….. 3,176 3,990
Advance from customers……………. 1,157 1,447
Others………………………………… 1,129 1,075
` 9,703 ̀ 11,452
Non-current:
Employee benefit obligations……….. ` 3,046 ` 3,150
Others……………………………….. 473 803
` 3,519 ` 3,953
Total…………………………………… ` 13,222 ` 15,405
As at
March 31,
2012
December
31, 2012
Provisions:
Current:
Provision for warranty……………………... ` 306 ` 322
Others……………………………………….. 815 846
` 1,121 ` 1,168
Non-current:
Provision for warranty…………………….. ` 61 ̀ 25
Total……………………………………….. ` 1,182 ̀ 1,193
Provision for warranty represents cost associated with providing sales support services which are accrued at the
time of recognition of revenues and are expected to be utilized over a period of 1 to 2 years. Other provisions primarily
include provisions for tax related contingencies and litigations. The timing of cash outflows in respect of such provision
cannot be reasonably determined.
12. Financial instruments
Derivative assets and liabilities:
The Company is exposed to foreign currency fluctuations on foreign currency assets / liabilities,
forecasted cash flows denominated in foreign currency and net investment in foreign operations. The Company
follows established risk management policies, including the use of derivatives to hedge foreign currency assets /
liabilities, foreign currency forecasted cash flows and net investment in foreign operations. The counter party in
these derivative instruments is a bank and the Company considers the risks of non-performance by the
counterparty as non-material.
15
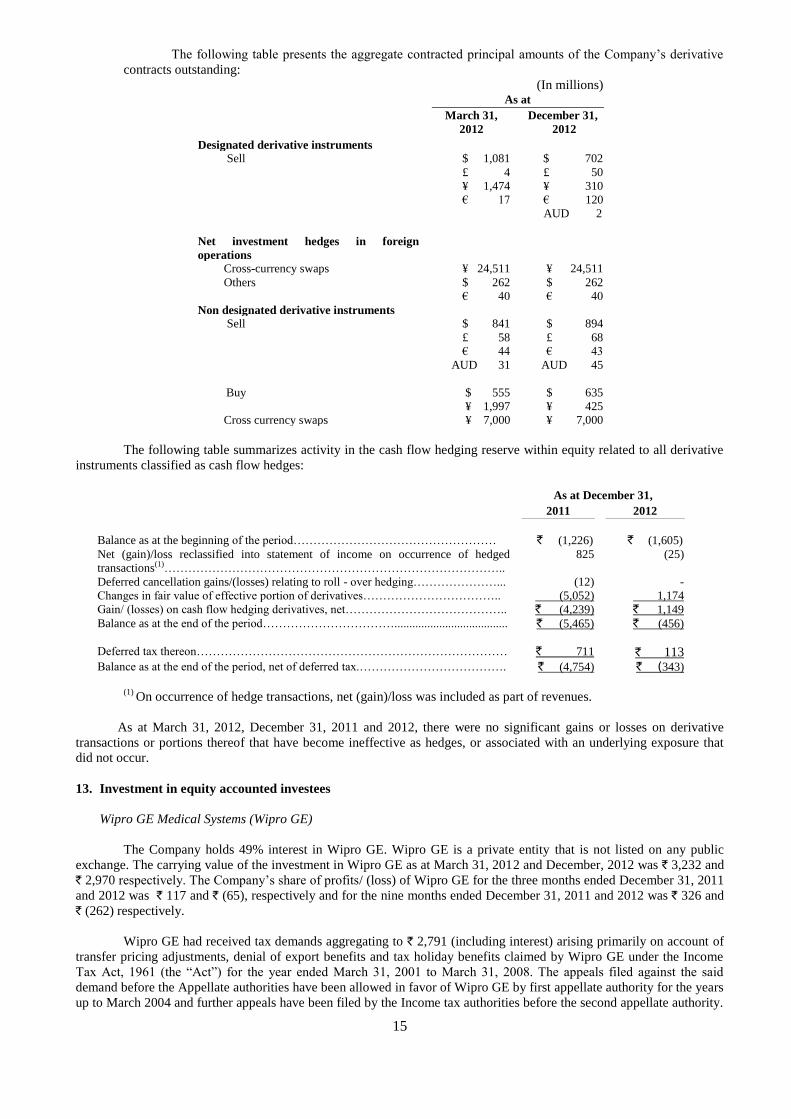
The following table presents the aggregate contracted principal amounts of the Company‟s derivative
contracts outstanding:
(In millions)
As at
March 31,
2012
December 31,
2012
Designated derivative instruments
Sell $ 1,081 $ 702
£ 4 £ 50
¥ 1,474 ¥ 310
€ 17 € 120 AUD 2
Net investment hedges in foreign
operations
Cross-currency swaps ¥ 24,511 ¥ 24,511
Others $ 262 $ 262
€ 40 € 40
Non designated derivative instruments
Sell $ 841 $ 894
£ 58 £ 68
€ 44 € 43
AUD 31 AUD 45
Buy $ 555 $ 635
¥ 1,997 ¥ 425
Cross currency swaps ¥ 7,000 ¥ 7,000
The following table summarizes activity in the cash flow hedging reserve within equity related to all derivative
instruments classified as cash flow hedges:
As at December 31,
2011 2012
Balance as at the beginning of the period…………………………………………… ` (1,226) ` (1,605)
Net (gain)/loss reclassified into statement of income on occurrence of hedged
transactions(1)…………………………………………………………………………..
825 (25)
Deferred cancellation gains/(losses) relating to roll - over hedging…………………... (12) -
Changes in fair value of effective portion of derivatives…………………………….. (5,052) 1,174
Gain/ (losses) on cash flow hedging derivatives, net………………………………….. ` (4,239) ` 1,149
Balance as at the end of the period……………………………...................................... ` (5,465) ` (456)
Deferred tax thereon…………………………………………………………………… ` 711 ` 113 Balance as at the end of the period, net of deferred tax.………………………………. ` (4,754) ` (343)
(1)
On occurrence of hedge transactions, net (gain)/loss was included as part of revenues.
As at March 31, 2012, December 31, 2011 and 2012, there were no significant gains or losses on derivative
transactions or portions thereof that have become ineffective as hedges, or associated with an underlying exposure that
did not occur.
13. Investment in equity accounted investees
Wipro GE Medical Systems (Wipro GE)
The Company holds 49% interest in Wipro GE. Wipro GE is a private entity that is not listed on any public
exchange. The carrying value of the investment in Wipro GE as at March 31, 2012 and December, 2012 was ` 3,232 and
` 2,970 respectively. The Company‟s share of profits/ (loss) of Wipro GE for the three months ended December 31, 2011
and 2012 was ` 117 and ` (65), respectively and for the nine months ended December 31, 2011 and 2012 was ` 326 and
` (262) respectively.
Wipro GE had received tax demands aggregating to ` 2,791 (including interest) arising primarily on account of
transfer pricing adjustments, denial of export benefits and tax holiday benefits claimed by Wipro GE under the Income
Tax Act, 1961 (the “Act”) for the year ended March 31, 2001 to March 31, 2008. The appeals filed against the said
demand before the Appellate authorities have been allowed in favor of Wipro GE by first appellate authority for the years
up to March 2004 and further appeals have been filed by the Income tax authorities before the second appellate authority.
16
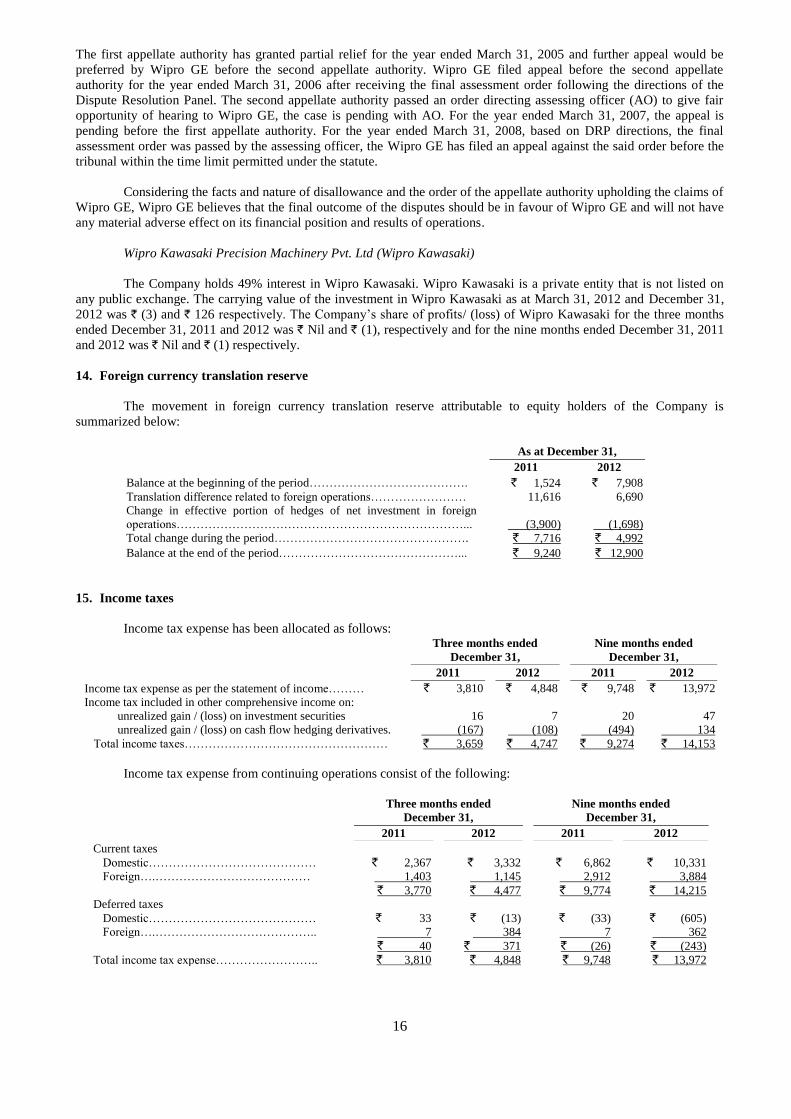
The first appellate authority has granted partial relief for the year ended March 31, 2005 and further appeal would be
preferred by Wipro GE before the second appellate authority. Wipro GE filed appeal before the second appellate
authority for the year ended March 31, 2006 after receiving the final assessment order following the directions of the
Dispute Resolution Panel. The second appellate authority passed an order directing assessing officer (AO) to give fair
opportunity of hearing to Wipro GE, the case is pending with AO. For the year ended March 31, 2007, the appeal is
pending before the first appellate authority. For the year ended March 31, 2008, based on DRP directions, the final
assessment order was passed by the assessing officer, the Wipro GE has filed an appeal against the said order before the
tribunal within the time limit permitted under the statute.
Considering the facts and nature of disallowance and the order of the appellate authority upholding the claims of
Wipro GE, Wipro GE believes that the final outcome of the disputes should be in favour of Wipro GE and will not have
any material adverse effect on its financial position and results of operations.
Wipro Kawasaki Precision Machinery Pvt. Ltd (Wipro Kawasaki)
The Company holds 49% interest in Wipro Kawasaki. Wipro Kawasaki is a private entity that is not listed on
any public exchange. The carrying value of the investment in Wipro Kawasaki as at March 31, 2012 and December 31,
2012 was ` (3) and ` 126 respectively. The Company‟s share of profits/ (loss) of Wipro Kawasaki for the three months
ended December 31, 2011 and 2012 was ` Nil and ` (1), respectively and for the nine months ended December 31, 2011
and 2012 was ` Nil and ` (1) respectively.
14. Foreign currency translation reserve
The movement in foreign currency translation reserve attributable to equity holders of the Company is
summarized below:
As at December 31,
2011 2012
Balance at the beginning of the period…………………………………. ` 1,524 ` 7,908
Translation difference related to foreign operations…………………… 11,616 6,690
Change in effective portion of hedges of net investment in foreign
operations………………………………………………………………... (3,900) (1,698)
Total change during the period…………………………………………. ` 7,716 ` 4,992
Balance at the end of the period………………………………………... ` 9,240 ` 12,900
15. Income taxes
Income tax expense has been allocated as follows:
Three months ended
December 31,
Nine months ended
December 31,
2011 2012 2011 2012
Income tax expense as per the statement of income……… ` 3,810 ` 4,848 ` 9,748 ` 13,972
Income tax included in other comprehensive income on:
unrealized gain / (loss) on investment securities 16 7 20 47
unrealized gain / (loss) on cash flow hedging derivatives. (167) (108) (494) 134
Total income taxes…………………………………………… ` 3,659 ̀ 4,747 ̀ 9,274 ` 14,153
Income tax expense from continuing operations consist of the following:
Three months ended
December 31,
Nine months ended
December 31,
2011 2012 2011 2012
Current taxes
Domestic…………………………………… ` 2,367 ` 3,332 ` 6,862 ` 10,331
Foreign….………………………………… 1,403 1,145 2,912 3,884
` 3,770 ` 4,477 ` 9,774 ` 14,215
Deferred taxes
Domestic…………………………………… ` 33 ` (13) ` (33) ` (605)
Foreign….………………………………….. 7 384 7 362
` 40 ` 371 ` (26) ` (243)
Total income tax expense…………………….. ` 3,810 ` 4,848 ` 9,748 ` 13,972
17
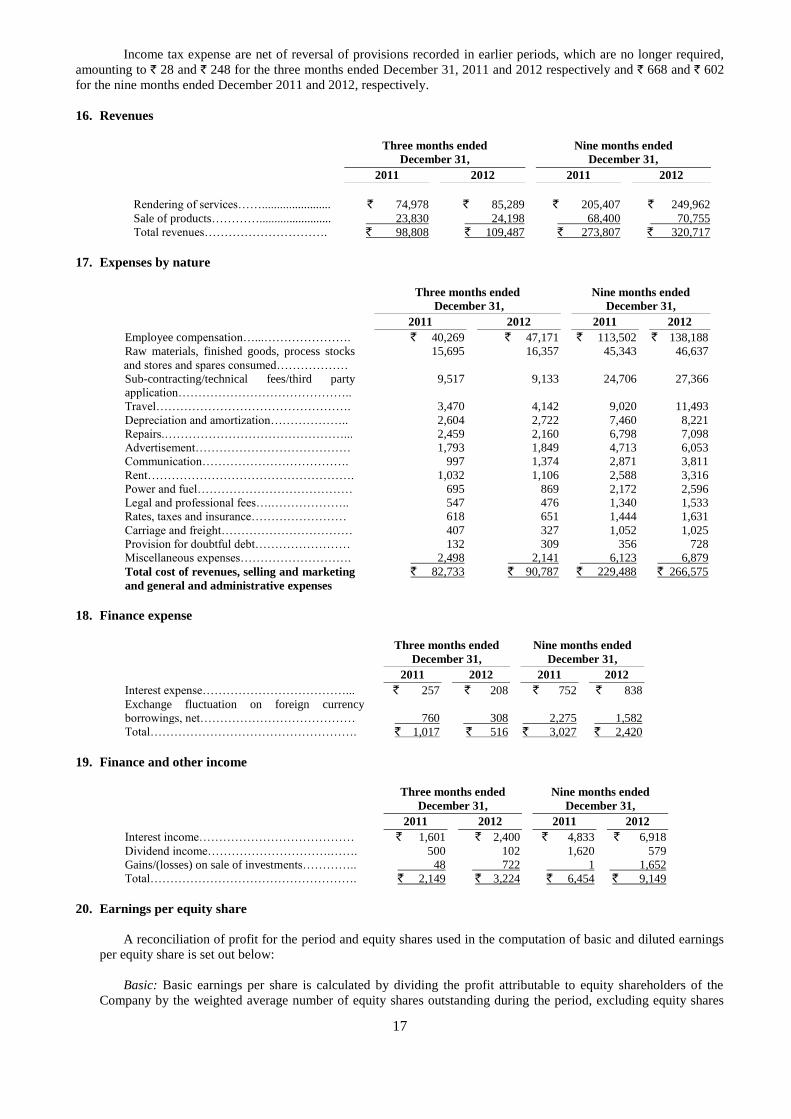
Income tax expense are net of reversal of provisions recorded in earlier periods, which are no longer required,
amounting to ` 28 and ` 248 for the three months ended December 31, 2011 and 2012 respectively and ` 668 and ` 602
for the nine months ended December 2011 and 2012, respectively.
16. Revenues
Three months ended
December 31,
Nine months ended
December 31,
2011 2012 2011 2012
Rendering of services……....................... ` 74,978 ` 85,289 ` 205,407 ` 249,962
Sale of products…………........................ 23,830 24,198 68,400 70,755
Total revenues…………………………. ` 98,808 ` 109,487 ` 273,807 ` 320,717
17. Expenses by nature
Three months ended
December 31,
Nine months ended
December 31,
2011 2012 2011 2012
Employee compensation…...…………………. ` 40,269 ` 47,171 ̀ 113,502 ` 138,188
Raw materials, finished goods, process stocks
and stores and spares consumed………………
15,695 16,357 45,343 46,637
Sub-contracting/technical fees/third party
application……………………………………..
9,517 9,133 24,706 27,366
Travel…………………………………………. 3,470 4,142 9,020 11,493
Depreciation and amortization……………….. 2,604 2,722 7,460 8,221
Repairs.………………………………………... 2,459 2,160 6,798 7,098
Advertisement………………………………… 1,793 1,849 4,713 6,053
Communication………………………………. 997 1,374 2,871 3,811
Rent……………………………………………. 1,032 1,106 2,588 3,316
Power and fuel………………………………… 695 869 2,172 2,596
Legal and professional fees….……………….. 547 476 1,340 1,533
Rates, taxes and insurance…………………… 618 651 1,444 1,631
Carriage and freight…………………………… 407 327 1,052 1,025
Provision for doubtful debt…………………… 132 309 356 728
Miscellaneous expenses………………………. 2,498 2,141 6,123 6,879
Total cost of revenues, selling and marketing
and general and administrative expenses
` 82,733 ` 90,787 ` 229,488 ` 266,575
18. Finance expense
Three months ended
December 31,
Nine months ended
December 31,
2011 2012 2011 2012
Interest expense………………………………... ` 257 ` 208 ` 752 ` 838
Exchange fluctuation on foreign currency
borrowings, net………………………………… 760 308 2,275 1,582
Total……………………………………………. ` 1,017 ` 516 ` 3,027 ` 2,420
19. Finance and other income
Three months ended
December 31,
Nine months ended
December 31,
2011 2012 2011 2012
Interest income………………………………… ` 1,601 ` 2,400 ` 4,833 ` 6,918
Dividend income………………………….……. 500 102 1,620 579
Gains/(losses) on sale of investments………….. 48 722 1 1,652
Total……………………………………………. ` 2,149 ` 3,224 ` 6,454 ` 9,149
20. Earnings per equity share
A reconciliation of profit for the period and equity shares used in the computation of basic and diluted earnings
per equity share is set out below:
Basic: Basic earnings per share is calculated by dividing the profit attributable to equity shareholders of the
Company by the weighted average number of equity shares outstanding during the period, excluding equity shares
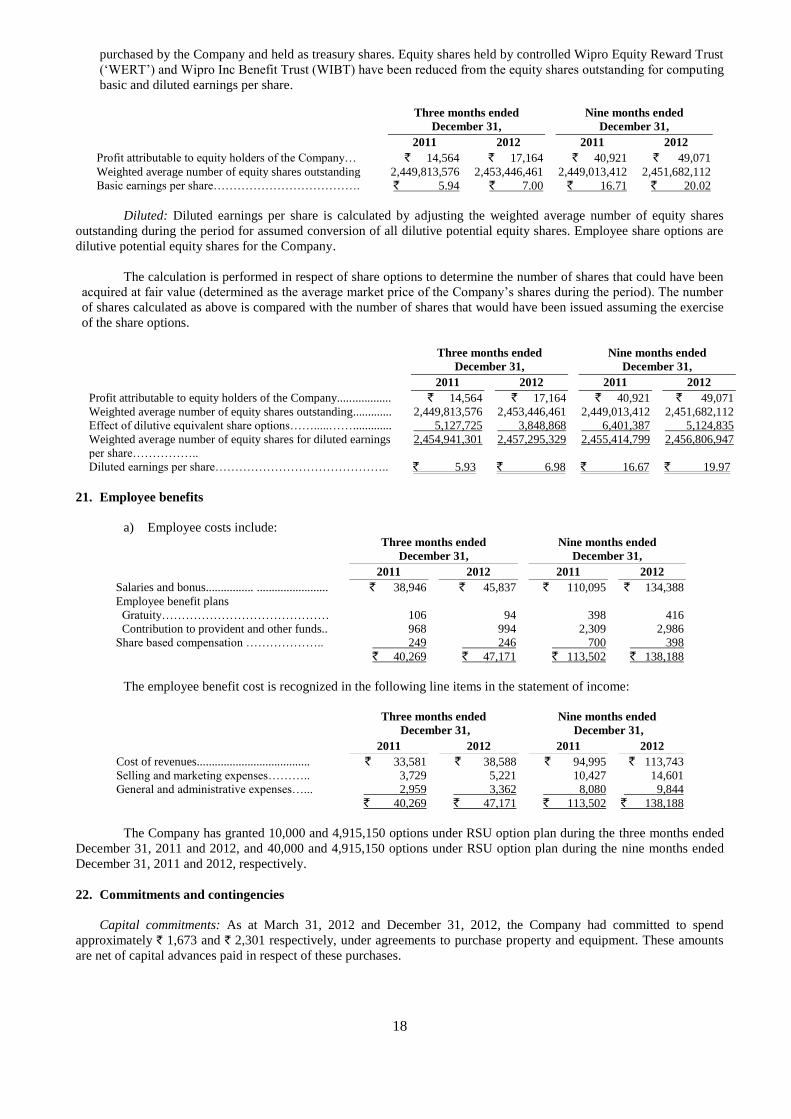
18
purchased by the Company and held as treasury shares. Equity shares held by controlled Wipro Equity Reward Trust
(„WERT‟) and Wipro Inc Benefit Trust (WIBT) have been reduced from the equity shares outstanding for computing
basic and diluted earnings per share.
Diluted: Diluted earnings per share is calculated by adjusting the weighted average number of equity shares
outstanding during the period for assumed conversion of all dilutive potential equity shares. Employee share options are
dilutive potential equity shares for the Company.
The calculation is performed in respect of share options to determine the number of shares that could have been
acquired at fair value (determined as the average market price of the Company‟s shares during the period). The number
of shares calculated as above is compared with the number of shares that would have been issued assuming the exercise
of the share options.
Three months ended
December 31,
Nine months ended
December 31,
2011 2012 2011 2012
Profit attributable to equity holders of the Company.................. ` 14,564 ` 17,164 ` 40,921 ` 49,071
Weighted average number of equity shares outstanding............. 2,449,813,576 2,453,446,461 2,449,013,412 2,451,682,112
Effect of dilutive equivalent share options…….....……............. 5,127,725 3,848,868 6,401,387 5,124,835
Weighted average number of equity shares for diluted earnings
per share……………..
2,454,941,301 2,457,295,329 2,455,414,799 2,456,806,947
Diluted earnings per share…………………………………….. ` 5.93 ` 6.98 ` 16.67 ` 19.97
21. Employee benefits
a) Employee costs include: Three months ended
December 31,
Nine months ended
December 31,
2011 2012 2011 2012
Salaries and bonus................ ........................ ` 38,946 ` 45,837 ` 110,095 ` 134,388
Employee benefit plans
Gratuity…………………………………… 106 94 398 416
Contribution to provident and other funds.. 968 994 2,309 2,986
Share based compensation ……………….. 249 246 700 398
` 40,269 ` 47,171 ` 113,502 ` 138,188
The employee benefit cost is recognized in the following line items in the statement of income:
Three months ended
December 31,
Nine months ended
December 31,
2011 2012 2011 2012
Cost of revenues...................................... ` 33,581 ` 38,588 ` 94,995 ` 113,743
Selling and marketing expenses……….. 3,729 5,221 10,427 14,601
General and administrative expenses…... 2,959 3,362 8,080 9,844
` 40,269 ` 47,171 ` 113,502 ` 138,188
The Company has granted 10,000 and 4,915,150 options under RSU option plan during the three months ended
December 31, 2011 and 2012, and 40,000 and 4,915,150 options under RSU option plan during the nine months ended
December 31, 2011 and 2012, respectively.
22. Commitments and contingencies
Capital commitments: As at March 31, 2012 and December 31, 2012, the Company had committed to spend
approximately ` 1,673 and ` 2,301 respectively, under agreements to purchase property and equipment. These amounts
are net of capital advances paid in respect of these purchases.
Three months ended
December 31,
Nine months ended
December 31,
2011 2012 2011 2012
Profit attributable to equity holders of the Company… ` 14,564 ` 17,164 ` 40,921 ` 49,071
Weighted average number of equity shares outstanding 2,449,813,576 2,453,446,461 2,449,013,412 2,451,682,112
Basic earnings per share………………………………. ` 5.94 ` 7.00 ` 16.71 ` 20.02
19
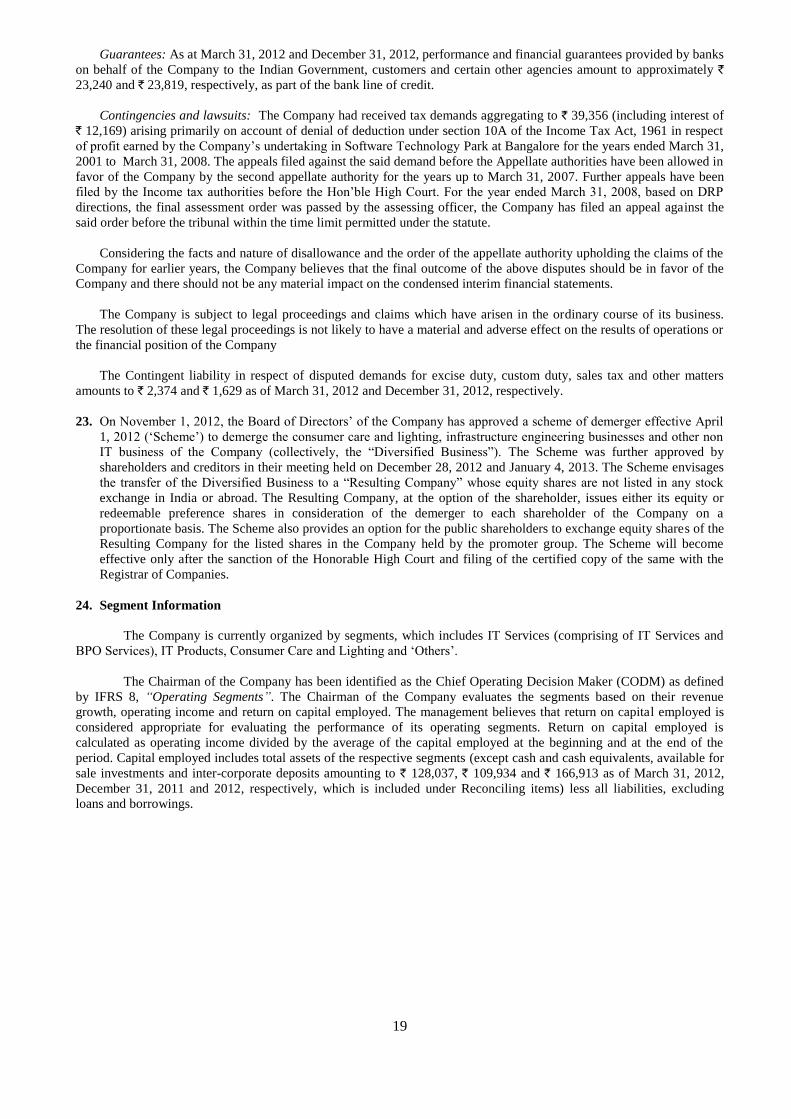
Guarantees: As at March 31, 2012 and December 31, 2012, performance and financial guarantees provided by banks
on behalf of the Company to the Indian Government, customers and certain other agencies amount to approximately `
23,240 and ` 23,819, respectively, as part of the bank line of credit.
Contingencies and lawsuits: The Company had received tax demands aggregating to ` 39,356 (including interest of
` 12,169) arising primarily on account of denial of deduction under section 10A of the Income Tax Act, 1961 in respect
of profit earned by the Company‟s undertaking in Software Technology Park at Bangalore for the years ended March 31,
2001 to March 31, 2008. The appeals filed against the said demand before the Appellate authorities have been allowed in
favor of the Company by the second appellate authority for the years up to March 31, 2007. Further appeals have been
filed by the Income tax authorities before the Hon‟ble High Court. For the year ended March 31, 2008, based on DRP
directions, the final assessment order was passed by the assessing officer, the Company has filed an appeal against the
said order before the tribunal within the time limit permitted under the statute.
Considering the facts and nature of disallowance and the order of the appellate authority upholding the claims of the
Company for earlier years, the Company believes that the final outcome of the above disputes should be in favor of the
Company and there should not be any material impact on the condensed interim financial statements.
The Company is subject to legal proceedings and claims which have arisen in the ordinary course of its business.
The resolution of these legal proceedings is not likely to have a material and adverse effect on the results of operations or
the financial position of the Company
The Contingent liability in respect of disputed demands for excise duty, custom duty, sales tax and other matters
amounts to ` 2,374 and ` 1,629 as of March 31, 2012 and December 31, 2012, respectively.
23. On November 1, 2012, the Board of Directors‟ of the Company has approved a scheme of demerger effective April
1, 2012 („Scheme‟) to demerge the consumer care and lighting, infrastructure engineering businesses and other non
IT business of the Company (collectively, the “Diversified Business”). The Scheme was further approved by
shareholders and creditors in their meeting held on December 28, 2012 and January 4, 2013. The Scheme envisages
the transfer of the Diversified Business to a “Resulting Company” whose equity shares are not listed in any stock
exchange in India or abroad. The Resulting Company, at the option of the shareholder, issues either its equity or
redeemable preference shares in consideration of the demerger to each shareholder of the Company on a
proportionate basis. The Scheme also provides an option for the public shareholders to exchange equity shares of the
Resulting Company for the listed shares in the Company held by the promoter group. The Scheme will become
effective only after the sanction of the Honorable High Court and filing of the certified copy of the same with the
Registrar of Companies.
24. Segment Information
The Company is currently organized by segments, which includes IT Services (comprising of IT Services and
BPO Services), IT Products, Consumer Care and Lighting and „Others‟.
The Chairman of the Company has been identified as the Chief Operating Decision Maker (CODM) as defined
by IFRS 8, ―Operating Segments‖. The Chairman of the Company evaluates the segments based on their revenue
growth, operating income and return on capital employed. The management believes that return on capital employed is
considered appropriate for evaluating the performance of its operating segments. Return on capital employed is
calculated as operating income divided by the average of the capital employed at the beginning and at the end of the
period. Capital employed includes total assets of the respective segments (except cash and cash equivalents, available for
sale investments and inter-corporate deposits amounting to ` 128,037, ` 109,934 and ` 166,913 as of March 31, 2012,
December 31, 2011 and 2012, respectively, which is included under Reconciling items) less all liabilities, excluding
loans and borrowings.
20
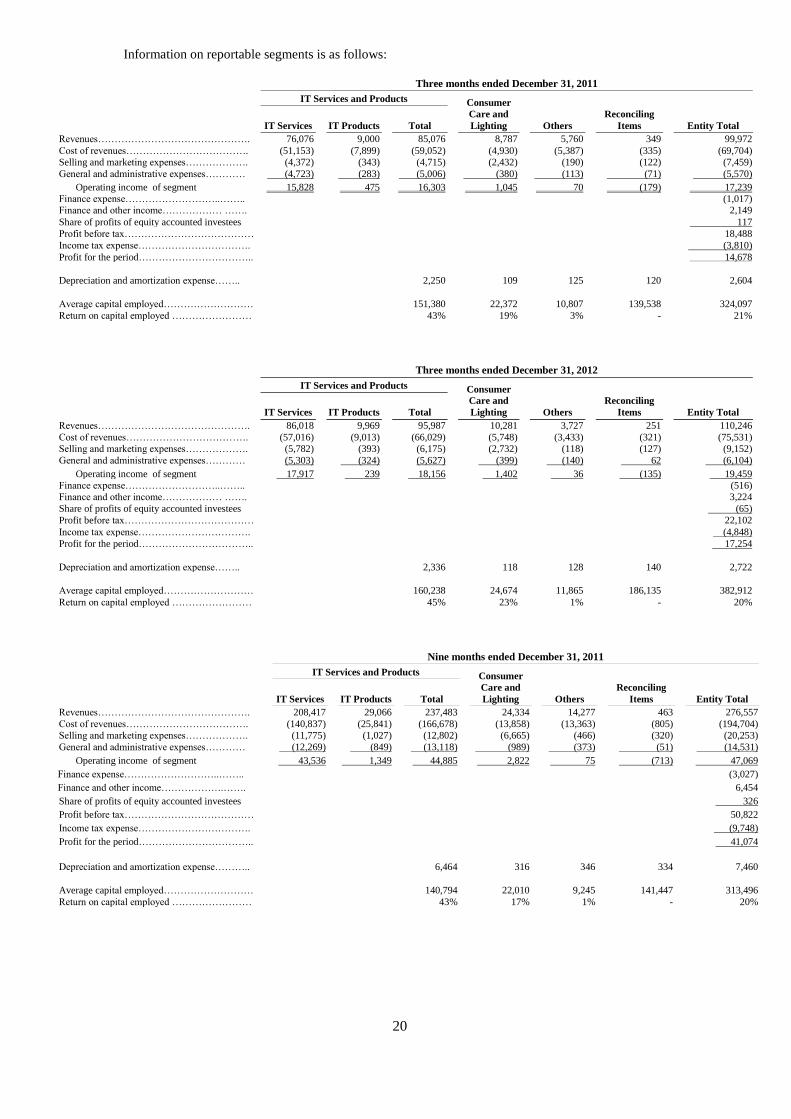
Information on reportable segments is as follows:
Three months ended December 31, 2011
IT Services and Products Consumer
Care and
Lighting Others
Reconciling
Items Entity Total IT Services IT Products Total
Revenues………………………………………. 76,076 9,000 85,076 8,787 5,760 349 99,972
Cost of revenues………………………………. (51,153) (7,899) (59,052) (4,930) (5,387) (335) (69,704)
Selling and marketing expenses………………. (4,372) (343) (4,715) (2,432) (190) (122) (7,459)
General and administrative expenses………… (4,723) (283) (5,006) (380) (113) (71) (5,570)
Operating income of segment 15,828 475 16,303 1,045 70 (179) 17,239
Finance expense………………………..…….. (1,017)
Finance and other income……………… ……. 2,149
Share of profits of equity accounted investees 117
Profit before tax………………………………… 18,488
Income tax expense……………………………. (3,810)
Profit for the period…………………………….. 14,678
Depreciation and amortization expense…….. 2,250 109 125 120 2,604
Average capital employed……………………… 151,380 22,372 10,807 139,538 324,097
Return on capital employed …………………… 43% 19% 3% - 21%
Three months ended December 31, 2012
IT Services and Products Consumer
Care and
Lighting Others
Reconciling
Items Entity Total IT Services IT Products Total
Revenues………………………………………. 86,018 9,969 95,987 10,281 3,727 251 110,246
Cost of revenues………………………………. (57,016) (9,013) (66,029) (5,748) (3,433) (321) (75,531)
Selling and marketing expenses………………. (5,782) (393) (6,175) (2,732) (118) (127) (9,152)
General and administrative expenses………… (5,303) (324) (5,627) (399) (140) 62 (6,104)
Operating income of segment 17,917 239 18,156 1,402 36 (135) 19,459
Finance expense………………………..…….. (516)
Finance and other income……………… ……. 3,224
Share of profits of equity accounted investees (65)
Profit before tax………………………………… 22,102
Income tax expense……………………………. (4,848)
Profit for the period…………………………….. 17,254
Depreciation and amortization expense…….. 2,336 118 128 140 2,722
Average capital employed……………………… 160,238 24,674 11,865 186,135 382,912
Return on capital employed …………………… 45% 23% 1% - 20%
Nine months ended December 31, 2011
IT Services and Products Consumer
Care and
Lighting Others
Reconciling
Items Entity Total IT Services IT Products Total
Revenues………………………………………. 208,417 29,066 237,483 24,334 14,277 463 276,557
Cost of revenues………………………………. (140,837) (25,841) (166,678) (13,858) (13,363) (805) (194,704)
Selling and marketing expenses………………. (11,775) (1,027) (12,802) (6,665) (466) (320) (20,253)
General and administrative expenses………… (12,269) (849) (13,118) (989) (373) (51) (14,531)
Operating income of segment 43,536 1,349 44,885 2,822 75 (713) 47,069
Finance expense………………………..…….. (3,027)
Finance and other income……………….……. 6,454
Share of profits of equity accounted investees 326
Profit before tax………………………………… 50,822
Income tax expense……………………………. (9,748)
Profit for the period…………………………….. 41,074
Depreciation and amortization expense……….. 6,464 316 346 334 7,460
Average capital employed……………………… 140,794 22,010 9,245 141,447 313,496
Return on capital employed …………………… 43% 17% 1% - 20%
21
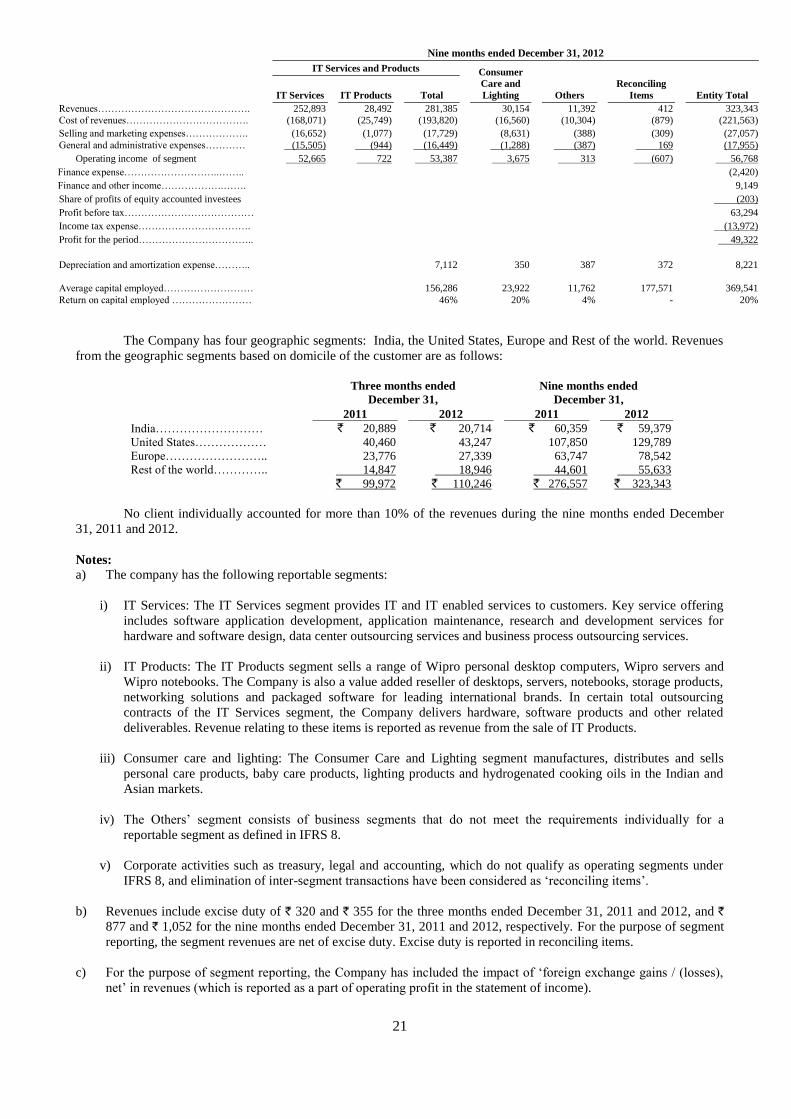
Nine months ended December 31, 2012
IT Services and Products Consumer
Care and
Lighting Others
Reconciling
Items Entity Total IT Services IT Products Total
Revenues………………………………………. 252,893 28,492 281,385 30,154 11,392 412 323,343
Cost of revenues………………………………. (168,071) (25,749) (193,820) (16,560) (10,304) (879) (221,563)
Selling and marketing expenses………………. (16,652) (1,077) (17,729) (8,631) (388) (309) (27,057)
General and administrative expenses………… (15,505) (944) (16,449) (1,288) (387) 169 (17,955)
Operating income of segment 52,665 722 53,387 3,675 313 (607) 56,768
Finance expense………………………..…….. (2,420)
Finance and other income……………….……. 9,149
Share of profits of equity accounted investees (203)
Profit before tax………………………………… 63,294
Income tax expense……………………………. (13,972)
Profit for the period…………………………….. 49,322
Depreciation and amortization expense……….. 7,112 350 387 372 8,221
Average capital employed……………………… 156,286 23,922 11,762 177,571 369,541
Return on capital employed …………………… 46% 20% 4% - 20%
The Company has four geographic segments: India, the United States, Europe and Rest of the world. Revenues
from the geographic segments based on domicile of the customer are as follows:
Three months ended
December 31,
Nine months ended
December 31,
2011 2012 2011 2012
India……………………… ` 20,889 ` 20,714 ` 60,359 ` 59,379
United States……………… 40,460 43,247 107,850 129,789
Europe…………………….. 23,776 27,339 63,747 78,542
Rest of the world………….. 14,847 18,946 44,601 55,633
` 99,972 ` 110,246 ` 276,557 ` 323,343
No client individually accounted for more than 10% of the revenues during the nine months ended December
31, 2011 and 2012.
Notes:
a) The company has the following reportable segments:
i) IT Services: The IT Services segment provides IT and IT enabled services to customers. Key service offering
includes software application development, application maintenance, research and development services for
hardware and software design, data center outsourcing services and business process outsourcing services.
ii) IT Products: The IT Products segment sells a range of Wipro personal desktop computers, Wipro servers and
Wipro notebooks. The Company is also a value added reseller of desktops, servers, notebooks, storage products,
networking solutions and packaged software for leading international brands. In certain total outsourcing
contracts of the IT Services segment, the Company delivers hardware, software products and other related
deliverables. Revenue relating to these items is reported as revenue from the sale of IT Products.
iii) Consumer care and lighting: The Consumer Care and Lighting segment manufactures, distributes and sells
personal care products, baby care products, lighting products and hydrogenated cooking oils in the Indian and
Asian markets.
iv) The Others‟ segment consists of business segments that do not meet the requirements individually for a
reportable segment as defined in IFRS 8.
v) Corporate activities such as treasury, legal and accounting, which do not qualify as operating segments under
IFRS 8, and elimination of inter-segment transactions have been considered as „reconciling items‟.
b) Revenues include excise duty of ` 320 and ` 355 for the three months ended December 31, 2011 and 2012, and `
877 and ` 1,052 for the nine months ended December 31, 2011 and 2012, respectively. For the purpose of segment
reporting, the segment revenues are net of excise duty. Excise duty is reported in reconciling items.
c) For the purpose of segment reporting, the Company has included the impact of „foreign exchange gains / (losses),
net‟ in revenues (which is reported as a part of operating profit in the statement of income).
22
d) For evaluating performance of the individual business segments, stock compensation expense is allocated on the
basis of straight line amortization. The incremental impact of accelerated amortization of stock compensation
expense over stock compensation expense allocated to the individual business segments is reported in reconciling
items.
e) For evaluating the performance of the individual business segments, amortization of intangibles acquired through
business combinations are reported in reconciling items.
f) For evaluating the performance of the individual business segments, loss on disposal of subsidiaries are reported in
reconciling items.
g) The Company generally offers multi-year payment terms in certain total outsourcing contracts. These payment
terms primarily relate to IT hardware, software and certain transformation services in outsourcing contracts.
Corporate treasury provides internal financing to the business units offering multi-year payments terms.
Accordingly, such receivables are reflected in capital employed in reconciling items. As of December 31, 2011 and
2012, capital employed in reconciling items includes ` 14,364 and ` 13,250 respectively, of such receivables on
extended collection terms. The finance income on deferred consideration earned under these contracts is included in
the revenue of the respective segment and is eliminated under reconciling items.
h) Operating income of segments is after recognition of stock compensation expense arising from the grant of options:
Segments Three months ended
December 31,
Nine months ended
December 31,
2011 2012 2011 2012
IT Services ………………………... ` 200 ` 255 ̀ 667 ` 508
IT Products………………………… 13 14 49 31
Consumer Care and Lighting……… 22 24 67 70
Others………………………………. 7 7 22 24
Reconciling items………………….. 7 (56) (105) (235)
Total……………………………….. ` 249 ` 244 ` 700 ` 398
Management believes that it is currently not practicable to provide disclosure of geographical location wise
assets, since the meaningful segregation of the available information is onerous
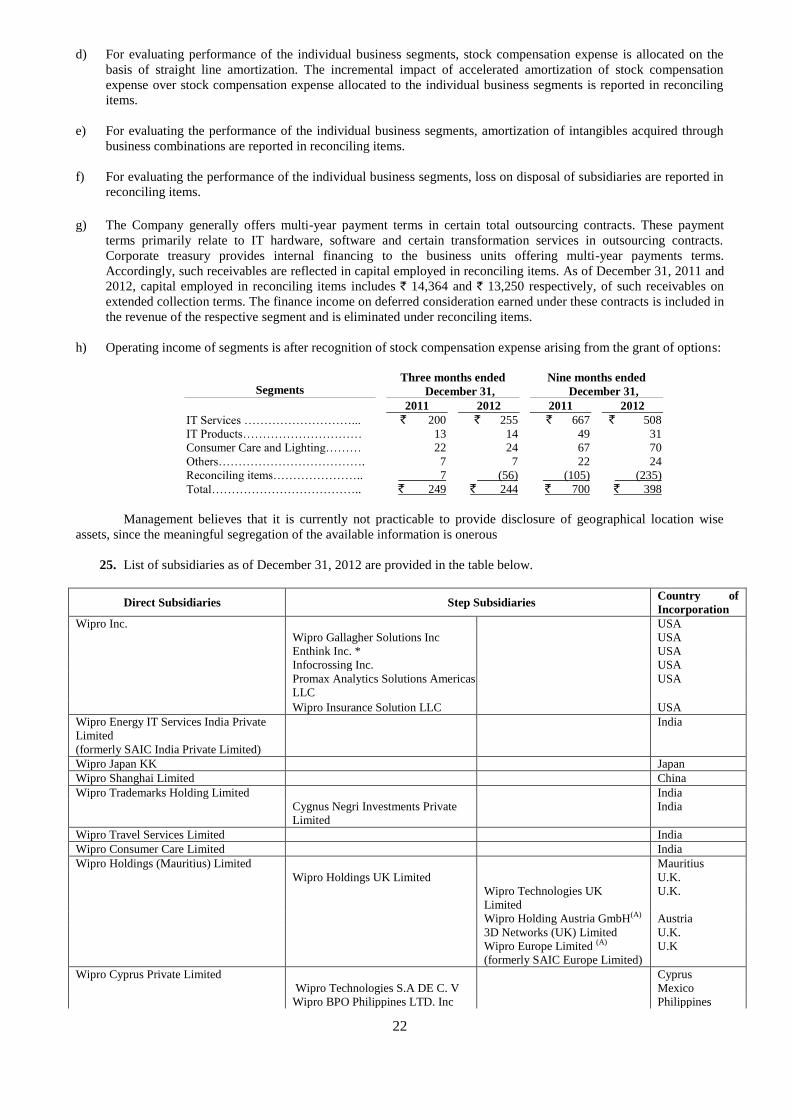
25. List of subsidiaries as of December 31, 2012 are provided in the table below.
Direct Subsidiaries Step Subsidiaries Country of
Incorporation
Wipro Inc. USA
Wipro Gallagher Solutions Inc USA
Enthink Inc. * USA
Infocrossing Inc. USA
Promax Analytics Solutions Americas
LLC
USA
Wipro Insurance Solution LLC USA
Wipro Energy IT Services India Private
Limited
(formerly SAIC India Private Limited)
India
Wipro Japan KK Japan
Wipro Shanghai Limited China
Wipro Trademarks Holding Limited India
Cygnus Negri Investments Private
Limited
India
Wipro Travel Services Limited India
Wipro Consumer Care Limited India
Wipro Holdings (Mauritius) Limited Mauritius
Wipro Holdings UK Limited U.K.
Wipro Technologies UK
Limited
U.K.
Wipro Holding Austria GmbH(A) Austria
3D Networks (UK) Limited
Wipro Europe Limited (A)
(formerly SAIC Europe Limited)
U.K.
U.K
Wipro Cyprus Private Limited Cyprus
Wipro Technologies S.A DE C. V Mexico
Wipro BPO Philippines LTD. Inc Philippines
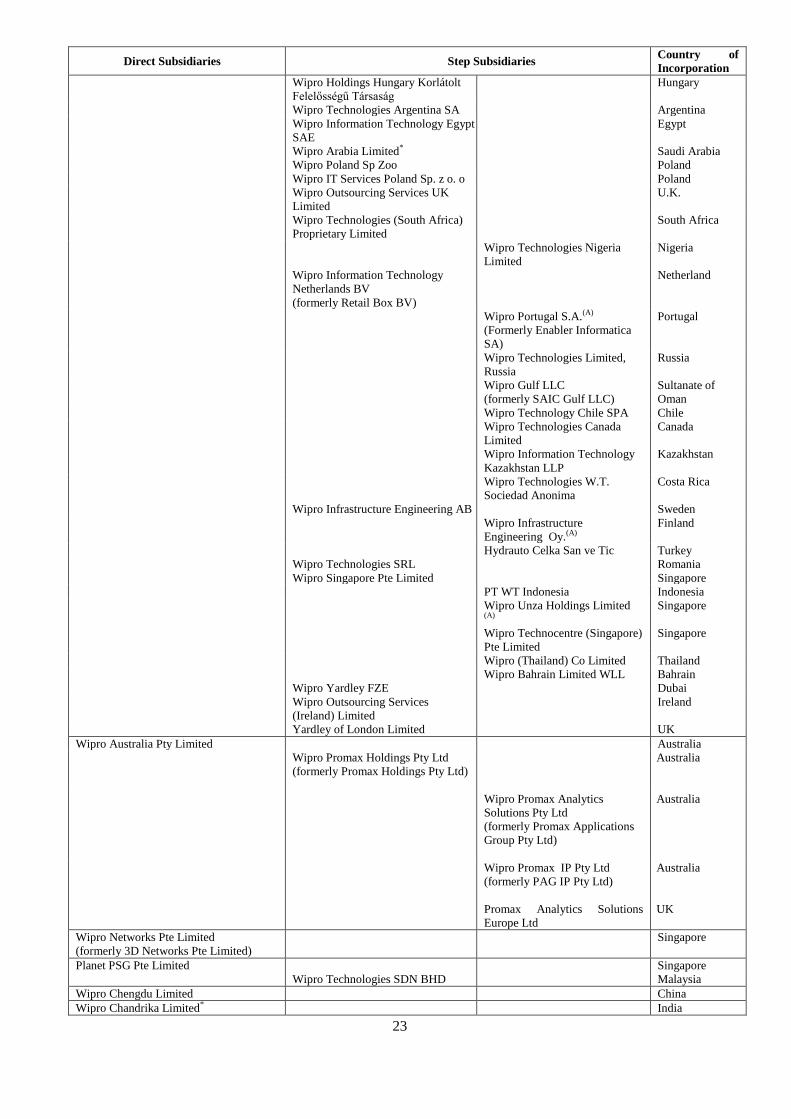
23
Direct Subsidiaries Step Subsidiaries Country of
Incorporation
Wipro Holdings Hungary Korlátolt
Felelősségű Társaság
Hungary
Wipro Technologies Argentina SA Argentina
Wipro Information Technology Egypt
SAE
Egypt
Wipro Arabia Limited* Saudi Arabia
Wipro Poland Sp Zoo Poland
Wipro IT Services Poland Sp. z o. o Poland
Wipro Outsourcing Services UK
Limited
U.K.
Wipro Technologies (South Africa)
Proprietary Limited
South Africa
Wipro Technologies Nigeria
Limited
Nigeria
Wipro Information Technology
Netherlands BV
(formerly Retail Box BV)
Netherland
Wipro Portugal S.A.(A)
(Formerly Enabler Informatica
SA)
Portugal
Wipro Technologies Limited,
Russia
Russia
Wipro Gulf LLC
(formerly SAIC Gulf LLC)
Sultanate of
Oman
Wipro Technology Chile SPA Chile
Wipro Technologies Canada
Limited
Canada
Wipro Information Technology
Kazakhstan LLP
Kazakhstan
Wipro Technologies W.T.
Sociedad Anonima
Costa Rica
Wipro Infrastructure Engineering AB Sweden
Wipro Infrastructure
Engineering Oy.(A)
Finland
Hydrauto Celka San ve Tic Turkey
Wipro Technologies SRL Romania
Wipro Singapore Pte Limited Singapore
PT WT Indonesia Indonesia
Wipro Unza Holdings Limited (A)
Singapore
Wipro Technocentre (Singapore)
Pte Limited
Singapore
Wipro (Thailand) Co Limited Thailand
Wipro Bahrain Limited WLL Bahrain
Wipro Yardley FZE Dubai
Wipro Outsourcing Services
(Ireland) Limited
Ireland
Yardley of London Limited UK
Wipro Australia Pty Limited Australia
Wipro Promax Holdings Pty Ltd
(formerly Promax Holdings Pty Ltd)
Australia
Wipro Promax Analytics
Solutions Pty Ltd
(formerly Promax Applications
Group Pty Ltd)
Australia
Wipro Promax IP Pty Ltd
(formerly PAG IP Pty Ltd)
Australia
Promax Analytics Solutions
Europe Ltd
UK
Wipro Networks Pte Limited
(formerly 3D Networks Pte Limited)
Singapore
Planet PSG Pte Limited Singapore
Wipro Technologies SDN BHD Malaysia
Wipro Chengdu Limited China
Wipro Chandrika Limited* India
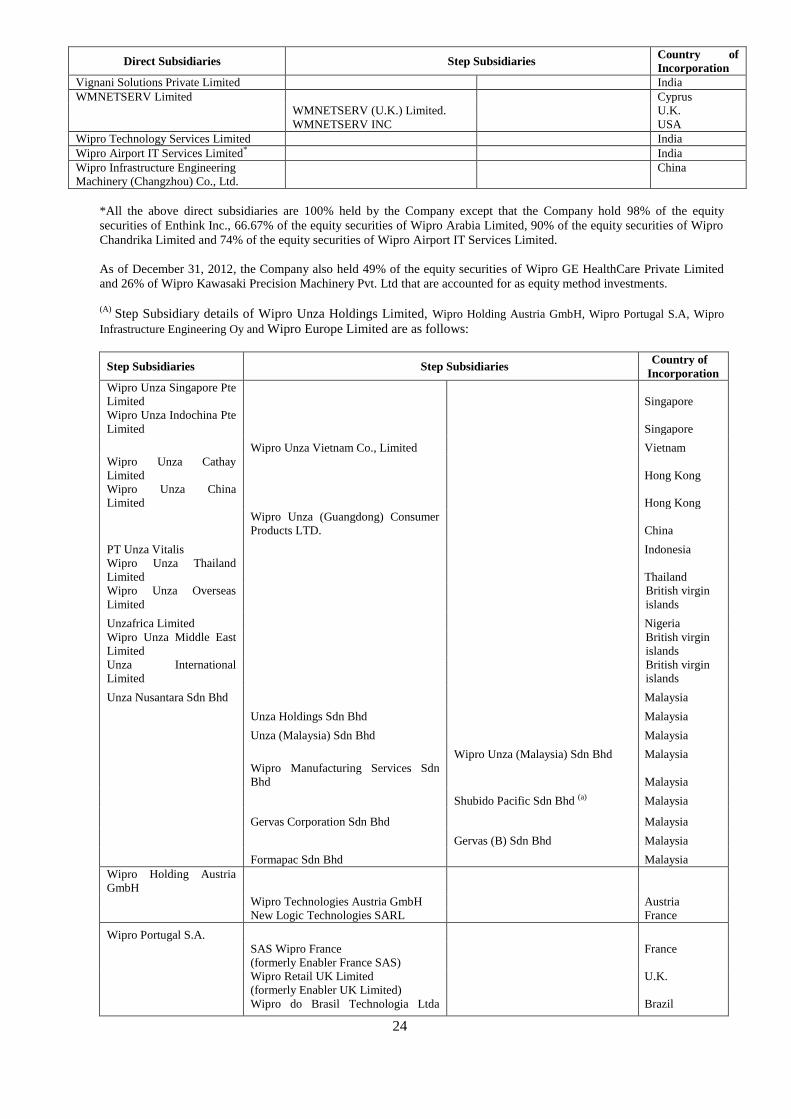
24
Direct Subsidiaries Step Subsidiaries Country of
Incorporation
Vignani Solutions Private Limited India
WMNETSERV Limited Cyprus
WMNETSERV (U.K.) Limited. U.K.
WMNETSERV INC USA
Wipro Technology Services Limited India
Wipro Airport IT Services Limited* India
Wipro Infrastructure Engineering
Machinery (Changzhou) Co., Ltd.
China
*All the above direct subsidiaries are 100% held by the Company except that the Company hold 98% of the equity
securities of Enthink Inc., 66.67% of the equity securities of Wipro Arabia Limited, 90% of the equity securities of Wipro
Chandrika Limited and 74% of the equity securities of Wipro Airport IT Services Limited.
As of December 31, 2012, the Company also held 49% of the equity securities of Wipro GE HealthCare Private Limited
and 26% of Wipro Kawasaki Precision Machinery Pvt. Ltd that are accounted for as equity method investments.
(A)
Step Subsidiary details of Wipro Unza Holdings Limited, Wipro Holding Austria GmbH, Wipro Portugal S.A, Wipro
Infrastructure Engineering Oy and Wipro Europe Limited are as follows:
Step Subsidiaries Step Subsidiaries Country of
Incorporation
Wipro Unza Singapore Pte
Limited Singapore
Wipro Unza Indochina Pte
Limited Singapore
Wipro Unza Vietnam Co., Limited Vietnam
Wipro Unza Cathay
Limited Hong Kong
Wipro Unza China
Limited Hong Kong
Wipro Unza (Guangdong) Consumer
Products LTD. China
PT Unza Vitalis Indonesia
Wipro Unza Thailand
Limited Thailand
Wipro Unza Overseas
Limited
British virgin
islands
Unzafrica Limited Nigeria
Wipro Unza Middle East
Limited
British virgin
islands
Unza International
Limited
British virgin
islands
Unza Nusantara Sdn Bhd Malaysia
Unza Holdings Sdn Bhd Malaysia
Unza (Malaysia) Sdn Bhd Malaysia
Wipro Unza (Malaysia) Sdn Bhd Malaysia
Wipro Manufacturing Services Sdn
Bhd Malaysia
Shubido Pacific Sdn Bhd (a) Malaysia
Gervas Corporation Sdn Bhd Malaysia
Gervas (B) Sdn Bhd Malaysia
Formapac Sdn Bhd Malaysia
Wipro Holding Austria
GmbH
Wipro Technologies Austria GmbH Austria
New Logic Technologies SARL France
Wipro Portugal S.A.
SAS Wipro France
(formerly Enabler France SAS)
France
Wipro Retail UK Limited
(formerly Enabler UK Limited)
U.K.
Wipro do Brasil Technologia Ltda Brazil
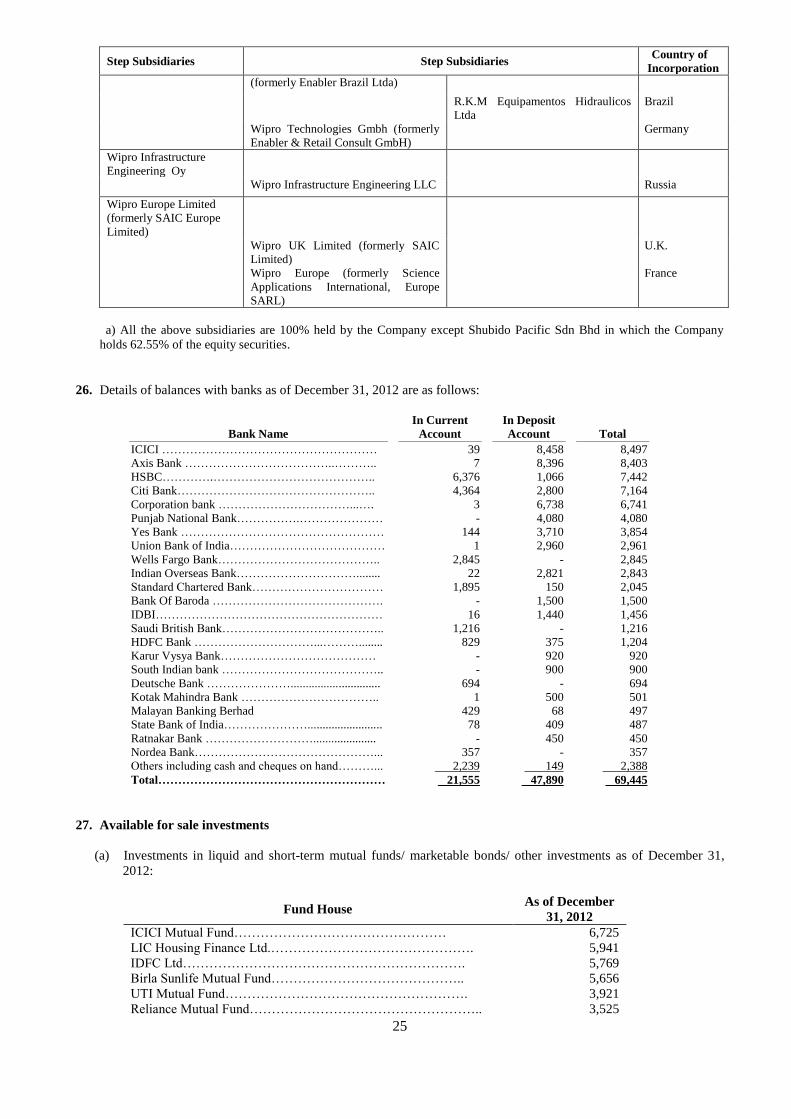
25
Step Subsidiaries Step Subsidiaries Country of
Incorporation
(formerly Enabler Brazil Ltda)
R.K.M Equipamentos Hidraulicos
Ltda
Brazil
Wipro Technologies Gmbh (formerly
Enabler & Retail Consult GmbH)
Germany
Wipro Infrastructure
Engineering Oy
Wipro Infrastructure Engineering LLC Russia
Wipro Europe Limited
(formerly SAIC Europe
Limited)
Wipro UK Limited (formerly SAIC
Limited)
U.K.
Wipro Europe (formerly Science
Applications International, Europe
SARL)
France
a) All the above subsidiaries are 100% held by the Company except Shubido Pacific Sdn Bhd in which the Company
holds 62.55% of the equity securities.
26. Details of balances with banks as of December 31, 2012 are as follows:
Bank Name
In Current
Account
In Deposit
Account Total
ICICI ……………………………………………… 39 8,458 8,497
Axis Bank ………………………………..……….. 7 8,396 8,403
HSBC………….………………………………….. 6,376 1,066 7,442
Citi Bank………………………………………….. 4,364 2,800 7,164
Corporation bank ……………………………...…. 3 6,738 6,741
Punjab National Bank…………….………………… - 4,080 4,080
Yes Bank …………………………………………… 144 3,710 3,854
Union Bank of India………………………………… 1 2,960 2,961
Wells Fargo Bank………………………………….. 2,845 - 2,845
Indian Overseas Bank…………………………........ 22 2,821 2,843
Standard Chartered Bank…………………………… 1,895 150 2,045
Bank Of Baroda ……………………………………. - 1,500 1,500
IDBI………………………………………………… 16 1,440 1,456
Saudi British Bank………………………………….. 1,216 - 1,216
HDFC Bank …………………………...………........ 829 375 1,204
Karur Vysya Bank………………………………… - 920 920
South Indian bank ………………………………….. - 900 900
Deutsche Bank ………………….............................. 694 - 694
Kotak Mahindra Bank …………………………….. 1 500 501
Malayan Banking Berhad 429 68 497
State Bank of India…………………......................... 78 409 487
Ratnakar Bank ………………………..................... - 450 450
Nordea Bank………………………………………... 357 - 357
Others including cash and cheques on hand………... 2,239 149 2,388
Total………………………………………………… 21,555 47,890 69,445
27. Available for sale investments
(a) Investments in liquid and short-term mutual funds/ marketable bonds/ other investments as of December 31,
2012:
Fund House As of December
31, 2012
ICICI Mutual Fund………………………………………… 6,725
LIC Housing Finance Ltd.………………………………………. 5,941
IDFC Ltd………………………………………………………. 5,769
Birla Sunlife Mutual Fund…………………………………….. 5,656
UTI Mutual Fund………………………………………………. 3,921
Reliance Mutual Fund…………………………………………….. 3,525
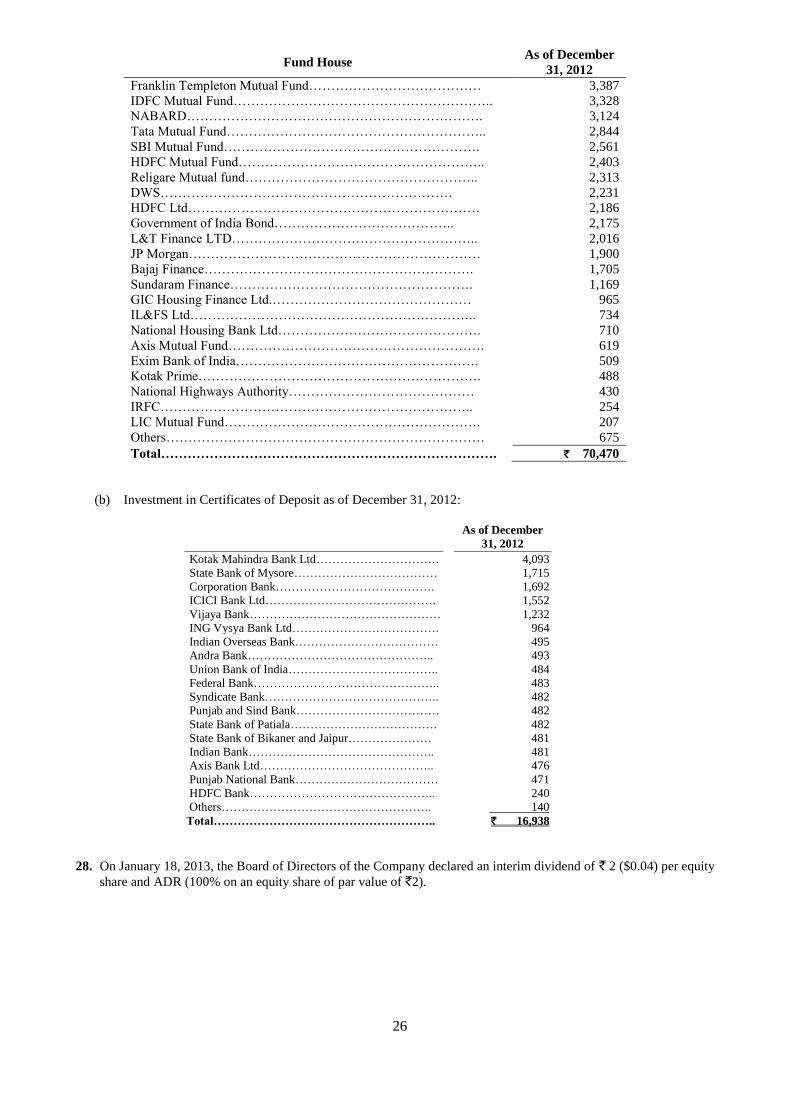
26
Fund House As of December
31, 2012
Franklin Templeton Mutual Fund………………………………… 3,387
IDFC Mutual Fund………………………………………………….. 3,328
NABARD…………………………………………………………. 3,124
Tata Mutual Fund………………………………………………….. 2,844
SBI Mutual Fund…………………………………………………. 2,561
HDFC Mutual Fund……………………………………………….. 2,403
Religare Mutual fund…………………………………………….. 2,313
DWS………………………………………………………… 2,231
HDFC Ltd………………………………………………………… 2,186
Government of India Bond………………………………….. 2,175
L&T Finance LTD……………………………………………….. 2,016
JP Morgan………………………………………………………… 1,900
Bajaj Finance……………………………………………………. 1,705
Sundaram Finance………………………………………………. 1,169
GIC Housing Finance Ltd.……………………………………… 965
IL&FS Ltd……………………………………………………….. 734
National Housing Bank Ltd………………………………………. 710
Axis Mutual Fund…………………………………………………. 619
Exim Bank of India………………………………………………. 509
Kotak Prime………………………………………………………. 488
National Highways Authority…………………………………… 430
IRFC…………………………………………………………….. 254
LIC Mutual Fund…………………………………………………. 207
Others……………………………………………………………… 675
Total…………………………………………………………………. ` 70,470
(b) Investment in Certificates of Deposit as of December 31, 2012:
As of December
31, 2012
Kotak Mahindra Bank Ltd…………………………. 4,093
State Bank of Mysore……………………………… 1,715
Corporation Bank…………………………………. 1,692
ICICI Bank Ltd……………………………………. 1,552
Vijaya Bank………………………………………… 1,232
ING Vysya Bank Ltd………………………………. 964
Indian Overseas Bank……………………………… 495
Andra Bank……………………………………….. 493
Union Bank of India……………………………….. 484
Federal Bank……………………………………….. 483
Syndicate Bank…………………………………….. 482
Punjab and Sind Bank……………………………… 482
State Bank of Patiala………………………………. 482
State Bank of Bikaner and Jaipur………………… 481
Indian Bank……………………………………….. 481
Axis Bank Ltd…………………………………….. 476
Punjab National Bank……………………………… 471
HDFC Bank……………………………………….. 240
Others…………………………………………….. 140
Total……………………………………………….. ` 16,938
28. On January 18, 2013, the Board of Directors of the Company declared an interim dividend of ` 2 ($0.04) per equity
share and ADR (100% on an equity share of par value of `2).

27
The accompanying notes form an integral part of these condensed consolidated interim financial statements
As per our report of even date attached For and on behalf of the Board of Directors
for B S R & Co. Azim Premji B C Prabhakar Shyam Saran
Chartered Accountants Chairman Director Director
Firm's Registration No:101248W
Natrajh Ramakrishna Suresh C Senapaty T K Kurien V Ramachandran
Partner Chief Financial Officer CEO, IT Business & Company Secretary
Membership No. 032815 & Director Executive Director
Bangalore
January 18, 2013