Embed Size (px)
DESCRIPTION
Annual reports of Wipro
Citation preview


Wipro Limited 49
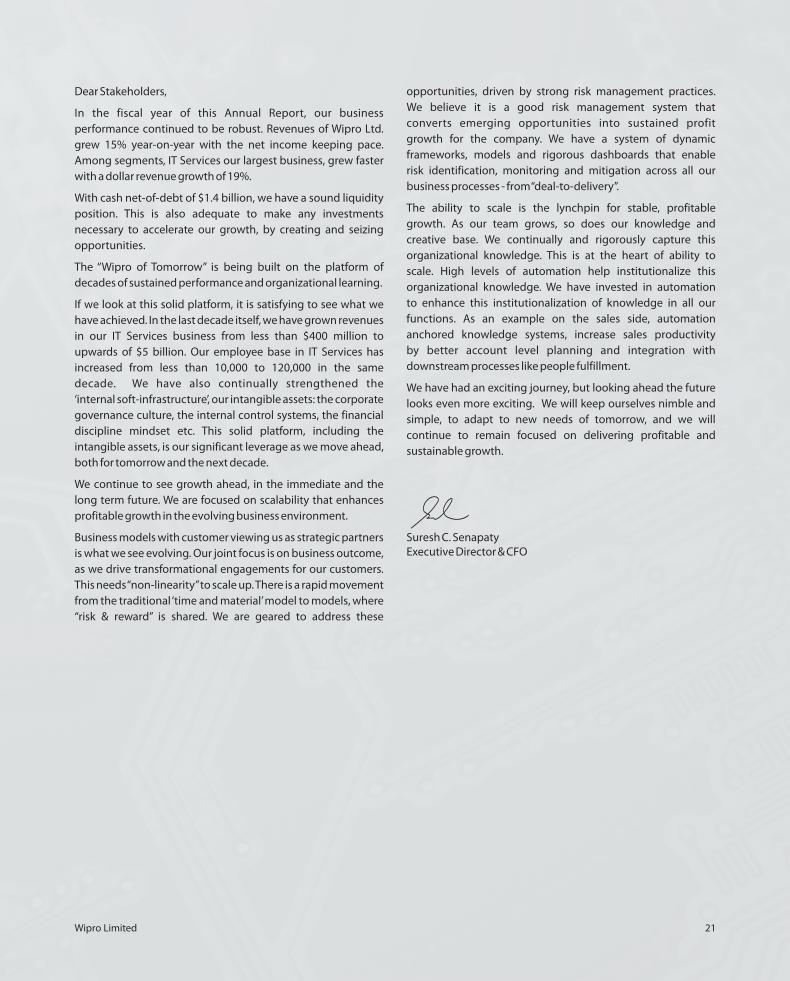
Dear Shareholders,
On behalf of the Board of Directors, I am happy to present the
65th Directors’ Report of your Company along with the
Balance Sheet and Profit and Loss Account for the year ended
March 31, 2011.
Financial Performance
Key aspects of consolidated financial performance for Wipro and
its group companies and standalone financial results for Wipro
Limited for the financial year 2010-11 are tabulated below:
(` in Mn)
Consolidated Standalone
2010-11 2009-10 2010-11 2009-10
Sales and Other
income 316,938 276,505 269,038 237,887
Profit before Tax 62,348 55,095 57,055 56,888
Provision for Tax 9,695 9,163 8,618 7,908
Minority interest
and equity in
earnings/(losses) in
affiliates 271 378 - -
Profit for the year* 52,924 46,310 48,437 48,980
Appropriations
Interim Dividend 4,908 - 4,908 -
Proposed Dividend
on equity shares 9,818 8,809 9,818 8,809
Corporate tax
on distributed
dividend 2,204 1,283 2,204 1,283
Transfer to General
Reserve 4,844 36,218 4,844 38,888
Balance retained
in Profit & Loss
account 31,150 - 26,663 -
* Profit for the year in standalone result is after ` 326 million
(March 2010: ̀ 4,534 million of gains/(losses) relating to changes
Directors’Report
in fair value of forward contracts designated as hedges of net
investment in non-integral foreign operations, translation
of foreign currency borrowings and changes in fair value of
related cross currency swaps together designated as hedges
of net investment in non-integral foreign operations. In the
consolidated Accounts, these are considered as hedges of
net investment in non-integral foreign operations and are
recognized directly in shareholders’ funds. (Refer note 6 on
page 112)
Global and Industry outlook
According to NASSCOM Strategic Review 2011, IT spend in
2011 is expected to grow about 4%. It is expected that in 2011,
there will be increased use of Cloud and Mobile Computing. IT
Services is expected to grow by about 3.5% in 2011 and 4.5% in
2012. Organisations will look for alternative IT models like Cloud,
On-demand Services, SaaS, etc, – in order to reduce hardware
infrastructure costs and achieve scalability on demand.
The Forrester US and Global IT market Outlook Q3, 2010-
11 predicts that U.S. IT market will grow by 6.6% in 2011.
Companies are increasingly turning to Offshore Technology
Service providers in order to meet their needs for high quality,
cost competitive technology solutions. As a result, spending in
several IT categories is expected to expand.
Subsidiary Companies
The Ministry of Corporate Affairs, Government of India, has
granted a general exemption under section 212(8) of the
Companies Act, 1956 from the requirement to attach detailed
financial statements of each subsidiary. In compliance with
the exemption granted, we have presented in page 163 & 164
summary financial information for each subsidiary.
The detailed financial statements and audit reports of each of the
subsidiaries are available for inspection at the registered office of
the company during office hours between 11 am to 1 pm and
upon written request from a shareholder, your company will
arrange to send the financial statements of subsidiary companies
to the said shareholder.

50 Annual Report 2010-11
Consolidated Results
Our Sales for the current year grew by 15% to `. 316,938 million
and our Profit for the year was ` 52,924 million, recording an
increase of 14% over the previous year. Over the last 10 years, our
Sales and Profit after Tax have grown at a CAGR (compounded
annual growth rate) of 26% and 23% respectively.
Dividend
Your Directors recommend a final Dividend of 200% (` 4/- per
equity share of ̀ 2/- each) to be appropriated from the profits of
the year 2010-11, subject to the approval of the shareholders at
the ensuing Annual General Meeting. The Dividend will be paid
in compliance with applicable regulations.
During the year 2010-11, unclaimed dividend of ` 1,37,605/-
was transferred to the Investor Education and Protection Fund,
as required under the Investor Education and Protection Fund
(Awareness and Protection of Investor) Rules, 2001.
Interim Dividend
Pursuant to the approval of Board of Directors on January 21,
2011, your company had distributed an interim dividend of
` 2/- per share, of face value of ` 2/- each, to shareholders, who
were on the Register of Members of the company as at closing
hours of January 28, 2011, being the record date fixed by the
Board of Directors for this purpose.
Issue of Bonus equity shares/American Depository Shares
In terms of approval of the shareholders of the company through
Postal Ballot pursuant to Section 192 A(2) of the Companies
Act, 1956 read with the companies (Passing of the Resolutions by
Postal Ballot) on June 4, 2010, the Company had allotted Bonus
equity shares of ` 2/- each in the ratio of 2:3 (two bonus shares
for every three shares held) to the shareholders of the Company
who were on the Register of Members of the Company as on
June 16, 2010, being the Record Date fixed by the Board of the
Directors of the Company for this purpose.
Mergers and Acquisitions
During the year, the Company re-structured a few of its
subsidiaries including overseas subsidiaries through merger/
other legal process.
Wipro Yardley Consumer Care Private Limited, a subsidiary
Company got merged with Wipro Limited w.e.f. April 1, 2010,
being the Appointed Date.
Investments in direct subsidiaries
During the year under review, your Company had invested
an aggregate of USD 34 Mn as equity in its direct subsidiaries
i.e. Wipro Cyprus Private Limited, Wipro Inc, Wipro Holdings
Mauritius Limited and Wipro Infrastructure Engineering
Machinery (Changzhou) Co., Ltd. Apart from this, your Company
had funded its subsidiaries, from time to time, as per the fund
requirements, through loans, guarantees and other means.
Corporate Governance & Corporate Social Responsibility
Your company believes that Corporate Governance is the basis
of stakeholder satisfaction. Your company’s governance practices
are described separately in page 63 of this annual report. Your
company has obtained a certification from V. Sreedharan &
Associates, Company Secretaries on compliance with clause
49 of the listing agreement with Indian Stock Exchanges. This
certificate is given in page 92.
With a view to strengthen the Corporate Governance
framework, the Ministry of Corporate Affairs has incorporated
certain provisions in the Companies Bill 2009. The Ministry of
Corporate Affairs has also issued a set of Voluntary Guidelines
on Corporate Governance and Corporate Social Responsibility
in December 2009 for adoption by companies. The Guidelines
broadly outline conditions for appointment of directors, guiding
principles to remunerate directors, responsibilities of the Board,
Risk Management, rotation of audit partners, audit firms and
conduct of secretarial audit and other Corporate Governance
and Corporate Social Responsibility related disclosures. Your
Company has by and large complied with various requirements
and is in the process of initiating appropriate action for other
applicable requirements.
Corporate Governance is also related to Innovation and strategy
as the organization’s ideas of Innovation and strategies are driven
to enhance stakeholder satisfaction.
Personnel
The particulars of employees as required by Section 217 (2A) of
the Companies Act, 1956, read with the Companies (Particulars
of Employee) Rules, 1975 as amended have been provided as
Annexure ‘C’ to this report.
Wipro Employee Stock Option Plans (WESOP) / Restricted
Stock Unit Plans
Information relating to stock options program of the Company
is provided as Annexure B of this report. The information is
being provided in compliance with Clause 12 of the Securities
and Exchange Board of India (Employee Stock Option Scheme)
and (Employee Stock Purchase Scheme) Guidelines, 1999, as
amended. No employee was issued Stock Option, during the year
equal to or exceeding 1% of the issued capital of the Company
at the time of grant.
Foreign Exchange Earnings and Outgoings
During the year, your company has earned foreign exchange of
` 183,771 million and the outgoings in foreign exchange were
` 85,642 million, including outgoings on materials imported
and dividend.
Research and Development
Requirement under Rule 2 of Companies (Disclosure of particulars
in the report of Board of Directors) Rules, 1988 regarding Technical
Absorption and Research and Development in Form B is given in
Page 54 of the Annual Report, to the extent applicable.

Wipro Limited 51
Conservation of Energy
The Company has taken several steps to conserve energy through
its “Eco Eye and Sustainability” initiatives disclosed separately as
part of this Annual Report. The information on Conservation
of Energy required under Section 217(1)(e) of the Companies
Act, 1956 read with Rule 2 of the Companies (Disclosure of
Particulars in the Report of Board of Directors) Rules, 1988 is
provided in Annexure A in page 53 of this annual report.
Directors:
(A) Appointment
1. Mr. T. K. Kurien was appointed as an Additional
Director of the Company with effect from
February 1, 2011 in accordance with Section 260 of
the Companies Act, 1956, by the Board of Directors
at its meeting held on January 21, 2011. Mr. T. K.
Kurien will hold office till the date of the Annual
General Meeting of the Company scheduled to be
held on July 19, 2011. The requisite notices together
with necessary deposits have been received from a
member pursuant to Section 257 of the Companies
Act, 1956 proposing the election of Mr. T.K. Kurien as
a Director of the Company. Accordingly, necessary
resolution has been included in the notice for calling
Annual General Meeting, for his appointment as
a Director (designated as CEO (IT Business) and
Executive Director).
2. Mr. M.K. Sharma was appointed as an Additional
Director of the Company in accordance with Section
260 of the Companies Act, 1956, by the Board of
Directors with effect from July 1, 2011. The Additional
Director would hold office till the date of Annual General
Meeting of the Company scheduled to be held on
July 19, 2011. The requisite notices together
with necessary deposits have been received
from a member pursuant to section 257 of the
Companies Act, 1956 proposing the election of
Mr. M. K. Sharma, as a Director.
(B) Re-appointment
Articles of Association of the Company provide that at least two-
third of our Directors shall be subject to retirement by rotation.
One third of these retiring Directors must retire from office at
each Annual General Meeting of the shareholders. A retiring
Director is eligible for reelection. Mr. Suresh C Senapaty, Mr
William Arthur Owens and Mr B C Prabhakar retire by rotation and
being eligible offer themselves for reappointment at the ensuing
Annual General Meeting. The Board Governance and Nomination
Committee have recommended their re-appointment for
consideration of the Shareholders.
Board of Directors vide circular resolution of June 15, 2011,
re-appointed Mr. Azim H Premji as Chairman and Managing
Director of the Company (designated as “Chairman”) for a
further period of two years with effect from July 31, 2011. This
re-appointment is subject to the approval of the shareholders of
the Company at the ensuing Annual General Meeting.
(C) Cessation
During the year 2010-11 Mr. Girish S Paranjpe and Mr. Suresh
Vaswani resigned as Board members of the company with effect
from closure of business hours on January 31, 2011.
The Board places on record the valuable contributions of
Mr. Girish S Paranjpe and Mr. Suresh Vaswani during their tenure
as Directors of the Company.
Group
The names of the Promoters and entities comprising “group”
(and their shareholding) as defined under the Monopolies and
Restrictive Trade Practices (“MRTP”) Act, 1969 for the purposes
of Section 3(1)(e)(i) of SEBI (Substantial Acquisition of Shares and
Takeover) Regulations, 1997 include the following:
Sl.
No.
Name of the shareholder No. of
shares
1 Azim H Premji 93,405,100
2 Yasmeen A Premji 10,62,666
3 Rishad Azim Premji 9,46,666
4 Tariq Azim Premji 2,65,000
5 Mr. Azim Hasham Premji Partner
Representing Hasham Traders
543,765,000
6 Mr Azim Hasham Premji Partner
Representing Prazim Traders
541,695,000
7 Mr. Azim Hasham Premji Partner
Representing Zash Traders
540,408,000
8 Regal Investments & Trading Company
Pvt Ltd
1,87,666
9 Vidya Investment & Trading Company
Pvt Ltd
1,87,666
10 Napean Trading & Investment Company
Pvt Ltd
1,87,666
11 Azim Premji Foundation (I) Pvt. Ltd 10,843,333
12 Azim Premji Trust 2,13,000,000
13 Azim Premji Trustee Company Private
Limited
NIL
14 Azim Premji Foundation for
Development
NIL
15 Azim Premji Foundation NIL
16 Azim Premji Trust Services Private
Limited
Nil
17 Azim Premji Safe Deposits Private
Limited
Nil
18 Azim Premji Custodial Services Private
Limited
Nil

52 Annual Report 2010-11
Management’s Discussion and Analysis Report
The Management’s Discussion and Analysis on Company’s
performance – industry trends and other material changes with
respect to the Company and its subsidiaries, wherever applicable,
are presented on pages 32 through 48 of this annual report.
Re-appointment of Statutory Auditor
The auditors, M/s. BSR & Co., Chartered Accountants, retire at
the ensuing Annual General Meeting and have confirmed their
eligibility and willingness to accept office, if re-appointed. The
proposal for their re-appointment is included in the notice for
Annual General Meeting sent herewith.
Re-appointment of Cost Auditor
Pursuant to the direction from the Ministry of Corporate Affairs
for appointment of Cost Auditors, your Board of Directors has
re-appointed M/s. P.D. Dani & Co., Cost Accountants, as the Cost
Auditor for the year ended March 31, 2012.
The Cost Audit report for the year ended March 31, 2010 was
due on September 30, 2010 and was filed by the cost Auditor
on August 25, 2010.
Fixed Deposits
Your company has not accepted any fixed deposits. Hence, there
is no outstanding amount as on the Balance Sheet date.
Green Initiatives in Corporate Governance
Ministry of Corporate Affairs has recently permitted companies
to send electronic copies of Annual Report, notices etc., to the
e-mail IDs of shareholders. We have accordingly arranged to
send the soft copies of these documents to the e-mail IDs of
shareholders wherever applicable. In case any of the shareholder
would like to receive physical copies of these documents, the
same shall be forwarded on written request to the Registrars
M/s. Karvy Computer Share Private Limited.
Directors’ Responsibility Statement
On behalf of the Directors I confirm that as required under
Section 217 (2AA) of the Companies Act, 1956.
a) In the preparation of the annual accounts, the applicable accounting standards have been followed and that no material departures are made from the same;
b) We have selected such accounting policies and applied them consistently and made judgements and estimates that are reasonable and prudent so as to give true and fair view of the state of affairs of the Company at the end of the financial year and of the profits of the Company for the period;
c) We have taken proper and sufficient care for the maintenance of adequate accounting records in accordance with the provisions of the Companies Act, 1956 for safeguarding the assets of the Company and for preventing and detecting fraud and other irregularities; and
d) We have prepared the annual accounts on a going concern basis.
Acknowledgements and Appreciation
Your Directors take this opportunity to thank the customers,
shareholders, suppliers, bankers, business partners/associates,
financial institutions and Central and State Governments for
their consistent support and encouragement to the Company.
I am sure you will join our Directors in conveying our sincere
appreciation to all employees of the Company for their hard
work and commitment. Their dedication and competence has
ensured that the Company continues be a significant and leading
player in the IT services industry.
For and on behalf of the Board of Directors
Azim H. Premji,
Chairman
Bangalore, June 17, 2011

Wipro Limited 53
Annexure A forming part of the Directors’ Report
A. DISCLOSURE OF PARTICULARS WITH RESPECT TO CONSERVATION OF ENERGY
( Wipro Infrastructure Engineering Division)
ELECTRICITY 2010-11 2009-10
a. Purchased
Unit KWH 8,528,328 5,683,709
Total Amount ` 46,194,564 30,024,982
Rate/Unit ` 5.42 5.28
b. Own Generation through DG
Unit KWH 1,080,430 824,978
Unit/Ltr. Of
Diesel
Units 2.91 2.53
Cost per unit ` 13.28 13.87
B. CONSUMPTION PER UNIT PRODUCTION
( Wipro Infrastructure Engineering Division)
Hydraulic cylinder Electricity
(kwh/Cyl.)
Diesel
(Lts/Cyl.)
2010-11 20.11 0.77
2009-10 20.40 1.02
C. DISCLOSUREOF PARTICULARS WITH RESPECT TO
CONVERSATION OF ENERGY
( Wipro Consumer Care Division)
Electricity 2010-11 2009 - 2010
a Purchased
Unit KWH 19,857,756 18,104,719
Total Amount ` 98,858,732 81,983,935
Rate/unit ` 4.98 4.53
b Own generation
Through Diesel
Generator
Unit KWH 1,961,637 1,047,006
Unit/litre of diesel Units 3.14 3.15
Cost per unit ` 12.25 10.90
Coal
Quantity Tones 1,843 2,594
Total Cost ` 10,184,851 12,115,327
Av. Rate ` 5,528 4,671
Furnace Oil 2010-11 2009-10
Quantity FO Ltrs. 3,149,110 4,546,900
Total Cost ` 102,419,666 120,679,932
Av. Rate ` 32.52 26.54
LPG & Propane
Quantity Kgs. 741,751 697,410
Total Cost ` 30,954,644 24,944,813
Av. Rate ` 41.73 35.77
H2 Gas
Quantity CMT 108,642 107,623
Total Cost ` 3,547,283 3,670,983
Av. Rate ` 32.65 34.11
D. CONSUMPTION PER UNIT PRODUCTION
( Wipro Consumer Care Division)
Vanaspati Electricity
(KWH/ Tonne)
Liquid Diesel Oil
(Litres / Tonne)
ACT STD
2010/11 132.38 109 NA
2009/10 130.53 109 NA
General Lighting
System
Electricity
(KWH/ 000 nos.)
Liquid Diesel Oil
(Litres / 000 nos.)
ACT STD ACT STD
2010/11 14.04 16.00 0.36 -
2009/10 14.72 16.00 0.37 -
Flourescent Tube
Light
Electricity
(KWH/ 000 nos.)
Liquid Diesel Oil
(Litres / 000 nos.)
ACT STD ACT STD
2010/11 107.55 129.00 5.19 -
2009/10 135.20 136.00 3.79 -

54 Annual Report 2010-11
FORM B
Wipro’s R&D Activities: 2010-11
Wipro’s R&D focus is to strengthen the portfolio of Applied
Research, Centers of Excellence (CoE), Solution Accelerators and
Software Engineering Tools & Methodologies.
Applied Research
Your Company’s activities in Applied Research are focused
around Content Analytics and E-discovery. Investment in
Applied Research has helped in collaboration with academic
institutes like Georgia Tech for Enterprise Software Infrastructure
performance in the cloud and IIIT-B in the space of social
analytics. Your Company has filed invention disclosures in the
area of query processing incubated solutions of E-discover and
made publications in ACM.
Your Company’s researchers were actively involved in
Government committees to integrate Rupee sign into ICT
environments. Rupee symbol is incorporated into personal
computers and first keyboard was created with the Indian
Rupee symbol.
Your Company has entered into a joint collaboration agreement
with Imec, a leading research institution from Belgium, world
leader in Applied Research in Semiconductor and Nano
technology in March 2011. The joint team being set up at Wipro’s
campus in Bangalore will develop IPs targeted for products and
solutions based on MEMS based smart sensors for emerging
market need.
Centers of Excellence (CoE)
The goal of a CoE is to create competencies in emerging areas of
technologies and industry domain and incubate new practices
for business growth. In order to enhance focus, few technologies
are driven centrally as Theme initiatives. For FY 2010-11, the
technology themes identified were Cloud Computing, Green
IT, Social Computing, Information Management, Mobility,
Collaboration and Open Source. Investments in Technology
Themes have resulted in creation of several new services
like Cloud SI Services, Cloud Originator Services in areas of
Mortgage Processing and Green Consulting. We have established
partnerships with leading technology platform providers like
Microsoft, Cisco, EMC, HP, Oracle, Amazon, Salesforce, etc.
Solution Accelerators
Your Company continued to invest in Reusable IP’s/Solution
Accelerators (components, tools, frameworks) which help in
accelerating the implementation of Solutions in customer
engagements. Your Company has integrated various accelerator
assets to create integrated stacks and solution.
Sample examples of integrated stack and solutions and business
platforms are the Wipro Cloud Stack, Digital Marketing Platform
and Enterprise Grade Smart Meters, Telco in a Box, Oracle based
Clinical Trials solutions.
Software Engineering Tools & Methodologies
Your Company continued to invest in in-house development of
Software Engineering tools to improve productivity and Quality;
Examples include Wipro Style, Wipro Accelerator , Wipro Unit Test
and Wipro Code Checker and Deepcheck. These tools have been
widely deployed across projects in your Company.
Your Company continued investment in developing an approach
for Flex Shared Delivery with innovative solution for effective
queue and capacity management for reduced cost.
Your Company has developed an in-house KEDB (Known Error
Data Base) Tool that will help in faster ticket resolution in
Managed Services projects.
Patents
In FY 2010-11, your Company had filed for 7 new patents and
from the previous filings, 6 patents have been granted.
Expenditure on R&D
During the year under review, your company incurred an
expenditure of ` 1,656 million including capital expenditure in
continued development of R& D activities.

Wipro Limited 55
An
ne
xu
re B
DISCLO
SUR
E IN
COMPLIANC
E WIT
H T
HE
CLA
US
E 12
OF
TH
E S
EBI (
EMPLO
YE
E S
TOCK
OP
TION
SC
HEM
E) A
ND
(EMPLO
YE
E S
TOCK
PURC
HAS
E SC
HEM
E) G
UID
ELIN
ES
1999,
AS
AM
END
ED
Sl.
No
.
De
scri
pti
on
WE
SO
P 1
99
9W
ES
OP
20
00
AD
S 2
00
0
Sto
ck O
pti
on
Pla
n
Wip
ro
Re
stri
cte
d
Sto
ck U
nit
Pla
n 2
00
4
Wip
ro
Re
stri
cte
d
Sto
ck U
nit
Pla
n 2
00
5
AD
S
Re
stri
cte
d
Sto
ck U
nit
Pla
n 2
00
4
Wip
ro
Re
stri
cte
d
Sto
ck U
nit
Pla
n 2
00
7
1Tota
l Number of options under the
Plan
50,000,000
(Ad
justed
for
the
issue
of
bonus shares in
the
years
2004,
2005
and
20
10)
250,000,000
(Ad
justed
for the
issue
of bonus
shares in
the
years
2004, 2005
and
20
10)
15,000,000
ADS
representing
15,000,000
underlying
equity shares
(Ad
justed
for
the
issue
fo
bonus shares
of the
years
2004, 2005
and
20
10)
20,000,000
(Ad
justed
for
the
issue
of
bonus shares
of the
years
2004, 2005
and
20
10)
20,000,000
(Ad
justed
for
the
issue
of
bonus shares
of the
year
2005
and
20
10)
20,000,000
ADS
representing
20,000,000
underlying
equity shares
(Ad
justed
for
the
issue
of
bonus shares
of the
years
2004. 2005
and
20
10)
16,666,667
(Ad
justed
for
the
issue
fo
bonus shares
of the
year
20
10
2Options/RSUs grants
approved
during
the
year
--
-1,352,480
3,390,840
84,580
1,837,030
3Pri
cing
form
ula
Fair
market
value
i.e. the
market pri
ce
as defined
by
the
Se
curities
and
Exchange
Board
of India
Fair
market va
lue
i.e. the
market
pri
ce as defined
by the
Se
curities
and
Exchange
Board
of India
Exercise
pri
ce
being
not
less
than
90%
of
the
market
pri
ce on
the
date
of grant
Face
va
lue
of
the
share
Face
va
lue
of
the
share
Face
va
lue
of
the
share
Face
va
lue
of
the
share
4Options
Vested
during
the
year
--
-92
1,477
5,5
19,756
1,073,3
12
-
5Options exercised
during
the
year
80,000
1,6
18,092
3,864,1
18
870,622
-
6Tota
l number of shares arising
as a
resu
lt of exercise
of option
(as of March
31, 20
11)
-80,000
-1,6
18,092
3,864,1
18
870,622
-
7Options
lapsed/forfeited
during
the
year *
-12
1,606
-1
11,960
646,488
233,7
15
73,950
8Variation
of term
s of options upto
March
31, 20
11
--
--
--
-
9Money rea
lised
by exercise
of options
during
the
year (Rs.)
-23,472,000
-3,236,185
7,728,235
1,74
1,244
-

56 Annual Report 2010-11
Sl.
No
.
De
scri
pti
on
WE
SO
P 1
99
9W
ES
OP
20
00
AD
S 2
00
0
Sto
ck O
pti
on
Pla
n
Wip
ro
Re
stri
cte
d
Sto
ck U
nit
Pla
n 2
00
4
Wip
ro
Re
stri
cte
d
Sto
ck U
nit
Pla
n 2
00
5
AD
S
Re
stri
cte
d
Sto
ck U
nit
Pla
n 2
00
4
Wip
ro
Re
stri
cte
d
Sto
ck U
nit
Pla
n 2
00
7
10
Tota
l number of options in
options in
force
at the
end
of the
year (granted,
vested
and
unexercised/unvested
and
unexercised
--
-3,23
1,032
10,36
1,5
19
3,223,892
1,790,2
10
11
Emp
loyee
wise
details
of options
granted
to
:
--
--
--
-
i. Senior Management during
the
year
a.
Suresh
Vasw
ani
Nil
Nil
Nil
Nil
Nil
Nil
50,000
b.
Girish
Paran
jpe
Nil
Nil
Nil
Nil
Nil
Nil
50,000
c.
T K
Kurien
Nil
Nil
Nil
Nil
Nil
Nil
30,000
d.
S Deb
Nil
Nil
Nil
Nil
Nil
Nil
18,000
e.
Pratik Kumar
Nil
Nil
Nil
Nil
Nil
Nil
30,000
f. Vineet Agrawa
lNil
Nil
Nil
Nil
Nil
Nil
40,000
g.
Martha
Be
jar
Nil
Nil
Nil
Nil
Nil
16,600
Nil
ii.
Emp
loyees ho
lding
5%
or more
of the
tota
l number of options
granted
during
the
year
Nil
Nil
Nil
Nil
Nil
Nil
Nil
iii. Identified
emp
loyees who
were
granted
option, during
any one
year,
equa
l to
or exceeding
1%
of the
issued
capita
l (exc
luding
outstanding
warrants
and
conversions)
of the
Company at
the
tim
e of grant
Nil
Nil
Nil
Nil
Nil
Nil
Nil
12
Dilu
ted
Earning
per Share
pursuant
to issue
of shares on
exercise
of
option
ca
lcu
lated
in a
ccordan
ce with
Accounting
Standard
(AS
) 20
19.78
19.78
19.78
19.78
19.78
19.78
19.78

Wipro Limited 57
Sl.
No
.
De
scri
pti
on
WE
SO
P 1
99
9W
ES
OP
20
00
AD
S 2
00
0
Sto
ck O
pti
on
Pla
n
Wip
ro
Re
stri
cte
d
Sto
ck U
nit
Pla
n 2
00
4
Wip
ro
Re
stri
cte
d
Sto
ck U
nit
Pla
n 2
00
5
AD
S
Re
stri
cte
d
Sto
ck U
nit
Pla
n 2
00
4
Wip
ro
Re
stri
cte
d
Sto
ck U
nit
Pla
n 2
00
7
13
Where
the
Company has
calcu
lated
the
emp
loyees
compensation
cost
using
the
instrinsi
c va
lue
of the
sto
ck
opitons,
the
differen
ce betw
een
the
emp
loyee
compensation
cost
so computed
and
the
emp
loyee
compensation
cost
that sha
ll have
been
re
cognised
if it
had
used
the
fair
vau
le of the
options.
The
impa
ct of this
differen
ce on
profits
and
on
EPS
of the
Company
Not app
licab
le
as there
were
no
grants
during
the
year
under this
Plan
Not app
licab
le
as there
were
no
grants
during
the
year under
this
Plan
Not
app
licab
le as
there
were
no
grants
during
the
year
under this
Plan
Sin
ce these
options were
granted
at
a nomina
l
exercise
pri
ce, intrinsi
c
value
on
the
date
of grant
approximates
the
fair
va
lue
of options
Sin
ce these
options were
granted
at
a nomina
l
exercise
pri
ce, intrinsi
c
value
on
the
date
of grant
approximates
the
fair
va
lue
of options
Sin
ce these
options were
granted
at
a nomina
l
exercise
pri
ce, intrinsi
c
value
on
the
date
of grant
approximates
the
fair
va
lue
of options
Sin
ce these
options were
granted
at
a nomina
l
exercise
pri
ce, intrinsi
c
value
on
the
date
of grant
approximates
the
fair
va
lue
of options
14
Weighted
average
exercise
pri
ces
and
weighted
average
fair
va
lues of
options separate
ly for options whose
exercise
pri
ce either equa
ls or exceeds
or is
less
than
the
market pri
ces of the
sto
ck
Not app
licab
le
as there
were
no
grants
during
the
year
under this
Plan
Not app
licab
le
as there
were
no
grants
during
the
year under
this
Plan
Not
app
licab
le as
there
were
no
grants
during
the
year
under this
Plan
Exercise
pri
ce
Rs.
2/-
per
option. Fair
value
Rs.
480.20/-
as
on
March
31,
20
11
Exercise
pri
ce
Rs.
2/-
per
option. Fair
value
Rs.
480.20/-
as
on
March
31,
20
11
Exercise
pri
ce Rs.
2/-
per option.
Fair
va
lue
$
14.65/-
as on
March
31,
20
11
Exercise
pri
ce
Rs.
2/-
per
option. Fair
value
Rs.
480.20/-
as
on
March
31,
20
11
15
A description
of method
and
signifi
cant assumptions used
durng
the
year to
estim
ate
the
fiar va
lues
of options,
including
the
fo
llowing
weighted
average
inform
ation:
--
--
--
-
(a)
risk
free
interest
rate
(b)
exp
ected
life
(c )
exp
ected
vo
lati
lity
(d)
exp
ected
dividends and
(e)
the
pri
ce fo
the
underlying
share
in m
arket at
the
tim
e of option
grant
Not app
licab
le
as there
were
no
grants
during
the
year
under this
Plan
Not app
licab
le
as there
were
no
grants
during
the
year under
this
Plan
Not
app
licab
le as
there
were
no
grants
during
the
year
under this
Plan
Sin
ce these
options were
granted
at
a nomina
l
exercise
pri
ce, intrinsi
c
value
on
the
date
of grant
approximate
ls
the
fair
va
lue
of options
Sin
ce these
options were
granted
at
a nomina
l
exercise
pri
ce, intrinsi
c
value
on
the
date
of grant
approximate
ls
the
fair
va
lue
of options
Sin
ce these
options were
granted
at
a nomina
l
exercise
pri
ce, intrinsi
c
value
on
the
date
of grant
approximate
ls
the
fair
va
lue
of options
Sin
ce these
options were
granted
at
a nomina
l
exercise
pri
ce, intrinsi
c
value
on
the
date
of grant
approximate
ls
the
fair
va
lue
of options
* As per the
Plan, O
ptions/RSUs
lapse
on
ly on
term
ination
of the
Plan. If an
Option/RSU, exp
ires or be
comes unexercisab
le without having
been
exercised
in fu
ll,
such
options sha
ll be
come
availab
le for future
grant under the
Plan.

58 Annual Report 2010-11
An
ne
xu
re C
Particu
lars
of
Emp
loyees form
ing
part
of the
Dire
ctor’s Report
for the
year ended
March
31, 20
11
Inform
ation
pursuant to
Se
ction
217(2A)(b)(ii)
of the
Companies
Act, 1956
and
the
Companies (Particu
lars
of
Emp
loyees)
Ru
les,
1975.
Sl.
No
.
Na
me
Da
te o
f Jo
inin
gR
em
un
era
tio
n
(`)
De
sig
na
tio
nQ
ua
lifi
cati
on
Ex
pe
rie
nce
Ag
eL
ast
Em
plo
ym
en
t
1Abhijit Bhaduri
01/10/2009
9,078,4
18
Chief Learning
Offi
cer &
Head
-
CHRD
MBA
26
51
Microsoft
Corp
2A
chuthan
Nair
29/04/199
16,336,844
Vice
- President-&
Business
Head
PGDBM, B
E19
44
Hindustan
Petro
leum
3A
joy Menon
21/02/2000
6,072,872
Vice
- President
B.A, PGDM,
16
39
First
Emp
loym
ent
4Amitava
Sharm
a17/05/1999
6,054,140
Vice
- President
MBA, B
E20
42
Pri
cewaterhouse
Coop
5Anand
Sankaran
26/06/1989
9,600,30
1Sr.
Vice
President &
Business
Head
BE
21
42
Perte
ch Computers
6Anil Chugh
19/04/1999
8,670,880
Sr.
Vice
President
B.Te
ch, M
MS
20
45
Gillette
7Anil K
Jain
10/04/1989
8,036,39
1Sr.
Vice
President
& Business
Head-
Globa
l Communic
BE, M
BA
21
46
Org
Systems
8Anurag
Behar
20/05/2002
6,568,273
Chief Sustainab
lity
Offi
cer
BE, M
BA
14
43
Wipro
GE
Medica
l
Systems
9Anurag
Mehrotra
02/0
1/200
16,878,649
Vice
President
and
Head
Client
Re
lationship
Group
BE
24
47
Inform
ix
Internationa
l
10
Ashutosh
Vaidya
17/0
1/1962
9,626,423
Head
Wipro
BPO
BE
24
49
HP
GLO
BALSOF
T
LTD
11
Badiga
L K
29/10/1990
15,05
1,737
Chief Inform
ation
Offi
cer
MTe
ch, B
E3
155
Alghmin
Communicatin
Services,
Kuwait
12
Bhanumurthy B
M03/09/1992
12,965,652
Senior
Vice
President-
Retail,CPG&
Distribution
PGDM, Bte
ch24
46
CMC
13
Dayapatra
Nevatia
15/02/1993
6,96
1,224
Vice
President &
Vertica
l Head-Energy
MTe
ch, Bte
ch17
41
First
Emp
loym
ent
14
Deepak
Jain
21/03/1986
8,400,529
Senior
Vice
President
& G
loba
l Head
- TIS
BE
24
45
Raba
Conte
l .P.
Ltd/
15
Dr.Anurag
Srivastava
15/12/2000
6,604,122
Chief Te
chno
logy
Offi
cer
BTe
ch, M
Tech
, PHD
19
43
Evizeon

Wipro Limited 59
Sl.
No
.
Na
me
Da
te o
f Jo
inin
gR
em
un
era
tio
n
(`)
De
sig
na
tio
nQ
ua
lifi
cati
on
Ex
pe
rie
nce
Ag
eL
ast
Em
plo
ym
en
t
16
Gangadharaiah
C P
16/02/1995
10,1
18,669
Senior
Vice
President-
Testing
Services
BE, M
E, M
.Sc.
33
57
ITI Ltd.
17
Hariprasad
Hegde
01/0
1/2005
6,267,522
VP
and
BU
Head
-
Wipro
Water
PG
Dip
loma, B
Tech
,
B.SC.
27
50
Satyam
Computer
Services Limited
18
Harish
J Shah
18/02/199
112,242,8
12
Sr
VP
and
Globa
l
Operations
Head
Others, ICWA, B
COM
30
53
Nationa
l Textiles
Corpn
Ltd.,
19
Harsh
Bhatia
14/0
1/1966
6,834,109
Vice
President
B.SC., SSC,
23
45
DakS
H
20
Harsha
La
l08/0
1/2007
7,263,585
Vice
President-
Business
Head
-
Microsoft
BTe
ch, PGDM
23
49
Sun
Microsystems
Inc
21
Hoshedar Contra
ctor
01/02/196
17,508,060
Vertica
l Head
B Com
22
50
KLM
/NW
Air
lines
22
Jagdish
Ramasw
amy
28/02/2003
7,944,667
Chief Qua
lity Offi
cer
BE, D
iploma
25
46
Tyco
Hea
lth
Care
23
Kenny Kesar
27/12/2006
6,877,467
Vice
- President-
Inform
ation
Systems
BE
19
41
GE
Hea
lth
care
24
Keyu
r Maniar
16/02/1970
6,2
17,259
Vertica
l Head
BE
, MBA, D
iploma
16
41
Capita
l One
Finan
cia
l
25
Kumudha
Sridharan
31/05/1995
6,8
12,424
Vice
- President-
Testing
Services
BE
24
46
ITI Ltd.
26
Lakshminarayana
K R
03/07/1995
10,784,363
Chief Strategy
Offi
cer-IT
Business
B COM,IC
WA,PGD
14
43
First
Emp
loym
ent
27
Madhavan
S15/09/1994
8,949,092
Vice
- President-
So
lution
Definition
BTe
ch,B.SC.
23
46
Cm
c
28
Madhu
Khatri
15/03/2005
14,300,23
1Senior
Vice
President
& Genera
l Counse
l
LLB,B.A,LLM
21
46
Genera
l Ele
ctri
c
29
Manish
Dugar
01/04/2002
9,648,978
Senior
Vice
President
C A
,ICS
ACCOUN
TS
MBA
15
38
Re
ckitt Ben
ckiser
30
Moiz
H Vasw
adaw
ala
06/03/1993
6,1
12,685
Genera
l Manager
and
Business
Head
-
Data
center and
Dip
loma
21
44
Tamim
i Adv/
Tech
no
lo
31
Nagamani M
urthy
01/07/199
17,563,872
Vice
- President-P
ES
BE
25
49
Texas Instruments
32
Padmanabha
K N
01/08/1982
6,342,632
Vice
President - Tru
ck
Hyd
rau
lics
MTe
ch, B
E,PUC
34
59
Bharath
Ele
ctronics
ltd. Banga
lore
33
Pavan
Kumar Goya
l04/0
1/199
17,2
10,006
Vice
- President-
Tech
no
logy
Vertica
l
M.BA.,B.SC.
21
44
First
Emp
loym
ent
34
Paw
an
Kumar S
18/08/1994
6,346,483
Vice
- President-
DW
& BI Pra
ctice
-
eEnab
ling
Grou
BE
17
40
Bem
l

60 Annual Report 2010-11
Sl.
No
.
Na
me
Da
te o
f Jo
inin
gR
em
un
era
tio
n
(`)
De
sig
na
tio
nQ
ua
lifi
cati
on
Ex
pe
rie
nce
Ag
eL
ast
Em
plo
ym
en
t
35
Prasanna
G.K.
01/10/2000
13,25
1,135
Senior
Vice
President-
Tech
no
logy
PGD,Bte
ch26
50
Micro
land
ltd
36
Prasen
jit Saha
05/06/1997
6,647,565
Vice
- President-
Enterprise
Se
curity
Services
Bte
ch18
40
ABB
Lim
ited
37
Pratik Kumar
04/1
1/199
116,564,467
Exe
cutive
Vice
President -
Human
Resources
B.A, M
BA
21
44
TVS
Ele
ctronics
Limited
38
Prem
ji A
H17/08/1966
54,639,256
Chairman
- W
ipro
Ltd
Genera
l Engineering
.Stanford.
44
65
Promoter,
First
Emp
loym
ent
39
Puneet Chandra
10/02/1962
7,520,0
12
Vice
President
ACA,BA
,SSC
27
49
CYGN
ET
SYS
TEMS
40
Ra
jat Mathur
15/1
1/1985
8,820,188
Chief Sa
les and
Operations Offi
cer-
AN
Z &
AS
EAN
BE,M
BA
24
49
Horizon
Mktg
&
Serv
41
Ra
jeev
Mendiratta
23/08/2002
7,676,809
Senior Pra
ctice
Partner-Pro
cess
Exce
llen
ce
BTe
ch16
37
GE
India
42
Ra
jesh
Ram
Mishra
06/05/1988
7,332,626
Vice
- President-P
ES
BTe
ch,M
tech
25
47
Internationa
l Sw
Ind
43
Ramakanth
Desai
12/08/1992
8,883,987
Senior
Vice
President-strategic
clients
Bte
ch25
46
Tata
Unisys
44
Ramakrishnan
R29/1
1/1990
6,9
12,277
Vice
- President-
Hite
ch &
Consumer
Ele
ctronics
ICWA,B
COM
24
46
EID
Parry
45
Ramesh
Nagara
jan
24/10/2000
7,695,590
COO
FS
and
E
enab
ling
ME
22
44
First
Emp
loym
ent
46
Ramit
Sethi
23/10/2006
8,332,027
Sr.
Vice
President
B COM,ACA,
548
Not Ava
liab
le
47
Richa
Tripathi
30/09/1966
6,558,534
TED
Head
MBA
19
45
Dusk
Va
lley
Tech
no
logy
48
Rishad
Prem
ji20/07/2007
5,043,997
Chief Strategy
Offi
cer - IT
Business
B.A,M
BA
12
33
BAIN
& CO
49
Sairaman
Jagannathan
29/08/200
16,162,65
1Vice
President-
Business
So
lutions
Division
BE
27
51
Mascot Systems

Wipro Limited 61
Sl.
No
.
Na
me
Da
te o
f Jo
inin
gR
em
un
era
tio
n
(`)
De
sig
na
tio
nQ
ua
lifi
cati
on
Ex
pe
rie
nce
Ag
eL
ast
Em
plo
ym
en
t
50
Sambuddha
Deb
29/06/1982
16,026,7
11
Exe
cutive
Vice
President-&
Chief
Globa
l De
livery
Offi
cer
PGDM,Bte
ch27
52
First
Emp
loym
ent
51
Sangita
Singh
01/08/1992
12,463,865
Senior
Vice
President-
EAS
BE
18
40
HCL Limited
52
San
jeev
Bhatia
01/0
1/1964
6,02
1,033
Vice
President
BA
20
47
Igate
Globa
l
So
lutions
53
San
jiv K
R16/1
1/1988
8,820,92
1Senior
Vice
President-Business
Tech
no
logies
Services
MMS
23
46
Dcm
Daewoo
54
Saurabh
Govil
11/05/2009
10,8
16,946
Senior
Vice
President
- Human
Resources
B S
c, PGDM-PM&IR
20
44
GE
55
Se
lvan
D05/09/1992
8,25
1,77
1Senior
Vice
President-
Talent
Transform
ation
PGDM,Bte
ch24
48
Niit
Ltd
56
Siby Abraham
16/02/1987
7,2
12,877
Vice
President &
SD
H-P
ES
Mte
ch,Bte
ch23
46
First
Emp
loym
ent
57
Soumitro
Ghosh
26/1
1/1988
14,003,0
16
Senior
Vice
President-Finan
ce
So
lutions
BTe
ch,M
BA
27
49
Blue
Star Ltd
58
Sri
jit Ra
jappan
15/10/1966
6,576,747
Vice
President
B Com
21
44
Stream
Tra
cmail
59
Srinivas Pa
llia
01/02/1992
6,843,0
17
Senior
Vice
President-B
TS(ES)
BTe
ch,M
Tech
,19
44
First
Emp
loym
ent
60
Srinivasan
P V
06/02/1997
11,526,899
Senior
Vice
President
- Corporate
Taxation
C A
26
50
Sundaram
Fasteners
Ltd
61
Sriram
Srinivasan
10/04/1989
10,025,900
Senior
Vice
President-Banking
MBA
24
45
Re
ckit
Co
leman
62
Subhash
Khare
03/10/1990
8,5
19,502
Vice
- President-
Talent
Engagement
& Deve
lopment
BE
26
50
Telco
63
Subrahmanyam
P08/1
1/1983
9,028,106
Senior
Vice
President-
Tele
com
MS
c,MP
HIL,B.SC.
26
49
First
Emp
loym
ent
64
Suresh
B22/05/1989
7,16
1,5
11
Vice
- President-
Manufa
cturing
ME,B
E23
46
First
Emp
loym
ent
65
Suresh
C Senapaty
10/04/1980
23,758,693
Exe
cutive
Dire
ctor
& CFO
B Com, FCA
30
53
Love
lock
& Lewis

62 Annual Report 2010-11
No
tes:
1.
Remuneration
comprises of sa
lary, commission, peform
an
ce based
paymets, a
llowan
ce, m
edica
l, perquisite
and
company’s
contribution
to
PF
and
super-
annuation.
2.
Rishad
Pem
ji is
a re
lative
of the
Chairman
and
Managing
Dir
cector as per the
definition
of “re
lative
” under the
Companies A
ct, 1956.
3.
The
nature
of emp
loym
ent is
contra
ctua
l in
all the
above
cases.
4.
In term
s of the
Notifi
cation
dated
March
31, 20
11
dated
by Ministry of Corporate
Affairs,
emp
loyees posted
and
working
in a
country outside
India, not being
Dire
ctors
or their
re
latives have
not been
included
in the
above
statement.
5.
None
of the
emp
loyees except the
Chairman
ho
lds 2%
or more
of the
paid
up
equity share
capita
l of the
Company.
Sl.
No
.
Na
me
Da
te o
f Jo
inin
gR
em
un
era
tio
n
(`)
De
sig
na
tio
nQ
ua
lifi
cati
on
Ex
pe
rie
nce
Ag
eL
ast
Em
plo
ym
en
t
66
Suryanarayana
Va
lluri
01/03/2000
8,539,026
Vice
President-
Communication
&
Media
PGDBM,B
E2
145
Rpg
Ce
llular
Services Ltd.
67
T K
Kurien
11/02/2000
17,928,434
CEO-I
T Business
BE,C
A28
50
GE
68
Tapan
D Bhat
25/07/1966
6,402,869
Vertica
l Head
MBA
13
45
69
Thandava
Murthy
T D
05/07/2002
10,057,274
Senior
Vice
President
- G
loba
l De
livery-
Infrastu
cture
Services
BE
30
54
Compaq
70
V.Suresh
29/0
1/20
10
6,627,156
Chief Marketing
Offi
cer
B Te
ch, M
BA
17
43
Godre
j Consumer
Care
71
Vasudevan
A3
1/03/1986
10,357,028
Vice
President -
VLSI
/ Systems Design
MTe
ch,B
E24
48
First
Emp
loym
ent
72
Venkatesh
V R
22/03/1984
12,0
10,279
Senior
Vice
President-Produ
ct
Engineering
Services
MTe
ch,M
Sc,B.SC.
26
50
Vikrant
73
Vijayaku
mar I
16/07/1990
8,960,377
Chief Te
chno
logy
Offi
cer
BE,B.SC.
22
45
Ind
chem
74
Vineet Agrawa
l04/12/1985
17,857,177
President
B Te
ch25
49
First
Emp
loym
ent
Part
of the
year
1Bip
lab
Adhya
04/10/20
10
3,63
1,0
17
Vice
President
PGDM
17
40
Trivium
Systems
2Girish
S Paran
jpe
23/07/1990
88,753,33
1Joint C
EO-I
T Business
ICWA, B
COM.
26
53
Wim
co Ltd
3Mohd
Ehteshamu
l Haque
04/10/20
10
3,232,292
Vice
President
MBA
16
39
Genpa
ct
4Pradeep
Bhairwani
19/06/1997
5,579,670
Vice
- President-
Talent Aquisition
BE
20
43
Ram
co Systems
5Suresh
Vasw
ani
02/05/1985
89,736,272
Joint C
EO-I
T Business
BTe
ch,PG
Dip
loma
26
51
Skefco
6V
S Padmanabhan
09/1
1/1994
7,707,907
Senior
Vice
President
- Corporate
Interna
l
Audit
B COM,C
A32
57
Union
Carbide

Wipro Limited 63
Corporate Governance
Report
The Spirit of Wipro represents the core values of Wipro. The three
values encapsulated in the Spirit of Wipro are:
Intensity to Win
Act with Sensitivity
Unyielding Integrity
FIRST LAYER: GOVERNANCE BY SHAREHOLDERS
Annual General Meeting
July 19, 2011, at 4.30 PM
conducted at Wipro campus, Cafeteria Hall, EC-3, Ground
Floor, Opp. Tower 8, No.72, Keonics Electronics city, Hosur
Road, Bangalore 561 229.
Annual General Meetings and other General Body meeting of
the last three years and Special Resolutions, if any.
2007-08,
2008-09
Court Convened Extraordinary General Meeting
2009-10

64
Financial Calendar
Table 01: Calendar for Reporting
Quarter ending Release of results
In addition, the Board may meet on other dates if there are
special requirements.
Interim Dividend
` `
Record Date for Interim Dividend
Final Dividend
` `
Date of Book closure
Final Dividend Payment Date
when declared at the meeting,
National ECS facility
Special Resolution passed during the Financial Year 2010-11
through the Postal Ballot Procedure
related resolutions.
3. Issue of Bonus Shares.
Awards and Rating
The company has been awarded the National award for
excellence in Corporate Governance from Institute of
Company Secretaries of India during the year 2004.

Wipro Limited
Indian IT Brands.
Corporate Social Responsibility and Sustainability Reporting
Our report has been
rated A+ for the third successive
Your Company’s Sustainability Report for 2009-10 has been
assessed by DNV at the A+ level
www.wipro.com/corporate/investors/sustainability-
wipro.htm
Shareholders’ Satisfaction Survey
The analysis of the responses reflects an average
rating of about 3.6 on a scale of 1 to 4. Around 83% of the
shareholders indicated that the services rendered by the
Company were good /excellent and were satisfied.
Means of Communication with Shareholders / Analysis
for release.
News Releases, Presentations, etc
www.wipro.com/
corporate/investors.
Quarterly results
Website:
Annual Report:
Table 02: Communication of Results
Means of communications Number of times during
2010-11
4
4
2
Listing on Stock Exchanges, Stock Codes, International Securities Identification Number (ISIN) and Cusip Number for ADRs
Table 03: Stock codes
Equity shares Stock Codes
Wipro
American Depository Receipts
WIT
Notes:
paid.

66
International Securities Identification Number (ISIN)
INE075A01022.
CUSIP Number for American Depository Shares
Corporate Identity Number (CIN)
Ministry of Company Affairs
L32102KA1945PLC020800, and our
Registrar and Transfer Agents
Share Transfer System
The turnaround time for completion of transfer of shares in
if the documents are clear in all respects.
Address for correspondence
Karvy Computershare Private Ltd.
Overseas depository for ADSs
J.P. Morgan Chase Bank N.A.
Indian custodian for ADSs
Web-based Query Redressal System
http://karisma.karvy.com
after 24 hours. The investors can continue to put additional
Shareholders can also send their correspondence to the
Wipro Limited
Secretarial &
Wipro Limited
Shreemal
Wipro Limited

Wipro Limited
Wipro Limited
com
Description of voting rights
Table 04 Distribution of Shareholding and categories of Shareholders as per Clause 35 of the Listing Agreement as on
March 31, 2011
31-Mar-11 31-Mar-10
Category No of Share
holders
%age of
Shares
No. of Shares % of Total
Equity
No. of Share
holders
%age of
Shares
No. of Shares % of
Total
Equity
434
223
Total
Table 05 Distribution of shareholding – City-wise as of March 31, 2011
Sl.
No.
CITY No. of share
Holders
Percentage No. of equity
shares
Percentage
1 3.63
2
3
4
6
11
12
13
transferred to “ nclaimed Suspense A

Sl.
No.
CITY No. of share
Holders
Percentage No. of equity
shares
Percentage
14
16
21
22
23 4.63
24
26
1.63
2.11
I)(a) Shareholding Pattern as of March 31, 2011 under Clause 35 of the Listing Agreement
Partly paid-up shares No. of partly paid-up
shares
As a % of total no. of partly
paid-up shares
As a % of total no. of shares of
the Company
Total
securities: securities
As a % of total no. of
securities
As a % of total no. of shares of the
Total
Warrants: As a % of total no. of As a % of total no. of shares of
Total
`

Wipro Limited
Categ-ory
code (I)
Category of shareholder
(II)
Number of
shareholders
(III)
Total number
of shares
Number of
shares held in
dematerialized
form
Total shareholding as
a percentage of total
number of shares
Shares Pledged
or otherwise
encumbered
As a
percentage
of (A+B)
As a
percentage
of (A+B+C)
Number
of
Shares
As a
Percentage
(A) Shareholding of Promoter
and Promoter Group
Indian
4
4
Financial Institutions/
3 66.24
Trust 1
Sub-Total (A)(1) 12 1,945,953,763 1,945,421,763 80.64 79.28 Nil Nil
(2) Foreign
Institutions
Sub-Total (A)(2) NIL NIL NIL NIL NIL
Total Shareholding of
Promoter and Promoter
Group (A)= (A)(1)+(A)(2)
12 1,945,953,763 1,945,421,763 80.64 79.28 Nil Nil
(B) Public Shareholding
(1) Institutions
Financial Institutions/ 1.64 1.62
1
Investors
Sub-Total (B)(1) 506 223,110,497 223,110,497 9.25 9.09

Categ-ory
code (I)
Category of shareholder
(II)
Number of
shareholders
(III)
Total number
of shares
Number of
shares held in
dematerialized
form
Total shareholding as
a percentage of total
number of shares
Shares Pledged
or otherwise
encumbered
As a
percentage
of (A+B)
As a
percentage
of (A+B+C)
Number
of
Shares
As a
Percentage
(2) Non-institutions
i. Individual shareholders 2.11
ii. Individual shareholders 3.33
1
Sub-Total (B)(2) 2,19,719 244,048,200 177,102,633 10.11 9.99
Total Public Shareholding
(B)= (B)(1)+(B)(2)
220,225 467,158,697 400,213,130 19.36 19.03 NA NA
TOTAL (A)+(B) 220,237 2,413,112,460 2,345,634,893 100.00 98.32 Nil Nil
(C) Shares held by
Custodians and against
which Depository
Receipts have been issued
Promoter and Promoter
Group
Public 1
GRAND TOTAL (A)+(B)+(C) 220,238 2,454,409,145 2,386,931,578 100 Nil Nil

Wipro Limited
I)(b) Statement showing Shareholding of persons belonging to the category “Promoter and Promoter Group”
Sr. No. Name of the shareholder Number of
shares
Shares as a
percentage of
total number of
shares {i.e., Grand
Total (A)+(B)+(C)
indicated in
Statement at para
(A)(1) above}
Shares Pledged or otherwise encumbered
(I) (II) (III) (IV) Number
(V)
As a
Percentage
(VI)=(V)/
(III)*100
As a Percentage
total A+B+C of
sub-clause (I)(a)
(VIII)
1
2
3
4
6
11
12
TOTAL 1,945,953,763 79.28 Nil Nil Nil
(I)(c) Statement showing Shareholding of persons belonging to the category “Public” and holding more than 1% of the
total number of shares.
Sr. No. Name of the shareholder Number of
shares
Shares as a percentage of total number of shares {i.e., Grand
Total (A)+(B)+(C) indicated in Statement at para (I)(a) above}
1
(I)(d) Statement showing details of locked-in-shares
Sr. No. Name of the shareholder * Category of
Shareholders
(Promoters /
Public)
Number of
locked-in
shares
Locked-in shares as a
percentage of total number
of shares {i.e., Grand Total
(A)+(B)+(C) indicated in
Statement at para (I)(a) above}
1
TOTAL 403,668 0.016

(II)(a) Statement showing details of Depository Receiot (DRs)
Sr.
No.
Type of outstanding DR (ADRs,
GDRs, SDRs, etc.)
Number of
outstanding DRs
Number of shares
underlying
outstanding DRs
Shares underlying outstanding DRs
as a percentage of total number of
shares {i.e., Grand Total (A)+(B)+(C)
indicated in Statement at para (I)(a)
above}
1
Total 41,296,685 41,296,685 0.00
(II)(b) Statement showing Holding of Depository Receipts (DRs), where underlying shares are held by promoter/
promoter group in excess of 1% of the total number of shares.
Sr.
No.
Name of the DR Holder Type of
outstanding DR
(ADRs, GDRs,
SDRs, etc.)
Number of shares
underlying
outstanding DRs
Shares underlying outstanding DRs
as a percentage of total number of
shares {i.e., Grand Total (A)+(B)+(C)
indicated in Statement at para (I)(a)
above}
1
Dematerialization of shares and liquidity
Table 06 - List of top ten shareholders of the Company as at
March 31, 2011
Sl.
No.
Name of the shareholder No. of
shares
%
1
2
3
4
6
Limited
SECOND LAYER: GOVERNANCE BY THE BOARD OF
DIRECTORS
Azim H. Premji
Dr Ashok Ganguly

Wipro Limited
B.C. Prabhakar
Dr. Jagdish N. Sheth
Narayanan Vaghul
Priya Mohan Sinha
William Arthur Owens
Suresh C Senapaty
companies:

T K Kurien
Shyam Saran
Dr. Henning Kagermann
Information flow to the Board Members
of the Board for their approval.
Board Meetings
over telephone.
Post-meeting follow-up system
Disclosure of materially significant related party
transactions
maintained and particulars of transactions are entered in the
on such matters.
Details of non- compliance by the company, penalties, and
strictures imposed on the company by Stock Exchange or SEBI
or any statutory authority, on any matter related to capital
markets, during the last three years

Wipro Limited
Whistle Blower policy and affirmation that no personnel
have been denied access to the Audit, Risk & Compliance
Committee
Details of compliance with mandatory requirements and
adoption of the non-mandatory requirements of this clause
Lead Independent Director
Particulars of directors proposed for re-appointment
Shareholders.
Particulars of director proposed for appointment
Remuneration Policy and criteria of making payments to
Directors

Details of Remuneration to all Directors
Table 07: Directors remuneration paid and grant of stock options during the financial year 2010-11A
zim
H P
rem
ji
N V
ag
hu
l
B C
Pra
bh
ak
ar
Dr
Jag
dis
h N
Sh
eth
Dr
Ash
ok
S G
an
gu
ly
P M
Sin
ha
Bil
l O
we
ns
Su
resh
C S
en
ap
aty
T.K
. Ku
rie
n#
Sh
ya
m S
ara
n
Gir
ish
S P
ara
njp
e**
Su
resh
Va
swa
ni*
*
He
nn
ing
Ka
ge
rma
nn
directors
/Incentives
ation
options
period
`
upees.

Wipro Limited
Ta
ble
08
: Ke
y I
nfo
rma
tio
n p
ert
ain
ing
to
dir
ect
ors
as
on
Ma
rch
31
, 20
11
Azim H Premji
N Vaghul
B C Prabhakar
Dr Jagdish N Sheth
Dr Ashok S Ganguly
P M Sinha
Bill Owens
Suresh C Senapaty
T.K. Kurien$
Shyam Saran$
Henning Kagermann
Independent
Independent
Independent
Independent
Independent
Independent
Independent
Independent
21
32
1
24
2
43
11
21
4#
#
Yes
Yes
Yes
Yes
Yes
Yes
Yes
Yes
Yes
Yes
#

THIRD LAYER: GOVERNANCE BY THE SUB-COMMITTEE OF
THE BOARD OF DIRECTORS
Board either for information or approval.
Audit/Risk and Compliance Committee
the appointment of our independent auditors to the shareholders
Table 09.
Name Position Number of meetings
attended
Board Governance and Nomination Committee
directors.
disclosure.

Wipro Limited
Table 10 provides the composition and attendance of the
Board Governance and Nomination Committee.
Name Position Number of meetings
attended
4
4
4
4
Compensation Committee
Table 11 provides the composition and attendance of the
Compensation Committee.
Name Position Number of meetings
attended
4
4
4
Administrative/Shareholders & Investors Grievance
Committee:
under:
complaints etc.
director.
shareholders and investor complaints.
Table 12 provides the composition and attendance of the
Shareholders / Investors Grievance Committee.
Table 12
Name Position Number of meetings
attended
444
Table 13
Description Nature Received Replied Pending
Securities
annual reports
Warrants
Warrant
3
received
2 2
Total 1048 1043 5

these cases are not material in nature.
Unclaimed Dividends
Table 14
Financial Year Date of declaration of
Dividend
Last date for
claiming unpaid
Dividend
Unclaimed amount
(Rs.)
(number to be
updated)
Due date for transfer to
Investor Education and
Protection Fund
made in respect of such claims.
Secretarial Audit
Compliance
the annual report.
Subsidiary Monitoring Framework

Wipro Limited
FOURTH LAYER: GOVERNANCE OF THE MANAGEMENT
PROCESS
Corporate Executive Council of the Company (CEC)
Code of Business Conduct and Ethics
Ombudsmen process
Compliance Committee
Compliance with adoption of mandatory requirements
Non Compliance on matters related to capital markets
Compliance report on Non-mandatory requirements under
Clause 49
1. The Board – Chairman’s Office & Tenure of Directors
2. Remuneration Committee
3. Shareholders rights

to despatch of letters to all shareholders.
4. Audit Qualifications
5. Training of Board Members
6. Mechanism for evaluation: Independent Board members
the recommendation to the Board. The evaluation process also
7. Whistle Blower Policy
Disclosures by the Management
Code for prevention of Insider Trading
NYSE Corporate Governance Listing Standards
Declaration as required under Clause 49 (I)(D)(ii) of the Stock
Exchange Listing Agreement
Azim H Premji

Wipro Limited
Share Data
Table 15: Monthly high and low price points and volume in National Stock Exchange and New York Stock Exchange is
provided below (Figures adjusted for Bonus shares issued in June 2010 in the ratio of 2:3):
Month April May June July August September October November December January February March
2011
Price in NSE during each Month :
422.4
traded on
that date
424.6 431.4
trade on
that date
S&P CNX Nifty Index during each month:
Wipro Price Movement vis-à-vis Previous
Month High/Low (%) :
1.6% 2.1% 3.4% 12.3%
1.3% 4.2%
S&P CNX Nifty Index Movement vis-à-vis
Previous Month High/Low %
1.3% 2.1% 1.3%
4.6% 3.6% 2.4% 3.3%
Graph : 01 Wipro share price movements in NSE compared with S&P CNX Nifty
-12
-9
-6
-3
0
3
6
9
12
15
MarchFebruaryJanuaryDecemberNovemberOctoberSeptAugJulyJuneMayApril
Relative performance of Wipro Share Vs. S & P CNX Nifty
Wipro Share S & P CNS Nifty Month & Year 2010-11

Table 16 : ADS Share Price during financial year 2010-11 ( ADS price adjusted for Bonus shares issued in June 2010 in ratio of 2:3)
April
price in
14.46 13.16
each month
Wipro
month
13.3% 11.3%
month
2.4%
Graph 02: Wipro Share price movements in NYSE compared with TMT index
-15
-12
-9
-6
-3
0
3
6
9
12
15
MarchFebruaryJanuaryDecemberNovemberOctoberSeptAugJulyJuneMayApril
Relative performance of Wipro ADS Vs. NYSE TMT Index
Wipro ADS Price NYSE TMT Month & Year 2010-11

Wipro Limited
Graph 03: Wipro ADS premium over Equity share price in NSE during the year 2010-11
10%
20%
30%
40%
50%
60%
70%
80%
90%
1-Apr-10
1-May-10
1-Jun-10
1-Jul-10
1-Aug-10
1-Sep-10
1-Oct-10
1-Nov-10
1-Dec-10
1-Jan-11
1-Feb-11
1-Mar-11
WWipip
rro A
DS
o A
DS
PPrrem
ium
emiu
m
AD
S p
rem
ium
Mo
ve
me
nt
as
Pe
rce
nta
ge
ov
er
Eq
uit
y S
ha
re P
rice
in I
nd
ia d
uri
ng
th
e y
ea
r 2
01
0-1
1

Other Information
a. Table 17 Share Capital History
Type Of Issue Year Of Issue Bonus
shares/
Stock
split ratio
Face
Value Of
Shares (`)
Shares Allotted No. of
Shares
Total
Total Paid
Up Capital
(`)
Number Nominal Value
Bonus issue 1:3Bonus issue 1:1Bonus issue 1:1Issue of shares
Bonus issue 1:1
Bonus issue 1:1Bonus issue 1:1Issue of shares
pursuant to
Wipro Infotech
Limited and
Bonus issue 1:1Bonus issue 2:1
1:1Allotment of
pursuant to
options
date for issue of
Bonus 2:1Allotment of
pursuant to
optionsAllotment of
pursuant to
options
date for issue of
Bonus 1:1
Allotment of
pursuant to
options

Wipro Limited
Type Of Issue Year Of Issue Bonus
shares/
Stock
split ratio
Face
Value Of
Shares (`)
Shares Allotted No. of
Shares
Total
Total Paid
Up Capital
(`)
Number Nominal ValueAllotment of
pursuant to
Allotment of
pursuant to
Allotment of
to shareholders
companies
Allotment of
pursuant to
Allotment of
pursuant to
Bonus issue 2:3Allotment of
pursuant to
History of Bonus issues and stock split
Year Ratio

History of Dividend declared for the last thirteen years
Financial Year Dividend amount per share and rate (%) Percentage
` `
` `
` `
` `
` `
` `
` `
` `
` `
` `
` `
` `
` `
` `
` `
` `
` `
Table 18: Mergers and Demergers
Merging Company Merger/Demerger Appointed Date
Wipro Infotech Limited

Wipro Limited
Table No.19: Plant locations
Sl.
No.
Address City/Country
1
2
3
4
6
11
12
13
14
16
21
22
23
24
26
31
32
33
34
36

Sl.
No.
Address City/Country
41
42
43
44
46
France
Finland
Austria
61
62
63
64
66
Finland
Finland
Australia

Wipro Limited
Sl.
No.
Address City/Country
Australia
Australia
The Company’s manufacturing facilities are located at:
Sl. No Address City/ State
1
2
3
4
6
11

Corporate Identity No. : L32102KA1945PLC020800
Nominal Capital Rs. 555 crores
To the Members of Wipro Limited
For V. Sreedharan & Associates
V. Sreedharan
Corporate Governance Compliance Certificate

Financial Statements

Standalone Financial Statements
94 Annual Report 2010-11
To the Members of WIPRO LIMITED
We have audited the attached balance sheet of Wipro Limited (“the Company”) as at March 31, 2011, the profit and loss account
and the cash flow statement for the year ended on that date, annexed thereto. These financial statements are the responsibility of
the Company’s management. Our responsibility is to express an opinion on these financial statements based on our audit.
We conducted our audit in accordance with the auditing standards generally accepted in India. Those standards require that we plan
and perform the audit to obtain reasonable assurance about whether the financial statements are free of material misstatement. An
audit includes examining, on a test basis, evidence supporting the amounts and disclosures in the financial statements. An audit
also includes assessing the accounting principles used and significant estimates made by management, as well as evaluating the
overall financial statement presentation. We believe that our audit provides a reasonable basis for our opinion.
1. As required by the Companies (Auditor’s Report) Order, 2003, as amended (“the Order”), issued by the Central Government of India in terms of Section 227(4A) of the Companies Act, 1956 (“the Act”), we enclose in the Annexure a statement on the matters specified in paragraphs 4 and 5 of the said Order.
2. Further to our comments in paragraph 1 above, we report that:
a) we have obtained all the information and explanations, which to the best of our knowledge and belief were necessary
for the purposes of our audit;
b) in our opinion, proper books of account as required by law have been kept by the Company so far as appears from our
examination of those books;
c) the balance sheet, profit and loss account and cash flow statement dealt with by this report are in agreement with the
books of account;
d) in our opinion, the balance sheet, profit and loss account and cash flow statement dealt with by this report comply with
the accounting standards referred to in sub-section (3C) of Section 211 of the Act ;
e) on the basis of written representations received from the directors as on March 31, 2011 and taken on record by the
Board of Directors, we report that none of the directors is disqualified as at March 31, 2011 from being appointed as a
director in terms of clause (g) of sub-section (1) of Section 274 of the Act; and
f ) In our opinion and to the best of our information and according to the explanations given to us, the said accounts give
the information required by the Act, in the manner so required and give a true and fair view in conformity with the
accounting principles generally accepted in India:
1) in the case of the balance sheet, of the state of affairs of the Company as at March 31, 2011;
2) in the case of the profit and loss account, of the profit of the Company for the year ended on that date; and
3) in the case of the cash flow statement, of the cash flows of the Company for the year ended on that date.
for BSR & Co.
Chartered Accountants
Firm Registration No: 101248W
Natrajh Ramakrishna
Partner
Membership No. 032815
Bangalore
April 27, 2011
Auditors’ Report

Standalone Financial Statements
Wipro Limited 95
Annexure referred to in paragraph 1 of our report to the members of Wipro Limited (“the Company”) for the year ended March 31, 2011
(i) (a) The Company has maintained proper records showing full particulars including quantitative details and situation of fixed
assets.
(b) The Company has a regular programme of physical verification of its fixed assets by which all fixed assets are verified in a
phased manner over a period of three years. In our opinion, this periodicity of physical verification is reasonable having
regard to the size of the Company and the nature of its assets. As informed to us, no material discrepancies were noticed
on such verification.
(c) Fixed assets disposed of during the year were not substantial, and therefore, do not affect the going concern
assumption.
(ii) (a) The inventory (including stocks lying with third parties), except goods-in-transit, has been physically verified by the
management during the year. In our opinion, the frequency of such verification is reasonable.
(b) The procedures for the physical verification of inventories followed by the management are reasonable and adequate
in relation to the size of the Company and the nature of its business.
(c) The Company is maintaining proper records of inventory. As informed to us, the discrepancies noticed on verification
between the physical stocks and the book records were not material.
(iii) (a) The Company has granted loans to wholly owned subsidiaries covered in the register maintained under Section 301 of
the Companies Act, 1956 (“Act”). The maximum amount outstanding during the year and the year-end balance of such
loans are as follows:
(`in million)
Name of the entity Maximum amount
outstanding during the year
Year-end balance
Wipro Cyprus Private Limited 1,577 1,577
Wipro Singapore Pte. Limited 22 22
Wipro Holdings (Mauritius) Limited 3 3
Wipro Inc 2,007 2,007
(b) In our opinion, the rate of interest, where applicable and other terms and conditions on which loans have been granted
to companies, firms or other parties covered in the register maintained under Section 301 of the Act are not, prima facie,
prejudicial to the interest of the Company.
(c) The principal amounts and interest, where applicable, are being repaid regularly in accordance with the agreed contractual
terms. Accordingly, paragraph 4(iii) (d) of the Order is not applicable to the Company.
(d) The Company has not taken any loans, secured or unsecured, from companies, firms or other parties covered in the
register maintained under Section 301 of the Act. Accordingly, paragraphs 4 (iii) (e) to (g) of the Order are not applicable
to the Company.
(iv) In our opinion and according to the information and explanations given to us, there is an adequate internal control system commensurate with the size of the Company and the nature of its business with regard to purchase of inventories and fixed assets and with regard to sale of goods and services. We have not observed any major weakness in the internal control system during the course of the audit.
(v) (a) In our opinion and according to the information and explanations given to us, the particulars of contracts or arrangements
referred to in Section 301 of the Act have been entered in the register required to be maintained under that Section.
(b) In our opinion and according to the information and explanations given to us, the transactions made in pursuance of
contracts and arrangements referred to in (a) above and exceeding the value of ` 5 lakh with each party during the year
have been made at prices which are reasonable having regard to the prevailing market prices at the relevant time except
for purchase of certain services which are for the Company’s specialised requirements and similarly for sale of certain
Annexure to the Auditors’ Report

Standalone Financial Statements
96 Annual Report 2010-11
goods and services for the specialised requirements of the buyers and for which suitable alternative sources are not
available to obtain comparable quotations. However, on the basis of information and explanations provided, the same
appear reasonable.
(vi) The Company has not accepted any deposits from the public.
(vii) In our opinion, the Company has an internal audit system commensurate with the size and nature of its business.
(viii) We have broadly reviewed the books of account maintained by the Company pursuant to the rules prescribed by the Central Government of India for maintenance of cost records under section 209(1)(d) of the Act, in respect of vanaspati, toilet soaps, lighting products and mini computers/microprocessor based system and data communication system and are of the opinion that, prima facie, the prescribed accounts and records have been made and maintained. However, we have not made a detailed examination of the records.
(ix) (a) According to the information and explanations given to us and on the basis of our examination of the records of the
Company, amounts deducted/accrued in the books of account in respect of undisputed statutory dues including Provident
Fund, Service tax, Employees’ State Insurance, Income-tax, Sales-tax, Wealth tax, Customs duty, Excise duty, Investor
Education and Protection Fund and other material statutory dues have been generally regularly deposited during the
year by the Company with the appropriate authorities.
There are no dues on account of Cess under Section 441A of the Act since the date from which the aforesaid Section
comes into force has not yet been notified by the Central Government of India.
According to the information and explanations given to us, no undisputed amounts payable in respect of Income-tax,
Sales-tax, Wealth tax, Service tax, Customs duty, Excise duty and other material statutory dues were in arrears as at March
31, 2011 for a period of more than six months from the date they became payable.
(b) According to the information and explanation given to us, the following dues of Income tax, Excise duty, Customs duty,
Sales tax and Service tax have not been deposited by the Company on account of disputes:
Name of the Statute Nature of the dues Amount
unpaid *
(` mn)
Period to which
the amount relates
(Assessment year)
Forum where dispute is
pending
Income Tax Act, 1961 Income tax and interest
demanded
3,235 2006-2007 Income tax Appellate Tribunal
The Central Excise Act, 1944 Excise duty demanded 47 1997-98 to 2008-09 Appellate Authority /CESTAT
Customs Act, 1962 Customs duty, interest and
penalty demanded
579 1991-92 to 2008-09 Appellate Authority /CESTAT
Customs Act, 1962 Customs duty demanded 44 1990-98 and 2005-06 Supreme court / High court
State Sales Tax/VAT and CST (pertaining to
various states)
Sales tax, interest and penalty
demanded
1,128 1986-87 to 2009-10 Appellate Authority/Appellate
Tribunal
State Sales Tax/VAT and CST (pertaining to Kerala
and Karnataka)
Sales tax and penalty demanded 25 1999-00 to 2006-07 Supreme court / High court
Entry Tax (Karnataka) Entry tax demanded 6 2005-09 Appellate Tribunal
Finance Act, 1994 - Service tax Service tax and interest
demanded
520 2001-02 to 2008-09 Appellate Authority /CESTAT
*The amounts paid under protest have been reduced from the amounts demanded in arriving at the aforesaid disclosure.
(x) The Company does not have any accumulated losses at the end of the financial year and has not incurred cash losses during the financial year and in the immediately preceding financial year.
(xi) In our opinion and according to the information and explanations given to us, the Company has not defaulted in repayment of dues to its bankers or to any financial institutions. The Company did not have any outstanding debentures during the year.
(xii) The Company has not granted any loans and advances on the basis of security by way of pledge of shares, debentures and other securities.
(xiii) In our opinion and according to the information and explanations given to us, the Company is not a chit fund / nidhi / mutual benefit fund/ society.
Annexure to the Auditors’ Report

Standalone Financial Statements
Wipro Limited 97
(xiv) According to the information and explanations given to us, the Company is not dealing or trading in shares, securities, debentures and other investments.
(xv) In our opinion and according to the information and explanations given to us, the terms and conditions on which the Company has given guarantees for loans taken by others from banks or financial institutions are not prejudicial to the interest of the Company.
(xvi) In our opinion and according to the information and explanations given to us, the term loans taken by the Company have been applied for the purposes for which they were raised.
(xvii) According to the information and explanations given to us and on an overall examination of the balance sheet of the Company, we are of the opinion that the funds raised on short-term basis have not been used for long-term investment.
(xviii) The Company has not made any preferential allotment of shares to companies/firms/parties covered in the register maintained under Section 301 of the Act.
(xix) The Company did not have any outstanding debentures during the year.
(xx) The Company has not raised any money by public issues during the year.
(xxi) According to the information and explanations given to us, no fraud on or by the Company has been noticed or reported during the course of our audit.
for BSR & Co.
Chartered Accountants
Firm Registration No: 101248W
Natrajh Ramakrishna
Partner
Membership No. 032815
Bangalore
April 27, 2011
Annexure to the Auditors’ Report

Standalone Financial Statements
98 Annual Report 2010-11
(` in Million)
As of March 31,
Schedule 2011 2010
SOURCES OF FUNDS
Shareholders’ Funds
Share capital 1 4,908 2,936
Share application money pending allotment 7 18
Reserves and surplus 2 208,294 173,968
213,209 176,922
Loan Funds
Unsecured loans 3 47,441 55,302
47,441 55,302
260,650 232,224
APPLICATION OF FUNDS
Fixed Assets
Gross block 4 77,793 67,613
Less: Accumulated depreciation and amortisation 35,423 31,050
Net block 42,370 36,563
Capital work-in-progress and advances 6,031 9,911
48,401 46,474
Investments 5 108,134 89,665
Deferred Tax Asset (Net) 18(24) 108 348
Current Assets, Loans and Advances
Inventories 6 7,249 6,069
Sundry debtors 7 57,813 50,164
Cash and bank balances 8 52,033 56,643
Loans and advances 9 67,460 53,911
184,555 166,787
Less: Current Liabilities and Provisions
Current liabilities 10 52,900 48,742
Provisions 11 27,648 22,308
80,548 71,050
Net Current Assets 104,007 95,737
260,650 232,224
Notes to accounts 18
The schedules referred to above form an integral part of the balance sheet
As per our report attached
for BSR & Co.,Chartered AccountantsFirm Registration number: 101248W
Natrajh RamakrishnaPartnerMembership No. 032815
BangaloreApril 27, 2011
For and on behalf of the Board of Directors
Azim Premji B. C. Prabhakar T. K. Kurien Dr. Jagdish N. ShethChairman Director CEO, IT Business Director & Executive Director
Suresh C. Senapaty V. Ramachandran Chief Financial Officer Company Secretary & Director
Balance Sheet

Standalone Financial Statements
Wipro Limited 99
As per our report attached
for BSR & Co.,Chartered AccountantsFirm Registration number: 101248W
Natrajh RamakrishnaPartnerMembership No. 032815
BangaloreApril 27, 2011
For and on behalf of the Board of Directors
Azim Premji B. C. Prabhakar T. K. Kurien Dr. Jagdish N. ShethChairman Director CEO, IT Business Director & Executive Director
Suresh C. Senapaty V. Ramachandran Chief Financial Officer Company Secretary & Director
Profit and Loss Account
(` in Million except share data)
Year ended March 31,
Schedule 2011 2010
INCOME
Gross sales and services 264,012 230,063
Less: Excise duty 1,007 843
Net sales and services 263,005 229,220
Other income, net 12 6,033 8,667
269,038 237,887
EXPENDITURE
Cost of sales and services 13 179,807 154,436
Selling and marketing expenses 14 16,420 14,022
General and administrative expenses 15 15,170 11,543
Interest 16 586 998
211,983 180,999
PROFIT BEFORE TAXATION 57,055 56,888
Provision for taxation including deferred tax 18(24) 8,618 7,908
PROFIT AFTER TAXATION 48,437 48,980
Appropriations
Interim dividend 4,908 -
Proposed dividend 9,818 8,809
Tax on dividend 2,204 1,283
Amount transferred to General reserve 4,844 38,888
BALANCE CARRIED TO BALANCE SHEET 26,663 -
EARNINGS PER SHARE - EPS[Refer Note 18(15)]
Equity shares of par value ` 2/- each
Basic (in `) 19.88 20.16
Diluted (in `) 19.78 20.03
Number of shares for calculating EPS
Basic 2,436,440,633 2,429,036,656
Diluted 2,449,297,479 2,445,450,341
Notes to accounts 18
The schedules referred to above form an integral part of the profit and loss account

Standalone Financial Statements
100 Annual Report 2010-11
Cash Flow Statement
(` in Million)Year ended March 31,
2011 2010A. Cash flows from operating activities:
Profit before tax 57,055 56,888 Adjustments:Depreciation and amortisation 6,001 5,796 Amortisation of stock compensation 1,311 1,224 Exchange differences, net 804 (5,528)Impact of cash flow hedges 4,251 5,858 Interest on borrowings 586 998Dividend/interest, net (6,234) (3,979)Profit on sale of investments (171) (308)Gain on sale of fixed assets (130) (22)Working capital changes :Sundry debtors and unbilled revenue (14,675) (9,244)Loans and advances (6,540) (778)Inventories (1,133) (1,385)Current liabilities & provisions 4,021 1,920 Net cash generated from operations 45,146 51,440 Direct taxes (paid)/refund, net (8,041) (6,666)Net cash generated by operating activities 37,105 44,774
B. Cash flows from investing activities:Acquisition of fixed assets (including capital advances) (8,689) (8,219)Proceeds from sale of fixed assets 431 300 Purchase of investments (468,165) (337,926)Proceeds from sale/maturity of investments 451,328 323,482 Purchase of intercorporate deposits (14,290) (10,750)Refund of intercorporate deposits 20,100 4,950 Payment for acquisition/merger of businesses - (52)Investment in subsidiaries (1,577) (6,096)Dividend/interest income received 6,122 3,665 Net cash used in investing activities (14,740) (30,646)
C. Cash flows from financing activities:Proceeds from exercise of employee stock options 36 7 Share application money pending allotment (11) 3 Interest paid on borrowings (615) (1,046)Dividends paid (including distribution tax) (15,585) (6,858)Repayment of borrowings/loans 71,371 (52,690)Proceeds of borrowings/loans (82,522) 59,622 Net cash used in financing activities (27,326) (962)Net (decrease)/increase in cash and cash equivalents during the period (4,961) 13,166 Cash acquired upon Merger 28 256 Cash and cash equivalents at the beginning of the period 56,643 44,092 Effect of exchange rate changes on cash balance 323 (871)Cash and cash equivalents at the end of the period (Refer Schedule 8) 52,033 56,643
As per our report attached
for BSR & Co.,Chartered AccountantsFirm Registration number: 101248W
Natrajh RamakrishnaPartnerMembership No. 032815
BangaloreApril 27, 2011
For and on behalf of the Board of Directors
Azim Premji B. C. Prabhakar T. K. Kurien Dr. Jagdish N. ShethChairman Director CEO, IT Business Director & Executive Director
Suresh C. Senapaty V. Ramachandran Chief Financial Officer Company Secretary & Director

Standalone Financial Statements
Wipro Limited 101
Schedules to Balance Sheet
(` in Million except share data)
As of March 31,
SCHEDULE 1 SHARE CAPITAL 2011 2010
Authorised capital
2,650,000,000 (2010: 1,650,000,000) equity shares of ` 2 each 5,300 3,300
25,000,000 (2010: 25,000,000) 10.25 % redeemable cumulative preference shares of ` 10
each
250 250
5,550 3,550
Issued, subscribed and paid-up capital
2,454,409,145 (2010: 1,468,211,189) equity shares of ` 2 each [Refer note 18(4)] 4,908 2,936
4,908 2,936
SCHEDULE 2 RESERVES AND SURPLUS
Capital reserve
Balance brought forward from previous year 1,144 1,144
Additions during the year - -
1,144 1,144
Securities premium account
Balance brought forward from previous year 29,188 27,279
Add: Exercise of stock options by employees 2,895 1,909
Less : Amount utilised for bonus shares 1,960 -
30,123 29,188
Restricted stock units reserve [Refer note 18(13)]
Employee stock options outstanding 3,791 4,366
Less: Deferred employee compensation expense 3,507 2,643
284 1,723
General reserve
Balance brought forward from previous year 147,012 108,327
Transferred from Profit and Loss account [Refer note 18 (5) (ii)] 4,743 38,685
151,755 147,012
Hedging reserve [Refer note 18(7)]
Balance brought forward from previous year (5,099) (16,859)
Movement during the year 3,424 11,760
Loss on cash flow hedging derivatives, net (1,675) (5,099)
Profit and Loss Account 26,663 -
Summary of reserves and surplus
Balance brought forward from previous year 173,968 122,204
Movement during the year 34,326 51,764
208,294 173,968
SCHEDULE 3 UNSECURED LOANS
From banks
External commercial borrowings[Refer note 18(19)] 18,861 16,844
Other short term loans (repayable within one year ) 27,754 37,555
Other loans
Interest free loan from State Government 37 37
Others(repayable within one year ` 334 million (2010: ` 263 million)) 789 866
47,441 55,302

Standalone Financial Statements
102 Annual Report 2010-11
Sc
he
du
les
to
Ba
lan
ce
Sh
ee
t
SC
HE
DU
LE
4
FIX
ED
AS
SE
TS
(` in
Mill
ion
)
PA
RT
ICU
LA
RS
GR
OS
S B
LOC
K**
*A
CC
UM
UL
AT
ED
DE
PR
EC
IAT
ION
/
AM
OR
TIS
AT
ION
NE
T B
LOC
K
As of
Apri
l 1,
20
10
#
Additions
Dedu
ctions/
ad
justments
As
of
Ma
rch
31
, 20
11
As of
Apri
l 1,
20
10
Depre
ciation
for the
year
Dedu
ctions /
ad
justments
As
of
Ma
rch
31
, 20
11
As
of
Ma
rch
31
, 20
11
As of
March
31,
20
10
(a)
Ta
ng
ible
fix
ed
ass
ets
**
Land
@ 3,9
10
9
10
-
4
,82
0
97
7
-
1
04
4
,71
6
3,8
13
Build
ings
16,074
3,275
44
1
9,3
05
908
323
36
1
,19
5
18
,11
0
15,166
P
lant &
ma
chinery
* 34,455
6,604
955
4
0,1
04
23,277
4,138
870
2
6,5
45
1
3,5
59
1
1,178
Fu
rniture, fixture
and
equipments
8,80
1
1,252
490
9
,56
3
4,726
1,045
386
5
,38
5
4,1
78
4,075
Vehic
les
2,700
26
437
2
,28
9
1,72
1
42
1
335
1
,80
7
48
2
979
(b)
Inta
ng
ible
fix
ed
ass
ets
Goodwill
447
-
-
4
47
-
-
-
-
4
47
447
Te
chnica
l know-how
55
35
3
8
7
46
3
1
4
8
39
9
Brands,
patents, trade
marks and
rights
1,17
1
7
-
1,1
78
275
64
-
3
39
8
39
896
67,6
13
12,109
1,929
7
7,7
93
3
1,050
6,00
1
1,628
3
5,4
23
4
2,3
70
36,563
Previous year - 20
10
57,433
10,897
7
17
6
7,6
13
25,637
5,796
383
31
,05
0
36
,56
3
@In
cludes Gross
blo
ck of
` 1,270
million
(20
10: `
1,270
million) and
Accumu
lated
amortisation
of
` 105
million
(20
10: `
98
million) being
leaseho
ld land.
*Plant &
ma
chinery
includes
computers
and
computer software.
**In
cludes Gross
blo
ck of
` 37
million
and
Accumu
lated
depre
ciation
of
` 17
million
on
account of merger.
#In
cludes P
lant &
Ma
chinery
of
` 20
million
(20
10: `
17
million) and
Furniture,fixtures &
equipment of
` 5
million
(20
10: `
4 m
illion) for research
and
deve
lopment
assets.
***Interest
capita
lised
aggregated
to
` 66
million
and
` 95
million
for the
year ended
March
31, 20
11
and
20
10
respe
ctive
ly.

Standalone Financial Statements
Wipro Limited 103
Schedules to Balance Sheet
(` in Million)As of March 31,
2011 2010 SCHEDULE 5 INVESTMENTS
Long term investments - (at cost)
Unquoted
Investments in subsidiary companies
Equity shares[Refer note 18(20)] 60,065 58,565Preference shares - 57 Investment in associates - Non trade
Wipro GE Healthcare Private Limited1 227 227 Current investments - Non trade
Quoted
Investments in Indian money market mutual funds [Refer note 18(21)] 23,877 18,548 Unquoted
Certificates of deposit 23,282 11,568 Others [Refer note 18(20)] 791 808
108,242 89,773 Less: Provision for diminution in value of long term investments 108 108
108,134 89,665 Aggregate market value of quoted investments and mutual funds 23,923 18,558 1Equity investments in this company carry certain restrictions on transfer of shares as provided for in
the shareholders’ agreements
SCHEDULE 6 INVENTORIES
Stores and spares 1,126 1,001 Raw materials 2,206 1,467 Finished goods 3,084 3,058 Stock in process 833 543
7,249 6,069
SCHEDULE 7 SUNDRY DEBTORS
Unsecured
Debts outstanding for a period exceeding six months
Considered good* 7,087 6,070 Considered doubtful 2,028 1,841
9,115 7,911 Other debts
Considered good* 50,726 44,094 Considered doubtful 65 10
50,791 44,104 Less: Provision for doubtful debts 2,093 1,851
57,813 50,164 * Refer to Note 18(23) for debts due from companies under the same management as defined under
Section 370 (1-B) of the Companies Act, 1956.
SCHEDULE 8 CASH AND BANK BALANCES
Cash and cheques on hand 969 531 Balances with scheduled banks In current accounts# 2,916 3,601 In deposit accounts 28,691 37,260 Balances with other banks in current account** 19,457 15,251
52,033 56,643 **Bankwise breakup and the maximum balances are given in note 18(18)
#Includes balance in unclaimed dividend account amounting to ` 20 million (2010: ` 17 million)

Standalone Financial Statements
104 Annual Report 2010-11
Schedules to Balance Sheet
(` in Million)
As of March 31,
2011 2010
SCHEDULE 9 LOANS AND ADVANCES
Unsecured, considered good unless otherwise stated
Advances recoverable in cash or in kind or for value to be received
Considered good
- Prepaid expenses 4,039 3,040
- Employee travel & other advances 1,417 1,462
- Advance to suppliers 630 409
- Others 2,910 2,501
8,996 7,412
Considered doubtful 568 297
9,564 7,709
Less: Provision for doubtful advances 568 297
8,996 7,412
Loans to subsidiaries* 3,585 1,596
Other deposits 1,978 1,530
Derivative asset 5,108 3,903
Finance lease receivables 7,250 4,442
Advance income tax less provision for tax 13,442 9,520
Inter corporate deposit 4,240 10,050
Inter corporate deposit with subsidiary* 273 273
Balances with excise and customs 786 690
Unbilled revenue 21,802 14,495
67,460 53,911
* Refer Note 18(22) for loans given to subsidiaries and inter corporate deposit with subsidiary
SCHEDULE 10 CURRENT LIABILITIES
Sundry creditors
-dues to micro and small enterprises[Refer note 18(17)] 1 5
-dues to other than micro and small enterprises 19,147 14,952
Accrued expenses 17,140 16,164
Statutory liabilities 3,288 3,397
Unearned revenue 6,188 7,215
Advances from customers 798 903
Payables to subsidiaries 1,905 1,682
Derivative liabilities 4,400 4,385
Unclaimed dividends 20 17
Interest accrued but not due 13 22
52,900 48,742
SCHEDULE 11 PROVISIONS
Provision for tax less advance tax 11,634 7,375
Proposed dividend 9,818 8,809
Tax on proposed dividend 1,593 1,283
Employee retirement benefits 2,293 2,546
Warranty 452 532
Others 1,858 1,763
27,648 22,308

Standalone Financial Statements
Wipro Limited 105
Schedules to Profit and Loss Account
(` in Million)
Year ended March 31,
2011 2010
SCHEDULE 12 OTHER INCOME
Income from current investments
- Dividend on mutual fund units(non-trade quoted) 2,288 1,442
- Profit/ (loss) on sale of investments,net 171 308
Interest on debt instruments and others* 3,946 2,537
Exchange fluctuations on foreign currency borrowings, net (774) 1,824
Other exchange differences, net 13 2,193
Miscellaneous income 389 363
6,033 8,667
*Tax deducted at source on interest received ` 201 million (2010 : ` 303 million)
SCHEDULE 13 COST OF SALES AND SERVICES
Employee compensation 88,897 74,350
Contribution to provident and other funds 1,936 1,589
Workmen and staff welfare 1,434 1,235
Raw materials, finished and process stocks consumed (Refer schedule 17) 37,513 36,194
Sub contracting / technical fees / third party application 26,151 19,839
Travel 6,513 4,972
Depreciation and amortisation 5,704 5,471
Repairs to building 155 163
Repairs to machinery 1,336 1,415
Communication 1,603 1,484
Power and fuel 1,997 1,414
Rent 1,064 1,003
Stores and spares 227 384
Insurance 390 332
Rates and taxes 44 226
Miscellaneous expenses 4,843 4,365
179,807 154,436
SCHEDULE 14 SELLING AND MARKETING EXPENSES
Employee compensation 8,936 7,539
Contribution to provident and other funds 126 82
Staff welfare 223 173
Advertisement and sales promotion 2,479 2,499
Travel 927 687
Carriage and freight 1,202 928
Sales commission 446 354
Rent 270 387
Communication 380 338
Depreciation and amortisation 164 195
Insurance 26 53
Rates and taxes 32 36
Miscellaneous expenses 1,209 751
16,420 14,022

Standalone Financial Statements
106 Annual Report 2010-11
Schedules to Profit and Loss Account
(` in Million)
Year ended March 31,
2011 2010
SCHEDULE 15 GENERAL AND ADMINISTRATIVE EXPENSES
Employee compensation 6,400 4,505
Contribution to provident and other funds 410 272
Staff welfare 1,012 883
Travel 1,123 1,039
Legal and professional 1,245 1,218
Provision for doubtful debts 241 453
Staff recruitment 1,211 473
Communication 177 244
Manpower outside services 315 199
Depreciation and amortisation 133 130
Rates and taxes 302 95
Insurance 32 53
Rent 514 393
Auditors’ remuneration
Audit fees 10 10
For certification including tax audit 2 2
Out of pocket expenses 1 1
Repairs and mantainance 15 10
Miscellaneous expenses 2,027 1,563
15,170 11,543
SCHEDULE 16 INTEREST
Cash credit and others 586 998
586 998
SCHEDULE 17 RAW MATERIALS, FINISHED AND PROCESSED STOCKS
Consumption of raw materials and bought out components:
Opening stock 1,467 1,446
Add: Purchases 11,596 9,913
Less: Closing stock 2,206 1,467
10,857 9,892
Purchase of finished products for sale 26,972 27,412
(Increase) / Decrease in finished and process stocks :
Opening stock
In process 543 425
Finished products 3,058 1,978
Stock taken over on merger
In process - 6
Finished products - 82
3,601 2,491
Less: Closing stock
In process 833 543
Finished products 3,084 3,058
(316) (1,110)
37,513 36,194

Standalone Financial Statements
Wipro Limited 107
SCHEDULE 18 – NOTES TO ACCOUNTS
Company overview
Wipro Limited (Wipro or the Company), is a leading India based
provider of IT Services, including Business Process Outsourcing
(BPO) services, globally. Further, Wipro has other businesses such
as IT Products, Consumer Care and Lighting and Infrastructure
engineering. Wipro is headquartered in Bangalore, India.
1. Significant accounting policies
i. Basis of preparation of financial statements
The financial statements are prepared in accordance with Indian Generally Accepted Accounting Principles (GAAP) under the historical cost convention on the accrual basis, except for certain financial instruments which are measured on a fair value basis. GAAP comprises Accounting Standards specified in the Companies (Accounting Standards) Rules, 2006, Accounting Standards issued by the Institute of Chartered Accountants of India (ICAI) and other generally accepted accounting principles in India.
ii. Use of estimates
The preparation of financial statements in accordance with the generally accepted accounting principles requires management to make judgments, estimates and assumptions that affect the application of accounting policies and the reported amounts of assets and liabilities, income and expenses. Estimates and underlying assumptions are reviewed on an ongoing basis. Revision to accounting estimate is recognised in the period in which the estimates are revised and in any future period affected.
iii. Goodwill
The goodwill arising on acquisition of a group of assets is not amortised and is tested for impairment if indicators of impairment exist.
iv. Fixed assets, intangible assets and work-in-progress
Fixed assets are stated at historical cost less accumulated depreciation. Costs include expenditure directly attributable to the acquisition of the asset. Borrowing costs directly attributable to the construction or production of qualifying assets are capitalized as part of the cost.
Intangible assets are stated at the consideration paid for acquisition less accumulated amortization.
Advances paid towards the acquisition of fixed assets outstanding as of each balance sheet date and the cost of fixed assets not ready for use before such date are disclosed under capital work-in-progress.
v. Investments
Long term investments are stated at cost less other than temporary decline in the value of such investments, if any. Current investments are valued at lower of cost and fair value determined by category of investment. The fair value is determined using quoted market price/market observable information adjusted for cost of disposal.
vi. Inventories
Inventories are valued at lower of cost and net realizable value, including necessary provision for obsolescence. Cost is determined using the weighted average method. Cost of work-in-progress and finished goods include material cost and appropriate share of manufacturing overheads.
vii. Provisions and contingent liabilities
Provisions are recognised when the Company has a present obligation as a result of past event, it is probable that an outflow of resources will be required to settle the obligation, and a reliable estimate can be made of the amount of obligation.
A disclosure for a contingent liability is made when there is a possible obligation or a present obligation that may, but probably will not, require an outflow of resources. Where there is a possible obligation or a present obligation in respect of which the likelihood of outflow of resources is remote, no provision or disclosure is made.
The Company recognizes provision for onerous contracts based on the estimate of excess of unavoidable costs of meeting obligations under the contracts over the expected economic benefits.
viii. Revenue recognition
Services:
The Company recognizes revenue when the significant terms of the arrangement are enforceable, services have been delivered and the collectability is reasonably assured. The method for recognizing revenues and costs depends on the nature of the services rendered:
A. Time and materials contracts
Revenues and costs relating to time and materials
contracts are recognized as the related services are
rendered.
B. Fixed-price contracts
Revenues from fixed-price contracts, including
systems development and integration contracts are
recognized using the “percentage-of-completion”
method. Percentage of completion is determined
based on project costs incurred to date as a percentage
of total estimated project costs required to complete
the project. When total cost estimates exceed
revenues in an arrangement, the estimated losses are
recognized in the statement of income in the period
in which such losses become probable based on the
current contract estimates.
‘Unbilled revenues’ included in loans and advances
represent cost and earnings in excess of billings as at
the balance sheet date. ‘Unearned revenues’ included
in current liabilities represent billing in excess of
revenue recognized.

Standalone Financial Statements
108 Annual Report 2010-11
C. Maintenance contracts
Revenue from maintenance contracts is recognized
ratably over the period of the contract using the
percentage of completion method. When services are
performed through an indefinite number of repetitive
acts over a specified period of time, revenue is
recognized on a straight-line basis over the specified
period unless some other method better represents
the stage of completion.
Products:
Revenue from sale of products is recognized when the product has been delivered, in accordance with the sales contract. Revenue from product sales are shown as net of excise duty, sales tax separately charged and applicable discounts.
Other income:
Agency commission is accrued when shipment of consignment is dispatched by the principal.
Profit on sale of investments is recorded upon transfer of title by the Company. It is determined as the difference between the sales price and carrying amount of the related investment.
Interest is recognized using the time-proportion method, based on rates implicit in the transaction.
Dividend income is recognized where the Company’s right to receive dividend is established.
ix. Leases
Leases of assets, where the Company assumes substantially all the risks and rewards of ownership are classified as finance leases. Finance leases are capitalized at the lower of the fair value of the leased assets at inception and the present value of minimum lease payments. Lease payments are apportioned between the finance charge and the outstanding liability. The finance charge is allocated to periods during the lease term at a constant periodic rate of interest on the remaining balance of the liability.
Leases where the lessor retains substantially all the risks and rewards of ownership are classified as operating leases. Lease rentals in respect of assets taken under operating leases are charged to profit and loss account on a straight line basis over the lease term.
In certain arrangements, the Company recognizes revenue from the sale of products given under finance leases. The Company records gross finance receivables, unearned income and the estimated residual value of the leased equipment on consummation of such leases. Unearned income represents the excess of the gross finance lease receivable plus the estimated residual value over the sales price of the equipment. The Company recognises unearned income as financing revenue over the lease term using the effective interest method.
x. Foreign currency transactions
The Company is exposed to currency fluctuations on foreign currency transactions. Foreign currency transactions are accounted in the books of accounts at the average rate for the month.
Transaction:
The difference between the rate at which foreign currency transactions are accounted and the rate at which they are realized is recognized in the profit and loss account.
Translation:
Monetary foreign currency assets and liabilities at period-end are restated at the closing rate. The difference arising from the restatement is recognized in the profit and loss account.
In March 2009, Ministry of Corporate affairs issued a notification amending AS 11, ‘The effects of changes in foreign exchange rates’. Before the amendment, AS 11 required the exchange gains/losses on long term foreign currency monetary assets/liabilities to be recorded in the profit and loss account.
The amended AS 11 provides an irrevocable option to the Company to amortise exchange rate fluctuation on long term foreign currency monetary asset/liability over the life of the asset/liability or March 31, 2011, whichever is earlier. The amendment is applicable retroactively from the financial year beginning on or after December 7, 2006.
The Company did not elect to exercise this option.
xi. Financial Instruments
Financial instruments are recognised when the Company becomes a party to the contractual provisions of the instrument.
Derivative instruments and Hedge accounting:
The Company is exposed to foreign currency fluctuations on foreign currency assets, liabilities, net investment in a non-integral foreign operation and forecasted cash flows denominated in foreign currency. The Company limits the effects of foreign exchange rate fluctuations by following established risk management policies including the use of derivatives. The Company enters into derivative financial instruments, where the counterparty is a bank.
The Company has adopted Accounting Standard 30, Financial Instruments: Recognition and Measurement (AS 30) issued by ICAI except to the extent the adoption of AS 30 does not conflict with existing accounting standards prescribed by Companies (Accounting Standards) Rules, 2006 and other authoritative pronouncements.
In accordance with the recognition and measurement principles set out in AS 30, changes in fair value of derivative financial instruments designated as cash flow hedges are recognised directly in shareholders’ funds and reclassified into the profit and loss account upon the occurrence of the hedged transaction.

Standalone Financial Statements
Wipro Limited 109
The fair value of derivative financial instruments is determined based on observable market inputs including currency spot and forward rates, yield curves, currency volatility etc.
Non-Derivative Financial Instruments
A financial instrument is any contract that gives rise to a financial asset of one entity and a financial liability or equity instrument of another entity. Financial assets of the Company mainly include cash and bank balances, sundry debtors, unbilled revenues, finance lease receivables, employee travel and other advances, other loans and advances and derivative financial instruments with a positive fair value. Financial liabilities of the Company mainly comprise secured and unsecured loans, sundry creditors, accrued expenses and derivative financial instruments with a negative fair value. Financial assets are derecognized when all of risks and rewards of the ownership of the financial asset have been transferred. In cases where substantial risk and rewards of ownership of the financial assets are neither transferred not retained, financial assets are derecognized only when the Company has not retained control over the financial asset.
The Company measures the financial assets and liabilities, except for derivative financial assets and liabilities at amortized cost using the effective interest method. The Company measures the short-term payables and receivables with no stated rate of interest at original invoice amount, if the effect of discounting is immaterial. Non-interest-bearing deposits are discounted to their present value.
xii. Depreciation and amortization
The Company has provided for depreciation using straight line method, at the rates specified in Schedule XIV to the Companies Act, 1956, except in cases of the following assets, which are depreciated based on estimated useful life, which is higher than the rates specified in Schedule XIV.
Class of AssetEstimated
useful life
Computer and Computer Software 2-7 years
Furniture and fixtures 5-6 years
Electrical installations 5 years
Office equipment 5 years
Vehicles 4 years
Fixed assets individually costing ` 5,000/- or less are depreciated at 100%.
Assets under capital lease are amortised over their estimated useful life or the lease term, whichever is lower. Intangible assets are amortized over their estimated useful life on a straight line basis. For various brands acquired by the Company, estimated useful life has been determined ranging between 20 to 25 years. The Company believes this based on number of factors including the competitive
environment, market share, brand history, product life cycles, operating plan, no restrictions on title and the macroeconomic environment of the countries in which the brands operate. Accordingly, such intangible assets are being amortised over the determined useful life. Payments for leasehold land are amortised over the period of lease.
xiii. Impairment of assets
Financial assets:
The Company assesses at each balance sheet date whether there is any objective evidence that a financial asset or group of financial assets is impaired. If any such indication exists, the Company estimates the amount of impairment loss. The amount of loss for short-term receivables is measured as the difference between the assets carrying amount and undiscounted amount of future cash flows. Reduction, if any, is recognised in the profit and loss account. If at the balance sheet date there is any indication that a previously assessed impairment loss no longer exists, the recognised impairment loss is reversed, subject to maximum of initial carrying amount of the short-term receivable.
Other than financial assets:
The Company assesses at each balance sheet date whether there is any indication that a non-financial asset including goodwill may be impaired. If any such indication exists, the Company estimates the recoverable amount of the asset. If such recoverable amount of the asset or the recoverable amount of the cash generating unit to which the asset belongs to is less than its carrying amount, the carrying amount is reduced to its recoverable amount. The reduction is treated as an impairment loss and is recognised in the profit and loss account. If at the balance sheet date there is an indication that a previously assessed impairment loss no longer exists, the recoverable amount is reassessed and the asset is reflected at the recoverable amount subject to a maximum of depreciated historical cost. In respect of goodwill, the impairment loss will be reversed only when it was caused by specific external events of an exceptional nature that is not expected to recur and their effects have been reversed by subsequent external events.
xiv. Employee benefits
Provident fund:
Employees receive benefits from a provident fund. The employee and employer each make monthly contributions to the plan equal to 12% of the covered employee’s salary. A portion of the contribution is made to the provident fund trust managed by the Company, while the remainder of the contribution is made to the Government’s provident fund.
Compensated absences:
The employees of the Company are entitled to compensated absence. The employees can carry-forward a portion of the unutilized accrued compensated absence and utilize it in future periods or receive cash compensation at

Standalone Financial Statements
110 Annual Report 2010-11
retirement or termination of employment for the unutilized accrued compensated absence. The Company records an obligation for compensated absences in the period in which the employee renders the services that increase this entitlement. The Company measures the expected cost of compensated absence as the additional amount that the Company expects to pay as a result of the unused entitlement that has accumulated at the balance sheet date. Long term compensated absences is accrued based on actuarial valuation at the balance sheet date carried out by an independent actuary.
Gratuity:
In accordance with the Payment of Gratuity Act, 1972, the Company provides for a lump sum payment to eligible employees, at retirement or termination of employment based on the last drawn salary and years of employment with the Company. The gratuity fund is managed by the Life Insurance Corporation of India (LIC), HDFC Standard Life, TATA AIG and Birla Sun-life. The Company’s obligation in respect of the gratuity plan, which is a defined benefit plan, is provided for based on actuarial valuation carried out by an independent actuary using the projected unit credit method. The Company recognizes actuarial gains and losses immediately in the profit and loss account.
Superannuation:
The employees of the Company also participate in a defined contribution plan maintained by the Company. This plan is administered by the LIC and ICICI Prudential Insurance Company Limited. The Company makes annual contributions based on a specified percentage of each covered employee’s salary.
xv. Employee stock options
The Company determines the compensation cost based on the intrinsic value method. The compensation cost is amortised on a straight line basis over the vesting period.
xvi. Taxes
Income tax:
The current charge for income taxes is calculated in accordance with the relevant tax regulations.
Deferred tax:
Deferred tax assets and liabilities are recognised for the future tax consequences attributable to timing differences that result between the profit offered for income taxes and the profit as per the financial statements of each entity in the Company.
Deferred taxes are recognised in respect of timing differences which originate during the tax holiday period but reverse after the tax holiday period. For this purpose,
reversal of timing difference is determined using first in first out method.
Deferred tax assets and liabilities are measured using the tax rates and tax laws that have been enacted or substantively enacted by the balance sheet date. The effect on deferred tax assets and liabilities of a change in tax rates is recognised in the period that includes the enactment/substantive enactment date.
Deferred tax assets on timing differences are recognised only if there is a reasonable certainty that sufficient future taxable income will be available against which such deferred tax assets can be realized. However, deferred tax assets on the timing differences when unabsorbed depreciation and losses carried forward exist, are recognised only to the extent that there is virtual certainty that sufficient future taxable income will be available against which such deferred tax assets can be realized.
Deferred tax assets are reassessed for the appropriateness of their respective carrying amounts at each balance sheet date.
The Company offsets, on a year on year basis, the current tax assets and liabilities, where it has a legally enforceable right and where it intends to settle such assets and liabilities on a net basis.
xvii. Earnings per share
Basic:
The number of equity shares used in computing basic earnings per share is the weighted average number of shares outstanding during the period excluding equity shares held by controlled trust.
Diluted:
The number of equity shares used in computing diluted earnings per share comprises the weighted average equity shares considered for deriving basic earnings per share, and also the weighted average number of equity shares that could have been issued on the conversion of all dilutive potential equity shares.
Dilutive potential equity shares are deemed converted as of the beginning of the period, unless issued at a later date. The number of equity shares and potentially dilutive equity shares are adjusted for any stock splits and bonus shares issued.
xviii. Cash flow statement
Cash flows are reported using the indirect method, whereby net profits before tax is adjusted for the effects of transactions of a non-cash nature and any deferrals or accruals of past or future cash receipts or payments. The cash flows from regular revenue generating, investing and financing activities of the Company are segregated.

Standalone Financial Statements
Wipro Limited 111
NOTES TO ACCOUNTS
2. Capital commitments
The estimated amount of contracts remaining to be executed on Capital account and not provided for, net of advances is ` 1,682 million(2010 : ` 2,648 million).
3. Contingent Liabilities
Contingent liabilities in respect of
(` in Million)
Particulars As at March 31,
2011 2010
a) Disputed demands for excise duty, customs duty, income tax, sales tax and other matters
1,472 1,384
b) Per formance and f inanc ia l guarantees given by banks on behalf of the Company
9,706 13,760
c) Guarantees given by the Company on behalf of subsidiaries
3,919 3,748
The Company is subject to legal proceedings and claims which have arisen in the ordinary course of its business. The resolution of these legal proceedings is not likely to have a material and adverse effect on the financial statements of the Company.
The Company’s Indian operations have been established as a Software Technology Park Unit under a plan formulated by the Government of India. As per the plan, the Company’s India operations have export obligations to the extent of 1.5 times the employee costs for the year on an annual basis and 5 times the amount of foreign exchange released for capital goods imported, over a five year period. The consequence of not meeting this commitment in the future would be a retroactive levy of import duties on certain computer hardware previously imported duty free. As at March 31, 2011, the Company has met all commitments required under the plan.
Tax Demands:
The Company had received tax demands from the Indian income tax authorities for the financial years ended March 31, 2001, 2002, 2003 and 2004 aggregating to ` 11,127 million (including interest of ` 1,503 million). The tax demands were primarily on account of the Indian income tax authority’s denial of deductions claimed by the Company under Section 10A of the Income Tax Act 1961, in respect of profits earned by the Company’s undertakings in Software Technology Park at Bangalore. The appeals filed by the Company for the above years to the first appellate authority were allowed in favor of the Company, thus deleting a substantial portion of the demands raised by the Income tax authorities. On further appeal filed by the income tax authorities, the second appellate authority
upheld the claims of the Company for the years ended March 31, 2001, 2002, 2003 and 2004.
In December 2008, the Company received, on similar grounds, an additional tax demand of ` 5,388 million (including interest of ` 1,615 million) for the financial year ended March 31, 2005. The appeal filed before the first appellate authority against the said order has been allowed in favour of the Company thus deleting substantial demand raised by the Income tax authorities.
In December 2009, the Company received the draft assessment order, on similar grounds, with a demand of ` 6,757 million (including interest of ` 2,050 million) for the financial year ended March 31, 2006. The Company had filed its objections against the said demand before the Dispute Resolution Panel, which later issued directions confirming the position of the assessing officer. Subsequently, the assessing officer passed the final assessment order in October 2010 raising a tax demand of ` 7,218 million (including interest of ` 2,510 million). The Company has filed an appeal against the said order before the tribunal within the time limit permitted under the statute.
In December 2010, the Company received the draft assessment order, on similar grounds, with a demand of ` 7,747 million (including interest of ` 2,307 million) for the financial year ended March 31, 2007. The Company has filed an objection against the said demand before the Dispute Resolution Panel, within the time limit permitted under the statute.
Considering the facts and nature of disallowance and the order of the appellate authority upholding the claims of the Company for earlier years, the Company believes that the final outcome of the above disputes should be in favour of the Company and there should not be any material impact on the standalone financial statements.
The Company is subject to legal proceedings and claims which have arisen in the ordinary course of its business. The resolution of these legal proceedings is not likely to have a material and adverse effect on the results of operations or the financial position of the Company.
4. Share Capital
The following are the details for 2,454,409,145 (2010: 1,468,211,189) equity shares as of March 31, 2011.
No. of shares Description
2,379,120,783 Equity shares / American Depository Receipts
(ADRs) (2010:1,399,355,659) have been
allotted as fully paid bonus shares / ADRs by
capitalization of Securities premium account
and Capital redemption reserve
1,325,525 Equity shares (2010: 1,325,525) have been
allotted as fully paid-up, pursuant to scheme
of amalgamation, without payment being
received in cash.

Standalone Financial Statements
112 Annual Report 2010-11
No. of shares Description
968,803 Equity shares ( 2010: 968,803) allotted to the
Wipro Inc Benefit Trust, the sole beneficiary of
which is Wipro Inc, wholly owned subsidiary
of the Company, without payment being
received in cash, in consideration of acquisition
of inter-company investments.
3,162,500 Equity shares (2010: 3,162,500) representing
American Depository Receipts issued during
2000-2001 pursuant to American Depository
offering by the Company
69,831,534 Equity shares (2010: 63,398,702) issued
pursuant to Employee Stock Option Plan
5. Note on Reserves:
i) Restricted stock units reserve includes Deferred Employee Compensation, which represents future charge to the profit and loss account and employee stock options outstanding to be treated as securities premium at the time of allotment of shares.
ii) Additions to General Reserve include:
(` in Million)
Particulars For the year ended
March 31,
2011 2010
Transfer from Profit and Loss Account 4,844 38,888
Additional dividend 19 (3)
Adjustment on account of merger (74) (199)
Others (46) (1)
4,743 38,685
6. Adoption of AS 30
The Company has adopted Accounting Standard 30, issued by ICAI except to the extent the adoption of AS 30 does not conflict with existing accounting standards prescribed by Companies (Accounting Standards) Rules, 2006 and other authoritative pronouncements.
The Company has designated USD 262 million (2010: USD 262 million) and Euro 40 million (2010: Euro 40 million) of forward contracts as hedges of its net investments in non integral foreign operations. The Company has also designated a yen-denominated foreign currency borrowing amounting to JPY 16.5 billion (2010: JPY 18 billion), along with a floating for floating Cross-Currency Interest Rate Swap (CCIRS), as a hedging instrument to hedge its net investment in a non-integral foreign operation. Further, the Company has also designated yen-denominated foreign currency borrowing amounting to JPY 8 billion (2010: JPY 8 billion) along with floating for fixed CCIRS as cash flow hedge of the yen- denominated borrowing and also as a hedge of net investment in a non-integral foreign operation. As equity investments in non integral foreign subsidiaries/operations are stated at historical cost, in
these standalone financial statements, the changes in fair value of forward contracts, the yen- denominated foreign currency borrowing and the related CCIRS amounting to gain/ (loss) of ` 326 million for the year ended March 31, 2011 has been recorded in the profit and loss account as part of other income (2010: ` 4,378 million).
7. Derivatives
As of March 31, 2011 the Company has recognised losses of ` 1,675 million (2010: ̀ 5,099 million) relating to derivative financial instruments (comprising of foreign currency forward contract and option contracts) that are designated as effective cash flow hedges in the shareholders’ fund.
The following table presents the aggregate contracted principal amounts of the Company’s derivative contracts outstanding as at:
(` In Million)
Particulars As at March 31,
2011 2010
Designated derivative instruments
Sell $901 $1,518
£21 £31
¥3,026 ¥4,578
AUD 4 AUD 7
€2 -
CHF 6 -
Buy - -
Non designated derivative
instruments
Cross currency swaps ¥31,511 ¥33,014
Sell $788 $307
AUD 13 -
£40 £38
€88 €69
Buy $617 $492
8. Merger and Acquisitions
Pursuant to the scheme of amalgamation approved by the Honourable High Courts of Karnataka and Bombay, Wipro Yardley Consumer Care Private Limited has been merged with the Company with retrospective effect from April 1, 2010, the Appointed Date. The amalgamation has been accounted as ‘amalgamation in the nature of merger’ in accordance with the terms of the Order. The excess of purchase consideration over the net assets of the undertaking amounting to ̀ 0.08 million has been adjusted against capital reserve of the Company. The merger order was received subsequent to March 31, 2011 but prior to the issuance of the financial statements, therefore the financial results of the above undertaking for the period April 1, 2010 to March 31, 2011 have been included in the year ended March 31, 2011 of the Company.

Standalone Financial Statements
Wipro Limited 113
9. Sale of financial assets
From time to time, in the normal course of business, the Company transfers accounts receivables, net investment in finance lease receivables and employee advances (financials assets) to banks. Under the terms of the arrangements, the Company surrenders control over the financial assets and are without recourse. Accordingly, such transfers are recorded as sale of financial assets. Gains and losses on sale of financial assets without recourse are recorded at the time of sale based on the carrying value of the financial assets and fair value of servicing liability. In certain cases, transfer of financial assets may be with recourse. Under arrangements with recourse, the Company is obligated to repurchase the uncollected financial assets, subject to limits specified in the agreement with the banks. Accordingly, in such cases the amount received are recorded as borrowings in the balance sheet and cash flows from financing activities. Additionally, the Company retains servicing responsibility for the transferred financial assets.
During the year ended March 31, 2011, the Company
transferred financial assets of ̀ 1,369 million (2010: ̀ 1, 666
million), under such arrangements. Proceeds from transfer
of receivables on non recourse basis are included in the net
cash provided by operating activities in the statements
of cash flows. Proceeds from transfer of receivables on
recourse basis are included in the net cash provided by
financing activities. This transfer resulted in a net gain /
(loss) of ` (7) million for the year ended March 31, 2011
(2010: ` (21) million). As at March 31, 2011, the maximum
amounts of recourse obligation in respect of the transferred
financial assets are Nil (March 31, 2010: Nil).
10. Finance lease receivables
The Company provides lease financing for the traded and manufactured products primarily through finance leases. The finance lease portfolio contains only the normal collection risk with no important uncertainties with respect to future costs. These receivables are generally due in monthly, quarterly or semi-annual installments over periods ranging from 3 to 5 years.
The components of finance lease receivables are as follows:
(` in Million)
Particulars As of March 31,
2011 2010
Gross investment in lease for the
period
8,851 5,616
Not later than one year 2,523 774
Later than one year and not later
than five years
6,128 4,652
Unguaranteed residual values 200 190
Unearned finance income (1,601) (1,174)
Net investment in finance receivables 7,250 4,442
Present value of minimum lease receivables are as follows:
(` in Million)
Particulars As of March 31,
2011 2010
Present value of minimum lease
payments receivables
7,250 4,442
Not later than one year 2,350 608
Later than one year and not later
than five years
4,723 3,675
Unguaranteed residual value 177 159
11. Assets taken on lease
Finance leases:
The following is a schedule of present value of future minimum lease payments under capital leases, together with the value of the minimum lease payments as of March 31, 2011
(` in Million)
Particulars As of March 31,
2011 2010
Present value of minimum lease
payments
Not later than one year 67 -
Later than one year and not later
than five years
96 -
Thereafter - -
Total present value of minimum lease
payments
163 -
Add: Amount representing interest 25 -
Total value of minimum lease
payments
188 -
Operating leases:
The Company leases office and residential facilities under cancelable and non-cancelable operating lease agreements that are renewable on a periodic basis at the option of both the lessor and the lessee. Rental payments under such leases are ` 1,848 million and ` 1,783 million during the years ended March 31, 2011 and 2010, respectively.
Details of contractual payments under non-cancelable leases are given below:
(` in Million)
Particulars As of March 31,
2011 2010
Not later than one year 717 666
Later than one year and not later than
five years
2,237 1,770
Thereafter 1,464 520
Total 4,418 2,956

Standalone Financial Statements
114 Annual Report 2010-11
12. Employee benefit plans
Gratuity: In accordance with applicable Indian laws, the Company provides for gratuity, a defined benefit retirement plan (Gratuity Plan) covering certain categories of employees. The Gratuity Plan provides a lump sum payment to vested employees, at retirement or termination of employment, an amount based on the respective employee’s last drawn salary and the years of employment with the Company. The Company provides the gratuity benefit through annual contributions to a fund managed by the Life Insurance Corporation of India (LIC), HDFC Standard Life, Tata AIG and Birla Sun Life (Insurer). Under this plan, the settlement obligation remains with the Company, although the Insurer administers the plan and determines the contribution premium required to be paid by the Company.
(` in Million)
Change in the benefit obligation As of March 31,
2011 2010
Projected benefit obligation (PBO) at
the beginning of the year
2,023 1,820
Service cost 628 313
Interest cost 158 132
Benefits paid (229) (212)
Actuarial loss/(gain) (132) (30)
PBO at the end of the year 2,448 2,023
(` in Million)
Change in plan assets As of March 31,
2011 2010
Fair value of plan assets at the
beginning of the year1,932 1,394
Expected return on plan assets 160 121
Employer contributions 463 611
Benefits paid (229) (212)
Actuarial gain/(loss) 13 18
Fair value of plan assets at the end of
the year2,339 1,932
Present value of unfunded obligation (109) (91)
Recognised liability (109) (91)
The Company has invested the plan assets with the insurer managed funds. The expected rate of return on plan asset is based on expectation of the average long term rate of return expected on investments of the fund during the estimated term of the obligation. Expected contribution to the fund during the year ending March 31, 2012 is ̀ 379 million.
Net gratuity cost for the year ended March 31, 2011 and 2010 are as follows:
(` in Million)
Particulars For the year ended
March 31,
2011 2010
Service cost 628 313
Interest cost 158 132
Expected return on plan assets (160) (121)
Actuarial loss/(gain) (145) (48)
Net gratuity cost 481 276
The weighted average actuarial assumptions used to determine benefit obligations and net periodic gratuity cost are:
Assumptions As of March 31,
2011 2010
Discount rate 7.95% 7.15%
Rate of increase in compensation
levels
5% 5%
Rate of return on plan assets 8% 8%
As at March 31, 2011 and 2010, 100% of the plan assets were invested in the insurer managed funds.
(` in Million)
Particulars As of March 31,
2011 2010 2009
Experience adjustments:
On Plan liabilities (55) 84 (59)
On Plan assets 15 18 26
Present value of benefit
obligation 2,448 2,023 1,802
Fair value of plan assets 2,339 1,932 1,380
Excess of (obligations over
plan assets)/
plan assets over
obligations
(109) (91) (422)
The Company assesses these assumptions with its projected long-term plans of growth and prevalent industry standards. The estimates of future salary increase, considered in actuarial valuation, take account of inflation, seniority, promotion and other relevant factors such as supply and demand factors in the employment market.
Superannuation: Apart from being covered under the gratuity plan, the employees of the Company also participate in a defined contribution plan maintained by the Company. This plan is administered by the Life Insurance Corporation of India and ICICI Prudential Insurance Company Limited. The Company makes annual contributions based on a specified percentage of each covered employee’s salary.

Standalone Financial Statements
Wipro Limited 115
For the year ended March 31, 2011, the Company contributed ` 168 million (2010: ` 246 million) to superannuation fund.
Provident fund (PF): In addition to the above, all employees receive benefits from a provident fund. The employee and employer each make monthly contributions to the plan equal to 12% of the covered employee’s salary. A portion of the contribution is made to the provident fund trust established by the Company, while the remainder of the contribution is made to the Government’s provident fund.
The interest rate payable by the trust to the beneficiaries is regulated by the statutory authorities. The Company has an obligation to make good the shortfall, if any, between the returns from its investments and the administered rate.
The Guidance on implementing AS 15, Employee Benefits issued by the Accounting Standards Board (ASB) provides that exempt provident funds which require employers to meet the interest shortfall are in effect defined benefit plans. The Company believes that it is not practicable to reliably determine the interest shortfall obligation. Accordingly, the computation of liability and disclosure in accordance with the provisions of AS 15 cannot be implemented.
For the year ended March 31, 2011, the Company contributed ` 1,824 million (2010: ` 1,422 million) to PF.
13. Employee stock option
i) Employees covered under Stock Option Plans and Restricted Stock Unit (RSU) Option Plans are granted an option to purchase shares of the Company at the respective exercise prices, subject to requirements of vesting conditions. These options generally vest over a period of five years from the date of grant. Upon vesting, the employees can acquire one equity share for every option. The maximum contractual term for these stock option plans is generally 10 years.
ii) The stock compensation cost is computed under the intrinsic value method and amortised on a straight line basis over the total vesting period of five years. For the year ended March 31, 2011, the Company has recorded stock compensation expense of ` 1,310 million, (2010: ` 1,224 million).
iii) The compensation committee of the board evaluates the performance and other criteria of employees and approves the grant of options. These options vest with employees over a specified period subject to fulfillment of certain conditions. Upon vesting, employees are eligible to apply and secure allotment of Company’s shares at a price determined on the date of grant of options. The particulars of options granted under various plans are tabulated below. (The numbers of shares in the table below are adjusted for any stock splits and bonus shares issues).
Activity under stock option plans
Particulars Year Ended
March 31, 2011
Year Ended
March 31, 2010
Shares Wt.
average
exercise
price
Shares Wt.
average
exercise
price
Outstanding at the
beginning of the
year
201,606* 293.4 122,746 484
Granted - - - -
Exercised 80,000 293.4 - -
Forfeited and lapsed 121,606 293.4 1,140 254
Outstanding at the
end of the year
- - 121,606 485
Exercisable at the
end of the year
- - 1,606 212
Activity under Restricted Stock Option plans
Particulars Year Ended March
31, 2011
Year Ended March
31, 2010
Shares Wt.
average
exercise
price
Shares Wt.
average
exercise
price
Outstanding at
the beginning
of the year
20,046,267* 2 16,270,226 2
Granted 6,664,930 2 142,100 2
Exercised 6,352,832 2 3,230,443 2
Forfeited and
lapsed
1,751,712 2 1,154,123 2
Outstanding at
the end of the
year
18,606,653 2 12,027,760 2
Exercisable at
the end of the
year
8,681,374 2 5,365,080 2
The following table provides details in respect of range of exercise price and weighted average remaining contractual life (in months) for the options outstanding as at March 31, 2011.
Range of exercise price
Year Ended March 31, 2011
Year Ended March 31, 2010
Shares Wt. average
remaining life
Shares Wt. average
remaining life
` 2 18,606,653 36.89 12,027,760 37.98
` 489 - - 120,000 49
$ 3.46 – 5.01 - - 1,606 1
*Includes units on account of bonus issue.
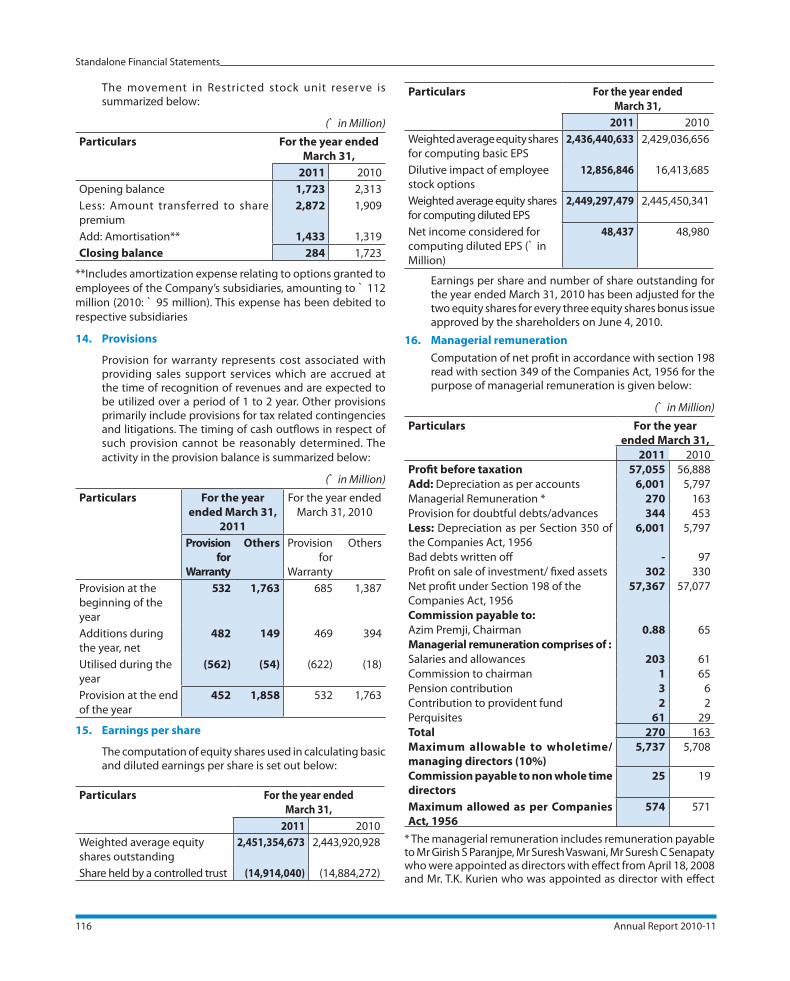
Standalone Financial Statements
116 Annual Report 2010-11
The movement in Restricted stock unit reserve is summarized below:
(` in Million)
Particulars For the year ended
March 31,
2011 2010
Opening balance 1,723 2,313
Less: Amount transferred to share
premium
2,872 1,909
Add: Amortisation** 1,433 1,319
Closing balance 284 1,723
**Includes amortization expense relating to options granted to
employees of the Company’s subsidiaries, amounting to ` 112
million (2010: ` 95 million). This expense has been debited to
respective subsidiaries
14. Provisions
Provision for warranty represents cost associated with providing sales support services which are accrued at the time of recognition of revenues and are expected to be utilized over a period of 1 to 2 year. Other provisions primarily include provisions for tax related contingencies and litigations. The timing of cash outflows in respect of such provision cannot be reasonably determined. The
activity in the provision balance is summarized below:
(` in Million)
Particulars For the year
ended March 31,
2011
For the year ended
March 31, 2010
Provision
for
Warranty
Others Provision
for
Warranty
Others
Provision at the
beginning of the
year
532 1,763 685 1,387
Additions during
the year, net
482 149 469 394
Utilised during the
year
(562) (54) (622) (18)
Provision at the end
of the year
452 1,858 532 1,763
15. Earnings per share
The computation of equity shares used in calculating basic and diluted earnings per share is set out below:
Particulars For the year ended
March 31,
2011 2010
Weighted average equity
shares outstanding
2,451,354,673 2,443,920,928
Share held by a controlled trust (14,914,040) (14,884,272)
Particulars For the year ended
March 31,
2011 2010
Weighted average equity shares
for computing basic EPS
2,436,440,633 2,429,036,656
Dilutive impact of employee
stock options
12,856,846 16,413,685
Weighted average equity shares
for computing diluted EPS
2,449,297,479 2,445,450,341
Net income considered for
computing diluted EPS (` in
Million)
48,437 48,980
Earnings per share and number of share outstanding for the year ended March 31, 2010 has been adjusted for the two equity shares for every three equity shares bonus issue approved by the shareholders on June 4, 2010.
16. Managerial remuneration
Computation of net profit in accordance with section 198 read with section 349 of the Companies Act, 1956 for the purpose of managerial remuneration is given below:
(` in Million)
Particulars For the year
ended March 31,
2011 2010
Profit before taxation 57,055 56,888
Add: Depreciation as per accounts 6,001 5,797
Managerial Remuneration * 270 163
Provision for doubtful debts/advances 344 453
Less: Depreciation as per Section 350 of
the Companies Act, 1956
6,001 5,797
Bad debts written off - 97
Profit on sale of investment/ fixed assets 302 330
Net profit under Section 198 of the
Companies Act, 1956
57,367 57,077
Commission payable to:
Azim Premji, Chairman 0.88 65
Managerial remuneration comprises of :
Salaries and allowances 203 61
Commission to chairman 1 65
Pension contribution 3 6
Contribution to provident fund 2 2
Perquisites 61 29
Total 270 163
Maximum allowable to wholetime/
managing directors (10%)
5,737 5,708
Commission payable to non whole time
directors
25 19
Maximum allowed as per Companies
Act, 1956
574 571
* The managerial remuneration includes remuneration payable to Mr Girish S Paranjpe, Mr Suresh Vaswani, Mr Suresh C Senapaty who were appointed as directors with effect from April 18, 2008 and Mr. T.K. Kurien who was appointed as director with effect

Standalone Financial Statements
Wipro Limited 117
from February 01, 2011. The above remuneration of Mr Girish S Paranjpe and Mr Suresh Vaswani for the current year was for the period April 01, 2010 to January 31, 2011.
Managerial remuneration does not include provision for compensated absences and gratuity, as the same are actuarially determined for the Company as a whole and separate figures are not available.
The managerial remuneration is based on the terms approved by the shareholders in the Annual General meeting held on July 22, 2010. The commission to Chairman is 0.3% of the incremental net profits over the previous year further adjusted as per the method approved by the Board of Governance and Compensation Committee.
17. The Management has identified enterprises which have provided goods and services to the Company and which qualify under the definition of micro and small enterprises, as defined under Micro, Small and Medium Enterprises Development Act, 2006. Accordingly, the disclosure in respect of the amounts payable to such enterprises as at March 31, 2011 has been made in the annual financial statements based on information received and available with the Company. The Company has not received any claim for interest from any supplier under the said Act.
(` in Million)
Particulars For the year
ended March 31,
2011 2010
The principal amount remaining unpaid
to any supplier as at the end of each
accounting year;
- 3
The interest due remaining unpaid to any
supplier as at the end of each accounting
year;
1 2
The amount of interest paid by the
Company along with the amounts of the
payment made to the supplier beyond the
appointed day during the year;
- Interest 2 -
- Principal 88 111
The amount of interest due and payable
for the period of delay in making payment
(which have been paid but beyond the
appointed day during the year) but without
adding the interest specified under this
Act;
- -
The amount of interest accrued and
remaining unpaid at the end of the year
1 2
The amount of further interest remaining
due and payable even in the succeeding
years, until such date when the interest
dues as above are actually paid to the
small enterprise.
- -
18. The list of balances with other banks in current account is given below.
(` in Million)
Name of the Bank Balances as at
March 31,
2011 2010
Wells Fargo 16,439 13,603
HSBC 2,010 784
Bank of America 319 197
Bank of Montreal 76 96
Saudi British Bank 63 64
Standard Chartered Bank 310 89
RABO Bank 100 222
Dresdner Bank 7 3
Citi Bank 1 136
Standard Bank 29 12
Bahrain Saudi Bank 36 21
Caja Madrid Bank - 4
Merill Lynch 5 9
US Bank 7 7
UniCredit Banca 2 4
Mitsubishi, Tokyo 44 -
Shinhan Bank 9 -
Total 19,457 15,251
Maximum balances during the year are given below.
(` in Million)
Name of the Bank Maximum balance
during the year
ending March 31,
2011 2010
Wells Fargo 16,439 13,648
HSBC 3,466 2,486
Standard Chartered Bank 1,097 120
Bank of America 406 487
Bank of Montreal 99 153
US Bank 25 44
Saudi British Bank 69 69
RABO Bank 451 510
UniCredit Banca 3 8
Bahrain Saudi Bank 38 27
Citi Bank 151 176
Merill Lynch 77 31
Dresdner Bank 30 33
Caja Madrid Bank 41 26
Standard Bank 29 12
Mitsubishi, Tokyo 44 -
Shinhan Bank 19 -

Standalone Financial Statements
118 Annual Report 2010-11
19. Borrowings
The Company entered into an arrangement with a consortium of banks to obtain External Commercial Borrowings (ECB) during the year ended March 31, 2008. Pursuant to this arrangement, the Company has availed ECB of approximately 35 billion Yen repayable in full in March 2013. The ECB is an unsecured borrowing and the Company is subject to certain customary restrictions on additional borrowings and quantum of payments for acquisitions in a financial year.
20. Investment in subsidiaries and other investments
The details of investment in subsidiaries and other investments are given below.
Preference Shares (Fully paid up)
(` in Million)
Name of the subsidiary No. of shares Currency Face value As at March 31,
2011 2010 2011 2010
9% cumulative redeemable preference shares
held in Wipro Trademarks Holding Limited
1,800 1,800 ` 10 - -
Wipro Yardley Consumer Care Private
Limited
- 5,720,764 ` 10 - 57
- 57
Equity shares (Fully paid up)
(` in Million)
Name of the subsidiary No. of shares Currency Face value As at March 31,
2011 2010 2011 2010
Wipro Consumer Care Limited 50,000 50,000 ` 10 1 1
Wipro Chandrika Limited 900,000 900,000 ` 10 7 7
Wipro Trademarks Holding Limited 94,000 93,250 ` 10 22 22
Wipro Travel Services Limited 66,171 66,171 ` 10 1 1
Wipro Technology Services Limited. 39,284,680 39,284,680 ` 10 6,205 6,205
Wipro Holdings (Mauritius) Limited 44,448,318 30,448,318 USD 1 2,023 1,391
Wipro Australia Pty Limited 25,000 25,000 AUD 1 1 1
Wipro Inc 156,378 150,378 USD 2,500 16,802 16,101
Wipro Japan KK 650 650 JPY 50,000 10 10
Wipro Shanghai Limited not applicable 9 9
Wipro Cyprus Private Limited 148,910 148,319 Euro 1 33,355 33,215
3D Networks Pte Limited 28,126,108 28,126,108 Sing $ 1 1,271 1,271
Planet PSG Pte Limited 1,472,279 1,472,279 Sing $ 1 94 94
Cmango Pte Limited 2 2 USD 1 16 16
WMNETSERV Limited 24,000 24,000 USD 1 83 83
Wipro Chengdu Limited not applicable 24 24
Wipro Airport IT Services Limited 3,700,000 3,700,000 ` 10 37 37
Lornamead Personal Care Private Limited - 7,706,090 ` 10 - 77
Wipro Infrastructure Engineering Machinery
(Changzhou) Company Limitednot applicable
USD 1 104 -
60,065 58,565

Standalone Financial Statements
Wipro Limited 119
Investment in associates (Fully paid up)
(` in Million)
Particulars No. of shares Currency Face value As at March 31,
2011 2010 2011 2010
Wipro GE Healthcare Private Limited 5,150,597 5,150,597 ` 10 227 227
Other Investments – unquoted (Fully paid up)
(` in Million)
Particulars No. of shares/units Currency Face value As at March 31,
2011 2010 2011 2010
Debentures in Citicorp Finance (India)
Limited
2,500 2,500 ` 100,000 241 241
Debentures in Morgan Stanley 500 500 ` 1,000,000 481 481
Others 69 86
791 808
21. The details of Quoted- Current investments in money market mutual funds are given below.
A) Closing position
(` in Million)
Fund House Number of Units as at March 31, Balances as at March 31,
2011 2010 2011 2010
Birla Sunlife Mutual Fund 281,936,542 150,477,088 3,709 1,524
DWS Mutual Fund - 56,560,196 - 567
DSP BlackRock Mutual Fund 50,003,369 - 500 -
Kotak Mahindra Mutual Fund 100,461,481 94,007,724 1,335 943
LIC Mutual Fund - 812,696,841 - 11,196
ICICI Prudential AMC Mutual Fund 239,954,367 1,497,039 6,025 158
Reliance Mutual Fund - 74,066,833 - 793
IDFC Mutual Fund 163,254,234 283,951,663 2,752 2,841
Tata Mutual Fund 184,569,350 - 2,703 -
Franklin Templeton Mutual Fund 238,800,422 517,125 3,676 521
UTI AMC Mutual Fund 28,632,720 4,085 1,065 5
JP Morgan AMC 15,000,000 - 150 -
Religare Aegon AMC Mutual Fund 30,009,000 - 300 -
SBI Mutual Fund 129,999,183 - 1,662 -
Total 1,462,620,668 1,473,778,594 23,877 18,548

Standalone Financial Statements
120 Annual Report 2010-11
B) Fund-wise details of units purchased and sold during the year
Fund House Purchased/Dividend reinvested Redeemed
2011 2010 2011 2010
Fortis Mutual Fund (ABN) 100,166,649 300,366,144 100,166,649 300,366,144
AIG Mutual Fund - - - 100,000
Birla Sunlife Mutual Fund 6,583,566,938 2,125,282,052 6,452,107,484 2,111,510,336
DBS Cholamandalam Mutual Fund 59,274,863 - 59,274,863 10,000,000
DWS Mutual Fund 118,380,459 334,293,147 174,940,655 297,732,952
DSP BlackRock Mutual Fund 376,025,881 - 326,022,512 20,000,000
Fidelity Mutual Fund - - - 15,000,000
HDFC Mutual Fund 1,203,502,639 2,834,429,983 1,203,502,639 3,037,534,008
HSBC Mutual Fund - - - 30,000,000
ING Mutual Fund - - - 17,000,000
J M Mutual Fund - 88 - 18,388
JP Morgan AMC 1,081,473,692 80,668,938 1,066,473,692 80,668,938
Kotak Mahindra Mutual Fund 2,660,511,259 1,609,283,936 2,654,057,502 1,557,149,765
LIC Mutual Fund 2,747,588,963 4,366,563,455 3,560,285,804 3,566,048,218
L & T 15,000,000 - 15,000,000 -
Religare Aegon AMC Mutual Fund 714,737,107 149,062,198 684,728,107 149,062,198
Principal PNB - - - 15,000,985
ICICI Prudential AMC 2,707,593,387 5,954,564,798 2,469,136,059 6,318,886,480
Reliance Mutual Fund 2,606,256,659 2,981,569,371 2,680,323,492 3,027,639,358
SBI Mutual Fund 3,269,611,278 - 3,139,612,095 -
IDFC Mutual Fund 3,557,380,350 1,078,183,112 3,678,077,779 832,027,904
Sundaram BNP Paribas Mutual Fund - - - 5,005,952
Tata Mutual Fund 1,014,769,044 125,058,296 830,199,694 145,058,296
Franklin Templeton Mutual Fund 1,757,810,399 1,318,500,362 1,519,527,102 1,411,200,792
UTI AMC Mutual Fund 345,146,562 28,275,807 316,517,927 126,097,261
Total 30,918,796,129 23,286,101,687 30,929,954,055 23,073,107,975
22. Related party relationships and transactions
List of subsidiaries as of March 31, 2011 are provided in the table below.
Direct Subsidiaries Step Subsidiaries Country of
Incorporation
Wipro Inc. U.S.Wipro Gallagher Solutions Inc U.S.Enthink Inc. U.S.Infocrossing Inc. U.S.
cMango Pte Limited SingaporeWipro Japan KK JapanWipro Shanghai Limited ChinaWipro Trademarks Holding Limited India
Cygnus Negri Investments
Private Limited
India
Wipro Travel Services Limited IndiaWipro Consumer Care Limited IndiaWipro Holdings (Mauritius) Limited Mauritius
Wipro Holdings UK Limited U.K.Wipro Technologies UK Limited U.K.Wipro Holding Austria GmbH(A) Austria3D Networks (UK) Limited U.K.

Standalone Financial Statements
Wipro Limited 121
Direct Subsidiaries Step Subsidiaries Country of
Incorporation
Wipro Cyprus Private Limited CyprusWipro Technologies S.A DE C. V MexicoWipro BPO Philippines LTD. Inc PhilippinesWipro Holdings Hungary
Korlátolt Felelősségű Társaság
Hungary
Wipro Technologies Argentina SA ArgentinaWipro Information Technology
Egypt SAE
Egypt
Wipro Arabia Limited* Saudi ArabiaWipro Poland Sp Zoo PolandWipro Outsourcing Services UK
Limited
U.K.
Wipro Technologies (South
Africa) Proprietary Limited
South Africa
Wipro Information Technology
Netherlands BV
(formerly RetailBox BV)
Netherland
Wipro Portugal S.A.(A) (Formerly
Enabler Informatica SA)
Portugal
Wipro Technologies Limited,
Russia
Russia
Wipro Technologies Oy FinlandWipro Infrastructure
Engineering AB
Sweden
Wipro Infrastructure Engineering
Oy
Finland
Hydrauto Celka San ve Tic TurkeyWipro Technologies SRL RomaniaWipro Singapore Pte Limited Singapore
PT WT Indonesia IndonesiaWipro Unza Holdings Limited (A) SingaporeWipro Technocentre (Singapore)
Pte Limited
Singapore
Wipro (Thailand) Co Limited ThailandWipro Bahrain Limited WLL Bahrain
Wipro Yardley FZE Dubai
Wipro Australia Pty Limited AustraliaWipro Networks Pte Limited (formerly 3D
Networks Pte Limited)
Singapore
Planet PSG Pte Limited SingaporePlanet PSG SDN BHD Malaysia
Wipro Chengdu Limited ChinaWipro Chandrika Limited* IndiaWMNETSERV Limited Cyprus
WMNETSERV (U.K.) Limited. U.K.WMNETSERV INC U.S.
Wipro Technology Services Limited IndiaWipro Airport IT Services Limited* IndiaWipro Infrastructure Engineering
Machinery (Changzhou) Co., Ltd.
China
*All the above direct subsidiaries are 100% held by the Company except that the Company hold 66.67% of the equity securities of
Wipro Arabia Limited, 90% of the equity securities of Wipro Chandrika Limited and 74% of the equity securities of Wipro Airport
IT Services Limited.

Standalone Financial Statements
122 Annual Report 2010-11
(A) Step Subsidiary details of Wipro Unza Holdings Limited, Wipro Holding Austria GmbH and Wipro Portugal S.A, are as follows :
Step Subsidiaries Step Subsidiaries Country of
Incorporation
Wipro Unza Singapore Pte Limited SingaporeWipro Unza Indochina Pte Limited Singapore Wipro Unza V i e tnam Co. ,
Limited
Vietnam
Wipro Unza Cathay Limited Hong KongWipro Unza (China) Limited Hong Kong Wipro Unza (Guangdong)
Consumer Products Limited.
China
PT Unza Vitalis IndonesiaWipro Unza (Thailand) Limited ThailandUnza Overseas Limited British virgin
islandsUnzafrica Limited NigeriaWipro Unza Middle East Limited British virgin
islandsUnza International Limited British virgin
islandsUnza Nusantara Sdn Bhd Malaysia Unza Holdings Sdn Bhd Malaysia Unza (Malaysia) Sdn Bhd Malaysia UAA (M) Sdn Bhd Malaysia Manufacturing Services Sdn
Bhd
Malaysia
Shubido Pacific Sdn Bhd(a) Malaysia Gervas Corporation Sdn Bhd Malaysia Gervas (B) Sdn Bhd Malaysia Formapac Sdn Bhd MalaysiaWipro Holding Austria GmbH Austria
New Logic Technologies GmbH AustriaNew Logic Technologies SARL France
Wipro Portugal S.A.SAS Wipro France
(formerly Enabler France SAS)
France
Wipro Retail UK Limited
(formerly Enabler UK Limited)
U.K.
Wipro do Brasil Technologia Ltda
(formerly Enabler Brazil Ltda)
Brazil
Wipro Techno logies Gmbh
(formerly Enabler & Retail Consult
GmbH)
Germany
a) All the above subsidiaries are 100% held by the Company except Shubido Pacific Sdn Bhd in which the Company holds 62.55% of the equity securities
Name of other related parties Nature % of holding Country of
Incorporation
Wipro Equity Reward Trust Trust Fully controlled trust IndiaWipro Inc Trust Trust Fully controlled trust USA
Wipro GE Healthcare Private Limited Associate 49% IndiaAzim Premji Foundation Entity controlled by Director Hasham Premji (partnership firm) Entity controlled by Director Prazim Traders (partnership firm) Entity controlled by DirectorZash Traders (partnership firm) Entity controlled by DirectorRegal Investment & Trading Company Private Limited Entity controlled by Director
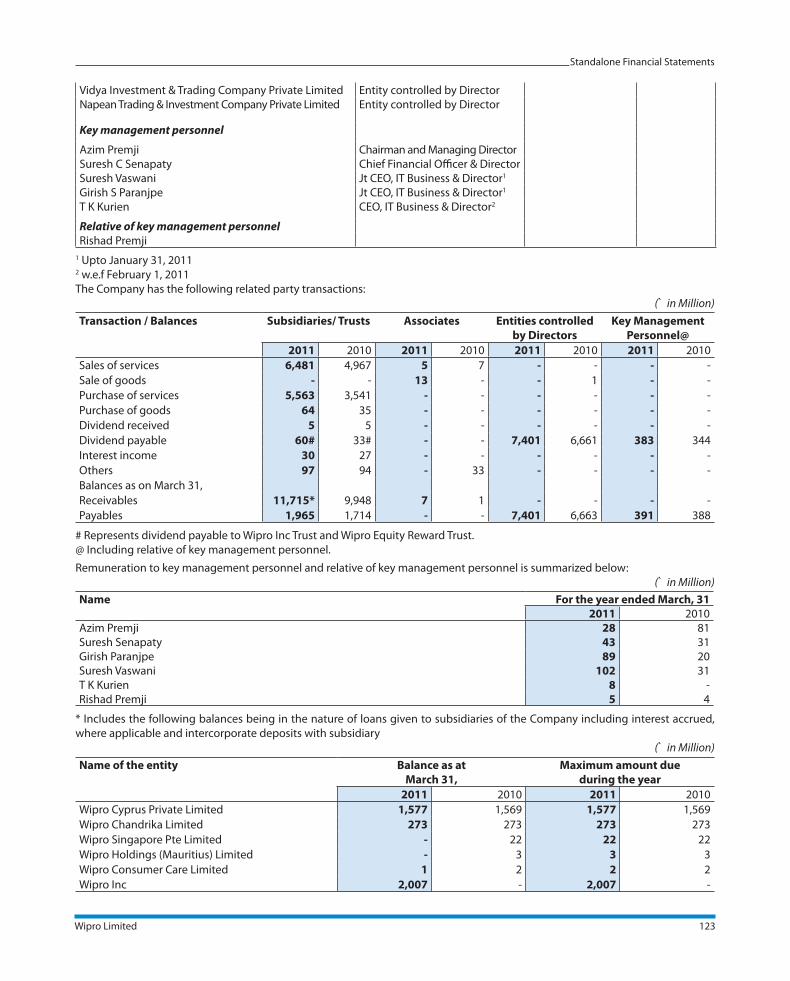
Standalone Financial Statements
Wipro Limited 123
Vidya Investment & Trading Company Private Limited Entity controlled by DirectorNapean Trading & Investment Company Private Limited Entity controlled by Director
Key management personnel
Azim Premji Chairman and Managing Director Suresh C Senapaty Chief Financial Officer & DirectorSuresh Vaswani Jt CEO, IT Business & Director1
Girish S Paranjpe Jt CEO, IT Business & Director1
T K Kurien CEO, IT Business & Director2
Relative of key management personnel
Rishad Premji
1 Upto January 31, 20112 w.e.f February 1, 2011
The Company has the following related party transactions:
(` in Million)
Transaction / Balances Subsidiaries/ Trusts Associates Entities controlled
by Directors
Key Management
Personnel@
2011 2010 2011 2010 2011 2010 2011 2010
Sales of services 6,481 4,967 5 7 - - - -
Sale of goods - - 13 - - 1 - -
Purchase of services 5,563 3,541 - - - - - -
Purchase of goods 64 35 - - - - - -
Dividend received 5 5 - - - - - -
Dividend payable 60# 33# - - 7,401 6,661 383 344
Interest income 30 27 - - - - - -
Others 97 94 - 33 - - - -
Balances as on March 31,
Receivables 11,715* 9,948 7 1 - - - -
Payables 1,965 1,714 - - 7,401 6,663 391 388
# Represents dividend payable to Wipro Inc Trust and Wipro Equity Reward Trust.
@ Including relative of key management personnel.
Remuneration to key management personnel and relative of key management personnel is summarized below:
(` in Million)
Name For the year ended March, 31
2011 2010Azim Premji 28 81Suresh Senapaty 43 31Girish Paranjpe 89 20Suresh Vaswani 102 31T K Kurien 8 -Rishad Premji 5 4
* Includes the following balances being in the nature of loans given to subsidiaries of the Company including interest accrued,
where applicable and intercorporate deposits with subsidiary
(` in Million)
Name of the entity Balance as at
March 31,
Maximum amount due
during the year
2011 2010 2011 2010
Wipro Cyprus Private Limited 1,577 1,569 1,577 1,569
Wipro Chandrika Limited 273 273 273 273
Wipro Singapore Pte Limited - 22 22 22
Wipro Holdings (Mauritius) Limited - 3 3 3
Wipro Consumer Care Limited 1 2 2 2
Wipro Inc 2,007 - 2,007 -

Standalone Financial Statements
124 Annual Report 2010-11
The following are the significant transactions during the year ended March 31, 2011 and 2010:
(` in Million)
Name of the entity Sale of services Purchase of services Purchase of goods
2011 2010 2011 2010 2011 2010
Wipro Inc 4,144 3,519 383 254 - -
Infocrossing Inc 491 6 839 237 - -
Wipro Japan KK - - 373 186 - -
Wipro Shanghai Limited 65 108 204 112 - -
Unza Holdings Limited - - - - 61 35
Wipro Portugal S. A. 498 536 783 1,369 - -
New Logic Technologies GmbH 286 97 40 77 - -
Wipro Technologies S.A DE C.V 71 68 107 37 - -
Wipro Information Technology, Netherlands BV 175 136 - - - -
Wipro Technologies Limited, Russia 32 23 - - - -
Wipro Technologies OY 51 65 635 297 - -
Wipro Gallagher Solutions Inc 116 60 20 15 - -
Wipro Holdings UK Limited 226 222 - - - -
Wipro Poland Sp Zoo - - 193 - - -
Wipro Technologies SRL-BPO - - 937 150 - -
Wipro Infrastructure Engineering Machinery
(Changzhou) Company Limited - - 228 - - -
Wipro Retail UK Limited - - 710 - - -
SAS Wipro France - - 16 - - -
Wipro do Brasil Technologia Ltda - - 7 - - -
Wipro (Australia)Pty Ltd 52 11 - - - -
Wipro Airport IT Services-Products division 194 - - - - -
23. Debts due from companies under the same management
(` in Million)
Companies As of March 31,
2011 2010
Wipro Inc 2,249 3,801
Inforcorssing Inc 1,309 1,174
Wipro Arabia Limited 1,040 824
Wipro Technology services Limited 449 280
Wipro Holding Austria Gmbh 338 102
Wipro Technologies S.A DE C.V 334 226
Wipro Japan KK 311 243
Wipro Shanghai Limited 301 199
Wipro Holdings UK Limited 283 160
Wipro Infrastructure Engineering AB 197 135
Wipro Technologies Limited Russia 175 117
Wipro Unza Holdings Limited 120 75
Wipro Chandrika Limited 110 93
Wipro Technologies Gmbh 108 139
Wipro (Thailand) Co Limited 102 75
Wipro Australia Pty Limited 89 25
Wipro Gallagher Solutions Inc 53 31
Wipro Information Technology Netherlands BV 51 108

Standalone Financial Statements
Wipro Limited 125
Companies As of March 31,
2011 2010
Wipro Poland Sp Zoo 51 134
Wipro Information Technology Egypt SAE 49 37
Wipro Airport IT Services Limited 40 -
Wipro Chengdu Limited 25 -
Wipro Technologies SRL 17 -
Wipro Bahrain Limited WLL 16 -
Wipro Technocentre (Singapore) Pte Ltd 16 22
Wipro Technologies Argentina SA 11 12
Wipro Singapore Pte Limited 8 -
Wipro Holdings (Mauritius) Limited 3 -
Wipro Yardley FZE 2 -
Enthink Inc - 46
Wipro Yardley Consumer Care Private Ltd - 21
7,857 8,079
24. Income Tax
The provision for taxation includes tax liability in India on the company’s worldwide income. The tax has been computed on the worldwide income as reduced by the various deductions and exemptions provided by the Income tax Act in India (Act) and the tax credit in India for the tax liabilities payable in foreign countries.
Most of the Company’s operations are through units in Software Technology Parks (‘STPs’). Income from STPs is eligible for 100% deduction upto March 31, 2011. The Company also has operations in Special Economic Zones (SEZ’s). Income from SEZ’s are eligible for 100% deduction for the first 5 years, 50% deduction for the next 5 years and 50% deduction for another 5 years subject to fulfilling certain conditions.
Pursuant to the amendments in the Act, the Company has calculated its tax liability after considering the provisions of law relating to Minimum Alternative Tax (MAT). As per the Act, any excess of MAT paid over the normal tax payable can be carried forward and set off against the future tax liabilities. Accordingly an amount of ` 126 million (2010: ` 195 million) is included under ‘Loans and Advances’ in the balance sheet as of March 31, 2011.
i) Provision for tax has been allocated as follows:
(` in Million)
Particulars For the year ended March 31,
2011 2010
Net current tax* 8,378 7,679
Deferred tax 240 229
Total income taxes 8,618 7,908
* Current tax provision includes reversal of tax provision in
respect of earlier periods no longer required amounting to `
590 million for the year ended March 31, 2011 (2010: ` 476
million).
ii) The components of the net deferred tax asset are as follows :
(` in Million)
Particulars As of March 31,
2011 2010
Fixed assets (1,059) (549)
Accrued expenses and
liabilities525 644
Allowances for doubtful
debts642 253
Net deferred tax assets 108 348
25. The Company publishes standalone financial statements along with the consolidated financial statements in the annual report. In accordance with Accounting Standard 17, Segment Reporting, the Company has disclosed the segment information in the consolidated financial statements.
26. Corresponding figures for previous year presented have been regrouped, where necessary, to conform to the current year classification.
27. Additional Information Schedule VI

Standalone Financial Statements
126 Annual Report 2010-11
QUANTITATIVE INFORMATION PURSUANT TO SCHEDULE VI
i) Licensed/registered/installed capacities
Particulars Licensed Capacity** Installed capacity @
March 31,
2011
March 31,
2010
March 31,
2011
March 31,
2010
Vanaspati / Hydrogenated oils T P A * NA NA 45,000 45,000
Toilet Soaps T P A * NA NA 134,026 128,430
Leather shoe uppers 000s NA NA 750 750
Fatty acids T P A * NA NA 78,450 68,650
Glycerine T P A * NA NA 1,650 1,000
General lighting systems lamps 000s NA NA 110,305 110,305
Fluorescent tube lights 000s NA NA 27,097 27,097
Compact flourescent lamps 000s NA NA 23,355 14,595
Mini computers / micro processor based systems and data
communication systems
N P A # NA NA
691,200 691,200
Hydraulic and Pneumatic tubes N P A # NA NA 831,140 649,320
Tipping Gear systems N P A # NA NA 50,000 35,000
@ Installed capacities are as per certificate given by management on which auditors have relied.
* TPA indicates tons per annum
# NPA indicates nos. per annum
** The company is exempt from the licensing provisions of the Industries (Development Regulation) Act, 1951.
ii) Production
Particulars March 31,
2011
March 31,
2010
Unit Quantity Quantity
Mini computers/micro processor based systems and data communication systems Nos. 217,016 224,744
Toilet soaps Tons 71,471 64,486
Vanaspati / hydrogenated oils Tons 5,909 4,714
Shoe uppers 000s 161 97
Fluorescent tube lights 000s 5,836 6,084
Fatty acids Tons 44,359 41,788
Glycerine Tons 1,355 1,309
Hydraulic and pneumatic tubes Nos. 454,602 301,323
Tipping Gear systems Nos. 23,276 14,532
Water Treatment Skids Nos. 26 -

Standalone Financial Statements
Wipro Limited 127
iii) Sales
Particulars March 31, 2011 March 31, 2010
Unit Quantity ` in Mn Quantity ` in Mn
Software services - - 194,139 - 176,740
Mini computers/micro processor based systems and data
communication systems
Nos 217431 28,581 224,886 18,496
IT enabled services - 18,021 - 16,836
Toilets soaps (a) Tons 71,668 8,404 63,376 7,479
Vanaspati/hydrogenated oils Tons 5,981 350 4,767 235
Shoe uppers 000s 162 69 97 38
Glycerine Tons 145 7 321 11
Lighting products (b) - 2,075 - 1,570
Hydraulic and Pneumatic equipment 455,152 6,186 305,348 3,761
Tipping Gear Systems 23,276 122 14,532 290
Spares/components for Tippers/cylinders - 55 - -
Water Treatment Skids(c) - 344 - -
Others (b) 5,659 - 4,607
Total 264,012 230,063
Less: Excise Duty 1,007 843
Total 263,005 229,220
(a) Includes samples and shortages(b) It is not practicable to give quantitative information in the absence of common expressible unit. (c) Water treatment skids are the identifiable units for water business. The rest are all part of project revenue
iv) Closing stocks
Particulars March 31, 2011 March 31, 2010
Unit Quantity ` in Mn Quantity ` in Mn
Mini computers/micro processor based systems and data
communication systems *
Nos. 2,813 2,012 3,228 2,269
Toilets soaps Tons 1,946 210 2,452 135
Lighting products * - 191 - 207
Hydraulic and Pneumatic equipment Nos. 11,288 113 11,838 70
Solar thin film and other ecoenergy related products Nos. 43,814 127 - -
Others (b) - 43 - 52
2,696 2,733
Closing stock of traded goods - 388 - 325
Total 3,084 3,058
* Includes traded products; bifurcation between manufactured and traded products not practicable.(b) It is not practicable to give quantitative information in the absence of common expressible unit.

Standalone Financial Statements
128 Annual Report 2010-11
v) Purchases for trading
Particulars March 31, 2011 March 31, 2010
Quantity ` in Mn Quantity ` in Mn
Computer units/printers/software products* - 22,241 - 23,909
Lighting products * - 935 - 580
Spares/ components/seal kits for cylinders and tippers * - 85 - 97
Solar thin film and other ecoenergy related products - 141 - -
Others * - 3,570 - 2,826
26,972 27,412
*It is not practicable to give quantitative information in the absence of common expressible unit.
vi) Raw Material consumed
Particulars March 31, 2011 March 31, 2010
Unit Quantity ` in Mn Quantity ` in Mn
Peripherals/components for computers* - - 1,287 - 3,052
Oil and fats Tons 62,084 2,903 53,871 1,870
Tubes Mts 389,884 660 276,936 470
Rounds and rods Tons 9,395 428 7,548 323
Casting and forging Nos 207,809 144 190,306 102
Bearings, seals and wipers Nos 15,416,303 480 9,032,671 183
Water Treatment Skids * Nos - 268 - -
Others * - 4,687 - 3,892
10,857 9,892
*It is not practicable to give quantitative information in the absence of common expressible unit.
vii) Value of imported and indigenous materials consumed
Particulars March 31, 2011 March 31, 2010
% ` In Mn % ` In Mn
Raw Materials
Imported 35 3,837 37 3,644
Indigenous 65 7,020 63 6,248
100 10,857 100 9,892
Stores and Spares
Imported 7 17 4 16
Indigenous 93 210 96 368
100 227 100 384
viii) Value of imports on CIF basis
(` in Million)
Particulars March 31,
2011 2010
(Does not include value of imported items locally purchased)
Raw materials, components and peripherals 27,358 17,484
Stores and spares 40 43
Capital goods 231 715
27,629 18,242

Standalone Financial Statements
Wipro Limited 129
ix) Activities in foreign currency
(` in Million)
Particulars March 31,
2011 2010
a) Expenditures
Traveling and onsite allowance 57,855 49,093
Interest 114 853
Royalty 307 518
Professional fees 7,843 6,458
Subcontracting charges 9,390 5,858
Dividend 0.11 0.06
Others 10,133 8,864
85,642.11 71,644.06
b) Earnings
Export of goods on F.O.B basis 6,291 4,186
Services 177,192 163,390
Agency commission 288 353
183,771 167,929
Dividend remitted in foreign currencies:
Final Dividend
Particulars March 31,
2011 2010
Net amount remitted (in ` Million) 0.04 0.06
Number of shares held by non-resident shareholders 6,978 16,166
No of foreign shareholders 2 9
Financial year to which final dividend relates 2009-10 2008-09
Dividend remitted in foreign currencies:
Interim Dividend
Particulars March 31,
2011 2010
Net amount remitted (in ` Million) 0.07 -
Number of shares held by non-resident shareholders 34,810 -
No of foreign shareholders 8 -
Financial year to which final dividend relates 2010-11 -

Standalone Financial Statements
130 Annual Report 2010-11
BangaloreApril 27, 2011
For and on behalf of the Board of Directors
Azim Premji B. C. Prabhakar T. K. Kurien Dr. Jagdish N. ShethChairman Director CEO, IT Business Director & Executive Director
Suresh C. Senapaty V. Ramachandran Chief Financial Officer Company Secretary & Director
ADDITIONAL INFORMATION PURSUANT TO THE PROVISIONS OF PART IV OF SCHEDULE VI TO THE COMPANIES ACT, 1956
BALANCE SHEET ABSTRACT AND THE COMPANY’S GENERAL BUSINESS PROFILE
I. Registration Details
CIN L32102KA1945PLC020800
Registration No. 20800 State Code 08
Balance Sheet Date 31st March 2011
II. Capital raised during the year (` in million)
Public issue Nil Bonus Issue 1,960
Rights issue Nil Private Placement -
Issue of shares on exercise of
Employee Stock Options 12
American Depository Offering Nil
III. Position of mobilisation of and (` in million)
deployment of funds
Total Liabilities 260,650 Total Assets 260,650
Sources of funds Application of Funds
Paid-up capital 4,908 Goodwill 447
Share application money pending Net Fixed Assets 48,401
allotment 7 Investments 108,134
Reserves and Surplus 208,294 Deferred tax assets 108
Secured Loans - Net Current Assets 104,007
Unsecured Loans 47,441
IV. Performance of the Company (` in million)
Turnover 269,038
Total Expenditure 211,983
Profit before Tax 57,055
Profit after Tax 48,437
Earnings per share (basic) 19.88
Dividend 200%
V. Generic names of three principal products/services of the Company (as per monetary terms)
i) Item code no (ITC Code) 84713010
Product description Personal Computer
ii) Item code no (ITC Code) 85249113
Product description I.T Software
iii) Item code no (ITC Code) 15162011
Product description Vegetable fats and oils (Edible Grade)

Consolidated Financial Statements
Wipro Limited 131
AUDITORS’ REPORT TO THE BOARD OF DIRECTORS ON THE CONSOLIDATED FINANCIAL STATEMENTS OF WIPRO LIMITED
AND ITS SUBSIDIARIES
We have audited the attached consolidated balance sheet of Wipro Limited (‘the Company’) and subsidiaries (collectively called ‘the
Wipro Group’) as at March 31, 2011, the consolidated profit and loss account and the consolidated cash flow statement for the year
ended on that date, annexed thereto. These consolidated financial statements are the responsibility of the Company’s management.
Our responsibility is to express an opinion on these consolidated financial statements based on our audit.
We conducted our audit in accordance with auditing standards generally accepted in India. Those Standards require that we plan
and perform the audit to obtain reasonable assurance about whether the consolidated financial statements are free of material
misstatement. An audit includes examining, on a test basis, evidence supporting the amounts and disclosures in the consolidated
financial statements. An audit also includes assessing the accounting principles used and significant estimates made by management,
as well as evaluating the overall consolidated financial statement presentation. We believe that our audit provides a reasonable
basis for our opinion.
We report that the consolidated financial statements have been prepared by the Company’s management in accordance with the
requirements of Accounting Standard 21, Consolidated Financial Statements and Accounting Standard 23, Accounting for Investments
in Associates in Consolidated Financial Statements, issued by the Institute of Chartered Accountants of India (‘ICAI’).
Without qualifying our opinion, we draw attention to Note 4 of the Notes to Accounts that describes the early adoption by the
Company of Accounting Standard (AS) 30, Financial Instruments: Recognition and Measurements, along with limited revisions to
other accounting standards, issued by the Institute of Chartered Accountants of India. AS 30, along with limited revisions to the
other accounting standards, have not currently been notified by the National Advisory Council for Accounting Standards (NACAS)
pursuant to the Companies (Accounting Standards) Rules, 2006 as per Section 211(3C) of the Companies Act, 1956. Had the Company
not early adopted AS 30 and the related limited revisions, profit after taxation for the year ended March 31, 2011 would have been
higher by ` 447 million.
In our opinion and to the best of our information and according to the explanations given to us, the consolidated financial statements
give a true and fair view in conformity with the accounting principles generally accepted in India:
(a) in the case of the consolidated balance sheet, of the state of affairs of the Wipro Group as at March 31, 2011;
(b) in the case of the consolidated profit and loss account, of the profit of the Wipro Group for the year ended on that date; and
(c) in the case of the consolidated cash flow statement, of the cash flows of the Wipro Group for the year ended on that date.
for BSR & Co.
Chartered Accountants
Firm registration number: 101248W
Natrajh Ramakrishna
Partner
Membership No. 032815
Bangalore
June 17, 2011
Auditors’ Report

Consolidated Financial Statements
132 Annual Report 2010-11
(` in Million)
As of March 31,
Schedule 2011 2010
SOURCES OF FUNDS
Shareholders’ Funds
Share capital 1 4,906 2,934
Share application money pending allotment 7 18
Reserves and surplus 2 219,964 179,491
224,877 182,443
Loan Funds
Secured loans 3 1,904 2,119
Unsecured loans 4 50,898 60,394
52,802 62,513
Minority interest 691 437
278,370 245,393
APPLICATION OF FUNDS
Goodwill 54,266 53,346
Fixed Assets and Intangible Assets
Gross block 5 99,324 86,253
Less: Accumulated depreciation and amortisation 48,706 42,314
Net block 50,618 43,939
Capital work-in-progress and advances 7,246 12,355
57,864 56,294
Investments 6 52,406 34,060
Deferred Tax Asset (Net) 18(13) 38 254
Current Assets, Loans and Advances
Inventories 7 9,707 7,926
Sundry debtors 8 61,773 51,150
Cash and bank balances 9 61,141 64,878
Loans and advances 10 71,005 58,175
203,626 182,129
Less: Current Liabilities and Provisions
Current liabilities 11 61,020 57,342
Provisions 12 28,810 23,348
89,830 80,690
Net Current Assets 113,796 101,439
278,370 245,393
Notes to accounts 18
The schedules referred to above form an integral part of the consolidated balance sheet
As per our report attached
for BSR & Co.,Chartered AccountantsFirm Registration number: 101248W
Natrajh RamakrishnaPartnerMembership No. 032815
BangaloreJune 17, 2011
For and on behalf of the Board of Directors
Azim Premji B. C. Prabhakar T. K. KurienChairman Director CEO, IT Business & Executive Director
Suresh C. Senapaty V. Ramachandran Chief Financial Officer Company Secretary & Director
Consolidated Balance Sheet
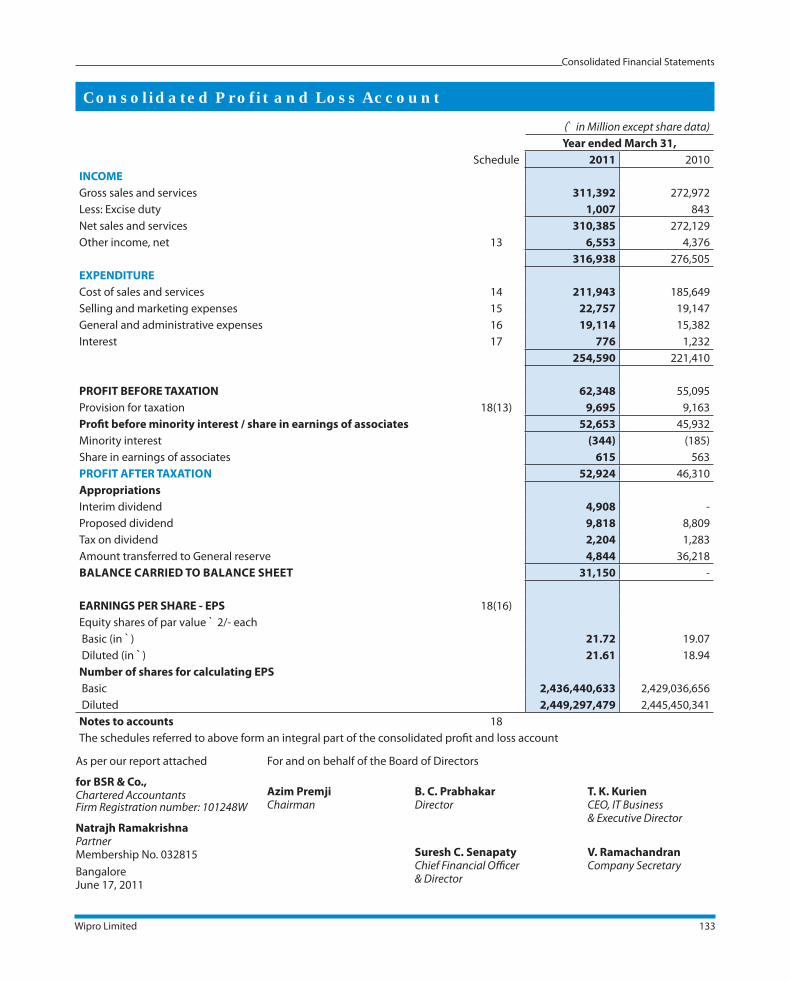
Consolidated Financial Statements
Wipro Limited 133
(` in Million except share data)
Year ended March 31,
Schedule 2011 2010
INCOME
Gross sales and services 311,392 272,972
Less: Excise duty 1,007 843
Net sales and services 310,385 272,129
Other income, net 13 6,553 4,376
316,938 276,505
EXPENDITURE
Cost of sales and services 14 211,943 185,649
Selling and marketing expenses 15 22,757 19,147
General and administrative expenses 16 19,114 15,382
Interest 17 776 1,232
254,590 221,410
PROFIT BEFORE TAXATION 62,348 55,095
Provision for taxation 18(13) 9,695 9,163
Profit before minority interest / share in earnings of associates 52,653 45,932
Minority interest (344) (185)
Share in earnings of associates 615 563
PROFIT AFTER TAXATION 52,924 46,310
Appropriations
Interim dividend 4,908 -
Proposed dividend 9,818 8,809
Tax on dividend 2,204 1,283
Amount transferred to General reserve 4,844 36,218
BALANCE CARRIED TO BALANCE SHEET 31,150 -
EARNINGS PER SHARE - EPS 18(16)
Equity shares of par value ` 2/- each
Basic (in `) 21.72 19.07
Diluted (in `) 21.61 18.94
Number of shares for calculating EPS
Basic 2,436,440,633 2,429,036,656
Diluted 2,449,297,479 2,445,450,341
Notes to accounts 18
The schedules referred to above form an integral part of the consolidated profit and loss account
Consolidated Profit and Loss Account
As per our report attached
for BSR & Co.,Chartered AccountantsFirm Registration number: 101248W
Natrajh RamakrishnaPartnerMembership No. 032815
BangaloreJune 17, 2011
For and on behalf of the Board of Directors
Azim Premji B. C. Prabhakar T. K. KurienChairman Director CEO, IT Business & Executive Director
Suresh C. Senapaty V. Ramachandran Chief Financial Officer Company Secretary & Director

Consolidated Financial Statements
134 Annual Report 2010-11
Consolidated Cash Flow Statement
(` in Million) Year ended March 31,
2011 2010 A. Cash flows from operating activities:
Profit before tax 62,348 55,095 Adjustments:Depreciation and amortisation 7,891 7,543 Amortisation of stock compensation 1,433 1,317 Exchange differences, net 822 (1,394)Impact of cash flow hedges 4,389 6,017 Interest on borrowings 776 1,232 Dividend / interest income (6,460) (4,052)Profit on sale of investments (192) (308)Gain on sale of fixed assets (131) (43)Working capital changes :Sundry debtors and unbilled revenues (17,816) (4,724)Loans and advances (5,234) (2,203)Inventories (1,781) (218)Current liabilities and provisions 3,685 650 Net cash generated from operations 49,730 58,912 Direct taxes (paid)/refund, net (9,293) (7,914)Net cash generated by operating activities 40,437 50,998
B. Cash flows from investing activities:Acquisition of fixed assets (including capital advances) (12,211) (11,029)Proceeds from sale of fixed assets 521 397 Advance/lease transactions - (1,950)Purchase of investments (474,476) (340,891)Proceeds from sale/maturity of investments 456,894 325,770 Investment in Intercorporate deposits (14,290) (10,750)Refund of Intercorporate deposits 20,100 4,950 Payment for acquisition of businesses, net of cash acquired (140) (4,051)Dividend/interest income received 6,363 3,739 Net cash used in investing activities (17,239) (33,815)
C. Cash flows from financing activities:Proceeds from exercise of employee stock options 36 7 Share application money pending allotment (11) 3 Interest paid on borrowings (696) (1,194)Dividends paid (including distribution tax) (15,585) (6,823)Repayment of borrowings/loans (83,798) (55,664)Proceeds from borrowings/loans 72,596 63,430 Proceeds from issuance of shares by subsidiary - 77 Net cash used in financing activities (27,458) (164)Net (decrease)/increase in cash and cash equivalents during the year (4,260) 17,019 Cash and cash equivalents at the beginning of the year 64,878 49,117 Effect of exchange rate changes on cash balance 523 (1,258)Cash and cash equivalents at the end of the year (Refer Schedule 9) 61,141 64,878
As per our report attached
for BSR & Co.,Chartered AccountantsFirm Registration number: 101248W
Natrajh RamakrishnaPartnerMembership No. 032815
BangaloreJune 17, 2011
For and on behalf of the Board of Directors
Azim Premji B. C. Prabhakar T. K. KurienChairman Director CEO, IT Business & Executive Director
Suresh C. Senapaty V. Ramachandran Chief Financial Officer Company Secretary & Director

Consolidated Financial Statements
Wipro Limited 135
Schedules to Consolidated Balance Sheet
(` in Million except share data)
As of March 31,
SCHEDULE 1 SHARE CAPITAL 2011 2010
Authorised capital
2,650,000,000 (2010: 1,650,000,000) equity shares of ` 2 each 5,300 3,300
25,000,000 (2010: 25,000,000) 10.25 % redeemable cumulative preference shares of `10
each
250 250
5,550 3,550
Issued, subscribed and paid-up capital [Refer note 18 (2)]
2,454,409,145 (2010: 1,468,211,189) equity shares of ` 2 each 4,908 2,936
Less: 968,803 (2010: 968,803) equity shares issued to controlled trust (2) (2)
4,906 2,934
SCHEDULE 2 RESERVES AND SURPLUS
Capital reserve
Balance brought forward from previous year 1,144 1,144
Addition during the year - -
1,144 1,144
Securities premium account
Balance brought forward from previous year 29,188 27,279
Add: Exercise of stock options by employees 2,895 1,909
32,083 29,188
Less: Shares issued to controlled trust [Refer note 18(2)] (540) (540)
Less: Issue of Bonus Shares (1,960) -
29,583 28,648
Translation reserve
Balance brought forward from previous year 218 1,233
Movement during the year 1,267 (1,015)
1,485 218
Restricted stock units reserve [Refer note 18(12)]
Employee stock options outstanding 3,791 4,366
Less: Deferred employee compensation expense 3,507 2,643
284 1,723
General reserve
Balance brought forward from previous year 152,712 118,813
Transferred from Profit and loss account [Refer note 18 (3) (ii)] 4,832 33,899
157,544 152,712
Hedging reserve [Refer note 18(5)]
Balance brought forward from previous year (4,954) (16,886)
Movement during the year 3,728 11,932
(1,226) (4,954)
Profit and Loss Account 31,150 -
Summary of reserves and surplus
Balance brought forward from previous year 179,491 133,356
Movement during the year 40,473 46,135
219,964 179,491

Consolidated Financial Statements
136 Annual Report 2010-11
Schedules to Consolidated Balance Sheet
(` in Million)
As of March 31,
2011 2010
SCHEDULE 3 SECURED LOANS
Term loans1 107 164
Cash credit1 1,325 1,243
Finance lease obligation2 472 712
1,904 2,119 1 Term loans and cash credit facility are secured by hypothecation of stock-in-trade, book debts,
immovable/movable properties and other assets.2 Secured by underlying assets.
SCHEDULE 4 UNSECURED LOANS
External commercial borrowings 18,861 16,844
Borrowing from banks 29,740 40,595
Others 2,297 2,955
50,898 60,394

Consolidated Financial Statements
Wipro Limited 137
Sc
he
du
les
to
Co
ns
oli
da
ted
Ba
lan
ce
Sh
ee
t
SC
HE
DU
LE
5
FIX
ED
AS
SE
TS
AN
D I
NT
AN
GIB
LE
AS
SE
TS
(` in
Mill
ion
)
PAR
TIC
ULA
RS
GR
OS
S B
LOC
K**
*A
CC
UM
ULA
TE
D D
EP
RE
CIA
TIO
N A
ND
AM
OR
TIS
AT
ION
NE
T B
LOC
K
As of A
pri
l 1,
2010
Additions
Effect of
Tran
slation*
Ded
uctions/
Ad
justmen
ts
As
of
Ma
rch
31
, 20
11
As of A
pri
l 1,
2010
Dep
reciation
and
amortisation
for the period
Effect of
Tran
slation*
Ded
uctions/
adjustmen
ts
As
of
Ma
rch
31
, 20
11
As
of
Ma
rch
31
, 20
11
As of M
arch
31, 201
0
(a)
Tan
gib
le fi
xed
ass
ets
Land
(in
cluding
l easeh
old)@
4,1
10
1,053
19
- 5
,18
2
115
42
1
- 1
58
5
,02
4
3,995
Build
ings
19,21
4 3,533
1
17
(41)
22
,82
3
2,0
15
489
50
(39)
2,5
15
2
0,3
08
17,
199
Plan
t & m
achinery
# 47,00
6 8,360
337
(1
,145
) 5
4,5
58
3
1,43
7 5,493
230
(1
,077
) 3
6,0
83
1
8,4
75
15,56
9
Fu
rniture, fixture
and
equipmen
ts 9,861
1,692
68
(591
) 1
1,0
30
5,543
1,253
45
(375
) 6
,46
6
4,5
64
4,3
18
Ve
hic
les
2,941
1
17
11
(458
) 2
,61
1
2,0
19
455
13
(354
) 2
,13
3
47
8
922
(b)
Inta
ng
ible
fixe
d a
sse
ts -
Te
chnical
know
-how
377
9
1 19
(3)
48
4
355
20
18
50
44
3
41
22
Brands,
paten
ts, trade marks
and
rights**
2,744
1
(1
09)
- 2
,63
6
830
139
(6
1) -
90
8
1,7
28
1,9
14
86
,25
3
14
,84
7
46
2
(2,2
38
) 9
9,3
24
4
2,3
14
7
,89
1
29
6
(1,7
95
) 4
8,7
06
5
0,6
18
4
3,9
39
Previous year
- 20
10
75,35
3 13,59
4 (1
,491
) (1
,203
) 8
6,2
53
36,34
2 7,543
(8
55)
(716
) 4
2,3
14
4
3,9
39
@ In
cludes
Gross
Blo
ck of `
1,426
million
(201
0: `
1,3
14 m
illion) and
Accumu
lated
amortisation
of `
158
million
(201
0: `
115
million) b
eing
leaseh
old
land.
* Rep
resents
translation
of fi
xed
assets of n
on-integra
l operations into
Indian
Rupee.
# P
lant &
machinery in
cludes
computers
and
computer software.
** Brands in
clude
` 34
8 million
related
to
Yard
ley acquisition
mad
e during
the year
ended
Mar
ch 3
1, 201
0.
*** Interest
cap
italized
was
` 66 million
and
` 95 million
for the year
ended
Mar
ch 3
1, 201
1 an
d 201
0 respective
ly.

Consolidated Financial Statements
138 Annual Report 2010-11
Schedules to Consolidated Balance Sheet
( ` in Million)
As of March 31,
2011 2010
SCHEDULE 6 INVESTMENTS
Long term - unquoted
Investment in associates [Refer note 18(6)]
Wipro GE Healthcare Private Limited 1 2,993 2,378
2,993 2,378
Current investments - quoted [Refer note 18(22)]
Investments in Indian money market mutual funds 25,200 19,147
Current investments - unquoted [Refer note 18(22)]
Certificates of deposit 11,966 11,088
Commercial Papers 7,416 -
Other investments [Refer note 18(22)] 4,831 1,447
49,413 31,682
52,406 34,060
Aggregate market value of quoted investments and mutual funds 25,246 19,156 1 Equity investments in this company carry certain restrictions on transfer of shares as provided for in
the shareholders’ agreements.
SCHEDULE 7 INVENTORIES
Finished goods 4,256 3,937
Raw materials 3,217 2,212
Stock in process 1,108 776
Stores and spares 1,126 1,001
9,707 7,926
SCHEDULE 8 SUNDRY DEBTORS
Unsecured
Debts outstanding for a period exceeding six months
Considered good 8,043 6,858
Considered doubtful 2,489 2,283
10,532 9,141
Other debts
Considered good 53,730 44,292
Considered doubtful 105 44
64,367 53,477
Less: Provision for doubtful debts 2,594 2,327
61,773 51,150
SCHEDULE 9 CASH AND BANK BALANCES
Balances with bank [Refer note 18(21)]
In current accounts* 26,674 23,608
In deposit accounts 33,514 40,723
Cash and cheques on hand 953 547
61,141 64,878
*Includes balance in unclaimed dividend account amounting to ` 20 million (2010: ` 17 million).

Consolidated Financial Statements
Wipro Limited 139
Schedules to Consolidated Balance Sheet
( ` in Million)
As of March 31,
2011 2010
SCHEDULE 10 LOANS AND ADVANCES
Unsecured, considered good unless otherwise stated
Advances recoverable in cash or in kind or for value to be received
Considered good
- Prepaid expenses 5,855 4,781
- Advance to suppliers 760 584
- Employee travel & other advances 1,500 1,524
- Others 3,646 3,103
11,761 9,992
Considered doubtful 568 297
12,329 10,289
Less: Provision for doubtful advances 568 297
11,761 9,992
Other deposits 2,283 1,780
Derivative assets 5,108 3,903
Finance lease receivables 7,250 4,442
Advance income taxes less provision for tax 14,644 10,383
Inter corporate deposits 4,240 10,050
Balances with excise and customs 1,570 917
Unbilled revenues 24,149 16,708
71,005 58,175
SCHEDULE 11 CURRENT LIABILITIES
Accrued expenses 19,950 19,615
Statutory liabilities 4,046 4,001
Sundry creditors 24,222 19,133
Unearned revenues 6,595 7,462
Advances from customers 1,025 1,786
Derivative liabilities 4,400 4,385
Unclaimed dividends 20 17
Others 762 943
61,020 57,342
SCHEDULE 12 PROVISIONS
Employee retirement benefits 2,633 2,967
Warranty 548 611
Provision for tax less advance tax 12,361 7,915
Proposed dividend 9,818 8,809
Tax on proposed dividend 1,593 1,283
Others 1,857 1,763
28,810 23,348

Consolidated Financial Statements
140 Annual Report 2010-11
Schedules to Consolidated Profit and Loss Account
(` in Million)
Year ended March 31,
2011 2010
SCHEDULE 13 OTHER INCOME, NET
Income from current investments
- Dividend on mutual fund units 2,402 1,442
- Profit on sale of investments, net 152 308
Interest on debt instruments and others 4,064 2,610
Exchange differences, net 445 (382)
Exchange fluctuations on foreign currency borrowings, net (1,156) (160)
Miscellaneous income 646 558
6,553 4,376
SCHEDULE 14 COST OF SALES AND SERVICES
Employee compensation 106,372 90,356
Raw materials, finished and process stocks consumed 48,261 45,698
Sub contracting / technical fees / third party application 26,121 22,193
Travel 7,563 5,830
Depreciation and amortisation 7,327 6,935
Repairs 4,272 3,844
Communication 3,035 2,779
Power and fuel 2,427 1,797
Rent 2,114 2,033
Stores and spares 801 709
Insurance 707 356
Rates and taxes 58 276
Miscellaneous expenses 2,885 2,843
211,943 185,649

Consolidated Financial Statements
Wipro Limited 141
Schedules to Consolidated Profit and Loss Account
( ` in Million)
Year ended March 31,
2011 2010
SCHEDULE 15 SELLING AND MARKETING EXPENSES
Employee compensation 10,964 9,130
Advertisement and sales promotion 5,337 4,831
Travel 1,145 858
Carriage and freight 1,359 1,083
Sales commission 1,121 885
Rent 383 466
Communication 457 378
Conveyance 189 144
Depreciation and amortisation 252 265
Repairs 136 109
Insurance 29 54
Rates and taxes 49 38
Miscellaneous expenses 1,336 906
22,757 19,147
SCHEDULE 16 GENERAL AND ADMINISTRATIVE EXPENSES
Employee compensation 9,874 7,759
Travel 1,259 1,232
Legal and professional charges 1,629 1,593
Repairs and mantainance 847 900
Provision for doubtful debts 267 566
Staff recruitment 1,228 485
Manpower outside services 360 232
Depreciation and amortisation 312 343
Rates and taxes 353 160
Insurance 141 148
Rent 733 563
Auditors’ remuneration 30 26
Miscellaneous expenses 2,081 1,375
19,114 15,382
SCHEDULE 17 INTEREST
Cash credit and others 776 1,232
776 1,232

Consolidated Financial Statements
142 Annual Report 2010-11
Index of Notes to Accounts Note Reference Page No.
Significant Accounting Policies .................................................................................................................................1 143-147
Equity Shares and Reserves ....................................................................................................................................2,3 147
Financial Instruments ...............................................................................................................................................4,5 147-148
Equity in Affiliate ............................................................................................................................................................6 148-149
Merger and Acquisition and Sale of Financial Assets ...................................................................................7,8 149
Leases ...........................................................................................................................................................................9,10 149-150
Employee Benefit Plans ............................................................................................................................................11 150-151
Employee Stock Options ..........................................................................................................................................12 151-152
Income Taxes ................................................................................................................................................................13 152
Tax Demands, Provisions and Earnings per Share ...............................................................................14,15,16 153
List of Subsidiaries ......................................................................................................................................................17 154-157
Related Party Relationships and Transactions ..................................................................................................18 157-158
Contingencies ..............................................................................................................................................................19 158
Segment Information ................................................................................................................................................20 158-160
Cash and Bank ..............................................................................................................................................................21 161
Investments ...................................................................................................................................................................22 161-162

Consolidated Financial Statements
Wipro Limited 143
SCHEDULE 18 – NOTES TO ACCOUNTS
Company overview
Wipro Limited (Wipro or the Parent), together with its subsidiaries
and associates (collectively, the Company or the group) is a
leading India based provider of IT Services, including Business
Process Outsourcing (BPO) services, globally. Further, Wipro
has other businesses such as IT Products, Consumer Care and
Lighting and Infrastructure engineering. Wipro is headquartered
in Bangalore, India.
1. Significant accounting policies
i. Basis of preparation of financial statements
The consolidated financial statements are prepared in accordance with Indian Generally Accepted Accounting Principles (GAAP) under the historical cost convention and on the accrual basis except for certain financial instruments, which are measured on a fair value basis. GAAP comprises Accounting Standards (AS), issued by the Institute of Chartered Accountants of India (ICAI) and other generally accepted accounting principles in India.
ii. Principles of consolidation
The consolidated financial statements include the financial statements of Wipro and all its subsidiaries, which are more than 50% owned or controlled.
The financial statements of the parent company and its majority owned / controlled subsidiaries have been combined on a line by line basis by adding together the book values of all items of assets, liabilities, incomes and expenses after eliminating all inter-company balances / transactions and resulting unrealized gain / loss.
The consolidated financial statements are prepared using uniform accounting policies for similar transactions and other events in similar circumstances.
iii. Use of estimates
The preparation of financial statements in accordance with the generally accepted accounting principles requires management to make judgments, estimates and assumptions that affect the application of accounting policies and the reported amounts of assets and liabilities, income and expenses. Estimates and underlying assumptions are reviewed on an ongoing basis. Revision to accounting estimate is recognised in the period in which the estimates are revised and in any future period affected.
iv. Fixed assets, intangible assets and capital work-in-progress
Fixed assets are stated at historical cost less accumulated depreciation. Costs include expenditure directly attributable to the acquisition of the asset. Borrowing costs directly attributable to the construction or production of qualifying assets are capitalized as part of the cost.
Intangible assets are stated at the consideration paid for acquisition less accumulated amortization.
Advances paid towards the acquisition of fixed assets outstanding as of each balance sheet date and the cost of fixed assets not ready for use before such date are disclosed under capital work-in-progress.
v. Investments
Long term investments (other than investment in associate) are stated at cost less other than temporary decline in the value of such investments, if any. Current investments are valued at lower of cost and fair value determined by category of investment. The fair value is determined using quoted market prices/market observable information adjusted for cost of disposal.
Investment in associate is accounted under the equity method.
vi. Inventories
Inventories are valued at lower of cost and net realizable value, including necessary provision for obsolescence. Cost is determined using the weighted average method. Cost of work-in-progress and finished goods include material cost and appropriate share of manufacturing overheads.
vii. Provisions and contingent liabilities
Provisions are recognised when the Company has a present obligation as a result of past event, it is probable that an outflow of resources will be required to settle the obligation, and a reliable estimate can be made of the amount of obligation.
A disclosure for a contingent liability is made when there is a possible obligation or a present obligation that may, but probably will not, require an outflow of resources. Where there is a possible obligation or a present obligation in respect of which the likelihood of outflow of resources is remote, no provision or disclosure is made.
The Company recognizes provision for onerous contracts based on the estimate of excess of unavoidable costs of meeting obligations under the contracts over the expected economic benefits.
viii. Revenue recognition
Services:
The Company recognizes revenue when the significant terms of the arrangement are enforceable, services have been delivered and the collectability is reasonably assured. The method for recognizing revenues and costs depends on the nature of the services rendered:
A. Time and materials contracts
Revenues and costs relating to time and materials
contracts are recognized as the related services are
rendered.
B. Fixed-price contracts
Revenues from fixed-price contracts, including

Consolidated Financial Statements
144 Annual Report 2010-11
systems development and integration contracts are
recognized using the “percentage-of-completion”
method. Percentage of completion is determined
based on project costs incurred to date as a percentage
of total estimated project costs required to complete
the project. When total cost estimates exceed
revenues in an arrangement, the estimated losses are
recognized in the statement of income in the period
in which such losses become probable based on the
current contract estimates.
‘Unbilled revenues’ included in loans and advances
represent cost and earnings in excess of billings as at
the balance sheet date. ‘Unearned revenues’ included
in current liabilities represent billing in excess of
revenue recognized.
C. Maintenance contract
Revenue from maintenance contracts is recognized
ratably over the period of the contract using the
percentage of completion method. When services are
performed through an indefinite number of repetitive
acts over a specified period of time, revenue is
recognized on a straight-line basis over the specified
period unless some other method better represents
the stage of completion.
Products:
Revenue from sale of products is recognised when the product has been delivered, in accordance with the sales contract. Revenues from product sales are shown as net of excise duty, sales tax separately charged and applicable discounts.
Other income:
Agency commission is accrued when shipment of consignment is dispatched by the principal.
Profit on sale of investments is recorded upon transfer of title by the Company. It is determined as the difference between the sales price and carrying amount of the related investment.
Interest is recognised using the time-proportion method, based on rates implicit in the transaction.
Dividend income is recognised where the Company’s right to receive dividend is established.
ix. Leases
Leases of assets, where the Company assumes substantially all the risks and rewards of ownership are classified as finance leases. Finance leases are capitalized at the lower of the fair value of the leased assets at inception and the present value of minimum lease payments. Lease payments are apportioned between the finance charge and the outstanding liability. The finance charge is allocated to periods during the lease term at a constant periodic rate of interest on the remaining balance of the liability.
Leases where the lessor retains substantially all the risks and rewards of ownership are classified as operating leases. Lease rentals in respect of assets taken under operating leases are charged to profit and loss account on a straight line basis over the lease term.
In certain arrangements, the Company recognizes revenue from the sale of products given under finance leases. The Company records gross finance receivables, unearned income and the estimated residual value of the leased equipment on consummation of such leases. Unearned income represents the excess of the gross finance lease receivable plus the estimated residual value over the sales price of the equipment. The Company recognises unearned income as financing revenue over the lease term using the effective interest method.
x. Foreign currency transactions
Transaction:
Foreign currency transactions are accounted in the books of accounts at the average rate for the month.
The difference between the rate at which foreign currency transactions are accounted and the rate at which they are realized is recognised in the profit and loss account.
Translation:
Monetary foreign currency assets and liabilities at period-end are translated at the closing rate. The difference arising from the translation is recognised in the profit and loss account, except for the exchange difference arising on monetary items that qualify as hedging instruments in a cash flow hedge or hedge of a net investment in a non-integral foreign operation. In such cases the exchange difference is initially recognised in hedging reserve or translation reserve, respectively. Such exchange differences are subsequently recognised in the profit and loss account on occurrence of the underlying hedged transaction or on disposal of the investment, respectively. Further, foreign currency differences arising from translation of inter company receivables or payables relating to foreign operations, the settlement of which is neither planned nor likely in the foreseeable future, are considered to form part of net investment in foreign operation and are recognised in Foreign Currency Translation Reserve (FCTR).
Integral operations:
Monetary assets and liabilities are translated at the exchange rate prevailing at the date of the balance sheet. Non-monetary items are translated at the historical rate. The items in the profit and loss account are translated at the average exchange rate during the period. The differences arising out of the translation are recognised in the profit and loss account.
Non-integral operations:
Assets and liabilities are translated at the exchange rate prevailing at the date of the balance sheet. The items in

Consolidated Financial Statements
Wipro Limited 145
the profit and loss account are translated at the average exchange rate during the period. The differences arising out of the translation are transferred to translation reserve.
xi. Financial Instruments
Financial instruments are recognised when the Company becomes a party to the contractual provisions of the instrument.
Derivative instruments and Hedge accounting:
The Company is exposed to foreign currency fluctuations
on foreign currency assets, liabilities, net investment in
non-integral foreign operations and forecasted cash flows
denominated in foreign currency. The Company limits the
effects of foreign exchange rate fluctuations by following
established risk management policies including the use of
derivatives. The Company enters into derivative financial
instruments, where the counterparty is a bank.
The Company early adopted Accounting Standard 30, Financial Instuments: Recognition and Measurement (AS 30) and the limited revisions to other accounting standards which come into effect upon adoption of AS 30 from April 1, 2008 except to the extent the provisions of AS 30 are in conflict with particular sections of other accounting standards; AS 4, Contingencies and Events Occurring after Balance sheet date, to the extent it deals with contingencies, AS 11(revised 2003), The Effects of Changes in Foreign Exchange Rates, to the extent it deals with the ‘forward exchange contracts’ and AS 13 Accounting for Investments, except to the extent it relates to accounting for investment properties.
Accordingly, the Company continues to comply with the guidance under these accounting standards; AS 4- relating to Contingencies, AS 11- relating to Forward Contracts and AS 13- relating to Investments.
In accordance with the recognition and measurement principles set out in AS 30, changes in fair value of derivative financial instruments designated as cash flow hedges are recognised directly in shareholders’ funds and reclassified into the profit and loss account upon the occurrence of the hedged transaction. The Company also designates derivative financial instruments as hedges of net investment in non-integral foreign operation. The portion of the changes in fair value of derivative financial instruments determined to be an effective hedge are recognised in the shareholders’ funds and would be recognised in the profit and loss account upon sale or disposal of related non-integral foreign operation. Changes in fair value relating to the ineffective portion of the hedges and derivatives not designated as hedges are recognised in the profit and loss account as they arise.
The fair value of derivative financial instruments is determined based on observable market inputs including currency spot and forward rates, yield curves, currency volatility etc.
Non-Derivative Financial Instruments
A financial instrument is any contract that gives rise to
a financial asset of one entity and a financial liability or
equity instrument of another entity. Financial assets of the
Company mainly include cash and bank balances, sundry
debtors, unbilled revenues, finance lease receivables,
employee travel and other advances, other loans and
advances and derivative financial instruments with a
positive fair value. Financial liabilities of the Company
mainly comprise secured and unsecured loans, sundry
creditors, accrued expenses and derivative financial
instruments with a negative fair value. Financial assets
are derecognised when substantial risks and rewards of
ownership of the financial asset have been transferred. In
cases where substantial risks and rewards of ownership of
the financial assets are neither transferred nor retained,
financial assets are derecognised only when the Company
has not retained control over the financial asset.
The Company measures the financial assets and liabilities,
except for derivative financial assets and liabilities at
amortized cost using the effective interest method.
The Company measures the short-term payables and
receivables with no stated rate of interest at original invoice
amount, if the effect of discounting is immaterial. Non-
interest-bearing deposits are discounted to their present
value.
xii. Depreciation and amortisation
Depreciation is provided on straight line method based on the estimated useful life of the asset. Management estimates the useful life of various assets as follows:
Nature of asset Life of asset
Building ................................................ 30 – 60 years
Plant and machinery ....................... 5 – 21 years
Office equipment ............................. 3 - 10 years
Vehicles ................................................ 4 years
Furniture and fixtures ..................... 3 - 10 years
Computer and software ................. 2 – 7 years
Fixed assets individually costing ` 5,000/- or less are depreciated at 100%.
Assets under capital lease are amortised over their estimated useful life or the lease term, whichever is lower. Intangible assets are amortized over their estimated useful life on a straight line basis. For various brands acquired by the Company, the estimated useful life has been determined ranging between 20 to 25 years. The Company believes this based on number of factors including the competitive environment, market share, brand history, product life cycles, operating plan, no restrictions on title and the macroeconomic environment of the countries in which the brands operate. Accordingly, such intangible assets are being amortised over the determined useful life. Payments for leasehold land are amortised over the period of lease.

Consolidated Financial Statements
146 Annual Report 2010-11
xiii. Impairment of assets
Financial assets:
The Company assesses at each balance sheet date whether there is any objective evidence that a financial asset or group of financial assets is impaired. If any such indication exists, the Company estimates the amount of impairment loss. The amount of loss for short-term receivables is measured as the difference between the assets carrying amount and undiscounted amount of future cash flows. Reduction, if any, is recognised in the profit and loss account. If at the balance sheet date there is any indication that a previously assessed impairment loss no longer exists, the recognised impairment loss is reversed, subject to maximum of initial carrying amount of the short-term receivable.
Other than financial assets:
The Company assesses at each balance sheet date whether there is any indication that a non-financial asset including goodwill may be impaired. If any such indication exists, the Company estimates the recoverable amount of the asset. If such recoverable amount of the asset or the recoverable amount of the cash generating unit to which the asset belongs to is less than its carrying amount, the carrying amount is reduced to its recoverable amount. The reduction is treated as an impairment loss and is recognised in the profit and loss account. If at the balance sheet date there is an indication that a previously assessed impairment loss no longer exists, the recoverable amount is reassessed and the asset is reflected at the recoverable amount subject to a maximum of depreciated historical cost. In respect of goodwill, the impairment loss will be reversed only when it was caused by specific external events of an exceptional nature that is not expected to recur and their effects have been reversed by subsequent external events.
xiv. Employee benefits
Provident fund:
Employees receive benefits from a provident fund. The employee and employer each make monthly contributions to the plan equal to 12% of the covered employee's salary. A portion of the contribution is made to the provident fund trust managed by the Company, while the remainder of the contribution is made to the Government's provident fund.
Compensated absences:
The employees of the Company are entitled to compensated absence. The employees can carry-forward a portion of the unutilized accrued compensated absence and utilize it in future periods or receive cash compensation at retirement or termination of employment for the unutilized accrued compensated absence. The Company records an obligation for compensated absences in the period in which the employee renders the services that increase this entitlement. The Company measures the expected cost of compensated absence as the additional amount
that the Company expects to pay as a result of the unused entitlement that has accumulated at the balance sheet date. Long term compensated absences is accrued based on actuarial valuation at the balance sheet date carried out by an independent actuary.
Gratuity:
In accordance with the Payment of Gratuity Act, 1972, the Company provides for a lump sum payment to eligible employees, at retirement or termination of employment based on the last drawn salary and years of employment with the Company. The gratuity fund is managed by the Life Insurance Corporation of India (LIC), HDFC Standard Life, TATA AIG and Birla Sun-life. The Company’s obligation in respect of the gratuity plan, which is a defined benefit plan, is provided for based on actuarial valuation carried out by an independent actuary using the projected unit credit method. The Company recognizes actuarial gains and losses immediately in the profit and loss account.
Superannuation:
The employees of the Company also participate in a defined contribution plan maintained by the Company. This plan is administered by the LIC and ICICI Prudential Insurance Company Limited. The Company makes annual contributions based on a specified percentage of each covered employee's salary.
xv. Employee stock options
The Company determines the compensation cost based on the intrinsic value method. The compensation cost is amortised on a straight line basis over the vesting period.
xvi. Taxes
Income tax:
The current charge for income taxes is calculated in accordance with the relevant tax regulations.
Deferred tax:
Deferred tax assets and liabilities are recognised for the future tax consequences attributable to timing differences that result between the profit offered for income taxes and the profit as per the financial statements of each entity in the Group.
Deferred taxes are recognised in respect of timing differences which originate during the tax holiday period but reverse after the tax holiday period. For this purpose, reversal of timing difference is determined using first in first out method.
Deferred tax assets and liabilities are measured using the tax rates and tax laws that have been enacted or substantively enacted by the balance sheet date. The effect on deferred tax assets and liabilities of a change in tax rates is recognised in the period that includes the enactment/substantive enactment date.

Consolidated Financial Statements
Wipro Limited 147
Deferred tax assets on timing differences are recognised only if there is a reasonable certainty that sufficient future taxable income will be available against which such deferred tax assets can be realized. However, deferred tax assets on the timing differences when unabsorbed depreciation and losses carried forward exist, are recognised only to the extent that there is virtual certainty that sufficient future taxable income will be available against which such deferred tax assets can be realized.
Deferred tax assets are reassessed for the appropriateness of their respective carrying amounts at each balance sheet date.
The Company offsets, on a year on year basis, the current tax assets and liabilities, where it has a legally enforceable right and where it intends to settle such assets and liabilities on a net basis.
xvii. Earnings per share
Basic:
The number of equity shares used in computing basic earnings per share is the weighted average number of shares outstanding during the period excluding equity shares held by controlled trust.
Diluted:
The number of equity shares used in computing diluted earnings per share comprises the weighted average equity shares considered for deriving basic earnings per share, and also the weighted average number of equity shares that could have been issued on the conversion of all dilutive potential equity shares.
Dilutive potential equity shares are deemed converted as of the beginning of the period, unless issued at a later date. The number of equity shares and potentially dilutive equity shares are adjusted for any stock splits and bonus shares issued.
xviii. Cash flow statement
Cash flows are reported using the indirect method, whereby net profits before tax is adjusted for the effects of transactions of a non-cash nature and any deferrals or accruals of past or future cash receipts or payments. The cash flows from regular revenue generating, investing and financing activities of the Company are segregated.
2. Share capital
The following are the details for 2,454,409,145 (2010: 1,468,211,189) equity shares as of March 31, 2011.
No. of shares Description
2,379,120,783
Equity shares / American Depository Receipts
(ADRs) (2010:1,399,355,659) have been
allotted as fully paid bonus shares / ADRs by
capitalization of Securities premium account
and Capital redemption reserve
No. of shares Description
1,325,525
Equity shares (2010: 1,325,525) have been
allotted as fully paid-up, pursuant to scheme
of amalgamation, without payment being
received in cash.
968,803
Equity shares ( 2010: 968,803) allotted to the
Wipro Inc Benefit Trust, the sole beneficiary of
which is Wipro Inc, wholly owned subsidiary of
the Company, without payment being received
in cash, in consideration of acquisition of inter-
company investments.
3,162,500
Equity shares (2010: 3,162,500) representing
American Depository Receipts issued during
2000-2001 pursuant to American Depository
offering by the Company
69,831,534
Equity shares (2010: 63,398,702) issued
pursuant to Employee Stock Option Plan
3. Note on reserves
i) Restricted stock units reserve includes Deferred
Employee Compensation, which represents future
charge to the profit and loss account and employee
stock options outstanding to be treated as securities
premium at the time of allotment of shares.
ii) Additions to General Reserve include:
(` in Million)
Particulars
For the year ended
March 31,
2011 2010
Transfer from Profit and loss account 4,844 36,218
Adjustment on account of merger
[refer note 18(7)(i)] (64) -
Additional purchase consideration
[refer note 18(7)(ii)] (54) (2,385)
Excess provision for Dividend/Dividend
Distribution Tax written back 19 -
Dividend paid to Wipro Equity Reward
Trust and Wipro Inc Trust 74 67
Others 13 (1)
4,832 33,899
4. The Company has adopted AS 30 and the limited revisions to other accounting standards except to the extent the provisions of AS 30 are in conflict with particular sections of other accounting standards; AS 4, Contingencies and Events Occurring after Balance sheet Date, to the extent it deals with contingencies, AS 11 (revised 2003), The Effects of Changes in Foreign Exchange Rates, to the extent it deals with the ‘forward exchange contracts’ and AS 13, Accounting for Investments, except to the extent it relates to accounting for investment properties.
Accordingly, the Company continues to comply with the guidance under these accounting standards; AS 4 – relating

Consolidated Financial Statements
148 Annual Report 2010-11
to Contingencies, AS 11 – relating to Forward Contracts and AS 13 – relating to Investments until AS 30 becomes mandatory.
i) As permitted by AS 30 and the consequent limited
revisions to other accounting standards, the Company
has designated a yen-denominated foreign currency
borrowing amounting to JPY 16.5 billion (2010: JPY
18 billion) along with a floating for floating Cross-
Currency Interest Rate Swap (CCIRS), as a hedging
instrument to hedge its net investment in a non-
integral foreign operation. In addition, the Company
has also designated yen-denominated foreign
currency borrowing amounting to JPY 8 billion (2010:
JPY 8 billion) along with floating for fixed CCIRS as
cash flow hedge of the yen- denominated borrowing
and also as a hedge of net investment in non-integral
foreign operation.
ii) Accordingly, the translation gain/ (loss) on the
foreign currency borrowings and portion of
the changes in fair value of CCIRS which are
determined to be effective hedge of net investment
in non-integral operation and cash flow hedge
of yen-denominated borrowings aggregating to
` 447 million for the year ended March 31, 2011 (2010:
` 1,736 million) was recognised in translation reserve
/ hedging reserve in shareholders’ funds. The amount
of gain/ (loss) of ` 142 million for the year ended
March 31, 2011 (2010: ` 1,564 million) recognised in
translation reserve would be transferred to profit and
loss account upon sale or disposal of the non-integral
foreign operation and the amount of gain / (loss) of
` 305 million for year ended March 31, 2011 (2010: `
172 million) recognised in the hedging reserve would
be transferred to profit and loss upon occurrence of
the hedged transaction.
iii) In accordance with AS 11, if the Company had
continued to recognize translation (losses)/ gains
on foreign currency borrowing in the profit and loss
account, the foreign currency borrowing would not
have been eligible to be combined with CCIRS for
hedge accounting. Consequently, the CCIRS also
would not have qualified for hedge accounting
and changes in fair value of CCIRS would have to
be recognised in the profit and loss account. As a
result profit after tax would have been higher by `
447 million for the year ended March 31, 2011 (2010:
` 1,736 million).
5. Derivatives
As of March 31, 2011, the Company has recognised losses of ` 1,226 million (2010: ̀ 4,954 million) relating to derivative financial instruments (comprising of foreign currency forward contract, option contracts and floating to fixed CCIRS) that are designated as effective cash flow hedges in the shareholders’ funds.
In addition to the derivative instruments discussed above in Note 4, the Company has also designated certain foreign currency forward contracts to hedge its net investment in non-integral foreign operations. The Company has recognized gain/ (loss) of ` (122) million for the year ended March 31, 2011 (2010: ` 2,642 million) relating to the derivative financial instruments in translation reserve in the shareholders’ funds.
The following table presents the aggregate contracted principal amounts of the Company’s derivative contracts outstanding as at:
(In Million)
Particulars As at March 31
2011 2010
Designated cash flow hedging
derivative instruments
Sell $901 $1,518
£21 £31
¥3,026 ¥4,578
AUD 4 AUD 7
CHF 6 -
€2 -
Net investment hedges in foreign
operations
Cross currency swaps ¥ 24,511 ¥ 26,014
Others $262 $262
€40 €40
Non designated derivative
instruments
Sell $526 $45
£40 £38
€48 €29
AUD 13 -
Buy $617 $492
Cross currency swaps ¥7,000 ¥7,000
6. The Company has a 49% equity interest in Wipro GE
Healthcare Private Limited (Wipro GE), an entity in which
General Electric, USA holds the majority equity interest.
The shareholders agreement provides specific rights to the
two shareholders. Management believes that these specific
rights do not confer joint control as defined in Accounting
Standard 27 “Financial Reporting of Interests in Joint
Ventures”. Consequently, Wipro GE is not considered as a
joint venture and consolidation of financial statements is
carried out as per the equity method in terms of Accounting
Standard 23 “Accounting for Investments in Associates in
Consolidated interim financial statements”.
Wipro GE had received tax demands from the Indian income tax authorities for the financial years ended March 31, 2001, 2002, 2003 and 2004 aggregating to ` 903 million,

Consolidated Financial Statements
Wipro Limited 149
including interest. The tax demands were primarily on account of transfer pricing adjustments and the denial of export benefits and tax holiday benefits claimed by Wipro GE under the Indian Income Tax Act, 1961 (the “Act”). Wipro GE appealed against the said demands before the first appellate authority. The first appellate authority has vacated the tax demands for the years ended March 31, 2001, 2002, 2003 and 2004. The income tax authorities have filed an appeal for the years ended March 31, 2001, 2002, 2003 and 2004. In December 2008, Wipro GE received, on similar grounds, additional tax demand of ` 552 million (including interest) for the financial year ended March 31, 2005. Wipro GE had filed an appeal against the said demand and in the month of February 2011, the appellate order has been received, setting aside the entire TP adjustment and reducing the overall demand of ̀ 552 million (including interest) to ̀ 220 million (including interest). Wipro GE would be seeking further relief in this regard.
In December 2009, Wipro GE received a draft assessment order, on similar grounds, with a demand of ` 317 million (including interest) for the financial year ended March 31, 2006. The final assessment order was issued in this regard demanding the same amount, plus interest and Wipro GE has filed an appeal against the said demand before the Income Tax Appellate Tribunal within the time limit permitted under the statute.
In February 2011, Wipro GE received an assessment order, on similar grounds, with a demand of ` 843 million (including interest) for the financial year ended March 31, 2007. In this regard, Wipro GE has filed an appeal with the first appellate authority against the said demand within the time limit permitted under the statute
Considering the facts and nature of disallowance and the order of the appellate authority upholding the claims of Wipro GE, Wipro GE believes that the final outcome of the disputes should be in favour of Wipro GE and will not have any material adverse effect on its financial position and results of operations.
7. Merger and Acquisition
(i) Pursuant to the scheme of amalgamation approved by
the Honourable High Courts of Karnataka and Bombay,
Wipro Yardley Consumer Care Private Limited has
been merged with the Company with retrospective
effect from April 1, 2010, the Appointed date. The
amalgamation has been accounted as ‘amalgamation
in the nature of merger’ in accordance with the terms
of the Order. The excess of purchase consideration
over the net assets of the undertaking amounting to ̀ 0.08 Million has been adjusted against capital reserve
in the standalone financial statements of Wipro
Limited. Accordingly, in the consolidated financial
statements, the goodwill arising on consolidation
of the amalgamated company amounting to ` 64
million has been adjusted against general reserves,
consequent to the merger.
(ii) During the year ended March 31, 2011, the
Company determined that ̀ 54 Million, of additional
consideration is payable for certain entities acquired
during the year ended March 31, 2007 and merged
with other entities of Wipro Group subsequently.
Pursuant to the merger of acquired entities, this
additional consideration has been adjusted through
reserves during the year ended March 31, 2011
consistent with the previous accounting for merger.
(iii) The Company has merged its fully owned subsidiary
Infocrossing LLC into Infocrossing Inc with effect from
December 31, 2010.
8. Sale of financial assets
From time to time, in the normal course of business, the Company transfers accounts receivables, net investment in finance lease receivables and employee advances (financials assets) to banks. Under the terms of the arrangements, the Company surrenders control over the financial assets and transfer is without recourse. Accordingly, such transfers are recorded as sale of financial assets. Gains and losses on sale of financial assets without recourse are recorded at the time of sale based on the carrying value of the financial assets and fair value of servicing liability.
In certain cases, transfer of financial assets may be with recourse. Under arrangements with recourse, the Company is obligated to repurchase the uncollected financial assets, subject to limits specified in the agreement with the banks. Accordingly, in such cases the amounts received are recorded as borrowings in the statement of financial position and cash flows from financing activities. As at March 31, 2010 and 2011, the maximum amount of recourse obligation in respect of the transferred financial assets (recorded as borrowings) are ` 657 million and ` 1,085 million respectively.
9. Finance lease receivables
The Company provides lease financing for the traded and manufactured products primarily through finance leases. The finance lease portfolio contains only the normal collection risk with no important uncertainties with respect to future costs. These receivables are generally due in monthly, quarterly or semi-annual installments over periods ranging from 3 to 5 years.
The components of finance lease receivables are as follows:
(` in Million)
Particulars As of March 31,
2011 2010
Gross investment in lease 8,851 5,616
Not later than one year 2,522 774
Later than one year and not later than five years 6,129 4,652
Unguaranteed residual values 200 190
Unearned finance income (1,601) (1,174)
Net investment in finance receivables 7,250 4,442

Consolidated Financial Statements
150 Annual Report 2010-11
Present value of minimum lease receivables are as follows:
(` in Million)
Particulars As of March 31,
2011 2010
Present value of minimum lease
payments receivables 7,250 4,442
Not later than one year 2,350 608
Later than one year and not later than five years 4,723 3,675
Unguaranteed residual value 177 159
10. Assets taken on lease
Finance leases:
The following is a schedule of present value of future minimum lease payments under capital leases, together with the value of the minimum lease payments as of March 31, 2011
(` in Million)
Particulars As of March 31,
2011 2010
Present value of minimum lease
payments
Not later than one year 203 228
Later than one year and not later than five years 372 425
Thereafter 60 59
Total present value of minimum lease
payments 635 712
Add: Amount representing interest 66 68
Total value of minimum lease
payments 701 780
Operating leases:
The Company leases office and residential facilities under cancelable and non-cancelable operating lease agreements that are renewable on a periodic basis at the option of both the lessor and the lessee. Rental payments under such leases are ` 3,230 million and ` 3,062 million during the years ended March 31, 2011 and 2010 respectively.
Details of contractual payments under non-cancelable leases are given below:
(` in Million)
Particulars As of March 31,
2011 2010
Not later than one year 1,828 1,396
Later than one year and not later than
five years 5,143 4,319
Thereafter 3,294 2,554
Total 10,265 8,269
11. Employee Benefit Plan
Gratuity: In accordance with applicable Indian laws, the Company provides for gratuity,a defined benefit retirement plan (Gratuity Plan) covering certain categories of employees. The Gratuity Plan provides a lump sum payment to vested employees, at retirement or termination of employment, an amount based on the respective employee’s last drawn salary and the years of employment with the Company. The Company provides the gratuity benefit through annual contributions to a fund managed by the Life Insurance Corporation of India (LIC), HDFC Standard Life, TATA AIG and Birla Sunlife (‘Insurer’). Under this plan, the settlement obligation remains with the Company, although the Insurer administers the plan and determines the contribution premium required to be paid by the Company.
(` in Million)
Change in the benefit obligation As of March 31,
2011 2010
Projected Benefit Obligation (PBO) at
the beginning of the year 2,060 1,858
Acquisitions - -
Service Cost 640 328
Interest Cost 161 133
Benefits paid (230) (214)
Actuarial loss/(gain) (155) (45)
PBO at the end of the year 2,476 2,060
(` in Million)
Change in plan assets As of March 31,
2011 2010
Fair value of plan assets at the
beginning of the year 1,967 1,416
Acquisitions - -
Expected return on plan assets 164 122
Employer contribution 473 625
Benefits paid (230) (214)
Actuarial (loss)/gain 13 18
Fair value of the plan assets at the end
of the year 2,387 1,967
Present value of unfunded obligation/
Recognised Liability (89) (93)
The Company has invested the plan assets with the insurer managed funds. The expected return on plan assets is based on expectation of the average long term rate of return expected on investments of the fund during the estimated term of the obligations. Expected contribution to the fund during the year ending March 31, 2012 is ̀ 379 million.

Consolidated Financial Statements
Wipro Limited 151
Net gratuity cost for the year ended March 31, 2011 and 2010 are as follows:
(` in Million)
Particulars For the year ended
March 31,
2011 2010
Service cost 640 328
Interest cost 161 133
Expected return on plan assets (164) (122)
Actuarial loss/(gain) (168) (63)
Net gratuity cost 469 276
The weighted average actuarial assumptions used to determine benefit obligations and net periodic gratuity cost are:
Assumptions As of March 31,
2011 2010
Discount rate 7.95% 7.15%
Rate of Increase in compensation
levels 5% 5%
Rate of return on plan assets 8% 8%
As at March 31, 2011 and 2010, 100% of the plan assets were invested in the insurer managed funds.
(` in Million)
Particulars As of March 31,
2011 2010 2009
Experience Adjustments:
On Plan Liabilities (32) 84 (53)
On Plan Assets 15 18 26
Present value of benefit
obligation 2,476 2,060 1,858
Fair value of plan assets 2,387 1,967 1,416
Excess of (obligations over
plan assets)/plan assets
over obligations (89) (93) (442)
The Company assesses these assumptions with its projected long-term plans of growth and prevalent industry standards. The estimates of future salary increase, considered in actuarial valuation, take account of inflation, seniority, promotion and other relevant factors such as supply and demand factors in the employment market.
Superannuation: Apart from being covered under the gratuity plan, the employees of the Company also
participate in a defined contribution plan maintained by
the Company. This plan is administered by the LIC & ICICI.
The Company makes annual contributions based on a
specified percentage of each covered employee’s salary. For
the year ended March 31, 2011, the Company contributed ̀
631 million to superannuation fund (2010: ` 726 million).
Provident Fund (PF): In addition to the above, all
employees receive benefits from a provident fund. The
employee and employer each make monthly contributions
to the plan equal to 12% of the covered employee’s salary.
A portion of the contribution is made to the provident fund
trust established by the Company, while the remainder of
the contribution is made to the Government’s provident
fund.
The interest rate payable by the trust to the beneficiaries is regulated by the statutory authorities. The Company has an obligation to make good the shortfall, if any, between the returns from its investments and the administered rate.
The Guidance on implementing AS 15, Employee Benefits issued by the Accounting Standards Board (ASB) provides that exempt provident funds which require employers to meet the interest shortfall are in effect defined benefit plans. The Company believes that it is not practicable to reliably determine the interest shortfall obligation. Accordingly, the computation of liability and disclosure in accordance with the provisions of AS 15 cannot be implemented.
For the year ended March 31, 2011, the Company contributed ` 2,276 million to PF (2010: ` 1,732 million).
12. Employee stock option
i) Employees covered under Stock Option Plans and
Restricted Stock Unit (RSU) Option Plans are granted
an option to purchase shares of the Company at the
respective exercise prices, subject to requirements
of vesting conditions. These options generally vest
in tranches over a period of five years from the date
of grant. Upon vesting, the employees can acquire
one equity share for every option. The maximum
contractual term for aforementioned stock option
plans is generally 10 years.
ii) The stock compensation cost is computed under the
intrinsic value method and amortised on a straight
line basis over the total vesting period of five years.
For the year ended March 31, 2011, the Company
has recorded stock compensation expense of
` 1,431million (2010: ` 1,317 million).
iii) The compensation committee of the board evaluates
the performance and other criteria of employees
and approves the grant of options. These options
vest with employees over a specified period subject
to fulfillment of certain conditions. Upon vesting,
employees are eligible to apply and secure allotment
of Company’s shares at a price determined on the
date of grant of options. The particulars of options
granted under various plans are tabulated below. (The
numbers of shares in the table below are adjusted for
any stock splits and bonus shares issues).

Consolidated Financial Statements
152 Annual Report 2010-11
Activity under Stock Options plans
Particulars Year Ended March
31, 2011
Year Ended March
31, 2010
Shares Wt.
average
exercise
price
Shares Wt.
average
exercise
price
Outstanding at the
beginning of the
year
201,606* 293.4 122,746 484
Granted - - - -
Exercised 80,000 293.4 - -
Forfeited and lapsed 121,606 293.4 1,140 254
Outstanding at the
end of the year
- - 121,606 485
Exercisable at the
end of the year
- - 1,606 223
Activity under Restricted Stock Unit Option plans
Particulars Year Ended March 31,
2011
Year Ended March
31, 2010
Shares Wt.
average
exercise
price
Shares Wt.
average
exercise
price
Outstanding at
the beginning
of the year
20,046,267* 2 16,270,226 2
Granted 6,664,930 2 142,100 2
Exercised 6,352,832 2 3,230,443 2
Forfeited and
lapsed
1,751,712 2 1,154,123 2
Outstanding at
the end of the
year
18,606,653 2 12,027,760 2
Exercisable at
the end of the
year
8,681,374 2 5,365,080 2
The following table provides details in respect of range of exercise price and weighted average remaining contractual life (in months) for the options outstanding as at period end:
Range of
exercise
price
Year Ended March 31,
2011
Year Ended March 31,
2010
Shares Wt.
average
remaining
life
Shares Wt.
average
remaining
life
` 2 18,606,653 36.89 12,027,760 37.98
` 489 - - 120,000 49
$ 3.46 – 5.01 - - 1,606 1
*Includes units on account of bonus issue.
13. Income tax
The provision for taxation includes tax liability in India on the company’s worldwide income. The tax has been computed on the worldwide income as reduced by the various deductions and exemptions provided by the Income tax act in India (Act) and the tax credit in India for the tax liabilities payable in foreign countries.
Most of the company’s operations are through units in Software Technology Parks (‘STPs’) and Special Economic Zones(SEZ’s). Income from STPs is eligible for 100% deduction upto March 31, 2011. The Company also has operations in Special Economic Zones (SEZ’s). Income from SEZ’s are eligible for 100% deduction for the first 5 years, 50% deduction for the next 5 years and 50% deduction for another 5 years subject to fulfilling certain conditions.
Pursuant to the amendments in the Act, the company has calculated its tax liability after considering the provisions of law relating to Minimum Alternate Tax (MAT). As per the Act, any excess of MAT paid over the normal tax payable can be carried forward and set off against the future tax liabilities. Accordingly an amount of ` 488 million (2010: ` 363 million) is included under ‘Loans and Advances’ in the balance sheet as of March 31, 2011.
(i) Provision for tax has been allocated as follows:
(` in Million)
Particulars Year Ended
March 31,
2011 2010
Net current tax * 9,469 8,665
Deferred tax 226 498
Total income taxes 9,695 9,163
* Current tax provision includes reversal / (charge) of tax
provision in respect of earlier periods no longer required
amounting to ` 590 million for the year ended March 31, 2011
(2010: ` 476 million).
(ii) The components of the net deferred tax asset are as follows:
(` in Million)
Particulars As of March 31,
2011 2010
Fixed assets and intangibles –
depreciation (1318) (747)
Accrued expenses and liabilities 520 482
Provision for doubtful debts 716 268
Amortisable goodwill (141) (177)
Carry – forward business losses 90 399
Others 171 29
Net deferred tax assets 38 254
Deferred tax asset on carry forward business losses is recognised to the extent of deferred tax liabilities, that are virtually certain of realization in accordance with AS 22 – Accounting for Taxes on Income.

Consolidated Financial Statements
Wipro Limited 153
14. The Company had received tax demands from the Indian income tax authorities for the financial years ended March 31, 2001, 2002, 2003 and 2004 aggregating to ` 11,127 million (including interest of ` 1,503 million). The tax demand was primarily on account of denial of deduction claimed by the Company under Section 10A of the Income Tax Act 1961, in respect of profits earned by its undertakings in Software Technology Park at Bangalore. The appeals filed by the Company for the above years to the first appellate authority were allowed in favour of the Company, thus deleting substantial portion of the demand raised by the Income tax authorities. On further appeal filed by the income tax authorities, the second appellate authority upheld the claim of the Company for the years ended March 31, 2001, 2002, 2003 and 2004. In December 2008, the Company received, on similar grounds, an additional tax demand of ` 5,388 million (including interest of ` 1,615 million) for the financial year ended March 31, 2005.
The appeal filed before the first appellate authority against the said order has been allowed in favour of the Company thus deleting substantial demand raised by the Income tax authorities.
During December 2009, the Company received the draft assessment order, on similar grounds, with a demand of ` 6,757 million (including interest of ̀ 2,050 million) for the financial year ended March 31, 2006. The Company had filed its objections against the said demand before the Dispute Resolution Panel which later issued directions confirming the position of the assessing officer. Subsequently, the assessing officer passed the final assessment order in October 2010 raising a tax demand of ` 7,218 million (including interest of ` 2,510 million). The Company has filed an appeal against the said order before the tribunal within the time limit permitted under the statute.
During December 2010, the Company received the draft assessment order, on similar grounds, with a demand of ` 7,747 million (including interest of ` 2,307 million) for the financial year ended March 31, 2007. The Company has filed an objection against the said demand before the Dispute Resolution Panel and the Assessing officer within the time limits permitted under the statute.
Considering the facts and nature of disallowance and the order of the first appellate authority upholding Company’s claims for earlier years, the Company expects the final outcome of the above disputes in its favour of the Company and there should not be any material impact on the financial statements.
The Company is subject to legal proceedings and claims which have arisen in the ordinary course of its business. The resolution of these legal proceedings is not likely to have a material and adverse effect on the results of operations or the financial position of the Company.
15. Provisions
Provision for warranty represents cost associated with providing sales support services which are accrued at the time of recognition of revenues and are expected to be utilized over a period of 1 to 2 year. Other provisions primarily include provisions for tax related contingencies and litigations. The timing of cash outflows in respect of such provision cannot be reasonably determined. The activity in provision balance is summarized below:
(` in Million)
Particulars For the year ended
March 31, 2011
For the year ended
March 31, 2010
Provision
for
Warranty
Others Provision
for
Warranty
Others
Provision at the
beginning of the
year
611 1,763 768 1,387
Additions during
the year
532 149 477 394
Utilised during the
year
(595) (55) (634) (18)
Provision at the
end of the year
548 1,857 611 1,763
16. The computation of equity shares used in calculating basic and diluted earnings per share is set out below:
Particulars For the year ended
March 31,
2011 2010
Weighted average equity
shares outstanding
2,451,354,673 2,443,920,928
Shares held by a controlled
trust
(14,914,040) (14,884,272)
Weighted average equity shares
for computing basic EPS
2,436,440,633 2,429,036,656
Dilutive impact of employee
stock options
12,856,846 16,413,685
Weighted average equity shares
for computing diluted EPS
2,449,297,479 2,445,450,341
Net Income considered for
computing diluted EPS (` in
Million)
52,924 46,310
Earnings per share and number of shares outstanding for the
year ended March 31, 2010, has been adjusted for two equity
shares for every three equity shares bonus issue approved by
the shareholders on June 4, 2010.

Consolidated Financial Statements
154 Annual Report 2010-11
17. The list of subsidiaries as of March 31, 2011 is as follows:
Direct Subsidiaries Step Subsidiaries Country of
Incorporation
Wipro Inc. U.S.
Wipro Gallagher Solutions Inc U.S.
Enthink Inc. U.S.
Infocrossing Inc. U.S.
cMango Pte Limited Singapore
Wipro Japan KK Japan
Wipro Shanghai Limited China
Wipro Trademarks Holding Limited India
Cygnus Negri Investments Private
Limited
India
Wipro Travel Services Limited India
Wipro Consumer Care Limited India
Wipro Holdings (Mauritius) Limited Mauritius
Wipro Holdings UK Limited U.K.
Wipro Technologies UK Limited U.K.
Wipro Holding Austria GmbH(A) Austria
3D Networks (UK) Limited U.K.
Wipro Cyprus Private Limited Cyprus
Wipro Technologies S.A DE C. V Mexico
Wipro BPO Philippines LTD. Inc Philippines
Wipro Holdings Hungary Korlátolt
Felelősségű Társaság
Hungary
Wipro Technologies Argentina SA Argentina
Wipro Information Technology Egypt
SAE
Egypt
Wipro Arabia Limited* Saudi Arabia
Wipro Poland Sp Zoo Poland
Wipro Outsourcing Services UK
Limited
U.K.
Wipro Technologies (South Africa)
Proprietary Limited
South Africa
Wipro Information Technology
Netherlands BV
(formerly RetailBox BV)
Netherland
Wipro Portugal S.A.(A) (Formerly
Enabler Informatica SA)
Portugal
Wipro Technologies Limited,
Russia
Russia
Wipro Technologies Oy Finland

Consolidated Financial Statements
Wipro Limited 155
Direct Subsidiaries Step Subsidiaries Country of
Incorporation
Wipro Infrastructure Engineering AB Sweden
Wipro Infrastructure Engineering
Oy
Finland
Hydrauto Celka San ve Tic Turkey
Wipro Technologies SRL Romania
Wipro Singapore Pte Limited Singapore
PT WT Indonesia Indonesia
Wipro Unza Holdings Limited (A) Singapore
Wipro Technocentre (Singapore)
Pte Limited
Singapore
Wipro (Thailand) Co Limited Thailand
Wipro Bahrain Limited WLL Bahrain
Wipro Yardley FZE Dubai
Wipro Australia Pty Limited Australia
Wipro Networks Pte Limited
(formerly 3D Networks Pte Limited)
Singapore
Planet PSG Pte Limited Singapore
Planet PSG SDN BHD Malaysia
Wipro Chengdu Limited China
Wipro Chandrika Limited* India
WMNETSERV Limited Cyprus
WMNETSERV (U.K.) Limited. U.K.
WMNETSERV INC U.S.
Wipro Technology Services Limited India
Wipro Airport IT Services Limited* India
Wipro Infrastructure Engineering
Machinery (Changzhou) Co., Ltd.
China
*All the above direct subsidiaries are 100% held by the Company except that the Company hold 66.67% of the equity securities of
Wipro Arabia Limited, 90% of the equity securities of Wipro Chandrika Limited and 74% of the equity securities of Wipro Airport
IT Services Limited.
As of March 31, 2011, the Company also held 49% of the equity securities of Wipro GE Medical Systems Private Limited that is
accounted for as an equity method investment.

Consolidated Financial Statements
156 Annual Report 2010-11
(A) Step Subsidiary details of Wipro Unza Holdings Limited, Wipro Holding Austria GmbH and Wipro Portugal S.A, are as follows :
Step Subsidiaries Step Subsidiaries Country of
Incorporation
Wipro Unza Singapore Pte Limited Singapore
Wipro Unza Indochina Pte Limited Singapore
Wipro Unza Vietnam Co., Limited Vietnam
Wipro Unza Cathay Limited Hong Kong
Wipro Unza (China) Limited Hong Kong
Wipro Unza (Guangdong) Consumer
Products Limited.
China
PT Unza Vitalis Indonesia
Wipro Unza (Thailand) Limited Thailand
Unza Overseas Limited British virgin
islands
Unzafrica Limited Nigeria
Wipro Unza Middle East Limited British virgin
islands
Unza International Limited British virgin
islands
Unza Nusantara Sdn Bhd Malaysia
Unza Holdings Sdn Bhd Malaysia
Unza (Malaysia) Sdn Bhd Malaysia
UAA (M) Sdn Bhd Malaysia
Manufacturing Services Sdn Bhd Malaysia
Shubido Pacific Sdn Bhd(a) Malaysia
Gervas Corporation Sdn Bhd Malaysia
Gervas (B) Sdn Bhd Malaysia
Formapac Sdn Bhd Malaysia
Wipro Holding Austria GmbH Austria
New Logic Technologies GmbH Austria
New Logic Technologies SARL France
Wipro Portugal S.A.
SAS Wipro France
(formerly Enabler France SAS)
France
Wipro Retail UK Limited
(formerly Enabler UK Limited)
U.K.
Wipro do Brasil Technologia Ltda
(formerly Enabler Brazil Ltda)
Brazil
Wipro Technologies Gmbh (formerly
Enabler & Retail Consult GmbH)
Germany

Consolidated Financial Statements
Wipro Limited 157
(a) All the above subsidiaries are 100% held by the Company except Shubido Pacific Sdn Bhd in which the Company holds 62.55% of the equity securities
The list of controlled trusts are :
Name of entity
Nature
Country of
Incorporation
Wipro Equity Reward Trust Trust India
Wipro Inc Trust Trust USA
18. Related party relationships and transactions
The related parties are:
Name of other related parties Nature % of holding Country of
Incorporation
Wipro GE Healthcare Private Limited Associate 49% India
Azim Premji Foundation Entity controlled by Director
Hasham Premji (partnership firm) Entity controlled by Director
Prazim Traders (partnership firm) Entity controlled by Director
Zash Traders (partnership firm) Entity controlled by Director
Regal Investment & Trading Company Private Limited Entity controlled by Director
Vidya Investment & Trading Company Private Limited Entity controlled by Director
Napean Trading & Investment Company Private Limited Entity controlled by Director
Key management personnel
Azim Premji Chairman and Managing Director
Suresh C Senapaty Chief Financial Officer & Director
Suresh Vaswani Jt CEO, IT Business & Director1
Girish S Paranjpe Jt CEO, IT Business & Director1
T K Kurien CEO, IT Business & Director2
Relative of key management personnel
Rishad Premji Relative of the director
1 Upto January 31st 2011
2 w.e.f February 1st,2011
The Company has the following related party transactions:
(` in Million)
Transaction / Balances Associates Entities controlled by
Directors
Key Management
Personnel@
2011 2010 2011 2010 2011 2010
Sales of services 5 7 - - - -
Sale of goods 13 - - 1 - -
Dividend payable - - 7,401 6,661 383 344
Others - 33 - - - -
Balances as on March 31,
Receivables 7 1 - - - -
Payables - - 7,401 6,663 391 388
@ Including relative of key management personnel.

Consolidated Financial Statements
158 Annual Report 2010-11
Remuneration to key management personnel and relative of key
management personnel is summarized below:
(` in Million)
Name For the year ended
March, 31
2011 2010
Azim Premji 28 81
Suresh Senapaty 43 31
Girish Paranjpe 89 20
Suresh Vaswani 102 31
T K Kurien 8 -
Rishad Premji 5 4
19. Estimated amount of contracts remaining to be executed on capital accounts and contingent liabilities
(` in Million)
Particulars As at March 31,
2011 2010
Estimated amount of contracts
remaining to be executed on Capital
account and not provided for
2,071 2,782
Contingent liabilities in respect of:
(a) Disputed demands for excise duty, custom duty, income tax, sales tax and other matters
1,472 1,384
(b) Per formance and f inancial guarantee given by the banks on behalf of the Company
19,841 14,526
The Company is subject to legal proceedings and claims which have arisen in the ordinary course of its business. The resolution of these legal proceedings is not likely to have a material and adverse effect on the consolidated financial statements of the Company.
The Company’s Indian operations have been established as a Software Technology Park Unit under a plan formulated by the Government of India. As per the plan, the Company’s India operations have export obligations to the extent of 1.5 times the employee costs for the year on an annual basis and 5 times the amount of foreign exchange released for capital goods imported, over a five year period. The consequence of not meeting this commitment in the future
would be a retroactive levy of import duties on certain computer hardware previously imported duty free. As at March 31, 2011, the Company has met all commitments required under the plan.
20. The Company is currently organized by business segments, comprising IT Services, IT Products, Consumer Care and Lighting and Others. Business segments have been determined based on system of internal financial reporting to the board of directors and chief executive officer and are considered to be primary segments. The secondary segment is identified based on the geographic location of the customer.
IT Services: The IT Services segment provides IT and IT enabled services to customers. Key service offering includes software application development, application maintenance, research and development services for hardware and software design, data center outsourcing services and business process outsourcing services.
IT Products: The IT Products segment sells a range of Wipro personal desktop computers, Wipro servers and Wipro notebooks. The Company is also a value added reseller of desktops, servers, notebooks, storage products, networking solutions and packaged software for leading international brands. In certain total outsourcing contracts of the IT Services segment, the Company delivers hardware, software products and other related deliverables. Revenue relating to these items is reported as revenue from the sale of IT Products.
Consumer care and lighting: The Consumer Care and Lighting segment manufactures, distributes and sells personal care products, baby care products, lighting products and hydrogenated cooking oils in the Indian and Asian markets.
The Others’ segment consists of business segments that do not meet the requirements individually for a reportable segment as defined in AS 17 Segment Reporting and includes corporate and treasury.
Segment Revenue, Segment Results, Segment Assets and Segment Liabilities include the respective amounts identifiable to each of the segment. Segment revenue resulting from business with other business segments are on the basis of market determined prices and common costs are apportioned on a reasonable basis.

Consolidated Financial Statements
Wipro Limited 159
The segment information for the year ended March 31, 2011 is as follows:
(` in Million)
Particulars Year ended March 31,
2011 2010 Variance (%)
Revenues
IT Services 234,760 202,469 16%
IT Products 36,995 38,322 (3%)
Consumer Care and Lighting 28,436 23,774 20%
Others 11,209 7,589
Eliminations (570) (407)
TOTAL 310,830 271,747 14%
Profit before Interest and Tax - PBIT
IT Services 53,457 47,749 12%
IT Products 1,627 1,752 (7%)
Consumer Care and Lighting 3,426 3,100 11%
Others (849) (474)
TOTAL 57,661 52,127 11%
Interest and Other Income, Net 4,687 2,968
Profit before tax 62,348 55,095 13%
Income Tax expense including Fringe Benefit Tax (9,695) (9,163)
Profit before Share in earnings of associates and minority interest 52,653 45,932 15%
Share in earnings of associates 615 563
Minority interest (344) (185)
PROFIT AFTER TAX 52,924 46,310 14%
Operating Margin
IT Services 22.8% 23.6%
IT Products 4.4% 4.6%
Consumer Care and Lighting 12.0% 13.0%
TOTAL 18.6% 19.2%
CAPITAL EMPLOYED AS AT PERIOD END
IT Services and Products 157,141 133,489
Consumer Care and Lighting 22,139 20,003
Others 99,090 91,901
TOTAL 278,370 245,393
CAPITAL EMPLOYED COMPOSITION AS AT PERIOD END
IT Services and Products 56% 54%
Consumer Care and Lighting 8% 8%
Others 36% 38%
TOTAL 100% 100%
RETURN ON AVERAGE CAPITAL EMPLOYED
IT Services and Products 38% 40%
Consumer Care and Lighting 16% 16%
TOTAL 22% 24%

Consolidated Financial Statements
160 Annual Report 2010-11
Notes to Segment Report
a) The segment report of Wipro Limited and its consolidated subsidiaries and associates has been prepared in accordance with the AS 17 “Segment Reporting” issued pursuant to the Companies (Accounting Standard) Rules, 2006 and by The Institute of Chartered Accountants of India.
b) Segment wise depreciation is as follows:
(` in Million)
Particulars Year ended March 31,
2011 2010
IT Services 6,994 6,711
IT Products 65 75
Consumer Care & Lighting 483 444
Others 349 313
7,891 7,543
c) Segment PBIT includes ̀ 645 million for the year ended March 31, 2011, (2010: ̀ 558 million) of certain operating other income / (loss) which is reflected in other income in the profit and loss account.
d) Segment assets and liabilities are as follows:
(` in Million)
Particulars As of March 31, 2011 As of March 31, 2010
Segment Assets Segment Liabilities Segment Assets Segment Liabilities
IT Services and Products 214,287 56,395 189,288 55,085
Consumer Care & Lighting 27,645 5,505 25,098 5,096
Others 127,045 28,098 112,723 20,994
Total 368,977 89,998 327,109 81,175
e) The Company has four geographic segments: India, USA, Europe and Rest of the World. Significant portion of the segment assets are in India. Revenue from geographic segments based on domicile of the customers is outlined below:
(` in Million)
Particulars Year ended March 31,
2011 % 2010 %
India 67,234 22 61,897 23
United States of America 129,286 41 119,921 44
Europe 68,159 22 56,780 21
Rest of the world 46,150 15 33,149 12
310,829 100 271,747 100
f ) The Company generally offers multi-year payment terms in certain total outsourcing contracts. These payment terms primarily relate to IT hardware, software and certain transformation services in Outsourcing contracts. Corporate Treasury provides internal financing to the business units offering multi-year payment terms and accordingly such receivables are reflected in Capital Employed of “Others”. As of March 31, 2011, Capital Employed of Others includes ̀ 12,255 million (2010: ̀ 8,516 million) of such receivables on extended collection terms.
g) For the purpose of reporting, business segments are considered as primary segments and geographic segments are considered as secondary segments.

Consolidated Financial Statements
Wipro Limited 161
21. Cash and Bank
Details of balances with banks as of March 31, 2011 are as follows:
(` in Million)
Bank Name In Current Account In Deposit Account Total
Wells Fargo Bank 16,943 - 16,943
HSBC Bank 3,997 332 4,329
Citi Bank 1,645 1,201 2,846
HDFC Bank 1,078 490 1,568
Standard Chartered Bank 691 75 766
Bank of America 326 - 326
ING Vysya Bank 309 - 309
Saudi British Bank 211 952 1,163
State Bank of India 117 120 237
Vijaya Bank 20 3,940 3,960
Yes Bank 14 1,000 1,014
Canara Bank - 13,670 13,670
Oriental Bank of Commerce - 3,250 3,250
Corporation Bank 1 2,370 2,371
Axis Bank - 1,570 1,570
Allahabad Bank - 1,320 1,320
Karur Vysya Bank - 920 920
Bank of Maharashtra - 820 820
South Indian Bank - 750 750
Others including cash and cheques on hand 2,275 734 3,009
Total 27,627 33,514 61,141
22. Investments
(a) Investments in Indian money market mutual funds as on March 31, 2011:
(` in Million)
Fund House As of March 31, 2011
ICICI Prudential AMC
Birla Sunlife
Franklin Templeton
6,131
3,883
3,777
IDFC Ltd
TATA
State Bank of India
3,153
2,705
1,699
Kotak Mahindra
UTI AMC
DSP Black Rock
Religare Aegon AMC
JP Morgan AMC
HDFC
1,695
1,065
500
300
150
73
Reliance
Others
67
2
Total 25,200

Consolidated Financial Statements
162 Annual Report 2010-11
(b) Investment in Certificates of Deposit as on March 31, 2011:
(` in Million)
Particulars As of March 31, 2011
Axis Bank
Bank of Baroda
ICICI
Corporation Bank
Bank of India
Kotak Bank
Federal Bank
Union Bank
HDFC Bank
State Bank of india
ING Vyasa Bank
Indian Overseas Bank
State Bank of Hyderabad
State Bank of Patiala
IDBI Bank
2,592
1,166
961
935
233
720
717
713
479
480
488
477
471
465
237State Bank of Travancore
Andhra Bank
Vijaya Bank
Others
240
242
239
111
Total 11,966
(c) Investment in Commercial Papers as on March 31, 2011:
(` in Million)
Particulars As of March 31, 2011
IDFC
IL & FS Ltd
L&T Infra Finance
LIC Housing Finance
NABARD
NHB
Sundaram BNP Paribas Housing Finance
1,426
1,891
715
1,800
230
1,116
238
Total 7,416
(d) Investment in Others as on March 31, 2011:
(` in Million)
Particulars As of March 31, 2011
NCD-CiticorpFinance
NCD-Morgan Stanley
NCD-IDFC Ltd
NCD-LIC
NCD-NHB
NCD-SIDBI
Others
241
481
607
2,263
891
251
97
Total 4,831
23. Corresponding figures for previous year presented have been regrouped, where necessary, to conform to the current year classification.

Consolidated Financial Statements
Wipro Limited 163
In
form
ati
on
re
lati
ng
to
Su
bsi
dia
rie
s a
s a
t M
arc
h 3
1, 2
01
1
(` in
Mill
ion
)
Sr.
No
.
Na
me
of
the
Su
bsi
dia
ryR
ep
ort
ing
Cu
rre
ncy
Exc
ha
ng
e
rate
as
on
Ma
rch
, 31
20
11
Sh
are
Ca
pit
al
Re
serv
es
&
Su
rplu
s
Tota
l
Ass
ets
Tota
l
Lia
bili
tie
s
[exc
l. (4
) &
(5)]
Inve
stm
en
ts-
oth
er
tha
n in
sub
sid
iari
es
% o
f
Ho
ldin
g
Sa
les
&
Oth
er
Inco
me
Pro
fit
be
fore
taxa
tio
n
Pro
vis
ion
for
taxa
tio
n
Pro
fit
aft
er
taxa
tio
n
Pro
po
sed
Div
ide
nd
(in
cl.
div
ide
nd
tax)
(1)
(2)
(3)
(4)
(5)
(6)
(7)
(8)
(9)
(10
)(1
1)
(12
)(1
3)
(14
)1
Wip
ro In
c.U
SD
44
.59
16
,80
1(7
,96
9)
28
,64
42
0,3
52
54
01
00
%6
,13
9(4
56
)8
7(5
43
)-
2E
nth
ink
Inc.
(a)
US
D4
4.5
91
05
(93
)1
2-
-1
00
%-
--
--
3W
ipro
Ja
pa
n K
KJPY
0.5
41
0(3
89
)2
41
62
0-
10
0%
47
2(2
01
)-
(20
1)
-4
Wip
ro C
ha
nd
rik
a L
imit
ed
INR
1.0
01
0(2
08
)1
87
38
5-
90
%-
(31
)-
(31
)-
5W
ipro
Tra
de
ma
rks H
old
ing
Lim
ite
dIN
R1
.00
13
53
6-
-1
00
%-
--
--
6W
ipro
Tra
vel S
erv
ice
s Li
mit
ed
INR
1.0
0-
45
22
31
78
-1
00
%5
43
11
02
1-
7W
ipro
Ho
ldin
gs
(Ma
uri
tiu
s) L
imit
ed
US
D4
4.5
92
,02
3(3
)2
,02
33
-1
00
%2
1-
1-
8W
ipro
Ho
ldin
gs
(UK
) Li
mit
ed
(b
)U
SD
44
.59
2,0
12
(44
)2
,77
78
09
-1
00
%2
86
82
6-
9W
ipro
Te
chn
olo
gie
s U
K L
imit
ed
(c)
US
D4
4.5
91
32
(12
6)
34
43
38
-1
00
%1
(14
)-
(14
)-
10
Wip
ro C
on
sum
er
Ca
re L
imit
ed
INR
1.0
01
(2)
-1
-1
00
%-
--
--
11
Cyg
nu
s N
eg
ri In
vest
me
nts
Pri
va
te L
imit
ed
(d
)IN
R1
.00
12
52
-1
00
%-
--
--
12
Wip
ro S
ha
ng
ha
i Lim
ite
dR
MB
6.8
29
(47
)4
24
46
2-
10
0%
65
33
14
4(1
3)
-1
3W
ipro
Ho
ldin
g A
ust
ria
Gm
bH
EU
R6
3.2
86
06
1,1
25
1,7
48
17
-1
00
%-
(5)
1(6
)-
14
Ne
w L
og
ic T
ech
no
log
ies
Gm
bH
EU
R6
3.2
81
,77
8(1
,87
9)
83
59
39
31
00
%1
,16
82
7-
27
-1
5N
ew
Log
ic T
ech
no
log
ies
SA
RL
EU
R6
3.2
8-
(50
1)
21
52
2-
10
0%
9(1
1)
-(1
1)
-1
6cM
an
go
Pte
Lim
ite
dS
GD
35
.34
-1
11
32
-1
00
%-
--
--
17
Wip
ro C
ypru
s P
riv
ate
Lim
ite
dE
UR
63
.28
93
4,1
65
36
,87
92
,70
5-
10
0%
65
96
07
10
59
75
18
Wip
ro T
ech
no
log
ies
SR
L (e
)R
ON
15
.39
16
91
11
73
24
52
-1
00
%1
,31
42
48
44
20
4-
19
Wip
ro I
nfo
rma
tio
n T
ec
hn
olo
gy
Ne
the
rla
nd
s BV
(Fo
rme
ly R
eta
il B
ox
BV
)
EU
R6
3.2
84
34
14
11
66
-1
00
%1
94
16
88
-
20
Wip
ro P
ort
ug
al
S.A
. (
Form
erl
y E
na
ble
r In
form
ati
cs
S.A
.) (
e)
EU
R6
3.2
83
2,0
70
2,7
07
63
4-
10
0%
2,8
31
75
62
46
51
0-
21
Wip
ro d
o B
rasi
l Te
chn
olo
gia
Ltd
a (
form
erl
y E
na
ble
r
Bra
sil L
TD
A)(
e)
BR
L2
7.5
31
02
37
85
86
11
-1
00
%1
,46
74
35
3(1
0)
-
22
Wip
ro T
ech
no
log
ies
Gm
bh
.(fo
rme
ly E
na
ble
r &
Re
tail
Co
nsu
lt G
mb
h)
EU
R6
3.2
85
6(1
3)
78
47
41
-1
00
%6
72
(13
0)
(5)
(12
5)
-
23
SA
S W
ipro
Fra
nce
( f
orm
erl
y E
na
ble
r Fr
an
ce S
AS
)E
UR
63
.28
2(7
5)
26
99
-1
00
%5
44
-4
-2
4W
ipro
Re
tail
UK
Lim
ite
d (
fo
rme
rly E
na
ble
r U
K L
td. )
GB
P7
1.6
7-
(10
3)
70
58
08
-1
00
%1
,30
92
0-
20
-2
5W
MNE
TSE
RV
Lim
ite
dU
SD
44
.59
16
56
82
-1
00
%-
(1)
-(1
)-
26
WM
NE
TSE
RV
(U
K)
Ltd
. UK
US
D4
4.5
99
17
38
12
-1
00
%-
(1)
-(1
)-
27
Wip
ro T
ech
no
log
ies
OY
EU
R6
3.2
84
(10
8)
44
45
48
-1
00
%7
02
68
-6
8-
28
3D
Ne
two
rks
(UK
) Li
mit
ed
GB
P7
1.6
77
(6)
43
-1
00
%-
(3)
-(3
)-
29
Wip
ro N
etw
ork
s P
te L
imit
ed
(fo
rme
rly
3D
Ne
two
rks
Pte
Lim
ite
d)
SG
D3
5.3
48
07
12
1,2
59
44
0-
10
0%
1,1
25
(37
)-
(37
)-
30
Pla
ne
t P
SG
Pte
Lim
ite
dS
GD
35
.34
42
(18
)5
02
6-
10
0%
18
--
--
31
Wip
ro T
ech
no
log
ies
SD
N BH
D (
form
erl
y P
lan
et
PS
G
SD
N BH
D)
MY
R1
4.7
1-
(7)
12
19
-1
00
%2
--
--
32
Wip
ro I
nfr
ast
ruc
ture
En
gin
ee
rin
g O
y (
form
erl
y
Hyd
rau
to O
y A
b P
ern
ion
)
EU
R6
3.2
88
81
04
1,0
62
87
0-
10
0%
1,6
48
79
-7
9-
33
Wip
ro I
nfr
ast
ruc
ture
En
gin
ee
rin
g A
B (
form
erl
y
Hyd
rau
to G
rou
p A
b)
SE
K7
.10
1,8
73
(99
6)
3,1
15
2,2
38
-1
00
%3
,31
9(3
74
)-
(37
4)
-
34
Info
cro
ssin
g In
cU
SD
44
.59
-4
,88
21
0,1
25
5,2
43
-1
00
%7
,13
01
37
18
11
9-
35
Un
za H
old
ing
Ltd
SG
D3
5.3
41
,90
13
,48
85
,40
01
1-
10
0%
2,8
51
2,7
44
72
,73
7-
36
Un
za C
om
pa
ny
Pte
Ltd
SG
D3
5.3
45
7(3
3)
10
98
5-
10
0%
34
3(6
)-
(6)
-3
7U
nza
Ind
och
ina
Pte
Ltd
SG
D3
5.3
48
62
87
38
81
5-
10
0%
33
36
0-
60
-
Pu
rsu
an
t to
th
e e
xem
pti
on
by
the
Min
istr
y o
f C
om
pa
ny
aff
air
s, G
ove
rnm
en
t o
f In
dia
, th
e C
om
pa
ny
is p
rese
nti
ng
su
mm
ary
fin
an
cia
l in
form
ati
on
ab
ou
t in
div
idu
al
sub
sid
iari
es
as
at
Ma
rch
31
, 20
11
. Th
e d
eta
iled
fin
an
cia
l sta
tem
en
ts, d
ire
cto
rs’ r
ep
ort
an
d a
ud
ito
rs’ r
ep
ort
of t
he
ind
ivid
ua
l su
bsi
dia
rie
s a
re a
vaila
ble
for
insp
ect
ion
at
the
re
gis
tere
d o
ffice
of t
he
Co
mp
an
y. U
po
n w
ritt
en
re
qu
est
fro
m a
sh
are
ho
lde
r w
e w
ill a
rra
ng
e
to d
eliv
er
cop
ies
of
the
fin
an
cia
l sta
tem
en
t, d
ire
cto
rs’ r
ep
ort
an
d a
ud
ito
rs’ r
ep
ort
fo
r th
e in
div
idu
al s
ub
sid
iari
es.

Consolidated Financial Statements
164 Annual Report 2010-11
Sr.
No
.
Na
me
of
the
Su
bsi
dia
ryR
ep
ort
ing
Cu
rre
ncy
Exc
ha
ng
e
rate
as
on
Ma
rch
, 31
20
11
Sh
are
Ca
pit
al
Re
serv
es
&
Su
rplu
s
Tota
l
Ass
ets
Tota
l
Lia
bili
tie
s
[exc
l. (4
) &
(5)]
Inve
stm
en
ts-
oth
er
tha
n in
sub
sid
iari
es
% o
f
Ho
ldin
g
Sa
les
&
Oth
er
Inco
me
Pro
fit
be
fore
taxa
tio
n
Pro
vis
ion
for
taxa
tio
n
Pro
fit
aft
er
taxa
tio
n
Pro
po
sed
Div
ide
nd
(in
cl.
div
ide
nd
tax)
38
Un
za V
ietn
am
Co
mp
an
y Li
mit
ed
VN
D0
.00
23
38
84
17
75
25
26
4-
10
0%
1
,76
11
57
50
10
76
03
9U
nza
Cat
hay
Lim
ite
dH
KD
5.7
25
63
52
87
19
6-
10
0%
53
64
13
-4
0U
nza
Ch
ina
Lim
ite
dH
KD
5.7
21
14
18
14
61
4-
10
0%
-(1
)-
(1)
-4
1D
on
gg
ua
n U
nza
Co
nsu
me
r P
rod
uct
s Lt
dR
MB
6.8
23
29
(18
2)
44
62
99
-1
00
%1
,21
7(2
)(7
)5
-4
2P
T U
nza
Vit
alis
IDR
0.0
12
39
66
96
56
60
-1
00
%1
,27
8(6
0)
29
(89
)-
43
Un
za (
Th
aila
nd
) Li
mit
ed
TH
B1
.47
34
(11
1)
22
99
-1
00
%4
1(4
)-
(4)
-4
4U
nza
Ove
rse
as
Ltd
US
D4
4.5
9-
71
23
51
64
-1
00
%3
05
25
-2
5-
45
Un
za A
fric
a L
imit
ed
US
D4
4.5
9-
46
2-
10
0%
--
--
-4
6U
nza
Mid
dle
Ea
st L
tdU
SD
44
.59
-4
65
00
45
4-
10
0%
84
05
8-
58
-4
7U
nza
Inte
rna
tio
na
l Lim
ite
dU
SD
44
.59
44
11
,26
51
,97
72
71
-1
00
%5
79
53
85
04
88
-4
8U
nza
Nu
san
tra
Sd
n B
hd
MY
R1
4.7
11
,19
25
12
3,5
81
1,8
77
-1
00
%7
6(3
47
)2
(34
9)
-4
9U
nza
Ho
ldin
gs
Sd
n B
hd
MY
R1
4.7
1-
--
--
10
0%
1(2
,71
5)
-(2
,71
5)
-5
0U
nza
Ma
lays
ia S
dn
Bh
dMY
R1
4.7
15
59
95
1,6
39
58
9-
10
0%
5,2
24
37
79
72
80
38
51
UA
A S
dn
Bh
dMY
R1
4.7
12
27
91
,19
89
17
-1
00
%4
,25
92
27
15
-5
2M
an
ufa
ctu
rin
g S
erv
ice
s S
en
dir
ian
Be
rha
dMY
R1
4.7
14
42
29
52
52
6-
10
0%
2,8
06
11
02
09
0-
53
Sh
ub
ido
Pa
cifi
c S
dn
Bh
dMY
R1
4.7
14
64
51
32
41
-6
2.5
5%
23
54
21
03
23
05
4G
erv
as
Co
rpo
rati
on
Sd
n B
hd
MY
R1
4.7
13
62
05
82
-1
00
%-
4-
4-
55
Ge
rva
s (B
) S
dn
Bh
dB
ND
11
9.1
8-
--
--
10
0%
--
--
-5
6Fo
rma
pa
c S
dn
Bh
dMY
R1
4.7
13
62
03
34
51
06
-1
00
%6
72
26
71
9-
57
Wip
ro T
ech
no
log
ies
S.A
DE
C. V
MX
N3
.79
2(5
8)
43
04
86
-1
00
%2
79
(14
)2
8(4
2)
-5
8W
ipro
Sin
ga
po
re P
te. L
td.
SG
D3
5.3
41
0,9
26
(5)
10
,95
02
9-
10
0%
1-
--
-5
9W
ipro
Au
stra
lia P
ty L
imit
ed
AU
D4
6.0
61
71
03
95
-1
00
%6
76
15
-6
0W
ipro
Ara
bia
Lim
ite
dS
AR
11
.90
35
81
,76
34
,85
42
,73
3-
66
.67
%7
,03
59
26
(11
7)
1,0
43
-6
1W
ipro
Ho
ldin
gs H
un
ga
ry K
orl
ato
lt F
ele
l.sse
g.
Tars
asa
g
HU
F0
.24
-1
7,1
18
17
,42
43
06
-1
00
%5
27
52
48
44
40
37
1
62
Wip
ro T
ech
no
cen
tre
(S
ing
ap
ore
) P
te L
imit
ed
SG
D3
5.3
45
4(6
6)
24
36
-1
00
%4
4(8
9)
1(9
0)
-6
3W
ipro
BP
O P
hili
pp
ine
s Lt
d. I
nc
US
D4
4.5
91
80
14
78
78
55
1-
10
0%
84
81
51
28
12
3-
64
Wip
ro T
ech
no
log
ies
Lim
ite
d-
Ru
ssia
RU
B1
.57
-1
10
32
02
10
-1
00
%1
13
58
12
46
-6
5W
ipro
Ga
llag
he
r S
olu
tio
ns
Inc
US
D4
4.5
97
58
42
93
24
61
12
10
0%
69
55
8-
58
-6
6W
ipro
Te
chn
olo
gie
s A
rge
nti
na
SA
AR
S1
1.1
9-
(53
)5
41
07
-1
00
%3
8(3
9)
-(3
9)
-6
7W
ipro
Po
lan
d S
p Z
oo
PLN
15
.95
16
51
54
88
-1
00
%4
35
71
6-
68
Wip
ro In
form
ati
on
Te
chn
olo
gy E
gyp
t S
AE
EG
P7
.58
7(3
8)
54
85
-1
00
%6
9(3
1)
-(3
1)
-6
9W
ipro
(T
ha
ilan
d)
Co
Lim
ite
dTH
B1
.47
15
41
23
46
71
90
-1
00
%1
85
48
10
38
-7
0W
ipro
Te
chn
log
ies
Se
rvic
es
Lim
ite
dIN
R1
.00
39
34
,77
54
,64
46
88
1,2
12
10
0%
3,6
95
1,4
13
59
1,3
54
-7
1W
ipro
Ch
en
gd
u L
imit
ed
RM
B6
.82
24
(10
0)
13
72
13
-1
00
%2
67
(45
)-
(45
)-
72
Wip
ro Y
ard
ley
FZE
US
D4
4.5
91
33
57
62
02
50
-1
00
%1
,06
61
17
-1
17
-7
3W
ipro
Ba
hra
in L
imit
ed
WLL
BH
D1
18
.93
69
46
31
-1
00
%9
31
0-
10
-7
4W
ipro
Air
po
rt IT
Se
rvic
es
Lim
ite
dIN
R1
.00
50
57
04
75
31
04
74
%5
66
71
6-
75
PT
WT
Ind
on
esi
aID
R0
.01
11
(1)
11
1-
10
0%
-(1
)-
(1)
-7
6W
ipro
Infr
ast
ruct
ure
En
gin
ee
rin
g M
ach
ine
ry
(Ch
an
gzh
ou
) C
o.,
Ltd
.
RM
B6
.82
10
5(1
2)
97
4-
10
0%
-(1
1)
-(1
1)
-
77
Hyd
rau
to C
elk
a S
an
ve
Tic
(g
)-
--
--
--
10
0%
--
--
-7
8W
MNE
TSE
RV
Inc
(g)
--
--
--
-1
00
%-
--
--
79
Wip
ro T
ech
no
log
ies
(So
uth
Afr
ica
) P
rop
rie
tary
Lim
ite
d (
f)
--
--
--
--
--
--
-
80
Wip
ro O
uts
ou
rcin
g S
erv
ice
s U
K L
imit
ed
(f)
--
--
--
--
--
--
-
a)
Majo
rity
ow
ne
d b
y W
ipro
Inc.
b)
Fully
ow
ne
d b
y W
ipro
Ho
ldin
gs
(Ma
uri
tiu
s) L
imit
ed
c)
Fully
ow
ne
d b
y W
ipro
Ho
ldin
gs
(UK
) Li
mit
ed
d)
Fully
ow
ne
d b
y W
ipro
Tra
de
ma
rks H
old
ing
Lim
ite
de
)
Th
e fi
na
nci
al r
esu
lts
are
as
of
an
d f
or
the
ye
ar
en
de
d M
arc
h, 3
1 2
01
1.
f)
Wip
ro T
ech
no
log
ies
(So
uth
Afr
ica
) P
rop
rie
tary
Lim
ite
d a
nd
Wip
ro O
uts
ou
rcin
g S
erv
ice
s U
K L
imit
ed
are
ye
t to
co
mm
en
ce o
pe
rati
on
sg
) H
ydra
uto
Ce
lka
Sa
n v
e T
ic a
nd
WM
NE
TSE
RV
Inc
are
no
t o
pe
rati
ve a
nd
he
nce
no
t in
clu
de
d a
bo
veh
) D
uri
ng
th
e y
ea
r 2
01
0-1
1, I
nfo
cro
ssin
g L
LC w
as
me
rge
d w
ith
Info
cro
ssin
g In
c., W
ipro
Ya
rdle
y C
on
sum
er
Ca
re P
riv
ate
Lim
ite
d w
as
me
rge
d w
ith
Wip
ro L
imit
ed
an
d P
osi
tive
Eq
uit
y S
DN
BH
D w
as
liqu
ida
ted

Wipro Limited 165
Consolidated Financial Statements Under IFRS
REPORT OF INDEPENDENT REGISTERED PUBLIC ACCOUNTING FIRM
The Board of Directors and Equity holders
Wipro Limited:
We have audited the accompanying consolidated statements of financial position of Wipro Limited and subsidiaries (“the Company”)
as of March 31, 2010 and 2011, and the related consolidated statements of income, comprehensive income, changes in equity and
cash flows for each of the years in the three-year period ended March 31, 2011. These consolidated financial statements are the
responsibility of the Company’s management. Our responsibility is to express an opinion on these consolidated financial statements
based on our audits.
We conducted our audits in accordance with the standards of the Public Company Accounting Oversight Board (United States).
Those standards require that we plan and perform the audit to obtain reasonable assurance about whether the financial statements
are free of material misstatement. An audit includes examining, on a test basis, evidence supporting the amounts and disclosures
in the financial statements. An audit also includes assessing the accounting principles used and significant estimates made by
management, as well as evaluating the overall financial statement presentation. We believe that our audits provide a reasonable
basis for our opinion.
In our opinion, the consolidated financial statements referred to above present fairly, in all material respects, the financial position
of the Company as of March 31, 2010 and 2011, and the results of their operations and their cash flows for each of the years in
the three-year period ended March 31, 2011, in conformity with International Financial Reporting Standards as issued by the
International Accounting Standards Board.
We have also audited, in accordance with the Standards of the Public Company Accounting Oversight Board (United States), the
Company’s internal control over financial reporting as of March 31, 2011, based on criteria established in Internal Control – Integrated
Framework issued by the Committee of Sponsoring Organizations of the Treadway Commission (COSO), and our report dated
June 16, 2011 expressed an unqualified opinion on the effectiveness of the Company’s internal control over financial reporting.
KPMG
Bangalore, India
June 16, 2011

Consolidated Financial Statements Under IFRS
166 Annual Report 2010-11
WIPRO LIMITED AND SUBSIDIARIES
CONSOLIDATED STATEMENTS OF FINANCIAL POSITION
(` in millions, except share and per share data, unless otherwise stated)
As at March 31,Notes 2010 2011 2011
Convenience
Translation into
US $ in millions
(Unaudited) Refer
note 2(iv)Assets Goodwill ........................................................................................... 5 53,802 54,818 1,231
Intangible assets ........................................................................... 5 4,011 3,551 80 Property, plant and equipment ............................................... 4 53,458 55,094 1,237 Investment in equity accounted investees ......................... 16 2,345 2,993 67 Derivative assets ........................................................................... 15 1,201 2,984 67 Deferred tax assets ....................................................................... 18 1,686 1,467 33 Non-current tax assets ................................................................ 3,464 9,239 207 Other non-current assets ........................................................... 11 8,784 8,983 202 Total non-current assets ............................................................... 128,751 139,129 3,124 Inventories ...................................................................................... 9 7,926 9,707 218 Trade receivables .......................................................................... 8 50,928 61,627 1,384 Other current assets .................................................................... 11 21,106 19,744 443 Unbilled revenues ........................................................................ 16,708 24,149 542 Available for sale investments.................................................. 7 30,420 49,282 1,106 Current tax assets ......................................................................... 6,596 4,955 111 Derivative assets ........................................................................... 15 2,615 1,709 38 Cash and cash equivalents ........................................................ 10 64,878 61,141 1,373 Total current assets ........................................................................ 201,177 232,314 5,216TOTAL ASSETS ...................................................................................... 329,928 371,443 8,340Equity Share capital ................................................................................... 2,936 4,908 110 Share premium .............................................................................. 29,188 30,124 676 Retained earnings......................................................................... 165,789 203,250 4,563 Share based payment reserve .................................................. 3,140 1,360 31 Other components of equity .................................................... (4,399) 580 13 Shares held by controlled trust ................................................ (542) (542) (12) Equity attributable to the equity holders of the Company 196,112 239,680 5,381 Non-controlling interest ............................................................. 437 691 16TOTAL EQUITY .................................................................................... 196,549 240,371 5,397Liabilities Loans and borrowings ................................................................ 12 18,107 19,759 444 Derivative liabilities ...................................................................... 15 2,882 2,586 58 Deferred tax liabilities ................................................................. 18 380 301 7 Non-current tax liabilities .......................................................... 3,065 5,021 113 Other non-current liabilities ..................................................... 14 3,233 2,706 61 Provisions ......................................................................................... 14 100 81 2 Total non-current liabilities ......................................................... 27,767 30,454 684 Loans and borrowings and bank overdraft ......................... 12 44,404 33,043 742 Trade payables and accrued expenses ................................. 13 38,748 44,052 989 Unearned revenues ...................................................................... 7,462 6,595 148 Current tax liabilities .................................................................... 4,850 7,340 165 Derivative liabilities ...................................................................... 15 1,375 1,358 30 Other current liabilities ............................................................... 14 6,499 5,906 133 Provisions ......................................................................................... 14 2,274 2,324 52 Total current liabilities .................................................................. 105,612 100,618 2,259TOTAL LIABILITIES ............................................................................. 133,379 131,072 2,943TOTAL EQUITY AND LIABILITIES ................................................. 329,928 371,443 8,340
The accompanying notes form an integral part of these consolidated financial statements.

Consolidated Financial Statements Under IFRS
Wipro Limited 167
WIPRO LIMITED AND SUBSIDIARIES
CONSOLIDATED STATEMENTS OF INCOME
(` in millions, except share and per share data, unless otherwise stated)
Year ended March 31,
Notes 2009 2010 2011 2011
Convenience
Translation
into US $
in millions
(Unaudited)
Refer note 2(iv)
Revenues.................................................................. 21 256,891 271,957 310,542 6,972
Cost of revenues .................................................... 22 (180,215) (186,299) (212,808) (4,778)
Gross profit .................................................................. 76,676 85,658 97,734 2,194
Selling and marketing expenses ..................... 22 (17,313) (18,608) (22,172) (498)
General and administrative expenses ........... 22 (14,510) (14,823) (18,339) (412)
Foreign exchange gains / (losses), net .......... (1,553) (383) 445 10
Results from operating activities ...................... 43,300 51,844 57,668 1,295
Finance expense .................................................. 23 (3,824) (1,324) (1,933) (43)
Finance and other income................................. 24 5,057 4,360 6,652 149
Share of profits of equity accounted ............
investees ..................................................................
16 362 530 648 15
Profit before tax ......................................................... 44,895 55,410 63,035 1,415
Income tax expense ............................................. 18 (6,035) (9,294) (9,714) (218)
Profit for the year ....................................................... 38,860 46,116 53,321 1,197
Attributable to:
Equity holders of the Company ....................... 38,761 45,931 52,977 1,189
Non-controlling interest ..................................... 99 185 344 8
Profit for the year ............................................... 38,860 46,116 53,321 1,197
Earnings per equity share: 25
Basic .......................................................................... 15.99 18.91 21.74 0.49
Diluted ...................................................................... 15.90 18.75 21.61 0.49
Weighted-average number of equity shares used
in computing earnings per equity share:
Basic ........................................................................... 2,423,558,482 2,429,025,243 2,436,440,633 2,436,440,633
Diluted ...................................................................... 2,437,464,403 2,449,658,532 2,451,154,154 2,451,154,154
The accompanying notes form an integral part of these consolidated financial statements.

Consolidated Financial Statements Under IFRS
168 Annual Report 2010-11
WIPRO LIMITED AND SUBSIDIARIES
CONSOLIDATED STATEMENTS OF COMPREHENSIVE INCOME
(` in millions, except share and per share data, unless otherwise stated)
Year ended March 31,
Notes 2009 2010 2011 2011
Convenience
Translation
into US $
in millions
(Unaudited)
Refer note
2(iv)
Profit for the year ................................................................... 38,860 46,116 53,321 1,197
Other comprehensive income, net of taxes:
Foreign currency translation differences:
Translation difference relating to foreign
operations .................................................................
17 8,992 (5,522) 1,222 27
Net change in fair value of hedges of net
investment in foreign operations .....................
17 (7,427) 4,202 20 -
Net change in fair value of cash flow hedges ...... 15, 18 (13,436) 9,841 3,684 83
Net change in fair value of available for sale
investments .....................................................................
7, 18 (320) (50) 29 1
Total other comprehensive income, net of taxes ...... (12,191) 8,471 4,955 111
Total comprehensive income for the year .................... 26,669 54,587 58,276 1,308
Attributable to:
Equity holders of the Company ................................ 26,548 54,447 57,956 1,301
Non-controlling interest .............................................. 121 140 320 7
26,669 54,587 58,276 1,308
The accompanying notes form an integral part of these consolidated financial statements.

Consolidated Financial Statements Under IFRS
Wipro Limited 169
WIP
RO
LIM
ITE
D A
ND
SU
BS
IDIA
RIE
S
CO
NS
OL
IDA
TE
D S
TA
TE
ME
NT
S O
F C
HA
NG
ES
IN
EQ
UIT
Y
(` i
n m
illi
on
s, e
xce
pt
sha
re a
nd
pe
r sh
are
da
ta, u
nle
ss o
the
rwis
e s
tate
d)
Oth
er
com
po
ne
nts
of
eq
uit
y
No
. of
sha
res
Sh
are
cap
ita
l
Sh
are
pre
miu
m
Re
tain
ed
ea
rnin
gs
Sh
are
ba
sed
pa
ym
en
t
rese
rve
Fo
reig
n
curr
en
cy
tra
nsl
ati
on
rese
rve
Ca
sh
flo
w
he
dg
ing
rese
rve
Oth
er
rese
rve
Sh
are
s
he
ld b
y
con
tro
lle
d
Tru
st
Eq
uit
y
att
rib
uta
ble
to t
he
eq
uit
y
ho
lde
rs
of
the
Co
mp
an
y
No
n-
con
tro
llin
g
inte
rest
Tota
l
eq
uit
y
As
at
Ap
ril 1
, 20
08
......
......
......
......
......
......
......
......
......
......
......
......
......
......
.1
,46
1,4
53
,32
02
,92
32
5,3
73
94
,72
83
,14
9(1
0)
(1,0
97
)4
04
-1
25
,46
91
16
12
5,5
85
Ca
sh d
ivid
en
d p
aid
(in
clu
din
g d
ivid
en
d t
ax
the
reo
n) .
......
......
...-
--
(6,8
42
)-
--
--
(6,8
42
)-
(6,8
42
)
Issu
e o
f e
qu
ity
sha
res
on
exe
rcis
e o
f o
pti
on
s ....
......
......
......
......
.....
2,5
58
,62
35
1,3
67
-(1
,27
2)
--
--
10
0-
10
0
Pro
fit
for
the
ye
ar .
......
......
......
......
......
......
......
......
......
......
......
......
......
......
.-
--
38
,76
1-
--
--
38
,76
19
93
8,8
60
Oth
er
com
pre
he
nsi
ve in
com
e ...
......
......
......
......
......
......
......
......
......
....
--
--
-1
,54
3(1
3,4
36
)(3
20
)-
(12
,21
3)
22
(12
,19
1)
Sh
are
s is
sue
d a
nd
he
ld b
y co
ntr
olle
d t
rust
......
......
......
......
......
......
.9
68
,80
32
54
0-
--
--
(54
2)
--
-
Co
mp
en
sati
on
co
st r
ela
ted
to
em
plo
yee
sh
are
ba
sed
pay
me
nt.
......
......
......
......
......
......
......
......
......
......
......
......
......
......
......
......
......
--
--
1,8
68
--
--
1,8
68
-1
,86
8
As
at
Ma
rch
31
, 20
09
.....
......
......
......
......
......
......
......
......
......
......
......
......
..1
,46
4,9
80
,74
62
,93
02
7,2
80
12
6,6
46
3,7
45
1,5
33
(14
,53
3)
85
(54
2)
14
7,1
44
23
71
47
,38
1
As
at
Ap
ril 1
, 20
09
......
......
......
......
......
......
......
......
......
......
......
......
......
......
.1
,46
4,9
80
,74
62
,93
02
7,2
80
12
6,6
46
3,7
45
1,5
33
(14
,53
3)
85
(54
2)
14
7,1
44
23
71
47
,38
1
Ca
sh d
ivid
en
d p
aid
(in
clu
din
g d
ivid
en
d t
ax
the
reo
n...
......
......
...-
--
(6,7
88
)-
--
--
(6,7
88
)-
(6,7
88
)
Issu
e o
f e
qu
ity
sha
res
on
exe
rcis
e o
f o
pti
on
s. ...
......
......
......
......
.....
3,2
30
,44
36
1,9
08
(1,9
08
)-
--
-6
-6
Pro
fit
for
the
ye
ar .
......
......
......
......
......
......
......
......
......
......
......
......
......
......
.-
--
45
,93
1-
--
--
45
,93
11
85
46
,11
6
Oth
er
com
pre
he
nsi
ve in
com
e ...
......
......
......
......
......
......
......
......
......
....
--
--
-(1
,27
5)
9,8
41
(50
)-
8,5
16
(45
)8
,47
1
Infu
sio
n o
f ca
pit
al,
......
......
......
......
......
......
......
......
......
......
......
......
......
.....
--
--
--
--
--
60
60
Co
mp
en
sati
on
co
st r
ela
ted
to
em
plo
yee
sh
are
ba
sed
pay
me
nt.
......
......
......
......
......
......
......
......
......
......
......
......
......
......
......
......
......
--
--
1,3
02
--
--
1,3
02
-1
,30
2
As
at
Ma
rch
31
, 20
10
.....
......
......
......
......
......
......
......
......
......
......
......
......
..1
,46
8,2
11
,18
92
,93
62
9,1
88
16
5,7
89
3,1
40
25
8(4
,69
2)
35
(54
2)
19
6,1
12
43
71
96
,54
9

Consolidated Financial Statements Under IFRS
170 Annual Report 2010-11
WIP
RO
LIM
ITE
D A
ND
SU
BS
IDIA
RIE
S
CO
NS
OL
IDA
TE
D S
TA
TE
ME
NT
S O
F C
HA
NG
ES
IN
EQ
UIT
Y
(` i
n m
illi
on
s, e
xce
pt
sha
re a
nd
pe
r sh
are
da
ta, u
nle
ss o
the
rwis
e s
tate
d)
Oth
er
com
po
ne
nts
of
eq
uit
y
No
. of
sha
res
Sh
are
cap
ita
l
Sh
are
pre
miu
m
Re
tain
ed
ea
rnin
gs
Sh
are
ba
sed
pa
ym
en
t
rese
rve
Fo
reig
n
curr
en
cy
tra
nsl
ati
on
rese
rve
Ca
sh
flo
w
he
dg
ing
rese
rve
Oth
er
rese
rve
Sh
are
s
he
ld b
y
con
tro
lle
d
Tru
st
Eq
uit
y
att
rib
uta
ble
to t
he
eq
uit
y
ho
lde
rs
of
the
Co
mp
an
y
No
n-
con
tro
llin
g
inte
rest
Tota
l
eq
uit
y
As
at
Ap
ril 1
, 20
10
......
......
......
......
......
......
......
......
......
......
......
......
......
..1
,46
8,2
11
,18
92
,93
62
9,1
88
16
5,7
89
3,1
40
25
8(4
,69
2)
35
(54
2)
19
6,1
12
43
71
96
,54
9
Ca
sh d
ivid
en
d p
aid
(in
clu
din
g d
ivid
en
d t
ax
the
reo
n...
......
....
--
-(1
5,5
16
)-
--
--
(15
,51
6)
(66
)(1
5,5
82
)
Issu
e o
f sh
are
s in
fo
rm o
f st
ock
div
ide
nd
......
......
......
......
......
......
97
9,7
65
,12
41
,96
0(1
,96
0)
--
--
--
--
-
Issu
e o
f e
qu
ity
sha
res
on
exe
rcis
e o
f o
pti
on
s ....
......
......
......
......
6,4
32
,83
21
22
,89
6-
(2,8
72
)-
--
-3
6-
36
Pro
fit
for
the
ye
ar .
......
......
......
......
......
......
......
......
......
......
......
......
......
..-
--
52
,97
7-
--
--
52
,97
73
44
53
,32
1
Oth
er
com
pre
he
nsi
ve in
com
e ...
......
......
......
......
......
......
......
......
.....
--
--
-1
,26
63
,68
42
9-
4,9
79
(24
)4
,95
5
Co
mp
en
sati
on
co
st r
ela
ted
to
em
plo
ye
e s
ha
re b
ase
d
pay
me
nt.
......
......
......
......
......
......
......
......
......
......
......
......
......
......
......
......
.
--
--
1,0
92
--
--
1,0
92
-1
,09
2
As
at
Ma
rch
31
, 20
11
.....
......
......
......
......
......
......
......
......
......
......
......
...2
,45
4,4
09
,14
54
,90
83
0,1
24
20
3,2
50
1,3
60
1,5
24
(1,0
08
)6
4(5
42
)2
39
,68
06
91
24
0,3
71
Co
nve
nie
nce
tra
nsl
ati
on
in
to U
S $
in
mill
ion
s (U
na
ud
ite
d)
Re
fer
no
te 2
(iv
)
11
06
76
4,5
63
31
34
(23
)1
(12
)5
,38
11
65
,39
7
Th
e a
cco
mp
an
yin
g n
ote
s fo
rm a
n in
teg
ral p
art
of
the
se c
on
solid
ate
d fi
na
nci
al s
tate
me
nts

Consolidated Financial Statements Under IFRS
Wipro Limited 171
WIPRO LIMITED AND SUBSIDIARIES
CONSOLIDATED STATEMENTS OF CASH FLOWS
(` in millions, except share and per share date, unless otherwise stated)
Year ended March 31,2009 2010 2011 2011
Convenience
Translation into
US $ in millions
(Unaudited) Refer
note 2(iv)Cash flows from operating activities: Profit for the year .................................................................................. 38,860 46,116 53,321 1,197 Adjustments to reconcile profit for the year to net cash
generated from operating activities: Gain on sale of property, plant and equipment................. (28) (43) (131) (3) Depreciation and amortization ................................................ 6,948 7,831 8,211 184 Exchange (gain) / loss .................................................................. 3,728 (1,462) 1,036 23 Impact of cash flow/net investment hedging activities . (12,196) 6,017 4,389 99 Gain on sale of investments ...................................................... (681) (308) (192) (4) Share based compensation ....................................................... 1,868 1,302 1,092 25 Income tax expense ..................................................................... 6,035 9,294 9,714 218 Share of profits of equity accounted investees .................. (362) (530) (648) (15) Dividend and interest (income)/expenses, net .................. (1,331) (2,820) (5,684) (128) Changes in operating assets and liabilities: ............................ Trade receivables ................................................................... (8,024) (2,150) (10,699) (240) Unbilled revenues ................................................................. (5,594) (2,600) (7,441) (167) Inventories ............................................................................... (922) (218) (1,781) (40) Other assets ............................................................................. (1,663) (2,203) (5,451) (122) Trade payables and accrued expenses .......................... 12,260 (66) 5,840 131 Unearned revenues .............................................................. 2,465 (1,272) (867) (19) Other liabilities and provisions ......................................... 1,986 2,024 (979) (22) Cash generated from operating activities before taxes.......... 43,349 58,912 49,730 1,117 Income taxes paid, net ................................................................ (7,250) (7,914) (9,293) (209) Net cash generated from operating activities............................ 36,099 50,998 40,437 908Cash flows from investing activities: Expenditure on property, plant and equipment and
intangible assets ............................................................................ (16,746) (12,631) (12,211) (274) Proceeds from sale of property, plant and equipment ... 358 397 521 12 Purchase of available for sale investments .......................... (342,717) (340,891) (474,476) (10,653) Proceeds from sale of available for sale investments ....... 341,687 325,770 456,894 10,258 Investment in inter-corporate deposits ................................ (3,750) (10,750) (14,290) (321) Refund of inter-corporate deposits ........................................ - 4,950 20,100 451 Payment for business acquisitions, net of cash acquired .. (6,679) (4,399) (140) (3) Interest received ............................................................................ 1,398 2,297 3,960 89 Dividend received ......................................................................... 2,266 1,442 2,403 54 Net cash used in investing activities .............................................. (24,183) (33,815) (17,239) (387)Cash flows from financing activities: Proceeds from issuance of equity shares ............................. 100 6 25 1 Proceeds from issuance of equity shares by a subsidiary... - 60 - - Repayment of loans and borrowings..................................... (80,251) (55,661) (82,718) (1,857) Proceeds from loans and borrowings .................................... 86,121 63,011 72,596 1,630 Interest paid on loans and borrowings ................................. (2,400) (1,194) (696) (16) Payment of cash dividend (including dividend tax .........
thereon) ............................................................................................ (6,829) (6,823) (15,585) (350) Net cash used in financing activities ............................................. (3,259) (601) (26,378) (592) Net increase / (decrease) in cash and cash equivalents during the
year ............................................................................................................................ 8,657 16,582 (3,180) (71) Effect of exchange rate changes on cash and cash equivalents ... 663 (1,258) 523 12 Cash and cash equivalents at the beginning of the year ....... 38,912 48,232 63,556 1,427 Cash and cash equivalents at the end of the year (Note 10) ... 48,232 63,556 60,899 1,367
The accompanying notes form an integral part of these consolidated financial statements

Consolidated Financial Statements Under IFRS
172 Annual Report 2010-11
WIPRO LIMITED AND SUBSIDIARIES
NOTES TO THE CONSOLIDATED FINANCIAL STATEMENTS
(` in millions, except share and per share date, unless otherwise stated)
1. The Company overview:
Wipro Limited (“Wipro” or the ”Parent Company”), together with
its subsidiaries and equity accounted investees (collectively,
“the Company” or the “Group”) is a leading India based provider
of IT Services, including Business Process Outsourcing (“BPO”)
services, globally. Further, Wipro has other businesses such as
IT Products, Consumer Care and Lighting and Infrastructure
engineering.
Wipro is a public limited company incorporated and domiciled
in India. The address of its registered office is Wipro Limited,
Doddakannelli, Sarjapur Road, Bangalore - 560 035, Karnataka,
India. Wipro has its primary listing with Bombay Stock Exchange
and National Stock Exchange in India. The Company’s American
Depository Shares representing equity shares are also listed
on the New York Stock Exchange. These consolidated financial
statements were authorized for issue by Audit Committee on
June 16, 2011.
2. Basis of preparation of financial statements
(i) Statement of compliance:
The consolidated financial statements have been prepared in
accordance with International Financial Reporting Standards
and its interpretations (“IFRS”), as issued by the International
Accounting Standards Board (“IASB”).
(ii) Basis of preparation
These consolidated financial statements have been prepared in
compliance with International Financial Reporting Standards as
issued by the International Accounting Standard Board (IFRS).
Accounting policies have been applied consistently to all periods
presented in these financial statements.
The consolidated financial statements correspond to the
classification provisions contained in IAS 1(revised), “Presentation
of Financial Statements”. For clarity, various items are aggregated
in the statements of income and statements of financial position.
These items are disaggregated separately in the Notes to
the consolidated financial statements, where applicable. The
accounting policies have been consistently applied to all periods
presented in these consolidated financial statements.
All amounts included in the consolidated financial statements
are reported in millions of Indian rupees (` in millions) except
share and per share data, unless otherwise stated. Due to
rounding off, the numbers presented throughout the document
may not add up precisely to the totals and percentages may not
precisely reflect the absolute figures.
(iii) Basis of measurement
The consolidated financial statements have been prepared on a
historical cost convention and on an accrual basis, except for the
following material items that have been measured at fair value
as required by relevant IFRS:-
a. Derivative financial instruments; and
b. Available-for-sale financial assets;
(iv) Convenience translation (unaudited)
The accompanying consolidated financial statements have been
prepared and reported in Indian rupees, the national currency of
India. Solely for the convenience of the readers, the consolidated
financial statements as of and for the year ended March 31, 2011,
have been translated into United States dollars at the certified
foreign exchange rate of $ 1 = ` 44.54, as published by Federal
Reserve Board of New York on March 31, 2011. No representation
is made that the Indian rupee amounts have been, could have
been or could be converted into United States dollars at such a
rate or any other rate.
(v) Use of estimates and judgment
The preparation of the consolidated financial statements in
conformity with IFRSs requires management to make judgments,
estimates and assumptions that affect the application of
accounting policies and the reported amounts of assets,
liabilities, income and expenses. Actual results may differ from
those estimates.
Estimates and underlying assumptions are reviewed on a
periodic basis. Revisions to accounting estimates are recognized
in the period in which the estimates are revised and in any future
periods affected. In particular, information about significant
areas of estimation, uncertainty and critical judgments in
applying accounting policies that have the most significant
effect on the amounts recognized in the consolidated financial
statements is included in the following notes:
a) Revenue recognition: The Company uses the percentage of
completion method using the input (cost expended) method to
measure progress towards completion in respect of fixed price
contracts. Percentage of completion method accounting relies
on estimates of total expected contract revenue and costs. This
method is followed when reasonably dependable estimates
of the revenues and costs applicable to various elements of
the contract can be made. Key factors that are reviewed in
estimating the future costs to complete include estimates of
future labor costs and productivity efficiencies. Because the
financial reporting of these contracts depends on estimates
that are assessed continually during the term of these contracts,
recognized revenue and profit are subject to revisions as the
contract progresses to completion. When estimates indicate that
a loss will be incurred, the loss is provided for in the period in
which the loss becomes probable. To date, the Company has not
incurred a material loss on any fixed-price and fixed-timeframe
contract.

Consolidated Financial Statements Under IFRS
Wipro Limited 173
b) Goodwill: Goodwill is tested for impairment at least annually
and when events occur or changes in circumstances indicate that
the recoverable amount of the cash generating unit is less than
its carrying value. The recoverable amount of cash generating
units is determined based on higher of value-in-use and fair
value less cost to sell. The calculation involves use of significant
estimates and assumptions which includes revenue growth rates
and operating margins used to calculate projected future cash
flows, risk-adjusted discount rate, future economic and market
conditions.
c) Income taxes: The major tax jurisdictions for the Company
are India and the United States of America. Significant judgments
are involved in determining the provision for income taxes
including judgment on whether tax positions are probable of
being sustained in tax assessments. A tax assessment can involve
complex issues, which can only be resolved over extended
time periods. Though, the Company considers all these issues
in estimating income taxes, there could be an unfavorable
resolution of such issues.
d) Deferred taxes: Deferred tax is recorded on temporary
differences between the tax bases of assets and liabilities and
their carrying amounts, at the rates that have been enacted or
substantively enacted. The ultimate realization of deferred tax
assets is dependent upon the generation of future taxable profits
during the periods in which those temporary differences and tax
loss carry-forwards become deductible. The Company considers
the expected reversal of deferred tax liabilities and projected
future taxable income in making this assessment. The amount of
the deferred income tax assets considered realizable, however,
could be reduced in the near term if estimates of future taxable
income during the carry-forward period are reduced.
e) Business combination: In accounting for business
combination, judgment is required in identifying whether an
identifiable intangible asset is to be recorded separately from
goodwill. Additionally, estimating the acquisition date fair
value of the identifiable assets acquired and liabilities assumed
involves management judgment. These measurements are
based on information available at the acquisition date and are
based on expectations and assumptions that have been deemed
reasonable by management. Changes in these judgments,
estimates, and assumptions can materially affect the results of
operations.
f ) Other estimates: The preparation of financial statements
involves estimates and assumptions that affect the reported
amount of assets, liabilities, disclosure of contingent liabilities
at the date of financial statements and the reported amount of
revenues and expenses for the reporting period. Specifically, the
Company estimates the uncollectability of accounts receivable by
analyzing historical payment patterns, customer concentrations,
customer credit-worthiness and current economic trends. If
the financial condition of a customer deteriorates, additional
allowances may be required. Similarly, the Company provides
for inventory obsolescence, excess inventory and inventories
with carrying values in excess of net realizable value based
on assessment of the future demand, market conditions and
specific inventory management initiatives. If market conditions
and actual demands are less favorable than the Company’s
estimates, additional inventory provisions may be required. In all
cases inventory is carried at the lower of historical cost and net
realizable value. The stock compensation expense is determined
based on the Company’s estimate of equity instruments that will
eventually vest.
3. Significant accounting policies:
(i) Basis of consolidation:
Subsidiaries
The consolidated financial statements incorporate the financial
statements of the Parent Company and entities controlled by the
Parent Company (its subsidiaries). Control is achieved where the
Company has the power to govern the financial and operating
policies of an entity so as to obtain benefits from its activities.
In assessing control, potential voting rights that currently are
exercisable are taken into account.
All intra-company balances, transactions, income and expenses
including unrealized income or expenses are eliminated in full
on consolidation.
Equity accounted investees
Equity accounted investees are entities in respect of which, the
Company has significant influence, but not control, over the
financial and operating policies. Generally, a Company has a
significant influence if it holds between 20 and 50 percent of
the voting power of another entity. Investments in such entities
are accounted for using the equity method (equity accounted
investees) and are initially recognized at cost.
(ii) Functional and presentation currency
Items included in the consolidated financial statements of each
of the Company’s subsidiaries and equity accounted investees
are measured using the currency of the primary economic
environment in which these entities operate (i.e. the “functional
currency”). These consolidated financial statements are
presented in Indian Rupee, the national currency of India, which
is the functional currency of Wipro Limited and its domestic
subsidiaries and equity accounted investees.
(iii) Foreign currency transactions and translation
a) Transactions and balances
Transactions in foreign currency are translated into the respective
functional currencies using the exchange rates prevailing at the
dates of the transactions. Foreign exchange gains and losses
resulting from the settlement of such transactions and from the
translation at the exchange rates prevailing at reporting date of
monetary assets and liabilities denominated in foreign currencies
are recognized in the statement of income and reported within
foreign exchange gains/(losses), net within results of operating
activities. Gains/losses relating to translation or settlement
of borrowings denominated in foreign currency are reported
Consolidated Financial Statements Under IFRS
174 Annual Report 2010-11
within finance expense except foreign exchange gains/losses
on short-term borrowings, which are considered as a natural
economic hedge for the foreign currency monetary assets are
classified and reported within foreign exchange gains/(losses),
net within results from operating activities. Non monetary assets
and liabilities denominated in a foreign currency and measured
at historical cost are translated at the exchange rate prevalent
at the date of transaction.
b) Foreign operations
For the purpose of presenting consolidated financial statements,
the assets and liabilities of the Company’s foreign operations that
have local functional currency are translated into Indian Rupee
using exchange rates prevailing at the reporting date. Income
and expense items are translated at the average exchange rates
for the period. Exchange differences arising, if any, are recognized
in other comprehensive income and held in foreign currency
translation reserve (FCTR), a component of equity. When a
foreign operation is disposed of, the relevant amount recognized
in FCTR is transferred to the statement of income as part of the
profit or loss on disposal. Goodwill and fair value adjustments
arising on the acquisition of a foreign operation are treated as
assets and liabilities of the foreign operation and translated at
the exchange rate prevailing at the reporting date.
c) Others
Foreign currency differences arising on the translation or
settlement of a financial liability designated as a hedge of a
net investment in a foreign operation are recognized in other
comprehensive income and presented within equity in the FCTR
to the extent the hedge is effective. To the extent the hedge
is ineffective, such difference are recognized in statement of
income. When the hedged part of a net investment is disposed
of, the relevant amount recognized in FCTR is transferred
to the statement of income as part of the profit or loss on
disposal. Foreign currency differences arising from translation
of intercompany receivables or payables relating to foreign
operations, the settlement of which is neither planned nor likely
in the foreseeable future, are considered to form part of net
investment in foreign operation and are recognized in FCTR.
(iv) Financial Instruments
a) Non-derivative financial instruments
Non derivative financial instruments consist of:
- financial assets, which include cash and cash equivalents, trade receivables, unbilled revenues, finance lease receivables, employee and other advances, investments in equity and debt securities and eligible current and non-current assets;
- financial liabilities, which include long and short-term loans and borrowings, bank overdrafts, trade payable, eligible current liabilities and non-current liabilities.
Non derivative financial instruments are recognized initially at
fair value including any directly attributable transaction costs.
Financial assets are derecognized when substantial risks and
rewards of ownership of the financial asset have been transferred.
In cases where substantial risks and rewards of ownership of the
financial assets are neither transferred nor retained, financial
assets are derecognized only when the Company has not
retained control over the financial asset.
Subsequent to initial recognition, non derivative financial
instruments are measured as described below:
A. Cash and cash equivalents
The Company’s cash and cash equivalent consist of cash on
hand and in banks and demand deposits with banks, which
can be withdrawn at anytime, without prior notice or penalty
on the principal.
For the purposes of the cash flow statement, cash and cash
equivalents include cash on hand, in banks and demand deposits
with banks, net of outstanding bank overdrafts that are repayable
on demand and are considered part of the Company’s cash
management system.
B. Available-for-sale financial assets
The Company has classified investments in liquid mutual funds,
equity securities, other than equity accounted investees and
certain debt securities (primarily certificate of deposits with
banks) as available-for-sale financial assets. These investments
are measured at fair value and changes therein are recognized
in other comprehensive income and presented within equity.
The impairment losses, if any, are reclassified from equity into
statement of income. When an available-for-sale financial asset
is derecognized, the related cumulative gain or loss in equity is
transferred to statement of income.
C. Others
Other non-derivative financial instruments are measured at
amortized cost using the effective interest method, less any
impairment losses.
b) Derivative financial instruments
The Company is exposed to foreign currency fluctuations on
foreign currency assets, liabilities, net investment in foreign
operations and forecasted cash flows denominated in foreign
currency.
The Company limits the effect of foreign exchange rate
fluctuations by following established risk management policies
including the use of derivatives. The Company enters into
derivative financial instruments where the counterparty is a
bank.
Derivatives are recognized and measured at fair value.
Attributable transaction cost are recognized in statement of
income as cost.
A. Cash flow hedges
Changes in the fair value of the derivative hedging instrument
designated as a cash flow hedge are recognized in other
comprehensive income and held in cash flow hedging reserve,

Consolidated Financial Statements Under IFRS
Wipro Limited 175
a component of equity to the extent that the hedge is effective.
To the extent that the hedge is ineffective, changes in fair value
are recognized in the statement of income. If the hedging
instrument no longer meets the criteria for hedge accounting,
expires or is sold, terminated or exercised, then hedge
accounting is discontinued prospectively. The cumulative gain
or loss previously recognized in the cash flow hedging reserve is
transferred to the statement of income upon the occurrence of
the related forecasted transaction. If the forecasted transaction
is no longer expected to occur, such cumulative balance is
immediately recognized in the statement of income.
B. Hedges of net investment in foreign operations
The Company designates derivative financial instruments as
hedges of net investments in foreign operations. The Company has
also designated a combination of foreign currency denominated
borrowings and related cross-currency swaps as a hedge of net
investment in foreign operations. Changes in the fair value of the
derivative hedging instruments and gains/losses on translation
or settlement of foreign currency denominated borrowings
designated as a hedge of net investment in foreign operations are
recognized in other comprehensive income and within equity in
the FCTR to the extent that the hedge is effective.
C. Others
Changes in fair value of foreign currency derivative instruments
not designated as cash flow hedges or hedges of net investment
in foreign operations and the ineffective portion of cash flow
hedges are recognized in the statement of income and reported
within foreign exchange gains/(losses), net within results from
operating activities.
Changes in fair value and gains/(losses) on settlement of foreign
currency derivative instruments relating to borrowings, which
have not been designated as hedges are recorded in finance
expense.
(v) Equity and share capital
a) Share capital and share premium
The Company has only one class of equity shares. The authorized
share capital of the Company is 2,650,000,000 equity shares, par
value ` 2 per share. Par value of the equity shares is recorded as
share capital and the amount received in excess of par value is
classified as share premium.
Every holder of the equity shares, as reflected in the records of the
Company as of the date of the shareholder meeting shall have
one vote in respect of each share held for all matters submitted
to vote in the shareholder meeting.
b) Shares held by controlled trust (Treasury shares):
The Company’s equity shares held by the controlled trust, which
is consolidated as a part of the Group are classified as Treasury
Shares. The Company has 8,930,563 and 14,884,272 treasury
shares as of March 31, 2010 and 2011, respectively. Treasury
shares are recorded at acquisition cost.
c) Retained earnings
Retained earnings comprises of the Company’s prior years’
undistributed earnings after taxes. A portion of these earnings
amounting to ` 1,144 is not freely available for distribution.
d) Share based payment reserve
The share based payment reserve is used to record the value
of equity-settled share based payment transactions with
employees. The amounts recorded in share based payment
reserve are transferred to share premium upon exercise of stock
options by employees.
e) Cash flow hedging reserve
Changes in fair value of derivative hedging instruments
designated and effective as a cash flow hedge are recognized
in other comprehensive income (net of taxes), and presented
within equity in the cash flow hedging reserve.
f ) Foreign currency translation reserve
The exchange difference arising from the translation of financial
statements of foreign subsidiaries, differences arising from
translation of intercompany receivables or payables relating
to foreign operations, changes in fair value of the derivative
hedging instruments and gains/losses on translation or
settlement of foreign currency denominated borrowings
designated as hedge of net investment in foreign operations
are recognized in other comprehensive income, and presented
within equity in the FCTR.
g) Other reserve
Changes in the fair value of available-for-sale financial assets is
recognized in other comprehensive income (net of taxes), and
presented within equity in other reserve.
h) Dividend
A final dividend, including tax thereon, on common stock is
recorded as a liability on the date of approval by the shareholders.
An interim dividend, including tax thereon, is recorded as a
liability on the date of declaration by the board of directors.
(vi) Property, plant and equipment:
a) Recognition and measurement
Property, plant and equipment are measured at cost less
accumulated depreciation and impairment losses, if any. Cost
includes expenditures directly attributable to the acquisition
of the asset. Borrowing costs directly attributable to the
construction or production of a qualifying asset are capitalized
as part of the cost.
b) Depreciation
The Company depreciates property, plant and equipment over
the estimated useful life on a straight-line basis from the date
the assets are available for use. Assets acquired under finance
lease and leasehold improvements are amortized over the
shorter of estimated useful life of the asset or the related lease

Consolidated Financial Statements Under IFRS
176 Annual Report 2010-11
term. The estimated useful life of assets are reviewed and where
appropriate are adjusted, annually. The estimated useful lives of
assets for the current and comparative period are as follows:
Category Useful life
Buildings 30 to 60 years
Plant and machinery 2 to 21 years
Computer equipment and software 2 to 6 years
Furniture, fixtures and equipment 3 to 10 years
Vehicles 4 years
When parts of an item of property, plant and equipment
have different useful lives, they are accounted for as separate
items (major components) of property, plant and equipment.
Subsequent expenditure relating to property, plant and
equipment is capitalized only when it is probable that future
economic benefits associated with these will flow to the
Company and the cost of the item can be measured reliably.
Deposits and advances paid towards the acquisition of property,
plant and equipment outstanding as of each reporting date
and the cost of property, plant and equipment not available
for use before such date are disclosed under capital work- in-
progress.
(vii) Business combination, Goodwill and Intangible assets:
Business combinations are accounted for using the purchase
(acquisition) method. The cost of an acquisition is measured
as the fair value of the assets given, equity instruments issued
and liabilities incurred or assumed at the date of exchange. The
cost of acquisition also includes the fair value of any contingent
consideration. Identifiable assets acquired and liabilities and
contingent liabilities assumed in a business combination
are measured initially at fair value at the date of acquisition.
Transaction costs incurred in connection with a business
combination are expensed as incurred.
a) Goodwill
The excess of the cost of acquisition over the Company’s share in
the fair value of the acquiree’s identifiable assets, liabilities and
contingent liabilities is recognized as goodwill. If the excess is
negative, a bargain purchase gain is recognized immediately in
the statement of income.
b) Intangible assets
Intangible assets acquired separately are measured at cost of
acquisition. Intangible assets acquired in a business combination
are measured at fair value as at the date of acquisition. Following
initial recognition, intangible assets are carried at cost less any
accumulated amortization and impairment losses, if any.
The amortization of an intangible asset with a finite useful life
reflects the manner in which the economic benefit is expected
to be generated and consumed. Intangible assets with indefinite
lives comprising of brands are not amortized, but instead
tested for impairment at least annually and written down to the
recoverable amount as required.
The estimated useful life of finite useful life intangibles are
reviewed and where appropriate are adjusted, annually. The
estimated useful lives of the amortizable intangible assets for
the current and comparative periods are as follows:
Category Useful life
Customer-related intangibles 2 to 11 years
Marketing related intangibles 20 to 30 years
(viii) Leases
a) Arrangements where the Company is the lessee
Leases of property, plant and equipment, where the Company
assumes substantially all the risks and rewards of ownership are
classified as finance leases. Finance leases are capitalized at the
lower of the fair value of the leased property and the present
value of the minimum lease payments. Lease payments are
apportioned between the finance charge and the outstanding
liability. The finance charge is allocated to periods during the
lease term at a constant periodic rate of interest on the remaining
balance of the liability.
Leases where the lessor retains substantially all the risks and
rewards of ownership are classified as operating leases. Payments
made under operating leases are recognized in the statement of
income on a straight-line basis over the lease term.
b) Arrangements where the Company is the lessor
In certain arrangements, the Company recognizes revenue
from the sale of products given under finance leases. The
Company records gross finance receivables, unearned income
and the estimated residual value of the leased equipment on
consummation of such leases. Unearned income represents the
excess of the gross finance lease receivable plus the estimated
residual value over the sales price of the equipment. The
Company recognises unearned income as financing revenue
over the lease term using the effective interest method.
(ix) Inventories
Inventories are valued at lower of cost and net realizable
value, including necessary provision for obsolescence. Cost is
determined using the weighted average method.
(x) Impairment
a) Financial assets:
The Company assesses at each reporting date whether there
is any objective evidence that a financial asset or a group of
financial assets is impaired. If any such indication exists, the
Company estimates the amount of impairment loss.
A. Loans and receivables
Impairment losses on trade and other receivables are recognized
using separate allowance accounts. Refer Note 2 (v) for further
information regarding the determination of impairment.

Consolidated Financial Statements Under IFRS
Wipro Limited 177
B. Available for sale financial asset
When the fair value of available-for-sale financial assets declines
below acquisition cost and there is objective evidence that the
asset is impaired, the cumulative loss that has been recognized
in other comprehensive income, a component of equity in other
reserve is transferred to the statement of income. An impairment
loss may be reversed in subsequent periods, if the indicators for
the impairment no longer exist. Such reversals are recognized
in other comprehensive income.
b) Non financial assets
The Company assesses long-lived assets, such as property,
plant, equipment and acquired intangible assets for impairment
whenever events or changes in circumstances indicate that
the carrying amount of an asset or group of assets may not
be recoverable. If any such indication exists, the Company
estimates the recoverable amount of the asset. The recoverable
amount of an asset or cash generating unit is the higher of its
fair value less cost to sell (FVLCTS) and its value-in-use (VIU). If
the recoverable amount of the asset or the recoverable amount
of the cash generating unit to which the asset belongs is less
than its carrying amount, the carrying amount is reduced to its
recoverable amount. The reduction is treated as an impairment
loss and is recognized in the statement of income. If at the
reporting date there is an indication that a previously assessed
impairment loss no longer exists, the recoverable amount is
reassessed and the impairment losses previously recognized
are reversed such that the asset is recognized at its recoverable
amount but not exceeding written down value which would
have been reported if the impairment losses had not been
recognized initially.
Intangible assets with indefinite lives comprising of brands
are not amortized, but instead tested for impairment at least
annually at the same time and written down to the recoverable
amount as required.
Goodwill is tested for impairment at least annually at the same
time and when events occur or changes in circumstances
indicate that the recoverable amount of the cash generating
unit is less than its carrying value. The goodwill impairment test
is performed at the level of cash-generating unit or groups of
cash-generating units which represent the lowest level at which
goodwill is monitored for internal management purposes. An
impairment in respect of goodwill is not reversed.
(xi) Employee Benefit
a) Post-employment and pension plans
The Group participates in various employee benefit plans.
Pensions and other post-employment benefits are classified as
either defined contribution plans or defined benefit plans. Under
a defined contribution plan, the Company’s only obligation
is to pay a fixed amount with no obligation to pay further
contributions if the fund does not hold sufficient assets to pay
all employee benefits. The related actuarial and investment risks
fall on the employee. The expenditure for defined contribution
plans is recognized as expense during the period when the
employee provides service. Under a defined benefit plan, it is
the Company’s obligation to provide agreed benefits to the
employees. The related actuarial and investment risks fall on the
Company. The present value of the defined benefit obligations
is calculated using the projected unit credit method.
The company has the following employee benefit plans:
A. Provident fund
Employees receive benefits from a provident fund. The employer
and employees each make periodic contributions to the plan. A
portion of the contribution is made to the approved provident
fund trust managed by the Company; while the remainder of the
contribution is made to the government administered pension
fund. The Company is generally liable for any shortfall in the
fund assets based on the government specified minimum rates
of return or pension and recognizes such shortfall, if any, as an
expense in the year it is incurred.
B. Superannuation
Superannuation plan, a defined contribution scheme is
administered by Life Insurance Corporation of India and ICICI
Prudential Insurance Company Limited. The Company makes
annual contributions based on a specified percentage of each
eligible employee’s salary.
C. Gratuity
In accordance with the Payment of Gratuity Act, 1972, the
Company provides for a lump sum payment to eligible
employees, at retirement or termination of employment based
on the last drawn salary and years of employment with the
Company. The gratuity fund is managed by the Life Insurance
Corporation of India (LIC), HDFC Standard Life, TATA AIG and
Birla Sun-life. The Company’s obligation in respect of the gratuity
plan, which is a defined benefit plan, is provided for based on
actuarial valuation using the projected unit credit method. The
Company recognizes actuarial gains and losses immediately in
the statement of income.
b) Termination benefits
Termination benefits are recognized as an expense when
the Company is demonstrably committed, without realistic
possibility of withdrawal, to a formal detailed plan to terminate
employment before the normal retirement date, or to provide
termination benefit as a result of an offer made to encourage
voluntary redundancy.
c) Short-term benefits
Short-term employee benefit obligations are measured on an
undiscounted basis and are recorded as expense as the related
service is provided. A liability is recognized for the amount
expected to be paid under short-term cash bonus or profit-
sharing plans, if the Company has a present legal or constructive
obligation to pay this amount as a result of past service provided
by the employee and the obligation can be estimated reliably.

Consolidated Financial Statements Under IFRS
178 Annual Report 2010-11
d) Compensated absences
The employees of the Company are entitled to compensated
absences. The employees can carry forward a portion of the
unutilised accumulating compensated absences and utilise it
in future periods or receive cash at retirement or termination
of employment. The Company records an obligation for
compensated absences in the period in which the employee
renders the services that increases this entitlement. The Company
measures the expected cost of compensated absences as the
additional amount that the Company expects to pay as a result
of the unused entitlement that has accumulated at the end of
the reporting period. The Company recognizes accumulated
compensated absences based on actuarial valuation. Non-
accumulating compensated absences are recognized in the period
in which the absences occur. The Company recognizes actuarial
gains and losses immediately in the statement of income.
(xii) Share based payment transaction
Employees of the Company receive remuneration in the form of
equity settled instruments, for rendering services over a defined
vesting period. Equity instruments granted are measured
by reference to the fair value of the instrument at the date
of grant. In cases, where equity instruments are granted at a
nominal exercise price, the intrinsic value on the date of grant
approximates the fair value. The expense is recognized in the
statement of income with a corresponding increase to the share
based payment reserve, a component of equity.
The equity instruments generally vest in a graded manner over
the vesting period. The fair value determined at the grant date is
expensed over the vesting period of the respective tranches of
such grants (accelerated amortization). The stock compensation
expense is determined based on the Company’s estimate of
equity instruments that will eventually vest.
(xiii) Provisions
Provisions are recognized when the Company has a present
obligation (legal or constructive) as a result of a past event, it is
probable that an outflow of economic benefits will be required
to settle the obligation, and a reliable estimate can be made of
the amount of the obligation.
The amount recognized as a provision is the best estimate of
the consideration required to settle the present obligation at
the end of the reporting period, taking into account the risks
and uncertainties surrounding the obligation.
When some or all of the economic benefits required to settle a
provision are expected to be recovered from a third party, the
receivable is recognized as an asset, if it is virtually certain that
reimbursement will be received and the amount of the receivable
can be measured reliably.
Provisions for onerous contracts are recognized when the
expected benefits to be derived by the Group from a contract
are lower than the unavoidable costs of meeting the future
obligations under the contract. Provisions for onerous contracts
are measured at the present value of lower of the expected
net cost of fulfilling the contract and the expected cost of
terminating the contract.
(xiv) Revenue
The Company derives revenue primarily from software
development and related services, BPO services, sale of IT and
other products.
a) Services
The Company recognizes revenue when the significant terms of
the arrangement are enforceable, services have been delivered
and the collectability is reasonably assured. The method for
recognizing revenues and costs depends on the nature of the
services rendered:
A. Time and materials contracts
Revenues and costs relating to time and materials contracts are
recognized as the related services are rendered.
B. Fixed-price contracts
Revenues from fixed-price contracts, including systems
development and integration contracts are recognized using
the “percentage-of-completion” method. Percentage of
completion is determined based on project costs incurred to
date as a percentage of total estimated project costs required
to complete the project. The cost expended (or input) method
has been used to measure progress towards completion as
there is a direct relationship between input and productivity.
If the Company does not have a sufficient basis to measure
the progress of completion or to estimate the total contract
revenues and costs, revenue is recognized only to the extent
of contract cost incurred for which recoverability is probable.
When total cost estimates exceed revenues in an arrangement,
the estimated losses are recognized in the statement of income
in the period in which such losses become probable based on
the current contract estimates.
‘Unbilled revenues’ represent cost and earnings in excess of
billings as at the end of the reporting period. ‘Unearned revenues’
represent billing in excess of revenue recognized. Advance
payments received from customers for which no services are
rendered are presented as ‘Advance from customers’.
C. Maintenance contracts
Revenue from maintenance contracts is recognized ratably over
the period of the contract using the percentage of completion
method. When services are performed through an indefinite
number of repetitive acts over a specified period of time,
revenue is recognized on a straight line basis over the specified
period under some other method better represents the stage
of completion.
b) Products
Revenue from products are recognized when the significant
risks and rewards of ownership have transferred to the buyer,

Consolidated Financial Statements Under IFRS
Wipro Limited 179
continuing managerial involvement usually associated with
ownership and effective control have ceased, the amount of
revenue can be measured reliably, it is probable that economic
benefits associated with the transaction will flow to the Company
and the costs incurred or to be incurred in respect of the
transaction can be measured reliably.
c) Multiple element arrangements
Revenue from contracts with multiple-element arrangements
are recognized using the guidance in IAS 18, Revenue. The
Company allocates the arrangement consideration to separately
identifiable components based on their relative fair values
or on the residual method. Fair values are determined based
on sale prices for the components when it is regularly sold
separately, third-party prices for similar components or cost
plus, an appropriate business-specific profit margin related to
the relevant component.
d) Others
The Company accounts for volume discounts and pricing
incentives to customers by reducing the amount of revenue
recognized at the time of sale.
Revenues are shown net of sales tax, value added tax, service
tax and applicable discounts and allowances. Revenue includes
excise duty.
The Company accrues the estimated cost of warranties at the
time when the revenue is recognized. The accruals are based
on the Company’s historical experience of material usage and
service delivery costs.
(xv) Finance expense
Finance expense comprise interest cost on borrowings,
impairment losses recognized on financial assets, gains / losses
on translation or settlement of foreign currency borrowings and
changes in fair value and gains / losses on settlement of related
derivative instruments except foreign exchange gains/(losses),
net on short-term borrowings which are considered as a natural
economic hedge for the foreign currency monetary assets which
are classified as foreign exchange gains/(losses), net within
results from operating activities. Borrowing costs that are not
directly attributable to a qualifying asset are recognized in the
statement of income using the effective interest method.
(xvi) Finance and other income
Finance and other income comprises interest income on deposits,
dividend income and gains / losses on disposal of available-for-
sale financial assets. Interest income is recognized using the
effective interest method. Dividend income is recognized when
the right to receive payment is established.
(xvii) Income tax
Income tax comprises current and deferred tax. Income tax
expense is recognized in the statement of income except to
the extent it relates to a business combination, or items directly
recognized in equity or in other comprehensive income.
a) Current income tax
Current income tax for the current and prior periods are
measured at the amount expected to be recovered from or
paid to the taxation authorities based on the taxable income
for the period. The tax rates and tax laws used to compute the
current tax amount are those that are enacted or substantively
enacted by the reporting date and applicable for the period. The
Company offsets current tax assets and current tax liabilities,
where it has a legally enforceable right to set off the recognized
amounts and where it intends either to settle on a net basis, or
to realize the asset and liability simultaneously.
b) Deferred income tax
Deferred income tax is recognized using the balance sheet
approach. Deferred income tax assets and liabilities are
recognized for deductible and taxable temporary differences
arising between the tax base of assets and liabilities and
their carrying amount in financial statements, except when
the deferred income tax arises from the initial recognition of
goodwill or an asset or liability in a transaction that is not a
business combination and affects neither accounting nor taxable
profits or loss at the time of the transaction.
Deferred income tax asset are recognized to the extent that it
is probable that taxable profit will be available against which
the deductible temporary differences, and the carry forward of
unused tax credits and unused tax losses can be utilized.
Deferred income tax liabilities are recognized for all taxable
temporary differences except in respect of taxable temporary
differences associated with investments in subsidiaries,
associates and foreign branches where the timing of the reversal
of the temporary difference can be controlled and it is probable
that the temporary difference will not reverse in the foreseeable
future.
The carrying amount of deferred income tax assets is reviewed at
each reporting date and reduced to the extent that it is no longer
probable that sufficient taxable profit will be available to allow
all or part of the deferred income tax asset to be utilized.
Deferred income tax assets and liabilities are measured at the
tax rates that are expected to apply in the period when the asset
is realized or the liability is settled, based on tax rates (and tax
laws) that have been enacted or substantively enacted at the
reporting date.
(xviii) Earnings per share
Basic earnings per share is computed using the weighted average
number of equity shares outstanding during the period adjusted
for treasury shares held. Diluted earnings per share is computed
using the weighted-average number of equity and dilutive
equivalent shares outstanding during the period, using the
treasury stock method for options and warrants, except where
the results would be anti-dilutive.

Consolidated Financial Statements Under IFRS
180 Annual Report 2010-11
New Accounting standards adopted by the Company:
The Company adopted IFRS 3, “Business Combinations” (“IFRS
3,( 2008)”) and IAS 27, “Consolidated and Separate Financial
Statements” (“IAS 27, (2008)”) effective April 1, 2010. The
revisions result in several changes in the accounting for business
combinations. Major changes relate to the measurement of non-
controlling interests, the accounting for business combinations
achieved in stages as well as the treatment of contingent
consideration and acquisition-related costs. Based on the new
standard, non- controlling interests may be measured at their
fair value (full-goodwill-methodology) or at the proportional
fair value of assets acquired and liabilities assumed. In respect of
business combinations achieved in stages, any previously held
equity interest in the acquiree is re-measured to its acquisition
date fair value. Any changes to contingent consideration
classified as a liability at the acquisition date are recognized in
the statement of income. Acquisition-related costs are expensed
in the period incurred. Adoption of IFRS 3 (2008) and IAS 27,
(2008), did not have a material effect on these consolidated
financial statements.
The Company adopted an amendment to IAS 39, “Financial
Instruments: Recognition and Measurement: Eligible Hedged
Items” (“amendment to IAS 39”) effective April 1, 2010. The
amendment addresses the designation of a one-sided risk in a
hedged item in particular situations. The amendment applies to
hedging relationships within the scope of IAS 39. Adoption of this
amendment did not have a material effect on these consolidated
financial statements.
New Accounting standards not yet adopted by the Company:
In November 2009, the IASB issued an amendment to IAS 24
(revised 2009) “Related Party Disclosures” (“IAS 24”). The purpose
of the revision is to simplify the definition of a related party,
clarifying its intended meaning and eliminating inconsistencies
from the definition. The revision is effective for fiscal years
beginning on or after January 1, 2011. Earlier application
is permitted. The Company is evaluating the impact, these
amendments will have on the Company’s consolidated financial
statements.
In November 2009, the IASB issued IFRS 9 “Financial Instruments
on the classification and measurement of financial assets”. The
new standard represents the first part of a three-part project
to replace IAS 39 Financial Instruments: Recognition and
Measurement (IAS 39) with IFRS 9 Financial Instruments (IFRS 9).
IFRS 9 uses a single approach to determine whether a financial
asset is measured at amortized cost or fair value, replacing the
many different rules in IAS 39. The approach in IFRS 9 is based
on how an entity manages its financial instruments (its business
model) and the contractual cash flow characteristics of the
financial assets. IFRS 9 is effective for fiscal years beginning on
or after January 1, 2013. Earlier application is permitted. The
Company is evaluating the impact, these amendments will have
on the Company’s consolidated financial statements.
In October 2010, the IASB issued an amendment to IFRS 7
“Disclosures – Transfers of financial assets”. The purpose of the
amendment is to enhance the existing disclosures in IFRS 7 when
an asset is transferred but is not derecognized and introduce
new disclosures for assets that are derecognized but the entity
continues to have a continuing exposure to the asset after the
sale. The amendment is effective for fiscal years beginning on or
after July 1, 2011. Earlier application is permitted. The Company
is evaluating the impact, these amendment will have on the
Company’s consolidated financial statements.
In May 2010, the IASB issued “Improvements to IFRSs (2010
Improvements)” — a collection of eleven amendments to
six International Financial Reporting Standards and to one
interpretation — as part of its program of annual improvements
to its standards, which is intended to make necessary, but non-
urgent, amendments to standards that will not be included
as part of another major project. The amendments resulting
from this standard are mainly applicable to the Company from
fiscal year beginning on or after January 1, 2011. The Company
is evaluating the impact, these amendments will have on the
Company’s consolidated financial statements.

Consolidated Financial Statements Under IFRS
Wipro Limited 181
4. Property, plant and equipment
Land Buildings Plant and
machinery*
Furniture
fixtures and
equipment
Vehicles Total
Gross carrying value:
As at April 1, 2009 ` 2,740 ` 15,384 ` 41,623 ` 8,113 ` 2,853 ` 70,713
Translation adjustment (6) (130) (1,126) (49) (4) (1,315)
Additions 60 4,160 6,744 1,959 459 13,382
Acquisition through business combination - - 6 9 2 17
Disposal / adjustments - (55) (590) (177) (381) (1,203)
As at March 31, 2010 ` 2,794 ` 19,359 ` 46,657 ` 9,855 ` 2,929 ` 81,594
Accumulated depreciation/impairment:
As at April 1, 2009 ` - ` 1,631 ` 26,728 ` 4,539 ` 1,748 ` 34,646
Translation adjustment - (58) (716) (30) 7 (797)
Depreciation - 426 5,329 1,106 512 7,373
Disposal / adjustments - (1) (346) (118) (263) (728)
As at March 31, 2010 ` - ` 1,998 ` 30,995 ` 5,497 ` 2,004 ` 40,494
Capital work-in-progress 12,358
Net carrying value as at March 31, 2010 ` 53,458
Gross carrying value:
As at April 1, 2010 ` 2,794 ` 19,359 ` 46,657 ` 9,855 ` 2,929 ` 81,594
Translation adjustment 17 117 337 68 11 550
Additions 943 3,533 8,360 1,692 117 14,645
Disposal / adjustments - (41) (1,145) (591) (458) (2,235)
As at March 31, 2011 ` 3,754 ` 22,968 ` 54,209 ` 11,024 ` 2,599 ` 94,554
Accumulated depreciation/impairment:
As at April 1, 2010 ` - ` 1,998 ` 30,995 ` 5,497 ` 2,004 ` 40,494
Translation adjustment - 50 231 45 14 340
Depreciation - 493 5,500 1,271 455 7,719
Disposal / adjustments - (39) (1,077) (375) (354) (1,845)
As at March 31, 2011 ` - ` 2,502 ` 35,649 ` 6,438 ` 2,119 ` 46,708
Capital work-in-progress 7,248
Net carrying value as at March 31, 2011 ` 55,094
*Including net carrying value of computer equipment and software amounting to ` 2,928 and ` 4,397 as at March 31, 2010 and
2011, respectively.
Interest capitalized by the Company was ` 95 and ` 66 for
the year ended March 31, 2010 and 2011, respectively. The
capitalization rate used to determine the amount of borrowing
cost capitalized for the year ended March 31, 2010 and 2011 are
4.32% and 4.23%, respectively.
5. Goodwill and Intangible assets
The movement in goodwill balance is given below
Year ended March 31,2010 2011
Balance at the beginning of the year ` 56,143 ` 53,802Translation adjustment (4,917) 962Acquisition through business
combination, net
2,576 54
Balance at the end of the year ` 53,802 ` 54,818
The Company has recognized additional goodwill on account of
earn-out consideration (contingent consideration) amounting
to ` 1,624 and ` 54 during the year ended March 31, 2010 and
2011, respectively.
Goodwill as at March 31, 2010 and 2011 has been allocated to
the following reportable segments:
Segment As at March 31,2010 2011
IT Services ` 39,056 ` 39,098IT Products 476 472Consumer Care and Lighting 12,670 13,475Others 1,600 1,773Total ` 53,802 ` 54,818
The goodwill held in the Infocrossing, Healthcare and Unza cash
generating units (CGU) are considered significant in comparison
to the total carrying amount of goodwill as at March 31, 2011.
The goodwill held in these CGUs are as follows:
CGUs As at March 31, 2011
Infocrossing ` 11,592
Healthcare 9,959
Unza 12,492

Consolidated Financial Statements Under IFRS
182 Annual Report 2010-11
The movement in intangible assets is given below:
Intangible assets
Customer related Marketing related Total
Gross carrying value:
As at April 1, 2009 ` 1,629 ` 2,911 ` 4,540
Translation Adjustment (19) (174) (193)
Acquisition through business combination 322 691 1,013
Additions - 36 36
As at March 31, 2010 ` 1,932 ` 3,464 ` 5,396
Accumulated amortization and impairment:
As at April 1, 2009 ` 91 ` 956 ` 1,047
Translation adjustment - (48) (48)
Amortization 301 85 386
As at March 31, 2010 ` 392 ` 993 ` 1,385
Net carrying value as at March 31, 2010 ` 1,540 ` 2,471 ` 4,011
Gross carrying value:
As at April 1, 2010 ` 1,932 ` 3,464 ` 5,396
Translation adjustment 11 (105) (94)
Additions - 36 36
As at March 31, 2011 ` 1,943 ` 3,395 ` 5,338
Accumulated amortization and impairment:
As at April 1, 2010 ` 392 ` 993 ` 1,385
Translation adjustment - (48) (48)
Amortization 341 109 450
As at March 31, 2011 ` 733 ` 1,054 ` 1,787
Net carrying value as at March 31, 2011 ` 1,210 ` 2,341 ` 3,551
Net carrying value of marketing-related intangibles includes
indefinite life intangible assets (brands and trade-marks) of
` 691 and ` 660 as of March 31, 2010 and 2011, respectively.
The assessment of marketing-related intangibles (brands
and trade-marks) that have an indefinite life were based on
a number of factors, including the competitive environment,
market share, brand history, product life cycles, operating plan
and macroeconomic environment of the geographies in which
these brands operate.
Amortization expense on intangible assets is included in selling
and marketing expenses in the statement of income.
As of March 31, 2011, the estimated remaining amortization
period for customer-related intangibles acquired on acquisition
of Citi Technology Services Limited is approximately 3.75 years
and the estimated remaining amortization period for customer-
related intangibles acquired on acquisition of Lornamead is
approximately 9 years.
Goodwill and Indefinite life intangible were tested for
impairment annually in accordance with the Company’s
procedure for determining the recoverable value of such assets.
For the purpose of impairment testing, goodwill is allocated to
a CGU representing the lowest level within the Group at which
goodwill is monitored for internal management purposes,
and which is not higher than the Group’s operating segment.
The useful life of the trademark and brand in respect of the
acquired Wipro Yardley FZE (Formerly known as Lornamead
FZE) and Wipro Yardley Consumer Care Private Limited (Formerly
known as Lornamead Personal Care Private Limited) has been
determined to be indefinite life intangible assets. For the purpose
of impairment testing, indefinite life intangible are allocated to
the Yardley businesses. The recoverable amount of the CGU is
the higher of its FVLCTS and its VIU. The FVLCTS of the CGU is
determined based on the market capitalization approach, using
the turnover and earnings multiples derived from observed
market data. The VIU is determined based on discounted cash
flow projections. Key assumptions on which the Company has
based its determination of VIUs include:
a) Estimated cash flows for five years based on formal/
approved internal management budgets with extrapolation for
the remaining period, wherever such budgets were shorter than
5 years period.
b) Terminal value arrived by extrapolating last forecasted year
cash flows to perpetuity using long-term growth rates: [2.5%-6%].
These long-term growth rates takes into consideration external
macroeconomic sources of data. Such long-term growth rate
considered does not exceed that of the relevant business and
industry sector.

Consolidated Financial Statements Under IFRS
Wipro Limited 183
c) The discount rates used are based on the Company’s
weighted average cost of capital as an approximation of the
weighted average cost of capital of a comparable market
participant, which are adjusted for specific country risks
[10%-17%].
d) Value-in-use is calculated using after tax assumptions. The
use of after tax assumptions does not result in a value-in-use that
is materially different from the value-in-use that would result if
the calculation was performed using before tax assumptions.
The after tax discount rate used ranges from [10% - 17%]. The
before tax discount rate is determined based on the value-in-use
derived from the use of after tax assumptions, and ranges from
[12.3% - 19.5%].
Based on the above, no impairment was identified as of March
31, 2011 as the recoverable value of the CGUs exceeded the
carrying value. Further, none of the CGU’s tested for impairment
as of March 31, 2011 were at risk of impairment. An analysis of
the calculation’s sensitivity to a change in the key parameters
(Revenue growth, operating margin, discount rate and long-term
growth rate) based on reasonably probable assumptions, did not
identify any probable scenarios where the CGU’s recoverable
amount would fall below its carrying amount.
6. Business combination
Science Applications International Corporation:
On April 1, 2011, the Company entered into a definitive agreement to acquire the global oil and gas information technology practice
of the Commercial Business Services Business Unit of Science Applications International Corporation (“SAIC”). SAIC‘s global oil
and gas practice provides consulting, system integration and outsourcing services to global oil majors with significant domain
capabilities in the areas of digital oil field, petro-technical data management and petroleum application services, addressing the
upstream segment. The business unit was acquired for cash consideration of approximately US$ 150 million. The Company believes
that the acquisition will further strengthen Wipro‘s presence in the Energy, Natural resources & Utilities domain.
The acquisition was completed on June 10, 2011(“acquisition date”), after receipt of regulatory approvals. The Company is in the
process of allocating the purchase consideration to identifiable assets and liabilities and therefore it is impracticable to provide
the other disclosures as required under IFRS 3, (2008) “Business Combinations” as of the date of filing of this Form 20-F for the year
ended March 31, 2011.
A summary of the acquisitions completed during the years ended March 31, 2009 and 2010 is given below
Name of entity and effective date
of acquisition
Nature of business Management’s assessment of business
rationale
Citi Technology Services Limited
(Subsequently renamed as Wipro
Technology Services Limited —
WTS)
(January 2009)
India based provider of information
technology services and solutions to Citi
Group worldwide
Enhance Company’s capabilities to address
Technology Infrastructure Services (TIS) and
Application Development and Maintenance
Services (ADM) in the financial services industry.
Lornamead
(December 2009)
Operates in the personal care category
marketing fragrance products, bath
and shower products and skin care
products
Enhance Company’s strong brand portfolio of
personal care products.
The total purchase price has been allocated to the acquired assets and liabilities as follows:
Name of entity Purchase
consideration
including earn-outs
Net assets Deferred tax
liabilities
Intangible
assets
Goodwill
WTS ` 6,205 ` 1,672 ` (461) ` 1,413 ` 3,581
Lornamead 2,340 308 - 1,013 1,019
Total ` 8,545 ` 1,980 ` (461) ` 2,426 ` 4,600

Consolidated Financial Statements Under IFRS
184 Annual Report 2010-11
As at March 31,
2010 2011
Trade receivables ` 53,255 ` 64,221
Allowance for doubtful accounts
receivable
(2,327) (2,594)
` 50,928 ` 61,627
The activity in the allowance for doubtful accounts receivable
is given below:
Year ended March 31,
2010 2011
Balance at the beginning of the
year
` 1,919 ` 2,327
Additions during the year, net 566 399
Uncollectable receivables charged
against allowance (158)
(132)
Balance at the end of the year ` 2,327 ` 2,594
9. Inventories
Inventories consist of the following:
As at March 31,
2010 2011
Stores and spare parts ` 1,001 ` 1,125
Raw materials and components 2,212 3,217
Work in progress 776 1,109
Finished goods 3,937 4,256
` 7,926 ` 9,707
10. Cash and cash equivalents
Cash and cash equivalents as of March 31, 2009, 2010 and 2011
consist of cash and balances on deposit with banks. Cash and
cash equivalents consist of the following:
As at March 31,
2009 2010 2011
Cash and bank balances ` 22,944 ` 24,155 ` 27,628
Demand deposits with
banks(1)
26,173
40,723
33,513
` 49,117 ` 64,878 ` 61,141
(1)These deposits can be withdrawn by the Company at any time
without prior notice and without any penalty on the principal.
Cash and cash equivalent consists of the following for the
purpose of the cash flow statement:
As at March 31,
2009 2010 2011
Cash and cash equivalents
(as per above)
` 49,117 ` 64,878 ` 61,141
Bank overdrafts (885) (1,322) (242)
` 48,232 ` 63,556 ` 60,899
11. Other assets
As at March 31,
2010 2011
Current
Interest bearing deposits with
corporates(1)
` 10,050 ` 4,240
Prepaid expenses 2,923 4,620
Due from officers and employees 1,244 1,110
Finance lease receivables 632 2,411
Advance to suppliers 1,194 1,407
Deferred contract costs 943 1,503
Interest receivable 822 393
Deposits 1,057 603
Balance with excise and customs 917 1,570
Non-convertible debentures 155 815
Others 1,169 1,072
` 21,106 ` 19,744
Non-current
Prepaid expenses including rentals
for leasehold land
` 3,059 ` 2,423
Finance lease receivables 3,810 4,839
Deposits 724 1,680
Non-convertible debentures 1,159 -
Others 32 41
` 8,784 ` 8,983
Total ` 29,890 ` 28,727
(1) Such deposits earn a fixed rate of interest and will be liquidated
within 12 months.
7. Available for sale investments
Available for sale investments consists of the following:
As at March 31, 2010 As at March 31, 2011
Cost Gross gain
recognized
directly in
equity
Gross loss
recognized
directly in
equity
Fair Value Cost Gross gain
recognized
directly in
equity
Gross loss
recognized
directly in
equity
Fair Value
Investment in liquid and short-
term mutual funds and others
` 19,279 ` 52 ` (4) ` 19,327 ` 37,013 ` 126 ` (49) ` 37,090
Certificate of deposits 11,088 5 - 11,093 12,189 17 (14) 12,192
Total ` 30,367 ` 57 ` (4) ` 30,420 ` 49,202 ` 143 ` (63) ` 49,282
8. Trade receivables

Consolidated Financial Statements Under IFRS
Wipro Limited 185
Finance lease receivables:
Finance lease receivables consist of assets that are leased to customers, with lease payments due in monthly, quarterly or semi-
annual installments for periods ranging from 3 to 5 years. Details of finance lease receivables are given below:
Minimum lease payment Present value of minimum
lease payment
As at March 31, As at March 31,
2010 2011 2010 2011
Not later than one year ` 774 ` 2,523 ` 608 ` 2,350
Later than one year but not later than five years 4,652 6,129 3,675 4,723
Unguaranteed residual values 190 199 159 177
Gross investment in lease 5,616 8,851 - -
Less: Unearned finance income (1,174) (1,601) - -
Present value of minimum lease payment receivable ` 4,442 ` 7,250 ` 4,442 ` 7,250
Included in the financial statements as follows:
Current finance lease receivables ` 632 ` 2,411
Non-current finance lease receivables 3,810 4,839
12. Loans and borrowings
Short-term loans and borrowings
The Company had short-term borrowings including bank
overdrafts amounting to ` 43,836 and ` 31,694 as at March
31, 2010 and 2011, respectively. Short-term borrowings from
banks as of March 31, 2011 primarily consist of lines of credit
of approximately ` 22,177, US$ 939 million, SEK 85 million,
SAR 90 million, Euro 20 million, GBP 21 million, IDR (Indonesian
Rupee) 5,005 million, MYR (Malaysian Ringgit) 25 million and RM
(Chinese Yuan) 28 million from bankers primarily for working
capital requirements. As of March 31, 2011, the Company has
unutilized lines of credit aggregating ̀ 16,584, US$ 393 million,
SEK 66 million, SAR 90 million, GBP 21 million, IDR 5,005 million,
and MYR 25 million, respectively. To utilize these unused
lines of credit, the Company requires consent of the lender
and compliance with certain financial covenants. Significant
portion of these lines of credit are revolving credit facilities and
floating rate foreign currency loans, renewable on a periodic
basis. Significant portion of these facilities bear floating rates of
interest, referenced to LIBOR and a spread, determined based
on market conditions.
The Company has non-fund based revolving credit facilities
in various currencies equivalent to ` 25,497 for operational
requirements that can be used for the issuance of letters of
credit and bank guarantees. As of March 31, 2011, an amount
of ̀ 5,656 was unutilized out of these non-fund based facilities.
Long-term loans and borrowings
A summary of long- term loans and borrowings is as follows:
Currency As at March 31, 2010 As at March 31, 2011
Foreign
currency
in millions
Indian
Rupee
Foreign
currency
in
millions
Indian
Rupee
Interest
rate
Final
maturity
Unsecured external commercial borrowing
Japanese Yen 35,016 ` 16,844 35,016 ` 18,861 2.04% 2013
Unsecured term loan
Indian Rupee NA 509 NA 366 6.05% 2014
Saudi Riyals - - 66 786 1.25% 2011
Others 445 354 0 - 2% 2011 – 2017
Other secured term loans 165 106 1.46 - 4.5% 2011 – 2016
` 17,963 ` 20,473
Obligations under finance leases 712 635
` 18,675 ` 21,108
Current portion of long term loans and borrowings ` 568 ` 1,349
Non-current portion of long term loans and
borrowings
18,107 19,759

Consolidated Financial Statements Under IFRS
186 Annual Report 2010-11
The Company has entered into cross-currency interest rate swap
(CCIRS) in connection with the unsecured external commercial
borrowing and has designated a portion of these as hedge of
net investment in foreign operation.
The contract governing the Company’s unsecured external
commercial borrowing contains certain covenants that limit
future borrowings and payments towards acquisitions in a
financial year. The terms of the other secured and unsecured
loans and borrowings also contain certain restrictive covenants
primarily requiring the Company to maintain certain financial
ratios. As of March 31, 2011, the Company has met the covenants
under these arrangements.
A portion of the above short-term loans and borrowings,
other secured term loans and obligation under finance leases
aggregating to ` 2,119 and ` 2,067 as at March 31, 2010
and 2011, respectively, are secured by inventories, accounts
receivable, certain property, plant and equipment and
underlying assets.
Interest expense was ̀ 1,232 and ̀ 776 for the year ended March
31, 2010 and 2011, respectively.
The following is a schedule of future minimum lease payments
under finance leases, together with the present value of
minimum lease payments as of March 31, 2010 and 2011:
Minimum lease payment Present value of minimum
lease payment
As at March 31, As at March 31,
2010 2011 2010 2011
Not later than one year ` 257 ` 242 ` 228 ` 203
Later than one year but not later than five year. 461 396 425 372
Later than five years 62 63 59 60
Total minimum lease payments 780 701 - -
Less: Amount representing interest (68) (66) - -
Present value of minimum lease payments ` 712 ` 635 ` 712 ` 635
Included in the financial statements as follows:
Current finance lease payables ` 228 ` 203
Non-current finance lease payables 484 432
13. Trade payables and accrued expenses
Trade payables and accrued expenses consist of the following:
As at March 31,
2010 2011
Trade payables ` 19,133 ` 20,618
Accrued expenses 19,615 23,434
` 38,748 ` 44,052
14. Other liabilities and provisions
As at March 31,
2010 2011
Other liabilities:
Current:
Statutory and other liabilities ` 4,001 ` 4,046
Advance from customers 1,786 1,049
Others 712 811
` 6,499 ` 5,906
Non-current:
Employee benefit obligations ` 2,967 ` 2,633
Others 266 73
` 3,233 ` 2,706
Total ` 9,732 ` 8,612
As at March 31,
2010 2011
Provisions:
Current:
Provision for warranty ` 511 ` 467
Others 1,763 1,857
` 2,274 ` 2,324
Non-current:
Provision for warranty ` 100 ` 81
Total ` 2,374 ` 2,405
Provision for warranty represents cost associated with
providing sales support services which are accrued at the time
of recognition of revenues and are expected to be utilized
over a period of 1 to 2 year. Other provisions primarily include
provisions for tax related contingencies and litigations. The
timing of cash outflows in respect of such provision cannot be
reasonably determined.

Consolidated Financial Statements Under IFRS
Wipro Limited 187
A summary of activity for provision for warranty and other
provisions is as follows:
Year ended March 31, 2011
Provision
for
warranty
Others Total
Balance at the beginning
of the year
` 611 ` 1,763 ` 2,374
Additional provision
during the year, net
532 149 681
Provision used during the
year
(595)
(55)
(650)
Balance at the end of the
year
` 548 ` 1,857 ` 2,405
15. Financial instruments
Financial assets and liabilities (carrying value/fair value):
As at March 31,
2010 2011
Assets:
Trade receivables ` 50,928 ` 61,627
Unbilled revenues 16,708 24,149
Cash and cash equivalents 64,878 61,141
Available for sale financial
investments
30,420 49,282
Derivative assets 3,816 4,693
Other assets 20,124 16,995
Total ` 186,874 ` 217,887
Liabilities:
Loans and borrowings ` 62,511 ` 52,802
Trade payables and accrued
expenses
38,748 44,052
Derivative liabilities 4,257 3,944
Other liabilities 126 140
Total ` 105,642 ` 100,938
By Category (Carrying value/Fair value):
As at March 31,
2010 2011
Assets:
Loans and receivables ` 152,638 ` 163,912
Derivative assets 3,816 4,693
Available for sale financial assets 30,420 49,282
Total ` 186,874 ` 217,887
Liabilities:
Financial liabilities at amortized cost ` 62,511 ` 52,802
Trade and other payables 38,874 44,192
Derivative liabilities 4,257 3,944
Total ` 105,642 ` 100,938
Fair Value
The fair value of cash and cash equivalents, trade receivables,
unbilled revenues, trade payables, current financial liabilities and
borrowings approximate their carrying amount largely due to
the short-term nature of these instruments. A substantial portion
of the Company’s long-term debt has been contracted at floating
rates of interest, which are reset at short intervals. Accordingly,
the carrying value of such long-term debt approximates
fair value. Further, finance lease receivables are periodically
evaluated based on individual credit worthiness of customers.
Based on this evaluation, the Company records allowance for
expected losses on these receivables. As of March 31, 2010 and
2011, the carrying value of such receivables, net of allowances
approximates the fair value.
Investments in liquid and short-term mutual funds, which are
classified as available-for-sale are measured using quoted market
prices at the reporting date multiplied by the quantity held.
Fair value of investments in certificate of deposits, classified
as available for sale is determined using observable market
inputs.
The fair value of derivative financial instruments is determined
based on observable market inputs including currency spot and
forward rates, yield curves, currency volatility etc.
Fair value hierarchy
Level 1 – Quoted prices (unadjusted) in active markets for
identical assets or liabilities.
Level 2 – Inputs other than quoted prices included within Level
1 that are observable for the asset or liability, either directly (i.e.
as prices) or indirectly (i.e. derived from prices).
Level 3 – Inputs for the assets or liabilities that are not based on
observable market data (unobservable inputs).

Consolidated Financial Statements Under IFRS
188 Annual Report 2010-11
The following table presents fair value hierarchy of assets and liabilities measured at fair value on a recurring basis:
Particulars As at March 31, 2010 As at March 31, 2011
Total
Fair value measurements
at reporting date using Total
Fair value measurements
at reporting date using
Level 1 Level 2 Level 3 Level 1 Level 2 Level 3
Assets
Derivative instruments
- Cash flow hedges ` 2,684 ` - ` 2,684 ` - ` 1,991 ` - ` 1,991 ` - - Net investment hedges 702 - 702 - 1,523 - 1,523 -
- Others 430 - 430 - 1,179 - 1,179 -
Available for sale financial assets:
- Investment in liquid and short-term mutual
funds 19,157 19,157 - - 25,246 25,246 - -
- Investment in certificate of deposits and other
investments 11,263 - 11,263 - 24,036 - 24,036 -
Liabilities
Derivative instruments
- Cash flow hedges 1,818 - 1,818 - 1,504 - 1,504 -
- Net investment hedges 1,578 - 1,578 - 1,701 - 1,701 -
- Others 861 - 861 - 739 - 739 -
Derivatives assets and liabilities:
The Company is exposed to foreign currency fluctuations
on foreign currency assets/liabilities, forecasted cash flows
denominated in foreign currency and net investment in foreign
operations. The Company follows established risk management
policies, including the use of derivatives to hedge foreign currency
assets/liabilities, foreign currency forecasted cash flows and net
investment in foreign operations. The counter party in these
derivative instruments is a bank and the Company considers the
risks of non-performance by the counterparty as non-material.
The following table presents the aggregate contracted principal
amounts of the Company’s derivative contracts outstanding:
As at March 31,2010 2011
Designated derivative instruments Sell $ 1,518 $ 901
€ - € 2£ 31 £ 21¥ 4,578 ¥ 3,026
AUD 7 AUD 4CHF - CHF 6
Net investment hedges in foreign
operations Cross-currency swaps ¥ 26,014 ¥ 24,511 Others $ 262 $ 262
€ 40 € 40Non designated derivative
instruments Sell $ 45 $ 526
£ 38 £ 40€ 29 € 48AUD - AUD 13
Buy $ 492 $ 617 Cross currency swaps ¥ 7,000 ¥ 7,000
The following table summarizes activity in the cash flow hedging
reserve within equity related to all derivative instruments
classified as cash flow hedges:
As at March 31,
2010 2011
Balance as at the beginning of the
year
` (16,886) ` (4,954)
Net (gain)/loss reclassified into
statement of income on occurrence
of hedged transactions(1)
5,201 4,041
Deferred cancellation gains/(losses)
relating to roll - over hedging
551 222
Changes in fair value of effective
portion of derivatives
6,180
(535)
Gains/ (losses) on cash flow hedging
derivatives, net
` 11,932 ` 3,728
Balance as at the end of the year ` (4,954) ` (1,226)
(1) On occurrence of hedge transactions, net (gain)/loss was
included as part of revenues.
The related hedge transactions for balance in cash flow hedging
reserve as of March 31, 2011 are expected to occur and reclassified
to the statement of income over a period of 2 years.
As at March 31, 2010 and 2011, there were no significant gains
or losses on derivative transactions or portions thereof that have
become ineffective as hedges, or associated with an underlying
exposure that did not occur.
Sale of financial assets
From time to time, in the normal course of business, the Company
transfers accounts receivables, net investment in finance lease
receivables and employee advances (financials assets) to banks.
Under the terms of the arrangements, the Company surrenders

Consolidated Financial Statements Under IFRS
Wipro Limited 189
control over the financial assets and transfer is without recourse.
Accordingly, such transfers are recorded as sale of financial assets.
Gains and losses on sale of financial assets without recourse are
recorded at the time of sale based on the carrying value of the
financial assets and fair value of servicing liability.
In certain cases, transfer of financial assets may be with recourse.
Under arrangements with recourse, the Company is obligated
to repurchase the uncollected financial assets, subject to limits
specified in the agreement with the banks. The Company has
transferred trade receivables with recourse obligation (credit
risk) and accordingly, in such cases the amounts received are
recorded as borrowings in the statement of financial position
and cash flows from financing activities. As at March 31, 2010 and
2011, the maximum amount of recourse obligation in respect
of the transferred financial assets (recorded as borrowings) is ` 657 and ` 1,085, respectively.
Financial risk management
General
Market risk is the risk of loss of future earnings, to fair values or
to future cash flows that may result from a change in the price
of a financial instrument. The value of a financial instrument
may change as a result of changes in the interest rates, foreign
currency exchange rates, equity prices and other market changes
that affect market risk sensitive instruments. Market risk is
attributable to all market risk sensitive financial instruments
including investments, foreign currency receivables, payables
and loans and borrowings.
The Company’s exposure to market risk is a function of
investment and borrowing activities and revenue generating
activities in foreign currency. The objective of market risk
management is to avoid excessive exposure of the Company’s
earnings and equity to losses.
Risk Management Procedures
The Company manages market risk through a corporate treasury
department, which evaluates and exercises independent control
over the entire process of market risk management. The corporate
treasury department recommends risk management objectives
and policies, which are approved by senior management and
Audit Committee. The activities of this department include
management of cash resources, implementing hedging
strategies for foreign currency exposures, borrowing strategies,
and ensuring compliance with market risk limits and policies.
Foreign currency risk
The Company operates internationally and a major portion of
the business is transacted in several currencies and consequently
the Company is exposed to foreign exchange risk through
its sales and services in the United States and elsewhere,
and purchases from overseas suppliers in various foreign
currencies. The exchange rate risk primarily arises from foreign
exchange revenue, receivables, cash balances, forecasted cash
flows, payables and foreign currency loans and borrowings. A
significant portion of revenue is in U.S. dollars, euro and pound
sterling, while a significant portion of costs are in Indian rupees.
The exchange rate between the rupee and U.S. dollar, euro and
pound sterling has fluctuated significantly in recent years and
may continue to fluctuate in the future. Appreciation of the rupee
against these currencies can adversely affect the Company’s
results of operations.
The Company evaluates exchange rate exposure arising from
these transactions and enters into foreign currency derivative
instruments to mitigate such exposure. The Company follows
established risk management policies, including the use of
derivatives like foreign exchange forward / option contracts to
hedge forecasted cash flows denominated in foreign currency.
The Company has designated certain derivative instruments
as cash flow hedge to mitigate the foreign exchange exposure
of forecasted highly probable cash flows. The Company has
also designated a combination of foreign currency borrowings
and related cross-currency swaps and other foreign currency
derivative instruments as hedge of its net investment in foreign
operations.
As at March 31, 2010 and 2011, ` 1 increase / decrease in the
exchange rate of Indian Rupee with U.S. dollar would result in
approximately ` 1,071 and ` 810 decrease / increase in the fair
value of the Company’s foreign currency dollar denominated
derivative instruments, respectively.
As at March 31, 2010 and 2011, 1% change in the exchange rate
between U.S. Dollar and Yen would result in approximately ̀ 160
and ` 170 increase/decrease in the fair value of cross-currency
interest rate swaps, respectively.
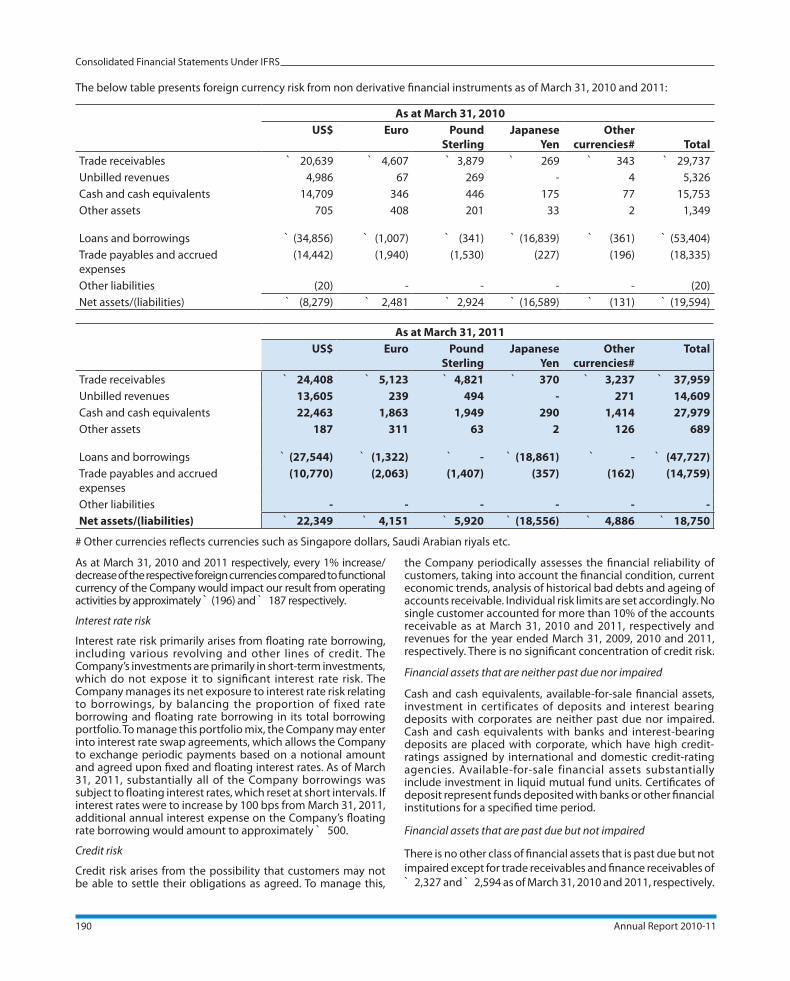
Consolidated Financial Statements Under IFRS
190 Annual Report 2010-11
The below table presents foreign currency risk from non derivative financial instruments as of March 31, 2010 and 2011:
As at March 31, 2010
US$ Euro Pound
Sterling
Japanese
Yen
Other
currencies# Total
Trade receivables ` 20,639 ` 4,607 ` 3,879 ` 269 ` 343 ` 29,737
Unbilled revenues 4,986 67 269 - 4 5,326
Cash and cash equivalents 14,709 346 446 175 77 15,753
Other assets 705 408 201 33 2 1,349
Loans and borrowings ` (34,856) ` (1,007) ` (341) ` (16,839) ` (361) ` (53,404)
Trade payables and accrued
expenses
(14,442) (1,940) (1,530) (227) (196) (18,335)
Other liabilities (20) - - - - (20)
Net assets/(liabilities) ` (8,279) ` 2,481 ` 2,924 ` (16,589) ` (131) ` (19,594)
As at March 31, 2011
US$ Euro Pound
Sterling
Japanese
Yen
Other
currencies#
Total
Trade receivables ` 24,408 ` 5,123 ` 4,821 ` 370 ` 3,237 ` 37,959
Unbilled revenues 13,605 239 494 - 271 14,609
Cash and cash equivalents 22,463 1,863 1,949 290 1,414 27,979
Other assets 187 311 63 2 126 689
Loans and borrowings ` (27,544) ` (1,322) ` - ` (18,861) ` - ` (47,727)
Trade payables and accrued
expenses
(10,770) (2,063) (1,407) (357) (162) (14,759)
Other liabilities - - - - - -
Net assets/(liabilities) ` 22,349 ` 4,151 ` 5,920 ` (18,556) ` 4,886 ` 18,750
# Other currencies reflects currencies such as Singapore dollars, Saudi Arabian riyals etc.
As at March 31, 2010 and 2011 respectively, every 1% increase/decrease of the respective foreign currencies compared to functional currency of the Company would impact our result from operating activities by approximately ` (196) and ` 187 respectively.
Interest rate risk
Interest rate risk primarily arises from floating rate borrowing, including various revolving and other lines of credit. The Company’s investments are primarily in short-term investments, which do not expose it to significant interest rate risk. The Company manages its net exposure to interest rate risk relating to borrowings, by balancing the proportion of fixed rate borrowing and floating rate borrowing in its total borrowing portfolio. To manage this portfolio mix, the Company may enter into interest rate swap agreements, which allows the Company to exchange periodic payments based on a notional amount and agreed upon fixed and floating interest rates. As of March 31, 2011, substantially all of the Company borrowings was subject to floating interest rates, which reset at short intervals. If interest rates were to increase by 100 bps from March 31, 2011, additional annual interest expense on the Company’s floating rate borrowing would amount to approximately ` 500.
Credit risk
Credit risk arises from the possibility that customers may not be able to settle their obligations as agreed. To manage this,
the Company periodically assesses the financial reliability of customers, taking into account the financial condition, current economic trends, analysis of historical bad debts and ageing of accounts receivable. Individual risk limits are set accordingly. No single customer accounted for more than 10% of the accounts receivable as at March 31, 2010 and 2011, respectively and revenues for the year ended March 31, 2009, 2010 and 2011, respectively. There is no significant concentration of credit risk.
Financial assets that are neither past due nor impaired
Cash and cash equivalents, available-for-sale financial assets, investment in certificates of deposits and interest bearing deposits with corporates are neither past due nor impaired. Cash and cash equivalents with banks and interest-bearing deposits are placed with corporate, which have high credit-ratings assigned by international and domestic credit-rating agencies. Available-for-sale financial assets substantially include investment in liquid mutual fund units. Certificates of deposit represent funds deposited with banks or other financial institutions for a specified time period.
Financial assets that are past due but not impaired
There is no other class of financial assets that is past due but not
impaired except for trade receivables and finance receivables of
` 2,327 and ̀ 2,594 as of March 31, 2010 and 2011, respectively.

Consolidated Financial Statements Under IFRS
Wipro Limited 191
Of the total receivables, ` 34,608 and ` 41,146 as of March 31,
2010 and 2011, respectively, were neither past due nor impaired.
The company’s credit period generally ranges from 45-60 days.
The aging analysis of the receivables have been considered from
the date of the invoice. The age wise break up of receivables, net
of allowances that are past due, is given below:
As at March 31,
2010 2011
Financial assets that are neither past
due nor impaired
` 34,608 ` 41,146
Financial assets that are past due
but not impaired
Past due 0 – 30 days 3,816 4,249
Past due 31 – 60 days 4,468 6,976
Past due 61 – 90 days 2,489 3,273
Past due over 90 days 11,163 14,834
Total past due and not impaired ` 21,936 ` 29,332
Counterparty risk
Counterparty risk encompasses issuer risk on marketable
securities, settlement risk on derivative and money market
contracts and credit risk on demand and time deposits. Issuer
risk is minimized by only buying securities which are at least
AA rated. Settlement and credit risk is reduced by the policy of
entering into transactions with counterparties that are usually
banks or financial institutions with acceptable credit ratings.
Exposure to these risks are closely monitored and maintained
within predetermined parameters. There are limits on credit
exposure to any financial institution. The limits are regularly
assessed and determined based upon credit analysis including
financial statements and capital adequacy ratio reviews. In
addition, net settlement agreements are contracted with
significant counterparties.
Liquidity risk
Liquidity risk is defined as the risk that the Company will
not be able to settle or meet its obligations on time or at a
reasonable price. The Company’s corporate treasury department
is responsible for liquidity, funding as well as settlement
management. In addition, processes and policies related to
such risks are overseen by senior management. Management
monitors the Company’s net liquidity position through rolling
forecasts on the basis of expected cash flows. As of March 31,
2010 and 2011, cash and cash equivalents are held with major
banks and financial institutions.
The table below provided details regarding the contractual maturities of significant financial liabilities.
As at March 31, 2010
Less than 1
year
1-2 years 2-4 years 4-7 years Total
Loans and borrowings ` 44,404 ` 544 ` 17,441 ` 122 ` 62,511
Trade payables and accrued expenses 38,748 - - - 38,748
Derivative liabilities 1,375 487 2,395 - 4,257
As at March 31, 2011
Less than 1
year
1-2 years 2-4 years 4-7 years Total
Loans and borrowings ` 33,043 ` 19,322 ` 304 ` 133 ` 52,802
Trade payables and accrued expenses 44,052 - - - 44,052
Derivative liabilities 1,358 2,586 - - 3,944
The balanced view of liquidity and financial indebtedness is stated in the table below. This calculation of the net cash position is
used by the management for external communication with investors, analysts and rating agencies:
As at March 31,
2010 2011
Cash and cash equivalents ` 64,878 ` 61,141
Interest bearing deposits with
corporates
10,050 4,240
Available for sale investments 30,420 49,282
Loans and borrowings (62,511) (52,802)
Net cash position ` 42,837 ` 61,861
16. Investment in equity accounted investees
Wipro GE Medical Systems (Wipro GE)
The Company holds 49% interest in Wipro GE. Wipro GE is a
private entity that is not listed on any public exchange. The
carrying value of the investment in Wipro GE as at March 31, 2010
and 2011 was ̀ 2,345 and ̀ 2,993, respectively. The Company’s
share of profits of Wipro GE for the year ended March 31, 2009,
2010 and 2011 was ` 362, ` 530 and ` 648, respectively.

Consolidated Financial Statements Under IFRS
192 Annual Report 2010-11
The aggregate summarized financial information of Wipro GE
is as follows:
Year ended March 31,
2009 2010 2011
Revenue ` 10,611 ` 12,567 ` 19,882
Gross profit 3,269 3,573 5,278
Profit for the year 875 934 1,127
As at March 31,
2010 2011
Total assets ` 11,518 ` 16,830
Total liabilities 6,709 8,543
Total equity ` 4,809 ` 8,287
In April 2010, Wipro GE acquired medical equipment and related
businesses from General Electric for a cash consideration of
approximately ` 3,728.
Wipro GE had received tax demands from the Indian income
tax authorities for the financial years ended March 31, 2001,
2002, 2003 and 2004 aggregating to ` 903, including interest.
The tax demands were primarily on account of transfer pricing
adjustments and the denial of export benefits and tax holiday
benefits claimed by Wipro GE under the Indian Income Tax Act,
1961 (the “Act”). Wipro GE appealed against the said demands
before the first appellate authority. The first appellate authority
has vacated the tax demands for the years ended March 31,
2001, 2002, 2003 and 2004. The income tax authorities have
filed an appeal for the years ended March 31, 2001, 2002, 2003
and 2004.
In December 2008, Wipro GE received, on similar grounds,
additional tax demand of ` 552 (including interest) for the
financial year ended March 31, 2005. Wipro GE had filed an
appeal against the said demand and in the month of February
2011, the appellate order has been received, setting aside the
entire TP adjustment and reducing the overall demand of ̀ 552
(including interest) to ̀ 220 (including interest). Wipro GE would
be seeking further relief in this regard.
In December 2009, Wipro GE received a draft assessment order,
on similar grounds, with a demand of ̀ 317 (including interest)
for the financial year ended March 31, 2006. The final assessment
order was issued in this regard demanding the same amount,
plus interest and Wipro GE has filed an appeal against the said
demand before the Income Tax Appellate Tribunal within the
time limit permitted under the statute.
In February 2011, Wipro GE received an assessment order, on
similar grounds, with a demand of ` 843 (including interest)
for the financial year ended March 31, 2007. In this regard,
Wipro GE has filed an appeal with the first appellate authority
against the said demand within the time limit permitted under
the statute.
Considering the facts and nature of disallowance and the order
of the appellate authority upholding the claims of Wipro GE,
Wipro GE believes that the final outcome of the disputes should
be in its favour and will not have any material adverse effect on
its financial position and results of operations.
17. Foreign currency translation reserve
The movement in foreign currency translation reserve
attributable to equity holders of the Company is summarized
below:
As at March 31,
2010 2011
Balance at the beginning of the
year
` 1,533 ` 258
Translation difference related to
foreign operations
(5,477) 1,246
Change in effective portion of
hedges of net investment in foreign
operations 4,202 20
Total change during the year ` (1,275) ` 1,266
Balance at the end of the year ` 258 ` 1,524
18. Income taxes
Income tax expense has been allocated as follows:
Year ended March 31,
2009 2010 2011
Income tax expense as
per the statement of
income
` 6,035 ` 9,294 ` 9,714
Income tax included in
other comprehensive
income on:
unrealized gains/
(losses) on available
for sale investments
(131) (14) 2
gains/(losses) on
cash flow hedging
derivatives (2,353) 2,091 44
Total income taxes ` 3,551 ` 11,371 ` 9,760
Income tax expense from continuing operations consist of the
following:
Year ended March 31,
2009 2010 2011
Current taxes
Domestic ` 3,656 ` 5,461 ` 5,573
Foreign 2,538 3,403 3,895
` 6,194 ` 8,864 ` 9,468
Deferred taxes
Domestic ` (24) ` 40 ` 292
Foreign (135) 390 (46)
` (159) ` 430 ` 246
Total income tax expense ` 6,035 ` 9,294 ` 9,714

Consolidated Financial Statements Under IFRS
Wipro Limited 193
The reconciliation between the provision of income tax of
the Company and amounts computed by applying the Indian
statutory income tax rate to profit before taxes is as follows:
Year ended March 31,2009 2010 2011
Profit before taxes ` 44,895 ` 55,410 ` 63,035Enacted income tax rate in India
33.99% 33.99% 33.218%
Computed expected tax expense
15,260 18,834 20,939
Effect of:Income exempt from tax
(10,368) (10,802) (10,458)
Basis differences that will reverse during a tax holiday period
328 898 (217)
Income taxed at higher/ (lower) rates
(166) (475) (566)
Income taxes relating to prior years
(370) (442) (590)
Changes in unrecognized deferred tax assets
314 811 160
Expenses disallowed for tax purposes
1,024 456 426
Others, net 13 14 20Total income tax expense ` 6,035 ` 9,294 ` 9,714
The tax rates under Indian Income Tax Act, for the year ended March 31, 2011 is 33.218% as compared to 33.99% for the year ended March 31, 2010. This change in tax rate is on account of reduction in surcharge from 10% for the year ended March 31, 2010 to 7.5% for the year ended March 31, 2011, in the financial annual budget by the Indian Government.
The components of deferred tax assets and liabilities are as follows:
As at March 31,2009 2010 2011
Carry-forward business losses
` 2,046 ` 1,851 ` 2,042
Accrued expenses and liabilities
813 568 521
Allowances for doubtful accounts receivable
322 328 716
Cash flow hedges 2,353 262 218Minimum alternate tax 126 363 488Others 69 83 196
5,729 3,455 4,181Property, plant and equipment
` (365) ` (525) ` (1,107)
Amortizable goodwill (348) (458) (659)Intangible assets (789) (734) (682)Investment in equity accounted investee (332) (432) (567)
(1,834) (2,149) (3,015)Net deferred tax assets ` 3,895 ` 1,306 ` 1,166Amounts presented in statement of financial position: Deferred tax assets ` 4,369 ` 1,686 ` 1,467Deferred tax liabilities ` (474) ` (380) ` (301)
Deferred taxes on unrealized foreign exchange gain / loss relating
to cash flow hedges is recognized in other comprehensive
income and presented within equity in the cash flow hedging
reserve. Deferred tax liability on the intangible assets identified
and recorded separately at the time of acquisition is recorded
by an adjustment to goodwill. Other than these, the change in
deferred tax assets and liabilities is primarily recorded in the
statement of income.
In assessing the realizability of deferred tax assets, the Company
considers the extent to which, it is probable that the deferred
tax asset will be realized. The ultimate realization of deferred tax
assets is dependent upon the generation of future taxable profits
during the periods in which those temporary differences and tax
loss carry-forwards become deductible. The Company considers
the expected reversal of deferred tax liabilities and projected
future taxable income in making this assessment. Based on this,
the Company believes that it is probable that the Company will
realize the benefits of these deductible differences. The amount
of the deferred tax asset considered realizable, however, could
be reduced in the near term if the estimates of future taxable
income during the carry-forward period are reduced. Deferred
tax asset in respect of unused tax losses amounting to ` 1,743
and ` 2,076 as of March 31, 2010 and 2011, respectively have
not been recognized by the Company.
The Company has recognized deferred tax assets of ` 1,851 and
` 2,043 in respect of carry forward losses of its U.S. subsidiary
during the year ended March 31, 2010 and 2011. Management’s
projections of future taxable income and tax planning strategies
support the assumption that it is probable that sufficient taxable
income will be available to utilize these deferred tax assets.
Pursuant to the changes in the Indian income tax laws in fiscal
2007, Minimum Alternate Tax (MAT) has been extended to income
in respect of which deduction is claimed under section 10A and
10B of the Act; consequently, the Company has calculated its tax
liability for current domestic taxes after considering MAT. The
excess tax paid under MAT provisions over and above normal
tax liability can be carried forward and set-off against future tax
liabilities computed under normal tax provisions. The Company
was required to pay MAT and accordingly, a deferred tax asset
of ` 363 and ` 488 has been recognized in the statement of
financial position as of March 31, 2010 and 2011, respectively,
which can be carried forward for a period of ten years from the
year of recognition.
A substantial portion of the profits of the Company’s India
operations are exempt from Indian income taxes being profits
attributable to export operations and profits from undertakings
situated in Software Technology, Hardware Technology Parks
and Export Oriented units. Under the tax holiday, the taxpayer
can utilize an exemption from income taxes for a period of any
ten consecutive years. The tax holidays on all facilities under
Software Technology, Hardware Technology Parks and Export
oriented units has expired on March 31, 2011. Additionally,
under the Special Economic Zone Act, 2005 scheme, units in
designated special economic zones providing service on or after

Consolidated Financial Statements Under IFRS
194 Annual Report 2010-11
April 1, 2005 will be eligible for a deduction of 100 percent of
profits or gains derived from the export of services for the first
five years from commencement of provision of services and 50
percent of such profits and gains for a further five years. Certain
tax benefits are also available for a further five years subject to
the unit meeting defined conditions. Profits from certain other
undertakings are also eligible for preferential tax treatment. In
addition, dividend income from certain category of investments
is exempt from tax. The difference between the reported income
tax expense and income tax computed at statutory tax rate is
primarily attributable to income exempt from tax.
Deferred income tax liabilities are recognized for all taxable
temporary differences except in respect of taxable temporary
differences associated with investments in subsidiaries where
the timing of the reversal of the temporary difference can be
controlled and it is probable that the temporary difference will
not reverse in the foreseeable future. Accordingly, deferred
income tax liabilities on cumulative earnings of subsidiaries
amounting to ` 8,436 and ` 12,969 as of March 31, 2010 and
2011, respectively has not been recognized. Further, it is not
practicable to estimate the amount of the unrecognized deferred
tax liabilities for these undistributed earnings.
The tax loss carry-forwards of ` 5,450 and ` 5,941 as of March
31, 2010 and 2011, respectively relates to certain subsidiaries
on which deferred tax asset has not been recognized by the
Company. Approximately, ` 4,531 and ` 4,644 as of March 31,
2010 and 2011 respectively, of these tax loss carry-forwards is
not currently subject to expiration dates. The remaining tax loss
carry forward of approximately ` 919 and ` 1,297 as of March
31, 2010 and 2011 respectively, expires in various years through
fiscal 2029.
We are subject to U.S. tax on income attributable to our
permanent establishment in the United States due to operation
of our U.S. branch. In addition, the Company is subject to a 15%
branch profit tax in the United States on the “dividend equivalent
amount” as that term is defined under U.S. tax law. The Company
has not triggered the branch profit tax until year ended March
31, 2011. The Company intends to maintain the current level of
net assets in the United States commensurate with its operation
and consistent with its business plan. The Company does not
intend to repatriate out of the United States any portion of its
current profits. Accordingly, the Company did not record current
and deferred tax provision for branch profit tax.
19. Dividends
The Company declares and pays dividend in Indian rupees.
According to the Indian law any dividend should be declared out
of accumulated distributable profits only after the transfer to a
general reserve of a specified percentage of net profit computed
in accordance with current regulations.
The cash dividends paid per equity share were ` 4, ` 4 and
` 6 during the years ended March 31, 2009, 2010 and 2011,
respectively. The Company has also paid an interim dividend of
` 2 per equity share during the year ended March 31, 2011.
During the year ended March 31, 2011, the Company has also
paid stock dividend, commonly known as bonus shares in India,
comprised of two equity shares for every three equity shares
outstanding on the record date and two ADSs for every three
ADSs outstanding on the record date. The stock dividend did
not affect the ratio of ADSs to equity shares, such that each ADS
after the stock dividend continues to represent one equity share
of par value of ` 2 per share.
The Board of directors in their meeting on April 27, 2011
proposed a final dividend of ` 4 ($ 0.09) per equity share and
ADR. The proposal is subject to the approval of shareholders at
the Annual General Meeting to be held on July 19, 2011, and
if approved, would result in a cash outflow of approximately ` 11,410, including corporate dividend tax thereon (` 1,593).
20. Additional capital disclosures
The key objective of the Company’s capital management is
to ensure that it maintains a stable capital structure with the
focus on total equity to uphold investor, creditor, and customer
confidence and to ensure future development of its business. The
Company focused on keeping strong total equity base to ensure
independence, security, as well as a high financial flexibility for
potential future borrowings, if required without impacting the
risk profile of the Company.
The Company’s goal is to continue to be able to return excess
liquidity to shareholders by continuing distributing annual
dividends in future periods. During the year ended March 31, 2010
and 2011, the Company distributed ` 4 and ` 6, respectively in
dividend per equity share. The Company has also distributed an
interim dividend of ` 2 per equity share during the year ended
March 31, 2011. The amount of future dividends will be balanced
with effort to continue to maintain an adequate liquidity status.
The capital structure as of March 31, 2010 and 2011 was as
follows:
As at March 31,
2010 2011 % Change
Total equity attributable
to the equity
shareholders of the
Company
` 196,112 ` 239,680 22.22%
As percentage of total
capital
76% 82%
Current loans and
borrowings
44,404 33,043
Non-current loans and
borrowings 18,107 19,759
Total loans and
borrowings
62,511 52,802 (15.53)%
As percentage of total
capital 24% 18%
Total capital (loans and
borrowings and equity)
` 258,623 ` 292,482 13.09%

Consolidated Financial Statements Under IFRS
Wipro Limited 195
The Company is predominantly equity-financed. This is also
evident from the fact that loans and borrowings represented
only 24% and 18% of total capital as of March 31, 2010 and 2011,
respectively. Further, the Company has consistently been a net
cash company with cash and bank balance along with available
for sale investments being in excess of debt.
21. Revenues
Year ended March 31,
2009 2010 2011
Rendering of services ` 193,009 ` 202,990 ` 234,285
Sale of products 63,882 68,967 76,257
Total revenues ` 256,891 ` 271,957 ` 310,542
22. Expenses by nature
Year ended March 31,
2009 2010 2011
Employee
compensation
` 107,266 ` 107,230 ` 126,867
Raw materials, finished
goods, process stocks
and stores and spares
consumed
47,179 51,813 50,166
Sub contracting/
technical fees/third
party application
15,890 17,527 26,415
Travel 9,313 8,064 10,156
Depreciation and
amortization
6,948 7,831 8,211
Repairs 4,045 5,020 5,253
Advertisement 3,221 4,534 5,114
Communication 3,006 3,157 3,492
Rent 2,526 3,062 3,230
Power and fuel 1,863 1,797 2,427
Legal and professional
fees
1,502 1,593 1,629
Rates, taxes and
insurance
955 1,023 1,324
Carriage and freight 885 950 1,181
Provision for doubtful
debt
939 566 399
Sales commission 515 459 656
Miscellaneous expenses 5,985 5,104 6,799
Total cost of revenues,
selling and marketing
expenses and general
and administrative
expenses ` 212,038 ` 219,730 ` 253,319
23. Finance expense
Year ended March 31,
2009 2010 2011
Interest expense ` 2,333 ` 1,232 ` 776
Exchange fluctuation
on foreign currency
borrowings, net 1,491 92 1,157
Total ` 3,824 ` 1,324 ` 1,933
24. Finance and other income
Year ended March 31,
2009 2010 2011
Interest income ` 1,964 ` 2,610 ` 4,057
Dividend income 2,265 1,442 2,403
Gain on sale of
investments
681 308 192
Others 147 - -
Total ` 5,057 ` 4,360 ` 6,652
25. Earnings per equity share
A reconciliation of profit for the year and equity shares used in
the computation of basic and diluted earnings per equity share
is set out below:
Basic: Basic earnings per share is calculated by dividing the
profit attributable to equity shareholders of the Company by the
weighted average number of equity shares outstanding during
the period, excluding equity shares purchased by the Company
and held as treasury shares. Equity shares held by controlled
Wipro Equity Reward Trust (‘WERT’) and Wipro Inc Benefit Trust
(WIBT) have been reduced from the equity shares outstanding
for computing basic and diluted earnings per share.

Consolidated Financial Statements Under IFRS
196 Annual Report 2010-11
Year ended March 31,
2009 2010 2011
Profit attributable to equity holders of the Company ` 38,761 ` 45,931 ` 52,977
Weighted average number of equity shares outstanding 2,423,558,482 2,429,025,243 2,436,440,633
Basic earnings per share ` 15.99 ` 18.91 ` 21.74
Diluted: Diluted earnings per share is calculated by adjusting the weighted average number of equity shares outstanding during
the period for assumed conversion of all dilutive potential equity shares. Employee share options are dilutive potential equity
shares for the Company.
The calculation is performed in respect of share options to determine the number of shares that could have been acquired at fair
value (determined as the average market price of the Company’s shares during the period). The number of shares calculated as
above is compared with the number of shares that would have been issued assuming the exercise of the share options.
Year ended March 31,
2009 2010 2011
Profit attributable to equity holders of the Company ` 38,761 ` 45,931 ` 52,977
Weighted average number of equity shares outstanding 2,423,558,482 2,429,025,243 2,436,440,633
Effect of dilutive equivalent share options 13,905,921 20,633,289 14,713,521
Weighted average number of equity shares for diluted earnings per share 2,437,464,403 2,449,658,532 2,451,154,154
Diluted earnings per share ` 15.90 ` 18.75 ` 21.61
Earnings per share and number of share outstanding for the year ended March 31, 2009 and 2010, have been adjusted for the two
equity shares for every three equity shares stock dividend approved by the shareholders on June 4, 2010.
26. Employee stock incentive plans
The stock compensation expense recognized for employee
services received during the year ended March 31, 2009, 2010
and 2011 is ` 1,868, ` 1,302 and ` 1,092, respectively.
Wipro Equity Reward Trust (WERT)
In 1984, the Company established a controlled trust called the
Wipro Equity Reward Trust (“WERT”). The WERT purchases shares
of the Company out of funds borrowed from the Company. The
Company’s compensation committee recommends to the WERT
certain officers and key employees, to whom the WERT grants
shares from its holdings at nominal price. Such shares are then
held by the employees subject to vesting conditions. The shares
held by the WERT are reported as a reduction in stockholders’
equity
The movement in the shares held by the WERT is given below:
Year ended March 31,
2009 2010 2011
Shares held at the
beginning of the
period(1)
7,961,760 7,961,760 13,269,600
Shares granted to
employees
- - -
Grants forfeited by
employees
- - -
Shares held at the end
of the period 7,961,760 7,961,760 13,269,600
(1)The opening balance as of April 1, 2010 has been adjusted
for the two equity shares for every three equity shares stock
dividend approved by the shareholders on June 4, 2010.
Wipro Employee Stock Option Plan and Restricted Stock Unit
Option Plan
A summary of the general terms of grants under stock option
plans and restricted stock unit option plans are as follows:
Name of Plan Authorized
Shares(1)
Range of
Exercise
Prices
Wipro Employee Stock Option
Plan 1999 (1999 Plan)
50,000,000 ` 171 – 490
Wipro Employee Stock Option
Plan 2000 (2000 Plan)
250,000,000 ` 171 – 490
Stock Option Plan (2000 ADS
Plan)
15,000,000 US$ 3 – 7
Wipro Restricted Stock Unit
Plan (WRSUP 2004 plan)
20,000,000 ` 2
Wipro ADS Restricted Stock
Unit Plan (WARSUP 2004 plan)
20,000,000 US$ 0.04
Wipro Employee Restricted
Stock Unit Plan 2005 (WSRUP
2005 plan)
20,000,000 ` 2
Wipro Employee Restricted
Stock Unit Plan 2007 (WSRUP
2007 plan)
16,666,667 ` 2
(1) adjusted for the two equity shares for every three equity shares
stock dividend approved by the shareholders on June 4, 2010.

Consolidated Financial Statements Under IFRS
Wipro Limited 197
Employees covered under the stock option plans and restricted stock unit option plans (collectively “stock option plans”) are
granted an option to purchase shares of the Company at the respective exercise prices, subject to requirement of vesting conditions
(generally service conditions). These options generally vests in tranches over a period of five years from the date of grant. Upon
vesting, the employees can acquire one equity share for every option. The maximum contractual term for these stock option plans
is generally ten years.
The activity in these stock option plans is summarized below:
Year ended March 31,
2009 2010 2011
Range of
Exercise
Prices
Number Weighted
Average
Exercise
Price
Number Weighted
Average
Exercise
Price
Number Weighted
Average
Exercise
Price
Outstanding at the beginning
of the period(1)
` 229 – 265 1,219,926 ` 264 1,140 ` 254 — ` —
` 489 — ` — 120,000 ` 489 200,000 ` 293.40
US$ 4– 6 8,706 US$ 5 1,606 US$ 4.7 2,677 US$ 2.82
` 2 9,700,163 ` 2 13,799,549 ` 2 17,103,172 ` 2
US$ 0.04 1,885,236 US$ 0.04 2,470,641 US$ 0.04 2,943,035 US$ 0.04
Granted ` 229 – 265 — ` — — ` — — ` —
` 489 120,000 ` 489 — ` — — ` —
US$ 4– 6 — US$ — — US$ — — US$ —
` 2 6,882,415 ` 2 5,000 ` 2 5,227,870 ` 2
US$ 0.04 1,484,261 US$ 0.04 137,100 US$ 0.04 1,437,060 US$ 0.04
Exercised ` 229 – 265 (345,099) ` 263 — ` — — ` —
` 489 — ` — — ` — (80,000) ` 293.40
US$ 4– 6 (4,400) US$ 4.7 — US$ — — US$ —
` 2 (1,762,283) ` 2 (2,736,924) ` 2 (5,482,210) ` 2
US$ 0.04 (446,841) US$ 0.04 (493,519) US$ 0.04 (870,622) US$ 0.04
Forfeited and lapsed ` 229 – 265 (873,687) ` 264 (1,140) ` 254 — ` —
` 489 — ` — — ` — (120,000) ` 293.40
US$ 4– 6 (2,700) US$ 5.82 — US$ — (2,677) US$ 2.82
` 2 (1,020,746) ` 2 (805,722) ` 2 (1,466,071) ` 2
US$ 0.04 (452,015) US$ 0.04 (348,401) US$ 0.04 (285,581) US$ 0.04
Outstanding at the end of the
period
` 229 – 265 1,140 ` 254 — ` — — ` —
` 489 120,000 ` 489 120,000 ` 489 — ` —
US$ 4– 6 1,606 US$ 4.7 1,606 US$ 4.7 — US$ —
` 2 13,799,549 ` 2 10,261,903 ` 2 15,382,761 ` 2
US$ 0.04 2,470,641 US$ 0.04 1,765,821 US$ 0.04 3,223,892 US$ 0.04
Exercisable at the end of the
period
` 229 – 265 1,140 ` 254 — ` — — ` —
` 489 — ` — — ` — — ` —
US$ 4– 6 1,606 US$ 4.7 1,606 US$ 4.7 — US$ —
` 2 2,975,987 ` 2 4,719,739 ` 2 7,533,984 ` 2
US$ 0.04 208,412 US$ 0.04 645,341 US$ 0.04 1,147,391 US$ 0.04
(1)The opening balance as of April 1, 2010 have been adjusted for the two equity shares for every three equity shares stock dividend
approved by the shareholders on June 4, 2010.

Consolidated Financial Statements Under IFRS
198 Annual Report 2010-11
The following table summarizes information about outstanding stock options:
As at March 31,
2009 2010 2011
Range of
Exercise price
Numbers Weighted
Average
Remaining
Life
(Months)
Weighted
Average
Exercise
Price
Numbers Weighted
Average
Remaining
Life
(Months)
Weighted
Average
Exercise
Price
Numbers Weighted
average
remaining
Life
(Months)
Weighted
Average
Exercise
Price
` 229 – 265 1,140 3 ` 254 - - ` - - - ` -
` 489 120,000 61 ` 489 120,000 49 ` 489 - - ` -
US$ 4 –6 1,606 12 US$ 4.70 1,606 1 US$ 4.70 - - US$ -
` 2 13,799,549 44 ` 2 10,261,903 37 ` 2 15,382,761 35 ` 2
US$ 0.04 2,470,641 51 US$ 0.04 1,765,821 44 US$ 0.04 3,223,892 48 US$ 0.04
The weighted-average grant-date fair value of options granted during the year ended March 31, 2009, 2010 and 2011 was ` 319,
` 814 and ` 417.65 for each option, respectively. The weighted average share price of options exercised during the year ended
March 31, 2009, 2010 and 2011was ` 360.96, ` 557.52 and ` 424.28 for each option, respectively.
The fair value of 120,000 options granted during the year ended
March 31, 2009 (other than at nominal exercise price) has been
estimated on the date of grant using the Binomial option pricing
model. The fair value of share options has been determined using
the following assumptions:
Expected term 5-7 yearsRisk free interest rates 7.36 – 7.42Volatility 35.81 – 36.21Dividend yield 1%
27. Employee benefits
a) Employee costs include:
Year ended March 31,
2009 2010 2011
Salaries and bonus ` 102,661 ` 103,194 ` 122,399
Employee benefit plans Defined benefit plan 310 276 469
Contribution to
provident and other
funds
2,427 2,458 2,907
Share based
compensation
1,868
1,302
1,092
` 107,266 ` 107,230 ` 126,867
The employee benefit cost is recognized in the following line
items in the statement of income:
Year ended March 31,
2009 2010 2011
Cost of revenues ` 90,321 ` 90,350 ` 106,235
Selling and marketing
expenses
10,594 9,126 10,860
General and
administrative expenses
6,351
7,754
9,772
` 107,266 ` 107,230 ` 126,867
b) Defined benefit plans:
Amount recognized in the statement of income in respect of
gratuity cost (defined benefit plan) is as follows:
Year ended March 31,
2009 2010 2011
Interest on obligation ` 135 ` 133 ` 161
Expected return on plan
assets
(92) (122) (164)
Actuarial losses/(gains)
recognized
(102) (63) (168)
Past service cost - - 254
Current service cost 369 328 386
Net gratuity cost/
(benefit)` 310 ` 276 ` 469
Actual return on plan
assets` 106 ` 138 ` 177
In May 2010, the Government of India amended the Payment of
Gratuity Act, 1972 to increase the limit of gratuity payment from
` 0.35 to ` 1. Consequently, during the year ended March 31,
2011, the Company has recognized ̀ 254 of vested past service
cost in the statement of income.
The principal assumptions used for the purpose of actuarial
valuation are as follows:
As at March 31,
2009 2010 2011
Discount rate 6.75% 7.15% 7.95%
Expected return on plan
assets
8% 8% 8%
Expected rate of salary
increase
5% 5% 5%
The expected return on plan assets is based on expectation of
the average long term rate of return expected on investments of
the fund during the estimated term of the obligations.

Consolidated Financial Statements Under IFRS
Wipro Limited 199
Change in present value of defined benefit obligation is
summarized below:
As at March 31,
2009 2010 2011
Defined benefit
obligation at the
beginning of the year
` 1,515 ` 1,858 ` 2,060
Acquisitions 34 - -
Current service cost 369 328 386
Past service cost - - 254
Interest on obligation 135 133 161
Benefits paid (118) (214) (230)
Actuarial losses/(gains) (77) (45) (155)
Defined benefit
obligation at the end of
the year ` 1,858 ` 2,060 ` 2,476
Change in plan assets is summarized below:
As at March 31,
2009 2010 2011
Fair value of plan assets
at the beginning of the
year ` 1,244 ` 1,416 ` 1,967
Acquisitions 19 - -
Expected return on plan
assets 92 122 164
Employer contributions 154 625 473
Benefits paid (118) (214) (230)
Actuarial gains/(losses) 25 18 13
Fair value of plan assets
at the end of the year 1,416 1,967 2,387
Present value of
unfunded obligation ` (442) ` (93) ` (89)
Recognized liability ` (442) ` (93) ` (89)
The experience adjustments, meaning difference between
changes in plan assets and obligations expected on the basis
of actuarial assumption and actual changes in those assets and
obligations are as follows:
As at March 31,
2009 2010 2011
Difference between expected
and actual developments:
of fair value of the obligation (59) (84) (32)
of fair value of plan assets 26 18 15
As at March 31, 2009, 2010 and 2011, 100% of the plan assets
were invested in insurer managed funds.
The expected future contribution and estimated future benefit
payments from the fund are as follows:
Expected contribution to the fund during the
year ending March 31, 2012 ` 379
Estimated benefit payments from the fund for
the year ending March 31:
2012 ` 498
2013 538
2014 545
2015 558
2016 623
Thereafter 2,590
Total ` 5,352
The expected benefits are based on the same assumptions used
to measure the Company’s benefit obligations as of March 31,
2011.
28. Related party relationships and transactions
List of subsidiaries as of March 31, 2011 are provided in the table below.
Direct Subsidiaries Step SubsidiariesCountry of
Incorporation
Wipro Inc. U.S.Wipro Gallagher Solutions Inc U.S.Enthink Inc. U.S.Infocrossing Inc. U.S.
cMango Pte Limited SingaporeWipro Japan KK JapanWipro Shanghai Limited ChinaWipro Trademarks Holding Limited India
Cygnus Negri Investments Private
Limited
India
Wipro Travel Services Limited IndiaWipro Consumer Care Limited IndiaWipro Holdings (Mauritius) Limited Mauritius
Wipro Holdings UK Limited U.K.Wipro Technologies UK Limited U.K.Wipro Holding Austria GmbH(A) Austria

Consolidated Financial Statements Under IFRS
200 Annual Report 2010-11
Direct Subsidiaries Step SubsidiariesCountry of
Incorporation
3D Networks (UK) Limited U.K.Wipro Cyprus Private Limited Cyprus
Wipro Technologies S.A DE C. V MexicoWipro BPO Philippines LTD. Inc PhilippinesWipro Holdings Hungary Korlátolt
Felelősségű Társaság
Hungary
Wipro Technologies Argentina SA ArgentinaWipro Information Technology
Egypt SAE
Egypt
Wipro Arabia Limited* Saudi ArabiaWipro Poland Sp Zoo PolandWipro Outsourcing Services UK
Limited
U.K.
Wipro Technologies (South Africa)
Proprietary Limited
South Africa
Wipro Information Technology
Netherlands BV
(formerly RetailBox BV)
Netherland
Wipro Portugal S.A.(A) (Formerly
Enabler Informatica SA)
Portugal
Wipro Technologies Limited, Russia RussiaWipro Technologies Oy FinlandWipro Infrastructure Engineering
AB
Sweden
Wipro Infrastructure Engineering
Oy
Finland
Hydrauto Celka San ve Tic TurkeyWipro Technologies SRL Romania
Wipro Singapore Pte Limited SingaporePT WT Indonesia IndonesiaWipro Unza Holdings Limited(A) SingaporeWipro Technocentre (Singapore) Pte
Limited
Singapore
Wipro (Thailand) Co Limited ThailandWipro Bahrain Limited WLL Bahrain
Wipro Yardley FZE DubaiWipro Australia Pty Limited AustraliaWipro Networks Pte Limited (formerly
3D Networks Pte Limited)
Singapore
Planet PSG Pte Limited SingaporeWipro Technologies SDN BHD
(Formerly Planet PSG SDN BHD)
Malaysia
Wipro Chengdu Limited ChinaWipro Chandrika Limited* IndiaWMNETSERV Limited Cyprus
WMNETSERV (U.K.) Limited. U.K.WMNETSERV INC U.S.
Wipro Technology Services Limited IndiaWipro Airport IT Services Limited* IndiaWipro Infrastructure Engineering
Machinery (Changzhou) Co., Ltd.
China
*All the above direct subsidiaries are 100% held by the Company except that the Company hold 66.67% of the equity securities of
Wipro Arabia Limited, 90% of the equity securities of Wipro Chandrika Limited and 74% of the equity securities of Wipro Airport
IT Services Limited.

Consolidated Financial Statements Under IFRS
Wipro Limited 201
(A) Step Subsidiary details of Wipro Unza Holdings Limited, Wipro Holding Austria GmbH and Wipro Portugal S.A, are as follows :
Step Subsidiaries Step SubsidiariesCountry of
Incorporation
Wipro Unza Singapore Pte Limited Singapore
Wipro Unza Indochina Pte Limited Singapore
Wipro Unza Vietnam Co., Limited Vietnam
Wipro Unza Cathay Limited Hong Kong
Wipro Unza (China) Limited Hong Kong
Wipro Unza (Guangdong)
Consumer Products Limited. China
PT Unza Vitalis Indonesia
Wipro Unza (Thailand) Limited Thailand
Unza Overseas Limited
British virgin
islands
Unzafrica Limited Nigeria
Wipro Unza Middle East Limited
British virgin
islands
Unza International Limited
British virgin
islands
Unza Nusantara Sdn Bhd Malaysia
Unza Holdings Sdn Bhd Malaysia
Unza (Malaysia) Sdn Bhd Malaysia
UAA (M) Sdn Bhd Malaysia
Manufacturing Services Sdn Bhd Malaysia
Shubido Pacific Sdn Bhd(a) Malaysia
Gervas Corporation Sdn Bhd Malaysia
Gervas (B) Sdn Bhd Malaysia
Formapac Sdn Bhd Malaysia
Wipro Holding Austria GmbH AustriaNew Logic Technologies GmbH AustriaNew Logic Technologies SARL France
Wipro Portugal S.A.SAS Wipro France
(formerly Enabler France SAS)
France
Wipro Retail UK Limited
(formerly Enabler UK Limited)
U.K.
Wipro do Brasil Technologia Ltda
(formerly Enabler Brazil Ltda)
Brazil
Wipro Technologies Gmbh (formerly
Enabler & Retail Consult GmbH)
Germany
a) All the above subsidiaries are 100% held by the Company except Shubido Pacific Sdn Bhd in which the Company holds 62.55%
of the equity securities.
The list of controlled trusts are:
Name of entity Nature Country of Incorporation
Wipro Equity Reward Trust Trust India
Wipro Inc Benefit Trust Trust USA

Consolidated Financial Statements Under IFRS
202 Annual Report 2010-11
The other related parties are:
Name of entity Nature % of
holding
Country of
IncorporationWipro GE Healthcare Private Limited Associate 49% IndiaAzim Premji Foundation Entity controlled by DirectorAzim Premji Trust Entity controlled by DirectorHasham Premji (partnership firm) Entity controlled by DirectorPrazim Traders (partnership firm) Entity controlled by DirectorZash Traders (partnership firm) Entity controlled by DirectorRegal Investment Trading Company Private Limited Entity controlled by DirectorVidya Investment Trading Company Private Limited Entity controlled by DirectorNapean Trading Investment Company Private Limited Entity controlled by DirectorKey management personnel
- Azim Premji Chairman and Managing Director- Suresh C Senapaty Chief Financial Officer and Director- Suresh Vaswani Jt CEO, IT Business and Director(1)
- Girish S Paranjpe Jt CEO, IT Business and Director(1)
- T K Kurien CEO, IT Business and Director(2)
- Dr. Ashok Ganguly Non-Executive Director- Narayan Vaghul Non-Executive Director- Dr. Jagdish N Sheth Non-Executive Director- P.M Sinha Non-Executive Director- B.C. Prabhakar Non-Executive Director- Bill Owens Non-Executive Director- Dr. Henning Kagermann Non-Executive Director- Shyam Saran Non-Executive DirectorRelative of Key management personnel
- Rishad Premji Relative of the Key management personnel
(1) Upto January 31, 2011(2) W.e.f February 01,2011
The Company has the following related party transactions:
Transaction/ Balances Associate Entities controlled by
Directors
Key Management
Personnel
2009 2010 2011 2009 2010 2011 2009 2010 2011
Sale of goods and services 15 7 18 1 1 - - - -
Dividend - - - 4,418 4,418 10,362 230 234 536##
Royalty income 36 32 - - - - - - -
Key management personnel#
Remuneration and short-term benefits - - - - - - 85 175 260
Other benefits - - - - - - 32 34 30
Remuneration to relative of key
management personnel
- - - - - - 3 4 5
Balances as on March 31,Receivables - 1 7 - - - - - -
Payables - - - - 2 - 4 44 8
# Post employment benefit comprising gratuity, and compensated absences are not disclosed as these are determined for the
Company as a whole.## including relative of key management personnel.
29. Commitments and contingencies
Operating leases: The Company has taken office and residential
facilities under cancelable and non-cancelable operating lease
agreements that are renewable on a periodic basis at the option
of both the lessor and the lessee. The operating lease agreements
extend up to a maximum of fifteen years from their respective
dates of inception and some of these lease agreements have
price escalation clause. Rental payments under such leases were
` 2,526, ̀ 3,062 and ̀ 3,230, for the year ended March 31, 2009,
2010 and 2011, respectively.

Consolidated Financial Statements Under IFRS
Wipro Limited 203
Details of contractual payments under non-cancelable leases
are given below:
As at March 31,
2010 2011
Not later than one year ` 1,396 ` 1,828
Later than one year but not later
than five years
4,319 5,143
Later than five years 2,554 3,294
` 8,269 ` 10,265
Capital commitments: As at March 31, 2010 and 2011, the
Company had committed to spend approximately ` 2,782 and
` 2,071, respectively, under agreements to purchase property
and equipment. These amounts are net of capital advances paid
in respect of these purchases.
Guarantees: As at March 31, 2010 and 2011, performance
and financial guarantees provided by banks on behalf of the
Company to the Indian Government, customers and certain
other agencies amount to approximately ̀ 14,526 and ̀ 19,841,
respectively, as part of the bank line of credit.
Contingencies and lawsuits: The Company had received tax
demands from the Indian income tax authorities for the financial
years ended March 31, 2001, 2002, 2003 and 2004 aggregating
to ` 11,127 (including interest of ` 1,503). The tax demands
were primarily on account of the Indian income tax authority’s
denial of deductions claimed by the Company under Section
10A of the Income Tax Act 1961, in respect of profits earned
by the Company’s undertakings in Software Technology Park
at Bangalore. The appeals filed by the Company for the above
years to the first appellate authority were allowed in favor of the
Company, thus deleting a substantial portion of the demands
raised by the Income tax authorities. On further appeal filed
by the income tax authorities, the second appellate authority
upheld the claims of the Company for the years ended March
31, 2001, 2002, 2003 and 2004. In December 2008, the Company
received, on similar grounds, an additional tax demand of
` 5,388 (including interest of ` 1,615) for the financial year
ended March 31, 2005. The appeal filed before the first appellate
authority against the said order has been allowed in favour of
the Company thus deleting substantial demand raised by the
Income tax authorities.
In December 2009, the Company received the draft assessment
order, on similar grounds, with a demand of ` 6,757 (including
interest of ` 2,050) for the financial year ended March 31, 2006.
The Company had filed its objections against the said demand
before the Dispute Resolution Panel, which later issued directions
confirming the position of the assessing officer. Subsequently, the
assessing officer passed the final assessment order in October
2010 raising a tax demand of ` 7,218 (including interest of ` 2,510). The Company has filed an appeal against the said order
before the tribunal within the time limit permitted under the
statute.
In December 2010, the Company received the draft assessment
order, on similar grounds, with a demand of ` 7,747 (including
interest of ` 2,307) for the financial year ended March 31, 2007.
The Company has filed an objection against the said demand
before the Dispute Resolution Panel, within the time limit
permitted under the statute.
Considering the facts and nature of disallowance and the order
of the appellate authority upholding the claims of the Company
for earlier years, the Company believes that the final outcome
of the above disputes should be in favor of the Company and
there should not be any material impact on the consolidated
financial statements.
The Contingent liability in respect of disputed demands for
excise duty, custom duty, income tax, sales tax and other matters
amounts to ` 872, ` 1,384 and ` 1,472 as of March 31, 2009,
2010 and 2011, respectively.
The Company is subject to legal proceedings and claims which
have arisen in the ordinary course of its business. The resolution
of these legal proceedings is not likely to have a material and
adverse effect on the results of operations or the financial
position of the Company.
Other commitments: The Company’s Indian operations have
been established as unit in Special Economic Zone and Software
Technology Park Unit under plans formulated by the Government
of India. As per the plan, the Company’s India operations have
export obligations to the extent of foreign exchane net positive
(i.e. foreign exchange inflow – foreign exchange outflow should
be positive) over a five year period. The consequence of not
meeting this commitment in the future would be a retroactive
levy of import duties on certain hardware previously imported
duty free. As at March 31, 2011, the Company has met all
commitments required under the plan.
30. Segment Information
The Company is currently organized by segments, which includes
IT Services (comprising of IT Services and BPO Services), IT
Products, Consumer Care and Lighting and ‘Others’.
The Chairman of the Company has been identified as the
Chief Operating Decision Maker (CODM) as defined by IFRS 8,
Operating Segments. The Chairman of the Company evaluates
the segments based on their revenue growth, operating income
and return on capital employed. The management believes
that return on capital employed is considered appropriate for
evaluating the performance of its operating segments. Return
on capital employed is calculated as operating income divided
by the average of the capital employed at the beginning and at
the end of the period. Capital employed includes total assets of
the respective segments less all liabilities, excluding loans and
borrowings.

Consolidated Financial Statements Under IFRS
204 Annual Report 2010-11
Information on reportable segments is as follows:
Year ended March 31, 2009
IT Services and Products Consumer
Care and
Lighting
Others Reconciling
Items
Entity
TotalIT
Services
IT
Products
Total
Revenues 191,613 34,277 225,890 19,249 8,995 1,204 255,338
Cost of revenues (128,473) (30,886) (159,359) (10,782) (8,679) (1,395) (180,215)
Selling and marketing expenses (10,581) (1,361) (11,942) (4,750) (294) (327) (17,313)
General and administrative expenses (12,271) (667) (12,938) (1,125) (316) (131) (14,510)
Operating income of segment 40,288 1,363 41,651 2,592 (294) (649) 43,300
Finance expense (3,824)
Finance and other income 5,057
Share of profits of equity accounted
investees 362
Profit before tax 44,895
Income tax expense (6,035)
Profit for the year 38,860
Depreciation and amortization expense 6,192 377 268 111 6,948
Total assets 181,303 22,862 6,748 73,342 284,255
Total liabilities 70,869 5,803 2,465 57,737 136,874
Opening capital employed 93,845 17,359 6,149 53,080 170,433
Closing capital employed 115,089 18,782 5,638 64,763 204,272
Average capital employed 104,467 18,070 5,893 58,923 187,353
Return on capital employed 40% 14% (5)% - 23%
Additions to:
Goodwill 5,437 - - - 5,437
Intangible assets 1,629 124 - - 1,753
Property, plant and equipment 14,463 726 445 646 16,280
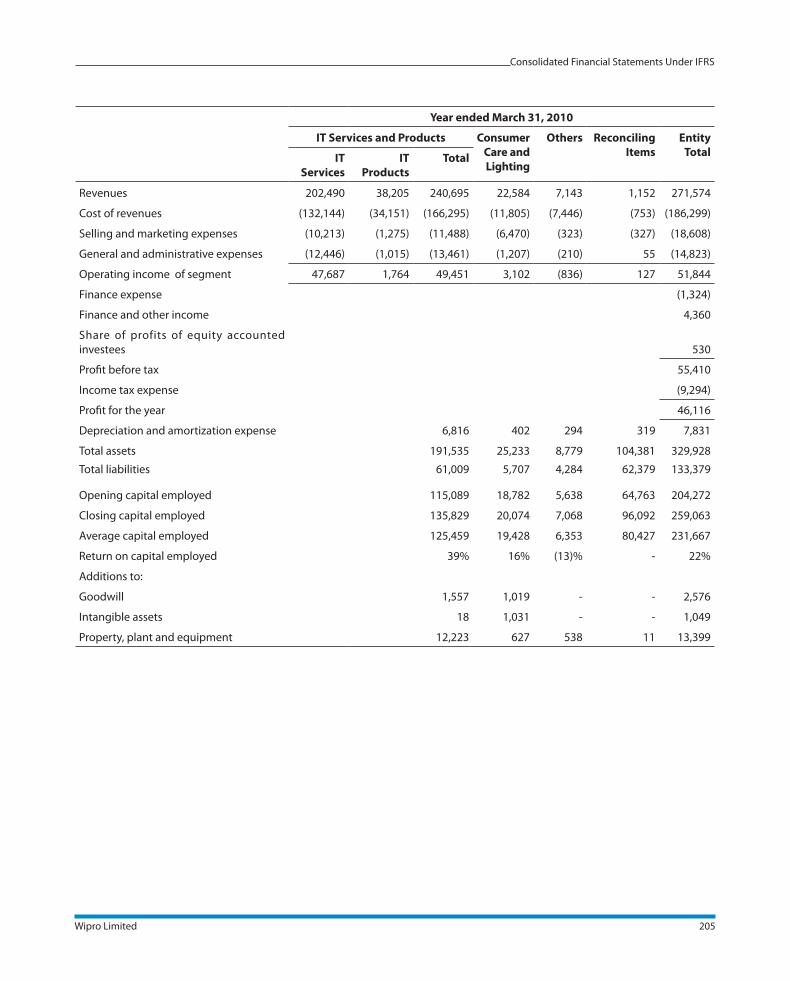
Consolidated Financial Statements Under IFRS
Wipro Limited 205
Year ended March 31, 2010
IT Services and Products Consumer
Care and
Lighting
Others Reconciling
Items
Entity
TotalIT
Services
IT
Products
Total
Revenues 202,490 38,205 240,695 22,584 7,143 1,152 271,574
Cost of revenues (132,144) (34,151) (166,295) (11,805) (7,446) (753) (186,299)
Selling and marketing expenses (10,213) (1,275) (11,488) (6,470) (323) (327) (18,608)
General and administrative expenses (12,446) (1,015) (13,461) (1,207) (210) 55 (14,823)
Operating income of segment 47,687 1,764 49,451 3,102 (836) 127 51,844
Finance expense (1,324)
Finance and other income 4,360
Share of profits of equity accounted
investees 530
Profit before tax 55,410
Income tax expense (9,294)
Profit for the year 46,116
Depreciation and amortization expense 6,816 402 294 319 7,831
Total assets 191,535 25,233 8,779 104,381 329,928
Total liabilities 61,009 5,707 4,284 62,379 133,379
Opening capital employed 115,089 18,782 5,638 64,763 204,272
Closing capital employed 135,829 20,074 7,068 96,092 259,063
Average capital employed 125,459 19,428 6,353 80,427 231,667
Return on capital employed 39% 16% (13)% - 22%
Additions to:
Goodwill 1,557 1,019 - - 2,576
Intangible assets 18 1,031 - - 1,049
Property, plant and equipment 12,223 627 538 11 13,399

Consolidated Financial Statements Under IFRS
206 Annual Report 2010-11
Year ended March 31, 2011
IT Services and Products Consumer
Care and
Lighting Others
Reconciling
Items
Entity
Total
IT
Services
IT
Products Total
Revenues 234,850 36,910 271,760 27,258 10,896 1,073 310,987
Cost of revenues (153,446) (32,843) (186,289) (15,142) (10,160) (1,217) (212,808)
Selling and marketing expenses (12,642) (1,284) (13,926) (7,514) (491) (241) (22,172)
General and administrative expenses (15,355) (1,174) (16,529) (1,152) (342) (316) (18,339)
Operating income of segment 53,407 1,609 55,016 3,450 (97) (701) 57,668
Finance expense (1,933)
Finance and other income 6,652
Share of profits of equity accounted
investees 648
Profit before tax 63,035
Income tax expense (9,714)
Profit for the year 53,321
Depreciation and amortization expense 7,088 433 328 362 8,211
Total assets 216,511 27,829 10,475 116,628 371,443
Total liabilities 60,998 5,726 5,343 59,005 131,072
Opening capital employed 135,829 20,074 7,068 96,092 259,063
Closing capital employed 159,480 22,249 7,418 104,029 293,176
Average capital employed 147,654 21,161 7,243 100,061 276,119
Return on capital employed 37% 16% (1)% - 21%
Additions to:
Goodwill 54 - - - 54
Intangible assets 28 8 - - 36
Property, plant and equipment 12,647 400 707 891 14,645
The Company has four geographic segments: India, the United
States, Europe and Rest of the world. Revenues from the
geographic segments based on domicile of the customer are
as follows:
Year ended March 31,
2009 2010 2011
India ` 54,945 ` 62,179 ` 67,904
United States 115,022 119,870 129,217
Europe 57,109 56,780 68,159
Rest of the world 28,262 32,745 45,707
` 255,338 ` 271,574 ` 310,987
No client individually accounted for more than 10% of the
revenues during the year ended March 31, 2009, 2010 and
2011.
Notes:
a) The company has the following reportable segments:
i) IT Services: The IT Services segment provides IT and IT
enabled services to customers. Key service offering includes
software application development, application maintenance,
research and development services for hardware and software
design, data center outsourcing services and business process
outsourcing services.
ii) IT Products: The IT Products segment sells a range of
Wipro personal desktop computers, Wipro servers and Wipro
notebooks. The Company is also a value added reseller of
desktops, servers, notebooks, storage products, networking
solutions and packaged software for leading international
brands. In certain total outsourcing contracts of the IT Services
segment, the Company delivers hardware, software products
and other related deliverables. Revenue relating to these items
is reported as revenue from the sale of IT Products.

Consolidated Financial Statements Under IFRS
Wipro Limited 207
iii) Consumer care and lighting: The Consumer Care and
Lighting segment manufactures, distributes and sells personal
care products, baby care products, lighting products and
hydrogenated cooking oils in the Indian and Asian markets.
iv) The Others’ segment consists of business segments that do
not meet the requirements individually for a reportable segment
as defined in IFRS 8.
v) Corporate activities such as treasury, legal and accounting,
which do not qualify as operating segments under IFRS 8, and
elimination of inter-segment transactions have been considered
within ‘reconciling items’.
b) Revenues include excise duty of ̀ 1,054, ̀ 842 and ̀ 1,007
for the year ended March 31, 2009, 2010 and 2011, respectively.
For the purpose of segment reporting, the segment revenues are
net of excise duty. Excise duty is reported in reconciling items.
c) For the purpose of segment reporting only, the Company
has included the impact of ‘foreign exchange gains / (losses),
net in revenues (which is reported as a part of operating profit
in the statement of income).
d) For evaluating performance of the individual business
segments, stock compensation expense is allocated on the
basis of straight line amortization. The incremental impact of
accelerated amortization of stock compensation expense over
stock compensation expense allocated to the individual business
segments is reported in reconciling items.
e) For evaluating the performance of the individual business
segments, amortization of intangibles acquired through business
combinations are reported in reconciling items. Accordingly,
comparative period information has been reclassified.
f ) The Company generally offers multi-year payment
terms in certain total outsourcing contracts. These payment
terms primarily relate to IT hardware, software and certain
transformation services in outsourcing contracts. Corporate
treasury provides internal financing to the business units offering
multi-year payment terms. Accordingly, such receivables are
reflected in capital employed in reconciling items. As of March
31, 2009, 2010 and 2011, capital employed in reconciling items
includes ` 5,549, ` 8,516 and ` 12,255, respectively, of such
receivables on extended collection terms.
g) Operating income of segments is after recognition of stock
compensation expense arising from the grant of options:
Segments Year ended March 31,
2009 2010 2011
IT Services ` 1,523 ` 1,159 ` 1,214
IT Products 112 93 90
Consumer Care and
Lighting
76 71 112
Others 21 18 31
Reconciling items 136 (39) (355)
Total ` 1,868 ` 1,302 ` 1,092
h) Management believes that it is currently not practicable
to provide disclosure of geographical location wise assets,
since the meaningful segregation of the available information
is onerous.

Consolidated Financial Statements Under IFRS
208 Annual Report 2010-11
A&D Aerospace & Defence
ADM Application Development & Maintenance
ADR American Depository Receipt
APAC Asia Pacific
ASEAN Association of Southeast Asian Nations
BFSI Banking & Financial Services
BPO Business Process Outsourcing
BPS Basis Point
CAGR Compounded Annual Growth Rate
CCLG Consumer Care & Lighting
CEM Client Engagement Manager
CFL Compact Fluorescent Lamps
CMSP Communication & Service Provider
COSO Company of Sponsoring Trade way Organisation
CPG Consumer Packaged Goods
CSAT Customer Satisfaction
CTI Computer Telephony Interface
FMCG Fast Moving Consumer Goods
FPP Fixed Price Projects
IFRS International Financial Reporting Standards
IP Intellectual Property
IT Products Information Technology Products
IT Services Information Technology Services
ITES Information Technology Enabled Services
LAN Local Area Network
LATAM Latin America
LED Light Emitting Diode
LEED Leadership in Energy and Environmental Designs
M2M Machine to Machine
NASSCOM National Association of Software and Services
Companies
NUI Natural User Interface
OEM Original Equipment Manufacturer
RSU Restricted Stock Unit
WAN Wide Area Network
WIN Wipro Infrastructure Engineering
Glossary


ww
w.a
rinsi
ght.c
om