Embed Size (px)
Citation preview

___________________________________________________________________________
Results of the WIPO Arbitration and Mediation Center International Survey on Dispute Resolution in Technology Transactions
WIPO Arbitration and Mediation Center 34 chemin des Colombettes 1211 Geneva 20, Switzerland T +4122 338 8247 E [email protected] http://www.wipo.int/amc March 2013

WIPO Center International Survey on Dispute Resolution in Technology Transactions - 2
Table of Contents
Page
Executive Summary 3
Objective 3
Respondents and Results 3
Introduction 8
Acknowledgments 8
Respondents and Results 9
1. Survey Respondents 9
2. Technology-related Agreements Concluded in the Past Two Years 12
3. Agreements Leading Most Often to Disputes 17
4. Choice of Dispute Resolution Clauses 19
5. Types of Technology Disputes and Party Objectives 24
6. Mechanisms Used to Resolve Disputes: Type, Time and Costs 26
6.1. Type 26
6.2. Time and Costs 30
7. Observations for Dispute Resolution in Technology Transactions 34
General Methodology 35
Selected Terms 36
Annex I – Members of the Expert Group for the Preparation of the Survey 37
Annex II – Additional Charts 38
Annex III – WIPO International Survey on Dispute Resolution in Technology Transactions (Questionnaire)
44

WIPO Center International Survey on Dispute Resolution in Technology Transactions - 3
Executive Summary Objective The World Intellectual Property Organization’s (WIPO) Arbitration and Mediation Center (WIPO Center)
designed the International Survey on Dispute Resolution in Technology Transactions (Survey) to assess the current use in technology-related disputes of Alternative Dispute Resolution (ADR) methods as compared to court litigation, including a qualitative evaluation of these dispute resolution options.
The results of this Survey provide a statistical basis to identify trends in the resolution of technology-related disputes. Best practices emerge from the Survey which may help guide intellectual property (IP) stakeholders in their dispute resolution strategies and this Report concludes with a number of observations relevant to such strategies. The Survey Respondents’ needs identified also help inform the WIPO Center’s ADR services.
The Survey has been developed with the support of the International Association for the Protection of Intellectual Property (AIPPI), the Association of University Technology Managers (AUTM), the Fédération Internationale des Conseils en Propriété Industrielle (FICPI) and the Licensing Executives Society International (LESI) in collaboration with in-house counsel and external experts in technology disputes from different jurisdictions and business areas. Their collective experience with disputes is reflected in the content, scope and structure of the questionnaire; they also assisted in its distribution.
Respondents and Results The core findings of the Survey are as follows.
1. Survey Respondents
393 Respondents from 62 countries completed the Survey. 63 Respondents from 28 countries complemented their written responses with a telephone interview.
Respondents are based in Europe, North America, Asia, South America, Oceania, the Caribbean, Central America and Africa1.
Respondents are law firms, companies, research organizations, universities, government bodies or are self-employed. Respondents range from entities of 1-10 employees to entities of more than 10,000 employees. Respondents are active in different business areas, including pharmaceuticals, biotechnology, IT, electronics, telecom, life sciences, chemicals, consumer goods and mechanical.
2. Technology-related Agreements Concluded in the Past Two Years
Of the types of agreements listed in the Survey, Respondents concluded most frequently non-disclosure agreements (NDA), followed by assignments, licenses2, agreements on settlement of litigation, research and development (R&D) agreements and merger and acquisition (M&A) agreements.
The subject matter of such agreements related more often to patents than to know-how or copyright.
1 Except as indicated otherwise, Survey results are presented in order of frequency. 2 The questionnaire listed licenses, cross-licenses and pool-licenses in one category, referred to as “licenses” in this Report.

WIPO Center International Survey on Dispute Resolution in Technology Transactions - 4
More than 90% of Respondents concluded agreements with parties from other jurisdictions. 80% of Respondents concluded patent-related agreements with parties from other jurisdictions on technology patented in at least two countries.
The choice of applicable law made in these agreements was influenced by the location of Respondent headquarters and the primary place of operations.
3. Agreements Leading Most Often to Disputes
Respondents were asked to estimate what percentage of the technology-related agreements they concluded led to disputes. As such agreements, the questionnaire listed, in this order, NDAs, R&D agreements, licenses, settlement agreements, M&A agreements and assignments.
While, overall, disputes occurred in relation to some 2% of Respondents’ technology-related agreements, more than half of Respondents stated that out of the agreements listed in the Survey less than 1% of licenses, R&D agreements, NDAs, settlement agreements, assignments and M&A agreements led to disputes. On the other hand, 7% of Respondents stated that more than 10% of their licensing agreements led to disputes.
Indeed, among technology-related agreements, licenses most frequently give rise to disputes (25% of Respondents). R&D agreements rank second (18% of Respondents), followed by NDAs (16%), settlement agreements (15%), assignments (13%), and M&A agreements (13%).
4. Choice of Dispute Resolution Clauses
94% of Respondents indicated that negotiating dispute resolution clauses forms part of their contract negotiations.
Court litigation was the most common stand-alone dispute resolution clause (32%), followed by (expedited) arbitration (30%) and mediation (12%). Mediation is also included where parties use multi-tier clauses (17% of all clauses) prior to court litigation, (expedited) arbitration or expert determination.
Respondents generally perceived a trend towards out-of-court dispute resolution mechanisms.
The choice of arbitral institution broadly corresponds to the location of Respondent headquarters.
Cost and time are the principal considerations for Respondents when negotiating dispute resolution clauses, both in domestic and international agreements.
For international agreements, Respondents placed a higher value on enforceability and forum neutrality than they did for domestic transactions.
Enforceability also ranked as a motivating factor among Respondents using court litigation and arbitration clauses. Finding a business solution was an important factor for Respondents choosing mediation.

WIPO Center International Survey on Dispute Resolution in Technology Transactions - 5
Source: WIPO Arbitration and Mediation Center, International Survey on Dispute Resolution in Technology Transactions
Main Considerations When Negotiating Dispute Resolution Clauses
6%
8%
6%
30%
33%
18%
45%
33%
60%
71%
5%
5%
9%
29%
32%
36%
44%
52%
56%
71%
0% 10% 20% 30% 40% 50% 60% 70% 80%
Setting Precedent
None in Particular (Standard Internal Practice)
Support Provided by Institution
Business Solution
Confidentiality
Neutral Forum
Quality Outcome (Including Specialization ofDecision-Maker)
Enforceability
Time
Costs
Percentage of Respondents
International Agreements Domestic Agreements
5. Types of Technology Disputes and Party Objectives
For contractual and non-contractual disputes, patent issues arose nearly twice as often as copyright or know-how issues.
The main objectives of claimant parties in patent disputes were to obtain damages/royalties (78%), a declaration of patent infringement (74%), and/or injunctions (53%).
The main objectives of respondent parties in patent disputes were a declaration of patent invalidity (73%), a negative declaratory judgment (33%), and/or a declaration of patent infringement (33%).
6. Mechanisms Used to Resolve Disputes: Type, Time and Costs
6.1. Type
Broadly consistent with the above findings concerning the choice of dispute resolution clauses, the most common mechanism used to resolve technology disputes was court litigation in Respondents’ home jurisdiction, followed by court litigation in another jurisdiction, arbitration, mediation, expedited arbitration and expert determination.

WIPO Center International Survey on Dispute Resolution in Technology Transactions - 6
Source: WIPO Arbitration and Mediation Center, International Survey on Dispute Resolution in Technology Transactions
Relative Use of Court Litigation, (Expedited) Arbitration, Mediation, Expert Determination
29% of Respondents indicated that they had submitted a dispute to mediation before or during court litigation involving contractual patent, copyright and/or know-how issues.
6.2. Time and Costs
Respondents indicated that they spent more time and incurred significantly higher costs in court litigation than in arbitration and mediation.
Respondents estimated that court litigation in their home jurisdiction took on average approximately 3 years and court litigation in another jurisdiction took on average 3.5 years.
Respondents estimated that legal costs incurred in court litigation in their home jurisdiction amounted on average to USD 475,000, and legal costs of court litigation in another jurisdiction amounted to slightly over USD 850,000.
Respondents indicated that mediation took on average 8 months, and 91% of Respondents stated that costs of mediation typically did not exceed USD 100,000.
Respondents indicated that arbitration took on average slightly more than 1 year and cost on average slightly over USD 400,000.
Apart from monetary amounts, 25% of Respondents identified management time of business executives and wasted time of other participants in proceedings, lost productivity and lost business opportunities as costs incurred.

WIPO Center International Survey on Dispute Resolution in Technology Transactions - 7
Source: WIPO Arbitration and Mediation Center, International Survey on Dispute Resolution in Technology Transactions
Relative Time and Costs of Resolving Disputes through Court Litigation, (Expedited) Arbitration, Mediation, Expert Determination

WIPO Center International Survey on Dispute Resolution in Technology Transactions - 8
Introduction Based in Geneva, Switzerland, and with an office in Singapore, the WIPO Arbitration and Mediation
Center (WIPO Center) offers Alternative Dispute Resolution (ADR) options for the resolution of international commercial disputes between private parties. Developed by leading experts in cross-border dispute settlement, the arbitration, mediation and expert determination procedures offered by the WIPO Center are recognized as particularly appropriate for technology and other disputes involving intellectual property (IP).
In their contract negotiations, parties frequently choose their dispute resolution mechanism without the benefit of comparative information. The WIPO Center developed the International Survey on Dispute Resolution in Technology Transactions (Survey) to offer parties a statistical base for their choice of dispute resolution mechanisms. The Survey furthermore helps inform the WIPO Center’s services.
This Report presents the results of the Survey3. It includes an assessment of the current use of ADR as compared to court litigation in technology-related disputes, and a qualitative evaluation of these dispute resolution options. The Survey thus sheds light on party dispute resolution strategies and on best practices in technology dispute resolution.
The Survey has been developed with the external support of the International Association for the Protection of Intellectual Property (AIPPI), the Association of University Technology Managers (AUTM), the Fédération Internationale des Conseils en Propriété Industrielle (FICPI) and the Licensing Executives Society International (LESI) in collaboration with in-house counsel and external experts in technology disputes from different jurisdictions and business areas. Their collective experience with disputes is reflected in the content, scope and structure of the questionnaire; they also assisted in its distribution.
Acknowledgements The WIPO Center would like to thank all those who contributed to the development, implementation and evaluation of the Survey. In particular the WIPO Center thanks the experts who provided valuable input at the initial expert group meeting for the preparation of the questionnaire (list of participants in Annex I). Thanks are also due to AIPPI, AUTM, FICPI and LESI for their support in the development and distribution of the Survey, and to further associations which facilitated distribution. The WIPO Center is also grateful to the WIPO Economics and Statistics Division for supporting the design of the questionnaire and the analysis of the results. Special thanks are given to all Respondents from companies, research organizations, universities, government bodies, law firms or otherwise engaged who took the time to complete the Survey; this Report aims to capture their extensive experience in the area of technology disputes.
3 See the General Methodology Section.

WIPO Center International Survey on Dispute Resolution in Technology Transactions - 9
Respondents and Results 1. Survey Respondents
Summary
393 Respondents from 62 countries completed the Survey. 63 Respondents from 28 countries complemented their written responses with a telephone interview.
Respondents are based in Europe, North America, Asia, South America, Oceania, the Caribbean, Central America and Africa.
Respondents are law firms, companies, research organizations, universities, government bodies or are self-employed. Respondents range from entities of 1-10 employees to entities of more than 10,000 employees. Respondents are active in different business areas, including pharmaceuticals, biotechnology, IT, electronics, telecom, life sciences, chemicals, consumer goods and mechanical.
Worldwide Participation
The WIPO Center received 393 responses from Respondents based in 62 countries. In addition to completing the Survey, 63 Respondents from 28 countries gave telephone interviews.
52% of Respondents have their headquarters in Europe, 20% in North America, 15% in Asia, 7% in South America, 3% in Oceania, 2% in the Caribbean and Central America and 1% in Africa. 35% of Respondents indicated to operate on at least two continents.
Europe52%
North America20%
Asia15%
South America7%
Oceania3%
The Caribbean and Central America
2%Africa1%
Germany 11%France 7%Switzerland 7%United Kingdom 6%Spain 6%Italy 3%The Netherlands 2%Other European Countries 10%
United States of America 17%Canada 2%Other North American Countries 1%
Japan 5%Singapore 2%China 2%Other Asian Countries 6%
Brazil 2%Colombia 2%Other South American Countries 3%
Source: WIPO Arbitration and Mediation Center, International Survey on Dispute Resolution in Technology Transactions
Chart 1: Location of Respondents' Headquarters
WIPO Center International Survey on Dispute Resolution in Technology Transactions - 10
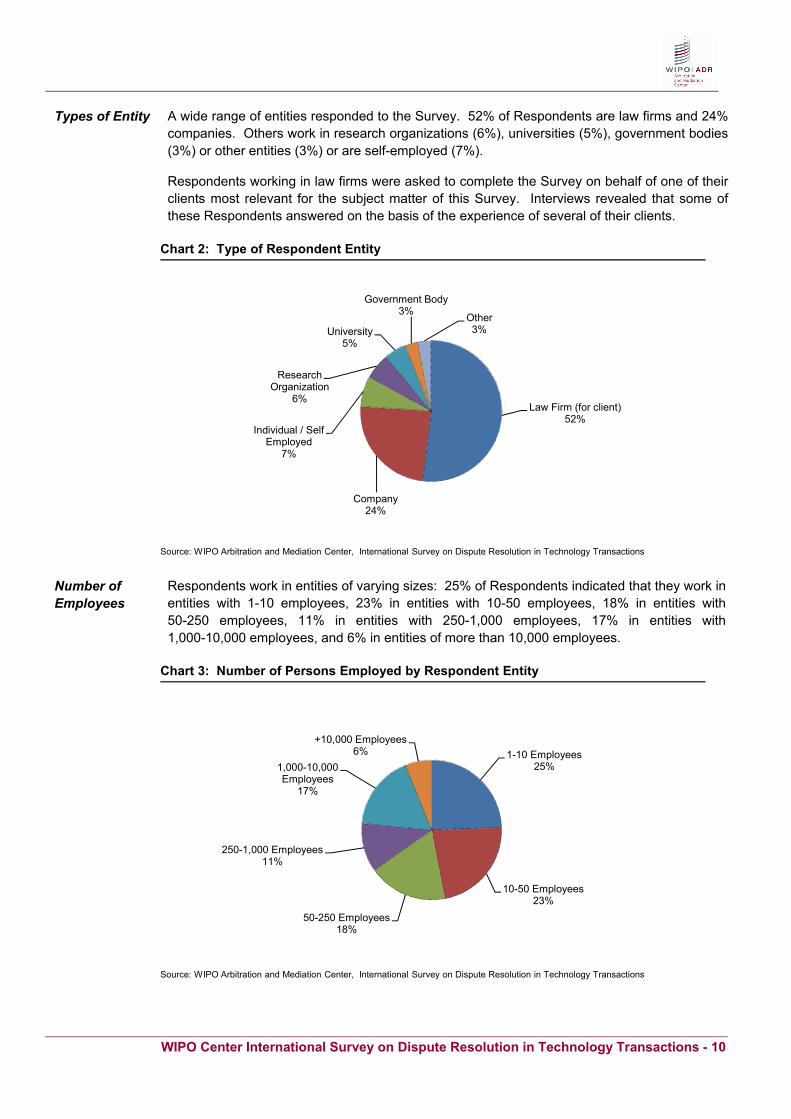
Types of Entity
A wide range of entities responded to the Survey. 52% of Respondents are law firms and 24% companies. Others work in research organizations (6%), universities (5%), government bodies (3%) or other entities (3%) or are self-employed (7%).
Respondents working in law firms were asked to complete the Survey on behalf of one of their clients most relevant for the subject matter of this Survey. Interviews revealed that some of these Respondents answered on the basis of the experience of several of their clients.
Law Firm (for client)52%
Company24%
Individual / Self Employed
7%
Research Organization
6%
University5%
Government Body3% Other
3%
Source: WIPO Arbitration and Mediation Center, International Survey on Dispute Resolution in Technology Transactions
Chart 2: Type of Respondent Entity
Number of Employees
Respondents work in entities of varying sizes: 25% of Respondents indicated that they work in entities with 1-10 employees, 23% in entities with 10-50 employees, 18% in entities with 50-250 employees, 11% in entities with 250-1,000 employees, 17% in entities with 1,000-10,000 employees, and 6% in entities of more than 10,000 employees.
1-10 Employees25%
10-50 Employees23%
50-250 Employees18%
250-1,000 Employees11%
1,000-10,000 Employees
17%
+10,000 Employees6%
Source: WIPO Arbitration and Mediation Center, International Survey on Dispute Resolution in Technology Transactions
Chart 3: Number of Persons Employed by Respondent Entity
WIPO Center International Survey on Dispute Resolution in Technology Transactions - 11
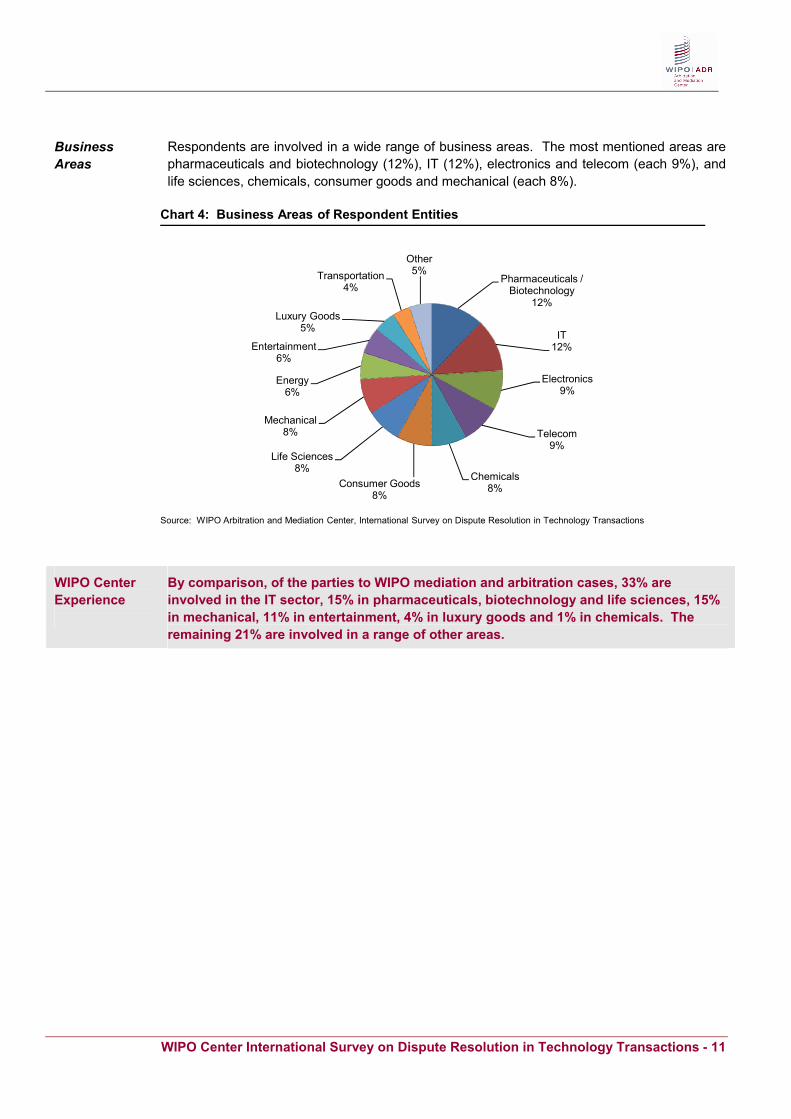
Business Areas
Respondents are involved in a wide range of business areas. The most mentioned areas are pharmaceuticals and biotechnology (12%), IT (12%), electronics and telecom (each 9%), and life sciences, chemicals, consumer goods and mechanical (each 8%).
Source: WIPO Arbitration and Mediation Center, International Survey on Dispute Resolution in Technology Transactions
Chart 4: Business Areas of Respondent Entities
Pharmaceuticals / Biotechnology
12%
IT12%
Electronics9%
Telecom9%
Chemicals8%Consumer Goods
8%
Life Sciences8%
Mechanical8%
Energy6%
Entertainment6%
Luxury Goods5%
Transportation4%
Other5%
WIPO Center Experience
By comparison, of the parties to WIPO mediation and arbitration cases, 33% are involved in the IT sector, 15% in pharmaceuticals, biotechnology and life sciences, 15% in mechanical, 11% in entertainment, 4% in luxury goods and 1% in chemicals. The remaining 21% are involved in a range of other areas.

WIPO Center International Survey on Dispute Resolution in Technology Transactions - 12
2. Technology-related Agreements Concluded in the Past Two Years
Summary
Of the types of agreements listed in the Survey, Respondents concluded most frequently NDAs, followed by assignments, licenses, agreements on settlement of litigation, R&D agreements and M&A agreements.
The subject matter of such agreements related more often to patents than to know-how or copyright.
More than 90% of Respondents concluded agreements with parties from other jurisdictions. 80% of Respondents concluded patent-related agreements with parties from other jurisdictions on technology patented in at least two countries.
The choice of applicable law made in these agreements was influenced by the location of Respondent headquarters and the primary place of operations.
Types and Number of Agreements
The number of technology-related agreements concluded by Respondents in the past two years varies widely with the type and size of entity. Responses have been analyzed by breaking down the replies in two categories. Covering only those Respondents who do not conclude more than 50 agreements of any one type, Chart 5.1 shows the average number of agreements concluded by Respondents. These Respondents on average concluded a total of 59 technology-related agreements in the past two years.
Source: WIPO Arbitration and Mediation Center, International Survey on Dispute Resolution in Technology Transactions
Chart 5.1: Average Number of Agreements by Type Concluded by Respondents in the Past Two Years (Excluding Respondents Which Concluded More Than 50 Agreements of Any One Type)
6
7
9
10
11
16
0 5 10 15 20
Mergers & Acquisitions (M&A)
Research & Development (R&D)Agreements
Agreements on Settlement of Litigation
Licenses / Cross-licenses / Pool-licenses
Assignments
Non-disclosure Agreements (NDA)
Average Number of Agreements
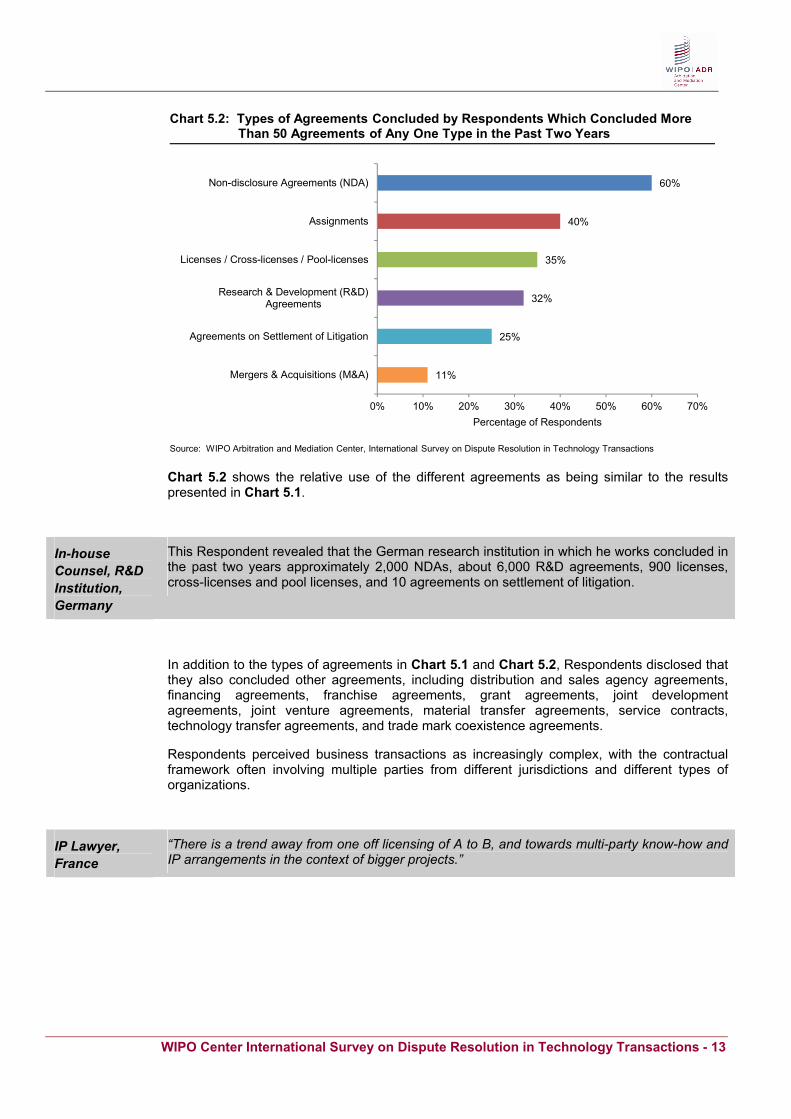
Chart 5.2, covering the second category of replies, includes Respondents who indicated that they concluded more than 50 of at least one of the types of agreements referred to in Chart 5.2. For example, 70% of Respondents working in entities with more than 10,000 employees selected the +50 category for at least one of the types of agreements.
WIPO Center International Survey on Dispute Resolution in Technology Transactions - 13
Source: WIPO Arbitration and Mediation Center, International Survey on Dispute Resolution in Technology Transactions
Chart 5.2: Types of Agreements Concluded by Respondents Which Concluded More Than 50 Agreements of Any One Type in the Past Two Years
11%
25%
32%
35%
40%
60%
0% 10% 20% 30% 40% 50% 60% 70%
Mergers & Acquisitions (M&A)
Agreements on Settlement of Litigation
Research & Development (R&D)Agreements
Licenses / Cross-licenses / Pool-licenses
Assignments
Non-disclosure Agreements (NDA)
Percentage of Respondents
Chart 5.2 shows the relative use of the different agreements as being similar to the results presented in Chart 5.1.
In-house Counsel, R&D Institution, Germany
This Respondent revealed that the German research institution in which he works concluded in the past two years approximately 2,000 NDAs, about 6,000 R&D agreements, 900 licenses, cross-licenses and pool licenses, and 10 agreements on settlement of litigation.
In addition to the types of agreements in Chart 5.1 and Chart 5.2, Respondents disclosed that they also concluded other agreements, including distribution and sales agency agreements, financing agreements, franchise agreements, grant agreements, joint development agreements, joint venture agreements, material transfer agreements, service contracts, technology transfer agreements, and trade mark coexistence agreements.
Respondents perceived business transactions as increasingly complex, with the contractual framework often involving multiple parties from different jurisdictions and different types of organizations.
IP Lawyer, France
“There is a trend away from one off licensing of A to B, and towards multi-party know-how and IP arrangements in the context of bigger projects.”

WIPO Center International Survey on Dispute Resolution in Technology Transactions - 14
Subject Matter of Agreements
Asked to indicate which percentage of the agreements related to patents, know-how and copyright they concluded in the past two years, Respondents indicated that they concluded more patent-related agreements than know-how or copyright-related agreements4. For a detailed analysis see Annex II, Additional Chart A1 (page 38).
30%
22%
17%
0%
5%
10%
15%
20%
25%
30%
35%
Patents Know-how Copyright
Source: WIPO Arbitration and Mediation Center, International Survey on Dispute Resolution in Technology Transactions
Chart 6: Average Share of Agreements Related to Patents, Know-how, and CopyrightConcluded by Respondents in the Past Two Years
International Scope of Agreements
More than 90% of Respondents indicated that they concluded agreements with parties from other jurisdictions. 28% of Respondents indicated that 60% of their agreements involved parties from other jurisdictions.
80% of Respondents stated that they concluded patent-related agreements involving parties from other jurisdictions concerning technology patented in at least two countries. 29% of Respondents indicated that this was the case in more than 60% of such agreements.
4 Statistics for Chart 6 were generated by assigning, for each Respondent, a value equivalent to the midpoint of the range (None = 0%; 1-5% = 3%, 5-30% = 17.5%, 30-60% = 45%, +60% = 80%), and averaging over all responses.

WIPO Center International Survey on Dispute Resolution in Technology Transactions - 15
Source: WIPO Arbitration and Mediation Center, International Survey on Dispute Resolution in Technology Transactions
Related to Technology Patented in
One Jurisdiction
20%
Related to Technology Patented in More Than
One Jurisdiction
80%
___________________________________________________
Chart 7.2: Respondents Having ConcludedAgreements with Parties from OtherJurisdictions in the Past Two Years Related to Technology Patentedin at Least Two Jurisdictions___________________________________________________
Chart 7.1: Respondents Having ConcludedTechnology Agreements with Partiesfrom Other Jurisdictions in the Past Two Years
With Parties from the Same
Jurisdiction Only 10%
With Parties from Other
Jurisdictions90%
Increasing Trend In Filing Patent Applications Abroad
Patenting strategies reflect internationalization. The World Intellectual Property Indicators Report 2012 confirms a long-term trend of inventors increasingly patenting inventions abroad in a larger number of countries5. This trend is also reflected in data about patent filings under the Patent Cooperation Treaty (PCT). For example, in 2010, based on an annual growth rate of 7.7%, the number of PCT national phase entries totaled 477,5006.
WIPO Center Experience
71% of WIPO mediation and arbitration cases administered have been international in scope. Parties were based in a range of jurisdictions, including, in alphabetical order, Austria, China, Cyprus, Denmark, Finland, France, Germany, India, Ireland, Israel, Italy, Japan, Malta, the Netherlands, Panama, Romania, the Russian Federation, South Africa, Spain, Switzerland, Turkey, the United Kingdom and the United States of America (USA).
Of patent-related WIPO arbitrations and mediations, 92% have been international in scope.
Applicable Laws
Respondents were asked about the substantive laws applicable to the technology-related agreements they have concluded over the past two years. They could select some of the more frequently designated laws in the WIPO Center’s experience including, in alphabetical order, Belgian law, Chinese law, Dutch law, English law, French law, German law, Japanese law, Singapore law, Swiss law, US law (with a specific mention of the laws of California, Delaware
5 World Intellectual Property Indicators Report 2012, pages 43 and 45. 6 PCT Yearly Review 2012, page 11.

WIPO Center International Survey on Dispute Resolution in Technology Transactions - 16
and New York), and could also indicate other jurisdictions.
Chart 8 presents the distribution among Survey responses for the choice of law most often utilized by Respondents in agreements.
US New York15%
English15%
German14%
US California11%
Swiss10%
French9%
US Delaware8%
Japanese5%
Belgian4%
Chinese3%
Singapore3%
Dutch3%
Source: WIPO Arbitration and Mediation Center, International Survey on Dispute Resolution in Technology Transactions
Chart 8: Selected Substantive Laws Applicable to Agreements Concluded by Respondents in the Past Two Years
Among the factors impacting the choice of applicable law, two factors appearing to drive the choice of the applicable law are the place where Respondents are headquartered and their primary place of operations. This reflects a link between the composition of Survey participation and the results of this question.
For example, Respondents based in Europe selected mainly English, German and Swiss law. Respondents based in North America selected mainly New York, California, Delaware law and English law. Respondents based in Asia selected mainly Japanese, English, New York, Singapore, California and Chinese law.
139 Respondents specified other applicable laws including Spanish, Swedish, Australian, Brazilian and Canadian law. Here again, Respondents’ selection confirmed the link between the location of Respondents headquarters and operations, and the choice of applicable law.
In-house Counsel, ICT Company, Italy
A Respondent working at an Italian ICT company with over 10,000 employees indicated that Italian law was included as applicable law in 40% of all contracts, whereas this company concluded more than 60% of its agreements with parties from other jurisdictions.

WIPO Center International Survey on Dispute Resolution in Technology Transactions - 17
3. Agreements Leading Most Often to Disputes
Summary
Respondents were asked to estimate what percentage of the technology-related agreements they concluded led to disputes. As such agreements, the questionnaire listed, in this order, NDAs, R&D agreements, licenses, settlement agreements, M&A agreements and assignments.
While, overall, disputes occurred in relation to some 2% of Respondents’ technology-related agreements, more than half of Respondents stated that out of the agreements listed in the Survey less than 1% of licenses, R&D agreements, NDAs, settlement agreements, assignments and M&A agreements led to disputes. On the other hand, 7% of Respondents stated that more than 10% of their licensing agreements led to disputes.
Indeed, among technology-related agreements, licenses most frequently give rise to disputes (25% of Respondents). R&D agreements rank second (18% of Respondents), followed by NDAs (16%), settlement agreements (15%), assignments (13%), and M&A agreements (13%).
Frequency and Types of Agreement
Respondents were asked to estimate what percentage of the technology-related agreements they concluded led to disputes. Overall, responses revealed that disputes typically occurred in relation to some 2% of these agreements.
Respondents indicated that disputes arose most often in relation to licenses (25% of Respondents), followed by R&D agreements (18% of Respondents), NDAs (16% of Respondents), settlement agreements (15% of Respondents), assignments (13% of Respondents), and M&A agreements (13% of Respondents).
Licenses / Cross-licenses / Pool-
licenses25%
Research & Development (R&D)
Agreements18%Non-disclosure
Agreements (NDA)16%
Agreements on Settlement of
Litigation15%
Assignments13%
Mergers & Acquisitions (M&A)
13%
Source: WIPO Arbitration and Mediation Center, International Survey on Dispute Resolution in Technology Transactions
Chart 9: Technology Agreements Concluded by Respondents Leading Most Often to Disputes
Additional Charts setting out data by business area (Additional Chart A2) and size of entity (Additional Chart A3) are included in Annex II (pages 38 and 39).

WIPO Center International Survey on Dispute Resolution in Technology Transactions - 18
License Agreements
41% of Respondents estimated that less than 1% of license agreements led to disputes. 7% of Respondents stated that more than 10% of the licenses led to disputes.
Respondent replies suggest that disputes in licensing agreements arise more frequently where parties are based in different jurisdictions than when they are based in the same jurisdiction.
In interviews, Respondents specified that disputes involving licensing agreements tended to concern issues such as scope and existence of the license, products, quality standards, profits, and determination and payment of royalty rates.
IP Lawyer, USA Noting the inherent interdependence between the various licensors and licensees, an attorney working in the USA in the area of technology transfer highlighted cross-licensing as a dispute prevention tool.
R&D Agreements
55% of Respondents indicated that less than 1% of their R&D agreements led to disputes. 4% of Respondents signaled that more than 10% of their R&D agreements led to disputes.
In interviews, Respondents mentioned that disputes regarding such agreements related to payment obligations, performance of milestones and ownership of protected technology.
IP Lawyer, United Kingdom
An English lawyer stated that the expanding commercialization of technology causes an increase in IP-related disputes arising out of R&D (and non-disclosure) agreements.
Non-disclosure Agreements
72% of Respondents confirmed that less than 1% of their NDAs led to disputes. 3% of Respondents indicated that more than 10% of their NDAs led to disputes.
Settlement Agreements
65% of Respondents stated that less than 1% of litigation settlement agreements led to disputes. 5% of Respondents indicated that more than 10% of their settlements led to disputes.
Assignments 73% of Respondents mentioned that less than 1% of their assignments led to disputes. 1% of Respondents indicated that more than 10% of their assignments caused disputes.
M&A Agreements
60% of Respondents confirmed that less than 1% of their M&A agreements led to disputes. 5% of Respondents indicated that more than 10% of their M&A agreements led to disputes.
Further Agreements
Respondents further stated that in their practice franchise and distribution agreements most frequently gave rise to disputes.
WIPO Center Experience
A significant share of WIPO Center cases relates to technology agreements: 40% licenses, 7% R&D agreements, 4% assignments, and 2% settlement agreements. Other cases concern, for example, distribution agreements, reseller agreements, and service agreements, frequently in the area of IT.

WIPO Center International Survey on Dispute Resolution in Technology Transactions - 19
4. Choice of Dispute Resolution Clauses
Summary
94% of Respondents indicated that negotiating dispute resolution clauses forms part of their contract negotiations.
Court litigation was the most common stand-alone dispute resolution clause (32%), followed by (expedited) arbitration (30%) and mediation (12%). Mediation is also included where parties use multi-tier clauses (17% of all clauses) prior to court litigation, (expedited) arbitration or expert determination.
Respondents generally perceived a trend towards out-of-court dispute resolution mechanisms.
The choice of arbitral institution broadly corresponds to the location of Respondent headquarters.
Cost and time are the principal considerations for Respondents when negotiating dispute resolution clauses, both in domestic and international agreements.
For international agreements, Respondents placed a higher value on enforceability and forum neutrality than they did for domestic transactions.
Enforceability also ranked as a motivating factor among Respondents using court litigation and arbitration clauses. Finding a business solution was an important factor for Respondents choosing mediation.
Negotiating Clauses
94% of Respondents indicated that negotiating dispute resolution clauses formed part of their contract negotiations.
Most Frequently Used Dispute Resolution Clauses
Respondents were asked to provide information on the dispute resolution clauses used in the technology agreements they concluded over the past two years. The clauses most commonly included in such agreements provided for court litigation (32%), (expedited) arbitration (30%), and mediation (29%). The use of mediation was either as a stand-alone dispute resolution mechanism (12%) or in combination with court litigation, (expedited) arbitration or expert determination (17%) (see Chart 107.)
In interviews, many Respondents confirmed their use of multi-tier clauses providing for negotiation and mediation followed, if necessary, by arbitration or court litigation.
Asked about trends, Respondents indicated that they observe an increasing use of out-of-court dispute resolution mechanisms and willingness to settle disputes in order to avoid costs and to be able to refocus on their regular business.
7 Statistics for Chart 10 were generated by assigning, for each Respondent, a value equivalent to the midpoint of the range (None = 0%; 1-5% = 3%, 5-30% = 17.5%, 30-60% = 45%, +60% = 80%), and averaging over all responses. Answers for the relevant question do not necessarily assume mutual exclusivity between dispute resolution types. The results shown in for Chart 10 are presented in order of clause options provided in the questionnaire.

WIPO Center International Survey on Dispute Resolution in Technology Transactions - 20
In-house Counsel, Denmark
“Arbitration offers a unified dispute settlement process for R&D and license agreements pertaining to IP rights protected in several jurisdictions”.
6%
1%
7%
9%
3%
4%
26%
12%
32%
0% 10% 20% 30% 40%
Other Dispute Resolution Methods orCombinations
Mediation followed by Expert Determination
Mediation followed by (Expedited) Arbitration
Mediation followed by Court Litigation
Expert Determination
Arbitration under Expedited Rules
Arbitration
Mediation
Court Litigation
Percentage of AgreementsSource: WIPO Arbitration and Mediation Center, International Survey on Dispute Resolution in Technology Transactions
Chart 10: Dispute Resolution Clauses Included in Agreements Concluded by Respondents in the Past Two Years
More detailed information on the frequency of dispute resolution clauses used in Respondents’ agreements in the past two years is set out in Annex II, Additional Chart A4 (page 39).
Litigation Counsel, USA
Technology Transfer Professional, Brazil
“Use and knowledge of the advantages of mediation in terms of speed, costs and settlement rate is growing.”
“Negotiation and mediation are essential elements of dispute resolution clauses in R&D agreements.”
Business Area Analysis of replies shows that preferences for dispute resolution mechanisms do not vary with the different business areas involved. Annex II, Additional Chart A5 (page 40) shows this analysis in detail.
Entity Size Analysis of replies by Respondents’ size is presented in Annex II, Additional Chart A6 (page 40). Amongst other conclusions, this analysis appears to confirm the premise that larger entities include court litigation more frequently in their dispute resolution clauses than smaller entities.

WIPO Center International Survey on Dispute Resolution in Technology Transactions - 21
Internal Dispute Resolution Policies - In-house Counsels’ Perspectives
Some Respondents provided information on specific internal dispute resolution policies and the use of standard dispute resolution clauses.
Life Sciences Company, Europe
An in-house counsel of a European life sciences company with staff of 1,000-10,000 indicated that the company does not use an internal policy or a fixed dispute resolution clause.
Automotive Company, USA
An executive of an automotive company in the sector with 250-1,000 employees based in the USA told of the company’s longstanding practice to choose ADR over court litigation mainly to save management time.
Electronics Company, Germany
An in-house counsel of a European company in electronics, energy, mechanical and transportation with staff of more than 10,000 specified using a binding internal dispute resolution policy that includes clauses providing for negotiation as first step, an ADR mechanism such as mediation or expert determination as second step, and arbitration as final step.
WIPO Center Experience
76% of mediation and arbitration cases administered by the WIPO Center are based on dispute resolution clauses included in existing agreements between the parties stipulating that future disputes shall be submitted to WIPO mediation and/or (expedited) arbitration. The remaining 24% of mediations and arbitrations are based on agreements specifically submitting an existing dispute to WIPO mediation or (expedited) arbitration. Such disputes relate, for example, to patent infringement.
With 65%, mediation ranked significantly higher in agreements for the submission of an existing dispute than in prior contract clauses.
66% of WIPO cases have been based on stand-alone dispute resolution clauses out of which 38% provided for arbitration, 25% for expedited arbitration and 38% for mediation. In 34% of WIPO cases parties included multi-tier dispute resolution clauses providing for mediation, followed by (expedited) arbitration.
52% of cases under the WIPO Arbitration Rules provided for a sole arbitrator, 48% for a three-member tribunal. Consistent with provisions of under the WIPO Expedited Arbitration Rules, cases under such rules have been conducted by a sole arbitrator.
WIPO Center International Survey on Dispute Resolution in Technology Transactions - 22
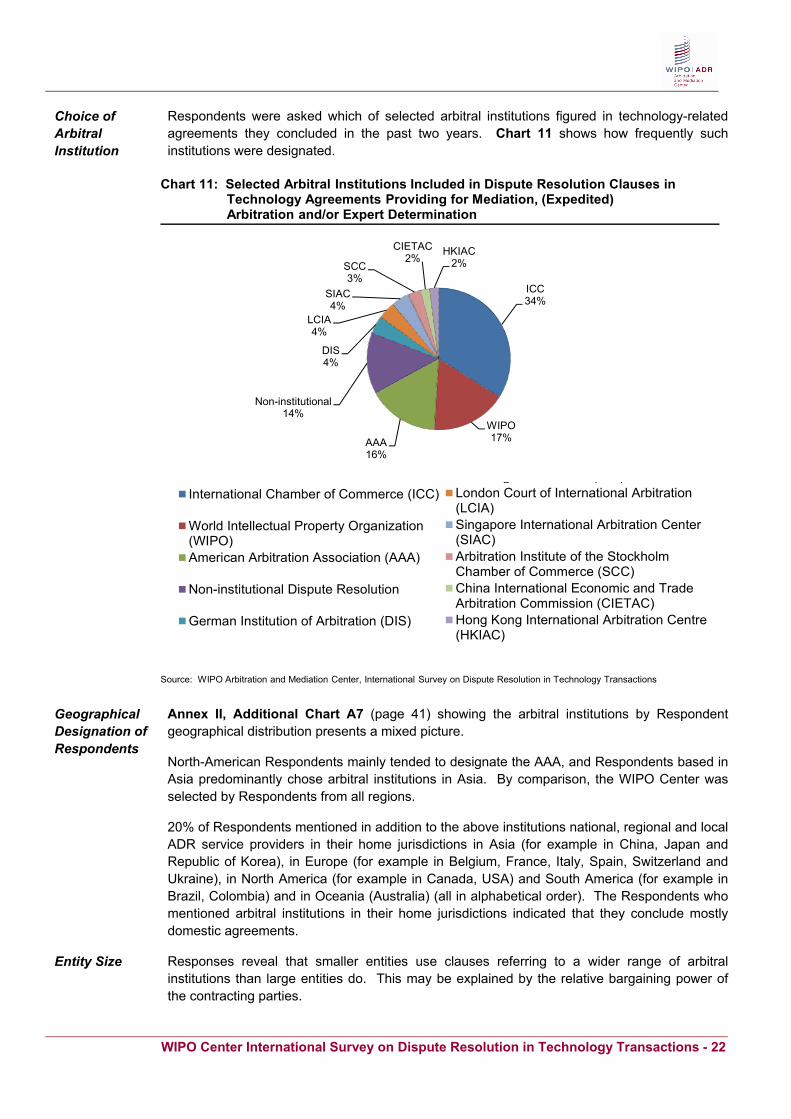
Choice of Arbitral Institution
Respondents were asked which of selected arbitral institutions figured in technology-related agreements they concluded in the past two years. Chart 11 shows how frequently such institutions were designated.
ICC34%
WIPO17%AAA
16%
Non-institutional14%
DIS4%
LCIA4%
SIAC4%
SCC3%
CIETAC2%
HKIAC2%
Source: WIPO Arbitration and Mediation Center, International Survey on Dispute Resolution in Technology Transactions
Chart 11: Selected Arbitral Institutions Included in Dispute Resolution Clauses in Technology Agreements Providing for Mediation, (Expedited) Arbitration and/or Expert Determination
g ( )London Court of International Arbitration(LCIA)Singapore International Arbitration Center(SIAC)Arbitration Institute of the StockholmChamber of Commerce (SCC)China International Economic and TradeArbitration Commission (CIETAC)Hong Kong International Arbitration Centre(HKIAC)
International Chamber of Commerce (ICC)
World Intellectual Property Organization(WIPO)American Arbitration Association (AAA)
Non-institutional Dispute Resolution
German Institution of Arbitration (DIS)
Geographical Designation of Respondents
Annex II, Additional Chart A7 (page 41) showing the arbitral institutions by Respondent geographical distribution presents a mixed picture.
North-American Respondents mainly tended to designate the AAA, and Respondents based in Asia predominantly chose arbitral institutions in Asia. By comparison, the WIPO Center was selected by Respondents from all regions.
20% of Respondents mentioned in addition to the above institutions national, regional and local ADR service providers in their home jurisdictions in Asia (for example in China, Japan and Republic of Korea), in Europe (for example in Belgium, France, Italy, Spain, Switzerland and Ukraine), in North America (for example in Canada, USA) and South America (for example in Brazil, Colombia) and in Oceania (Australia) (all in alphabetical order). The Respondents who mentioned arbitral institutions in their home jurisdictions indicated that they conclude mostly domestic agreements.
Entity Size Responses reveal that smaller entities use clauses referring to a wider range of arbitral institutions than large entities do. This may be explained by the relative bargaining power of the contracting parties.

WIPO Center International Survey on Dispute Resolution in Technology Transactions - 23
Considerations When Deciding on Dispute Resolution Clauses
When asked about their main considerations when negotiating dispute resolution clauses, Respondents identified costs and time as their top priorities. This ranking applied both in a domestic and international context. For international disputes, Respondents placed a higher value on enforceability and forum neutrality than they did for domestic transactions (see below Chart 12).
Source: WIPO Arbitration and Mediation Center, International Survey on Dispute Resolution in Technology Transactions
Chart 12: Main Considerations When Negotiating Dispute Resolution Clauses
6%
8%
6%
30%
33%
18%
45%
33%
60%
71%
5%
5%
9%
29%
32%
36%
44%
52%
56%
71%
0% 10% 20% 30% 40% 50% 60% 70% 80%
Setting Precedent
None in Particular (Standard Internal Practice)
Support Provided by Institution
Business Solution
Confidentiality
Neutral Forum
Quality Outcome (Including Specialization ofDecision-Maker)
Enforceability
Time
Costs
Percentage of Respondents
International Agreements Domestic Agreements
Annex II, Additional Charts A8 and A9 (pages 41 and 42) provide the main considerations for Respondents who use any of arbitration, mediation, court litigation in the majority of their agreements, per each such category. Across all dispute resolution mechanisms, time and cost remain the prime concern. Enforceability also ranked as a motivating factor among users of court litigation and arbitration clauses. As shown in Additional Charts 8 and 9, more frequent users of mediation placed a higher value on finding a business solution, especially for international agreements.
In-house Counsel, Energy Company, Spain
An in-house IP counsel in a company in the energy sector with over 10,000 employees attributed this company’s selection of long-established arbitral institutions to a degree of inertia in the review of dispute resolution practices.

WIPO Center International Survey on Dispute Resolution in Technology Transactions - 24
5. Types of Technology Disputes and Party Objectives
Summary
For contractual and non-contractual disputes, patent issues arose nearly twice as often as copyright or know-how issues.
The main objectives of claimant parties in patent disputes were to obtain damages/royalties (78%), a declaration of patent infringement (74%), and/or injunctions (53%).
The main objectives of respondent parties in patent disputes were a declaration of patent invalidity (73%), a negative declaratory judgment (33%), and/or a declaration of patent infringement (33%).
Subject Matter of Technology Disputes
Asked about the relative incidence of contractual and non-contractual disputes related to patents, copyright or know-how, Survey Respondents indicated that patent disputes occurred nearly twice as often as copyright or know-how disputes. It is thereby recalled that as indicated in Chart 6 (page 14), Respondents conclude more patent-related agreements than agreements in the area of copyright or know-how. Survey Respondents’ replies reveal a slightly higher proportion of non-contractual patent disputes than contractual ones.
Source: WIPO Arbitration and Mediation Center, International Survey on Dispute Resolution in Technology Transactions
_____________________________
Chart 13.1: Relative Incidence between Patent,Know-how, and Copyright Disputes -Non-Contractual
Patents55%
Know-how18%
Copyright27%
_____________________________
Chart 13.2: Relative Incidence between Patent,Know-how, and Copyright Disputes -Contractual
Patents50%
Know-how25%
Copyright25%
More detailed data on the relative frequency of patent, know-how and copyright-related contractual and non-contractual disputes is provided in Annex II, Additional Charts A10.1 and A10.2 (page 42).
WIPO Center International Survey on Dispute Resolution in Technology Transactions - 25
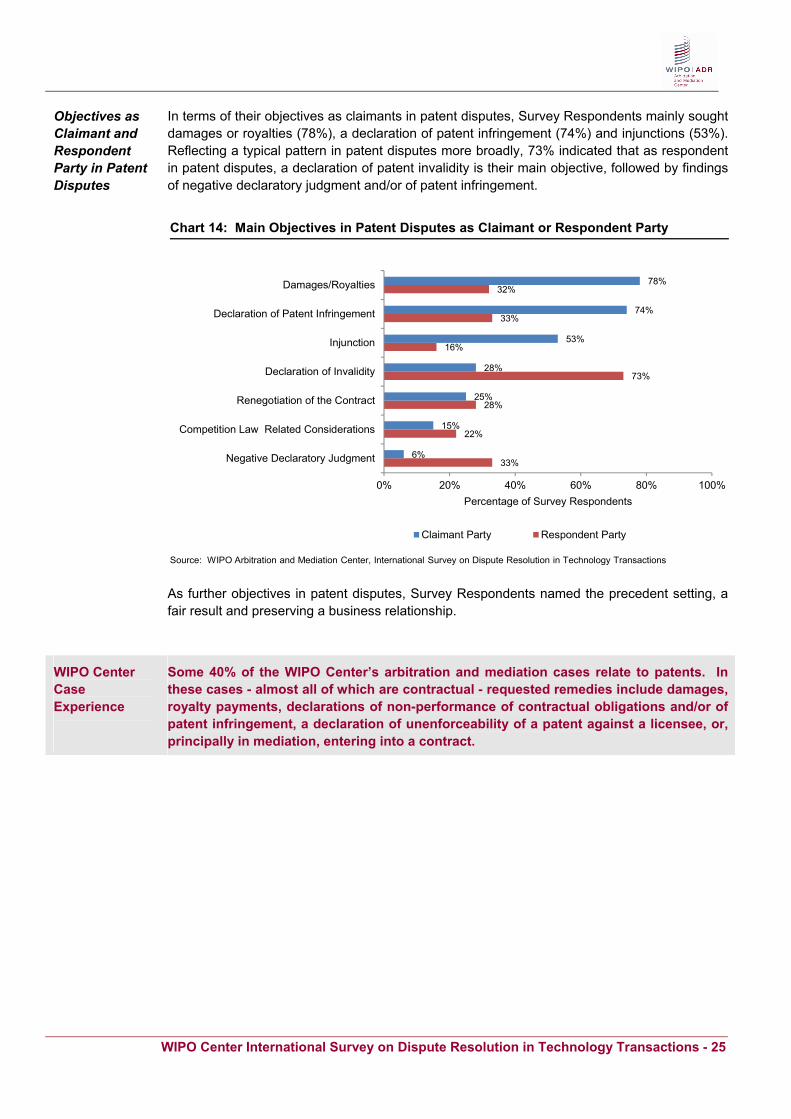
Objectives as Claimant and Respondent Party in Patent Disputes
In terms of their objectives as claimants in patent disputes, Survey Respondents mainly sought damages or royalties (78%), a declaration of patent infringement (74%) and injunctions (53%). Reflecting a typical pattern in patent disputes more broadly, 73% indicated that as respondent in patent disputes, a declaration of patent invalidity is their main objective, followed by findings of negative declaratory judgment and/or of patent infringement.
Source: WIPO Arbitration and Mediation Center, International Survey on Dispute Resolution in Technology Transactions
Chart 14: Main Objectives in Patent Disputes as Claimant or Respondent Party
33%
22%
28%
73%
16%
33%
32%
6%
15%
25%
28%
53%
74%
78%
0% 20% 40% 60% 80% 100%
Negative Declaratory Judgment
Competition Law Related Considerations
Renegotiation of the Contract
Declaration of Invalidity
Injunction
Declaration of Patent Infringement
Damages/Royalties
Percentage of Survey Respondents
Claimant Party Respondent Party
As further objectives in patent disputes, Survey Respondents named the precedent setting, a fair result and preserving a business relationship.
WIPO Center Case Experience
Some 40% of the WIPO Center’s arbitration and mediation cases relate to patents. In these cases - almost all of which are contractual - requested remedies include damages, royalty payments, declarations of non-performance of contractual obligations and/or of patent infringement, a declaration of unenforceability of a patent against a licensee, or, principally in mediation, entering into a contract.

WIPO Center International Survey on Dispute Resolution in Technology Transactions - 26
6. Mechanisms Used to Resolve Disputes: Type, Time and Costs
6.1. Type
Summary
Broadly consistent with the above findings concerning the choice of dispute resolution clauses, the most common mechanism used to resolve technology disputes was court litigation in Respondents’ home jurisdiction, followed by court litigation in another jurisdiction, arbitration, mediation, expedited arbitration and expert determination.
29% of Respondents indicated that they had submitted a dispute to mediation before or during court litigation involving contractual patent, copyright and/or know-how issues.
Respondents were asked to rank, for their contractual and their non-contractual disputes, direct party negotiations, court litigation (in their home jurisdiction and in another jurisdiction), mediation, arbitration, expedited arbitration and expert determination.
Source: WIPO Arbitration and Mediation Center, International Survey on Dispute Resolution in Technology Transactions
Direct Party Negotiations
39%
Dispute Resolution
Mechanisms61%
___________________________________________________Chart 15.1: Resolution of Contractual
Disputes
Direct Party Negotiations
36%
Dispute Resolution
Mechanisms64%
___________________________________________________Chart 15.2: Resolution of Non-Contractual
Disputes
Direct Party Negotiations
As shown in Charts 15.1 and 15.2, Respondents resolved their disputes through direct party negotiations more than through any of the other identified mechanisms.
Dispute Resolution Mechanisms
Respondents resolved those disputes not resolved through direct party negotiations through dispute resolution mechanisms in the frequency indicated in Chart 168 below.
8 Statistics for Chart 16 are generated by assigning, for each Respondent, a value equivalent to the midpoint of the range (None = 0%; 1-5% = 3%, 5-30% = 17.5%, 30-60% = 45%, +60% = 80%), and averaging over all responses. It is assumed that each resolution method is mutually exclusive, and the dispute resolution mechanisms reflected in Chart 16 realistically represent the totality of the possible dispute resolution mechanisms.

WIPO Center International Survey on Dispute Resolution in Technology Transactions - 27
Source: WIPO Arbitration and Mediation Center, International Survey on Dispute Resolution in Technology Transactions
Chart 16: Relative Use of Court Litigation, (Expedited) Arbitration,Mediation, Expert Determination
Litigation in Home Jurisdiction
Based on the ranges of Respondents’ replies, up to half of Respondents’ contractual as well as non-contractual disputes are estimated to have been resolved through court litigation in their home jurisdiction.
38% of Respondents indicated that 30%9 or more of their contractual disputes were resolved through court litigation in their home jurisdiction and 47% of Respondents indicated that 30% or more of their non-contractual disputes were resolved in this way.
IP Lawyer, Sweden
“Internationally focused lawyers and clients are more aware of ADR than those focusing on domestic transactions. The latter often use court litigation.”
Litigation in Foreign Jurisdiction
17% of Respondents indicated that 30% or more of their contractual disputes were resolved through court litigation in another jurisdiction. 33% of Respondents resolved 30% or more of their non-contractual disputes in this way.
Arbitration In relation to the use of arbitration, the Survey results were similar to those for mediation. 11% of Respondents resolved 30% or more of their contractual disputes through arbitration, and 10% of Respondents resolved 30% or more of their non-contractual disputes in this way.
9 For a meaningful representation of use of dispute resolution mechanisms, the following analysis is based on responses confirming a minimum 30% frequency use of any such mechanism.

WIPO Center International Survey on Dispute Resolution in Technology Transactions - 28
Lawyer, United Kingdom
“The increase in size and scale of transactions in emerging markets is causing an increased use of arbitral proceedings in technology disputes.”
R&D Professional, France
“The use of arbitration will increase since more and more parties require specific neutral expertise in their dispute resolution clauses.”
In-house Counsel, Industrial Company, India
“The increasingly international character of contracting should see more use of arbitration.”
Mediation 11% of Respondents indicated that they resolved 30% or more of their contractual disputes through mediation. For their non-contractual disputes, 14% of Respondents indicated that 30% or more of such disputes were resolved through mediation.
Respondents generally signaled an increased use of mediation, which mechanism, by itself or in combination with direct negotiations, (expedited) arbitration or court litigation, Respondents perceived as particularly cost- and time-efficient.
Expedited Arbitration
4% of Respondents indicated that they resolved 30% or more of their contractual disputes through expedited arbitration and 3% of Respondents indicated to resolve 30% or more of their non-contractual disputes in this way. In relation to both contractual and non-contractual disputes, nearly 70% of Respondents indicated not to have used expedited arbitration. It may be recalled that only a limited number of arbitral institutions, including the WIPO Center, offer expedited arbitration. Page 21 shows the WIPO Center’s case experience in this regard.
Expert Determination
3% of Respondents indicated that they resolved 30% or more of their contractual disputes and non-contractual disputes through expert determination. Nearly 70% of Respondents indicated not to have used expert determination.
In-housel Counsel, Pharmaceutical Company, Switzerland
“I believe different dispute resolution methods should be used depending on the case. In future I would expect more expert determinations as a way to restart negotiations of the entire dispute.”
A detailed analysis of the relative frequency of dispute resolution mechanisms used by Respondents is available in Annex II, Additional Chart A11 (page 43).
Mediation and Court Proceedings
When involved in court proceedings related to contractual patent, copyright or know-how issues, 29% of Respondents indicated that they had submitted a dispute to mediation before or during such proceedings. When involved in court proceedings related to non-contractual patent, copyright or know-how issues, 23% of Respondents indicated that they had submitted a dispute to mediation before or during such proceedings.

WIPO Center International Survey on Dispute Resolution in Technology Transactions - 29
Settlement Rates
36% of Respondents indicated that, of those disputes submitted to mediation before or in the course of court proceedings, more than 60% resulted in settlement, with 89% of Respondents indicating that at least one such mediation reached that result.
Lawyer, Canada
“Increasing time and costs encourage more clients to consider mediation at an early stage of a dispute.”
WIPO Center Experience
Most WIPO mediations relate to disputes arising from contracts containing a mediation clause. This contractual nature may help explain the 69% settlement rate in WIPO mediation. In addition, the 40% settlement rate of WIPO (expedited) arbitration cases confirms the reported benefit of multi-tier clauses.

WIPO Center International Survey on Dispute Resolution in Technology Transactions - 30
6.2. Time and Costs
Summary
Respondents indicated that they spent more time and incurred significantly higher costs in court litigation than in arbitration and mediation.
Respondents estimated that court litigation in their home jurisdiction took on average approximately 3 years and court litigation in another jurisdiction took on average 3.5 years.
Respondents estimated that legal costs incurred in court litigation in their home jurisdiction amounted on average to USD 475,000, and legal costs of court litigation in another jurisdiction amounted to slightly over USD 850,000.
Respondents indicated that mediation took on average 8 months, and 91% of Respondents stated that costs of mediation typically did not exceed USD 100,000.
Respondents indicated that arbitration took on average slightly more than 1 year and cost on average slightly over USD 400,000.
Apart from monetary amounts, 25% of Respondents identified management time of business executives and wasted time of other participants in proceedings, lost productivity and lost business opportunities as costs incurred.
Time and Cost to Resolve Disputes
Respondents were asked how long it took and how much it cost them to resolve disputes using court litigation (in their home jurisdiction and abroad), mediation, arbitration, expedited arbitration and expert determination. Below results show that Respondents spent more time and incurred significantly higher costs in court litigation than in arbitration and mediation. As reflected in Section 6.1 of this Report, Respondents were involved most frequently in court litigation.
Source: WIPO Arbitration and Mediation Center, International Survey on Dispute Resolution in Technology Transactions
Chart 17: Relative Time and Costs of Resolving Disputes through Court Litigation, (Expedited) Arbitration, Mediation, Expert Determination

WIPO Center International Survey on Dispute Resolution in Technology Transactions - 31
Litigation in Home Jurisdiction
47% of Respondents indicated that court litigation (first instance and any appeal) in their home jurisdiction typically took between 2 and 5 years. The reported average duration of court litigation in Respondents’ home jurisdiction was approximately 3 years.10
Respondents estimated that the legal cost of court litigation in their home jurisdiction amounted on average to USD 475,000-500,000.11 24% of Respondents indicated that court litigation costs in their home jurisdiction typically fell into the provided range of USD 100,000 to USD 1 million.
A summary of the duration and cost from the countries most represented among Survey Respondents is provided in Annex II, Additional Chart A12 (page 43).
Litigation in Foreign Jurisdiction
55% of Respondents stated that court litigation in a jurisdiction other than their own took on average between 2 and 5 years. With approximately 3.5 years, the average reported duration for court litigation in such jurisdiction was slightly higher than for court litigation at home.
Respondents indicated that court litigation in a foreign jurisdiction cost on average USD 850,000-875,000, nearly twice the cost of home jurisdiction litigation. 32% of Respondents indicated that these costs typically exceeded USD 1 million.
Typically, larger entities incur higher costs of litigation in a foreign jurisdiction than do smaller entities of more limited resources.
The above time and cost data is based on an average of Respondents’ replies. The legal costs and duration of court litigation depend in part on potentially jurisdiction-specific factors such as rules of evidence, bifurcation of proceedings, court resources, availability of specialized judges, or use of juries.
In-house Counsel, Dutch Multinational Company
“Costs of litigation and arbitration are rising. Especially in the US the costs for litigation are tremendous.”
10 Average time durations were calculated by assigning, for each Respondent, a value equivalent to the midpoint of the range (1-6 months = 3.5 months; 6 months – 1 year = 9 months; 1 year = 1 year; 1-2 years = 18 months; 2-5 years = 42 months). For purposes of this Report, a value of 6 years was assigned to “+ 5 years”, and averaging over all responses. It is assumed that each resolution method is mutually exclusive, and the dispute resolution mechanisms reflected in Chart 17 realistically represent the totality of the possible dispute resolution mechanisms. Only Respondents who affirmatively indicated in a prior question that they resolved disputes utilizing the process in question were counted for purposes of this section. 11 Average costs were calculated by assigning, for each Respondent, a value equivalent to the midpoint of the range (“-10,000” = USD 5,000; “10,000-50,000” = USD 30,000; “50,000-100,000” = USD 75,000; “100,000-1M” = USD 550,000; “1-2M” = USD 1,500,000; “2-5M” = USD 3,500,000). In less than 1% of “court litigation in your home jurisdiction” and “arbitration” responses and in less than 4% of “court litigation in another jurisdiction” responses, Respondents chose “+10M” (this was not selected by any Respondent in relation to mediation, expedited arbitration and expert determination cases). Such responses are treated as outliers and are not included for purposes of calculation of the “average” costs due to the potential for error in estimation and due to distortive effects. Only Respondents who affirmatively indicated in a prior question that they resolved disputes utilizing the process in question were counted for purposes of this section.

WIPO Center International Survey on Dispute Resolution in Technology Transactions - 32
Arbitration 61% of Respondents reported that arbitrations typically took between 6 and 12 months. Overall, Respondents reported that arbitrations took on average slightly more than 1 year.
Respondents reported the average cost of arbitration to be between USD 400,000 and USD 425,000.
Respondents mentioned arbitration under expedited rules as a means to control the costs of arbitration. They noted that arbitrators should make available sufficient time in order to decide disputes in a timely manner.
IP In-house Counsel, Pharmaceutical Company
An in-house IP counsel of a pharmaceutical company with 1,000-10,000 employees based in Denmark stated that arbitration could as such be as expensive as court litigation in Denmark, but be more efficient in the international enforceability of its result.
IP Lawyer, USA An IP lawyer based in the USA mentioned that any use of procedural practices originating in national court systems, in particular the use of (electronic) discovery, increases the costs of international arbitration and negatively impacts on its use.
In-house Counsel, European Electronics Company
An in-house counsel in a European company observed a trend towards increased document production in arbitration and the use of experts; both of these trends drastically increase costs. He observed that mediation involved far less documentation, with significant cost benefits over arbitration and court litigation.
Expedited Arbitration
75% of Respondents indicated that expedited arbitrations typically took less than 1 year. Overall, Respondents indicated that arbitration under expedited rules took on average approximately 9 months.
54% of Respondents indicated that the cost of expedited arbitration would not typically exceed USD 50,000.
Mediation Mediation is faster and less costly than court litigation. Respondents indicated that mediation took on average approximately 8 months, with 46% of Respondents further indicating that their mediation typically took between 1 and 6 months.
91% of Respondents confirmed that mediation generally did not exceed USD 100,000.
Expert Determination
49% of Respondents indicated that expert determination typically took less than 6 months. Overall, Respondents indicated that expert determination took on average slightly more than 6 months.
73% of Respondents indicated that costs of expert determination would not typically exceed USD 50,000.
Observations on Costs and Time
As set out on page 23, Respondents ranked cost and time as their prime considerations when negotiating dispute resolution clauses.

WIPO Center International Survey on Dispute Resolution in Technology Transactions - 33
IP Lawyer, Liechtenstein
“Our clients want to quickly resolve their disputes and go back to work”.
Respondents stated that they consider not only quantifiable monetary amounts as costs incurred. 25% of Respondents mentioned wasted management time of business executives and other participants in proceedings, lost productivity, and lost business opportunities due to the reserves required to cover the worst potential outcome of a pending dispute.
WIPO Center Experience
In the WIPO Center’s experience, mediation takes on average 5 months. Arbitration cases under the WIPO Expedited Arbitration Rules take on average 7 months and cases under the WIPO Arbitration Rules take on average 23 months.
The cost of WIPO mediations amounted on average to USD 21,000. The cost of WIPO expedited arbitrations averaged USD 48,000. WIPO arbitrations on average have cost USD 165,000; as noted on page 21, about half of the latter category involved three-member tribunals. Arbitrations under WIPO Arbitration Rules include large cases involving patents protected in several jurisdictions.

WIPO Center International Survey on Dispute Resolution in Technology Transactions - 34
7. Observations for Dispute Resolution in Technology Transactions Although each transaction may have its own dispute resolution requirements, some general observations about the resolution of technology disputes can be made in light of the Survey results.
Contracts Should Anticipate Disputes
Survey Respondents indicated that dispute resolution provisions are often regarded as a relatively minor element in contract negotiations. However, where disputes subsequently arise they tend to be lengthy and costly. Parties to technology transactions should anticipate the risk of disputes in their contract negotiations.
Dispute Policies Should Anticipate International Aspects
A majority of Survey Respondents concluded transactions with parties based in foreign jurisdictions, relating to IP rights protected in several countries and potentially subject to foreign law. Respondents also confirmed that designation of a dispute resolution mechanism does not necessarily take account of the risk of foreign litigation. Internal dispute policies need to anticipate international aspects in parties, rights, and law.
Dispute Policies Should Aim to Minimize Costs and Time
Ranking a wide range of considerations, Survey Respondents placed the greatest importance on cost and time in their choice of dispute resolution options.
Survey Respondents indicated that the typical cost of court litigation in a foreign jurisdiction, and sometimes also in their home jurisdiction, exceeded the typical cost of ADR mechanisms. Dispute resolution policies should be designed to save costs and time, taking into account the specific transaction.
Between court litigation and arbitration, parties may wish to consider arbitration as potentially faster and less expensive. When choosing arbitration, subject to the potential value and complexity of a dispute, parties may want to consider expedited arbitration as a time- and cost-effective option.
Survey Respondents found mediation a valuable step in their dispute resolution policy, with high settlement rates yielding significant time and cost savings. In the event mediation fails, adding arbitration as a next step enhances the chances of settlement. It may further be noted that Survey Respondents see scope for greater use of mediation in non-contractual disputes.
Particularly in Patent Disputes, the Features of Court Litigation Should Be Compared with Those of ADR
Many Survey Respondents are exposed to international patent disputes with important time and cost implications. Between court litigation and forms of ADR, the choice of dispute resolution procedure should take account of such considerations as any existence of specialized courts and judges, bifurcation of proceedings, availability of injunctions, possible parallel litigation, enforceability, and resources required to coordinate and manage such proceedings.
In making the above Survey-based observations, the WIPO Center notes that no dispute resolution mechanism may offer a comprehensive solution in all circumstances. Rather, it is important for parties to contracts and to disputes to consider the comparative costs and benefits of each available dispute resolution option.

WIPO Center International Survey on Dispute Resolution in Technology Transactions - 35
General Methodology 393 Responses The Survey was initiated and conducted by the WIPO Center. The questionnaire was
designed with feedback from the members of the external Expert Group (see Annex I) and the WIPO Economics and Statistics Division, which also supported the WIPO Center’s evaluation of responses. The Survey consisted of 35 questions on the types of technology-related agreements concluded, dispute resolution clauses in such agreements, types of disputes arising, dispute resolution mechanisms used to resolve those disputes, and the time and costs involved.
Invitations to complete the Survey were sent to WIPO Center contacts worldwide, members of AIPPI, AUTM, FICPI and LESI, and of other associations which facilitated the distribution of the Survey.
Recipients of the Survey were companies, research organizations, universities, government bodies, law firms, individuals and other entities involved in technology transactions and technology disputes. Their responses formed the basis for the data presented in this Report.
Respondents were invited to indicate whether they would also be willing to be interviewed. The WIPO Center conducted 63 telephone interviews with Respondents from 28 countries. The interviews, which lasted on average from 15 to 60 minutes, followed up on the Respondents’ replies. The information thus gathered was used to complement and to contextualize the written responses.
In a further step, the WIPO Center carried out a comparative analysis of the Survey information and WIPO case statistics.

WIPO Center International Survey on Dispute Resolution in Technology Transactions - 36
Selected Terms ADR - Alternative Dispute Resolution: A range of out-of-court dispute resolution procedures involving
one or more neutral intermediaries appointed by the parties.
Arbitration: An out-of-court procedure in which the dispute is submitted to one or more arbitrators who make a binding decision.
Copyright Agreements: For the purpose of the Survey, copyright agreements exclude standard software user licenses in a general office context.
Direct Party Negotiations: Implies that no procedure involving a neutral intermediary such as a mediator, arbitrator or expert has been engaged.
Dispute: For the purpose of the Survey, any difference, controversy or claim resolved through direct party negotiations, court litigation, mediation, arbitration or expert determination.
Expedited Arbitration: An arbitration procedure whose rules provide for reduced time and cost.
Expert Determination: A procedure in which a matter is submitted to one or more experts who make a determination on the matter referred by the parties. The determination is binding, unless the parties have agreed otherwise.
Mediation: An informal procedure in which a neutral intermediary assists the parties in reaching a settlement of the dispute.
Respondent: Those who completed this Survey in full or in part.
Settlement: For the purpose of the Survey, settlement includes any consensual solution of a dispute through mediation, or in court litigation before a judgment is issued, or in arbitration before a final award is issued, or in expert determination before a determination is made.
Technology: For the purpose of the Survey, all technology subject to patents, protection of know-how or copyright.

WIPO Center International Survey on Dispute Resolution in Technology Transactions - 37
Annex I
Members of the Expert Group for the Preparation of the Survey (alphabetical order)
Florian BEILHACK, Max-Planck-Innovation, Germany
Rick BRANDON, University of Michigan, USA (representing AUTM)
Thierry CALAME, Lenz & Staehelin, Switzerland (representing AIPPI)
Trevor COOK, Bird & Bird, United Kingdom
Eric DOBRUSIN, Dobrusin & Thennisch PC, USA
Heinz GODDAR, Boehmert & Boehmert, Germany
Helena GONZALEZ, Repsol, Spain
Michael GROSS, Fraunhofer-Gesellschaft, Germany
Martin KNAUER, Roche Diagnostics, Germany
Frank SÄNGER, Deutsche Telekom, Germany
Russell LEVINE, Kirkland & Ellis LLP, USA (representing LESI)
Kevin NACHTRAB, Johnson & Johnson, Belgium (representing LESI)
David PERKINS, Arnold & Porter, United Kingdom
Flip PETILLION, Crowell & Moring, Belgium
Andrew RIDDLES, Crowell & Moring, USA
Douglas ROBERTSON, Newcastle University, United Kingdom
Rainer TRITZ-FLOSSDORF, Deutsches Zentrum für Luft- u. Raumfahrt (DLR), Helmholtz-Gemeinschaft, Germany
Frank ZACHARIAS, Porsche, Germany

WIPO Center International Survey on Dispute Resolution in Technology Transactions - 38
Annex II
Additional Charts
Technology-related Agreements Concluded in the Past Two Years
Source: WIPO Arbitration and Mediation Center, International Survey on Dispute Resolution in Technology Transactions
Additional Chart 1: Relative Frequency of Agreements Related to Patents, Know-how and Copyright
0%
5%
10%
15%
20%
25%
30%
35%
40%
None 1-5% 5-30% 30-60% +60%Percentage of Agreements Concluded by Respondents
Patents Know-how Copyright
Agreements Leading Most Often to Disputes
Source: WIPO Arbitration and Mediation Center, International Survey on Dispute Resolution in Technology Transactions
Additional Chart 2: Agreements Leading Most Often to Disputes per Business Area
Non-disclosure Agreements
R&D Agreements
Licenses Settlement Agreements
M&A Agreements
Assignments
Chemicals 16% 18% 25% 14% 13% 13% Consumer Goods
15% 17% 24% 15% 14% 15%
Electronics 14% 18% 26% 16% 12% 14% Energy 16% 20% 22% 16% 13% 13% IT 15% 18% 25% 16% 12% 14% Life Sciences 15% 20% 27% 15% 11% 12% Mechanical 14% 20% 26% 16% 11% 13% Pharmaceuticals/ Biotechnology
15% 20% 26% 13% 13% 13%
Telecom 15% 17% 26% 17% 12% 13% Transportation 14% 22% 22% 18% 13% 11%

WIPO Center International Survey on Dispute Resolution in Technology Transactions - 39
Source: WIPO Arbitration and Mediation Center, International Survey on Dispute Resolution in Technology Transactions
Additional Chart 3: Agreements Leading Most Often to Disputes per Entity Size
Number of Employees
Non-disclosure Agreements
R&D Agreements
Licenses Settlement Agreements
M&A Agreements
Assignments
1-10 16% 14% 22% 17% 14% 17% 10-50 14% 18% 29% 13% 11% 15% 50-250 16% 16% 27% 15% 14% 12% 250-1,000 17% 21% 23% 17% 11% 11% 1,000-10,000 16% 21% 24% 14% 13% 12% +10,000 11% 29% 33% 7% 16% 4%
Choice of Dispute Resolution Clauses
Source: WIPO Arbitration and Mediation Center, International Survey on Dispute Resolution in Technology Transactions
Additional Chart 4: Relative Frequency of Dispute Resolution Clauses Included in Agreements
0%
10%
20%
30%
40%
50%
60%
70%
80%
Cou
rt Li
tigat
ion
inH
ome
Juris
dict
ion
Cou
rt Li
tigat
ion
inAn
othe
r Jur
isdi
ctio
n
Med
iatio
n
Arbi
tratio
n
Arbi
tratio
n un
der
Expe
dite
d R
ules
Expe
rt D
eter
min
atio
n
Per
cent
age
of R
espo
nden
ts
Dispute Resolution Clauses
Never Used 1-5% of Agreements 5-30% of Agreements
30-60% of Agreements +60% of Agreements

WIPO Center International Survey on Dispute Resolution in Technology Transactions - 40
Source: WIPO Arbitration and Mediation Center, International Survey on Dispute Resolution in Technology Transactions
Additional Chart 5: Preferences for Selected Dispute Resolution Clauses per Business Area
Chemicals Consumer Goods
Electronics
IT
Mechanical
Pharmaceuticals/ Biotechnology
Telecom
Court Litigation 30% 33% 37% 34% 31% 33% 32% Mediation 14% 11% 12% 13% 15% 11% 12% Arbitration 23% 20% 24% 24% 25% 24% 26% Arbitration under Expedited Rules
4% 5% 4% 4% 4% 4% 3%
Expert Determination
4% 3% 3% 3% 3% 3% 4%
Mediation Followed, in the Absence of a Settlement, by Court Litigation
10% 9% 12% 11% 10% 11% 9%
Mediation Followed, in the Absence of a Settlement, by [Expedited] Arbitration
9% 7% 8% 9% 8% 8% 9%
Mediation Followed, in the Absence of a Settlement, by Expert Determination
1% 1% 2% 2% 1% 2% 2%
Source: WIPO Arbitration and Mediation Center, International Survey on Dispute Resolution in Technology Transactions
Additional Chart 6: Preferences for Selected Dispute Resolution Clauses per Entity Size
Number of Employees
1-10 10-50 50-250 250-1,000 1,000-10,000 +10,000
Court Litigation 26% 27% 34% 33% 35% 48% Mediation 14% 11% 12% 20% 6% 16% Arbitration 28% 25% 25% 33% 22% 22% Arbitration under Expedited Rules
4% 4% 3% 4% 5% 6%
Expert Determination 4% 2% 3% 1% 1% 2% Mediation Followed, in the Absence of a Settlement, by Court Litigation
11% 10% 7% 7% 9% 8%
Mediation Followed, in the Absence of a Settlement, by [Expedited] Arbitration
7% 10% 7% 9% 4% 4%
Mediation Followed, in the Absence of a Settlement, by Expert Determination
2% 2% 1% - 1% 1%
Mediation – Stand-alone and Multi-tier Combined
34% 33% 27% 36% 20% 29%

WIPO Center International Survey on Dispute Resolution in Technology Transactions - 41
Source: WIPO Arbitration and Mediation Center, International Survey on Dispute Resolution in Technology Transactions
Additional Chart 7: Selected Arbitral Institutions Most Utilized in Technology Agreements by Geographical Distribution of Survey Respondent*
Asia
Europe
North America
Oceania
South America
AAA 10% 3% 50% 11% 15% CIETAC 5% 1% 3% 2% 1% DIS 1% 7% 1% 2% 1% HKIAC 5% 1% 1% 3% 1% ICC 34% 45% 10% 22% 57% LCIA 3% 3% 6% 2% 3% SIAC 15% 1% 3% 2% 1% SCC 2% 4% 2% 2% 1% WIPO 7% 23% 10% 23% 9% Non-institutional
18% 12% 14% 31% 11%
* No statistically significant data became available in relation to entities in Africa.
Source: WIPO Arbitration and Mediation Center, International Survey on Dispute Resolution in Technology Transactions
Additional Chart 8: Main Considerations When Negotiating Dispute Resolution Clausesin International Agreements
International Agreements - Considerations
Court Litigation Clause Used in +60% of Agreements
Mediation Clause Used in +60% of Agreements
Arbitration Clause Used in +60% of Agreements
Costs 69% 84% 58% Time 48% 79% 64% Enforceability 49% 37% 51% Quality Outcome (Including Specialization of Decision-Maker)
41% 37% 56%
Neutral Forum 25% 42% 42% Confidentiality 21% 37% 31% Business Solution 24% 53% 33% Support Provided by Institution - 11% 18% None in Particular (Standard Internal Practice)
12% - 2%
Setting Precedent 5% 11% 7%
Additional Chart 7: Selected Arbitral Institutions Most Utilized in Technology Agreements by Geographical Distribution of Survey Respondent*

WIPO Center International Survey on Dispute Resolution in Technology Transactions - 42
Source: WIPO Arbitration and Mediation Center, International Survey on Dispute Resolution in Technology Transactions
Additional Chart 9: Main Considerations When Negotiating Dispute Resolution Clausesin Domestic Agreements
Domestic Agreements -Considerations
Court Litigation Clause Used in +60% of Agreements
Mediation Clause Used in +60% of Agreements
Arbitration Clause Used in +60% of Agreements
Costs 68% 89% 60% Time 50% 83% 71% Enforceability 34% 11% 29% Quality Outcome (Including Specialization of Decision-Maker)
41% 39% 50%
Neutral Forum 15% 28% 24% Confidentiality 23% 39% 33% Business Solution 22% 39% 26% Support Provided by Institution 3% 11% 14% None in Particular (Standard Internal Practice)
15% - 5%
Setting Precedent 4% 6% 7%
Types of Technology Disputes and Party Objectives
______________________________
Additional Chart 10.2: Frequency of Respondents' Patent, Know-how, and Copyright Disputes -Contractual
0%
10%
20%
30%
40%
50%
60%
Patents Know-how Copyright
______________________________
Additional Chart 10.1: Frequency of Respondents' Patent, Know-how, and Copyright Disputes -Non-Contractual
0%
10%
20%
30%
40%
50%
60%
Patents Know-how Copyright
Source: WIPO Arbitration and Mediation Center, International Survey on Dispute Resolution in Technology Transactions
None 1-5% of Disputes 5-30% of Disputes 30-60% of Disputes +60% of Disputes

WIPO Center International Survey on Dispute Resolution in Technology Transactions - 43
Mechanisms Used to Resolve Disputes: Type, Time and Costs
0%
10%
20%
30%
40%
50%
60%
70%
80%
90%
Cou
rt Li
tigat
ion
Med
iatio
n
Arbi
tratio
n
Arbi
tratio
n (E
xped
ited)
Expe
rt D
eter
min
atio
n
Med
iatio
n +
Cou
rt Li
tigat
ion
Med
iatio
n +
Arbi
tratio
n
Med
iatio
n +E
xper
tD
eter
min
atio
n
Perc
enta
ge o
f Res
pond
ents
None 1-5% of Agreements 5-30% of Agreements 30-60% of Agreements +60% of Agreements
Source: WIPO Arbitration and Mediation Center, International Survey on Dispute Resolution in Technology Transactions
Additional Chart 11: Relative Frequency of Dispute Resolution Mechanisms Used by Respondents in the Past Two Years
Source: WIPO Arbitration and Mediation Center, International Survey on Dispute Resolution in Technology Transactions
Additional Chart 12: Cost and Duration of Court Litigation of Technology Disputesin Selected Jurisdictions Experienced by Survey Respondents from That Jurisdiction
Country Domestic Court Proceedings
Duration (Months) Costs (in USD) Australia 38 690 000 France 39 217 000 Germany 27 370 000 Japan 26 450 000 Spain 37 33 000 Switzerland 28 634 000 United Kingdom 26 381 000 United States of America 37 1.4 Mio

International Survey on Dispute Resolution in Technology Transactions - 44
Annex III International Survey on Dispute Resolution in Technology
Transactions (Questionnaire)
WIPO Arbitration and Mediation Center
World Intellectual Property Organization
International Survey on Dispute Resolution in Technology Transactions
I. General Information about the Survey RESPONDENT
1. In which type of entity (hereinafter “your entity”) do you work? Company
Research Organization
University
Government body
Law firm
Individual/Self Employed
Other (please specify):
2. In which department of your entity do you work? Legal
Litigation, including Alternative Dispute Resolution
Intellectual property
Technology transfer
Research & Development
Other (please specify):
3. What is your position within your entity?
In-house counsel
External legal advisor
Technology transfer professional
Other (please specify):

International Survey on Dispute Resolution in Technology Transactions - 45
4. What are the main business areas your entity is involved in?
Chemicals
Consumer goods
Electronics
Energy
Entertainment
IT
Life sciences
Luxury goods
Mechanical
Pharmaceuticals/Biotechnology
Telecom
Transportation
Other (please specify):
5. How many persons are employed with your entity?
6. In which country are your entity’s headquarters?
7. Please mark the continent(s) in which your entity operates primarily.
Africa
Asia
Europe
North America
Oceania
South America
1-10
10-50
50-250
250-1,000
1,000-10,000
+10,000

International Survey on Dispute Resolution in Technology Transactions - 46
II. Technology Related AGREEMENTS
8. Does your entity conclude agreements covering patents (pending applications or registered), know-how, and/or copyright? Please indicate the approximate respective percentage of such agreements over the past two years.
Note: For the purpose of this Survey, copyright agreements exclude standard software user licenses in a general office context.
None 1-5% 5-30% 30-60% +60%
Patents Know-how Copyright
9. What percentage share of such agreements involve parties from other jurisdictions?
10. Do such agreements relate to patents covered in more than one country? Please indicate the respective percentage.
11. How many of the following types of agreements has your entity concluded over the past two years?
None 1-10 10-20 20-50 +50 Unknown
Non-disclosure agreements
Research & Development agreements
Licenses / Cross-licenses / Pool-licenses
Agreements on settlement of litigation
Mergers & Acquisitions
Assignments
Other types of agreement (please specify):
None
1-5%
5-30%
30-60%
+60%
None
1-5%
5-30%
30-60%
+60%

International Survey on Dispute Resolution in Technology Transactions - 47
12. Could you roughly estimate the percentage of such agreements that lead to disputes? Please select the top three types of agreements.
0-1% 1-2% 2-5% 5-10% +10%
Non-disclosure agreements
Research & Development agreements
Licenses/ Cross-licenses / Pool-licenses
Agreements on settlement of litigation
Mergers & Acquisitions
Assignments
Other types of agreement (please specify):
13. What laws apply to the agreements your entity has concluded over the past two years?
Note: Some of the more frequently used jurisdictions as reported to the WIPO Center are included in the following table listed in alphabetical order.
None 1-30% 30-60% +60%
Belgian Chinese Dutch English French German Japanese Singapore Swiss US California US Delaware US New York
Please add any other relevant laws:

International Survey on Dispute Resolution in Technology Transactions - 48
III. Dispute Resolution CLAUSES in Technology Related Agreements
14. In what percentage of cases does your entity’s contract negotiations include negotiation of dispute resolution clauses?
None
1-25%
25-50%
50-75%
+75%
15. How would you describe such negotiations?
16. What dispute resolution clauses were used in the agreements your entity concluded over the past two years?
None 1-5% 5-30% 30-60% +60%
Court Litigation
Mediation
Arbitration
Arbitration under Expedited Rules
Expert Determination
Mediation followed, in the absence of a Settlement, by Court Litigation
Mediation followed, in the absence of a Settlement, by [Expedited] Arbitration
Mediation followed, in the absence of a Settlement, by Expert Determination
Other (please specify):
Straightforward
Requiring some discussion
Challenging

International Survey on Dispute Resolution in Technology Transactions - 49
17. Which arbitral institutions were included in such clauses where these foresaw mediation, (expedited) arbitration or expert determination?
None 1-5% 5-30% 30-60% +60%
American Arbitration Association (AAA)
China International Economic and Trade Arbitration Commission (CIETAC)
Deutsche Institution für Schiedsgerichtsbarkeit (DIS)
Hong Kong International Arbitration Centre (HKIAC)
International Chamber of Commerce (ICC)
London Court of International Arbitration (LCIA)
Singapore International Arbitration Center (SIAC)
Arbitration Institute of the Stockholm Chamber of Commerce (SCC)
WIPO Arbitration and Mediation Center (WIPO Center)
Non-institutional dispute resolution
Other (please specify):
18. In general, what are your entity’s main considerations when negotiating dispute resolution clauses (including court litigation)? Please tick the top three criteria.
Domestic Disputes International Disputes
Costs
Time
Confidentiality
Quality outcome (including specialization of decision-maker)
Enforceability
Neutral forum
Business solution
Setting precedent
None in particular (standard internal practice)
Support provided by institution

International Survey on Dispute Resolution in Technology Transactions - 50
IV. Types of Technology Related DISPUTES
Note: For the purpose of this Survey, a dispute means any difference, controversy or claim which is resolved through direct party negotiations, mediation, arbitration or court litigation. Proceedings in different jurisdictions, even between the same parties and concerning the same patent(s), should be counted as multiple disputes (for example patent infringement litigation in two countries between the same parties would be counted as two disputes). An appeal in a court case should not be counted as a separate dispute.
19. Has your entity been a party to NON-CONTRACTUAL disputes related to patents, copyright or know-how? Please indicate the percentage of the respective types of disputes.
No 1-5% 5-30% 30-60% +60%
Patents Know-how Copyright
20. Has your entity been a party to CONTRACTUAL disputes related to copyright, patents or know-how? Please indicate the percentage of the respective types of disputes.
No 1-5% 5-30% 30-60% +60%
Patents Know-how Copyright
21. What were your entity’s objectives in patent disputes as claimant or respondent? Please tick the main three objectives.
Claimant Respondent
Declaration of patent infringement Declaration of invalidity Damages / Royalties Renegotiation of the contract Injunction Negative declaratory judgment Competition law related considerations
Please indicate any other objectives including for copyright and know-how protection.
22. Has your entity submitted to mediation a dispute related to patents, copyright and/or know-how before or while court proceedings were pending?
No 1-5% 5-30% 30-60% +60%
Contractual Non-contractual

International Survey on Dispute Resolution in Technology Transactions - 51
23. Did the mediation result in settlement?
V. RESOLUTION of Technology Related Disputes
A. CONTRACTUAL Disputes
24. What percentage of your entity’s disputes is resolved through direct party negotiations?
Note: Direct party negotiations implies that none of the procedures listed in question 25 below has been engaged.
25. If not through direct party negotiations, how are your entity’s contractual disputes resolved?
None 1-5% 5-30% 30-60% +60%
Court litigation in your home jurisdiction
Court litigation in another jurisdiction Mediation Arbitration Arbitration under Expedited Rules Expert Determination
26. Typically, how long does it take to resolve disputes using the following procedures?
1-6 months
6 months-1 year
1 year
1-2 years
2-5 years
+ 5 years
Court litigation in your home jurisdiction (first instance and appeal count as one)
Court litigation in another jurisdiction (first instance and appeal count as one)
Mediation
Arbitration
Arbitration under Expedited Rules
Expert Determination
None
1-5%
5-30%
30-60%
+60%
None
1-5%
5-30%
30-60%
+60%

International Survey on Dispute Resolution in Technology Transactions - 52
27. Typically, what legal costs does your entity incur in resolving one dispute?
Amounts in USD -10,000 10,000-50,000
50,000-100,000
100,000-1M 1- 2M 2-5M +10M
Court litigation in your home jurisdiction (first instance and appeal count as one)
Court litigation in another jurisdiction (first instance and appeal count as one)
Mediation
Arbitration
Arbitration under Expedited Rules
Expert Determination
28. Does your entity incur other important costs in resolving disputes?
29. If not through direct party negotiations, what are your entity’s consensual settlement rates of technology disputes?
Note: For the purpose of this question, settlement includes any consensual solution of a dispute through mediation, or preceding a court judgment, or a final arbitral award.
None 1-5% 5-30% 30-60% +60% Court litigation in your home jurisdiction (first instance and appeal count as one)
Court litigation in another jurisdiction (first instance and appeal count as one)
Mediation
Arbitration
Arbitration under Expedited Rules
Expert Determination
B. NON-CONTRACTUAL Disputes
30. What percentage of your entity’s disputes is resolved through direct party negotiations?
Note: Direct party negotiations imply that none of the procedures listed in question 31 below has been engaged.
None
1-5%
5-30%
30-60%
+60%

International Survey on Dispute Resolution in Technology Transactions - 53
31. If not through direct party negotiations, how are your entity’s non-contractual disputes resolved?
None 1-5% 5-30% 30-60% +60% Court litigation in your home jurisdiction (first instance and appeal count as one)
Court litigation in another jurisdiction (first instance and appeal count as one)
Mediation
Arbitration
Arbitration under Expedited Rules
Expert Determination
Alternatively, do you sometimes use a different procedure? Please specify:
VI. Final COMMENTS
32. Do you observe any trends in the development of technology or of business practices which may influence your choice of dispute resolution mechanisms?
33. Do you observe any trend in your entity’s use of direct party negotiations, court litigation, mediation, arbitration, expert determination or other dispute resolution proceedings?
34. Which improvements would you suggest for the following dispute resolution mechanisms: Mediation, Arbitration and Expert Determination?

International Survey on Dispute Resolution in Technology Transactions - 54
35. Would you be willing to be briefly interviewed for the purpose of this Survey?
36. Would you be interested in participating in the following events held at the World Intellectual Property Organization’s headquarters in Geneva (at a significantly reduced fee):
If you are willing to be interviewed or if you are interested in participating in the events mentioned above, please indicate your email address:
If you wish to review your answers to the questionnaire please click “Save” below. The system will then require you to insert your email address, which will generate an email message containing a link that will allow you to return to the questionnaire as completed up to that point. Your email address will be stored confidentially.
Prepared by WIPO Arbitration and Mediation Center
Yes
No
WIPO Mediation Workshop 2011 (http://www.wipo.int/amc/en/events/)
WIPO Arbitration Workshop 2011 (http://www.wipo.int/amc/en/events/)