Embed Size (px)
Citation preview

1
Wintrust Financial Corporation 727 North Bank Lane, Lake Forest, Illinois 60045
May, 2003
Dear Shareholders, This letter provides a brief update on our financial performance through the first quarter of 2003 and other news of Wintrust Financial Corporation. Our April 17, 2003 news release of our earnings for the quarter ended March 31, 2003 is also attached for your information.
HIGHLIGHTS FOR FIRST QUARTER OF 2003 We again achieved record earnings this quarter while deposits and assets also increased to record levels. Here is a summary of our financial results and accomplishments for the three months ended March 31, 2003: ◊ Net income of $8.3 million for the quarter ended March 31, 2003 increased 30% over the first quarter
of 2002. The results for the first quarter of 2002 included pretax income of $1.25 million, or $754,000 after-tax ($0.05 per common diluted share), for a partial settlement related to a non-recurring charge recorded in 2000;
◊ On a per share basis, net income totaled $0.45 per diluted common share for the first quarter of 2003,
a 13% increase as compared to year ago. The lower growth rate in earnings per share as compared to net income was primarily due to the issuance of 1,362,750 additional shares of common stock in June and July of 2002;
◊ Return on average equity was 14.51%; ◊ Total assets rose to $3.9 billion as of March 31, 2003, an increase of $960 million, or 32%, compared
to a year ago; ◊ Total deposits were $3.3 billion at the end of the first quarter 2003, an increase of $853 million, or
35%, compared to a year ago; ◊ Total loans grew to $2.6 billion as of March 31, 2003, an increase of $461 million, or 21%, compared
to a year ago; ◊ Our net overhead ratio, a measure of operating efficiency, improved to 1.21% in the first quarter of
2003 from 1.43% in the prior year quarter; ◊ Our asset quality remains strong and very manageable. Non-performing assets as a percent of total
assets were 0.34%, an improvement over year ago levels of 0.39%; ◊ In January of this year, the Board of Directors approved a semi-annual cash dividend of $0.08 per
share of outstanding common stock. The dividend was paid on February 20, 2003 to shareholders of

2
record as of February 6, 2003. This cash dividend, on an annualized basis, represents a 33.3% increase over the per share common stock dividends paid during 2002.
◊ In January 2003, we opened our 32nd banking facility—Cary Bank & Trust, a branch of Crystal Lake
Bank & Trust—in a temporary facility in Cary, Illinois, located in the southeast corner of McHenry County;
◊ Also, in April of this year, North Shore Community Bank & Trust-Skokie’s new main facility with a
drive-through was opened. Construction is well under way on Libertyville Bank & Trust’s South Libertyville facility with drive-through and Cary Bank & Trust's (a branch of Crystal Lake Bank & Trust) new main facility with drive-through;
◊ Plans are on the drawing board for Highland Park Bank & Trust’s new permanent facility, North
Shore Community Bank & Trust’s new branch in Edgebrook/Sauganash, and a new branch facility in West Northbrook for Northbrook Bank & Trust;
◊ On February 4, 2003, Wintrust completed the acquisition of Lake Forest Capital Management
Company, a predominantly large cap growth stock manager, based in Lake Forest, Illinois; INCOME AND EARNINGS The first quarter of 2003 was a good one on the revenue side for Wintrust. Net revenue reached $44.3 million, a 27% increase over the first quarter of 2002. Average earning assets grew 32%, or $846 million, over the same period. Despite the economic uncertainties and the current low interest rate environment, net interest income for the quarter increased by $4.4 million, or 20%, over the first quarter of 2002. Loan growth continued in the first quarter of 2003 with total loans outstanding at March 31, 2003 increasing from December 31, 2002 by $72 million, or 11% on an annualized basis. The net interest margin, on a fully tax equivalent basis, increased to 3.15% for the first quarter of 2003 compared with 3.13% in the fourth quarter of 2002, but declined 33 basis points from in the first quarter of 2002. Despite the pressure on the net interest margin, we believe we are positioned well for future earnings growth. We have positioned the balance sheet so that we should benefit from a rise in interest rates and believe this is a prudent position. Until a rise in rates occurs, we are fortunate that our business strategy provides a solid base to grow the deposit and loan portfolios and this growth in our balance sheet has helped fuel earnings growth despite the lower margins. We also mitigated the net interest margin pressure by realizing income from strong residential real estate lending activity and by using income from the sale of covered call options to augment the reduced net interest income. We actively monitor the relationships between growth, net interest income and other income to assist us in our goal of earnings growth in a tough interest rate environment. Non-interest income increased by 39% to $17.7 million for the first quarter of 2003 versus the same period in 2002. This was primarily due to: fees on mortgage loans increasing $2.6 million (128%), wealth management fees increasing $1.4 million (30%), gain on sale of premium finance receivables increasing $396,000 (52%), administrative services revenue associated with Tricom increasing $269,000 (33%), fees from covered call option transactions increasing $576,000 (37%), and net securities gains increasing $601,000. Partially offsetting the increased fees on mortgage loans sold were the
3
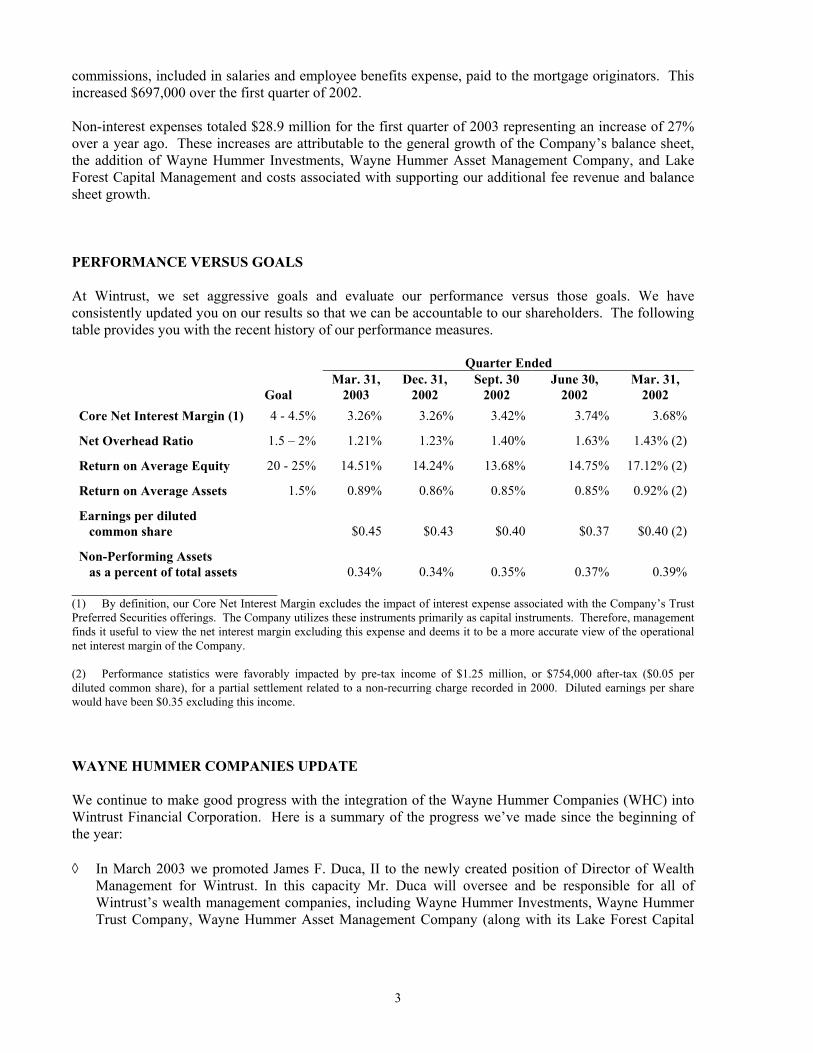
commissions, included in salaries and employee benefits expense, paid to the mortgage originators. This increased $697,000 over the first quarter of 2002. Non-interest expenses totaled $28.9 million for the first quarter of 2003 representing an increase of 27% over a year ago. These increases are attributable to the general growth of the Company’s balance sheet, the addition of Wayne Hummer Investments, Wayne Hummer Asset Management Company, and Lake Forest Capital Management and costs associated with supporting our additional fee revenue and balance sheet growth. PERFORMANCE VERSUS GOALS At Wintrust, we set aggressive goals and evaluate our performance versus those goals. We have consistently updated you on our results so that we can be accountable to our shareholders. The following table provides you with the recent history of our performance measures.
Quarter Ended Mar. 31, Dec. 31, Sept. 30 June 30, Mar. 31, Goal 2003 2002 2002 2002 2002 Core Net Interest Margin (1) 4 - 4.5% 3.26% 3.26% 3.42% 3.74% 3.68%
Net Overhead Ratio 1.5 – 2% 1.21% 1.23% 1.40% 1.63% 1.43% (2)
Return on Average Equity 20 - 25% 14.51% 14.24% 13.68% 14.75% 17.12% (2)
Return on Average Assets 1.5% 0.89% 0.86% 0.85% 0.85% 0.92% (2)
Earnings per diluted common share
$0.45
$0.43
$0.40
$0.37
$0.40 (2)
Non-Performing Assets as a percent of total assets 0.34% 0.34% 0.35% 0.37% 0.39%
____________________________ (1) By definition, our Core Net Interest Margin excludes the impact of interest expense associated with the Company’s Trust Preferred Securities offerings. The Company utilizes these instruments primarily as capital instruments. Therefore, management finds it useful to view the net interest margin excluding this expense and deems it to be a more accurate view of the operational net interest margin of the Company. (2) Performance statistics were favorably impacted by pre-tax income of $1.25 million, or $754,000 after-tax ($0.05 per diluted common share), for a partial settlement related to a non-recurring charge recorded in 2000. Diluted earnings per share would have been $0.35 excluding this income.
WAYNE HUMMER COMPANIES UPDATE We continue to make good progress with the integration of the Wayne Hummer Companies (WHC) into Wintrust Financial Corporation. Here is a summary of the progress we’ve made since the beginning of the year: ◊ In March 2003 we promoted James F. Duca, II to the newly created position of Director of Wealth
Management for Wintrust. In this capacity Mr. Duca will oversee and be responsible for all of Wintrust’s wealth management companies, including Wayne Hummer Investments, Wayne Hummer Trust Company, Wayne Hummer Asset Management Company (along with its Lake Forest Capital

4
Management Division), Focused Investments and the Wayne Hummer family of mutual funds. The CEO’s of each of these companies will report directly to him. Mr. Duca, who joined Wintrust in December 2001, will continue in his current positions as President & CEO of Wayne Hummer Trust Company and Wayne Hummer Asset Management Company;
◊ In April 2003 we announced the addition of Thomas M. McDonald as President and CEO of Wayne
Hummer Investments, LLC. Mr. McDonald succeeds Raymond L. Kratzer, who will remain with the firm as Senior Managing Director. Mr. McDonald joins Wayne Hummer from McDonald Investments, where he served as Managing Director and National Sales Manager, over-seeing 60 retail offices with responsibility for over 700 registered investment professionals. As Wayne Hummer expands its resources and capabilities, his leadership and experience in recruiting quality investment professionals, combined with Ray Kratzer’s continued involvement with our firm, will allow us to expand our capabilities, while remaining loyal to the tradition of service that our clients associate with the Wayne Hummer name;
◊ In April we introduced our new Wayne Hummer kiosks that will be located in the first floor lobbies
of most of our banks. These kiosks will be silent sales representatives for Wayne Hummer and each one will contain Wayne Hummer branding, a listing of our products and services, space for seminar announcements, our new Wayne Hummer brochures, recent Wayne Hummer Market Letters, other printed materials, and information on how to contact a Wayne Hummer Investment Executive for service; and
◊ As of the first quarter, we have now placed a total of three brokers into our bank locations—Hinsdale,
West Lake Forest, and Lake Forest. We have begun local marketing programs to promote awareness and generate new business.
With an active recruiting program underway, we expect to have Wayne Hummer brokers in all our key bank locations in 2003. This is a significant growth opportunity for us—as these new brokers bring with them a portion of their current book of business and begin to offer these new services to our bank customer base. ANNUAL MEETING
The 2003 Annual Meeting of Shareholders will be held on Thursday, May 22, 2003 at 10:00 a.m. at the Michigan Shores Club at 911 Michigan Avenue in Wilmette, Illinois. You should have already received your 2002 Annual Report to Shareholders and proxy statement. If you have not done so already, please return the proxy card or vote via the telephone or the Internet. We hope to see you at our annual meeting. We look forward to providing you with additional details about our results and presenting you with our strategy for the future.

5
SUMMARY In summary, we are very pleased with the continued growth in earnings and assets in the first quarter. We are grateful for your support of our organization and are enthusiastic about making the year 2003 another good year in terms of growth in earnings and assets. Yours truly,
John S. Lillard Edward J. Wehmer David A. Dykstra Chairman President & CEO Sr. EVP & COO
This press release contains forward-looking statements related to the Company’s financial performance that are based on estimates. Wintrust intends such forward-looking statements to be covered by the safe harbor provision for forward-looking statements contained in the Private Securities Litigation Reform Act of 1995, and is including this statement for purposes of invoking these safe harbor provisions. Actual results could differ materially from those addressed in the forward-looking statements due to factors such as changes in economic conditions, competition, or other factors that may influence the anticipated growth rate of loans and deposits, the quality of the loan portfolio and loan and deposit pricing, unanticipated changes in interest rates that negatively impact net interest income, future events that may cause unforeseen loan or lease losses, slower than anticipated development and growth of the trust and investment business, unanticipated changes in the temporary staffing industry, the ability to adapt successfully to technological changes to compete effectively in the marketplace, competition and the related pricing of brokerage and asset management products, unforeseen difficulties in integrating the Wayne Hummer Companies with our Banks, unforeseen difficulties in integrating the recent acquisition of Lake Forest Capital Management with the Wayne Hummer Companies, the ability to pursue acquisition and expansion strategies and the ability to attract and retain experienced senior management. Therefore, there can be no assurances that future actual results will correspond to these forward-looking statements.

6
Wintrust Financial Corporation 727 North Bank Lane, Lake Forest, Illinois 60045
News Release FOR IMMEDIATE RELEASE April 17, 2003 FOR MORE INFORMATION CONTACT: Edward J. Wehmer, President & Chief Executive Officer David A. Dykstra, Senior Executive Vice President & Chief Operating Officer (847) 615-4096 Website address: www.wintrust.com
WINTRUST FINANCIAL CORPORATION REPORTS RECORD EARNINGS FOR THE FIRST QUARTER;
FIRST QUARTER NET EARNINGS UP 30%
LAKE FOREST, ILLINOIS — Wintrust Financial Corporation (“Wintrust”) (Nasdaq: WTFC)
announced record net income of $8.3 million for the quarter ended March 31, 2003, an increase of $1.9
million, or 30%, over the $6.4 million recorded in the first quarter of 2002. On a per share basis, net income
for the first quarter of 2003 totaled $0.45 per diluted common share, a $0.05 per share, or 13%, increase as
compared to the 2002 first quarter total of $0.40 per diluted common share. The results for the first quarter of
2002 included pretax income of $1.25 million, or $754,000 after-tax ($0.05 per common diluted share), for a
partial settlement related to a non-recurring charge recorded in 2000. The lower growth rate in the earnings
per share as compared to net income was primarily due to the issuance of 1,362,750 additional shares of
common stock in June and July of 2002. The return on average equity for the first quarter of 2003 stood at
14.51%.
“We are pleased with the results and growth of the Company as we continue to address and meet the
challenges of the current economic cycle,” commented Edward J. Wehmer, President and Chief Executive
Officer. “In the first quarter we continued to devote significant efforts to our wealth management businesses.”
Mr. Wehmer added, “We successfully completed the acquisition of Lake Forest Capital Management
Company in February, named James F. Duca, II as Director of Wealth Management, announced the addition of

7
Thomas M. McDonald as President and CEO of Wayne Hummer Investments, LLC and added to our stable of
experienced customer-oriented brokerage representatives, all aimed at growing this important business
segment. We remain comfortable with the existing range of the analysts’ earnings estimate for 2003 of $1.75
to $1.90 per share.”
Key operating measures for Wintrust in 2003, as compared to the prior year, are shown in the table
below:
Quarter Quarter Ended Ended % or March 31, March 31, basis point (bp) (Dollars in thousands, except per share data) 2003 2002 Change Net income $ 8,263 $ 6,362 30 %Net income per common share – Diluted $ 0.45 $ 0.40 13 % Net revenue (1) $ 44,347 $ 34,920 27 %Net interest income $ 26,604 $ 22,168 20 % Net interest margin (4) 3.15 % 3.48 % (33)bpCore net interest margin (2) (4) 3.26 % 3.68 % (42)bpNet overhead ratio (3) 1.21 % 1.43 % (22)bpReturn on average assets 0.89 % 0.92 % (3)bpReturn on average equity 14.51 % 17.12 % (261)bp At end of period Total assets $ 3,914,995 $ 2,955,153 32 %Total loans $ 2,628,480 $ 2,167,550 21 %Total deposits $ 3,270,295 $ 2,417,315 35 % Book value per common share $ 13.75 $ 10.41 32 %Market price per common share $ 28.60 $ 22.97 25 %Common shares outstanding 17,371,140 15,711,641 11 %(1) Net revenue includes net interest income and non-interest income. (2) Core net interest margin excludes interest expense associated with Wintrust’s Long-term Debt - Trust Preferred Securities. (3) The net overhead ratio is calculated by netting total non-interest expense and total non-interest income, annualizing this amount, and dividing by
that period’s total average assets. A lower ratio indicates a higher degree of efficiency. (4) See “Supplemental Financial Measures/Ratios” for additional information on this performance measure/ratio.

8
On February 20, 2002, Wintrust completed its acquisition of Wayne Hummer Investments, LLC
(including its wholly owned subsidiary, Focused Investments LLC) and Wayne Hummer Asset Management
Company (collectively, the “Wayne Hummer Companies”). Accounted for as a purchase, the Wayne Hummer
Companies results of operations are included only since the effective date of acquisition (February 1, 2002) in
Wintrust’s results. As of March 31, 2003, we have migrated approximately $252 million of customers’ funds
from the money market mutual fund managed by Wayne Hummer Asset Management Company into insured
bank deposits of the Wintrust banks. The introduction of bank and trust products to customers of the Wayne
Hummer Companies continues, as well as the referral of banking customers to Wayne Hummer’s brokerage
operation. We now are actively pursuing the placement of brokerage representatives into the markets served
by Wintrust banks.
On February 4, 2003, Wintrust completed the acquisition of Lake Forest Capital Management
Company based in Lake Forest, Illinois. Lake Forest Capital Management will retain its name and has been
merged into and will operate as a separate division of Wayne Hummer Asset Management Company,
Wintrust's existing asset management subsidiary. Accounted for as a purchase, Lake Forest Capital
Management Company’s results of operations are included only since the effective date of acquisition
(February 1, 2003) in Wintrust’s 2003 results. The acquisition of Lake Forest Capital Management Company
will further expand our wealth management business in the Chicago metropolitan area.
The Company’s first quarter 2003 results of operations include three months revenue and expenses
attributable to the Wayne Hummer Companies and two months revenue and expenses attributable to Lake
Forest Capital Management Company while the first quarter of 2002 includes only two months revenue and
expenses from the Wayne Hummer Companies and no revenue and expenses from Lake Forest Capital
Management Company.
Total assets rose to $3.9 billion at March 31, 2003, an increase of $960 million, or 32%, compared to
$3.0 billion a year ago. Total deposits as of March 31, 2003 were $3.3 billion, an increase of $853 million, or

9
35%, as compared to $2.4 billion at March 31, 2002. Total loans grew to $2.6 billion as of March 31, 2003, a
$461 million, or 21%, increase over the $2.2 billion of a year ago.
For the first quarter of 2003, net interest income totaled $26.6 million, increasing $4.4 million, or 20%,
compared to the first quarter of 2002. Average earning assets grew $846 million over the first quarter of 2002,
a 32% increase. Despite the first quarter’s economic uncertainties and the current low interest rate
environment, net interest income in the quarter increased by $476,000, or 2%, over the fourth quarter of 2002.
Loan growth continued in the first quarter of 2003, despite higher levels of refinancing, with total loans
outstanding at March 31, 2003 increasing from December 31, 2002 by $72 million, or 11% on an annualized
basis. The net interest margin for the first quarter of 2003 increased to 3.15% compared with 3.13% in the
fourth quarter of 2002, but down 33 basis points from the 3.48% recorded in the first quarter of 2002. Net
interest margin pressure over the last 12 months was mitigated by increases in fees on mortgage loans sold and
fees from covered call option transactions.
Non-interest income totaled $17.7 million for the first quarter of 2003, increasing $5.0 million, or
39%, over the same period in 2002. Fees on mortgage loans increased $2.6 million or 128%, wealth
management fees increased $1.4 million or 30%, gain on sale of premium finance receivables increased
$396,000 or 52%, administrative services revenue associated with Tricom increased $269,000 or 33%, fees
from covered call option transactions increased $576,000 or 37% and net securities gains increased $601,000.
Partially offsetting the increased fees on mortgage loans sold were the commissions, included in salaries and
employee benefits expense, paid to the mortgage originators, increasing $697,000 over the first quarter of
2002.
Non-interest expense totaled $28.9 million for the first quarter of 2003, increasing $6.2 million, or
27%, over the first quarter of 2002. The growth in non-interest expense is attributable to increases in salaries
and benefits and operating costs as a result of continued growth and expansion of the banking franchise
(including the commissions paid to mortgage originators described above and other costs related to increased

10
mortgage loan activities), normal annual increases in salaries, increased costs of employee benefits and the
growth of the wealth management business. The net overhead ratio for the first quarter of 2003 improved to
1.21% from 1.43% in the same period last year.
Non-performing assets totaled $13.4 million, minimally increasing over both the $11.6 million at
March 31, 2002 and the $12.6 million at December 31, 2002. The increase in non-performing assets from
year-end is attributable to a $908,000 increase in other real estate owned. Non-performing assets were 0.34%
of total assets, at March 31, 2003. This ratio improved when compared to 0.39% at March 31, 2002 and
remained level with the 0.34% at December 31, 2002. The level of non-performing assets remains low and
manageable.

11
Wintrust is a financial holding company whose common stock is traded on the Nasdaq Stock Market.
Its seven suburban Chicago community bank subsidiaries, each of which was founded as a de novo bank since
December 1991, are located in high income retail markets — Lake Forest Bank & Trust Company, Hinsdale
Bank & Trust Company, North Shore Community Bank & Trust Company in Wilmette, Libertyville Bank &
Trust Company, Barrington Bank & Trust Company, Crystal Lake Bank & Trust Company and Northbrook
Bank & Trust Company. The banks also operate facilities in Lake Bluff, Highland Park, Hoffman Estates,
Highwood, Glencoe, Winnetka, Clarendon Hills, Western Springs, Skokie, Wauconda, Cary, McHenry and
Riverside, Illinois. Additionally, the Company operates various non-bank subsidiaries. First Insurance
Funding Corporation, one of the largest commercial insurance premium finance companies operating in the
United States, serves commercial loan customers throughout the country. Wayne Hummer Trust Company, a
trust subsidiary, allows Wintrust to service customers’ trust and investment needs at each banking location.
Tricom, Inc. of Milwaukee provides short-term accounts receivable financing and value-added out-sourced
administrative services, such as data processing of payrolls, billing and cash management services, to
temporary staffing service clients located throughout the United States. Wayne Hummer Investments, LLC is
a broker-dealer providing a full range of private client and brokerage services to clients located primarily in the
Midwest. Focused Investments LLC is a broker-dealer that provides a full range of investment solutions to
clients through a network of community-based financial institutions throughout the Midwest. Wayne Hummer
Asset Management Company provides money management services and advisory services to individual
accounts as well as the Wayne Hummer Companies' four proprietary mutual funds. Wintrust Information
Technology Services Company provides information technology support, item capture, and statement
preparation and lockbox services to the Wintrust subsidiaries.
Currently, Wintrust operates a total of 32 banking offices and is in the process of constructing several
additional branch facilities. All of the Company’s banking subsidiaries are locally managed with large local
boards of directors. Wintrust Financial Corporation has been one of the fastest growing de novo bank groups
in Illinois.
# # #

7
WINTRUST FINANCIAL CORPORATION SELECTED FINANCIAL HIGHLIGHTS Three Months Ended March 31, (Dollars in thousands, except per share data) 2003 2002 Selected Financial Condition Data (at end of period): Total assets $ 3,914,995 $ 2,955,153 Total loans 2,628,480 2,167,550 Total deposits 3,270,295 2,417,315 Long-term debt – trust preferred securities 51,004 51,050 Total shareholders' equity 238,905 163,521 Selected Statements of Income Data: Net interest income $ 26,604 $ 22,168 Net revenue (1) 44,347 34,920 Income before taxes 12,795 9,893 Net income 8,263 6,362 Net income per common share – Basic 0.48 0.42 Net income per common share – Diluted 0.45 0.40 Selected Financial Ratios and Other Data: Performance Ratios: Net interest margin (5) 3.15 % 3.48 % Core net interest margin (2) (5) 3.26 3.68 Non-interest income to average assets 1.92 1.84 Non-interest expense to average assets 3.12 3.28 Net overhead ratio (3) 1.21 1.43 Efficiency ratio (4) (5) 65.46 64.17 Return on average assets 0.89 0.92 Return on average equity 14.51 17.12 Average total assets $ 3,757,564 $ 2,805,594 Average total shareholders' equity 230,928 150,743 Average loans to average deposits ratio 85.5 % 89.8 %
Common Share Data at end of period: Market price per common share $ 28.60 $ 22.97 Book value per common share $ 13.75 $ 10.41 Common shares outstanding 17,371,140 15,711,641 Other Data at end of period: Allowance for loan losses $ 19,773 $ 14,697 Non-performing assets $ 13,405 $ 11,576 Allowance for loan losses to total loans 0.75 % 0.68 % Non-performing assets to total assets 0.34 % 0.39 % Number of:
Bank subsidiaries 7 7Non-bank subsidiaries 7 7Banking offices 32 30
(1) Net revenue includes net interest income and non-interest income. (2) The core net interest margin excludes interest expense associated with Wintrust’s Long-term Debt – Trust Preferred Securities. (3) The net overhead ratio is calculated by netting total non-interest expense and total non-interest income, annualizing this amount, and dividing by that
period’s total average assets. A lower ratio indicates a higher degree of efficiency (4) The efficiency ratio is calculated by dividing total non-interest expense by tax-equivalent net revenues (less securities gains or losses). A lower ratio
indicates more efficient revenue generation. (5) See “Supplemental Financial Measure/Ratios” for additional information on this performance measure/ratio.

8
WINTRUST FINANCIAL CORPORATION AND SUBSIDIARIES CONSOLIDATED STATEMENTS OF CONDITION
(Unaudited) (Unaudited) March 31, December 31, March 31,
(In thousands) 2003 2002 2002 Assets Cash and due from banks $ 78,858 $ 105,671 $ 55,793 Federal funds sold and securities purchased under
resale agreements
331,640
151,251
97,287 Interest bearing deposits with banks 4,870 4,418 1,028 Available-for-sale securities, at fair value 504,190 547,679 365,540 Trading account securities 5,777 5,558 5,298 Brokerage customer receivables 35,405 37,592 64,765 Mortgage loans held-for-sale 96,350 90,446 31,723 Loans, net of unearned income 2,628,480 2,556,086 2,167,550 Less: Allowance for loan losses 19,773 18,390 14,697 Net loans 2,608,707 2,537,696 2,152,853 Premises and equipment, net 121,068 118,961 104,780 Accrued interest receivable and other assets 95,939 95,852 50,059 Goodwill 29,515 25,266 25,935 Other intangible assets 2,676 1,165 92 Total assets $ 3,914,995 $ 3,721,555 $ 2,955,153
Liabilities and Shareholders' Equity Deposits: Non-interest bearing $ 313,207 $ 305,540 $ 242,966 Interest bearing 2,957,088 2,783,584 2,174,349 Total deposits 3,270,295 3,089,124 2,417,315
Notes payable 46,975 44,025 66,125 Federal Home Loan Bank advances 140,000 140,000 90,000 Subordinated note 25,000 25,000 — Other borrowings 41,668 46,708 113,624 Long-term debt - trust preferred securities 51,004 50,894 51,050 Accrued interest payable and other liabilities 101,148 98,802 53,518 Total liabilities 3,676,090 3,494,553 2,791,632 Shareholders' equity: Preferred stock — — — Common stock 17,371 17,216 15,712 Surplus 157,499 153,614 116,201 Common stock warrants 1,031 81 98 Retained earnings 63,842 56,967 36,482 Accumulated other comprehensive loss (838) (876) (4,972) Total shareholders' equity 238,905 227,002 163,521 Total liabilities and shareholders' equity $ 3,914,995 $ 3,721,555 $ 2,955,153

9
WINTRUST FINANCIAL CORPORATION AND SUBSIDIARIES CONSOLIDATED STATEMENTS OF INCOME Three Months Ended March 31, (Unaudited) (Unaudited) (In thousands, except per share data) 2003 2002 Interest income
Interest and fees on loans $ 40,591 $ 36,661Interest bearing deposits with banks 29 3Federal funds sold and securities purchased under resale agreements 389 293Securities 5,835 4,500Trading account securities 38 24Brokerage customer receivables 357 490Total interest income 47,239 41,971
Interest expense Interest on deposits 17,102 16,675Interest on Federal Home Loan Bank advances 1,457 897Interest on subordinated note 444 — Interest on notes payable and other borrowings 704 943Interest on long-term debt – trust preferred securities 928 1,288Total interest expense 20,635 19,803
Net interest income 26,604 22,168Provision for loan losses 2,641 2,348Net interest income after provision for loan losses 23,963 19,820Non-interest income
Wealth management fees 5,951 4,570Fees on mortgage loans sold 4,598 2,017Service charges on deposit accounts 855 738Gain on sale of premium finance receivables 1,162 766Administrative services revenue 1,091 822Net available-for-sale securities gains (losses) 386 (215)Other 3,700 4,054Total non-interest income 17,743 12,752
Non-interest expense Salaries and employee benefits 17,450 13,362Equipment expense 1,842 1,730Occupancy, net 1,898 1,544Data processing 1,053 1,014Advertising and marketing 539 524Professional fees 782 611Amortization of other intangible assets 139 17Other 5,208 3,877Total non-interest expense 28,911 22,679
Income before taxes 12,795 9,893Income tax expense 4,532 3,531Net income $ 8,263 $ 6,362
Net income per common share – Basic $ 0.48 $ 0.42
Net income per common share – Diluted $ 0.45 $ 0.40
Cash dividends declared per common share $ 0.08 $ 0.06
Weighted average common shares outstanding 17,308 15,078Dilutive potential common shares 1,124 913Average common shares and dilutive common shares 18,432 15,991

10
SUPPLEMENTAL FINANCIAL MEASURES/RATIOS In accordance with new SEC rules required by the Sarbanes-Oxley Act of 2002 regarding the use of financial measures and ratios not calculated in accordance with generally accepted accounting principles (“GAAP”), a reconciliation must be provided that shows these measures and ratios calculated according to GAAP and a statement why management believes these measures and ratios provide a more accurate view of performance. Certain non-GAAP performance measures and ratios are used by management to evaluate and measure the Company’s performance. These include taxable-equivalent net interest income (including its individual components), net interest margin (including its individual components), core net interest margin and the efficiency ratio. Management believes that these measures and ratios provide users of the Company’s financial information a more accurate view of the performance of the interest-earning assets and interest-bearing liabilities and of the Company’s operating efficiency for comparative purposes. Other financial holding companies may define or calculate these measures and ratios differently. See the table below for supplemental data and the corresponding reconciliation to GAAP financial measures for the three months ended March 31, 2003 and 2002. Management reviews yields on certain asset categories and the net interest margin of the Company, and its banking subsidiaries, on a fully taxable-equivalent basis (“FTE”). In this non-GAAP presentation, net interest income is adjusted to reflect tax-exempt interest income on an equivalent before-tax basis. This measure ensures comparability of net interest income arising from both taxable and tax-exempt sources. Net interest income on a taxable-equivalent basis is also used in the calculation of the Company’s efficiency ratio. The efficiency ratio, which is calculated by dividing non-interest expense by total taxable-equivalent net revenue (less securities gains or losses), measures how much it costs to produce one dollar of revenue. Management also evaluates the net interest margin excluding the interest expense associated with the Company’s Long-term Debt – Trust Preferred Securities (“Core Net Interest Margin”.) Because these instruments are utilized by the Company primarily as capital instruments, management finds it useful to view the net interest margin excluding this expense and deems it to be a more accurate view of the operational net interest margin of the Company. Quarter Ended March 31, (Dollars in thousands) 2003 2002
(A) Interest income (GAAP) $ 47,239 $ 41,971 Taxable-equivalent adjustment – Loans 141 188 Taxable-equivalent adjustment – Liquidity management assets 61 20 Interest income – FTE $ 47,441 $ 42,179
(B) Interest expense (GAAP) 20,635 19,803 Net interest income – FTE $ 26,806 $ 22,376
(C) Net interest income (GAAP) (A minus B) $ 26,604 $ 22,168 Net interest income – FTE $ 26,806 $ 22,376 Add: Interest expense on long-term debt – trust preferred securities 928 1,288 Core net interest income – FTE (1) $ 27,734 $ 23,664
(D) Net interest margin (GAAP) 3.13 % 3.45 % Net interest margin – FTE 3.15 % 3.48 % Core net interest margin - FTE (1) 3.26 % 3.68 %
(E) Efficiency ratio (GAAP) 65.76 % 64.55 % Efficiency ratio – FTE 65.46 % 64.17 %
(1) Core net interest income and core net interest margin are by definition a non-GAAP measure/ratio. The GAAP equivalents are the net interest income and net interest margin determined in accordance with GAAP (lines C and D in the table).

11
LOANS, NET OF UNEARNED INCOME % Growth % Growth From From March 31, December 31, March 31, December 31, March 31, (Dollars in thousands) 2003 2002 2002 2002 (1) 2002 Balance: Commercial and commercial real estate $ 1,314,493 $ 1,320,598 $ 1,066,326 (1.9)% 23.3 %Home equity 395,056 365,521 287,186 32.8 37.6Residential real estate 135,940 156,213 142,554 (52.6) (4.6)Premium finance receivables 532,162 461,614 414,330 62.0 28.4Indirect auto loans 169,311 178,234 184,385 (20.3) (8.2)Tricom finance receivables 24,416 21,048 17,558 64.9 39.1Consumer and other loans 57,102 52,858 55,211 32.6 3.4
Total loans, net of unearned income $ 2,628,480 $ 2,556,086 $ 2,167,550 11.5 % 21.3 %Mix: Commercial and commercial real estate 50 % 52 % 49 % Home equity 15 14 13 Residential real estate 5 6 7 Premium finance receivables 20 18 19 Indirect auto loans 7 7 9 Tricom finance receivables 1 1 1 Consumer and other loans 2 2 2
Total loans, net of unearned income 100 % 100 % 100 % (1) Annualized based on the number of days in the period.
DEPOSITS % Growth % Growth From From March 31, December 31, March 31, December 31, March 31, (Dollars in thousands) 2003 2002 2002 2002 (1) 2002 Balance: Non-interest bearing $ 313,207 $ 305,540 $ 242,966 10.2 % 28.9 %NOW 347,938 354,499 290,120 (7.5) 19.9NOW-Brokerage customer deposits 252,223 231,700 — 35.9 N/MMoney market 416,698 399,441 368,240 17.5 13.2Savings 155,228 147,669 133,963 20.8 15.9Time certificate of deposits 1,785,001 1,650,275 1,382,026 33.1 29.2Total deposits $ 3,270,295 $ 3,089,124 $ 2,417,315 23.8 % 35.3 %
Mix: Non-interest bearing 9 % 10 % 10 % NOW 11 11 12 NOW-Brokerage customer deposits 8 8 — Money market 13 13 15 Savings 5 5 6 Time certificate of deposits 54 53 57 Total deposits 100 % 100 % 100 %
(1) Annualized based on the number of days in the period. N/M = Not Meaningful
Previously, Wintrust indicated its strategy to attract funds from the money market mutual fund balances managed by Wayne Hummer Asset Management Company into deposit accounts of the Wintrust affiliate banks. Consistent with reasonable interest rate risk parameters, the funds will generally be invested in loan production of the affiliate banks as well as other investments suitable for banks. As of March 31, 2003, approximately $252 million had migrated into insured bank deposits at the affiliate banks. The migration of additional funds to the affiliate banks is subject to the desire of the customers to make the transition of their funds into FDIC insured bank accounts, capital capacity of the Company and the availability of suitable investments in which to deploy the funds.

12
NET INTEREST INCOME The following table presents a summary of Wintrust’s net interest income and related net interest margins, calculated on a fully tax-equivalent basis, for the three-month periods ended March 31, 2003 and 2002:
For the Quarter Ended March 31, 2003
For the Quarter Ended March 31, 2002
(Dollars in thousands) Average Interest Rate Average Interest Rate Liquidity management assets (1) (2) (8) $ 715,338 $ 6,314 3.58% $ 458,922 $ 4,816 4.26 %Other earning assets (3) 41,221 395 3.89 44,920 514 4.64 Loans, net of unearned income (2) (4) (8) 2,695,146 40,732 6.13 2,101,802 36,849 7.11 Total earning assets (8) $ 3,451,705 $ 47,441 5.57% $ 2,605,644 $ 42,179 6.56 % Interest-bearing deposits $ 2,851,643 $ 17,102 2.43% $ 2,097,388 $ 16,675 3.22 %Federal Home Loan Bank advances 140,000 1,457 4.22 90,000 897 4.04 Notes payable and other borrowings 92,018 704 3.10 119,698 943 3.20 Subordinated note 25,000 444 7.10 — — — Long-term debt – trust preferred securities 50,894 928 7.29 51,050 1,288 10.09 Total interest-bearing liabilities $ 3,159,555 $ 20,635 2.65% $ 2,358,136 $ 19,803 3.41 % Interest rate spread (5) (8) 2.92% 3.15 %Net free funds/contribution (6) $ 292,150 0.23 $ 247,508 0.33 Net interest income/Net interest margin (8) $ 26,806 3.15% $ 22,376 3.48 %Core net interest margin (7) (8) 3.26% 3.68 % (1) Liquidity management assets include available-for-sale securities, interest earning deposits with banks and federal funds sold. (2) Interest income on tax-advantaged loans and securities reflects a tax-equivalent adjustment based on a marginal federal corporate tax rate of 35%. The total
adjustments for the quarters ended March 31, 2003 and 2002 were $202,000 and $208,000, respectively. (3) Other earning assets include brokerage customer receivables and trading account securities. (4) Loans, net of unearned income includes mortgages held for sale and non-accrual loans. (5) Interest rate spread is the difference between the yield earned on earning assets and the rate paid on interest-bearing liabilities. (6) Net free funds are the difference between total average earning assets and total average interest-bearing liabilities. The contribution is based on the rate
paid for total interest-bearing liabilities. (7) The core net interest margin excludes interest expense associated with Wintrust’s Long-term Debt – Trust Preferred Securities. (8) See “Supplemental Financial Measures/Ratios” for additional information on this performance measure/ratio. Net interest income, which is the difference between interest income and fees on earning assets and interest expense on deposits and borrowings, is the major source of earnings for Wintrust. Tax-equivalent net interest income for the quarter ended March 31, 2003 totaled $26.8 million, an increase of $4.4 million, or 20%, as compared to the $22.4 million recorded in the same quarter of 2002. Average loans in the first quarter of 2003 increased $593 million, or 28%, over the first quarter of 2002. Net interest margin represents tax-equivalent net interest income as a percentage of the average earning assets during the period. For the first quarter of 2003 the net interest margin was 3.15%, a decrease of 33 basis points when compared to the net interest margin of 3.48% in the prior year first quarter. The core net interest margin, which excludes the interest expense related to Wintrust’s Long-term Debt - Trust Preferred Securities, was 3.26% for the first quarter of 2003, and decreased 42 basis points when compared to the prior year first quarter’s core margin of 3.68%. Wintrust’s net interest margin increased slightly when compared to the fourth quarter of 2002.

13
The yield on total earning assets for the first quarter of 2003 was 5.57% as compared to 6.56% in 2002, a decrease of 99 basis points resulting primarily from the effect of decreases in general market rates on liquidity management assets and loans. The yield on earning assets is heavily dependent on the yield on loans since average loans comprised approximately 78% of total average earning assets. The first quarter 2003 yield on loans was 6.13%, a 98 basis point decrease when compared to the prior year first quarter yield of 7.11%. The rate paid on interest-bearing liabilities for the first quarter of 2003 was 2.65%, compared to 3.41% in the first quarter of 2002, a decline of 76 basis points. Interest-bearing deposits accounted for 90% of total interest-bearing funding in the first quarter of 2003, compared to 89% in the same period of 2002. The rate paid on interest-bearing deposits averaged 2.43% for the first quarter of 2003 versus 3.22% for the same quarter of 2002, a decrease of 79 basis points. The rate paid on wholesale funding, consisting of Federal Home Loan Bank of Chicago advances, notes payable, subordinated note and other borrowings, rose to 4.11% in the first quarter of 2003 compared to 3.56% in the first quarter of 2002. The increase in the rate paid on total wholesale funding is primarily attributable to a $25 million subordinated debt agreement with an unaffiliated bank that qualifies as Tier II regulatory capital that was completed in the fourth quarter of 2002. The Company utilizes these borrowing sources to fund the additional capital requirements of the subsidiary banks, manage its capital, manage its interest rate risk position, funding at the Wayne Hummer Companies and for general corporate purposes. NON-INTEREST INCOME For the first quarter of 2003, non-interest income totaled $17.7 million and increased $5.0 million over the prior year first quarter. All categories of non-interest income increased over the first quarter of 2002. Most notable were increases in fees on mortgage loans sold and wealth management fees. The first quarter of 2002 includes a $1.25 million partial settlement related to a non-recurring charge recorded in 2000. Non-interest income as a percentage of net revenue increased to 40% in the first quarter of 2003, up from 37% in the first quarter of 2002. Wealth management fees is comprised of the trust and asset management revenue of Wayne Hummer Trust Company (name changed from Wintrust Asset Management Company in May 2002) and the asset management fees, brokerage commissions, trading commissions and insurance product commissions at the Wayne Hummer Companies (including the recently acquired Lake Forest Capital Management Company). The increase in this category, up $1.4 million over the first quarter of 2002, is primarily attributable to the additional month of revenues from the Wayne Hummer Companies included in the 2003 results and the two months of revenue from Lake Forest Capital Management Company. The acquisition of Lake Forest Capital Management Company demonstrates Wintrust’s commitment to growing the trust and investment business in order to better service its customers and create a more diversified revenue stream. Fees on mortgage loans sold include income from originating and selling residential real estate loans into the secondary market. For the quarter ended March 31, 2003, these fees totaled $4.6 million, an increase of $2.6 million, or 128%, from the prior year first quarter and up from the $4.5 million recorded in the fourth quarter of 2002. Although these fees are a continuous source of revenue, these fees continue to benefit from high levels of mortgage origination volumes, particularly refinancing activity caused by the low level of mortgage interest rates. Management anticipates that the levels of refinancing activity may taper off in 2003, barring any further reductions in mortgage interest rates. Service charges on deposit accounts totaled $855,000 for the first quarter of 2003, an increase of $117,000, or 16%, when compared to the same quarter of 2002. This increase was mainly due to a higher deposit base and a larger

14
number of accounts at the banking subsidiaries. The majority of deposit service charges relates to customary fees on overdrawn accounts and returned items. The level of service charges received is substantially below peer group levels, as management believes in the philosophy of providing high quality service without encumbering that service with numerous activity charges. As a result of continued strong loan originations of premium finance receivables, Wintrust sold excess premium finance receivables volume to an unrelated third party financial institution in the first quarter of 2003 and recognized gains of $1.2 million related to this activity, compared with $766,000 of recognized gains in the first quarter of 2002. Wintrust has a philosophy of maintaining its average loan-to-deposit ratio in the range of 85-90%. During the first quarter of 2003, the ratio was approximately 86%. Consistent with Wintrust’s strategy to be asset-driven and the desire to maintain our loan-to-deposit ratio in the aforementioned range, it is probable that similar sales of premium finance receivables will occur in the future. The administrative services revenue contributed by Tricom added $1.1 million to total non-interest income in the first quarter of 2003, an increase of $269,000 from the first quarter of 2002 and an increase of $284,000 from the fourth quarter of 2002. This revenue comprises income from administrative services, such as data processing of payrolls, billing and cash management services, to temporary staffing service clients located throughout the United States. The revenue increase in the first quarter of 2003 is attributable to the acquisition of a competitor’s customer base in early January 2003. Tricom also earns interest and fee income from providing short-term accounts receivable financing to this same client base, which is included in the net interest income category. Other non-interest income for the first quarter of 2003 totaled $3.7 million and decreased $354,000, or 9%, from the prior year quarterly total of $4.1 million. The first quarter of 2002 included pretax income of $1.25 million for a partial settlement related to a non-recurring charge recorded in 2000. This was partially offset by a $576,000 increase in premium income from certain covered call option transactions and $410,000 from Bank Owned Life Insurance (“BOLI”). The premium income from the covered call option transactions totaled $2.1 million in the first quarter of 2003 and $1.6 million in the same period of 2002. Management is able to effectively use the proceeds from selling covered call options to offset net interest margin compression and administers such sales in a coordinated process with the Company’s overall asset/liability management. During the third quarter of 2002, the Company purchased $41.1 million of BOLI. The BOLI policies were purchased to consolidate existing term life insurance contracts of executive officers and to mitigate the mortality risk associated with death benefits provided for in the executives’ employment contracts. Adjustments to the cash surrender value of the BOLI policies are recorded as non-interest income.

15
NON-INTEREST EXPENSE Non-interest expense for the first quarter of 2003 totaled $28.9 million and increased $6.2 million, or 27%, from the first quarter 2002 total of $22.7 million. All categories of non-interest expense increased over the first quarter of 2002, reflecting the continued growth and expansion of the banks with additional branches, the growth in the premium finance business, the addition of Lake Forest Capital Management in the first quarter of 2003 and a full quarter’s operating expenses attributable to the Wayne Hummer Companies. Salaries and employee benefits totaled $17.4 million for the first quarter of 2003, an increase of $4.0 million, or 31%, as compared to the prior year’s first quarter total of $13.4 million. This increase was primarily due to an additional month in the first quarter of 2003 of employee costs associated with the Wayne Hummer Companies, the salary and benefit costs of Lake Forest Capital Management Company, increases in salaries and employee benefit costs as a result of continued growth and expansion of the banking franchise, commissions associated with increased mortgage loan origination activity and normal annual increases in salaries and the employee benefit costs. The remaining categories of non-interest expense, such as occupancy costs, equipment expense, data processing, advertising and marketing, professional fees and other increased by $2.1 million over the prior year first quarter due to the acquisition of the Wayne Hummer Companies, the acquisition of Lake Forest Capital Management Company and the general growth and expansion of the banks.

16
ASSET QUALITY Allowance for Loan Losses A reconciliation of the activity in the balance of the allowance for loan losses for the three months ended March 31, 2003 and 2002 is shown as follows: Three Months Ended March 31, (Dollars in thousands) 2003 2002 Balance at beginning of period $ 18,390 $ 13,686 Provision for loan losses 2,641 2,348 Charge-offs:
Commercial and commercial real estate loans 445 225 Home equity loans — — Residential real estate loans — — Consumer and other loans 103 76 Premium finance receivables 673 867 Indirect automobile loans 216 287 Tricom finance receivables — —
Total charge-offs 1,437 1,455 Recoveries:
Commercial and commercial real estate loans 43 20 Home equity loans — — Residential real estate loans — — Consumer and other loans 23 — Premium finance receivables 67 63 Indirect automobile loans 42 30 Tricom finance receivables 4 5
Total recoveries 179 118 Net charge-offs (1,258) (1,337) Balance at March 31 $ 19,773 $ 14,697 Annualized net charge-offs (recoveries) as a percentage of average:
Commercial and commercial real estate loans 0.13 % 0.08 %Home equity loans — — Residential real estate loans — — Consumer and other loans 0.57 0.48 Premium finance receivables 0.45 0.80 Indirect automobile loans 0.40 0.56 Tricom finance receivables (0.07) (0.11)
Total loans, net of unearned income 0.19 % 0.26 %
Net charge-offs as a percentage of the provision for loan losses 47.67
% 56.94
%
Loans at March 31 $ 2,628,480 $ 2,167,550 Allowance as a percentage of loans at period-end 0.75 % 0.68 %

17
Past Due Loans and Non-performing Assets The following table sets forth Wintrust’s non-performing assets at the dates indicated. The information in the table should be read in conjunction with the detailed discussion following the table. March 31, December 31, March 31, (Dollars in thousands) 2003 2002 2002 Past Due greater than 90 days and still accruing:
Residential real estate and home equity $ 13 $ 32 $ 136Commercial, consumer and other 2,053 3,047 208Premium finance receivables 1,574 2,198 1,582Indirect automobile loans 399 423 249Tricom finance receivables — — —
Total past due greater than 90 days and still accruing 4,039 5,700 2,175 Non-accrual loans:
Residential real estate and home equity 375 711 1,912Commercial, consumer and other 2,053 1,132 742Premium finance receivables 5,694 4,725 6,277Indirect automobile loans 246 254 266Tricom finance receivables 14 20 104
Total non-accrual 8,382 6,842 9,301 Total non-performing loans:
Residential real estate and home equity 388 743 2,048Commercial, consumer and other 4,106 4,179 950Premium finance receivables 7,268 6,923 7,859Indirect automobile loans 645 677 515Tricom finance receivables 14 20 104
Total non-performing loans 12,421 12,542 11,476Other real estate owned 984 76 100Total non-performing assets $ 13,405 $ 12,618 $ 11,576 Total non-performing loans by category as a percent
of its own respective category:
Residential real estate and home equity 0.07% 0.14% 0.48%Commercial, consumer and other 0.30 0.30 0.08 Premium finance receivables 1.37 1.50 1.90 Indirect automobile loans 0.38 0.38 0.28 Tricom finance receivables 0.06 0.10 0.59
Total non-performing loans 0.47% 0.49% 0.53% Total non-performing assets as a
percentage of total assets
0.34%
0.34% 0.39% Allowance for loan losses as a
percentage of non-performing loans
159.19%
146.63% 128.07%

18
The provision for loan losses totaled $2.6 million for the first quarter of 2003, an increase of $293,000 from a year earlier. For the quarter ended March 31, 2003 net charge-offs totaled $1.3 million, down $78,000 from the $1.3 million of net charge-offs recorded in the same period of 2002. On a ratio basis annualized net charge-offs as a percentage of average loans decreased to 0.19% in the first quarter of 2003 from 0.26% in the same period in 2002. Management has actively monitored and pursued methods to reduce the level of delinquencies in the indirect auto and premium finance portfolios. Management believes the allowance for loan losses is adequate to provide for inherent losses in the portfolio. There can be no assurances, however, that future losses will not exceed the amounts provided for, thereby affecting future results of operations. The amount of future additions to the allowance for loan losses will be dependent upon the economy, changes in real estate values, interest rates, the regulatory environment, the level of past-due and non-performing loans, and other factors. The $908,000 increase in other real estate owned is attributable to possession taken from two customers on several properties that are in the process of being sold. Management does not anticipate any material losses in future periods from the disposition of these properties. Non-performing Residential Real Estate, Commercial, Consumer and Other Loans Total non-performing loans for Wintrust’s residential real estate, commercial, consumer and other loans were $4.5 million, up from the $3.0 million reported at March 31, 2002, and down from the $4.9 million reported at December 31, 2002. These loans consist primarily of a small number of commercial, residential real estate and home equity loans, which management believes are well secured and in the process of collection. The small number of such non-performing loans allows management to monitor the status of these credits and work with the borrowers to resolve these problems effectively. Non-performing Premium Finance Receivables The table below presents the level of non-performing premium finance receivables as of March 31, 2003 and 2002, and the amount of net charge-offs for the quarters then ended. (Dollars in thousands)
March 31, 2003
March 31, 2002
Non-performing premium finance receivables $ 7,268 $ 7,859 - as a percent of premium finance receivables 1.37% 1.90% Net charge-offs of premium finance receivables $ 606 $ 804
- as a percent of premium finance receivables 0.45% 0.80% Management continues to see progress in this portfolio and continues to expect the level of non-performing loans related to this portfolio to remain at relatively low levels. The ratio of non-performing premium finance receivables fluctuates throughout the year due to the nature and timing of canceled account collections from insurance carriers. Due to the nature of collateral for premium finance receivables it customarily takes 60-150 days to convert the collateral into cash collections. Accordingly, the level of non-performing premium finance receivables is not necessarily indicative of the loss inherent in the portfolio. In the event of default, Wintrust has the power to cancel the insurance policy and collect the unearned portion of the premium from the insurance carrier. In the event of cancellation, the cash returned in payment of the unearned premium by the insurer should generally be sufficient to cover the receivable balance, the interest and other charges due. Due to notification requirements and processing time by most insurance carriers, many receivables will become delinquent beyond 90 days while the insurer is processing the return of the unearned premium. Management continues to accrue interest until maturity as the unearned premium is ordinarily sufficient to pay-off the outstanding balance and contractual interest due. Non-performing Indirect Automobile Loans

19
Total non-performing indirect automobile loans were $645,000 at March 31, 2003, increasing from $515,000 at March 31, 2002 and decreasing from $677,000 at December 31, 2002. The ratio of these non-performing loans to total indirect automobile loans stood at 0.38% of total indirect automobile loans at March 31, 2003, 0.28% at March 31, 2002 and 0.38% at December 31, 2002. As noted in the Allowance for Loan Losses table, net charge-offs as a percent of total indirect automobile loans has decreased from 0.56% in the first quarter of 2002 to 0.40% in the first quarter of 2003. The level of non-performing and net charge-offs of indirect automobile loans continues to be below standard industry ratios for this type of lending. Due to the impact of the current economic and competitive environment surrounding this type of lending, management continues to de-emphasize, in relation to other loan categories, growth in the indirect automobile loan portfolio. Indirect automobile loans at March 31, 2003 were $169.3 million, down from $178.2 million at December 31, 2002 and $184.4 million at March 31, 2002. FORWARD-LOOKING STATEMENTS This press release contains forward-looking statements related to Wintrust’s financial performance that are based on estimates. Wintrust intends such forward-looking statements to be covered by the safe harbor provision for forward-looking statements contained in the Private Securities Litigation Reform Act of 1995, and is including this statement for purposes of invoking these safe harbor provisions. Actual results could differ materially from those addressed in the forward-looking statements due to factors such as changes in economic conditions, competition, or other factors that may influence the anticipated growth rate of loans and deposits, the quality of the loan portfolio and loan and deposit pricing, unanticipated changes in interest rates that negatively impact net interest income, future events that may cause unforeseen loan or lease losses, slower than anticipated development and growth of the trust and investment business, unanticipated changes in the temporary staffing industry, the ability to adapt successfully to technological changes to compete effectively in the marketplace, competition and the related pricing of brokerage and asset management products, unforeseen difficulties in integrating the acquisition of the Wayne Hummer Companies, unforeseen difficulties in integrating the acquisition of Lake Forest Capital Management with Wintrust, the ability to pursue acquisition and expansion strategies and the ability to attract and retain experienced senior management. Therefore, there can be no assurances that future actual results will correspond to these forward-looking statements.