Embed Size (px)
Citation preview
INTERNATIONAL JOURNAL OF CLIMATOLOGYInt. J. Climatol. 33: 2142–2156 (2013)Published online 30 August 2012 in Wiley Online Library(wileyonlinelibrary.com) DOI: 10.1002/joc.3579
Winter wave climate, storms and regional cycles: the SWSpanish Atlantic coast
N. Rangel-Buitrago* and G. AnfusoDepartamento de Ciencias de la Tierra, Facultad de Ciencias del Mar y Ambientales, Universidad de Cadiz, Cadiz, Spain
ABSTRACT: Climatic change-related impacts on coastal areas became an important issue in past decades and nowadaysthreaten many human settlements and activities. Coastal hazards are linked to flooding and erosion processes associatedwith sea level rise and the increased strength of hurricanes, cyclones and storms. The main aim of this work is thecharacterization of coastal storms in Cadiz (SW Spain) and the determination of their recurrence intervals and relationshipswith several regional cycles. Storm characterization was carried out using the Storm Power Index (Dolan and Davis, 1992)and five classes were obtained, from class I (weak events) to V (extreme events). Storm occurrence probability was 96%for class I (i.e. almost one event per year) to 3% for class V. The return period for class V was 25 years and ranged from6 to 8 years for classes III and IV storms, e.g. significant and severe events. Classes I and II showed a period of recurrenceranging from 1 to 3 years. Stormy winter seasons were 2009/10 (12 events), 1995/6 and 2002/3 (with 10 events each) and1993/4 (8 events). Approximately 40% of the change in monthly wave data and storminess indices was related to severalteleconnection patterns, the most important drivers of change being the Arctic Oscillation (AO), 21.45%, and the NorthAtlantic Oscillation (NAO), 19.65%. It is interesting to note that a great number of storms, larger storm duration andhigher values of Storm Power Index were only observed when neutral to strong negative NAO and AO phases occurred atthe same time (89 storms and 3355 h) and/or when there was an abrupt change of NAO and AO phases, i.e. they movedfrom a positive to negative phase without passing through a neutral phase. The results obtained in this work have widerapplications for ocean and coastal management. It is suggested that methodology used can be easily applied in differentareas where wave buoy data are available. In the same way, information obtained with this kind of work constitutes thefirst step in the development of coastal protection plans to preserve socio-economic activities from the impact of severestorm events.
KEY WORDS waves; storm; power index; teleconnection patterns; Cadiz; Spain
Received 12 April 2012; Revised 30 July 2012; Accepted 30 July 2012
1. Introduction
The recent research on climate change effects on coastalzone has been almost completely devoted to the impactsof sea level rise as a result of the global warming (Komarand Allan, 2008; Phillips and Crisp, 2010). Less attentionhas been given to the knowledge and trend of waveclimate and storms. As suggested by Keim et al. (2004),wave climate, occurrence and distribution of extremewaves and storms are important issues in the occurrenceand amount of coastal erosion, the deterioration and (atsome places) complete disappearance of ecosystems andthe safety of shipping and offshore platforms.
Different researchers around the World have recog-nized that the height of extreme waves, the number ofstorms and their intensity have been increasing in lastdecades (Bacon and Carter, 1991; Allan and Komar,2000; Dupuis et al., 2006; Komar and Allan, 2008;Soomere, 2008). In a scenario of rising sea levels and
* Correspondence to: N. Rangel-Buitrago, Departamento de Cienciasde la Tierra, Facultad de Ciencias del Mar y Ambientales, Universidadde Cadiz, Polıgono Rıo San pedro s/n, 11510 Puerto Real, Cadiz, Spain.E-mail: [email protected]
increasing wave heights, the coastline will suffer hugeimpacts in terms of erosion and flooding especially withrespect to low-lying regions that may partly or entirelydisappear (Hanson and Larson, 2008).
In order to reduce the impacts of climate change, itis important to provide realistic analyses of the naturalvariability and trends associated with climatic events, inthis case storms. The homogeneity and quality of wavedata over long periods (more than 25 years) are essentialin any analysis of extreme wave heights, storms and theirrespective probability of recurrence. Many approacheshave been used to document wave climate changes: visualobservations, wave buoys data, instrumented ships, satel-lite altimeters, numerical and physical models (Dupuiset al., 2006; Komar and Allan, 2008).
This work deals with the analysis of a 27 year longwave buoy dataset recorded at Cadiz (SW Spain). Theanalysis consisted of characterizing winter wave climate,extreme waves and storms characteristics and distributionand their relationships with regional cycles (Telecon-nection Patterns) such as the North Atlantic Oscillation(NAO) Index, the East Atlantic (EA) pattern and the Arc-tic Oscillation (AO), among others. The methodology
2012 Royal Meteorological Society
WINTER WAVE CLIMATE, STORMS AND REGIONAL CYCLES 2143
used can be easily applied in different coastal areasaround the World where wave buoy data are available fora monitoring period greater than 25 years. Informationobtained in this study constitutes a first step in developingcoastal response plans to storm impacts for the protectionof socio-economic activities, especially tourism. This willbe a major concern for coastal managers in future yearsbecause storm impacts will be magnified by predictedsea level rise linked to global climate change (Jones andPhillips, 2011).
1.1. Study area
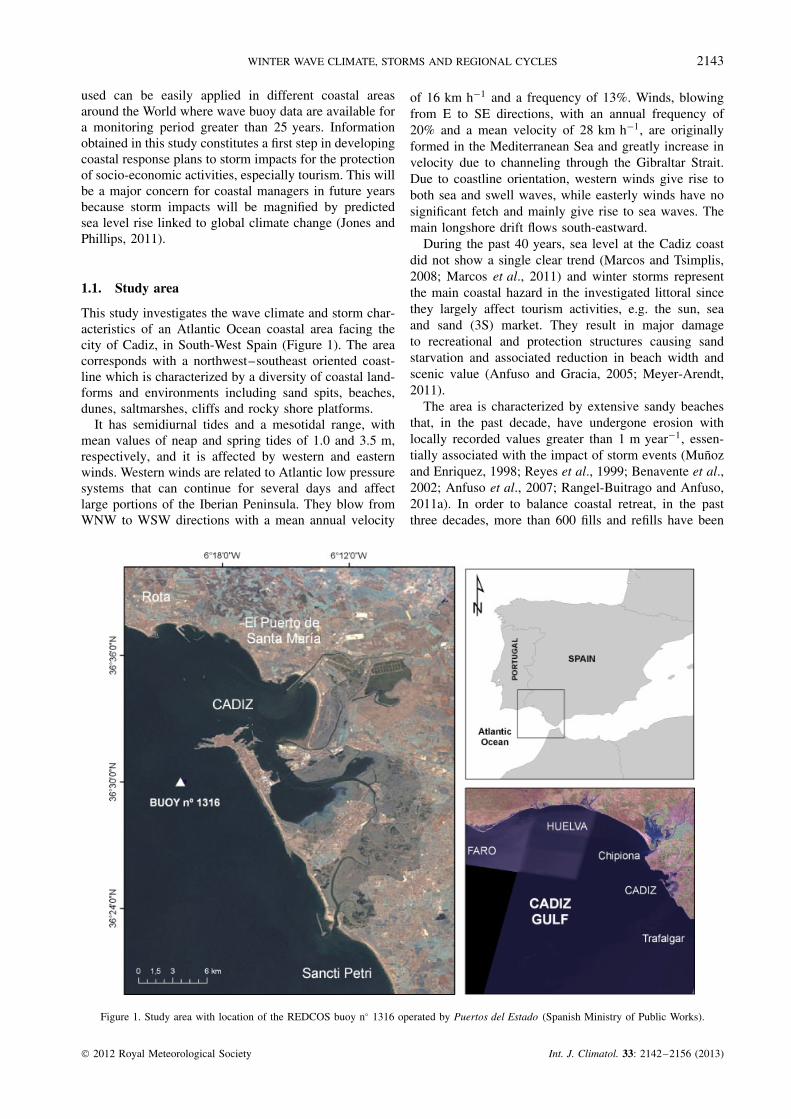
This study investigates the wave climate and storm char-acteristics of an Atlantic Ocean coastal area facing thecity of Cadiz, in South-West Spain (Figure 1). The areacorresponds with a northwest–southeast oriented coast-line which is characterized by a diversity of coastal land-forms and environments including sand spits, beaches,dunes, saltmarshes, cliffs and rocky shore platforms.
It has semidiurnal tides and a mesotidal range, withmean values of neap and spring tides of 1.0 and 3.5 m,respectively, and it is affected by western and easternwinds. Western winds are related to Atlantic low pressuresystems that can continue for several days and affectlarge portions of the Iberian Peninsula. They blow fromWNW to WSW directions with a mean annual velocity
of 16 km h−1 and a frequency of 13%. Winds, blowingfrom E to SE directions, with an annual frequency of20% and a mean velocity of 28 km h−1, are originallyformed in the Mediterranean Sea and greatly increase invelocity due to channeling through the Gibraltar Strait.Due to coastline orientation, western winds give rise toboth sea and swell waves, while easterly winds have nosignificant fetch and mainly give rise to sea waves. Themain longshore drift flows south-eastward.
During the past 40 years, sea level at the Cadiz coastdid not show a single clear trend (Marcos and Tsimplis,2008; Marcos et al., 2011) and winter storms representthe main coastal hazard in the investigated littoral sincethey largely affect tourism activities, e.g. the sun, seaand sand (3S) market. They result in major damageto recreational and protection structures causing sandstarvation and associated reduction in beach width andscenic value (Anfuso and Gracia, 2005; Meyer-Arendt,2011).
The area is characterized by extensive sandy beachesthat, in the past decade, have undergone erosion withlocally recorded values greater than 1 m year−1, essen-tially associated with the impact of storm events (Munozand Enriquez, 1998; Reyes et al., 1999; Benavente et al.,2002; Anfuso et al., 2007; Rangel-Buitrago and Anfuso,2011a). In order to balance coastal retreat, in the pastthree decades, more than 600 fills and refills have been
Figure 1. Study area with location of the REDCOS buoy n° 1316 operated by Puertos del Estado (Spanish Ministry of Public Works).
2012 Royal Meteorological Society Int. J. Climatol. 33: 2142–2156 (2013)
2144 N. RANGEL-BUITRAGO AND G. ANFUSO
Table I. Characteristics of the five storm classes (modified from Rangel-Buitrago and Anfuso 2011a): range, frequency (numberof cases and percentages), mean values (X) of significant wave height and period, storm duration and storm power index per
class.
CLASS Range (m2 h) Frequency Wave height Period Duration Storm power
N % X (m) X (s) X (h) X (m2 h)
I – Weak <515 74 57 3.46 7.02 20 242.4II – Moderate 516–1225 41 31 4.46 7.52 40.2 785.3III – Significant 1226–2537 11 8 4.56 7.5 89.6 1850IV – Severe 2538–5167 2 3 5.06 8.6 139.3 3311V – Extreme >5167 1 1 7.8 9.7 89 5414
performed along the Spanish coast. Investment in beachnourishment during the 1990s along the Atlantic coast ofAndalusia was US $37M, representing the cost of inject-ing circa 13 × 106 m3 of sediment (Munoz et al., 2001).
2. Methodology
2.1. Wave Data
Real-time wave measurements along the Spanish lit-toral are available from the coastal buoy network oper-ated by Puertos del Estado (Spanish Ministry of Pub-lic Works). Specifically, this work was based on theanalysis of data obtained from the scalar buoy n°
1316 (36.50 °N; 6.33 °W), a waverider-datawell instru-ment which is located at a water deep of 21 m, in frontof Cadiz city (Figure 1). Data were logged at 1 h inter-vals and included a time series of 163 237 wave heightand period records acquired between 1983 and 2010. Inthis study, average annual and monthly winter values ofsignificant wave height (Hs) and the 99th percentile ofHs (Hs99) were used for the characterization of wave cli-mate and definition and description of storms. The Hs99
was used because it is associated with high energy events(Almeida et al., 2011; BACC Author Team, 2008).
According to previous studies carried out by Anfusoet al. (2007) and Rangel-Buitrago and Anfuso (2011a),winter season was defined as the October to Marchperiod. The investigated dataset presented a length of27 years that, according to Komar and Allan (2008),represents a sufficient time period to analyse wave heighttrend, presence of climate-controlled cycles and waveheight annual variations due to climate events.
2.2. Storm definition and characterization
Storminess is a key issue in coastal erosion and climatechange studies (Li et al., 2011). Coastal engineers nor-mally use the number of storm events or the amountof hours during which a certain wave height thresh-old is exceed (Goda, 1988; Lemm, et al., 1999; Barr,2004). Meteorologists use the number of storm sys-tems, characterized by wind speed values grater thana certain threshold or central air pressure values lowerthan 1000 hPa (Schmith et al., 1998; Zielinski, 2002;Keim et al., 2004). Other researchers use the number of
events or the number of hours during which a specificwater level threshold is exceed (Eliot and Clarke, 1986;Zhang et al., 2000; Bromirski et al., 2003; Pattiaratchiand Elliot, 2008; Phillips, 2008).
In this work, a storm is defined as a climatic eventduring which the significant wave height (Hs) exceeds athreshold over a minimum, specific time, so the followingthree criteria have to meet:
• Wave height Hs ≥ 2.5 m. This threshold reflects thedeep-water wave height at which erosion affectedCadiz beaches (Plomaritis et al., 2009, 2010; Rangel-Buitrago and Anfuso, 2011a).
• The minimum storm duration was set at 12 h, in thisway the storm affected the coast at least during acomplete tidal cycle.
• The inter-storm period was set at 1 d in order to createde-clustered, independent sets of storms (Morton et al.,1997; Dorsch et al., 2008).
The energy content for each storm was calculatedaccording to the Storm Power Index (Dolan and Davis,1992), which is a valuable indicator of storm strength andassociated shoreline erosion (Li et al., 2011), using theformula:
Hs2td (1)
Where Hs is the maximum significant wave heightin meters and td is the storm duration in hours. Oncestorms were recognized, they were categorized by meansof the natural breaks function analysis (Jenks and Caspall,1971), into five classes from class I (weak) to class V(extreme events, limits presented in Table I).
2.3. Storm recurrence period
Frequency analysis was applied to estimate extremewaves and storm power recurrence periods by means ofthe Generalized Extreme Value (GEV) distribution; it is afamily of continuous probability distributions developedwithin extreme value theory to combine the Gumbel,Frechet and Weibull families also known as types I, IIand III extreme value distributions (Coles, 2001). TheGEV distribution was calculated according to:
F(x) = exp{− exp[−(x − u)/α]1/k} (2)
2012 Royal Meteorological Society Int. J. Climatol. 33: 2142–2156 (2013)
WINTER WAVE CLIMATE, STORMS AND REGIONAL CYCLES 2145
Where x is the random variable and u, α and k
are location, scale and shape parameters, respectively,that should be estimated for each sample. The equationreduces to type I (or Gumbel, for k = 0), type III (orWeibull, for k > 0) or type II (for k < 0) distribution.The equation for the type I (Gumbel) distribution is:
F(x) = exp{− exp[−(x − u)/α]} (3)
The methods of parameter estimation for each distri-bution are also discussed in detail in Rao and Hamed(2000). In this study, the method of moments and maxi-mum likelihood was applied to estimate the distributionof investigated parameters. The root mean square errorwas then used to select the appropriate distribution. Toinvestigate the recurrence period, wave and storm datawere plotted with the Gringorten (1963) plotting positionformula and the Gumbel distribution was fitted to thedata. The distribution function is given by the formula:
TR = N + 0.12/m − 0.44 (4)
Where N is the number of annual maximum obser-vations and m is the rank of extreme waves or stormpower values from the lowest to the highest observa-tion. According to the Gumbel distribution, the expectedsignificant values for a selected return period can be esti-mated as follows (reduced value):
TRp = − ln[− ln(1 − 1/TR)] (5)
2.4. Northern Hemisphere teleconnection patterns
The term Regional Cycle and Teleconnection Patternare terms referred to a recurring and persistent, largescale pattern of pressure and circulation anomalies thatspan vast geographical areas (Hatzaki et al., 2006).Teleconnection patterns are also referred to as preferredmodes of low-frequency (or long time scale) variabilityof the atmospheric circulation with geographically fixedcentres of action.
The NOAA Climate Dynamics Research Centre hasshown the existence of several teleconnection patternsinfluencing the European region (including the areainvestigated in this study):
• North Atlantic Oscillation – NAO (Wallace and Gut-zler, 1981; Hurrel, 1995; Barnston and Livezey, 1987).
• East Atlantic Pattern – EA (Esbensen, 1984; Wallaceand Gutzler, 1981).
• East Atlantic/Western Russia – EA/WR (Barnston andLivezey, 1987)
• Scandinavia – SCAND (Barnston and Livezey, 1987).• Polar/Eurasia – POL (Barnston and Livezey, 1987).• East Pacific – North Pacific Pattern – EP–NP (Bell
and Janowiak, 1995).• Pacific/North American Pattern – PNA (Barnston and
Livezey, 1987; Chen and van den Doo, 2003).• Arctic Oscillation – AO (Zhou et al., 2001; Higgins
et al., 2002).
Previous teleconnection patterns were recognized asthe most important characterizing parameters of theEuropean climate system, the NAO apparently beingthe most important. A link between these teleconnectionpatterns and seasonal, interannual and decadal variationsin weather, waves and storminess for the EuropeanAtlantic coastlines was established by different authors(Wang et al., 2008; Lozano et al., 2004; Hurrel andDeser, 2009; Dodet et al., 2010). Likewise, changes incoastal evolution during the second half of the 20thcentury were also connected to modulations of the NAOIndex (Lozano et al., 2004; Esteves et al., 2011; Thomaset al., 2011; O’Connor et al., 2011).
In this study, distributions of average winter monthlyand annual values of NAO, EA, EATL/WRUS, SCAND,Polar/Eurasia, EP-NP, PNA and AO from 1983 to 2010were compared with winter wave height data and stormclasses by means of multiple and independent regressionanalysis.
3. Results
3.1. Wave climate
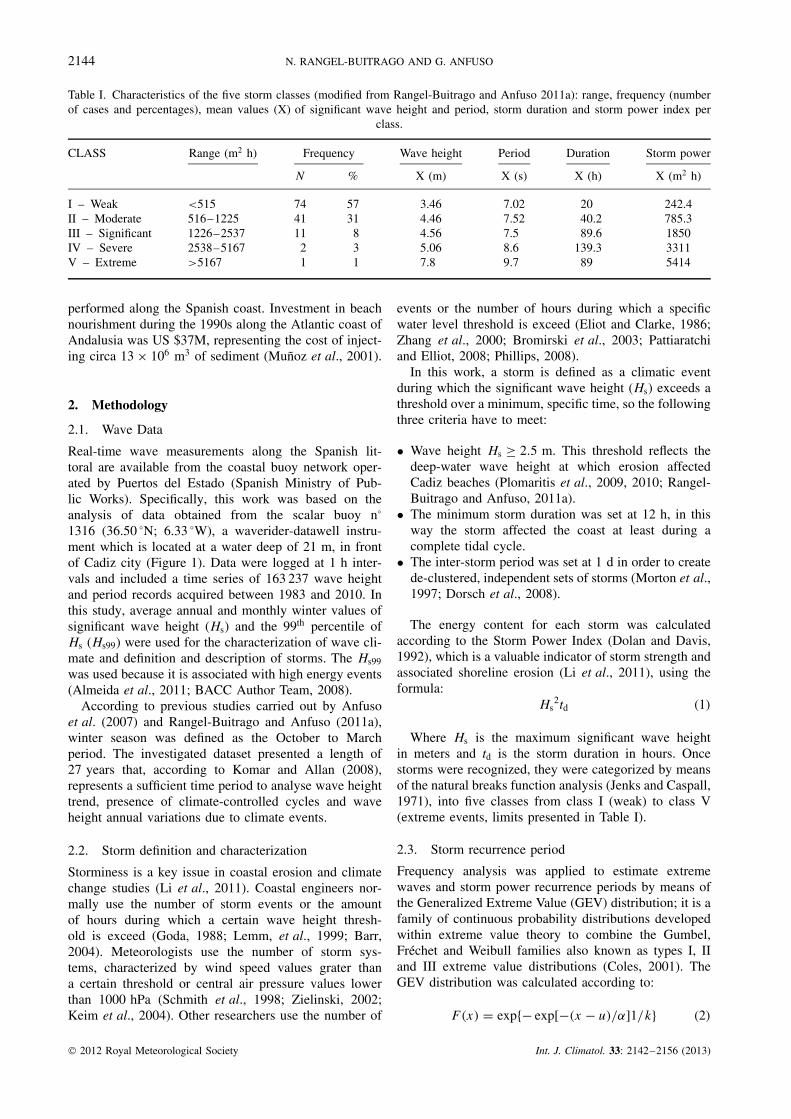
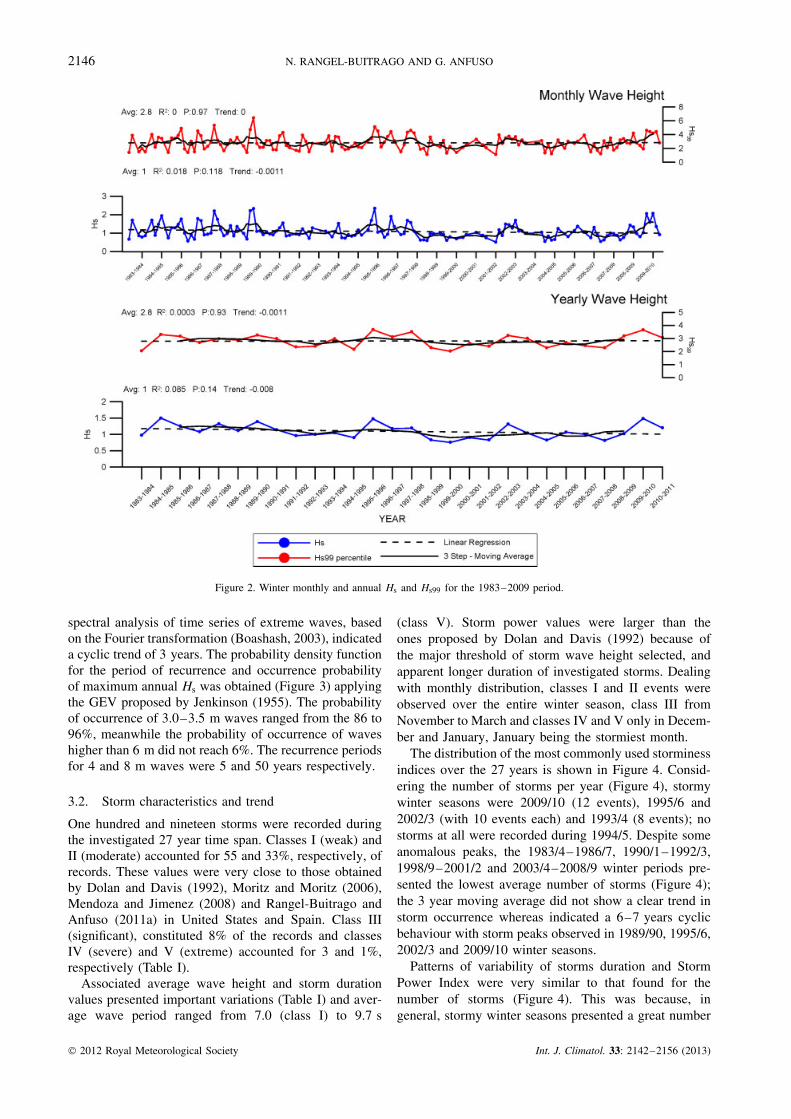
Data showed a clear pattern of cyclic variations of aver-age monthly values of significant wave height (Hs) and99th percentile of Hs (Hs99 – Figure 2). Waves were usu-ally low (Hs < 0.8 m, Hs99 < 1.8 m) in May to Augustperiod (late spring to summer), reaching minimum val-ues in August (Hs = 0.6 m, Hs99 = 1.22 m). During thewinter season, waves rapidly increased in height, reachingpeak values (Hs = 1.2 m and Hs99 = 3.1) in Decemberto January period.
Trends of average monthly and annual values of Hs
and Hs99 during the investigated period (1983–2010)and associated linear regression analyses, were plottedin Figure 2; data showed a small decrease in monthly(Avg: 1; r2 : 0.018; P : 0.118; trend: −0.0011) and annual(Avg: 1; r2 : 0.085; P : 0.14; trend: −0.008) Hs values,whereas Hs99 remained constant. However, low recordedvalues of Pearson coefficient revealed that these trendsare not statistically significant (P monthly: 0.118; P
annual: 0.14). Similar results were obtained using theMann–Kendall trend test and the Wilcoxon rank-sumtest commonly used in such kind of studies (Carter andDraper, 1988; Bacon and Carter, 1991; Allan and Komar,2000).
Considering the 27 investigated winters, a great vari-ability of average monthly wave height was observed.Low Hs values (<0.8 m) were recorded in winter sea-sons within the 1990/1–1994/5, 1998/9–2001/2 and2004/5–2007/8 periods; high Hs values (≈1.3 m) wererecorded during the 1995/6, 1996/7, 1997/8, 2002/3,2003/4 and 2009/10 winter season periods. Concerningextreme wave conditions, the highest monthly value was7.8 m (recorded December 1989) and the average valueof extreme wave height was 4.6 m.
Figure 2 evidenced a quasi-periodic 3–4 year beha-viour in the recurrence of high wave height values. A
2012 Royal Meteorological Society Int. J. Climatol. 33: 2142–2156 (2013)
2146 N. RANGEL-BUITRAGO AND G. ANFUSO
Figure 2. Winter monthly and annual Hs and Hs99 for the 1983–2009 period.
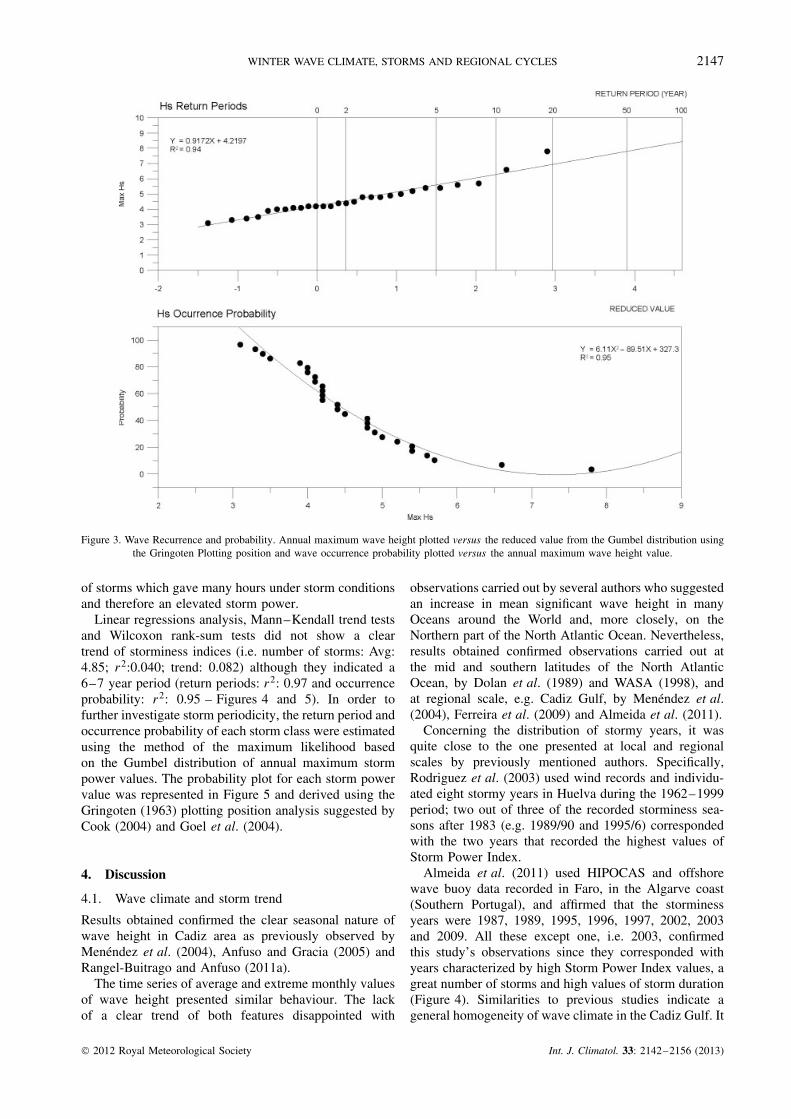
spectral analysis of time series of extreme waves, basedon the Fourier transformation (Boashash, 2003), indicateda cyclic trend of 3 years. The probability density functionfor the period of recurrence and occurrence probabilityof maximum annual Hs was obtained (Figure 3) applyingthe GEV proposed by Jenkinson (1955). The probabilityof occurrence of 3.0–3.5 m waves ranged from the 86 to96%, meanwhile the probability of occurrence of waveshigher than 6 m did not reach 6%. The recurrence periodsfor 4 and 8 m waves were 5 and 50 years respectively.
3.2. Storm characteristics and trend
One hundred and nineteen storms were recorded duringthe investigated 27 year time span. Classes I (weak) andII (moderate) accounted for 55 and 33%, respectively, ofrecords. These values were very close to those obtainedby Dolan and Davis (1992), Moritz and Moritz (2006),Mendoza and Jimenez (2008) and Rangel-Buitrago andAnfuso (2011a) in United States and Spain. Class III(significant), constituted 8% of the records and classesIV (severe) and V (extreme) accounted for 3 and 1%,respectively (Table I).
Associated average wave height and storm durationvalues presented important variations (Table I) and aver-age wave period ranged from 7.0 (class I) to 9.7 s
(class V). Storm power values were larger than theones proposed by Dolan and Davis (1992) because ofthe major threshold of storm wave height selected, andapparent longer duration of investigated storms. Dealingwith monthly distribution, classes I and II events wereobserved over the entire winter season, class III fromNovember to March and classes IV and V only in Decem-ber and January, January being the stormiest month.
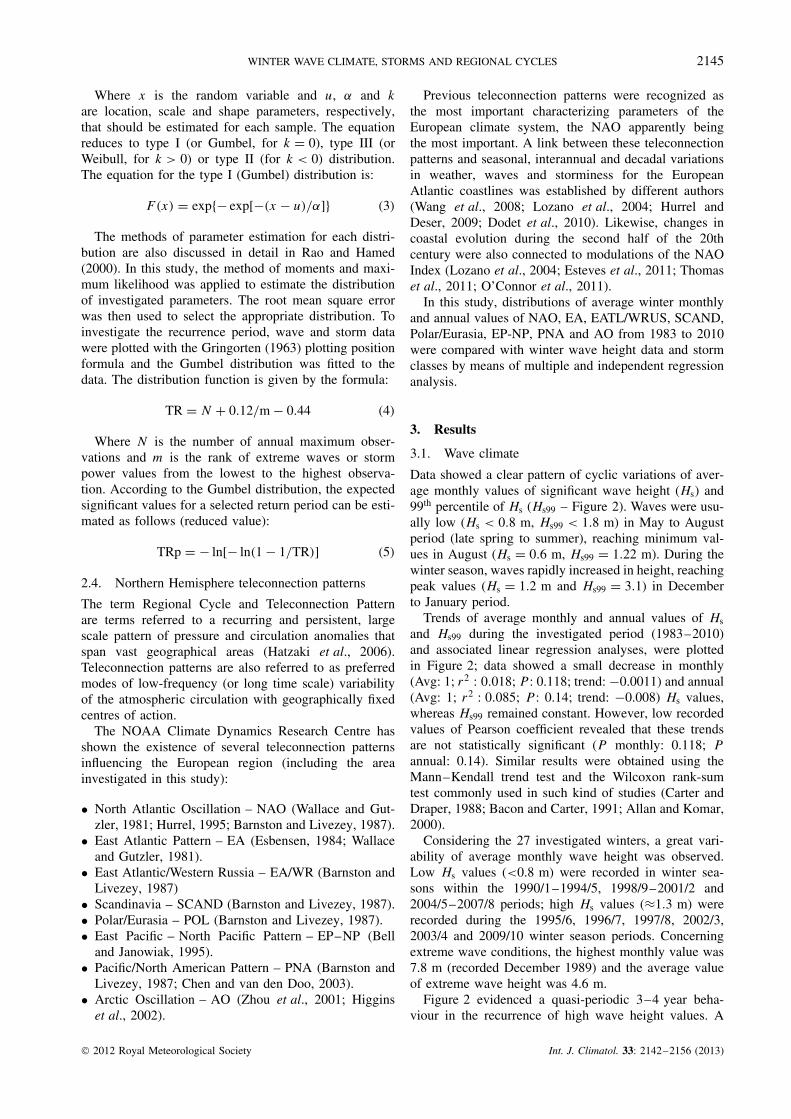
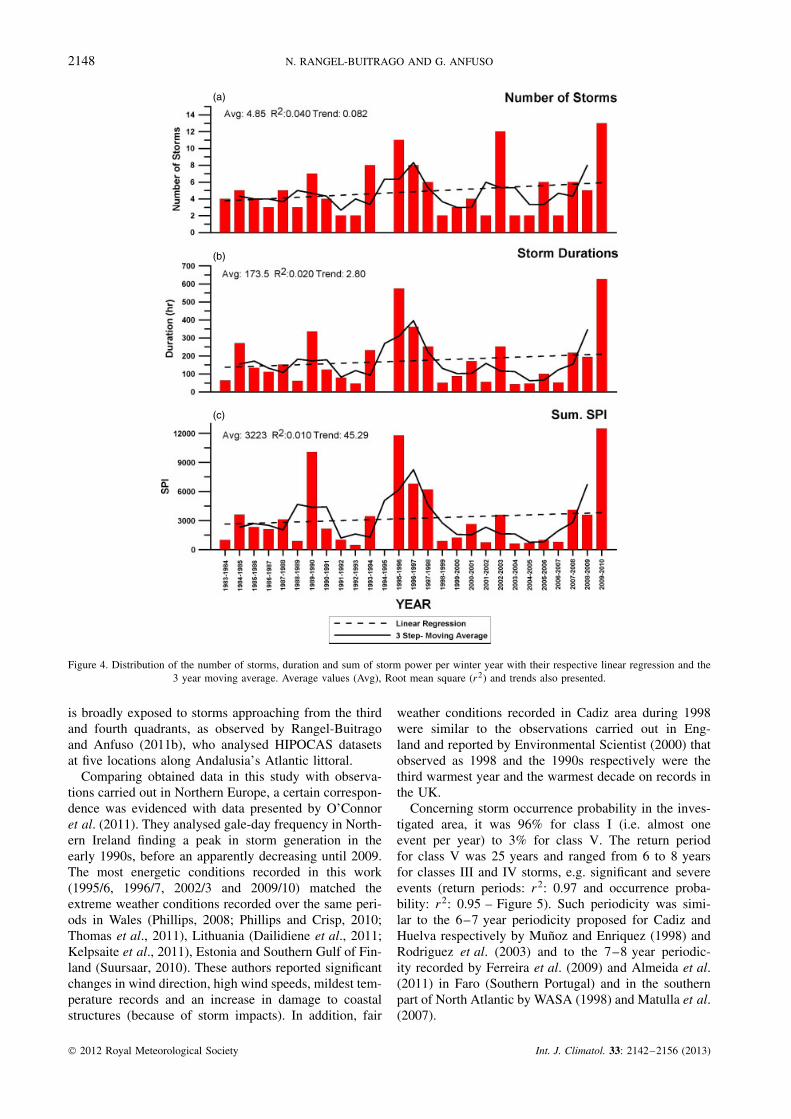
The distribution of the most commonly used storminessindices over the 27 years is shown in Figure 4. Consid-ering the number of storms per year (Figure 4), stormywinter seasons were 2009/10 (12 events), 1995/6 and2002/3 (with 10 events each) and 1993/4 (8 events); nostorms at all were recorded during 1994/5. Despite someanomalous peaks, the 1983/4–1986/7, 1990/1–1992/3,1998/9–2001/2 and 2003/4–2008/9 winter periods pre-sented the lowest average number of storms (Figure 4);the 3 year moving average did not show a clear trend instorm occurrence whereas indicated a 6–7 years cyclicbehaviour with storm peaks observed in 1989/90, 1995/6,2002/3 and 2009/10 winter seasons.
Patterns of variability of storms duration and StormPower Index were very similar to that found for thenumber of storms (Figure 4). This was because, ingeneral, stormy winter seasons presented a great number
2012 Royal Meteorological Society Int. J. Climatol. 33: 2142–2156 (2013)
WINTER WAVE CLIMATE, STORMS AND REGIONAL CYCLES 2147
Figure 3. Wave Recurrence and probability. Annual maximum wave height plotted versus the reduced value from the Gumbel distribution usingthe Gringoten Plotting position and wave occurrence probability plotted versus the annual maximum wave height value.
of storms which gave many hours under storm conditionsand therefore an elevated storm power.
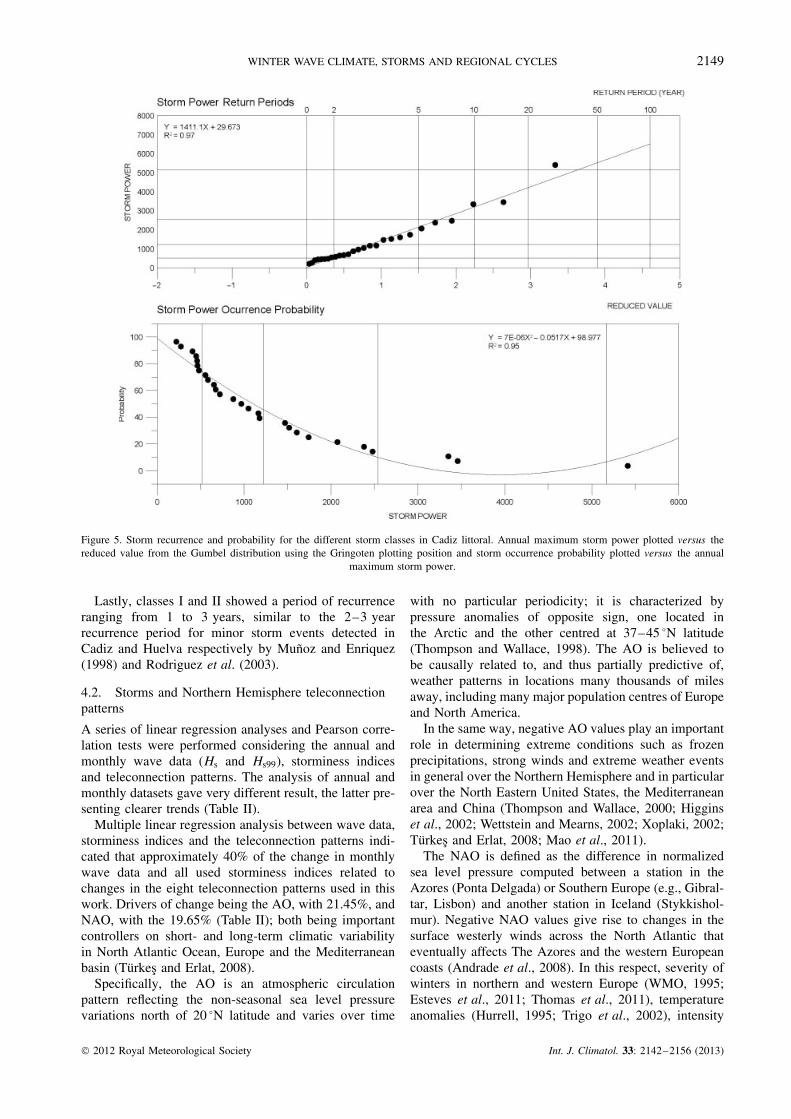
Linear regressions analysis, Mann–Kendall trend testsand Wilcoxon rank-sum tests did not show a cleartrend of storminess indices (i.e. number of storms: Avg:4.85; r2:0.040; trend: 0.082) although they indicated a6–7 year period (return periods: r2: 0.97 and occurrenceprobability: r2: 0.95 – Figures 4 and 5). In order tofurther investigate storm periodicity, the return period andoccurrence probability of each storm class were estimatedusing the method of the maximum likelihood basedon the Gumbel distribution of annual maximum stormpower values. The probability plot for each storm powervalue was represented in Figure 5 and derived using theGringoten (1963) plotting position analysis suggested byCook (2004) and Goel et al. (2004).
4. Discussion
4.1. Wave climate and storm trend
Results obtained confirmed the clear seasonal nature ofwave height in Cadiz area as previously observed byMenendez et al. (2004), Anfuso and Gracia (2005) andRangel-Buitrago and Anfuso (2011a).
The time series of average and extreme monthly valuesof wave height presented similar behaviour. The lackof a clear trend of both features disappointed with
observations carried out by several authors who suggestedan increase in mean significant wave height in manyOceans around the World and, more closely, on theNorthern part of the North Atlantic Ocean. Nevertheless,results obtained confirmed observations carried out atthe mid and southern latitudes of the North AtlanticOcean, by Dolan et al. (1989) and WASA (1998), andat regional scale, e.g. Cadiz Gulf, by Menendez et al.(2004), Ferreira et al. (2009) and Almeida et al. (2011).
Concerning the distribution of stormy years, it wasquite close to the one presented at local and regionalscales by previously mentioned authors. Specifically,Rodriguez et al. (2003) used wind records and individu-ated eight stormy years in Huelva during the 1962–1999period; two out of three of the recorded storminess sea-sons after 1983 (e.g. 1989/90 and 1995/6) correspondedwith the two years that recorded the highest values ofStorm Power Index.
Almeida et al. (2011) used HIPOCAS and offshorewave buoy data recorded in Faro, in the Algarve coast(Southern Portugal), and affirmed that the storminessyears were 1987, 1989, 1995, 1996, 1997, 2002, 2003and 2009. All these except one, i.e. 2003, confirmedthis study’s observations since they corresponded withyears characterized by high Storm Power Index values, agreat number of storms and high values of storm duration(Figure 4). Similarities to previous studies indicate ageneral homogeneity of wave climate in the Cadiz Gulf. It
2012 Royal Meteorological Society Int. J. Climatol. 33: 2142–2156 (2013)
2148 N. RANGEL-BUITRAGO AND G. ANFUSO
(a)
(b)
(c)
Figure 4. Distribution of the number of storms, duration and sum of storm power per winter year with their respective linear regression and the3 year moving average. Average values (Avg), Root mean square (r2) and trends also presented.
is broadly exposed to storms approaching from the thirdand fourth quadrants, as observed by Rangel-Buitragoand Anfuso (2011b), who analysed HIPOCAS datasetsat five locations along Andalusia’s Atlantic littoral.
Comparing obtained data in this study with observa-tions carried out in Northern Europe, a certain correspon-dence was evidenced with data presented by O’Connoret al. (2011). They analysed gale-day frequency in North-ern Ireland finding a peak in storm generation in theearly 1990s, before an apparently decreasing until 2009.The most energetic conditions recorded in this work(1995/6, 1996/7, 2002/3 and 2009/10) matched theextreme weather conditions recorded over the same peri-ods in Wales (Phillips, 2008; Phillips and Crisp, 2010;Thomas et al., 2011), Lithuania (Dailidiene et al., 2011;Kelpsaite et al., 2011), Estonia and Southern Gulf of Fin-land (Suursaar, 2010). These authors reported significantchanges in wind direction, high wind speeds, mildest tem-perature records and an increase in damage to coastalstructures (because of storm impacts). In addition, fair
weather conditions recorded in Cadiz area during 1998were similar to the observations carried out in Eng-land and reported by Environmental Scientist (2000) thatobserved as 1998 and the 1990s respectively were thethird warmest year and the warmest decade on records inthe UK.
Concerning storm occurrence probability in the inves-tigated area, it was 96% for class I (i.e. almost oneevent per year) to 3% for class V. The return periodfor class V was 25 years and ranged from 6 to 8 yearsfor classes III and IV storms, e.g. significant and severeevents (return periods: r2: 0.97 and occurrence proba-bility: r2: 0.95 – Figure 5). Such periodicity was simi-lar to the 6–7 year periodicity proposed for Cadiz andHuelva respectively by Munoz and Enriquez (1998) andRodriguez et al. (2003) and to the 7–8 year periodic-ity recorded by Ferreira et al. (2009) and Almeida et al.(2011) in Faro (Southern Portugal) and in the southernpart of North Atlantic by WASA (1998) and Matulla et al.(2007).
2012 Royal Meteorological Society Int. J. Climatol. 33: 2142–2156 (2013)
WINTER WAVE CLIMATE, STORMS AND REGIONAL CYCLES 2149
Figure 5. Storm recurrence and probability for the different storm classes in Cadiz littoral. Annual maximum storm power plotted versus thereduced value from the Gumbel distribution using the Gringoten plotting position and storm occurrence probability plotted versus the annual
maximum storm power.
Lastly, classes I and II showed a period of recurrenceranging from 1 to 3 years, similar to the 2–3 yearrecurrence period for minor storm events detected inCadiz and Huelva respectively by Munoz and Enriquez(1998) and Rodriguez et al. (2003).
4.2. Storms and Northern Hemisphere teleconnectionpatterns
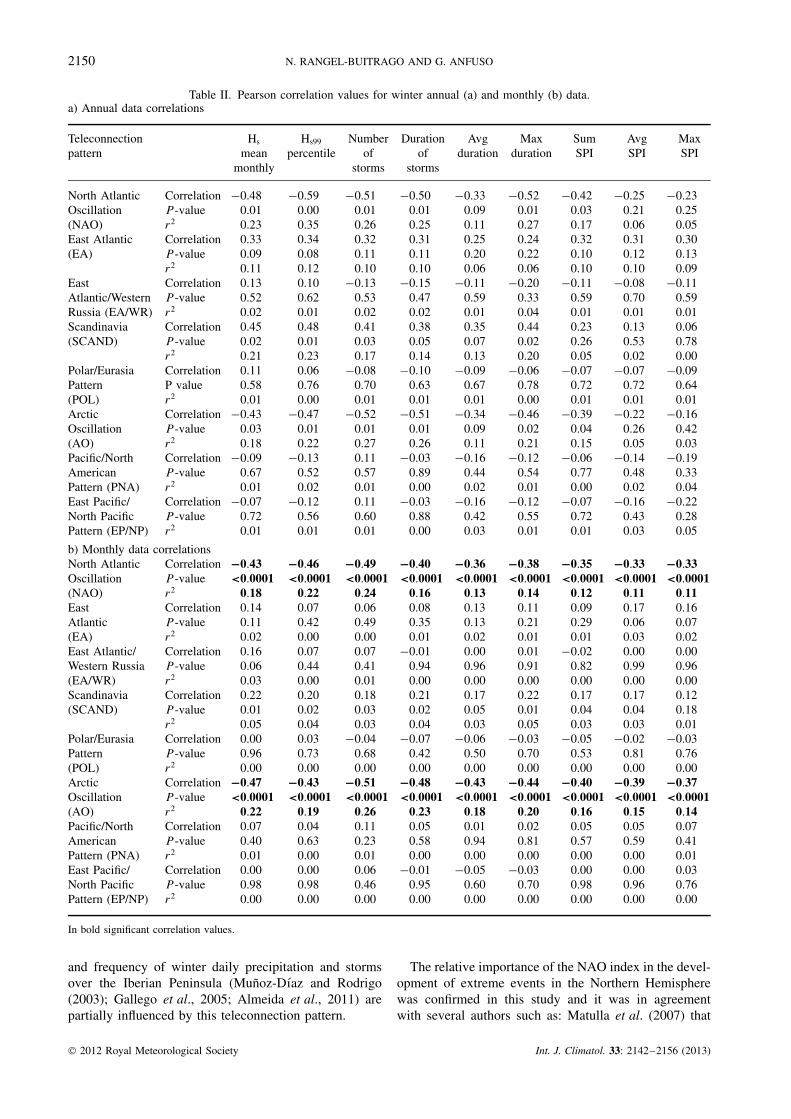
A series of linear regression analyses and Pearson corre-lation tests were performed considering the annual andmonthly wave data (Hs and Hs99), storminess indicesand teleconnection patterns. The analysis of annual andmonthly datasets gave very different result, the latter pre-senting clearer trends (Table II).
Multiple linear regression analysis between wave data,storminess indices and the teleconnection patterns indi-cated that approximately 40% of the change in monthlywave data and all used storminess indices related tochanges in the eight teleconnection patterns used in thiswork. Drivers of change being the AO, with 21.45%, andNAO, with the 19.65% (Table II); both being importantcontrollers on short- and long-term climatic variabilityin North Atlantic Ocean, Europe and the Mediterraneanbasin (Turkes and Erlat, 2008).
Specifically, the AO is an atmospheric circulationpattern reflecting the non-seasonal sea level pressurevariations north of 20 °N latitude and varies over time
with no particular periodicity; it is characterized bypressure anomalies of opposite sign, one located inthe Arctic and the other centred at 37–45 °N latitude(Thompson and Wallace, 1998). The AO is believed tobe causally related to, and thus partially predictive of,weather patterns in locations many thousands of milesaway, including many major population centres of Europeand North America.
In the same way, negative AO values play an importantrole in determining extreme conditions such as frozenprecipitations, strong winds and extreme weather eventsin general over the Northern Hemisphere and in particularover the North Eastern United States, the Mediterraneanarea and China (Thompson and Wallace, 2000; Higginset al., 2002; Wettstein and Mearns, 2002; Xoplaki, 2002;Turkes and Erlat, 2008; Mao et al., 2011).
The NAO is defined as the difference in normalizedsea level pressure computed between a station in theAzores (Ponta Delgada) or Southern Europe (e.g., Gibral-tar, Lisbon) and another station in Iceland (Stykkishol-mur). Negative NAO values give rise to changes in thesurface westerly winds across the North Atlantic thateventually affects The Azores and the western Europeancoasts (Andrade et al., 2008). In this respect, severity ofwinters in northern and western Europe (WMO, 1995;Esteves et al., 2011; Thomas et al., 2011), temperatureanomalies (Hurrell, 1995; Trigo et al., 2002), intensity
2012 Royal Meteorological Society Int. J. Climatol. 33: 2142–2156 (2013)
2150 N. RANGEL-BUITRAGO AND G. ANFUSO
Table II. Pearson correlation values for winter annual (a) and monthly (b) data.a) Annual data correlations
Teleconnectionpattern
Hs
meanmonthly
Hs99
percentileNumber
ofstorms
Durationof
storms
Avgduration
Maxduration
SumSPI
AvgSPI
MaxSPI
North Atlantic Correlation −0.48 −0.59 −0.51 −0.50 −0.33 −0.52 −0.42 −0.25 −0.23Oscillation P -value 0.01 0.00 0.01 0.01 0.09 0.01 0.03 0.21 0.25(NAO) r2 0.23 0.35 0.26 0.25 0.11 0.27 0.17 0.06 0.05East Atlantic Correlation 0.33 0.34 0.32 0.31 0.25 0.24 0.32 0.31 0.30(EA) P -value 0.09 0.08 0.11 0.11 0.20 0.22 0.10 0.12 0.13
r2 0.11 0.12 0.10 0.10 0.06 0.06 0.10 0.10 0.09East Correlation 0.13 0.10 −0.13 −0.15 −0.11 −0.20 −0.11 −0.08 −0.11Atlantic/Western P -value 0.52 0.62 0.53 0.47 0.59 0.33 0.59 0.70 0.59Russia (EA/WR) r2 0.02 0.01 0.02 0.02 0.01 0.04 0.01 0.01 0.01Scandinavia Correlation 0.45 0.48 0.41 0.38 0.35 0.44 0.23 0.13 0.06(SCAND) P -value 0.02 0.01 0.03 0.05 0.07 0.02 0.26 0.53 0.78
r2 0.21 0.23 0.17 0.14 0.13 0.20 0.05 0.02 0.00Polar/Eurasia Correlation 0.11 0.06 −0.08 −0.10 −0.09 −0.06 −0.07 −0.07 −0.09Pattern P value 0.58 0.76 0.70 0.63 0.67 0.78 0.72 0.72 0.64(POL) r2 0.01 0.00 0.01 0.01 0.01 0.00 0.01 0.01 0.01Arctic Correlation −0.43 −0.47 −0.52 −0.51 −0.34 −0.46 −0.39 −0.22 −0.16Oscillation P -value 0.03 0.01 0.01 0.01 0.09 0.02 0.04 0.26 0.42(AO) r2 0.18 0.22 0.27 0.26 0.11 0.21 0.15 0.05 0.03Pacific/North Correlation −0.09 −0.13 0.11 −0.03 −0.16 −0.12 −0.06 −0.14 −0.19American P -value 0.67 0.52 0.57 0.89 0.44 0.54 0.77 0.48 0.33Pattern (PNA) r2 0.01 0.02 0.01 0.00 0.02 0.01 0.00 0.02 0.04East Pacific/ Correlation −0.07 −0.12 0.11 −0.03 −0.16 −0.12 −0.07 −0.16 −0.22North Pacific P -value 0.72 0.56 0.60 0.88 0.42 0.55 0.72 0.43 0.28Pattern (EP/NP) r2 0.01 0.01 0.01 0.00 0.03 0.01 0.01 0.03 0.05
b) Monthly data correlationsNorth Atlantic Correlation −0.43 −0.46 −0.49 −0.40 −0.36 −0.38 −0.35 −0.33 −0.33Oscillation P -value <0.0001 <0.0001 <0.0001 <0.0001 <0.0001 <0.0001 <0.0001 <0.0001 <0.0001(NAO) r2 0.18 0.22 0.24 0.16 0.13 0.14 0.12 0.11 0.11East Correlation 0.14 0.07 0.06 0.08 0.13 0.11 0.09 0.17 0.16Atlantic P -value 0.11 0.42 0.49 0.35 0.13 0.21 0.29 0.06 0.07(EA) r2 0.02 0.00 0.00 0.01 0.02 0.01 0.01 0.03 0.02East Atlantic/ Correlation 0.16 0.07 0.07 −0.01 0.00 0.01 −0.02 0.00 0.00Western Russia P -value 0.06 0.44 0.41 0.94 0.96 0.91 0.82 0.99 0.96(EA/WR) r2 0.03 0.00 0.01 0.00 0.00 0.00 0.00 0.00 0.00Scandinavia Correlation 0.22 0.20 0.18 0.21 0.17 0.22 0.17 0.17 0.12(SCAND) P -value 0.01 0.02 0.03 0.02 0.05 0.01 0.04 0.04 0.18
r2 0.05 0.04 0.03 0.04 0.03 0.05 0.03 0.03 0.01Polar/Eurasia Correlation 0.00 0.03 −0.04 −0.07 −0.06 −0.03 −0.05 −0.02 −0.03Pattern P -value 0.96 0.73 0.68 0.42 0.50 0.70 0.53 0.81 0.76(POL) r2 0.00 0.00 0.00 0.00 0.00 0.00 0.00 0.00 0.00Arctic Correlation −0.47 −0.43 −0.51 −0.48 −0.43 −0.44 −0.40 −0.39 −0.37Oscillation P -value <0.0001 <0.0001 <0.0001 <0.0001 <0.0001 <0.0001 <0.0001 <0.0001 <0.0001(AO) r2 0.22 0.19 0.26 0.23 0.18 0.20 0.16 0.15 0.14Pacific/North Correlation 0.07 0.04 0.11 0.05 0.01 0.02 0.05 0.05 0.07American P -value 0.40 0.63 0.23 0.58 0.94 0.81 0.57 0.59 0.41Pattern (PNA) r2 0.01 0.00 0.01 0.00 0.00 0.00 0.00 0.00 0.01East Pacific/ Correlation 0.00 0.00 0.06 −0.01 −0.05 −0.03 0.00 0.00 0.03North Pacific P -value 0.98 0.98 0.46 0.95 0.60 0.70 0.98 0.96 0.76Pattern (EP/NP) r2 0.00 0.00 0.00 0.00 0.00 0.00 0.00 0.00 0.00
In bold significant correlation values.
and frequency of winter daily precipitation and stormsover the Iberian Peninsula (Munoz-Dıaz and Rodrigo(2003); Gallego et al., 2005; Almeida et al., 2011) arepartially influenced by this teleconnection pattern.
The relative importance of the NAO index in the devel-opment of extreme events in the Northern Hemispherewas confirmed in this study and it was in agreementwith several authors such as: Matulla et al. (2007) that
2012 Royal Meteorological Society Int. J. Climatol. 33: 2142–2156 (2013)
WINTER WAVE CLIMATE, STORMS AND REGIONAL CYCLES 2151
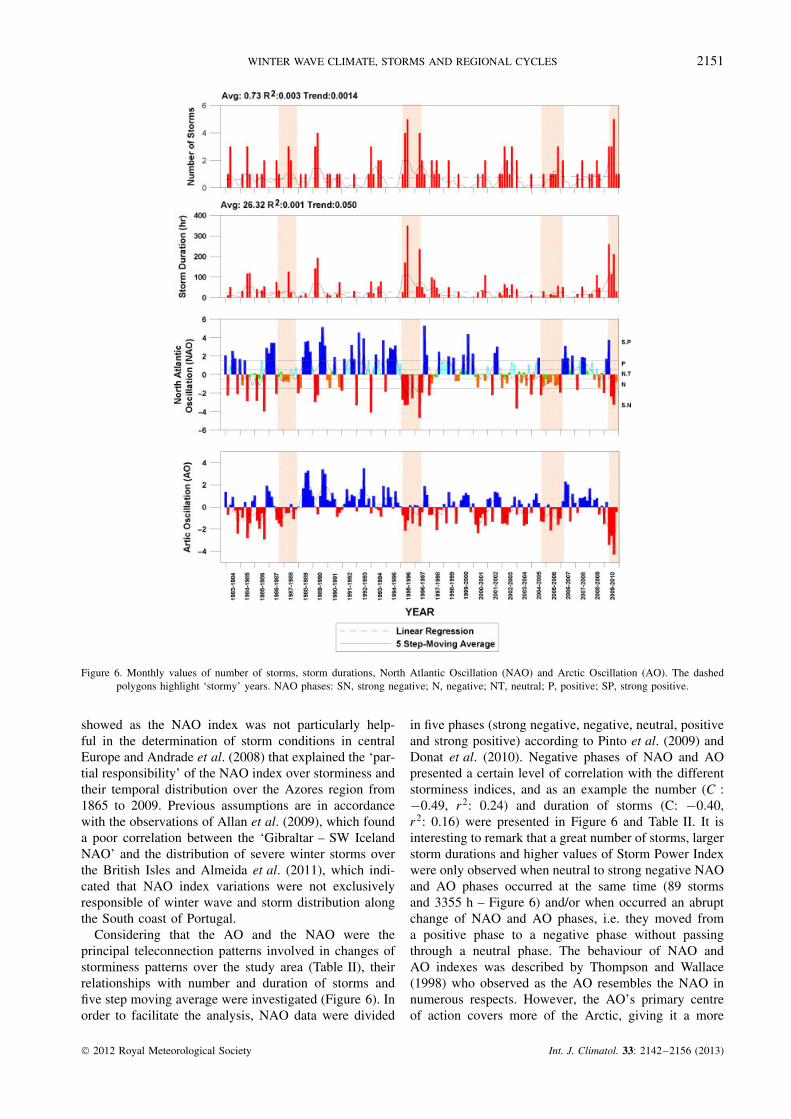
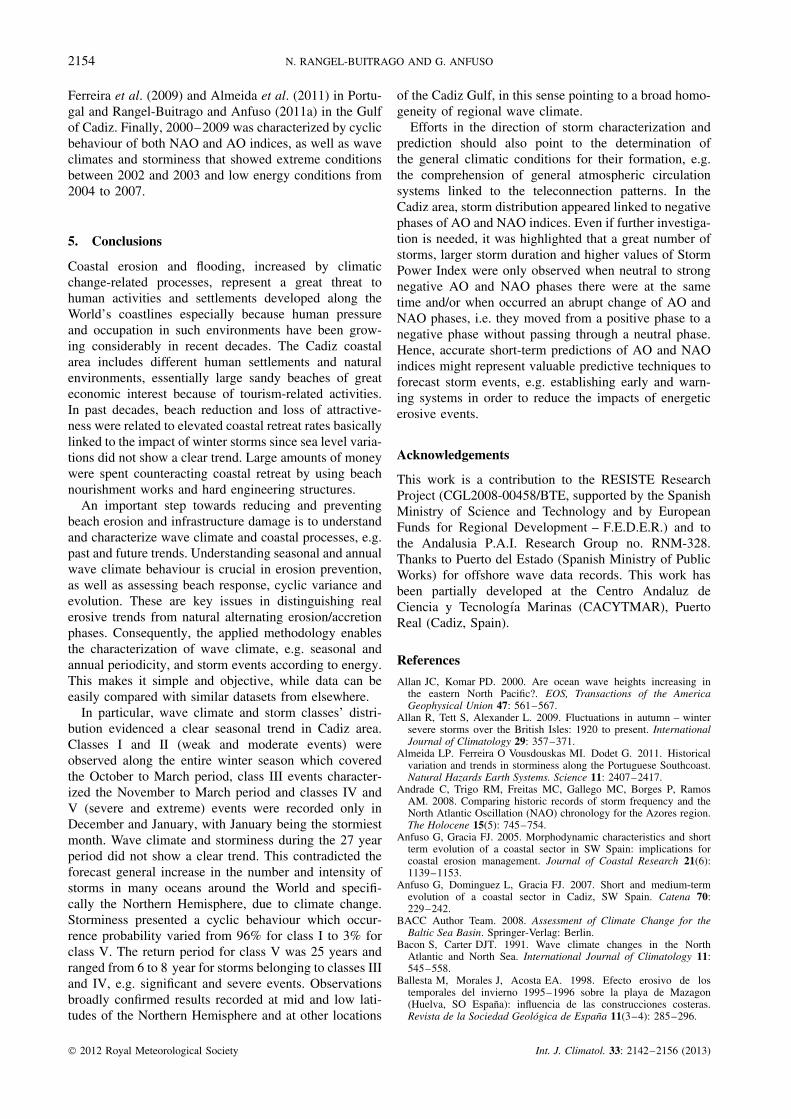
Figure 6. Monthly values of number of storms, storm durations, North Atlantic Oscillation (NAO) and Arctic Oscillation (AO). The dashedpolygons highlight ‘stormy’ years. NAO phases: SN, strong negative; N, negative; NT, neutral; P, positive; SP, strong positive.
showed as the NAO index was not particularly help-ful in the determination of storm conditions in centralEurope and Andrade et al. (2008) that explained the ‘par-tial responsibility’ of the NAO index over storminess andtheir temporal distribution over the Azores region from1865 to 2009. Previous assumptions are in accordancewith the observations of Allan et al. (2009), which founda poor correlation between the ‘Gibraltar – SW IcelandNAO’ and the distribution of severe winter storms overthe British Isles and Almeida et al. (2011), which indi-cated that NAO index variations were not exclusivelyresponsible of winter wave and storm distribution alongthe South coast of Portugal.
Considering that the AO and the NAO were theprincipal teleconnection patterns involved in changes ofstorminess patterns over the study area (Table II), theirrelationships with number and duration of storms andfive step moving average were investigated (Figure 6). Inorder to facilitate the analysis, NAO data were divided
in five phases (strong negative, negative, neutral, positiveand strong positive) according to Pinto et al. (2009) andDonat et al. (2010). Negative phases of NAO and AOpresented a certain level of correlation with the differentstorminess indices, and as an example the number (C :−0.49, r2: 0.24) and duration of storms (C: −0.40,r2: 0.16) were presented in Figure 6 and Table II. It isinteresting to remark that a great number of storms, largerstorm durations and higher values of Storm Power Indexwere only observed when neutral to strong negative NAOand AO phases occurred at the same time (89 stormsand 3355 h – Figure 6) and/or when occurred an abruptchange of NAO and AO phases, i.e. they moved froma positive phase to a negative phase without passingthrough a neutral phase. The behaviour of NAO andAO indexes was described by Thompson and Wallace(1998) who observed as the AO resembles the NAO innumerous respects. However, the AO’s primary centreof action covers more of the Arctic, giving it a more
2012 Royal Meteorological Society Int. J. Climatol. 33: 2142–2156 (2013)
2152 N. RANGEL-BUITRAGO AND G. ANFUSO
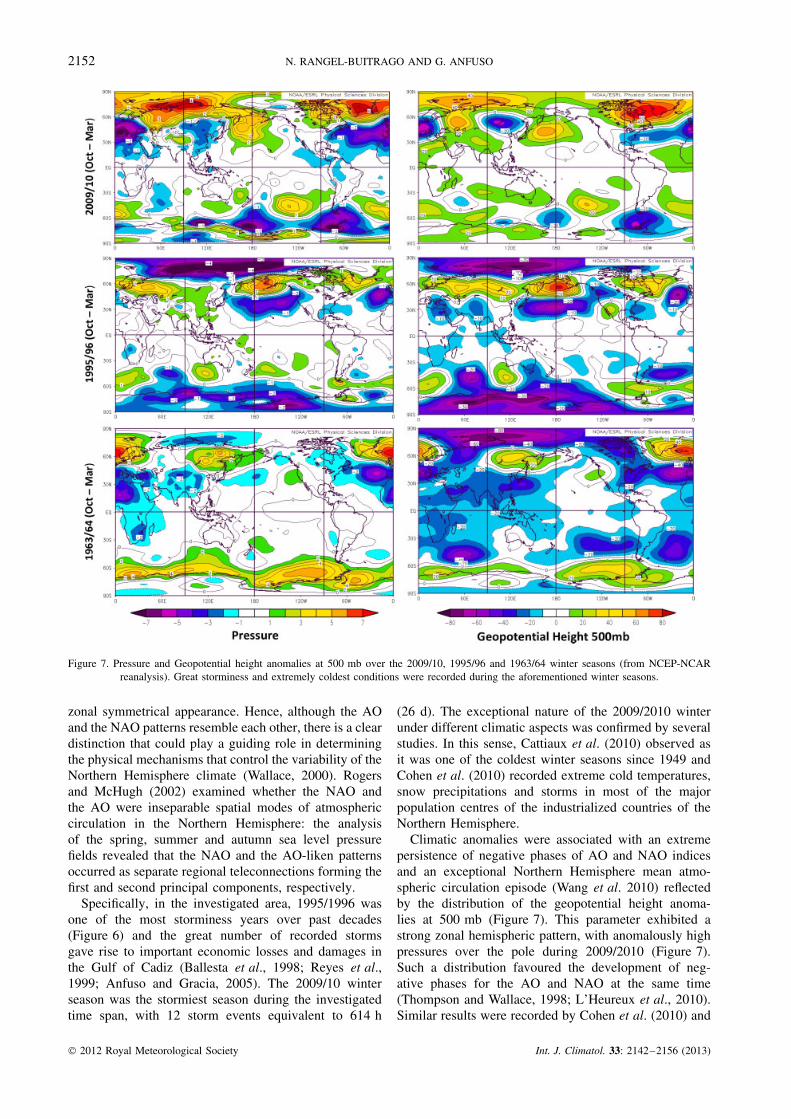
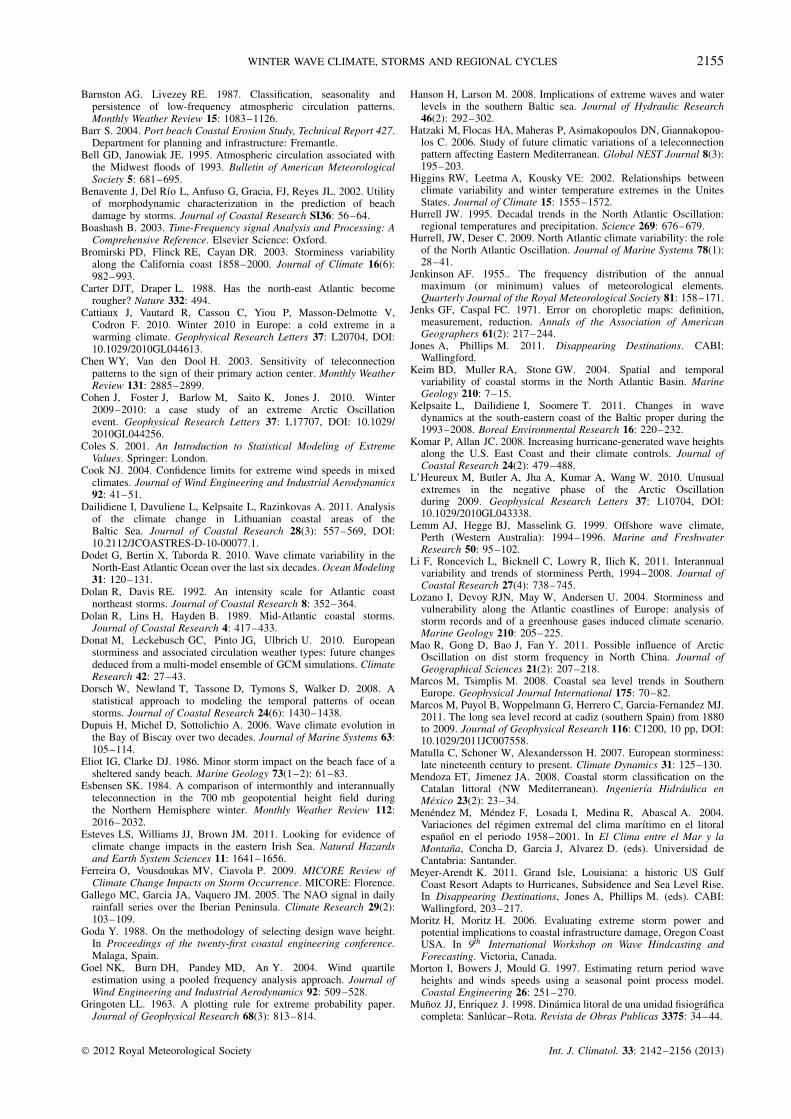
Figure 7. Pressure and Geopotential height anomalies at 500 mb over the 2009/10, 1995/96 and 1963/64 winter seasons (from NCEP-NCARreanalysis). Great storminess and extremely coldest conditions were recorded during the aforementioned winter seasons.
zonal symmetrical appearance. Hence, although the AOand the NAO patterns resemble each other, there is a cleardistinction that could play a guiding role in determiningthe physical mechanisms that control the variability of theNorthern Hemisphere climate (Wallace, 2000). Rogersand McHugh (2002) examined whether the NAO andthe AO were inseparable spatial modes of atmosphericcirculation in the Northern Hemisphere: the analysisof the spring, summer and autumn sea level pressurefields revealed that the NAO and the AO-liken patternsoccurred as separate regional teleconnections forming thefirst and second principal components, respectively.
Specifically, in the investigated area, 1995/1996 wasone of the most storminess years over past decades(Figure 6) and the great number of recorded stormsgave rise to important economic losses and damages inthe Gulf of Cadiz (Ballesta et al., 1998; Reyes et al.,1999; Anfuso and Gracia, 2005). The 2009/10 winterseason was the stormiest season during the investigatedtime span, with 12 storm events equivalent to 614 h
(26 d). The exceptional nature of the 2009/2010 winterunder different climatic aspects was confirmed by severalstudies. In this sense, Cattiaux et al. (2010) observed asit was one of the coldest winter seasons since 1949 andCohen et al. (2010) recorded extreme cold temperatures,snow precipitations and storms in most of the majorpopulation centres of the industrialized countries of theNorthern Hemisphere.
Climatic anomalies were associated with an extremepersistence of negative phases of AO and NAO indicesand an exceptional Northern Hemisphere mean atmo-spheric circulation episode (Wang et al. 2010) reflectedby the distribution of the geopotential height anoma-lies at 500 mb (Figure 7). This parameter exhibited astrong zonal hemispheric pattern, with anomalously highpressures over the pole during 2009/2010 (Figure 7).Such a distribution favoured the development of neg-ative phases for the AO and NAO at the same time(Thompson and Wallace, 1998; L’Heureux et al., 2010).Similar results were recorded by Cohen et al. (2010) and
2012 Royal Meteorological Society Int. J. Climatol. 33: 2142–2156 (2013)
WINTER WAVE CLIMATE, STORMS AND REGIONAL CYCLES 2153
1980
-198
119
81-1
982
1982
-198
319
83-1
984
1984
-198
519
85-1
986
1986
-198
719
87-1
988
1988
-198
919
89-1
990
1990
-199
119
91-1
992
1992
-199
319
93-1
994
1994
-199
519
95-1
996
1996
-199
719
97-1
998
1998
-199
919
99-2
000
2000
-200
120
01-2
002
2002
-200
320
03-2
004
2004
-200
520
05-2
006
2006
-200
720
07-2
008
2008
-200
920
09-2
010
YEAR
Avg: 4.37 R2:0.040 Trend: 0.010
Avg: 156.1 R2:0.028 Trend: 6.70 Avg: 185.2 R2:0.006 Trend: 4.5 Avg: 176 R2:0.36 Trend: 41.2
Avg: 4.6 R2:0.30 Trend: 0.06 Avg: 5.5 R2:0.10 Trend: 0.51
0
4
8
12
Nu
mb
er o
f S
torm
s
0
0
1
−1
2
S.P
P
N.T
N
S.N−2
200
400
600
Sto
rm D
ura
tio
n (
hr)
No
rth
Atl
anti
cO
scill
atio
n (
NA
O)
0
1
−1
2
−2
Art
ic O
scill
atio
n (
AO
)
Linear Regression3 Step-Moving Average
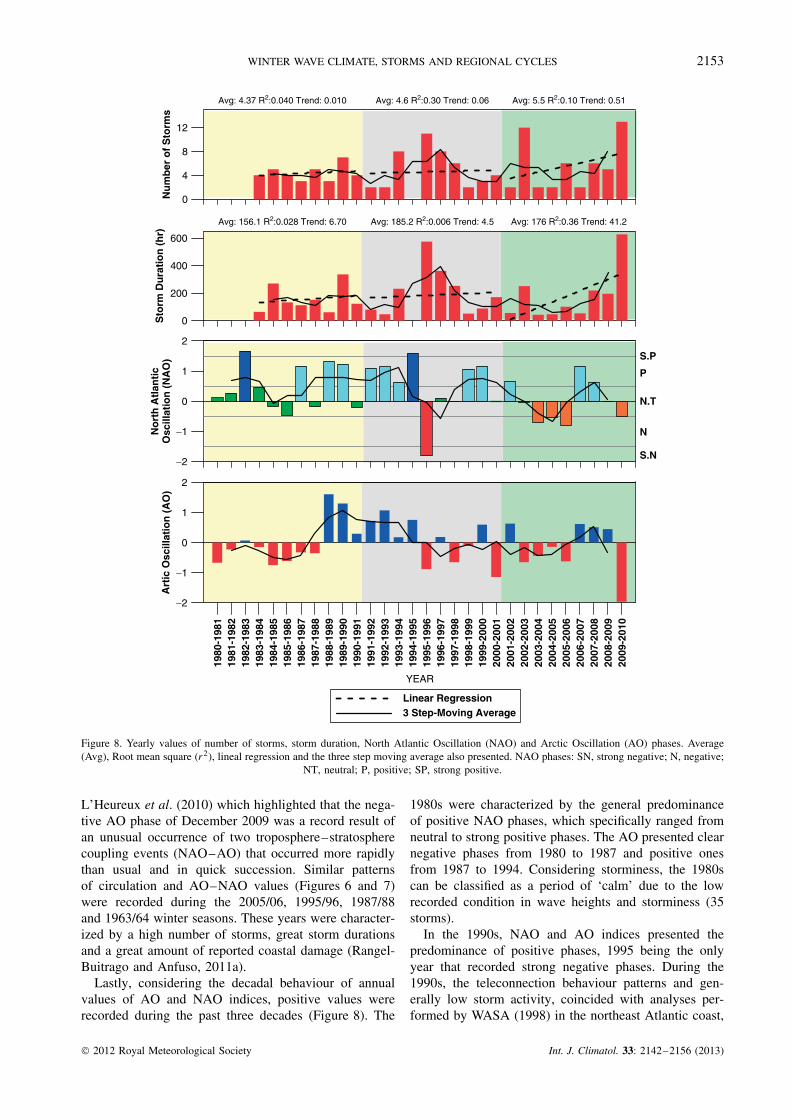
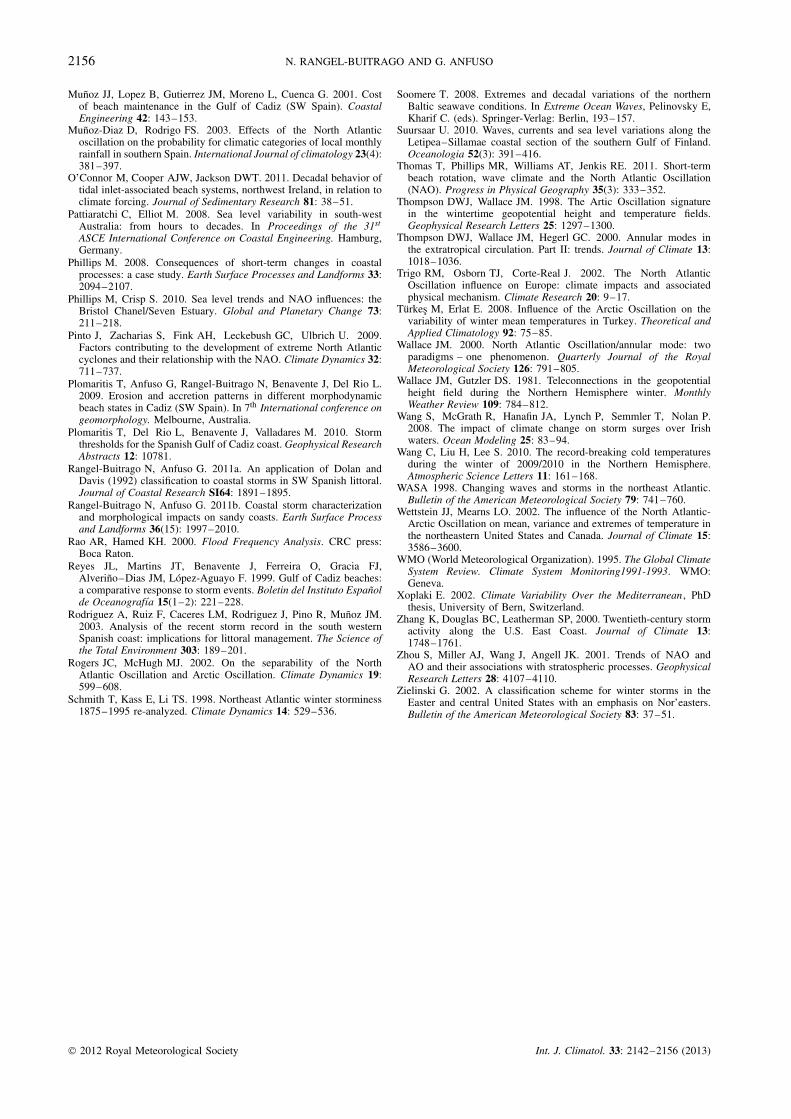
Figure 8. Yearly values of number of storms, storm duration, North Atlantic Oscillation (NAO) and Arctic Oscillation (AO) phases. Average(Avg), Root mean square (r2), lineal regression and the three step moving average also presented. NAO phases: SN, strong negative; N, negative;
NT, neutral; P, positive; SP, strong positive.
L’Heureux et al. (2010) which highlighted that the nega-tive AO phase of December 2009 was a record result ofan unusual occurrence of two troposphere–stratospherecoupling events (NAO–AO) that occurred more rapidlythan usual and in quick succession. Similar patternsof circulation and AO–NAO values (Figures 6 and 7)were recorded during the 2005/06, 1995/96, 1987/88and 1963/64 winter seasons. These years were character-ized by a high number of storms, great storm durationsand a great amount of reported coastal damage (Rangel-Buitrago and Anfuso, 2011a).
Lastly, considering the decadal behaviour of annualvalues of AO and NAO indices, positive values wererecorded during the past three decades (Figure 8). The
1980s were characterized by the general predominanceof positive NAO phases, which specifically ranged fromneutral to strong positive phases. The AO presented clearnegative phases from 1980 to 1987 and positive onesfrom 1987 to 1994. Considering storminess, the 1980scan be classified as a period of ‘calm’ due to the lowrecorded condition in wave heights and storminess (35storms).
In the 1990s, NAO and AO indices presented thepredominance of positive phases, 1995 being the onlyyear that recorded strong negative phases. During the1990s, the teleconnection behaviour patterns and gen-erally low storm activity, coincided with analyses per-formed by WASA (1998) in the northeast Atlantic coast,
2012 Royal Meteorological Society Int. J. Climatol. 33: 2142–2156 (2013)
2154 N. RANGEL-BUITRAGO AND G. ANFUSO
Ferreira et al. (2009) and Almeida et al. (2011) in Portu-gal and Rangel-Buitrago and Anfuso (2011a) in the Gulfof Cadiz. Finally, 2000–2009 was characterized by cyclicbehaviour of both NAO and AO indices, as well as waveclimates and storminess that showed extreme conditionsbetween 2002 and 2003 and low energy conditions from2004 to 2007.
5. Conclusions
Coastal erosion and flooding, increased by climaticchange-related processes, represent a great threat tohuman activities and settlements developed along theWorld’s coastlines especially because human pressureand occupation in such environments have been grow-ing considerably in recent decades. The Cadiz coastalarea includes different human settlements and naturalenvironments, essentially large sandy beaches of greateconomic interest because of tourism-related activities.In past decades, beach reduction and loss of attractive-ness were related to elevated coastal retreat rates basicallylinked to the impact of winter storms since sea level varia-tions did not show a clear trend. Large amounts of moneywere spent counteracting coastal retreat by using beachnourishment works and hard engineering structures.
An important step towards reducing and preventingbeach erosion and infrastructure damage is to understandand characterize wave climate and coastal processes, e.g.past and future trends. Understanding seasonal and annualwave climate behaviour is crucial in erosion prevention,as well as assessing beach response, cyclic variance andevolution. These are key issues in distinguishing realerosive trends from natural alternating erosion/accretionphases. Consequently, the applied methodology enablesthe characterization of wave climate, e.g. seasonal andannual periodicity, and storm events according to energy.This makes it simple and objective, while data can beeasily compared with similar datasets from elsewhere.
In particular, wave climate and storm classes’ distri-bution evidenced a clear seasonal trend in Cadiz area.Classes I and II (weak and moderate events) wereobserved along the entire winter season which coveredthe October to March period, class III events character-ized the November to March period and classes IV andV (severe and extreme) events were recorded only inDecember and January, with January being the stormiestmonth. Wave climate and storminess during the 27 yearperiod did not show a clear trend. This contradicted theforecast general increase in the number and intensity ofstorms in many oceans around the World and specifi-cally the Northern Hemisphere, due to climate change.Storminess presented a cyclic behaviour which occur-rence probability varied from 96% for class I to 3% forclass V. The return period for class V was 25 years andranged from 6 to 8 year for storms belonging to classes IIIand IV, e.g. significant and severe events. Observationsbroadly confirmed results recorded at mid and low lati-tudes of the Northern Hemisphere and at other locations
of the Cadiz Gulf, in this sense pointing to a broad homo-geneity of regional wave climate.
Efforts in the direction of storm characterization andprediction should also point to the determination ofthe general climatic conditions for their formation, e.g.the comprehension of general atmospheric circulationsystems linked to the teleconnection patterns. In theCadiz area, storm distribution appeared linked to negativephases of AO and NAO indices. Even if further investiga-tion is needed, it was highlighted that a great number ofstorms, larger storm duration and higher values of StormPower Index were only observed when neutral to strongnegative AO and NAO phases there were at the sametime and/or when occurred an abrupt change of AO andNAO phases, i.e. they moved from a positive phase to anegative phase without passing through a neutral phase.Hence, accurate short-term predictions of AO and NAOindices might represent valuable predictive techniques toforecast storm events, e.g. establishing early and warn-ing systems in order to reduce the impacts of energeticerosive events.
Acknowledgements
This work is a contribution to the RESISTE ResearchProject (CGL2008-00458/BTE, supported by the SpanishMinistry of Science and Technology and by EuropeanFunds for Regional Development – F.E.D.E.R.) and tothe Andalusia P.A.I. Research Group no. RNM-328.Thanks to Puerto del Estado (Spanish Ministry of PublicWorks) for offshore wave data records. This work hasbeen partially developed at the Centro Andaluz deCiencia y Tecnologıa Marinas (CACYTMAR), PuertoReal (Cadiz, Spain).
References
Allan JC, Komar PD. 2000. Are ocean wave heights increasing inthe eastern North Pacific?. EOS, Transactions of the AmericaGeophysical Union 47: 561–567.
Allan R, Tett S, Alexander L. 2009. Fluctuations in autumn – wintersevere storms over the British Isles: 1920 to present. InternationalJournal of Climatology 29: 357–371.
Almeida LP. Ferreira O Vousdouskas MI. Dodet G. 2011. Historicalvariation and trends in storminess along the Portuguese Southcoast.Natural Hazards Earth Systems. Science 11: 2407–2417.
Andrade C, Trigo RM, Freitas MC, Gallego MC, Borges P, RamosAM. 2008. Comparing historic records of storm frequency and theNorth Atlantic Oscillation (NAO) chronology for the Azores region.The Holocene 15(5): 745–754.
Anfuso G, Gracia FJ. 2005. Morphodynamic characteristics and shortterm evolution of a coastal sector in SW Spain: implications forcoastal erosion management. Journal of Coastal Research 21(6):1139–1153.
Anfuso G, Dominguez L, Gracia FJ. 2007. Short and medium-termevolution of a coastal sector in Cadiz, SW Spain. Catena 70:229–242.
BACC Author Team. 2008. Assessment of Climate Change for theBaltic Sea Basin. Springer-Verlag: Berlin.
Bacon S, Carter DJT. 1991. Wave climate changes in the NorthAtlantic and North Sea. International Journal of Climatology 11:545–558.
Ballesta M, Morales J, Acosta EA. 1998. Efecto erosivo de lostemporales del invierno 1995–1996 sobre la playa de Mazagon(Huelva, SO Espana): influencia de las construcciones costeras.Revista de la Sociedad Geologica de Espana 11(3–4): 285–296.
2012 Royal Meteorological Society Int. J. Climatol. 33: 2142–2156 (2013)
WINTER WAVE CLIMATE, STORMS AND REGIONAL CYCLES 2155
Barnston AG. Livezey RE. 1987. Classification, seasonality andpersistence of low-frequency atmospheric circulation patterns.Monthly Weather Review 15: 1083–1126.
Barr S. 2004. Port beach Coastal Erosion Study, Technical Report 427.Department for planning and infrastructure: Fremantle.
Bell GD, Janowiak JE. 1995. Atmospheric circulation associated withthe Midwest floods of 1993. Bulletin of American MeteorologicalSociety 5: 681–695.
Benavente J, Del Rıo L, Anfuso G, Gracia, FJ, Reyes JL. 2002. Utilityof morphodynamic characterization in the prediction of beachdamage by storms. Journal of Coastal Research SI36: 56–64.
Boashash B. 2003. Time-Frequency signal Analysis and Processing: AComprehensive Reference. Elsevier Science: Oxford.
Bromirski PD, Flinck RE, Cayan DR. 2003. Storminess variabilityalong the California coast 1858–2000. Journal of Climate 16(6):982–993.
Carter DJT, Draper L. 1988. Has the north-east Atlantic becomerougher? Nature 332: 494.
Cattiaux J, Vautard R, Cassou C, Yiou P, Masson-Delmotte V,Codron F. 2010. Winter 2010 in Europe: a cold extreme in awarming climate. Geophysical Research Letters 37: L20704, DOI:10.1029/2010GL044613.
Chen WY, Van den Dool H. 2003. Sensitivity of teleconnectionpatterns to the sign of their primary action center. Monthly WeatherReview 131: 2885–2899.
Cohen J, Foster J, Barlow M, Saito K, Jones J. 2010. Winter2009–2010: a case study of an extreme Arctic Oscillationevent. Geophysical Research Letters 37: L17707, DOI: 10.1029/2010GL044256.
Coles S. 2001. An Introduction to Statistical Modeling of ExtremeValues. Springer: London.
Cook NJ. 2004. Confidence limits for extreme wind speeds in mixedclimates. Journal of Wind Engineering and Industrial Aerodynamics92: 41–51.
Dailidiene I, Davuliene L, Kelpsaite L, Razinkovas A. 2011. Analysisof the climate change in Lithuanian coastal areas of theBaltic Sea. Journal of Coastal Research 28(3): 557–569, DOI:10.2112/JCOASTRES-D-10-00077.1.
Dodet G, Bertin X, Taborda R. 2010. Wave climate variability in theNorth-East Atlantic Ocean over the last six decades. Ocean Modeling31: 120–131.
Dolan R, Davis RE. 1992. An intensity scale for Atlantic coastnortheast storms. Journal of Coastal Research 8: 352–364.
Dolan R, Lins H, Hayden B. 1989. Mid-Atlantic coastal storms.Journal of Coastal Research 4: 417–433.
Donat M, Leckebusch GC, Pinto JG, Ulbrich U. 2010. Europeanstorminess and associated circulation weather types: future changesdeduced from a multi-model ensemble of GCM simulations. ClimateResearch 42: 27–43.
Dorsch W, Newland T, Tassone D, Tymons S, Walker D. 2008. Astatistical approach to modeling the temporal patterns of oceanstorms. Journal of Coastal Research 24(6): 1430–1438.
Dupuis H, Michel D, Sottolichio A. 2006. Wave climate evolution inthe Bay of Biscay over two decades. Journal of Marine Systems 63:105–114.
Eliot IG, Clarke DJ. 1986. Minor storm impact on the beach face of asheltered sandy beach. Marine Geology 73(1–2): 61–83.
Esbensen SK. 1984. A comparison of intermonthly and interannuallyteleconnection in the 700 mb geopotential height field duringthe Northern Hemisphere winter. Monthly Weather Review 112:2016–2032.
Esteves LS, Williams JJ, Brown JM. 2011. Looking for evidence ofclimate change impacts in the eastern Irish Sea. Natural Hazardsand Earth System Sciences 11: 1641–1656.
Ferreira O, Vousdoukas MV, Ciavola P. 2009. MICORE Review ofClimate Change Impacts on Storm Occurrence. MICORE: Florence.
Gallego MC, Garcia JA, Vaquero JM. 2005. The NAO signal in dailyrainfall series over the Iberian Peninsula. Climate Research 29(2):103–109.
Goda Y. 1988. On the methodology of selecting design wave height.In Proceedings of the twenty-first coastal engineering conference.Malaga, Spain.
Goel NK, Burn DH, Pandey MD, An Y. 2004. Wind quartileestimation using a pooled frequency analysis approach. Journal ofWind Engineering and Industrial Aerodynamics 92: 509–528.
Gringoten LL. 1963. A plotting rule for extreme probability paper.Journal of Geophysical Research 68(3): 813–814.
Hanson H, Larson M. 2008. Implications of extreme waves and waterlevels in the southern Baltic sea. Journal of Hydraulic Research46(2): 292–302.
Hatzaki M, Flocas HA, Maheras P, Asimakopoulos DN, Giannakopou-los C. 2006. Study of future climatic variations of a teleconnectionpattern affecting Eastern Mediterranean. Global NEST Journal 8(3):195–203.
Higgins RW, Leetma A, Kousky VE: 2002. Relationships betweenclimate variability and winter temperature extremes in the UnitesStates. Journal of Climate 15: 1555–1572.
Hurrell JW. 1995. Decadal trends in the North Atlantic Oscillation:regional temperatures and precipitation. Science 269: 676–679.
Hurrell, JW, Deser C. 2009. North Atlantic climate variability: the roleof the North Atlantic Oscillation. Journal of Marine Systems 78(1):28–41.
Jenkinson AF. 1955.. The frequency distribution of the annualmaximum (or minimum) values of meteorological elements.Quarterly Journal of the Royal Meteorological Society 81: 158–171.
Jenks GF, Caspal FC. 1971. Error on choropletic maps: definition,measurement, reduction. Annals of the Association of AmericanGeographers 61(2): 217–244.
Jones A, Phillips M. 2011. Disappearing Destinations. CABI:Wallingford.
Keim BD, Muller RA, Stone GW. 2004. Spatial and temporalvariability of coastal storms in the North Atlantic Basin. MarineGeology 210: 7–15.
Kelpsaite L, Dailidiene I, Soomere T. 2011. Changes in wavedynamics at the south-eastern coast of the Baltic proper during the1993–2008. Boreal Environmental Research 16: 220–232.
Komar P, Allan JC. 2008. Increasing hurricane-generated wave heightsalong the U.S. East Coast and their climate controls. Journal ofCoastal Research 24(2): 479–488.
L’Heureux M, Butler A, Jha A, Kumar A, Wang W. 2010. Unusualextremes in the negative phase of the Arctic Oscillationduring 2009. Geophysical Research Letters 37: L10704, DOI:10.1029/2010GL043338.
Lemm AJ, Hegge BJ, Masselink G. 1999. Offshore wave climate,Perth (Western Australia): 1994–1996. Marine and FreshwaterResearch 50: 95–102.
Li F, Roncevich L, Bicknell C, Lowry R, Ilich K, 2011. Interannualvariability and trends of storminess Perth, 1994–2008. Journal ofCoastal Research 27(4): 738–745.
Lozano I, Devoy RJN, May W, Andersen U. 2004. Storminess andvulnerability along the Atlantic coastlines of Europe: analysis ofstorm records and of a greenhouse gases induced climate scenario.Marine Geology 210: 205–225.
Mao R, Gong D, Bao J, Fan Y. 2011. Possible influence of ArcticOscillation on dist storm frequency in North China. Journal ofGeographical Sciences 21(2): 207–218.
Marcos M, Tsimplis M. 2008. Coastal sea level trends in SouthernEurope. Geophysical Journal International 175: 70–82.
Marcos M, Puyol B, Woppelmann G, Herrero C, Garcia-Fernandez MJ.2011. The long sea level record at cadiz (southern Spain) from 1880to 2009. Journal of Geophysical Research 116: C1200, 10 pp, DOI:10.1029/2011JC007558.
Matulla C, Schoner W, Alexandersson H. 2007. European storminess:late nineteenth century to present. Climate Dynamics 31: 125–130.
Mendoza ET, Jimenez JA. 2008. Coastal storm classification on theCatalan littoral (NW Mediterranean). Ingenierıa Hidraulica enMexico 23(2): 23–34.
Menendez M, Mendez F, Losada I, Medina R, Abascal A. 2004.Variaciones del regimen extremal del clima marıtimo en el litoralespanol en el periodo 1958–2001. In El Clima entre el Mar y laMontana, Concha D, Garcia J, Alvarez D. (eds). Universidad deCantabria: Santander.
Meyer-Arendt K. 2011. Grand Isle, Louisiana: a historic US GulfCoast Resort Adapts to Hurricanes, Subsidence and Sea Level Rise.In Disappearing Destinations, Jones A, Phillips M. (eds). CABI:Wallingford, 203–217.
Moritz H, Moritz H. 2006. Evaluating extreme storm power andpotential implications to coastal infrastructure damage, Oregon CoastUSA. In 9th International Workshop on Wave Hindcasting andForecasting. Victoria, Canada.
Morton I, Bowers J, Mould G. 1997. Estimating return period waveheights and winds speeds using a seasonal point process model.Coastal Engineering 26: 251–270.
Munoz JJ, Enriquez J. 1998. Dinamica litoral de una unidad fisiograficacompleta: Sanlucar–Rota. Revista de Obras Publicas 3375: 34–44.
2012 Royal Meteorological Society Int. J. Climatol. 33: 2142–2156 (2013)
2156 N. RANGEL-BUITRAGO AND G. ANFUSO
Munoz JJ, Lopez B, Gutierrez JM, Moreno L, Cuenca G. 2001. Costof beach maintenance in the Gulf of Cadiz (SW Spain). CoastalEngineering 42: 143–153.
Munoz-Diaz D, Rodrigo FS. 2003. Effects of the North Atlanticoscillation on the probability for climatic categories of local monthlyrainfall in southern Spain. International Journal of climatology 23(4):381–397.
O’Connor M, Cooper AJW, Jackson DWT. 2011. Decadal behavior oftidal inlet-associated beach systems, northwest Ireland, in relation toclimate forcing. Journal of Sedimentary Research 81: 38–51.
Pattiaratchi C, Elliot M. 2008. Sea level variability in south-westAustralia: from hours to decades. In Proceedings of the 31st
ASCE International Conference on Coastal Engineering. Hamburg,Germany.
Phillips M. 2008. Consequences of short-term changes in coastalprocesses: a case study. Earth Surface Processes and Landforms 33:2094–2107.
Phillips M, Crisp S. 2010. Sea level trends and NAO influences: theBristol Chanel/Seven Estuary. Global and Planetary Change 73:211–218.
Pinto J, Zacharias S, Fink AH, Leckebush GC, Ulbrich U. 2009.Factors contributing to the development of extreme North Atlanticcyclones and their relationship with the NAO. Climate Dynamics 32:711–737.
Plomaritis T, Anfuso G, Rangel-Buitrago N, Benavente J, Del Rio L.2009. Erosion and accretion patterns in different morphodynamicbeach states in Cadiz (SW Spain). In 7th International conference ongeomorphology. Melbourne, Australia.
Plomaritis T, Del Rio L, Benavente J, Valladares M. 2010. Stormthresholds for the Spanish Gulf of Cadiz coast. Geophysical ResearchAbstracts 12: 10781.
Rangel-Buitrago N, Anfuso G. 2011a. An application of Dolan andDavis (1992) classification to coastal storms in SW Spanish littoral.Journal of Coastal Research SI64: 1891–1895.
Rangel-Buitrago N, Anfuso G. 2011b. Coastal storm characterizationand morphological impacts on sandy coasts. Earth Surface Processand Landforms 36(15): 1997–2010.
Rao AR, Hamed KH. 2000. Flood Frequency Analysis. CRC press:Boca Raton.
Reyes JL, Martins JT, Benavente J, Ferreira O, Gracia FJ,Alverino–Dias JM, Lopez-Aguayo F. 1999. Gulf of Cadiz beaches:a comparative response to storm events. Boletin del Instituto Espanolde Oceanografıa 15(1–2): 221–228.
Rodriguez A, Ruiz F, Caceres LM, Rodriguez J, Pino R, Munoz JM.2003. Analysis of the recent storm record in the south westernSpanish coast: implications for littoral management. The Science ofthe Total Environment 303: 189–201.
Rogers JC, McHugh MJ. 2002. On the separability of the NorthAtlantic Oscillation and Arctic Oscillation. Climate Dynamics 19:599–608.
Schmith T, Kass E, Li TS. 1998. Northeast Atlantic winter storminess1875–1995 re-analyzed. Climate Dynamics 14: 529–536.
Soomere T. 2008. Extremes and decadal variations of the northernBaltic seawave conditions. In Extreme Ocean Waves, Pelinovsky E,Kharif C. (eds). Springer-Verlag: Berlin, 193–157.
Suursaar U. 2010. Waves, currents and sea level variations along theLetipea–Sillamae coastal section of the southern Gulf of Finland.Oceanologia 52(3): 391–416.
Thomas T, Phillips MR, Williams AT, Jenkis RE. 2011. Short-termbeach rotation, wave climate and the North Atlantic Oscillation(NAO). Progress in Physical Geography 35(3): 333–352.
Thompson DWJ, Wallace JM. 1998. The Artic Oscillation signaturein the wintertime geopotential height and temperature fields.Geophysical Research Letters 25: 1297–1300.
Thompson DWJ, Wallace JM, Hegerl GC. 2000. Annular modes inthe extratropical circulation. Part II: trends. Journal of Climate 13:1018–1036.
Trigo RM, Osborn TJ, Corte-Real J. 2002. The North AtlanticOscillation influence on Europe: climate impacts and associatedphysical mechanism. Climate Research 20: 9–17.
Turkes M, Erlat E. 2008. Influence of the Arctic Oscillation on thevariability of winter mean temperatures in Turkey. Theoretical andApplied Climatology 92: 75–85.
Wallace JM. 2000. North Atlantic Oscillation/annular mode: twoparadigms – one phenomenon. Quarterly Journal of the RoyalMeteorological Society 126: 791–805.
Wallace JM, Gutzler DS. 1981. Teleconnections in the geopotentialheight field during the Northern Hemisphere winter. MonthlyWeather Review 109: 784–812.
Wang S, McGrath R, Hanafin JA, Lynch P, Semmler T, Nolan P.2008. The impact of climate change on storm surges over Irishwaters. Ocean Modeling 25: 83–94.
Wang C, Liu H, Lee S. 2010. The record-breaking cold temperaturesduring the winter of 2009/2010 in the Northern Hemisphere.Atmospheric Science Letters 11: 161–168.
WASA 1998. Changing waves and storms in the northeast Atlantic.Bulletin of the American Meteorological Society 79: 741–760.
Wettstein JJ, Mearns LO. 2002. The influence of the North Atlantic-Arctic Oscillation on mean, variance and extremes of temperature inthe northeastern United States and Canada. Journal of Climate 15:3586–3600.
WMO (World Meteorological Organization). 1995. The Global ClimateSystem Review. Climate System Monitoring1991-1993. WMO:Geneva.
Xoplaki E. 2002. Climate Variability Over the Mediterranean , PhDthesis, University of Bern, Switzerland.
Zhang K, Douglas BC, Leatherman SP, 2000. Twentieth-century stormactivity along the U.S. East Coast. Journal of Climate 13:1748–1761.
Zhou S, Miller AJ, Wang J, Angell JK. 2001. Trends of NAO andAO and their associations with stratospheric processes. GeophysicalResearch Letters 28: 4107–4110.
Zielinski G. 2002. A classification scheme for winter storms in theEaster and central United States with an emphasis on Nor’easters.Bulletin of the American Meteorological Society 83: 37–51.
2012 Royal Meteorological Society Int. J. Climatol. 33: 2142–2156 (2013)