Embed Size (px)
Citation preview
Winter Mortality in Scotland
2017/18
Published on 16 October 2018
A National Statistics publication for Scotland
National Statistics are produced to high
professional standards set out in the
National Statistics Code of Practice. They
undergo regular quality assurance reviews
to ensure that they meet customer needs.
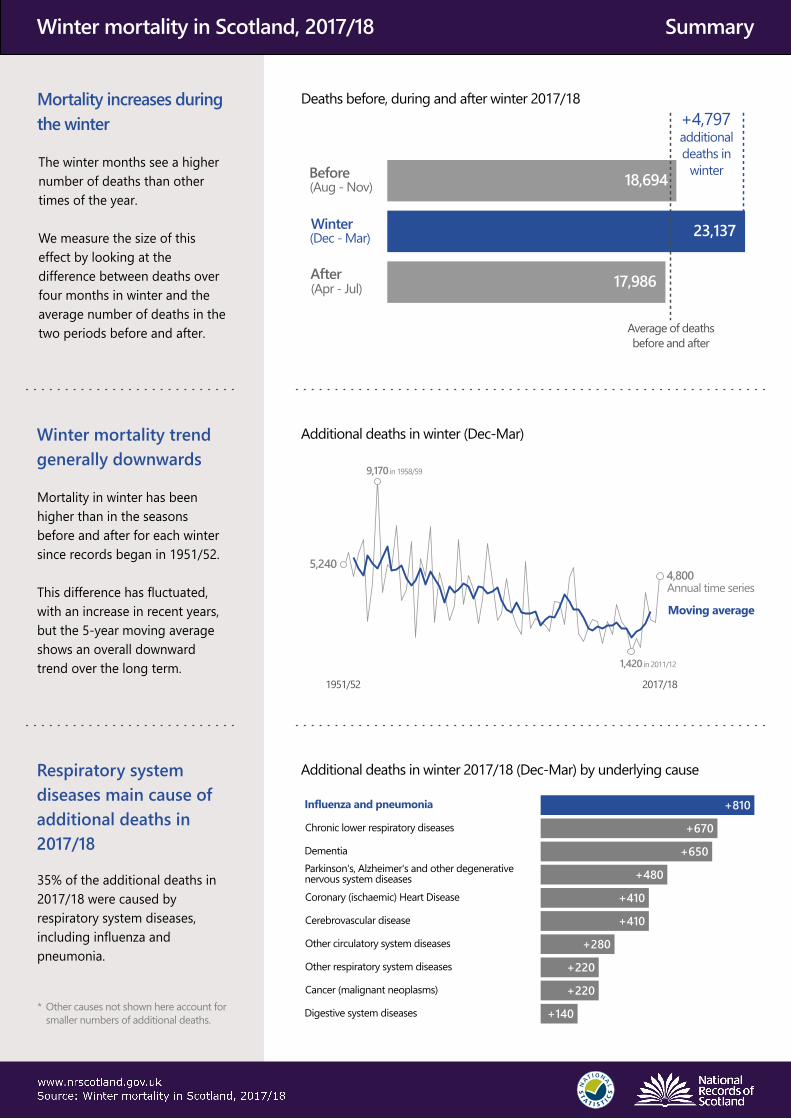
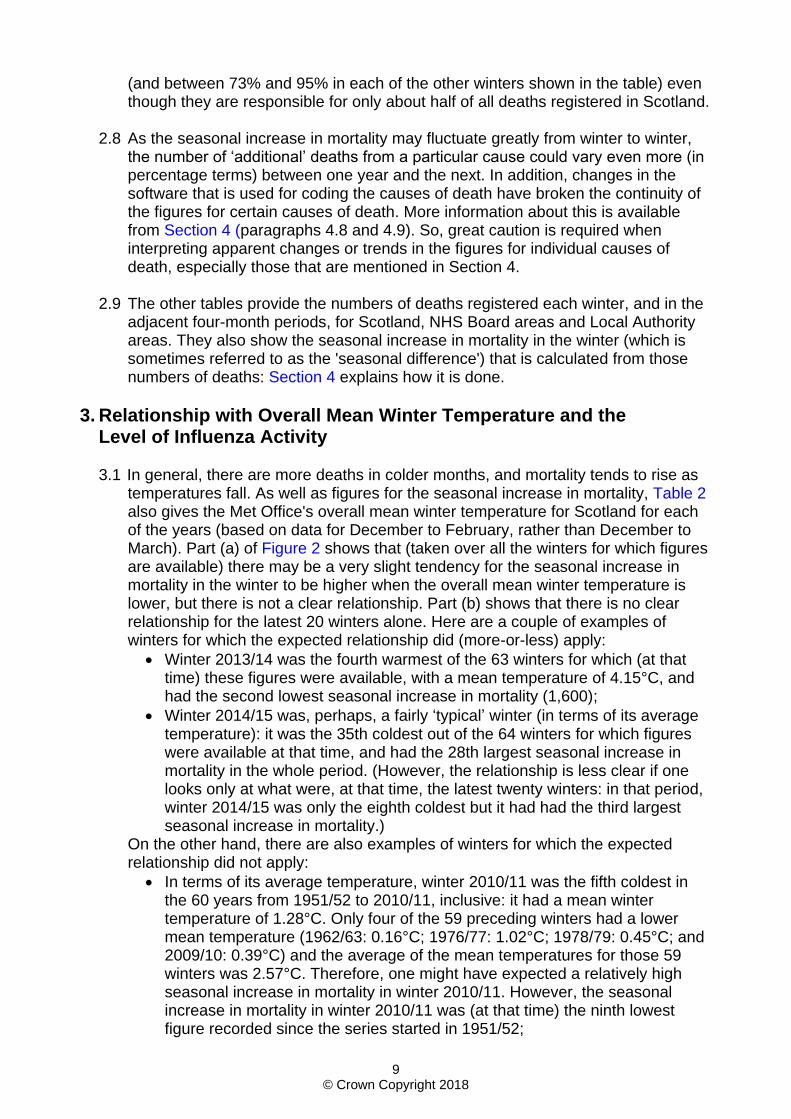
Mortality increases during the winter
The winter months see a higher number of deaths than other times of the year.
We measure the size of this effect by looking at the difference between deaths over four months in winter and the average number of deaths in the two periods before and after.
Winter mortality trend generally downwards
Mortality in winter has been higher than in the seasons before and after for each winter since records began in 1951/52.
This difference has fluctuated, with an increase in recent years, but the 5-year moving average shows an overall downward trend over the long term.
Respiratory system diseases main cause of additional deaths in 2017/18
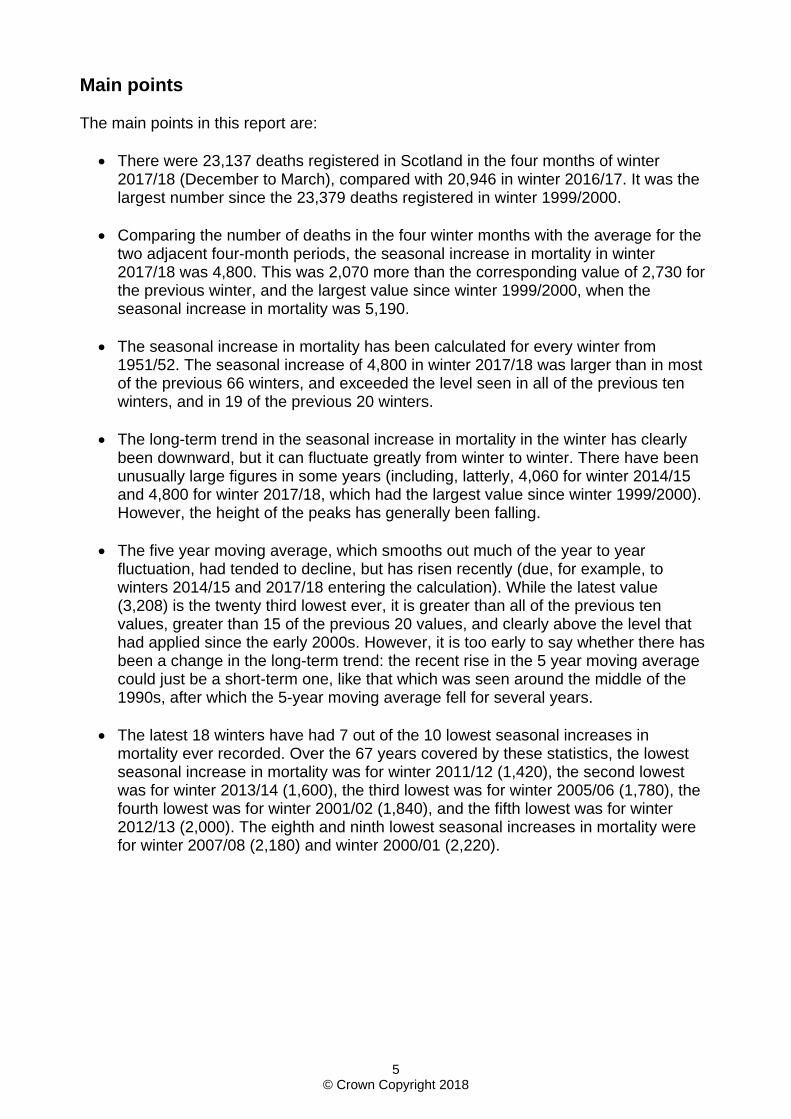
35% of the additional deaths in 2017/18 were caused by respiratory system diseases, including influenza and pneumonia.
Additional deaths in winter 2017/18 (Dec-Mar) by underlying cause
Additional deaths in winter (Dec-Mar)
Deaths before, during and after winter 2017/18
Source: Winter mortality in Scotland, 2017/18www.nrscotland.gov.uk
Winter mortality in Scotland, 2017/18 Summary
Annual time series
Moving average
2017/181951/52
9,170 in 1958/59
1,420 in 2011/12
+4,797additionaldeaths in
winter
Average of deaths before and after
Before(Aug - Nov) 18,694
Winter(Dec - Mar) 23,137
After(Apr - Jul) 17,986
+140
+810
+220
+410
+670
+410
+650
+280
+220
+480
Digestive system diseases
Dementia
Cancer (malignant neoplasms)
Other respiratory system diseases
Other circulatory system diseases
Cerebrovascular disease
Coronary (ischaemic) Heart Disease
Chronic lower respiratory diseases
Influenza and pneumonia
Parkinson's, Alzheimer's and other degenerativenervous system diseases
Other causes not shown here account for smaller numbers of additional deaths.
*
5,2404,800
Contents
Main points ........................................................................................................................
...........................................................................................................
.........................................................................................................
...................
.....................................................................
.......................................................................................
......................................................................................................
5
1. Introduction 6
2. Commentary 6
3. Relationship with Overall Mean Winter Temperature and the Level of InfluenzaActivity ..................................................................................................................9
4. How the Seasonal Increase in Mortality in the Winter is Calculated 12
5. Background: about these statistics 14
Notes on statistical publications 49
Related organisations 51
3 © Crown Copyright 2018
List of Tables
Table 1: Seasonal Increase in Mortality in the Winter by age group, Scotland, 1990/91 to 2017/18.......................................................................................................16
Table 2: Seasonal Increase in Mortality in the Winter, mean winter temperature and indicators of level of influenza activity, Scotland, 1951/52 to 2017/18 ............17
Table 3: Seasonal Increase in Mortality in the Winter and Increased Winter Mortality Index, by age group and NHS Board area of usual residence, 2008/09 to 2017/18...........................................................................................................19
Table 4: Seasonal Increase in Mortality in the Winter – underlying numbers of registrations of deaths, Scotland, 1990/91 to 2017/18 ....................................23
Table 5: Seasonal Increase in Mortality in the Winter - underlying numbers of registrations of deaths, by NHS Board area of usual residence, 2014/15 to 2017/18...........................................................................................................24
Table 6: Seasonal Increase in Mortality in the Winter and Increased Winter Mortality Index, by age group and Local Authority area of usual residence, 2008/09 to 2017/18...........................................................................................................26
Table 7: Seasonal Increase in Mortality in the Winter - underlying numbers of registrations of deaths, by Local Authority area of usual residence, 2014/15 to 2017/18...........................................................................................................35
Table 8: Seasonal Increase in Mortality in the Winter and Increased Winter Mortality Index, by age-group and underlying cause of death, Scotland, 2007/08 to 2017/18...........................................................................................................40
List of Figures
Figure 1: Seasonal Increase in Mortality in the Winter, Scotland, 1951/52 to 2017/18 ..46
Figure 2: Seasonal Increase in Mortality in the Winter and mean winter temperature (deg.C.), Scotland: (a) winter 1951/52 to winter 2017/18; and (b) winter 1998/99 to winter 2017/18 ..............................................................................47
Figure 3: Seasonal Increase in Mortality in the Winter and indicators of influenza activity, Scotland: (a) winters and 'flu seasons - 1971/72 to 2007/08, inclusive; and (b) and (c) winters - 2003/04 to 2017/18, inclusive...............................................48
4 © Crown Copyright 2018
Main points
The main points in this report are:
There were 23,137 deaths registered in Scotland in the four months of winter2017/18 (December to March), compared with 20,946 in winter 2016/17. It was thelargest number since the 23,379 deaths registered in winter 1999/2000.
Comparing the number of deaths in the four winter months with the average for thetwo adjacent four-month periods, the seasonal increase in mortality in winter2017/18 was 4,800. This was 2,070 more than the corresponding value of 2,730 forthe previous winter, and the largest value since winter 1999/2000, when theseasonal increase in mortality was 5,190.
The seasonal increase in mortality has been calculated for every winter from1951/52. The seasonal increase of 4,800 in winter 2017/18 was larger than in mostof the previous 66 winters, and exceeded the level seen in all of the previous tenwinters, and in 19 of the previous 20 winters.
The long-term trend in the seasonal increase in mortality in the winter has clearlybeen downward, but it can fluctuate greatly from winter to winter. There have beenunusually large figures in some years (including, latterly, 4,060 for winter 2014/15and 4,800 for winter 2017/18, which had the largest value since winter 1999/2000).However, the height of the peaks has generally been falling.
The five year moving average, which smooths out much of the year to yearfluctuation, had tended to decline, but has risen recently (due, for example, towinters 2014/15 and 2017/18 entering the calculation). While the latest value(3,208) is the twenty third lowest ever, it is greater than all of the previous tenvalues, greater than 15 of the previous 20 values, and clearly above the level thathad applied since the early 2000s. However, it is too early to say whether there hasbeen a change in the long-term trend: the recent rise in the 5 year moving averagecould just be a short-term one, like that which was seen around the middle of the1990s, after which the 5-year moving average fell for several years.
The latest 18 winters have had 7 out of the 10 lowest seasonal increases inmortality ever recorded. Over the 67 years covered by these statistics, the lowestseasonal increase in mortality was for winter 2011/12 (1,420), the second lowestwas for winter 2013/14 (1,600), the third lowest was for winter 2005/06 (1,780), thefourth lowest was for winter 2001/02 (1,840), and the fifth lowest was for winter2012/13 (2,000). The eighth and ninth lowest seasonal increases in mortality werefor winter 2007/08 (2,180) and winter 2000/01 (2,220).
5 © Crown Copyright 2018
1. Introduction
1.1 This release presents provisional data for the seasonal increase in mortality in Scotland in winter 2017/18. The Tables and Figures provide overall data for Scotland for 67 years, breakdowns by age-group for Scotland as a whole for 28 years and for each NHS Board and Local Authority area for 10 years, and the numbers of ‘additional’ deaths by age-group and cause for 11 years. They also give recent years' numbers of deaths registered for Scotland and for NHS Board and Local Authority areas.
1.2 The seasonal increase in mortality in the winter is defined as the difference between the number of deaths in the four month 'winter' period (December to March, inclusive) and the average number of deaths in the two, four month periods which precede winter (August to November, inclusive) and follow winter (April to July, inclusive).
1.3 There is no single cause of 'additional' deaths in winter. Health Protection Scotland (HPS) has noted (in its National Influenza Reports) that they are often attributed in part to cold weather directly (for instance deaths due following falls, fractures, and road traffic accidents), in part to cold weather worsening chronic medical conditions (for example, heart and respiratory complaints), and in part to respiratory infections including influenza. National Records of Scotland (NRS) data show that very few deaths are caused by hypothermia. The underlying causes of most of the ‘additional’ deaths are circulatory system diseases (such as coronary heart disease and stroke), respiratory system diseases (such as pneumonia and chronic obstructive pulmonary disease), dementia, and Parkinson’s, Alzheimer’s and other degenerative nervous system diseases. Influenza is recorded as the underlying cause in only a minority of deaths.
1.4 One improvement has been made for this edition: adding an extra indicator of the level of influenza activity, calculated from the General Practitioner consultation rates for influenza-like illnesses for the weeks which (broadly speaking) cover the period from the start of December to the end of March. The extra indicator has been included in Table 2 and in a new chart in Figure 3.
2. Commentary
2.1 Table 1 shows recent trends in the seasonal increase in mortality in the winter for Scotland as a whole. It is estimated that there were about 4,800 'additional' deaths in Scotland during winter 2017/18. This was 2,070 more than the corresponding figure of 2,730 for the previous winter, and the largest value since winter 1999/2000, when the seasonal increase in mortality was 5,190. The series starts with winter 1951/52. The seasonal increase of 4,800 in winter 2017/18 was larger than in 48 of the previous 66 winters, and larger than the average for those 66 winters (which was roughly 3,840). The figure for winter 2017/18 exceeded the level seen in all of the previous ten winters, and in 19 of the previous 20 winters.
2.2 Table 1 also shows the extent to which the seasonal increase in mortality in the winter affects the elderly, particularly those aged 75 and over. In the past ten winters, the percentage of the additional deaths accounted for by people aged 75 to 84 ranged between 28% (in 2017/18) and 33% (in 2008/09 and 2013/14), and people aged 85 and over accounted for between 34% (in 2015/16) and 56% (in
6 © Crown Copyright 2018
2012/13) of the additional deaths. Overall, taking the average of the ten winters' percentages, around 31% of the additional deaths were of people who were aged 75 to 84, and 45% were of people aged 85 and over. The right-hand part of the table shows the number of additional deaths per 1,000 population in each age-group. It is clear that the seasonal increase in mortality is greatest for those aged 85 and over. For example, winter 2014/15 had almost 17 deaths of people who were aged 85 and over (when they died) per 1,000 people who were aged 85 and over (at mid-2014). On this basis, the worst winters (of those shown in the table) were 1998/99, 1999/2000 and 2017/18, which all had over 20 additional deaths aged 85 and over per 1,000 population aged 85 and over at mid-year. Over the period covered by the table, increases in the size of the population in the older age-groups mean that lower ‘additional death’ rates for each age-group will lead to a particular number of additional deaths. For example, the seasonal increases in mortality in winter 1991/92 and winter 2015/16 were almost the same (2,890 and 2,850, respectively), even though winter 2015/16 had much lower ‘additional death’ rates per 1,000 population in the older age-groups (for example, for those aged 85 and over, 8.38 for winter 2015/16 compared with 13.52 for winter 1991/92).
2.3 Figure 1 shows the seasonal increase in mortality for each winter from 1951/52 individually (the bars) and as a 5 year moving average (the black line) - the latter should give a better guide to the overall trend, as it 'smooths out' most (but not all) of the effect of what are, sometimes, very large percentage year-to-year fluctuations in the figures. The chart shows that there has been an overall downward trend in the number of 'additional' winter deaths over the past 65-or-so years. It also shows that there have been unusually large figures in some years (including, in recent years, 4,060 in winter 2014/15, and 4,800 in winter 2017/18, the latter being the largest seasonal increase since the 5,190 in winter 1999/2000). However, the height of the peaks has generally appeared to be falling, and the 5year moving average had tended to decline, albeit with fluctuations around the overall long-term downward trend, such as the short-term rise in the moving average around the middle of the 1990s. The 5-year moving average has risen recently (due, for example, to winters 2014/15 and 2017/18 entering the calculation): while its latest value (3,208) is the twenty-third lowest ever, it is greater than all of the previous ten values, and 15 of the previous 20 values. Until its latest five values were calculated, the 5-year moving average appeared to have more-or-less 'levelled off' since the early 2000s: the average of the nine values (before the latest five) was 2,509, and seven of those nine values had been within 100 of 2,500. However, its latest value (3,208) is well above the top of that range. Although the 5-year moving average is now clearly above the level that had applied since the early 2000s, it is too soon to say whether there has been a change in the long-term trend: the recent rise in the 5-year moving average could just be a short-term one, like that which was seen around the middle of the 1990s, after which the 5-year moving average fell for several years.
2.4 Table 2 gives the figures for the 67 winters for which these statistics are available. The 1,420 'additional' deaths in winter 2011/12 is the lowest figure in the whole series. Winter 2013/14 had the second lowest seasonal increase in mortality (1,600) recorded since the series started in 1951/52. Winter 2005/06 had the third lowest number (1,780), winter 2001/02 had the fourth lowest (1,840), and winter 2012/13 had the fifth lowest (2,000). The winters of 2007/08 and 2000/01 had the eighth and ninth lowest figures (2,180 and 2,220, respectively). As a result, the
7 © Crown Copyright 2018
latest 18 winters have had 7 of the 10 lowest seasonal increases in mortality in the 67 years for which these statistics are available. In addition, as the twelfth and thirteenth lowest figures were 2,450 in winter 2010/11 and 2,510 in winter 2002/03, the latest 18 winters have had 9 of the 13 lowest seasonal increases in mortality. The other winters which had seasonal increases in mortality which were among the 13 lowest such figures were 1966/67 (2,020 - sixth lowest), 1988/89 (2,160 - seventh lowest), 1994/95 (2,310 - tenth lowest) and 1990/91 (2,430 - eleventh lowest). However, the seasonal increase of 4,800 in winter 2017/18 was (jointly with winter 1968/69) the eighteenth highest of the 67 winters.
2.5 Table 3 gives a more detailed breakdown of the seasonal increase in mortality in the winter by age and NHS Board area. There are some negative figures: these are cases where a particular age-group had fewer deaths in the winter period than the average of the two adjacent non-winter periods. This happens sometimes because the number of deaths may fluctuate 'randomly' during the year. The 'all ages' figures for the seasonal increase in mortality in the winter take account of any negative values for individual age-groups. In this publication, the statistics for each NHS Board area are based on the boundaries which apply with effect from 1 April 2014. The figures for earlier years show what the numbers would have been, had the new boundaries applied in those years. Table 6 provides the same kinds of figures, but for each Local Authority area.
2.6 Table 8 shows the numbers of ‘additional’ deaths for various categories of underlying causes of death. They are defined using the International Statistical Classification of Diseases and Related Health Problems, Tenth Revision (ICD-10). There may be some apparently very large Increased Winter Mortality Index values, which are based on small unrounded numbers of deaths. For example, a certain winter would have an Index value of 200 (per cent) for a particular cause of death / age-group ‘cell’ if it had two ‘additional’ deaths and there was, on average, only one death per four month non-winter period. The figures for the latest winter are provisional, and therefore subject to revision, because NRS has yet to receive final information about the causes of some of the deaths which were registered between January and July of the latest year. However, based on a comparison of ‘provisional’ and ‘final’ figures for winter 2014/15, it seems likely that only a small percentage of the (rounded) numbers of additional deaths will change by more than 10. The categories for which the numbers are most likely to change by more than 10 are ‘other external causes of death’ and ‘ill-defined and unknown causes’: categories for which NRS is more likely to receive further information which changes the classification of the cause of death. (The Index values may have more changes, including apparently large percentage changes, between their provisional and final versions, due to small revisions to the unrounded numbers from which they are calculated.)
2.7 The underlying causes of most of the 4,800 ‘additional’ deaths in winter 2017/18 were circulatory system diseases (410 additional deaths from coronary heart disease, 410 from cerebrovascular disease, and 280 from other circulatory system diseases), respiratory system diseases (810 additional deaths from influenza and pneumonia, 670 deaths from chronic lower respiratory diseases, such as chronic obstructive pulmonary disease, and 220 from other respiratory system diseases), dementia (650 additional deaths) and Parkinson’s, Alzheimer’s and other degenerative nervous system diseases (480 additional deaths). Taken together, those medical conditions caused 82% of the additional deaths in winter 2017/18
8 © Crown Copyright 2018
(and between 73% and 95% in each of the other winters shown in the table) even though they are responsible for only about half of all deaths registered in Scotland.
2.8 As the seasonal increase in mortality may fluctuate greatly from winter to winter, the number of ‘additional’ deaths from a particular cause could vary even more (in percentage terms) between one year and the next. In addition, changes in the software that is used for coding the causes of death have broken the continuity of the figures for certain causes of death. More information about this is available from Section 4 (paragraphs 4.8 and 4.9). So, great caution is required when interpreting apparent changes or trends in the figures for individual causes of death, especially those that are mentioned in Section 4.
2.9 The other tables provide the numbers of deaths registered each winter, and in the adjacent four-month periods, for Scotland, NHS Board areas and Local Authority areas. They also show the seasonal increase in mortality in the winter (which is sometimes referred to as the 'seasonal difference') that is calculated from those numbers of deaths: Section 4 explains how it is done.
3. Relationship with Overall Mean Winter Temperature and theLevel of Influenza Activity
3.1 In general, there are more deaths in colder months, and mortality tends to rise as temperatures fall. As well as figures for the seasonal increase in mortality, Table 2 also gives the Met Office's overall mean winter temperature for Scotland for each of the years (based on data for December to February, rather than December to March). Part (a) of Figure 2 shows that (taken over all the winters for which figures are available) there may be a very slight tendency for the seasonal increase in mortality in the winter to be higher when the overall mean winter temperature is lower, but there is not a clear relationship. Part (b) shows that there is no clear relationship for the latest 20 winters alone. Here are a couple of examples of winters for which the expected relationship did (more-or-less) apply:
Winter 2013/14 was the fourth warmest of the 63 winters for which (at thattime) these figures were available, with a mean temperature of 4.15°C, andhad the second lowest seasonal increase in mortality (1,600);
Winter 2014/15 was, perhaps, a fairly ‘typical’ winter (in terms of its averagetemperature): it was the 35th coldest out of the 64 winters for which figureswere available at that time, and had the 28th largest seasonal increase inmortality in the whole period. (However, the relationship is less clear if onelooks only at what were, at that time, the latest twenty winters: in that period,winter 2014/15 was only the eighth coldest but it had had the third largestseasonal increase in mortality.)
On the other hand, there are also examples of winters for which the expected relationship did not apply:
In terms of its average temperature, winter 2010/11 was the fifth coldest inthe 60 years from 1951/52 to 2010/11, inclusive: it had a mean wintertemperature of 1.28°C. Only four of the 59 preceding winters had a lowermean temperature (1962/63: 0.16°C; 1976/77: 1.02°C; 1978/79: 0.45°C; and2009/10: 0.39°C) and the average of the mean temperatures for those 59winters was 2.57°C. Therefore, one might have expected a relatively highseasonal increase in mortality in winter 2010/11. However, the seasonalincrease in mortality in winter 2010/11 was (at that time) the ninth lowestfigure recorded since the series started in 1951/52;
9 © Crown Copyright 2018
Winter 2011/12 was quite mild, with a mean temperature of 3.56°C. Eight ofthe preceding 60 winters had higher mean temperatures (ranging from3.61°C in winter 2007/08 to 5.12°C in winter 1988/89), yet winter 2011/12had by far the lowest seasonal increase in mortality.
3.2 There may be a number of reasons for the lack of a clear association, for example,
over the years, improvements in home insulation and the spread of central heating will have altered the relationship between the weather outdoors and temperatures indoors. In addition, the overall mean winter temperature may not be a good indicator of the severity of a winter because it is an average over three months: it could therefore suggest that a winter with some extremely cold weeks (in, say, January) was ‘mild’ if the average for the three months were raised by unusually warm weather in, say, December or February.
3.3 Table 2 also includes indicators of the level of influenza activity, which NRS has calculated from figures for the weekly rate (per 100,000 population) for General Practitioner (GP) consultations for influenza-like illnesses (ILI) which were supplied by HPS. The ‘fluspotter’ surveillance scheme ran from 1971 to 2008. Since 2009/10 the Scottish Influenza Surveillance Reporting Scheme (SISRS) has provided aggregate level data on GP consultation for ILI, based on automated software extracts from 99% of Scottish GP practices. (However, HPS advises that a software provider issue [for INPS-Vision practices] meant that during the 2017/18 season data was only available from around 50% of practices.) These data are now used for routine surveillance of ILI in Scotland. (Data from the Pandemic Influenza Primary Care Reporting (PIPeR) sentinel scheme, which started in 2004, have been used retrospectively to calculate comparable historical rates for SISRS for the period 2003/04 to 2008/09.) The first two indicators are based on the peak weekly rate for GP consultations for ILI over the relevant influenza season. The third indicator was calculated from the total of the rates for the weeks which (broadly speaking) cover the period from the start of December to the end of March. NRS has expressed each indicator in the form of an index, with the 2004/05 value being 100 in each case. 2004/05 is one of only five years for which both ‘fluspotter’ and SISRS/PIPeR data are available, any of which could have been chosen as the ‘base’ year for the indices. One might expect differences between the three series' index values for the other years which they have in common, because different measuring systems and different types of data may produce different results.
3.4 The seasonal increase in mortality in the winter may have a slight tendency to be a
little higher when the peak weekly rate for GP consultations for ILI is higher. A tentative suggestion of this is given by part (a) of Figure 3, which uses the ‘fluspotter’ data; part (b) provides an even fainter suggestion using the ‘SISRS’ data. However, it will be seen that any relationship between the two numbers is a very weak one (although, as mentioned later, HPS advises that the correlation is stronger when influenza A (H3N2) is the dominant strain.). There are some winters which had apparently similar levels of influenza activity (measured in terms of the peak weekly rate for GP consultations for ILI) but which had markedly different seasonal increases in mortality. This may be because the peak weekly rate may sometimes be a poor indicator of the total volume of influenza activity. One reason for this is that an ‘influenza season’ with a below-average peak weekly rate could have more cases than a ‘normal’ season if it lasted much longer than usual. Another reason is that the time of the year when influenza is at its highest may not
10 © Crown Copyright 2018
be within the four winter months (as defined for the purpose of these statistics), which may reduce the statistical correlation between influenza activity and the seasonal increase in mortality. This can be seen from HPS's regular Influenza Updates (available on their website) which include a chart comparing the latest and the previous influenza seasons' GP consultation rates for flu. For example, the updates produced in April 2010 show that influenza in the 2009/10 season peaked in early November 2009 - which was before the start of what is defined as ‘winter 2009/10’ for the statistics of the seasonal increase in mortality in the winter. The third indicator, being based on the ‘SISRS’ total for the relevant weeks, should be a better indicator of the total volume of influenza activity in the winter, as it is not affected by either of those problems. However, there is also very little (if any) relationship between the seasonal increase in mortality and the value of the third indicator, as can be seen in part (c) of Figure 3. HPS advises that stratification of the data by influenza subtype reveals that the strongest correlation is evident for seasons in which influenza A(H3N2) was the dominant strain. That strain is one which particularly affects the most elderly, and for which the seasonal vaccine has been demonstrated in UK data to be poorly protective over recent influenza seasons, as shown in an article published on 27 September 2018 in “Eurosurveillance” (a journal on infectious disease surveillance, epidemiology, prevention and control). This finding prompted a change in vaccine policy across Scotland and the rest of the UK for the 2018/19 influenza season.
3.5 Some of the winters which had particularly high seasonal increases in mortality were in periods with apparently unusually high levels of influenza activity (for example 1975/76 and 1989/90), but there have also been occasions when the relationship was less clear. Examples of the latter are winter 1971/72, which had a very high level of influenza activity, but its seasonal increase in mortality did not differ greatly from the 5-year moving average; and winter 2014/15, which had a relatively low level of influenza activity (when measured in terms of both the ‘SISRS’ indicators for GP consultations), but a seasonal increase in mortality that was unusually high for the 21st century. The large seasonal increase in mortality in winter 2014/15 is believed to be due to the impact of the main influenza strain that was circulating at that time (influenza A H3N2), for three reasons. First, older people have demonstrated increased susceptibility to this strain and are more vulnerable to increased winter mortality. Second, the 2014/15 ‘influenza season’ (as determined by the results of laboratory testing of swabs from sentinel general practices) was much longer than normal (around 20 weeks, rather than the usual 6-8 weeks). Third, while the vaccine which the World Health Organisationrecommended (in February 2014) for use in Northern hemisphere countries overwinter 2014/15 provided protection against a number of influenza strains, it wasless successful in protecting against H3N2. The vaccine was less effective thananticipated because the majority of the influenza A H3N2 viruses that were foundto have circulated in Europe during the 2014/15 ‘influenza season’ had ‘drifted’from the vaccine strain. The mismatch between the vaccine and what turned out tobe the dominant influenza strain was revealed by early and sustained pressure onelderly residential care settings with high uptake of seasonal influenza vaccine dueto outbreaks of influenza H3N2. The patterns of influenza rates and changes inmortality rates seen in Scotland in winter 2014/15 were similar to those of anumber of other EU countries.
3.6 At the time of writing, the last winter with an apparently extremely high level of influenza incidence (with an indicator value which was many times greater than
11 © Crown Copyright 2018
the indicator values of all the subsequent winters – for example, 5-6 times those of the two later winters which had the next highest indicator values) was winter 1999/2000, when the seasonal increase in mortality was 5,190. Since then, the number of ‘additional’ deaths in winter had tended to fluctuate around about half of that level (this has, very broadly, been between roughly 2,000 and 3,000), with some exceptions (such as the values of 3,510 in winter 2008/09, 1,420 in winter 2011/12, 1,600 in winter 2013/14, 4,060 in winter 2014/15 and 4,800 in winter 2017/18). However, HPS advises that there are other measures of the level of influenza activity, such as the number and proportion of people who were found to have influenza following tests conducted by GPs and hospitals – and that, on the basis of hospital test results, winter 2017/18 had an unusually high level of influenza.
3.7 Influenza may increase the mortality rate for vulnerable people, such as the elderly and those with long-term health conditions, like cancer and chronic obstructive pulmonary disease (COPD), by making them more vulnerable to the effects of existing health problems. Influenza and other respiratory system diseases may affect the circulatory system and trigger coronary heart disease or cerebrovascular disease. In such cases, the medical condition (for example COPD or heart disease) may be recorded as the cause of death, as influenza itself is mentioned on relatively few death certificates. Information about the numbers of deaths from different causes is given in the Vital Events Reference Tables on the NRS website. There, Table 6.01 shows that, in most calendar years, relatively few deaths are registered for which the underlying cause is recorded as influenza (ICD-10 codes J09-J11): for example, 10 in 2008, 12 in 2010, 19 in 2012 and 23 in 2014. In recent calendar years, the largest such figures have been:
first, 136 deaths registered in 2017 (which is small in relation to the seasonalincrease in mortality of 2,730 in winter 2016/17 – refer to Table 1);
second, 94 deaths registered in 2015 (again, small in relation to the seasonalincrease in mortality of 4,060 in winter 2014/15);
third, 79 in 2016 (also small relative to the seasonal increase of 2,850 in winter2015/16); and
fourth, 62 in 2009 (small in relation to the seasonal increase in mortality of3,510 in winter 2008/09).
That figure of 62 includes all the deaths for which the underlying cause was H1N1/’swine' flu that were registered in 2009. H1N1/'swine' flu accounted for only a small proportion of winter 2009/10's seasonal increase in mortality. The HPS Influenza Update dated 15 April 2010 stated that ‘the total number of reports received of deaths among those with confirmed Influenza A H1N1v in Scotland remains at 69’, a figure which covers the period since H1N1/'swine' flu started in Scotland in Spring 2009, so the number of H1N1/'swine' flu deaths included in the figure for the seasonal increase in mortality in winter 2009/10 will be less than that.
4. How the Seasonal Increase in Mortality in the Winter is Calculated
4.1 The seasonal increase in mortality in the winter is defined as the difference between the number of deaths in the four-month ‘winter’ period (December to March, inclusive) and the average number of deaths in the two four-month periods which precede winter (August to November) and follow winter (April to July). This is a standard definition which is used by the Office for National Statistics, the World Health Organisation and others (who may describe it as – for example - ‘excess winter deaths’ or ‘excess winter mortality’).
12 © Crown Copyright 2018
4.2 Some of the previous editions of this publication were called ‘Increased Winter Mortality’ and ‘Excess Winter Mortality’. The title was changed to reduce the likelihood of misunderstandings (because someone seeing, say, ‘Increased Winter Mortality in Scotland, 2009/10’ might wrongly infer that there had been an increase in winter mortality in that year).
4.3 The numbers of deaths registered each winter, and in the adjacent four-month periods, are provided in Table 4, along with figures for the seasonal increase in mortality in the winter (sometimes referred to as the ‘seasonal difference’) which have been calculated from those numbers of deaths.
4.4 Table 4 shows that 23,137 deaths were registered in Scotland in the four months of winter 2017/18 (December 2017 to March 2018). This was more than in the preceding 4-month period (August 2017 to November 2017: 18,694 deaths) and in the following 4-month period (April 2018 to July 2018: 17,986 deaths). The average of the figures for the 4-month periods before and after the winter is 18,340. Taking the difference between that average and the total for the four winter months (23,137 deaths), gives a seasonal increase in mortality of 4,800 for winter 2017/18 (after rounding the result to the nearest ten). The figures for the seasonal increase in mortality for all the other winters were calculated using the same method.
4.5 Table 5 provides the same kind of information as Table 4 but for each NHS Board area for the latest four years, in order to provide examples of the calculation of the seasonal increase in mortality for NHS Board areas; Table 7 does the same for each Local Authority area.
4.6 The figures in Table 4 may be used to compare winters in terms of their actual numbers of deaths as well as on the basis of their seasonal increases in mortality. In terms of the numbers of deaths registered in Scotland, winter 2017/18 was unusually bad for recent years. The total of 23,137 deaths registered in the four months of winter 2017/18 was 2,191 more than the corresponding figure for winter 2016/17 (20,946) and was the highest number that had been recorded since winter 1999/2000 (when 23,379 deaths were registered). In the intervening period, winter 2014/15 had the largest number of deaths (22,013), and only two other winters had more than 21,000 deaths: winter 2002/03 (21,058 deaths) and winter 2003/04 (21,024 deaths).
4.7 In contrast, the 18,675 deaths registered in Scotland in winter 2013/14 was the lowest number for any of the 28 winters that are shown in Table 4. It was also the lowest value for any of the 67 winters for which those values have been calculated, which start with winter 1951/52. This is because, of the winters from 1951/52 to 1989/90 (which are not shown in Table 4), the one with the fewest deaths was winter 1966/67, when 21,431 deaths were registered.
4.8 The seasonal increase in deaths from a particular cause is calculated as described in paragraph 4.1, but using only figures for deaths with that underlying cause. However, from time to time, changes in the automatic cause of death coding software used by NRS have caused breaks in the continuity of the statistics for some causes of death. The figures in Table 8 are affected by coding changes which were made with effect from the start of 2011 and 2017. They broke the
13 © Crown Copyright 2018
continuity of the seasonal increase in mortality for some causes of death around winter 2010/11 and around winter 2016/17, because the seasonal increases for (for example)
winter 2009/10 were calculated wholly from data coded by the ‘old’ software(that used for deaths that were registered up to the end of 2010);
winter 2010/11 were calculated from some data coded by the ‘old’ software(for deaths registered from August 2010 to December 2010) and some coded by the ‘new’ software (for deaths registered from January 2011 to July 2011);
winter 2011/12 were calculated wholly from data coded by the ‘new’ software(that used for deaths that were registered from the start of 2011).
.9 Papers on the software changes (available from the Death Certificates and Codin g
the Causes of Death page of the NRS website) describe the causes of death most affected by the changes in the coding software. From su ch information, it is clear that (of the causes of death shown in Table 8) the ones most affected by, and the effect on their numbers from, the changes in the software are as follows:
2011 changes: o influenza and pneumonia – reduction in numbers due to the change; o other respiratory system diseases – reduction; o dementia – increase; o other mental and behavioural disorders – reduction; o Parkinson’s, Alzheimer’s and other degenerative nervous system
diseases – increase; o genitourinary system diseases – reduction; o other external causes of death – increase;
2017 changes: o other respiratory system diseases – reduction; o dementia – increase; o Parkinson’s, Alzheimer’s and other degenerative nervous system
diseases – increase. The above causes are listed in the order in which they appear in Table 8. It is not possible to quantify the effect on their figures because (in general) the papers’ estimates of such effects are for different causes (or groups thereof). From the papers, one can determine which of Table 8’s categories would be affected markedly by the software changes, and whether their numbers would have increased or decreased as a result, but not by how much their seasonal increases might have changed (which, in any case, could well be small relative to some of the year-to-year fluctuations in the seasonal increase in mortality).
Background: about these st atistics
5.1 This is an annual publication. NRS collects the underlying data on a daily basis, as and when each event is registered. The statistics for the latest winter are all new. The figures for the previous winter may have been revised very slightly.
5.2 Information about (for example) the sources, methods, definitions and reliability of these statistics is available from the following NRS web site pages general background information on Vital Events statistics and background information on points which are specific to statistics about deaths. These figures are directly comparable with those for other parts of the UK, there are no significant differences across the UK in how Vital Events data are collected and processed.
4
5.
14 © Crown Copyright 2018
5.3 The figures for the latest winter, and the subsequent four month period, given here are provisional. They were produced from the statistical information that NRS had on Tuesday 28 August 2018, which included data for deaths which had been registered by the weekend of Sunday 26 August 2018. Therefore, records for all the deaths which were registered in the winter (December to March), or in the subsequent four month period (April to July), should have been added to NRS's statistical database before the tables for this release were produced. However, the overall figures could change slightly, because occasionally, due to unusual circumstances, it may be a long time before a particular registration record is added to NRS’s statistical database. Also (as mentioned in paragraph 2.6), NRS does not ‘freeze’ its statistical data for a given year until it starts to prepare the final statistics for the calendar year as a whole (which are published in the following summer), by which time it will have received final information about the causes of some of the deaths. Finally, it should be noted that, by law, a death which occurs in Scotland must be registered within eight days - so figures which based on when each death occurred would not differ greatly from those given here, which are based on the date of registration of each death.
5.4 Statistics of the seasonal increase in mortality in the winter inform public debate and the development of government policy on matters such as the health of the elderly population, fuel poverty and whether there is a need to improve the housing stock in terms of central heating and thermal insulation.
5.5 A separate document, Increased Winter Mortality - Background Note (PDF 39 Kb), published in October 2010 (available on the NRS website), gives information about some of the medical causes of the seasonal increase in mortality in the winter, describes some research studies' findings on factors that influence it, reports on a comparison of the figures for a number of European countries, mentions previous publications on this topic, and provides references to the sources of the material. The main points to note are:
high cold-related mortality is associated with low indoor temperatures, andwith people not wearing appropriate clothing when outdoors in cold weather;
increased winter mortality was at the same level in Scotland as the overallmean for the 14 European countries covered by a comparative study; and
the seasonal increase in mortality in the winter is higher in countries with awarmer winter climate, probably because their homes tend to be poorlyinsulated and their populations tend not to dress well for cold weather.
5.6 The United Kingdom Statistics Authority has designated these statistics as National Statistics, in accordance with the Statistics and Registration Service Act 2007 and signifying compliance with the Code of Practice for Official Statistics.
5.7 Designation can be broadly interpreted to mean that the statistics:
meet identified user needs;
are well explained and readily accessible;
are produced according to sound methods, and
are managed impartially and objectively in the public interest.
5.8 Once statistics have been designated as National Statistics it is a statutory requirement that the Code of Practice shall continue to be observed.
15 © Crown Copyright 2018
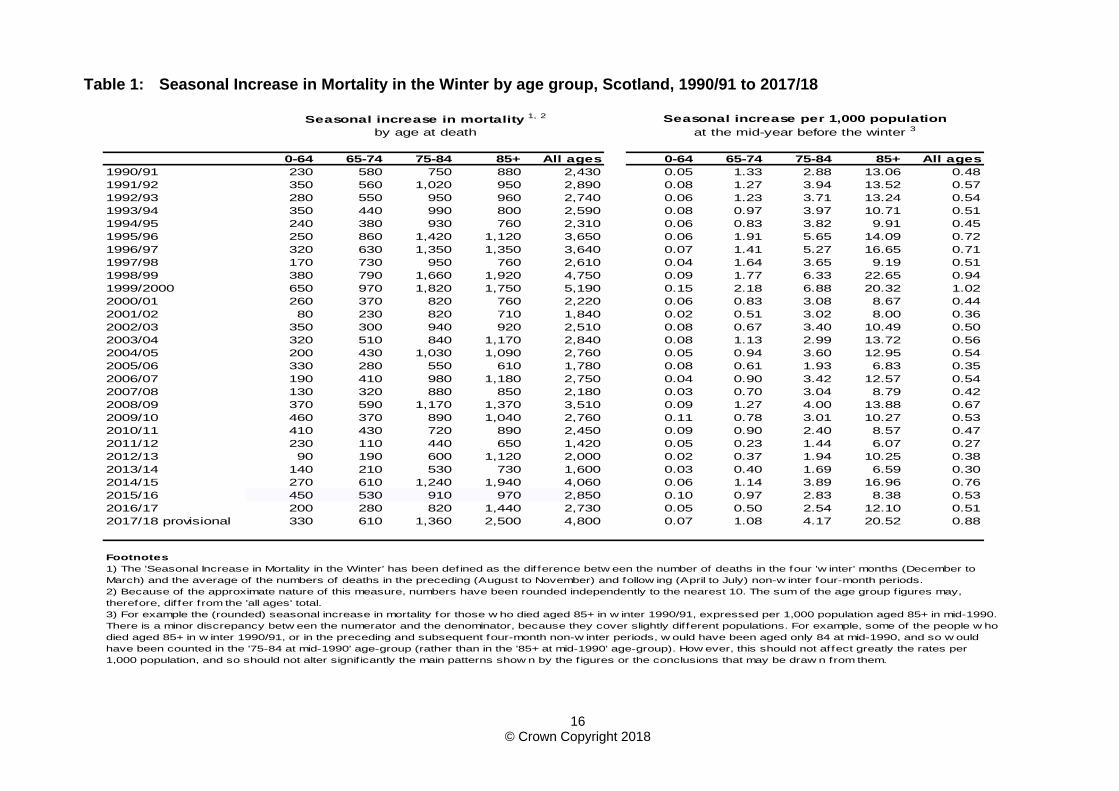
Table 1: Seasonal Increase in Mortality in the Winter by age group, Scotland, 1990/91 to 2017/18
0-64 65-74 75-84 85+ All ages 0-64 65-74 75-84 85+ All ages
1990/91 230 580 750 880 2,430 0.05 1.33 2.88 13.06 0.48
1991/92 350 560 1,020 950 2,890 0.08 1.27 3.94 13.52 0.57
1992/93 280 550 950 960 2,740 0.06 1.23 3.71 13.24 0.54
1993/94 350 440 990 800 2,590 0.08 0.97 3.97 10.71 0.51
1994/95 240 380 930 760 2,310 0.06 0.83 3.82 9.91 0.45
1995/96 250 860 1,420 1,120 3,650 0.06 1.91 5.65 14.09 0.72
1996/97 320 630 1,350 1,350 3,640 0.07 1.41 5.27 16.65 0.71
1997/98 170 730 950 760 2,610 0.04 1.64 3.65 9.19 0.51
1998/99 380 790 1,660 1,920 4,750 0.09 1.77 6.33 22.65 0.94
1999/2000 650 970 1,820 1,750 5,190 0.15 2.18 6.88 20.32 1.02
2000/01 260 370 820 760 2,220 0.06 0.83 3.08 8.67 0.44
2001/02 80 230 820 710 1,840 0.02 0.51 3.02 8.00 0.36
2002/03 350 300 940 920 2,510 0.08 0.67 3.40 10.49 0.50
2003/04 320 510 840 1,170 2,840 0.08 1.13 2.99 13.72 0.56
2004/05 200 430 1,030 1,090 2,760 0.05 0.94 3.60 12.95 0.54
2005/06 330 280 550 610 1,780 0.08 0.61 1.93 6.83 0.35
2006/07 190 410 980 1,180 2,750 0.04 0.90 3.42 12.57 0.54
2007/08 130 320 880 850 2,180 0.03 0.70 3.04 8.79 0.42
2008/09 370 590 1,170 1,370 3,510 0.09 1.27 4.00 13.88 0.67
2009/10 460 370 890 1,040 2,760 0.11 0.78 3.01 10.27 0.53
2010/11 410 430 720 890 2,450 0.09 0.90 2.40 8.57 0.47
2011/12 230 110 440 650 1,420 0.05 0.23 1.44 6.07 0.27
2012/13 90 190 600 1,120 2,000 0.02 0.37 1.94 10.25 0.38
2013/14 140 210 530 730 1,600 0.03 0.40 1.69 6.59 0.30
2014/15 270 610 1,240 1,940 4,060 0.06 1.14 3.89 16.96 0.76
2015/16 450 530 910 970 2,850 0.10 0.97 2.83 8.38 0.53
2016/17 200 280 820 1,440 2,730 0.05 0.50 2.54 12.10 0.51
2017/18 provisional 330 610 1,360 2,500 4,800 0.07 1.08 4.17 20.52 0.88
Footnotes
Seasonal increase in mortality 1, 2
at the mid-year before the winter 3by age at death
Seasonal increase per 1,000 population
3) For example the (rounded) seasonal increase in mortality for those w ho died aged 85+ in w inter 1990/91, expressed per 1,000 population aged 85+ in mid-1990.
There is a minor discrepancy betw een the numerator and the denominator, because they cover slightly different populations. For example, some of the people w ho
died aged 85+ in w inter 1990/91, or in the preceding and subsequent four-month non-w inter periods, w ould have been aged only 84 at mid-1990, and so w ould
have been counted in the '75-84 at mid-1990' age-group (rather than in the '85+ at mid-1990' age-group). How ever, this should not affect greatly the rates per
1,000 population, and so should not alter signif icantly the main patterns show n by the f igures or the conclusions that may be draw n from them.
1) The 'Seasonal Increase in Mortality in the Winter' has been defined as the difference betw een the number of deaths in the four 'w inter' months (December to
March) and the average of the numbers of deaths in the preceding (August to November) and follow ing (April to July) non-w inter four-month periods.
2) Because of the approximate nature of this measure, numbers have been rounded independently to the nearest 10. The sum of the age group f igures may,
therefore, differ from the 'all ages' total.
16 © Crown Copyright 2018
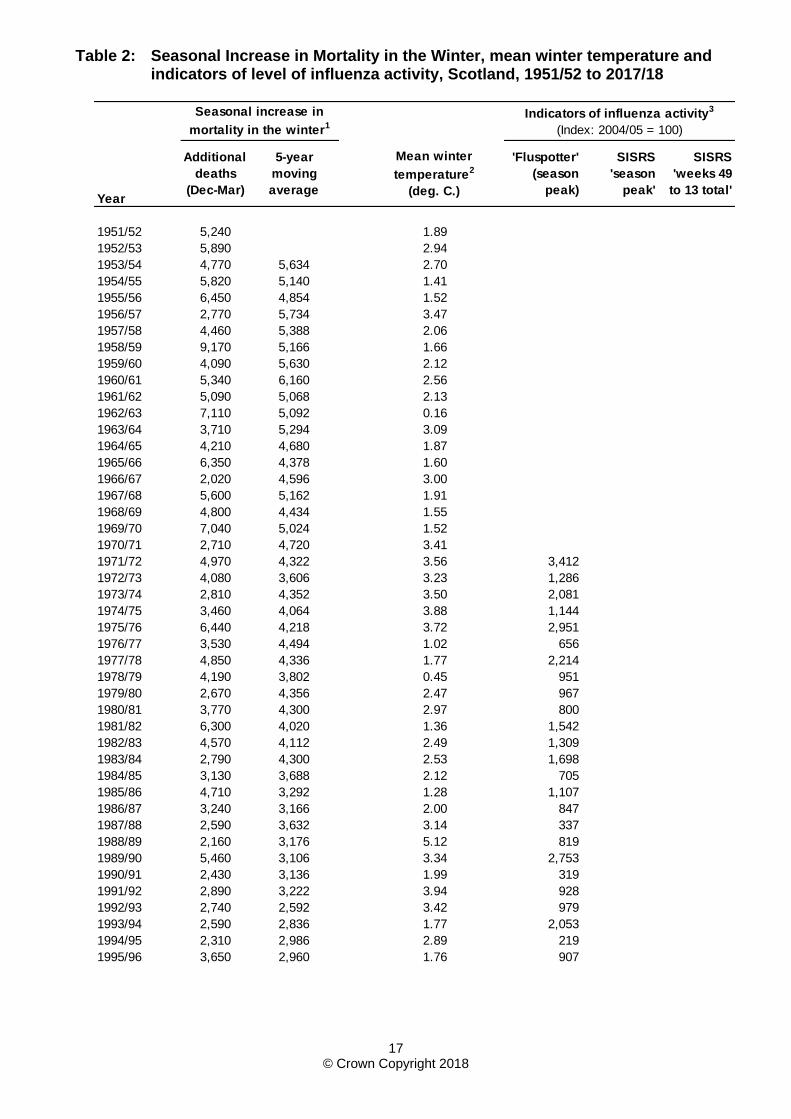
Table 2: Seasonal Increase in Mortality in the Winter, mean winter temperature and indicators of level of influenza activity, Scotland, 1951/52 to 2017/18
Year
Additional
deaths
(Dec-Mar)
5-year
moving
average
Mean winter
temperature2
(deg. C.)
'Fluspotter'
(season
peak)
SISRS
'season
peak'
SISRS
'weeks 49
to 13 total'
1951/52 5,240 1.89
1952/53 5,890 2.94
1953/54 4,770 5,634 2.70
1954/55 5,820 5,140 1.41
1955/56 6,450 4,854 1.52
1956/57 2,770 5,734 3.47
1957/58 4,460 5,388 2.06
1958/59 9,170 5,166 1.66
1959/60 4,090 5,630 2.12
1960/61 5,340 6,160 2.56
1961/62 5,090 5,068 2.13
1962/63 7,110 5,092 0.16
1963/64 3,710 5,294 3.09
1964/65 4,210 4,680 1.87
1965/66 6,350 4,378 1.60
1966/67 2,020 4,596 3.00
1967/68 5,600 5,162 1.91
1968/69 4,800 4,434 1.55
1969/70 7,040 5,024 1.52
1970/71 2,710 4,720 3.41
1971/72 4,970 4,322 3.56 3,412
1972/73 4,080 3,606 3.23 1,286
1973/74 2,810 4,352 3.50 2,081
1974/75 3,460 4,064 3.88 1,144
1975/76 6,440 4,218 3.72 2,951
1976/77 3,530 4,494 1.02 656
1977/78 4,850 4,336 1.77 2,214
1978/79 4,190 3,802 0.45 951
1979/80 2,670 4,356 2.47 967
1980/81 3,770 4,300 2.97 800
1981/82 6,300 4,020 1.36 1,542
1982/83 4,570 4,112 2.49 1,309
1983/84 2,790 4,300 2.53 1,698
1984/85 3,130 3,688 2.12 705
1985/86 4,710 3,292 1.28 1,107
1986/87 3,240 3,166 2.00 847
1987/88 2,590 3,632 3.14 337
1988/89 2,160 3,176 5.12 819
1989/90 5,460 3,106 3.34 2,753
1990/91 2,430 3,136 1.99 319
1991/92 2,890 3,222 3.94 928
1992/93 2,740 2,592 3.42 979
1993/94 2,590 2,836 1.77 2,053
1994/95 2,310 2,986 2.89 219
1995/96 3,650 2,960 1.76 907
Seasonal increase in
mortality in the winter1
Indicators of influenza activity3
(Index: 2004/05 = 100)
17 © Crown Copyright 2018
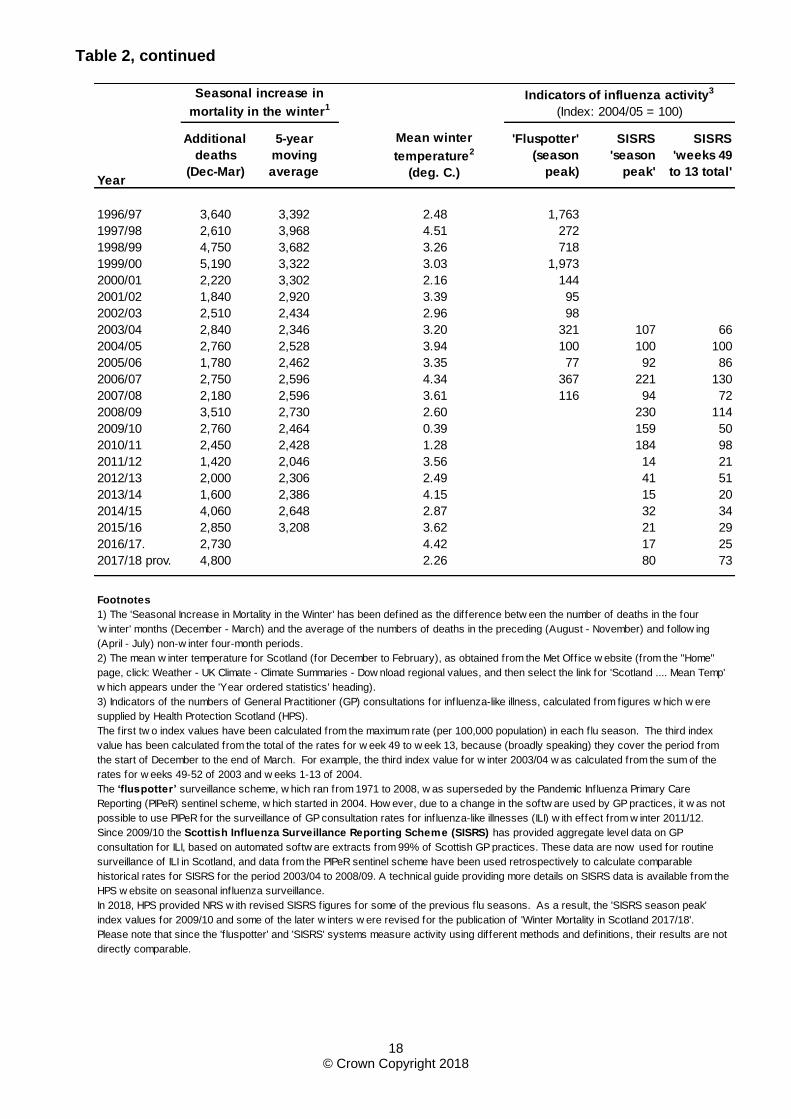
Table 2, continued
Year
Additional
deaths
(Dec-Mar)
5-year
moving
average
Mean winter
temperature2
(deg. C.)
'Fluspotter'
(season
peak)
SISRS
'season
peak'
SISRS
'weeks 49
to 13 total'
Seasonal increase in
mortality in the winter1
Indicators of influenza activity3
(Index: 2004/05 = 100)
1996/97 3,640 3,392 2.48 1,763
1997/98 2,610 3,968 4.51 272
1998/99 4,750 3,682 3.26 718
1999/00 5,190 3,322 3.03 1,973
2000/01 2,220 3,302 2.16 144
2001/02 1,840 2,920 3.39 95
2002/03 2,510 2,434 2.96 98
2003/04 2,840 2,346 3.20 321 107 66
2004/05 2,760 2,528 3.94 100 100 100
2005/06 1,780 2,462 3.35 77 92 86
2006/07 2,750 2,596 4.34 367 221 130
2007/08 2,180 2,596 3.61 116 94 72
2008/09 3,510 2,730 2.60 230 114
2009/10 2,760 2,464 0.39 159 50
2010/11 2,450 2,428 1.28 184 98
2011/12 1,420 2,046 3.56 14 21
2012/13 2,000 2,306 2.49 41 51
2013/14 1,600 2,386 4.15 15 20
2014/15 4,060 2,648 2.87 32 34
2015/16 2,850 3,208 3.62 21 29
2016/17. 2,730 4.42 17 25
2017/18 prov. 4,800 2.26 80 73
Footnotes
Please note that since the 'f luspotter' and 'SISRS' systems measure activity using different methods and definitions, their results are not
directly comparable.
1) The 'Seasonal Increase in Mortality in the Winter' has been defined as the difference betw een the number of deaths in the four
'w inter' months (December - March) and the average of the numbers of deaths in the preceding (August - November) and follow ing
(April - July) non-w inter four-month periods.
2) The mean w inter temperature for Scotland (for December to February), as obtained from the Met Office w ebsite (from the "Home"
page, click: Weather - UK Climate - Climate Summaries - Dow nload regional values, and then select the link for 'Scotland .... Mean Temp'
w hich appears under the 'Year ordered statistics' heading).
3) Indicators of the numbers of General Practitioner (GP) consultations for influenza-like illness, calculated from figures w hich w ere
supplied by Health Protection Scotland (HPS).
The ‘fluspotter’ surveillance scheme, w hich ran from 1971 to 2008, w as superseded by the Pandemic Influenza Primary Care
Reporting (PIPeR) sentinel scheme, w hich started in 2004. How ever, due to a change in the softw are used by GP practices, it w as not
possible to use PIPeR for the surveillance of GP consultation rates for influenza-like illnesses (ILI) w ith effect from w inter 2011/12.
Since 2009/10 the Scottish Influenza Surveillance Reporting Scheme (SISRS) has provided aggregate level data on GP
consultation for ILI, based on automated softw are extracts from 99% of Scottish GP practices. These data are now used for routine
surveillance of ILI in Scotland, and data from the PIPeR sentinel scheme have been used retrospectively to calculate comparable
historical rates for SISRS for the period 2003/04 to 2008/09. A technical guide providing more details on SISRS data is available from the
HPS w ebsite on seasonal influenza surveillance.
In 2018, HPS provided NRS w ith revised SISRS figures for some of the previous f lu seasons. As a result, the 'SISRS season peak'
index values for 2009/10 and some of the later w inters w ere revised for the publication of 'Winter Mortality in Scotland 2017/18'.
The f irst tw o index values have been calculated from the maximum rate (per 100,000 population) in each f lu season. The third index
value has been calculated from the total of the rates for w eek 49 to w eek 13, because (broadly speaking) they cover the period from
the start of December to the end of March. For example, the third index value for w inter 2003/04 w as calculated from the sum of the
rates for w eeks 49-52 of 2003 and w eeks 1-13 of 2004.
18 © Crown Copyright 2018
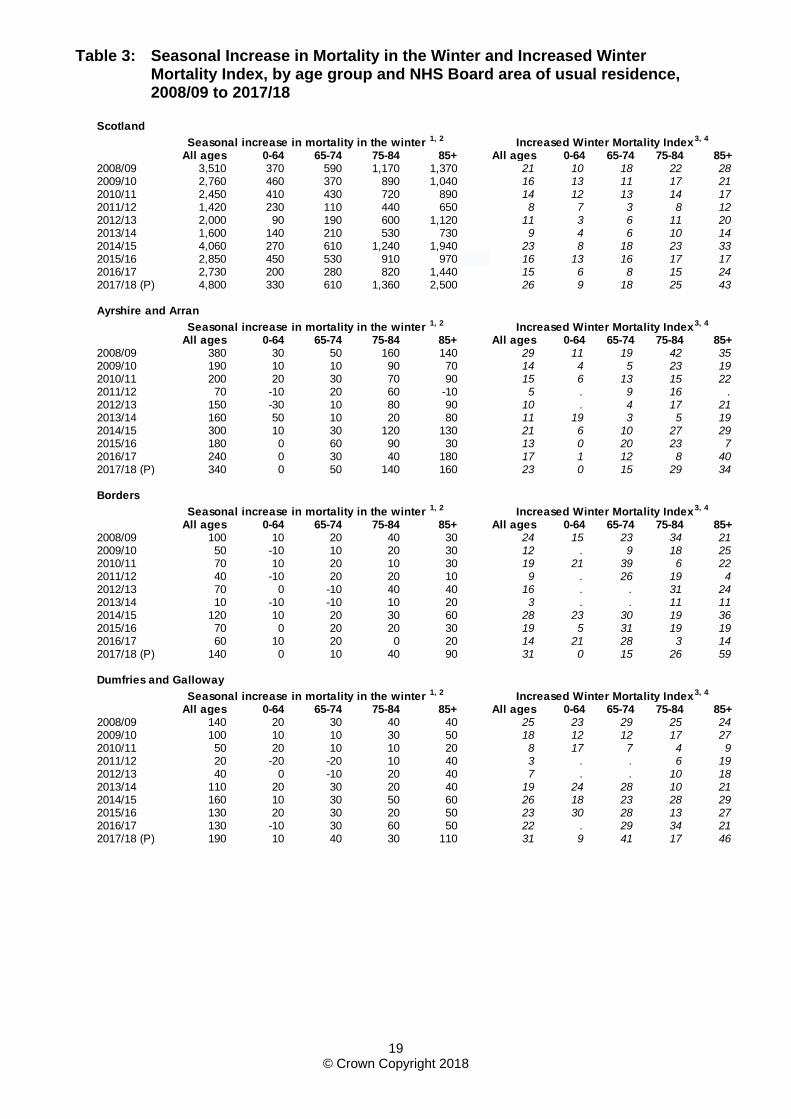
Table 3: Seasonal Increase in Mortality in the Winter and Increased Winter Mortality Index, by age group and NHS Board area of usual residence, 2008/09 to 2017/18
Scotland
All ages 0-64 65-74 75-84 85+ All ages 0-64 65-74 75-84 85+2008/09 3,510 370 590 1,170 1,370 21 10 18 22 282009/10 2,760 460 370 890 1,040 16 13 11 17 212010/11 2,450 410 430 720 890 14 12 13 14 172011/12 1,420 230 110 440 650 8 7 3 8 122012/13 2,000 90 190 600 1,120 11 3 6 11 202013/14 1,600 140 210 530 730 9 4 6 10 142014/15 4,060 270 610 1,240 1,940 23 8 18 23 332015/16 2,850 450 530 910 970 16 13 16 17 172016/17 2,730 200 280 820 1,440 15 6 8 15 242017/18 (P) 4,800 330 610 1,360 2,500 26 9 18 25 43
All ages 0-64 65-74 75-84 85+ All ages 0-64 65-74 75-84 85+2008/09 380 30 50 160 140 29 11 19 42 352009/10 190 10 10 90 70 14 4 5 23 192010/11 200 20 30 70 90 15 6 13 15 222011/12 70 -10 20 60 -10 5 . 9 16 .2012/13 150 -30 10 80 90 10 . 4 17 212013/14 160 50 10 20 80 11 19 3 5 192014/15 300 10 30 120 130 21 6 10 27 292015/16 180 0 60 90 30 13 0 20 23 72016/17 240 0 30 40 180 17 1 12 8 402017/18 (P) 340 0 50 140 160 23 0 15 29 34
Borders
All ages 0-64 65-74 75-84 85+ All ages 0-64 65-74 75-84 85+2008/09 100 10 20 40 30 24 15 23 34 212009/10 50 -10 10 20 30 12 . 9 18 252010/11 70 10 20 10 30 19 21 39 6 222011/12 40 -10 20 20 10 9 . 26 19 42012/13 70 0 -10 40 40 16 . . 31 242013/14 10 -10 -10 10 20 3 . . 11 112014/15 120 10 20 30 60 28 23 30 19 362015/16 70 0 20 20 30 19 5 31 19 192016/17 60 10 20 0 20 14 21 28 3 142017/18 (P) 140 0 10 40 90 31 0 15 26 59
All ages 0-64 65-74 75-84 85+ All ages 0-64 65-74 75-84 85+2008/09 140 20 30 40 40 25 23 29 25 242009/10 100 10 10 30 50 18 12 12 17 272010/11 50 20 10 10 20 8 17 7 4 92011/12 20 -20 -20 10 40 3 . . 6 192012/13 40 0 -10 20 40 7 . . 10 182013/14 110 20 30 20 40 19 24 28 10 212014/15 160 10 30 50 60 26 18 23 28 292015/16 130 20 30 20 50 23 30 28 13 272016/17 130 -10 30 60 50 22 . 29 34 212017/18 (P) 190 10 40 30 110 31 9 41 17 46
Seasonal increase in mortality in the winter 1, 2
Seasonal increase in mortality in the winter 1, 2
Increased Winter Mortality Index3, 4
Increased Winter Mortality Index3, 4
Seasonal increase in mortality in the winter 1, 2 Increased Winter Mortality Index3, 4
Seasonal increase in mortality in the winter 1, 2
Ayrshire and Arran
Dumfries and Galloway
Increased Winter Mortality Index3, 4
19 © Crown Copyright 2018
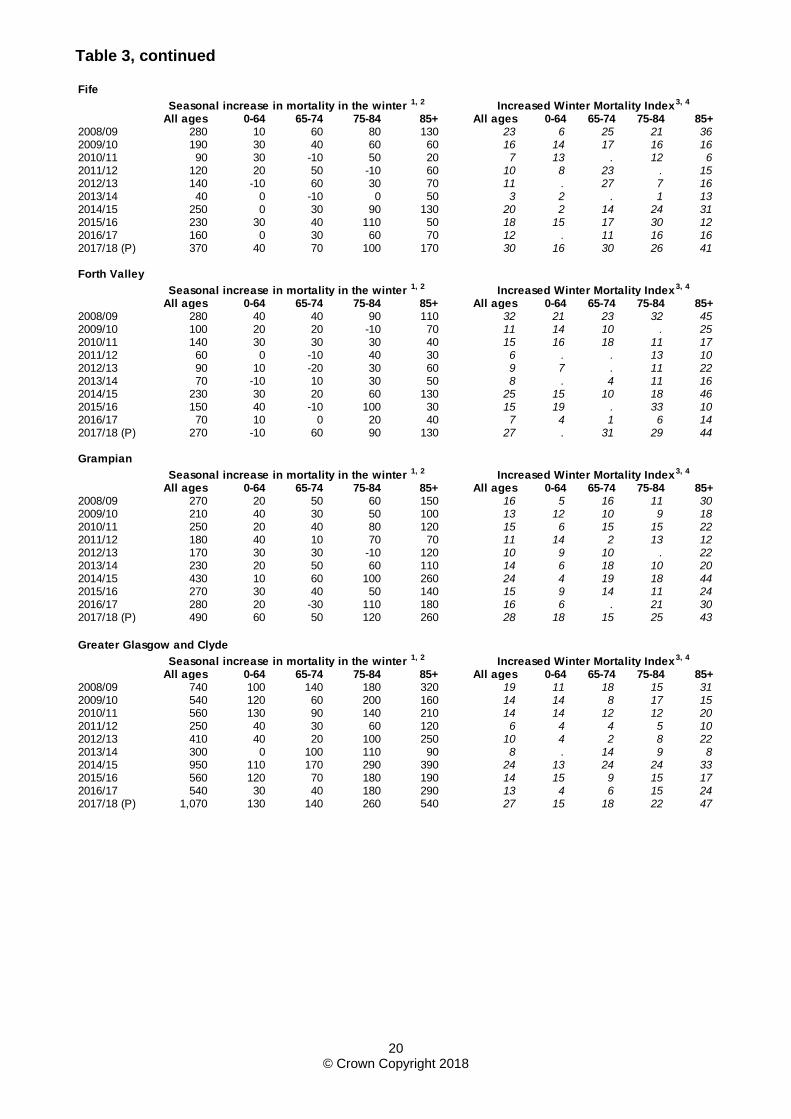
Table 3, continued
Fife
All ages 0-64 65-74 75-84 85+ All ages 0-64 65-74 75-84 85+2008/09 280 10 60 80 130 23 6 25 21 362009/10 190 30 40 60 60 16 14 17 16 162010/11 90 30 -10 50 20 7 13 . 12 62011/12 120 20 50 -10 60 10 8 23 . 152012/13 140 -10 60 30 70 11 . 27 7 162013/14 40 0 -10 0 50 3 2 . 1 132014/15 250 0 30 90 130 20 2 14 24 312015/16 230 30 40 110 50 18 15 17 30 122016/17 160 0 30 60 70 12 . 11 16 162017/18 (P) 370 40 70 100 170 30 16 30 26 41
Forth Valley
All ages 0-64 65-74 75-84 85+ All ages 0-64 65-74 75-84 85+2008/09 280 40 40 90 110 32 21 23 32 452009/10 100 20 20 -10 70 11 14 10 . 252010/11 140 30 30 30 40 15 16 18 11 172011/12 60 0 -10 40 30 6 . . 13 102012/13 90 10 -20 30 60 9 7 . 11 222013/14 70 -10 10 30 50 8 . 4 11 162014/15 230 30 20 60 130 25 15 10 18 462015/16 150 40 -10 100 30 15 19 . 33 102016/17 70 10 0 20 40 7 4 1 6 142017/18 (P) 270 -10 60 90 130 27 . 31 29 44
Grampian
All ages 0-64 65-74 75-84 85+ All ages 0-64 65-74 75-84 85+2008/09 270 20 50 60 150 16 5 16 11 302009/10 210 40 30 50 100 13 12 10 9 182010/11 250 20 40 80 120 15 6 15 15 222011/12 180 40 10 70 70 11 14 2 13 122012/13 170 30 30 -10 120 10 9 10 . 222013/14 230 20 50 60 110 14 6 18 10 202014/15 430 10 60 100 260 24 4 19 18 442015/16 270 30 40 50 140 15 9 14 11 242016/17 280 20 -30 110 180 16 6 . 21 302017/18 (P) 490 60 50 120 260 28 18 15 25 43
All ages 0-64 65-74 75-84 85+ All ages 0-64 65-74 75-84 85+2008/09 740 100 140 180 320 19 11 18 15 312009/10 540 120 60 200 160 14 14 8 17 152010/11 560 130 90 140 210 14 14 12 12 202011/12 250 40 30 60 120 6 4 4 5 102012/13 410 40 20 100 250 10 4 2 8 222013/14 300 0 100 110 90 8 . 14 9 82014/15 950 110 170 290 390 24 13 24 24 332015/16 560 120 70 180 190 14 15 9 15 172016/17 540 30 40 180 290 13 4 6 15 242017/18 (P) 1,070 130 140 260 540 27 15 18 22 47
Seasonal increase in mortality in the winter 1, 2
Seasonal increase in mortality in the winter 1, 2 Increased Winter Mortality Index3, 4
Greater Glasgow and Clyde
Increased Winter Mortality Index3, 4
Seasonal increase in mortality in the winter 1, 2
Seasonal increase in mortality in the winter 1, 2
Increased Winter Mortality Index3, 4
Increased Winter Mortality Index3, 4
20 © Crown Copyright 2018
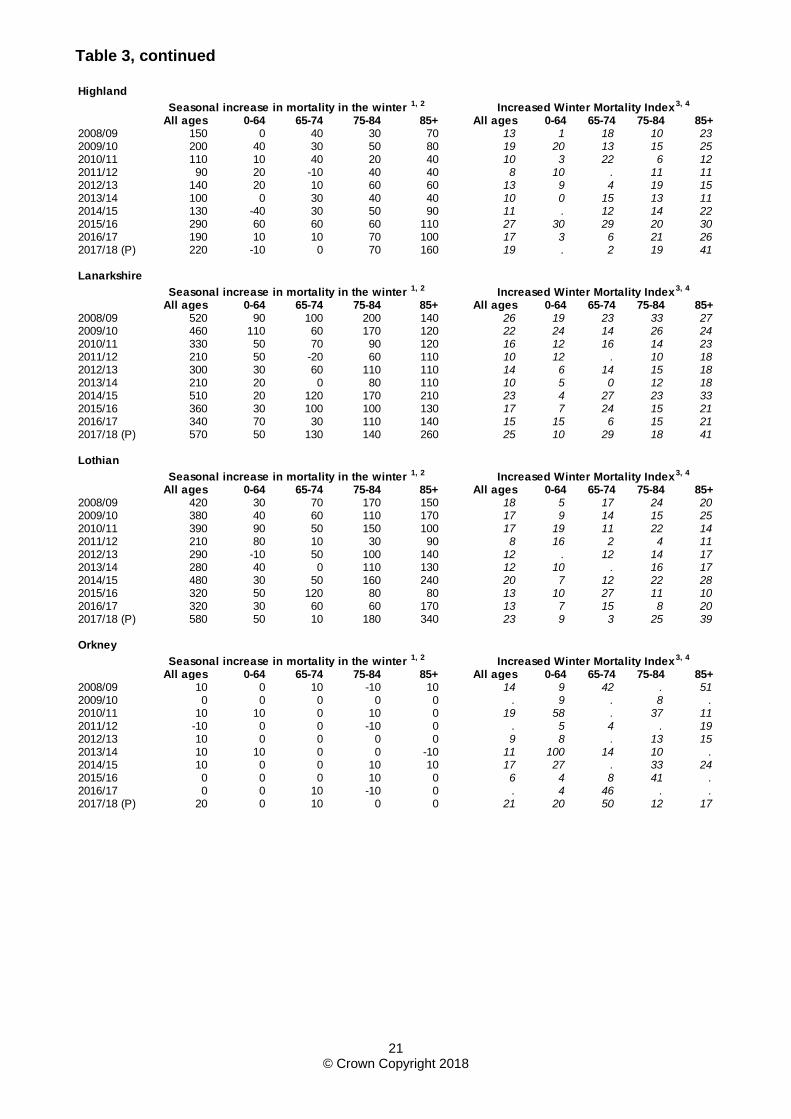
Table 3, continued
Highland
All ages 0-64 65-74 75-84 85+ All ages 0-64 65-74 75-84 85+2008/09 150 0 40 30 70 13 1 18 10 232009/10 200 40 30 50 80 19 20 13 15 252010/11 110 10 40 20 40 10 3 22 6 122011/12 90 20 -10 40 40 8 10 . 11 112012/13 140 20 10 60 60 13 9 4 19 152013/14 100 0 30 40 40 10 0 15 13 112014/15 130 -40 30 50 90 11 . 12 14 222015/16 290 60 60 60 110 27 30 29 20 302016/17 190 10 10 70 100 17 3 6 21 262017/18 (P) 220 -10 0 70 160 19 . 2 19 41
Lanarkshire
All ages 0-64 65-74 75-84 85+ All ages 0-64 65-74 75-84 85+2008/09 520 90 100 200 140 26 19 23 33 272009/10 460 110 60 170 120 22 24 14 26 242010/11 330 50 70 90 120 16 12 16 14 232011/12 210 50 -20 60 110 10 12 . 10 182012/13 300 30 60 110 110 14 6 14 15 182013/14 210 20 0 80 110 10 5 0 12 182014/15 510 20 120 170 210 23 4 27 23 332015/16 360 30 100 100 130 17 7 24 15 212016/17 340 70 30 110 140 15 15 6 15 212017/18 (P) 570 50 130 140 260 25 10 29 18 41
Lothian
All ages 0-64 65-74 75-84 85+ All ages 0-64 65-74 75-84 85+2008/09 420 30 70 170 150 18 5 17 24 202009/10 380 40 60 110 170 17 9 14 15 252010/11 390 90 50 150 100 17 19 11 22 142011/12 210 80 10 30 90 8 16 2 4 112012/13 290 -10 50 100 140 12 . 12 14 172013/14 280 40 0 110 130 12 10 . 16 172014/15 480 30 50 160 240 20 7 12 22 282015/16 320 50 120 80 80 13 10 27 11 102016/17 320 30 60 60 170 13 7 15 8 202017/18 (P) 580 50 10 180 340 23 9 3 25 39
Orkney
All ages 0-64 65-74 75-84 85+ All ages 0-64 65-74 75-84 85+2008/09 10 0 10 -10 10 14 9 42 . 512009/10 0 0 0 0 0 . 9 . 8 .2010/11 10 10 0 10 0 19 58 . 37 112011/12 -10 0 0 -10 0 . 5 4 . 192012/13 10 0 0 0 0 9 8 . 13 152013/14 10 10 0 0 -10 11 100 14 10 .2014/15 10 0 0 10 10 17 27 . 33 242015/16 0 0 0 10 0 6 4 8 41 .2016/17 0 0 10 -10 0 . 4 46 . .2017/18 (P) 20 0 10 0 0 21 20 50 12 17
Seasonal increase in mortality in the winter 1, 2 Increased Winter Mortality Index3, 4
Seasonal increase in mortality in the winter 1, 2
Seasonal increase in mortality in the winter 1, 2
Increased Winter Mortality Index3, 4
Increased Winter Mortality Index3, 4
Seasonal increase in mortality in the winter 1, 2 Increased Winter Mortality Index3, 4
21 © Crown Copyright 2018
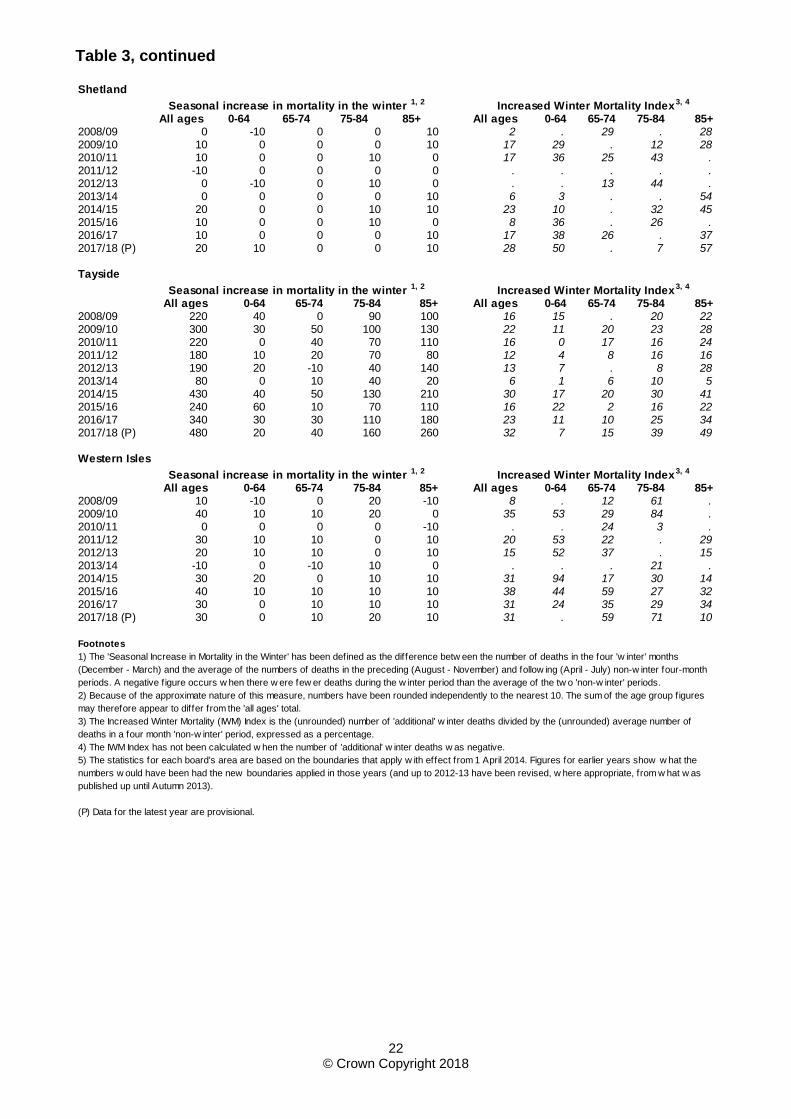
Table 3, continued
Shetland
All ages 0-64 65-74 75-84 85+ All ages 0-64 65-74 75-84 85+2008/09 0 -10 0 0 10 2 . 29 . 282009/10 10 0 0 0 10 17 29 . 12 282010/11 10 0 0 10 0 17 36 25 43 .2011/12 -10 0 0 0 0 . . . . .2012/13 0 -10 0 10 0 . . 13 44 .2013/14 0 0 0 0 10 6 3 . . 542014/15 20 0 0 10 10 23 10 . 32 452015/16 10 0 0 10 0 8 36 . 26 .2016/17 10 0 0 0 10 17 38 26 . 372017/18 (P) 20 10 0 0 10 28 50 . 7 57
Tayside
All ages 0-64 65-74 75-84 85+ All ages 0-64 65-74 75-84 85+2008/09 220 40 0 90 100 16 15 . 20 222009/10 300 30 50 100 130 22 11 20 23 282010/11 220 0 40 70 110 16 0 17 16 242011/12 180 10 20 70 80 12 4 8 16 162012/13 190 20 -10 40 140 13 7 . 8 282013/14 80 0 10 40 20 6 1 6 10 52014/15 430 40 50 130 210 30 17 20 30 412015/16 240 60 10 70 110 16 22 2 16 222016/17 340 30 30 110 180 23 11 10 25 342017/18 (P) 480 20 40 160 260 32 7 15 39 49
All ages 0-64 65-74 75-84 85+ All ages 0-64 65-74 75-84 85+2008/09 10 -10 0 20 -10 8 . 12 61 .2009/10 40 10 10 20 0 35 53 29 84 .2010/11 0 0 0 0 -10 . . 24 3 .2011/12 30 10 10 0 10 20 53 22 . 292012/13 20 10 10 0 10 15 52 37 . 152013/14 -10 0 -10 10 0 . . . 21 .2014/15 30 20 0 10 10 31 94 17 30 142015/16 40 10 10 10 10 38 44 59 27 322016/17 30 0 10 10 10 31 24 35 29 342017/18 (P) 30 0 10 20 10 31 . 59 71 10
Footnotes
Western Isles
(P) Data for the latest year are provisional.
Seasonal increase in mortality in the winter 1, 2 Increased Winter Mortality Index3, 4
Seasonal increase in mortality in the winter 1, 2
Seasonal increase in mortality in the winter 1, 2
Increased Winter Mortality Index3, 4
Increased Winter Mortality Index3, 4
3) The Increased Winter Mortality (IWM) Index is the (unrounded) number of 'additional' w inter deaths divided by the (unrounded) average number of
deaths in a four month 'non-w inter' period, expressed as a percentage.
5) The statistics for each board's area are based on the boundaries that apply w ith effect from 1 April 2014. Figures for earlier years show w hat the
numbers w ould have been had the new boundaries applied in those years (and up to 2012-13 have been revised, w here appropriate, from w hat w as
published up until Autumn 2013).
4) The IWM Index has not been calculated w hen the number of 'additional' w inter deaths w as negative.
1) The 'Seasonal Increase in Mortality in the Winter' has been defined as the difference betw een the number of deaths in the four 'w inter' months
(December - March) and the average of the numbers of deaths in the preceding (August - November) and follow ing (April - July) non-w inter four-month
periods. A negative f igure occurs w hen there w ere few er deaths during the w inter period than the average of the tw o 'non-w inter' periods.
2) Because of the approximate nature of this measure, numbers have been rounded independently to the nearest 10. The sum of the age group f igures
may therefore appear to differ from the 'all ages' total.
22 © Crown Copyright 2018
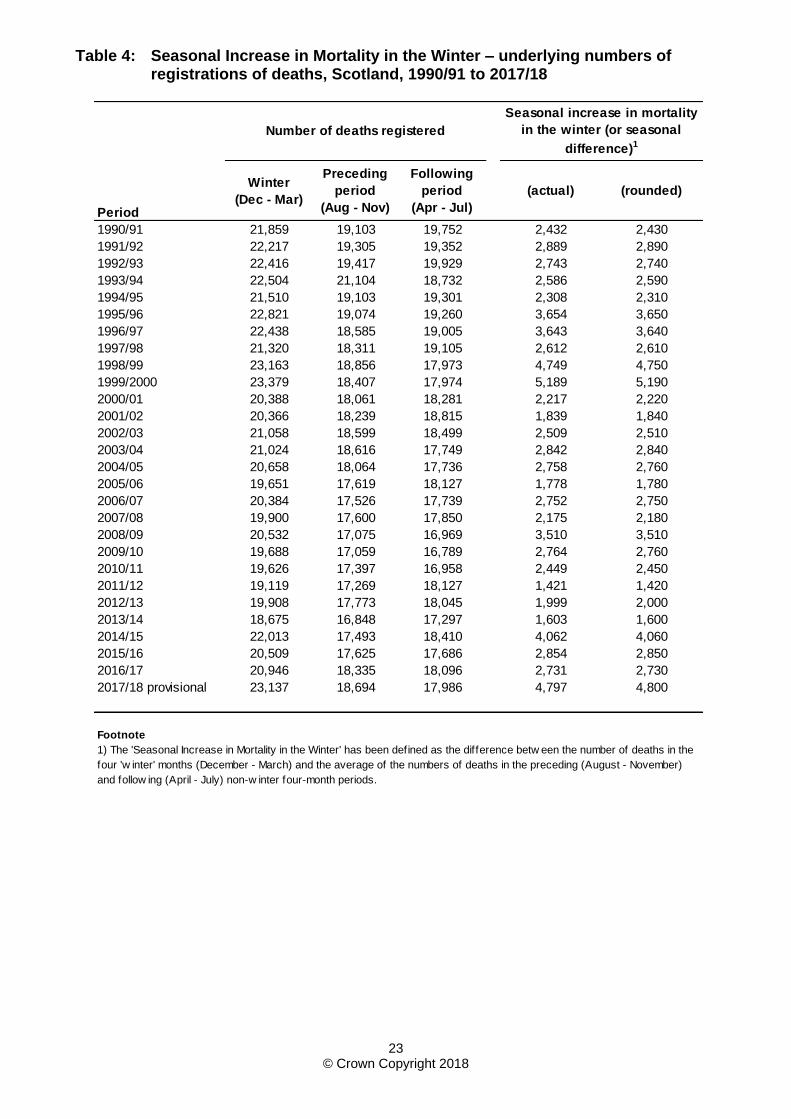
Table 4: Seasonal Increase in Mortality in the Winter – underlying numbers of registrations of deaths, Scotland, 1990/91 to 2017/18
Period
Winter
(Dec - Mar)
Preceding
period
(Aug - Nov)
Following
period
(Apr - Jul)
(actual) (rounded)
1990/91 21,859 19,103 19,752 2,432 2,430
1991/92 22,217 19,305 19,352 2,889 2,890
1992/93 22,416 19,417 19,929 2,743 2,740
1993/94 22,504 21,104 18,732 2,586 2,590
1994/95 21,510 19,103 19,301 2,308 2,310
1995/96 22,821 19,074 19,260 3,654 3,650
1996/97 22,438 18,585 19,005 3,643 3,640
1997/98 21,320 18,311 19,105 2,612 2,610
1998/99 23,163 18,856 17,973 4,749 4,750
1999/2000 23,379 18,407 17,974 5,189 5,190
2000/01 20,388 18,061 18,281 2,217 2,220
2001/02 20,366 18,239 18,815 1,839 1,840
2002/03 21,058 18,599 18,499 2,509 2,510
2003/04 21,024 18,616 17,749 2,842 2,840
2004/05 20,658 18,064 17,736 2,758 2,760
2005/06 19,651 17,619 18,127 1,778 1,780
2006/07 20,384 17,526 17,739 2,752 2,750
2007/08 19,900 17,600 17,850 2,175 2,180
2008/09 20,532 17,075 16,969 3,510 3,510
2009/10 19,688 17,059 16,789 2,764 2,760
2010/11 19,626 17,397 16,958 2,449 2,450
2011/12 19,119 17,269 18,127 1,421 1,420
2012/13 19,908 17,773 18,045 1,999 2,000
2013/14 18,675 16,848 17,297 1,603 1,600
2014/15 22,013 17,493 18,410 4,062 4,060
2015/16 20,509 17,625 17,686 2,854 2,850
2016/17 20,946 18,335 18,096 2,731 2,730
2017/18 provisional 23,137 18,694 17,986 4,797 4,800
Footnote
Number of deaths registered
Seasonal increase in mortality
in the winter (or seasonal
difference)1
1) The 'Seasonal Increase in Mortality in the Winter' has been defined as the difference betw een the number of deaths in the
four 'w inter' months (December - March) and the average of the numbers of deaths in the preceding (August - November)
and follow ing (April - July) non-w inter four-month periods.
23 © Crown Copyright 2018
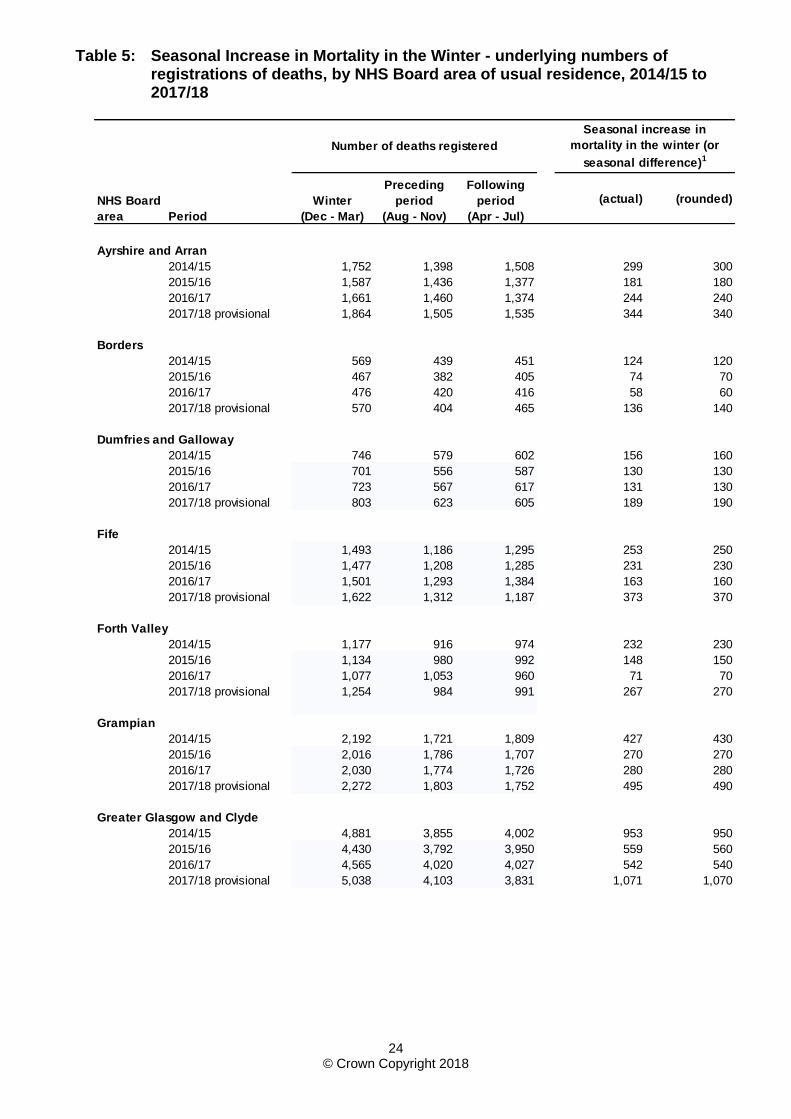
Table 5: Seasonal Increase in Mortality in the Winter - underlying numbers of registrations of deaths, by NHS Board area of usual residence, 2014/15 to 2017/18
NHS Board
area Period
Winter
(Dec - Mar)
Preceding
period
(Aug - Nov)
Following
period
(Apr - Jul)
(actual) (rounded)
2014/15 1,752 1,398 1,508 299 300
2015/16 1,587 1,436 1,377 181 180
2016/17 1,661 1,460 1,374 244 240
2017/18 provisional 1,864 1,505 1,535 344 340
Borders
2014/15 569 439 451 124 120
2015/16 467 382 405 74 70
2016/17 476 420 416 58 60
2017/18 provisional 570 404 465 136 140
2014/15 746 579 602 156 160
2015/16 701 556 587 130 130
2016/17 723 567 617 131 130
2017/18 provisional 803 623 605 189 190
Fife
2014/15 1,493 1,186 1,295 253 250
2015/16 1,477 1,208 1,285 231 230
2016/17 1,501 1,293 1,384 163 160
2017/18 provisional 1,622 1,312 1,187 373 370
2014/15 1,177 916 974 232 230
2015/16 1,134 980 992 148 150
2016/17 1,077 1,053 960 71 70
2017/18 provisional 1,254 984 991 267 270
Grampian
2014/15 2,192 1,721 1,809 427 430
2015/16 2,016 1,786 1,707 270 270
2016/17 2,030 1,774 1,726 280 280
2017/18 provisional 2,272 1,803 1,752 495 490
2014/15 4,881 3,855 4,002 953 950
2015/16 4,430 3,792 3,950 559 560
2016/17 4,565 4,020 4,027 542 540
2017/18 provisional 5,038 4,103 3,831 1,071 1,070
Number of deaths registered
Seasonal increase in
mortality in the winter (or
seasonal difference)1
Ayrshire and Arran
Dumfries and Galloway
Forth Valley
Greater Glasgow and Clyde
24 © Crown Copyright 2018
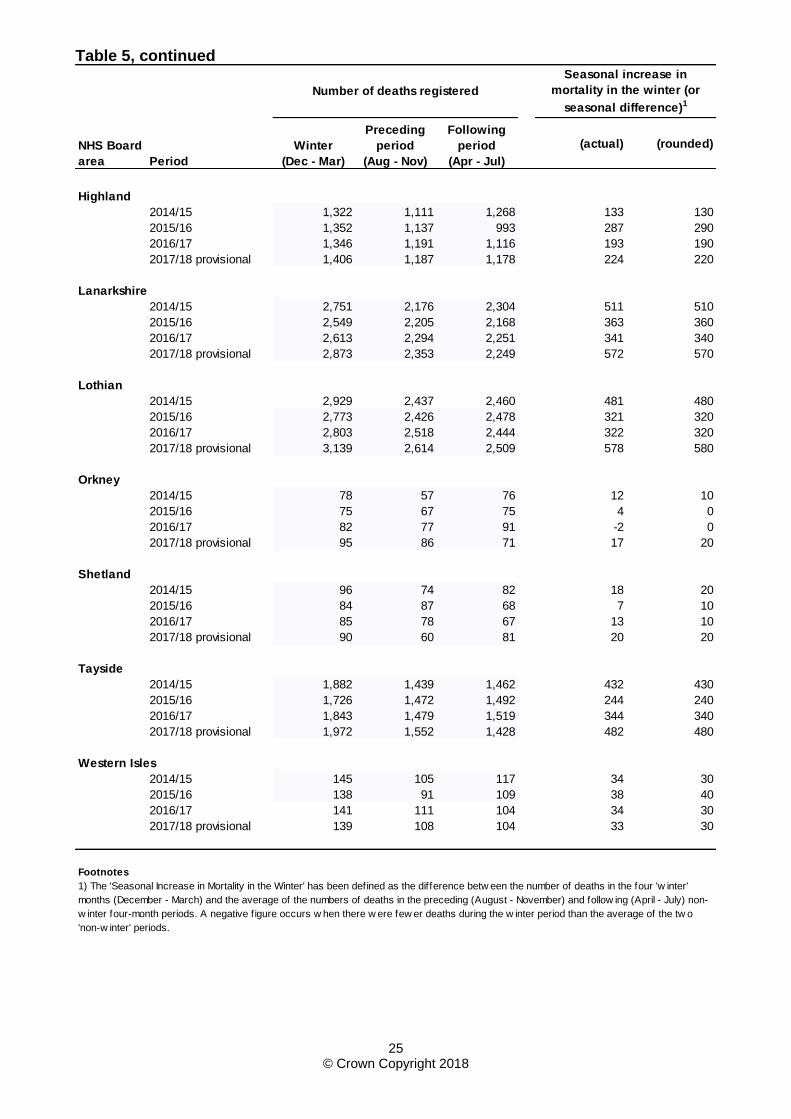
Table 5, continued
NHS Board
area Period
Winter
(Dec - Mar)
Preceding
period
(Aug - Nov)
Following
period
(Apr - Jul)
(actual) (rounded)
Number of deaths registered
Seasonal increase in
mortality in the winter (or
seasonal difference)1
Highland
2014/15 1,322 1,111 1,268 133 130
2015/16 1,352 1,137 993 287 290
2016/17 1,346 1,191 1,116 193 190
2017/18 provisional 1,406 1,187 1,178 224 220
2014/15 2,751 2,176 2,304 511 510
2015/16 2,549 2,205 2,168 363 360
2016/17 2,613 2,294 2,251 341 340
2017/18 provisional 2,873 2,353 2,249 572 570
Lothian
2014/15 2,929 2,437 2,460 481 480
2015/16 2,773 2,426 2,478 321 320
2016/17 2,803 2,518 2,444 322 320
2017/18 provisional 3,139 2,614 2,509 578 580
Orkney
2014/15 78 57 76 12 10
2015/16 75 67 75 4 0
2016/17 82 77 91 -2 0
2017/18 provisional 95 86 71 17 20
Shetland
2014/15 96 74 82 18 20
2015/16 84 87 68 7 10
2016/17 85 78 67 13 10
2017/18 provisional 90 60 81 20 20
Tayside
2014/15 1,882 1,439 1,462 432 430
2015/16 1,726 1,472 1,492 244 240
2016/17 1,843 1,479 1,519 344 340
2017/18 provisional 1,972 1,552 1,428 482 480
2014/15 145 105 117 34 30
2015/16 138 91 109 38 40
2016/17 141 111 104 34 30
2017/18 provisional 139 108 104 33 30
Footnotes
Western Isles
Lanarkshire
1) The 'Seasonal Increase in Mortality in the Winter' has been defined as the difference betw een the number of deaths in the four 'w inter'
months (December - March) and the average of the numbers of deaths in the preceding (August - November) and follow ing (April - July) non-
w inter four-month periods. A negative f igure occurs w hen there w ere few er deaths during the w inter period than the average of the tw o
'non-w inter' periods.
25 © Crown Copyright 2018
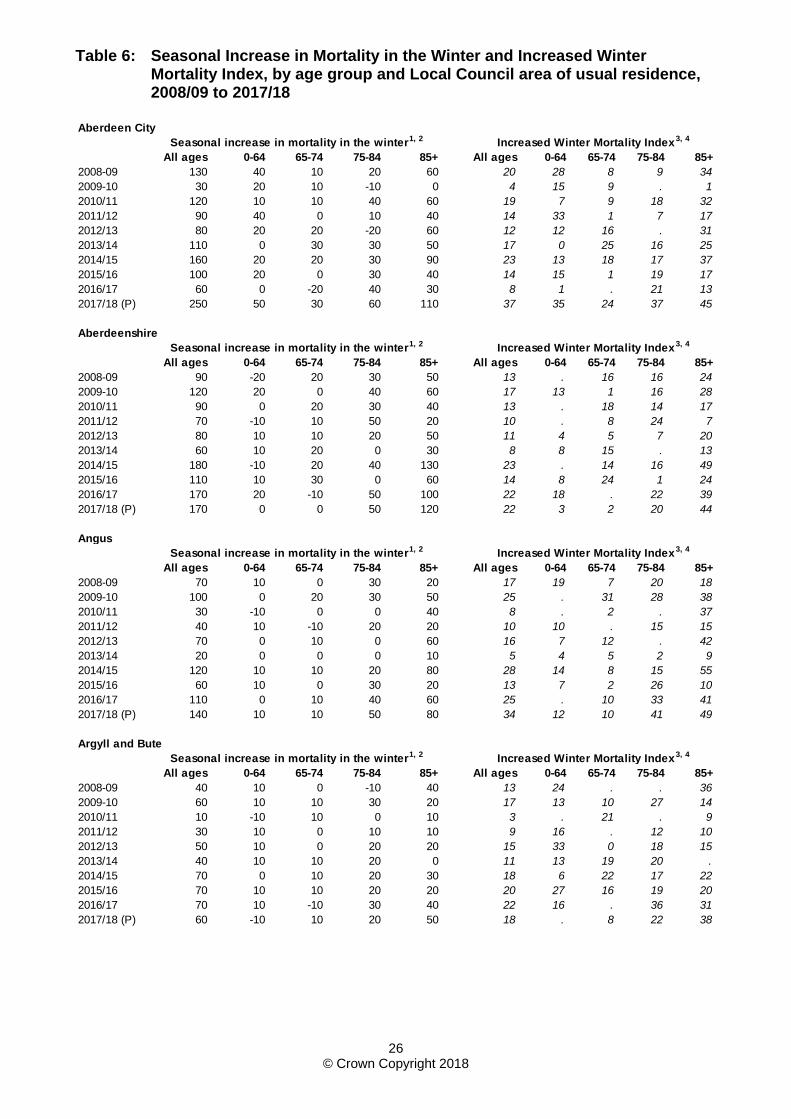
Table 6: Seasonal Increase in Mortality in the Winter and Increased Winter Mortality Index, by age group and Local Council area of usual residence, 2008/09 to 2017/18
All ages 0-64 65-74 75-84 85+ All ages 0-64 65-74 75-84 85+
2008-09 130 40 10 20 60 20 28 8 9 34
2009-10 30 20 10 -10 0 4 15 9 . 1
2010/11 120 10 10 40 60 19 7 9 18 32
2011/12 90 40 0 10 40 14 33 1 7 17
2012/13 80 20 20 -20 60 12 12 16 . 31
2013/14 110 0 30 30 50 17 0 25 16 25
2014/15 160 20 20 30 90 23 13 18 17 37
2015/16 100 20 0 30 40 14 15 1 19 17
2016/17 60 0 -20 40 30 8 1 . 21 13
2017/18 (P) 250 50 30 60 110 37 35 24 37 45
All ages 0-64 65-74 75-84 85+ All ages 0-64 65-74 75-84 85+
2008-09 90 -20 20 30 50 13 . 16 16 24
2009-10 120 20 0 40 60 17 13 1 16 28
2010/11 90 0 20 30 40 13 . 18 14 17
2011/12 70 -10 10 50 20 10 . 8 24 7
2012/13 80 10 10 20 50 11 4 5 7 20
2013/14 60 10 20 0 30 8 8 15 . 13
2014/15 180 -10 20 40 130 23 . 14 16 49
2015/16 110 10 30 0 60 14 8 24 1 24
2016/17 170 20 -10 50 100 22 18 . 22 39
2017/18 (P) 170 0 0 50 120 22 3 2 20 44
All ages 0-64 65-74 75-84 85+ All ages 0-64 65-74 75-84 85+
2008-09 70 10 0 30 20 17 19 7 20 18
2009-10 100 0 20 30 50 25 . 31 28 38
2010/11 30 -10 0 0 40 8 . 2 . 37
2011/12 40 10 -10 20 20 10 10 . 15 15
2012/13 70 0 10 0 60 16 7 12 . 42
2013/14 20 0 0 0 10 5 4 5 2 9
2014/15 120 10 10 20 80 28 14 8 15 55
2015/16 60 10 0 30 20 13 7 2 26 10
2016/17 110 0 10 40 60 25 . 10 33 41
2017/18 (P) 140 10 10 50 80 34 12 10 41 49
All ages 0-64 65-74 75-84 85+ All ages 0-64 65-74 75-84 85+
2008-09 40 10 0 -10 40 13 24 . . 36
2009-10 60 10 10 30 20 17 13 10 27 14
2010/11 10 -10 10 0 10 3 . 21 . 9
2011/12 30 10 0 10 10 9 16 . 12 10
2012/13 50 10 0 20 20 15 33 0 18 15
2013/14 40 10 10 20 0 11 13 19 20 .
2014/15 70 0 10 20 30 18 6 22 17 22
2015/16 70 10 10 20 20 20 27 16 19 20
2016/17 70 10 -10 30 40 22 16 . 36 31
2017/18 (P) 60 -10 10 20 50 18 . 8 22 38
Angus
Argyll and Bute
Seasonal increase in mortality in the winter1, 2 Increased Winter Mortality Index3, 4
Seasonal increase in mortality in the winter1, 2 Increased Winter Mortality Index3, 4
Aberdeen City
Seasonal increase in mortality in the winter1, 2 Increased Winter Mortality Index3, 4
Seasonal increase in mortality in the winter1, 2 Increased Winter Mortality Index3, 4
Aberdeenshire
26 © Crown Copyright 2018
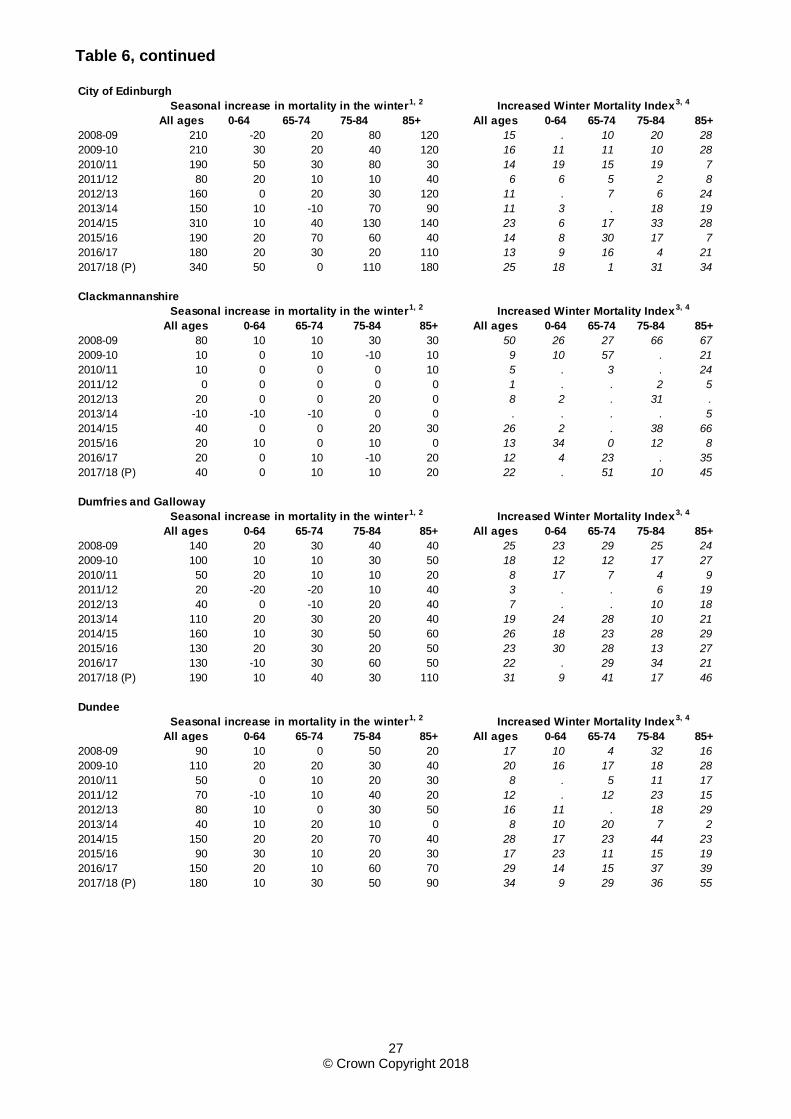
Table 6, continued
All ages 0-64 65-74 75-84 85+ All ages 0-64 65-74 75-84 85+
2008-09 210 -20 20 80 120 15 . 10 20 28
2009-10 210 30 20 40 120 16 11 11 10 28
2010/11 190 50 30 80 30 14 19 15 19 7
2011/12 80 20 10 10 40 6 6 5 2 8
2012/13 160 0 20 30 120 11 . 7 6 24
2013/14 150 10 -10 70 90 11 3 . 18 19
2014/15 310 10 40 130 140 23 6 17 33 28
2015/16 190 20 70 60 40 14 8 30 17 7
2016/17 180 20 30 20 110 13 9 16 4 21
2017/18 (P) 340 50 0 110 180 25 18 1 31 34
All ages 0-64 65-74 75-84 85+ All ages 0-64 65-74 75-84 85+
2008-09 80 10 10 30 30 50 26 27 66 67
2009-10 10 0 10 -10 10 9 10 57 . 21
2010/11 10 0 0 0 10 5 . 3 . 24
2011/12 0 0 0 0 0 1 . . 2 5
2012/13 20 0 0 20 0 8 2 . 31 .
2013/14 -10 -10 -10 0 0 . . . . 5
2014/15 40 0 0 20 30 26 2 . 38 66
2015/16 20 10 0 10 0 13 34 0 12 8
2016/17 20 0 10 -10 20 12 4 23 . 35
2017/18 (P) 40 0 10 10 20 22 . 51 10 45
All ages 0-64 65-74 75-84 85+ All ages 0-64 65-74 75-84 85+
2008-09 140 20 30 40 40 25 23 29 25 24
2009-10 100 10 10 30 50 18 12 12 17 27
2010/11 50 20 10 10 20 8 17 7 4 9
2011/12 20 -20 -20 10 40 3 . . 6 19
2012/13 40 0 -10 20 40 7 . . 10 18
2013/14 110 20 30 20 40 19 24 28 10 21
2014/15 160 10 30 50 60 26 18 23 28 29
2015/16 130 20 30 20 50 23 30 28 13 27
2016/17 130 -10 30 60 50 22 . 29 34 21
2017/18 (P) 190 10 40 30 110 31 9 41 17 46
All ages 0-64 65-74 75-84 85+ All ages 0-64 65-74 75-84 85+
2008-09 90 10 0 50 20 17 10 4 32 16
2009-10 110 20 20 30 40 20 16 17 18 28
2010/11 50 0 10 20 30 8 . 5 11 17
2011/12 70 -10 10 40 20 12 . 12 23 15
2012/13 80 10 0 30 50 16 11 . 18 29
2013/14 40 10 20 10 0 8 10 20 7 2
2014/15 150 20 20 70 40 28 17 23 44 23
2015/16 90 30 10 20 30 17 23 11 15 19
2016/17 150 20 10 60 70 29 14 15 37 39
2017/18 (P) 180 10 30 50 90 34 9 29 36 55
Seasonal increase in mortality in the winter1, 2 Increased Winter Mortality Index3, 4
Seasonal increase in mortality in the winter1, 2
Increased Winter Mortality Index3, 4
Increased Winter Mortality Index3, 4
Clackmannanshire
Seasonal increase in mortality in the winter1, 2 Increased Winter Mortality Index3, 4
Dundee
Seasonal increase in mortality in the winter1, 2
City of Edinburgh
Dumfries and Galloway
27 © Crown Copyright 2018
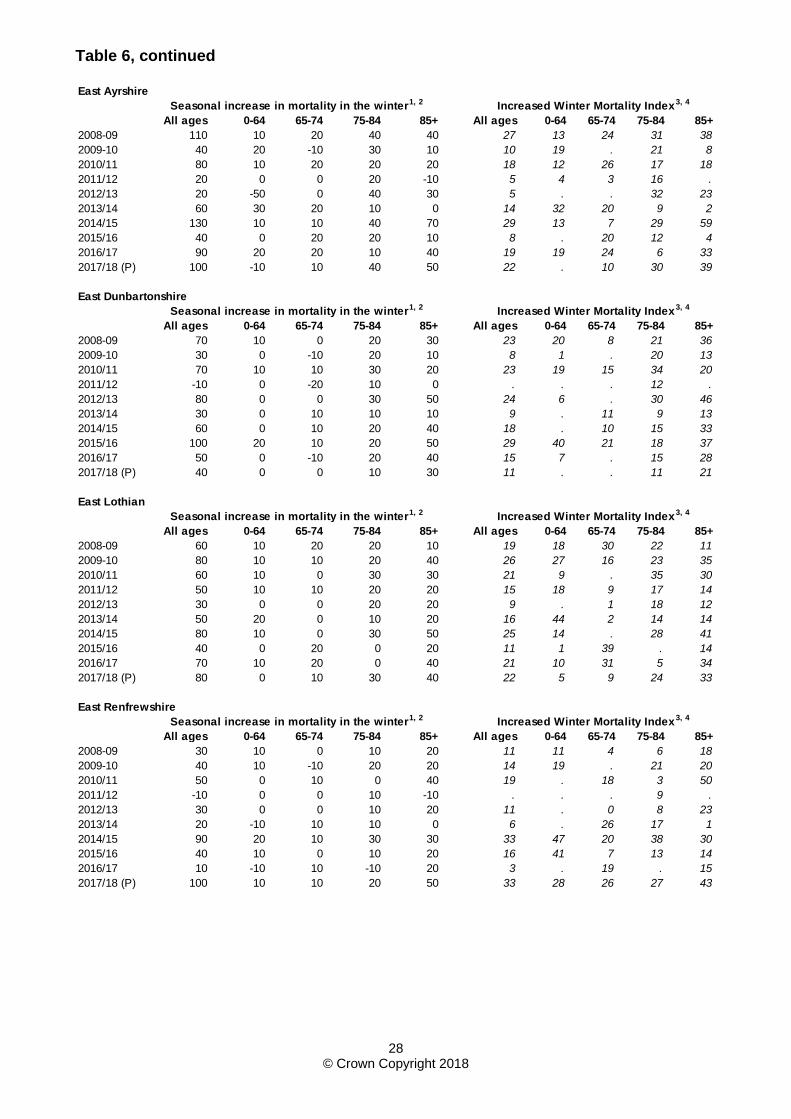
Table 6, continued
East Ayrshire
All ages 0-64 65-74 75-84 85+ All ages 0-64 65-74 75-84 85+
2008-09 110 10 20 40 40 27 13 24 31 38
2009-10 40 20 -10 30 10 10 19 . 21 8
2010/11 80 10 20 20 20 18 12 26 17 18
2011/12 20 0 0 20 -10 5 4 3 16 .
2012/13 20 -50 0 40 30 5 . . 32 23
2013/14 60 30 20 10 0 14 32 20 9 2
2014/15 130 10 10 40 70 29 13 7 29 59
2015/16 40 0 20 20 10 8 . 20 12 4
2016/17 90 20 20 10 40 19 19 24 6 33
2017/18 (P) 100 -10 10 40 50 22 . 10 30 39
All ages 0-64 65-74 75-84 85+ All ages 0-64 65-74 75-84 85+
2008-09 70 10 0 20 30 23 20 8 21 36
2009-10 30 0 -10 20 10 8 1 . 20 13
2010/11 70 10 10 30 20 23 19 15 34 20
2011/12 -10 0 -20 10 0 . . . 12 .
2012/13 80 0 0 30 50 24 6 . 30 46
2013/14 30 0 10 10 10 9 . 11 9 13
2014/15 60 0 10 20 40 18 . 10 15 33
2015/16 100 20 10 20 50 29 40 21 18 37
2016/17 50 0 -10 20 40 15 7 . 15 28
2017/18 (P) 40 0 0 10 30 11 . . 11 21
East Lothian
All ages 0-64 65-74 75-84 85+ All ages 0-64 65-74 75-84 85+
2008-09 60 10 20 20 10 19 18 30 22 11
2009-10 80 10 10 20 40 26 27 16 23 35
2010/11 60 10 0 30 30 21 9 . 35 30
2011/12 50 10 10 20 20 15 18 9 17 14
2012/13 30 0 0 20 20 9 . 1 18 12
2013/14 50 20 0 10 20 16 44 2 14 14
2014/15 80 10 0 30 50 25 14 . 28 41
2015/16 40 0 20 0 20 11 1 39 . 14
2016/17 70 10 20 0 40 21 10 31 5 34
2017/18 (P) 80 0 10 30 40 22 5 9 24 33
All ages 0-64 65-74 75-84 85+ All ages 0-64 65-74 75-84 85+
2008-09 30 10 0 10 20 11 11 4 6 18
2009-10 40 10 -10 20 20 14 19 . 21 20
2010/11 50 0 10 0 40 19 . 18 3 50
2011/12 -10 0 0 10 -10 . . . 9 .
2012/13 30 0 0 10 20 11 . 0 8 23
2013/14 20 -10 10 10 0 6 . 26 17 1
2014/15 90 20 10 30 30 33 47 20 38 30
2015/16 40 10 0 10 20 16 41 7 13 14
2016/17 10 -10 10 -10 20 3 . 19 . 15
2017/18 (P) 100 10 10 20 50 33 28 26 27 43
Seasonal increase in mortality in the winter1, 2 Increased Winter Mortality Index3, 4
Seasonal increase in mortality in the winter1, 2 Increased Winter Mortality Index3, 4
Increased Winter Mortality Index3, 4
Seasonal increase in mortality in the winter1, 2 Increased Winter Mortality Index3, 4
Seasonal increase in mortality in the winter1, 2
East Dunbartonshire
East Renfrewshire
28 © Crown Copyright 2018
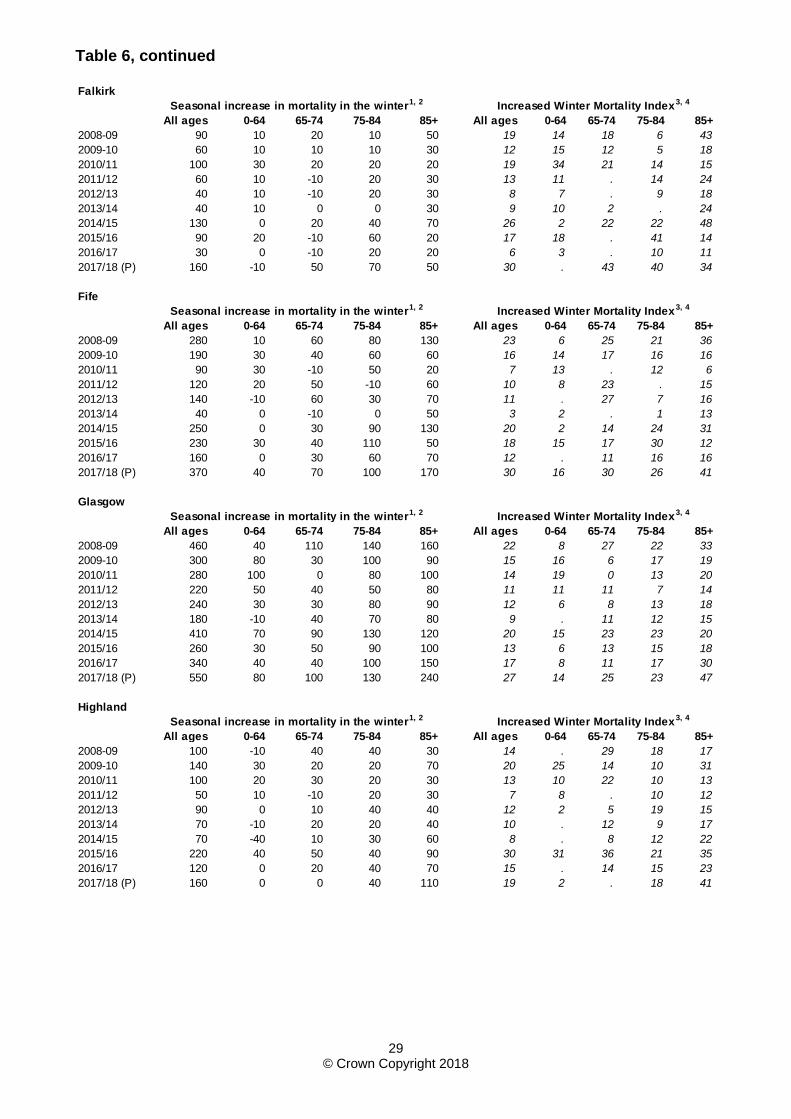
Table 6, continued
All ages 0-64 65-74 75-84 85+ All ages 0-64 65-74 75-84 85+
2008-09 90 10 20 10 50 19 14 18 6 43
2009-10 60 10 10 10 30 12 15 12 5 18
2010/11 100 30 20 20 20 19 34 21 14 15
2011/12 60 10 -10 20 30 13 11 . 14 24
2012/13 40 10 -10 20 30 8 7 . 9 18
2013/14 40 10 0 0 30 9 10 2 . 24
2014/15 130 0 20 40 70 26 2 22 22 48
2015/16 90 20 -10 60 20 17 18 . 41 14
2016/17 30 0 -10 20 20 6 3 . 10 11
2017/18 (P) 160 -10 50 70 50 30 . 43 40 34
All ages 0-64 65-74 75-84 85+ All ages 0-64 65-74 75-84 85+
2008-09 280 10 60 80 130 23 6 25 21 36
2009-10 190 30 40 60 60 16 14 17 16 16
2010/11 90 30 -10 50 20 7 13 . 12 6
2011/12 120 20 50 -10 60 10 8 23 . 15
2012/13 140 -10 60 30 70 11 . 27 7 16
2013/14 40 0 -10 0 50 3 2 . 1 13
2014/15 250 0 30 90 130 20 2 14 24 31
2015/16 230 30 40 110 50 18 15 17 30 12
2016/17 160 0 30 60 70 12 . 11 16 16
2017/18 (P) 370 40 70 100 170 30 16 30 26 41
Glasgow
All ages 0-64 65-74 75-84 85+ All ages 0-64 65-74 75-84 85+
2008-09 460 40 110 140 160 22 8 27 22 33
2009-10 300 80 30 100 90 15 16 6 17 19
2010/11 280 100 0 80 100 14 19 0 13 20
2011/12 220 50 40 50 80 11 11 11 7 14
2012/13 240 30 30 80 90 12 6 8 13 18
2013/14 180 -10 40 70 80 9 . 11 12 15
2014/15 410 70 90 130 120 20 15 23 23 20
2015/16 260 30 50 90 100 13 6 13 15 18
2016/17 340 40 40 100 150 17 8 11 17 30
2017/18 (P) 550 80 100 130 240 27 14 25 23 47
All ages 0-64 65-74 75-84 85+ All ages 0-64 65-74 75-84 85+
2008-09 100 -10 40 40 30 14 . 29 18 17
2009-10 140 30 20 20 70 20 25 14 10 31
2010/11 100 20 30 20 30 13 10 22 10 13
2011/12 50 10 -10 20 30 7 8 . 10 12
2012/13 90 0 10 40 40 12 2 5 19 15
2013/14 70 -10 20 20 40 10 . 12 9 17
2014/15 70 -40 10 30 60 8 . 8 12 22
2015/16 220 40 50 40 90 30 31 36 21 35
2016/17 120 0 20 40 70 15 . 14 15 23
2017/18 (P) 160 0 0 40 110 19 2 . 18 41
Fife
Highland
Increased Winter Mortality Index3, 4
Seasonal increase in mortality in the winter1, 2 Increased Winter Mortality Index3, 4
Seasonal increase in mortality in the winter1, 2 Increased Winter Mortality Index3, 4
Seasonal increase in mortality in the winter1, 2
Falkirk
Seasonal increase in mortality in the winter1, 2 Increased Winter Mortality Index3, 4
29 © Crown Copyright 2018
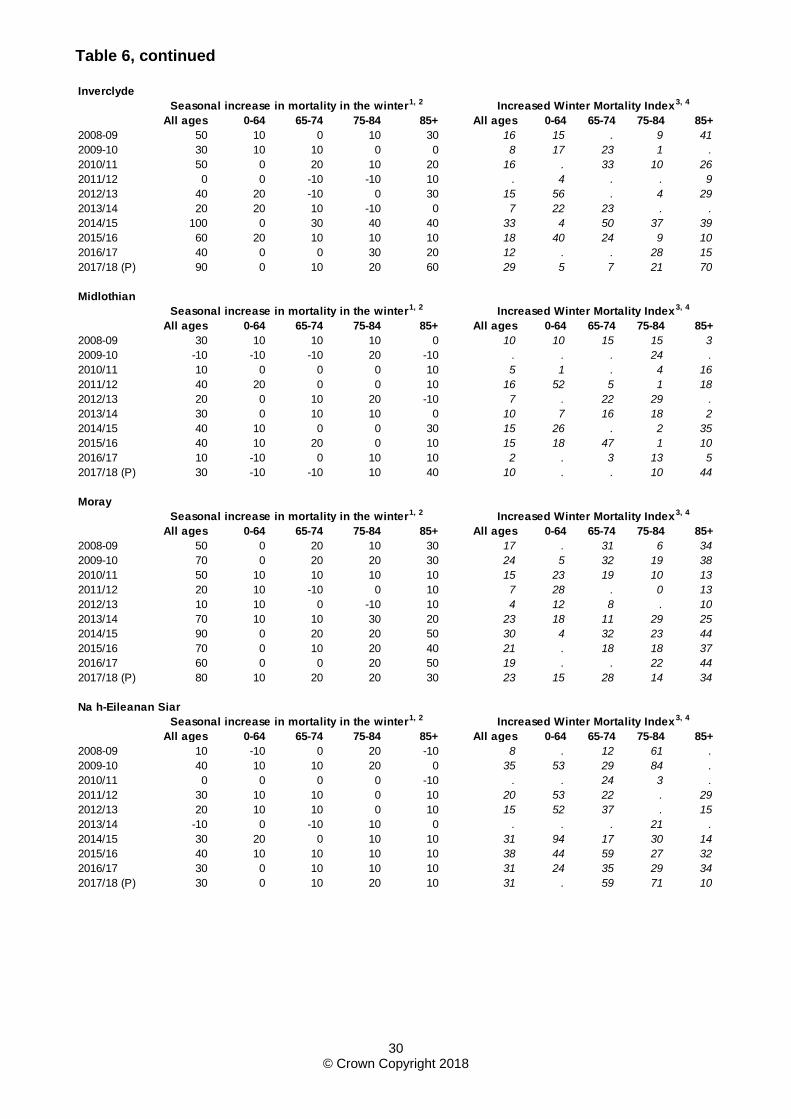
Table 6, continued
Inverclyde
All ages 0-64 65-74 75-84 85+ All ages 0-64 65-74 75-84 85+
2008-09 50 10 0 10 30 16 15 . 9 41
2009-10 30 10 10 0 0 8 17 23 1 .
2010/11 50 0 20 10 20 16 . 33 10 26
2011/12 0 0 -10 -10 10 . 4 . . 9
2012/13 40 20 -10 0 30 15 56 . 4 29
2013/14 20 20 10 -10 0 7 22 23 . .
2014/15 100 0 30 40 40 33 4 50 37 39
2015/16 60 20 10 10 10 18 40 24 9 10
2016/17 40 0 0 30 20 12 . . 28 15
2017/18 (P) 90 0 10 20 60 29 5 7 21 70
Midlothian
All ages 0-64 65-74 75-84 85+ All ages 0-64 65-74 75-84 85+
2008-09 30 10 10 10 0 10 10 15 15 3
2009-10 -10 -10 -10 20 -10 . . . 24 .
2010/11 10 0 0 0 10 5 1 . 4 16
2011/12 40 20 0 0 10 16 52 5 1 18
2012/13 20 0 10 20 -10 7 . 22 29 .
2013/14 30 0 10 10 0 10 7 16 18 2
2014/15 40 10 0 0 30 15 26 . 2 35
2015/16 40 10 20 0 10 15 18 47 1 10
2016/17 10 -10 0 10 10 2 . 3 13 5
2017/18 (P) 30 -10 -10 10 40 10 . . 10 44
Moray
All ages 0-64 65-74 75-84 85+ All ages 0-64 65-74 75-84 85+
2008-09 50 0 20 10 30 17 . 31 6 34
2009-10 70 0 20 20 30 24 5 32 19 38
2010/11 50 10 10 10 10 15 23 19 10 13
2011/12 20 10 -10 0 10 7 28 . 0 13
2012/13 10 10 0 -10 10 4 12 8 . 10
2013/14 70 10 10 30 20 23 18 11 29 25
2014/15 90 0 20 20 50 30 4 32 23 44
2015/16 70 0 10 20 40 21 . 18 18 37
2016/17 60 0 0 20 50 19 . . 22 44
2017/18 (P) 80 10 20 20 30 23 15 28 14 34
All ages 0-64 65-74 75-84 85+ All ages 0-64 65-74 75-84 85+
2008-09 10 -10 0 20 -10 8 . 12 61 .
2009-10 40 10 10 20 0 35 53 29 84 .
2010/11 0 0 0 0 -10 . . 24 3 .
2011/12 30 10 10 0 10 20 53 22 . 29
2012/13 20 10 10 0 10 15 52 37 . 15
2013/14 -10 0 -10 10 0 . . . 21 .
2014/15 30 20 0 10 10 31 94 17 30 14
2015/16 40 10 10 10 10 38 44 59 27 32
2016/17 30 0 10 10 10 31 24 35 29 34
2017/18 (P) 30 0 10 20 10 31 . 59 71 10
Increased Winter Mortality Index3, 4Seasonal increase in mortality in the winter1, 2
Seasonal increase in mortality in the winter1, 2
Seasonal increase in mortality in the winter1, 2 Increased Winter Mortality Index3, 4
Seasonal increase in mortality in the winter1, 2 Increased Winter Mortality Index3, 4
Increased Winter Mortality Index3, 4
Na h-Eileanan Siar
30 © Crown Copyright 2018
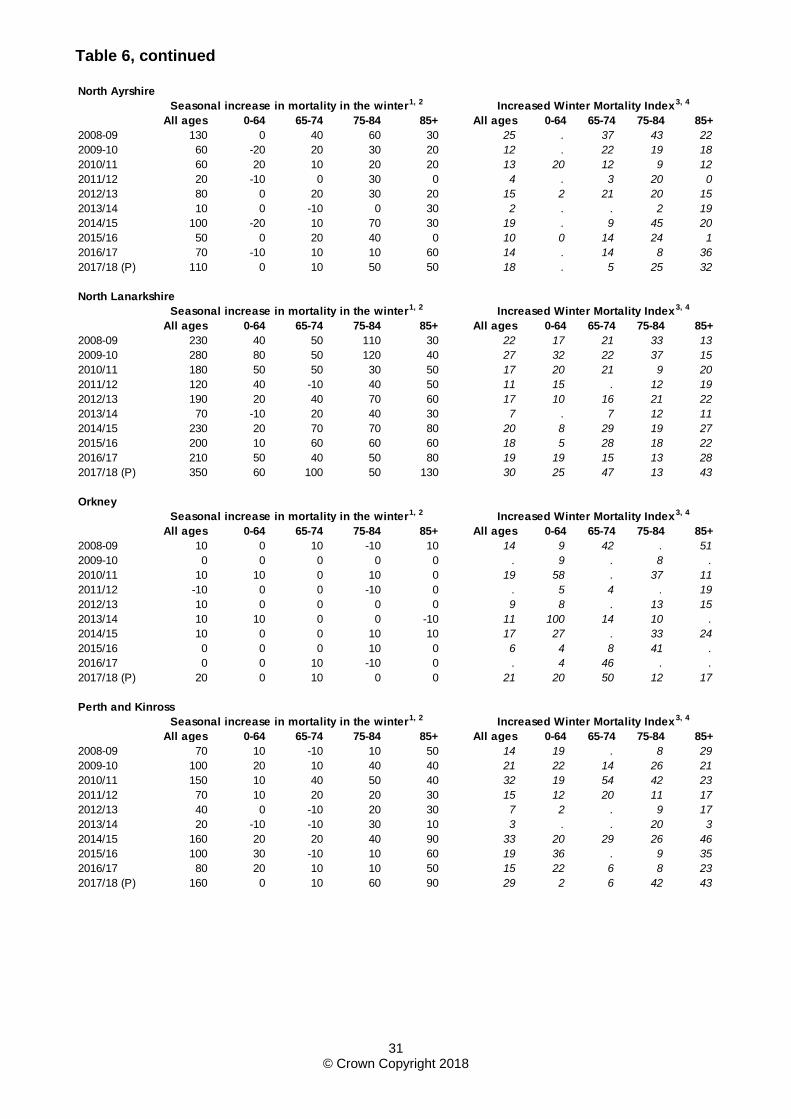
Table 6, continued
All ages 0-64 65-74 75-84 85+ All ages 0-64 65-74 75-84 85+
2008-09 130 0 40 60 30 25 . 37 43 22
2009-10 60 -20 20 30 20 12 . 22 19 18
2010/11 60 20 10 20 20 13 20 12 9 12
2011/12 20 -10 0 30 0 4 . 3 20 0
2012/13 80 0 20 30 20 15 2 21 20 15
2013/14 10 0 -10 0 30 2 . . 2 19
2014/15 100 -20 10 70 30 19 . 9 45 20
2015/16 50 0 20 40 0 10 0 14 24 1
2016/17 70 -10 10 10 60 14 . 14 8 36
2017/18 (P) 110 0 10 50 50 18 . 5 25 32
All ages 0-64 65-74 75-84 85+ All ages 0-64 65-74 75-84 85+
2008-09 230 40 50 110 30 22 17 21 33 13
2009-10 280 80 50 120 40 27 32 22 37 15
2010/11 180 50 50 30 50 17 20 21 9 20
2011/12 120 40 -10 40 50 11 15 . 12 19
2012/13 190 20 40 70 60 17 10 16 21 22
2013/14 70 -10 20 40 30 7 . 7 12 11
2014/15 230 20 70 70 80 20 8 29 19 27
2015/16 200 10 60 60 60 18 5 28 18 22
2016/17 210 50 40 50 80 19 19 15 13 28
2017/18 (P) 350 60 100 50 130 30 25 47 13 43
Orkney
All ages 0-64 65-74 75-84 85+ All ages 0-64 65-74 75-84 85+
2008-09 10 0 10 -10 10 14 9 42 . 51
2009-10 0 0 0 0 0 . 9 . 8 .
2010/11 10 10 0 10 0 19 58 . 37 11
2011/12 -10 0 0 -10 0 . 5 4 . 19
2012/13 10 0 0 0 0 9 8 . 13 15
2013/14 10 10 0 0 -10 11 100 14 10 .
2014/15 10 0 0 10 10 17 27 . 33 24
2015/16 0 0 0 10 0 6 4 8 41 .
2016/17 0 0 10 -10 0 . 4 46 . .
2017/18 (P) 20 0 10 0 0 21 20 50 12 17
All ages 0-64 65-74 75-84 85+ All ages 0-64 65-74 75-84 85+
2008-09 70 10 -10 10 50 14 19 . 8 29
2009-10 100 20 10 40 40 21 22 14 26 21
2010/11 150 10 40 50 40 32 19 54 42 23
2011/12 70 10 20 20 30 15 12 20 11 17
2012/13 40 0 -10 20 30 7 2 . 9 17
2013/14 20 -10 -10 30 10 3 . . 20 3
2014/15 160 20 20 40 90 33 20 29 26 46
2015/16 100 30 -10 10 60 19 36 . 9 35
2016/17 80 20 10 10 50 15 22 6 8 23
2017/18 (P) 160 0 10 60 90 29 2 6 42 43
North Ayrshire
Seasonal increase in mortality in the winter1, 2
Seasonal increase in mortality in the winter1, 2
Increased Winter Mortality Index3, 4
Seasonal increase in mortality in the winter1, 2
Increased Winter Mortality Index3, 4
Increased Winter Mortality Index3, 4
Increased Winter Mortality Index3, 4
Seasonal increase in mortality in the winter1, 2
North Lanarkshire
Perth and Kinross
31 © Crown Copyright 2018
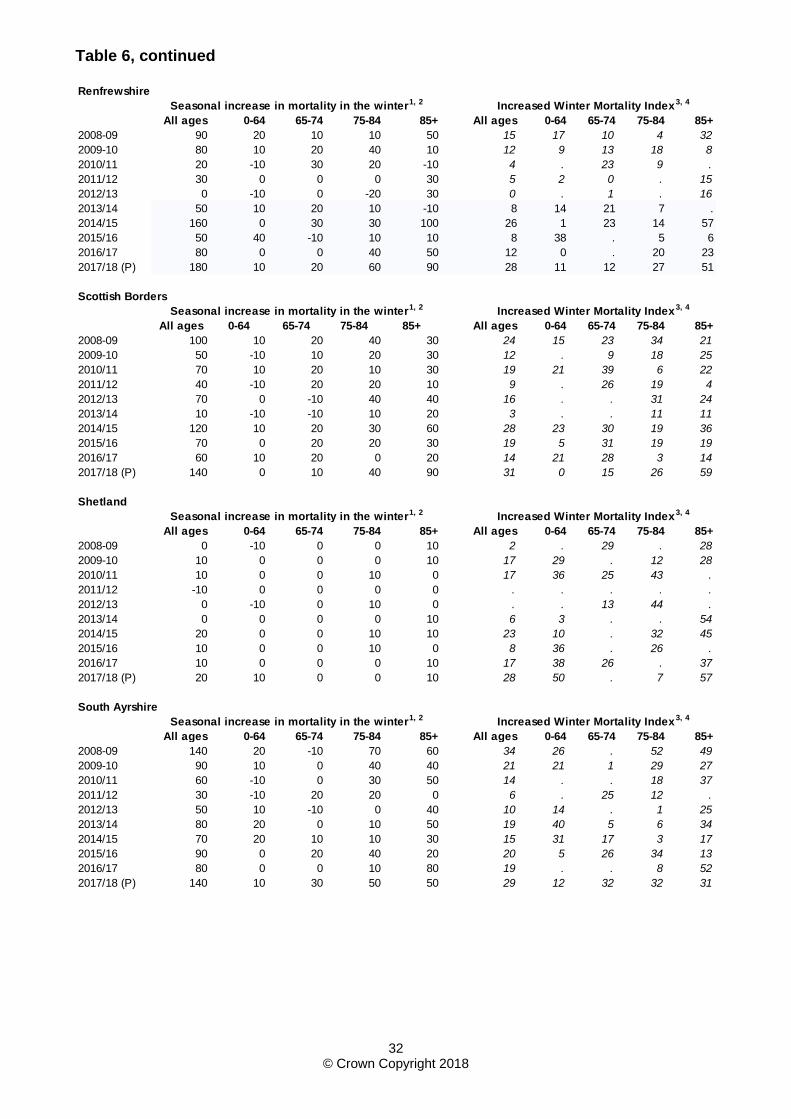
Table 6, continued
All ages 0-64 65-74 75-84 85+ All ages 0-64 65-74 75-84 85+
2008-09 90 20 10 10 50 15 17 10 4 32
2009-10 80 10 20 40 10 12 9 13 18 8
2010/11 20 -10 30 20 -10 4 . 23 9 .
2011/12 30 0 0 0 30 5 2 0 . 15
2012/13 0 -10 0 -20 30 0 . 1 . 16
2013/14 50 10 20 10 -10 8 14 21 7 .
2014/15 160 0 30 30 100 26 1 23 14 57
2015/16 50 40 -10 10 10 8 38 . 5 6
2016/17 80 0 0 40 50 12 0 . 20 23
2017/18 (P) 180 10 20 60 90 28 11 12 27 51
All ages 0-64 65-74 75-84 85+ All ages 0-64 65-74 75-84 85+
2008-09 100 10 20 40 30 24 15 23 34 21
2009-10 50 -10 10 20 30 12 . 9 18 25
2010/11 70 10 20 10 30 19 21 39 6 22
2011/12 40 -10 20 20 10 9 . 26 19 4
2012/13 70 0 -10 40 40 16 . . 31 24
2013/14 10 -10 -10 10 20 3 . . 11 11
2014/15 120 10 20 30 60 28 23 30 19 36
2015/16 70 0 20 20 30 19 5 31 19 19
2016/17 60 10 20 0 20 14 21 28 3 14
2017/18 (P) 140 0 10 40 90 31 0 15 26 59
Shetland
All ages 0-64 65-74 75-84 85+ All ages 0-64 65-74 75-84 85+
2008-09 0 -10 0 0 10 2 . 29 . 28
2009-10 10 0 0 0 10 17 29 . 12 28
2010/11 10 0 0 10 0 17 36 25 43 .
2011/12 -10 0 0 0 0 . . . . .
2012/13 0 -10 0 10 0 . . 13 44 .
2013/14 0 0 0 0 10 6 3 . . 54
2014/15 20 0 0 10 10 23 10 . 32 45
2015/16 10 0 0 10 0 8 36 . 26 .
2016/17 10 0 0 0 10 17 38 26 . 37
2017/18 (P) 20 10 0 0 10 28 50 . 7 57
All ages 0-64 65-74 75-84 85+ All ages 0-64 65-74 75-84 85+
2008-09 140 20 -10 70 60 34 26 . 52 49
2009-10 90 10 0 40 40 21 21 1 29 27
2010/11 60 -10 0 30 50 14 . . 18 37
2011/12 30 -10 20 20 0 6 . 25 12 .
2012/13 50 10 -10 0 40 10 14 . 1 25
2013/14 80 20 0 10 50 19 40 5 6 34
2014/15 70 20 10 10 30 15 31 17 3 17
2015/16 90 0 20 40 20 20 5 26 34 13
2016/17 80 0 0 10 80 19 . . 8 52
2017/18 (P) 140 10 30 50 50 29 12 32 32 31
Increased Winter Mortality Index3, 4
Seasonal increase in mortality in the winter1, 2 Increased Winter Mortality Index3, 4
Increased Winter Mortality Index3, 4
Seasonal increase in mortality in the winter1, 2
South Ayrshire
Seasonal increase in mortality in the winter1, 2
Scottish Borders
Seasonal increase in mortality in the winter1, 2 Increased Winter Mortality Index3, 4
Renfrewshire
32 © Crown Copyright 2018
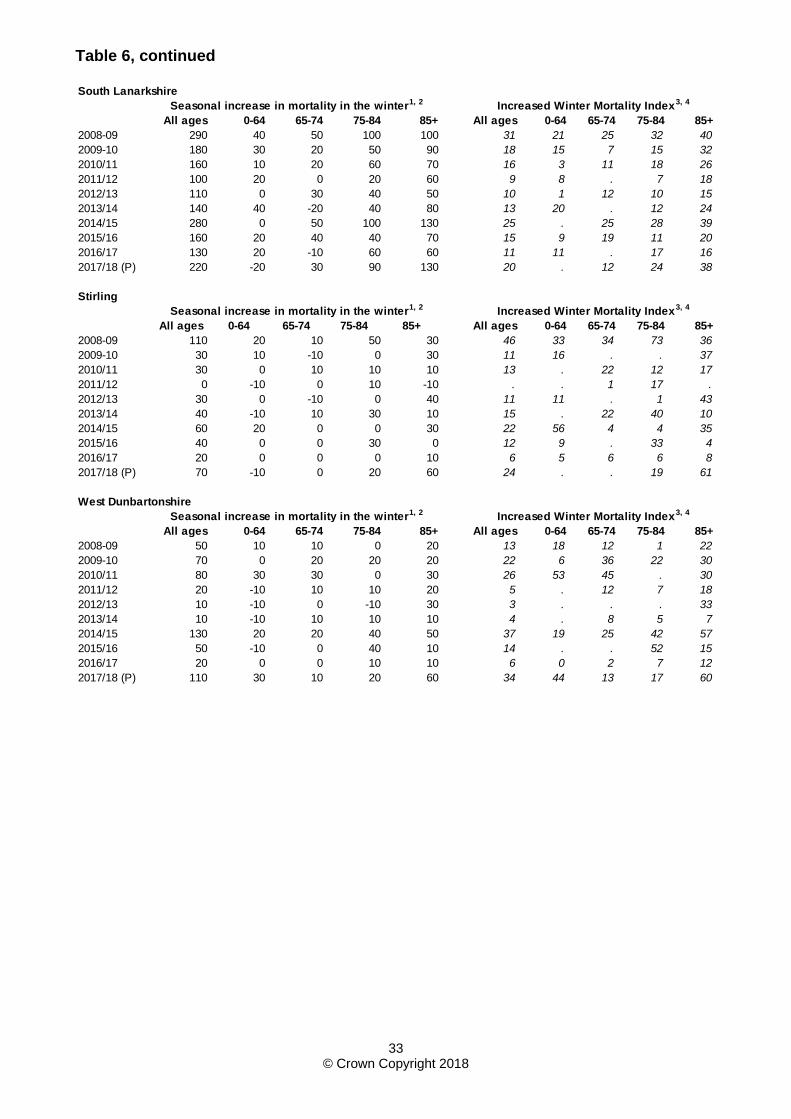
Table 6, continued
All ages 0-64 65-74 75-84 85+ All ages 0-64 65-74 75-84 85+
2008-09 290 40 50 100 100 31 21 25 32 40
2009-10 180 30 20 50 90 18 15 7 15 32
2010/11 160 10 20 60 70 16 3 11 18 26
2011/12 100 20 0 20 60 9 8 . 7 18
2012/13 110 0 30 40 50 10 1 12 10 15
2013/14 140 40 -20 40 80 13 20 . 12 24
2014/15 280 0 50 100 130 25 . 25 28 39
2015/16 160 20 40 40 70 15 9 19 11 20
2016/17 130 20 -10 60 60 11 11 . 17 16
2017/18 (P) 220 -20 30 90 130 20 . 12 24 38
Stirling
All ages 0-64 65-74 75-84 85+ All ages 0-64 65-74 75-84 85+
2008-09 110 20 10 50 30 46 33 34 73 36
2009-10 30 10 -10 0 30 11 16 . . 37
2010/11 30 0 10 10 10 13 . 22 12 17
2011/12 0 -10 0 10 -10 . . 1 17 .
2012/13 30 0 -10 0 40 11 11 . 1 43
2013/14 40 -10 10 30 10 15 . 22 40 10
2014/15 60 20 0 0 30 22 56 4 4 35
2015/16 40 0 0 30 0 12 9 . 33 4
2016/17 20 0 0 0 10 6 5 6 6 8
2017/18 (P) 70 -10 0 20 60 24 . . 19 61
All ages 0-64 65-74 75-84 85+ All ages 0-64 65-74 75-84 85+
2008-09 50 10 10 0 20 13 18 12 1 22
2009-10 70 0 20 20 20 22 6 36 22 30
2010/11 80 30 30 0 30 26 53 45 . 30
2011/12 20 -10 10 10 20 5 . 12 7 18
2012/13 10 -10 0 -10 30 3 . . . 33
2013/14 10 -10 10 10 10 4 . 8 5 7
2014/15 130 20 20 40 50 37 19 25 42 57
2015/16 50 -10 0 40 10 14 . . 52 15
2016/17 20 0 0 10 10 6 0 2 7 12
2017/18 (P) 110 30 10 20 60 34 44 13 17 60
Increased Winter Mortality Index3, 4
Seasonal increase in mortality in the winter1, 2
Seasonal increase in mortality in the winter1, 2
South Lanarkshire
Increased Winter Mortality Index3, 4
Increased Winter Mortality Index3, 4Seasonal increase in mortality in the winter1, 2
West Dunbartonshire
33 © Crown Copyright 2018
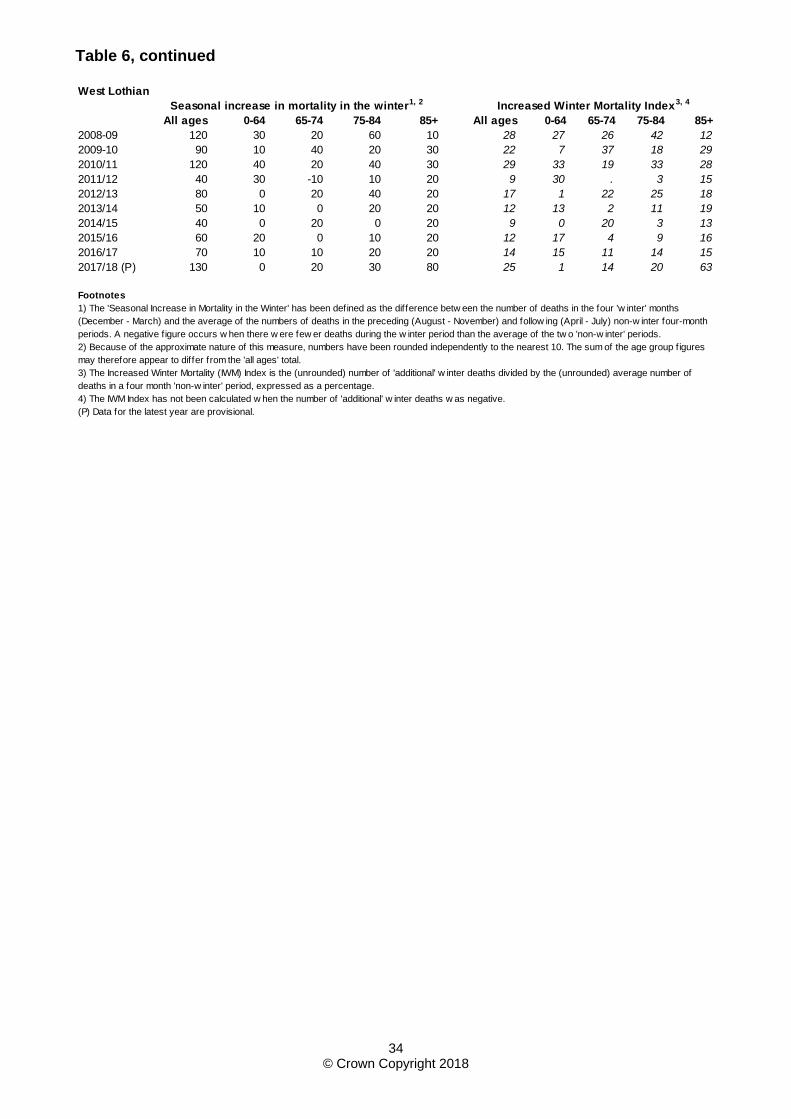
Table 6, continued
All ages 0-64 65-74 75-84 85+ All ages 0-64 65-74 75-84 85+
2008-09 120 30 20 60 10 28 27 26 42 12
2009-10 90 10 40 20 30 22 7 37 18 29
2010/11 120 40 20 40 30 29 33 19 33 28
2011/12 40 30 -10 10 20 9 30 . 3 15
2012/13 80 0 20 40 20 17 1 22 25 18
2013/14 50 10 0 20 20 12 13 2 11 19
2014/15 40 0 20 0 20 9 0 20 3 13
2015/16 60 20 0 10 20 12 17 4 9 16
2016/17 70 10 10 20 20 14 15 11 14 15
2017/18 (P) 130 0 20 30 80 25 1 14 20 63
Footnotes
Seasonal increase in mortality in the winter1, 2
(P) Data for the latest year are provisional.
4) The IWM Index has not been calculated w hen the number of 'additional' w inter deaths w as negative.
West Lothian
Increased Winter Mortality Index3, 4
1) The 'Seasonal Increase in Mortality in the Winter' has been defined as the difference betw een the number of deaths in the four 'w inter' months
(December - March) and the average of the numbers of deaths in the preceding (August - November) and follow ing (April - July) non-w inter four-month
periods. A negative f igure occurs w hen there w ere few er deaths during the w inter period than the average of the tw o 'non-w inter' periods.
2) Because of the approximate nature of this measure, numbers have been rounded independently to the nearest 10. The sum of the age group figures
may therefore appear to differ from the 'all ages' total.
3) The Increased Winter Mortality (IWM) Index is the (unrounded) number of 'additional' w inter deaths divided by the (unrounded) average number of
deaths in a four month 'non-w inter' period, expressed as a percentage.
34 © Crown Copyright 2018
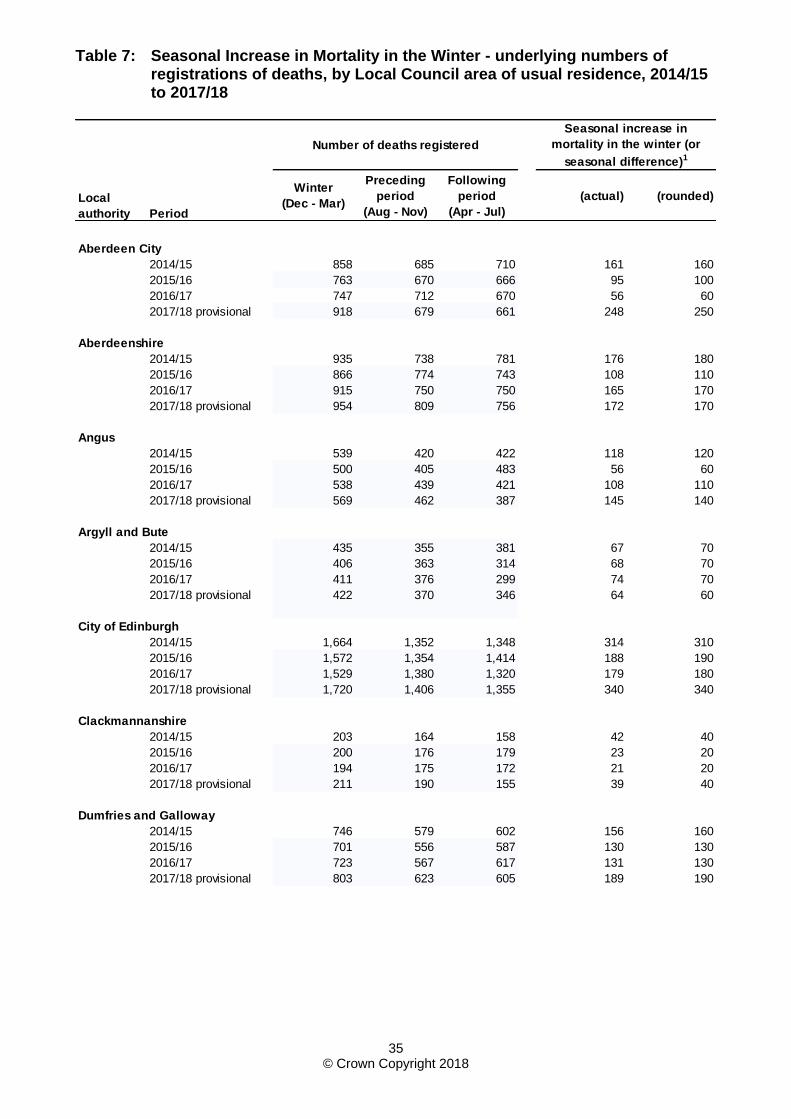
Table 7: Seasonal Increase in Mortality in the Winter - underlying numbers of registrations of deaths, by Local Council area of usual residence, 2014/15 to 2017/18
Local
authority Period
Winter
(Dec - Mar)
Preceding
period
(Aug - Nov)
Following
period
(Apr - Jul)
(actual) (rounded)
Number of deaths registered
Seasonal increase in
mortality in the winter (or
seasonal difference)1
2014/15 858 685 710 161 160
2015/16 763 670 666 95 100
2016/17 747 712 670 56 60
2017/18 provisional 918 679 661 248 250
2014/15 935 738 781 176 180
2015/16 866 774 743 108 110
2016/17 915 750 750 165 170
2017/18 provisional 954 809 756 172 170
2014/15 539 420 422 118 120
2015/16 500 405 483 56 60
2016/17 538 439 421 108 110
2017/18 provisional 569 462 387 145 140
2014/15 435 355 381 67 70
2015/16 406 363 314 68 70
2016/17 411 376 299 74 70
2017/18 provisional 422 370 346 64 60
2014/15 1,664 1,352 1,348 314 310
2015/16 1,572 1,354 1,414 188 190
2016/17 1,529 1,380 1,320 179 180
2017/18 provisional 1,720 1,406 1,355 340 340
2014/15 203 164 158 42 40
2015/16 200 176 179 23 20
2016/17 194 175 172 21 20
2017/18 provisional 211 190 155 39 40
2014/15 746 579 602 156 160
2015/16 701 556 587 130 130
2016/17 723 567 617 131 130
2017/18 provisional 803 623 605 189 190
Aberdeenshire
Argyll and Bute
Dumfries and Galloway
City of Edinburgh
Aberdeen City
Angus
Clackmannanshire
35 © Crown Copyright 2018
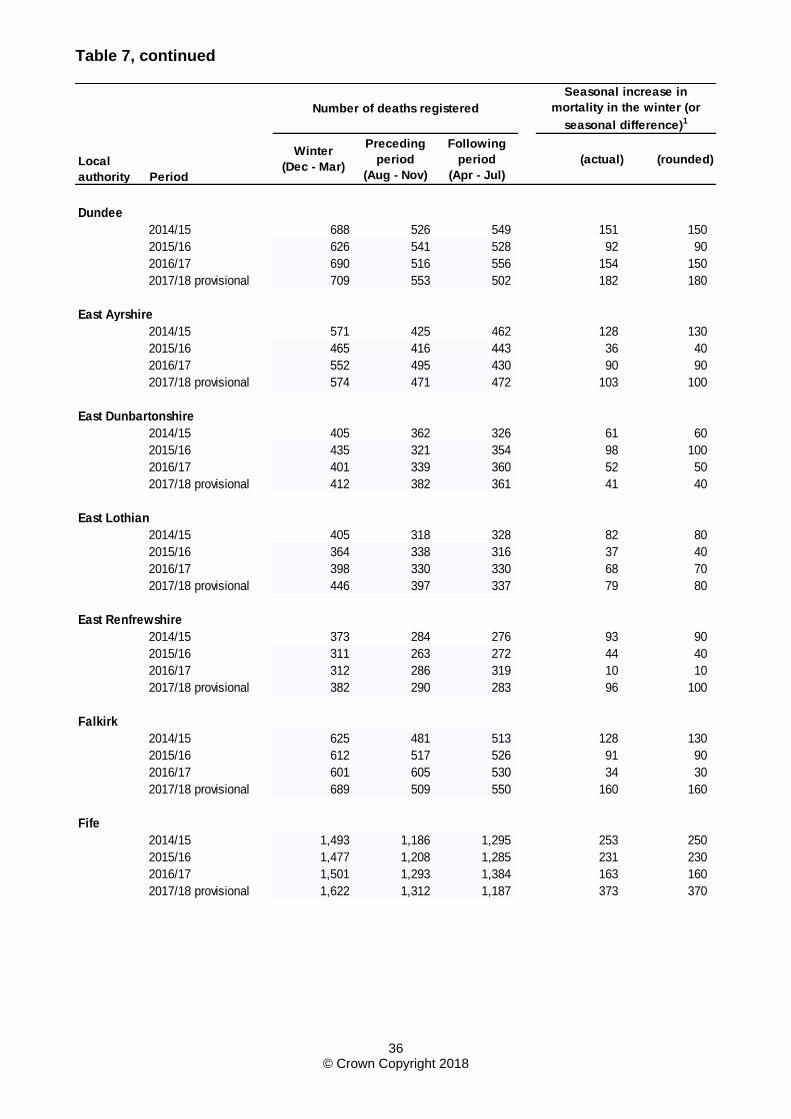
Table 7, continued
Local
authority Period
Winter
(Dec - Mar)
Preceding
period
(Aug - Nov)
Following
period
(Apr - Jul)
(actual) (rounded)
Number of deaths registered
Seasonal increase in
mortality in the winter (or
seasonal difference)1
2014/15 688 526 549 151 150
2015/16 626 541 528 92 90
2016/17 690 516 556 154 150
2017/18 provisional 709 553 502 182 180
2014/15 571 425 462 128 130
2015/16 465 416 443 36 40
2016/17 552 495 430 90 90
2017/18 provisional 574 471 472 103 100
2014/15 405 362 326 61 60
2015/16 435 321 354 98 100
2016/17 401 339 360 52 50
2017/18 provisional 412 382 361 41 40
2014/15 405 318 328 82 80
2015/16 364 338 316 37 40
2016/17 398 330 330 68 70
2017/18 provisional 446 397 337 79 80
2014/15 373 284 276 93 90
2015/16 311 263 272 44 40
2016/17 312 286 319 10 10
2017/18 provisional 382 290 283 96 100
2014/15 625 481 513 128 130
2015/16 612 517 526 91 90
2016/17 601 605 530 34 30
2017/18 provisional 689 509 550 160 160
2014/15 1,493 1,186 1,295 253 250
2015/16 1,477 1,208 1,285 231 230
2016/17 1,501 1,293 1,384 163 160
2017/18 provisional 1,622 1,312 1,187 373 370
Fife
East Ayrshire
East Dunbartonshire
Falkirk
East Lothian
East Renfrewshire
Dundee
36 © Crown Copyright 2018
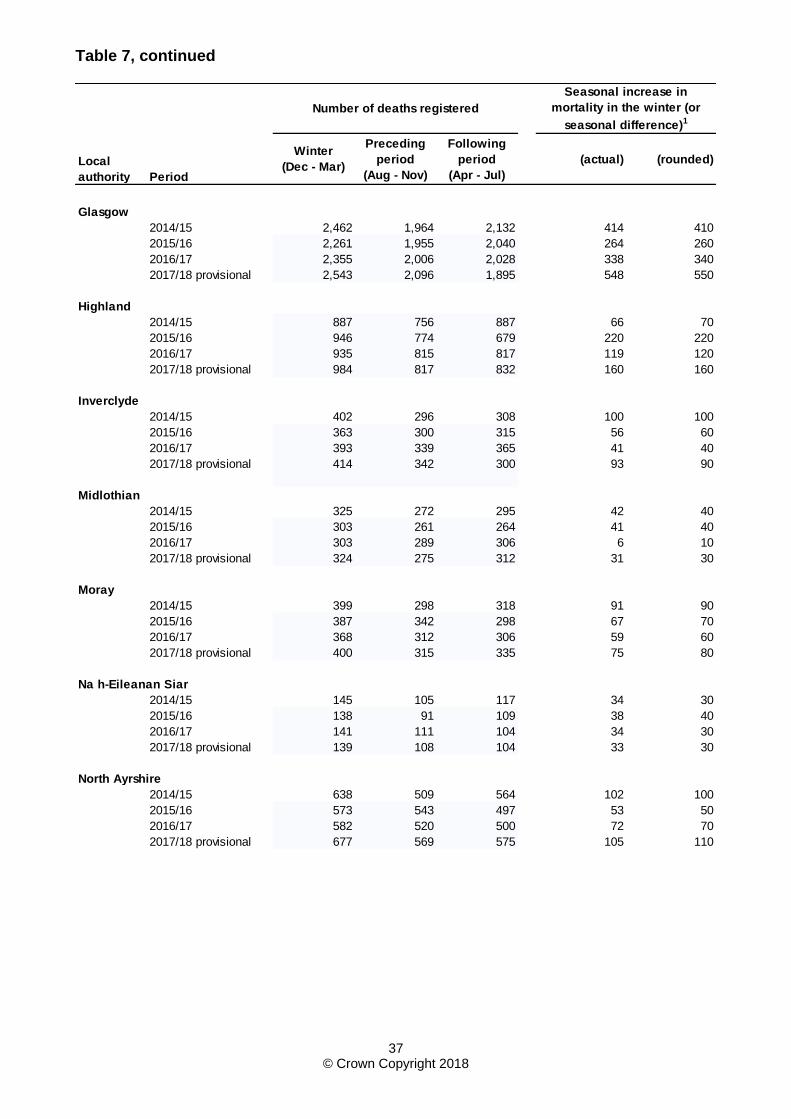
Table 7, continued
Local
authority Period
Winter
(Dec - Mar)
Preceding
period
(Aug - Nov)
Following
period
(Apr - Jul)
(actual) (rounded)
Number of deaths registered
Seasonal increase in
mortality in the winter (or
seasonal difference)1
Glasgow
2014/15 2,462 1,964 2,132 414 410
2015/16 2,261 1,955 2,040 264 260
2016/17 2,355 2,006 2,028 338 340
2017/18 provisional 2,543 2,096 1,895 548 550
2014/15 887 756 887 66 70
2015/16 946 774 679 220 220
2016/17 935 815 817 119 120
2017/18 provisional 984 817 832 160 160
Inverclyde
2014/15 402 296 308 100 100
2015/16 363 300 315 56 60
2016/17 393 339 365 41 40
2017/18 provisional 414 342 300 93 90
2014/15 325 272 295 42 40
2015/16 303 261 264 41 40
2016/17 303 289 306 6 10
2017/18 provisional 324 275 312 31 30
Moray
2014/15 399 298 318 91 90
2015/16 387 342 298 67 70
2016/17 368 312 306 59 60
2017/18 provisional 400 315 335 75 80
2014/15 145 105 117 34 30
2015/16 138 91 109 38 40
2016/17 141 111 104 34 30
2017/18 provisional 139 108 104 33 30
2014/15 638 509 564 102 100
2015/16 573 543 497 53 50
2016/17 582 520 500 72 70
2017/18 provisional 677 569 575 105 110
Highland
Midlothian
North Ayrshire
Na h-Eileanan Siar
37 © Crown Copyright 2018
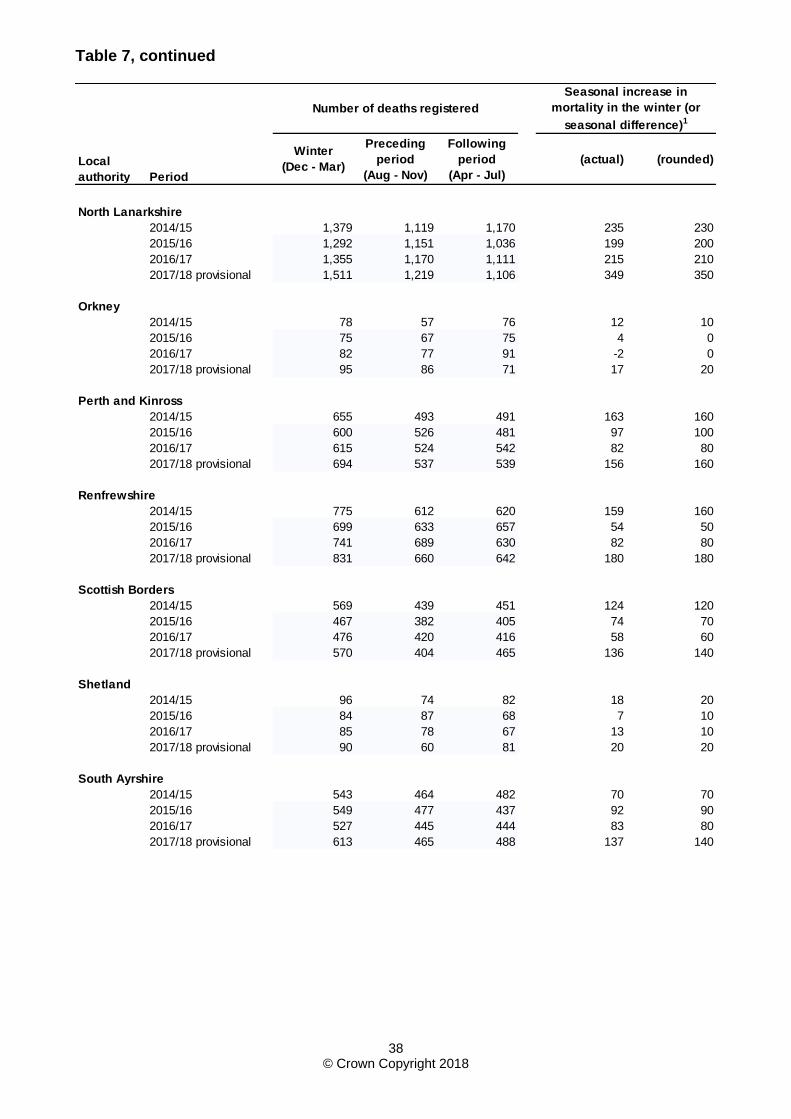
Table 7, continued
Local
authority Period
Winter
(Dec - Mar)
Preceding
period
(Aug - Nov)
Following
period
(Apr - Jul)
(actual) (rounded)
Number of deaths registered
Seasonal increase in
mortality in the winter (or
seasonal difference)1
2014/15 1,379 1,119 1,170 235 230
2015/16 1,292 1,151 1,036 199 200
2016/17 1,355 1,170 1,111 215 210
2017/18 provisional 1,511 1,219 1,106 349 350
Orkney
2014/15 78 57 76 12 10
2015/16 75 67 75 4 0
2016/17 82 77 91 -2 0
2017/18 provisional 95 86 71 17 20
2014/15 655 493 491 163 160
2015/16 600 526 481 97 100
2016/17 615 524 542 82 80
2017/18 provisional 694 537 539 156 160
2014/15 775 612 620 159 160
2015/16 699 633 657 54 50
2016/17 741 689 630 82 80
2017/18 provisional 831 660 642 180 180
2014/15 569 439 451 124 120
2015/16 467 382 405 74 70
2016/17 476 420 416 58 60
2017/18 provisional 570 404 465 136 140
Shetland
2014/15 96 74 82 18 20
2015/16 84 87 68 7 10
2016/17 85 78 67 13 10
2017/18 provisional 90 60 81 20 20
2014/15 543 464 482 70 70
2015/16 549 477 437 92 90
2016/17 527 445 444 83 80
2017/18 provisional 613 465 488 137 140
Scottish Borders
South Ayrshire
North Lanarkshire
Perth and Kinross
Renfrewshire
38 © Crown Copyright 2018
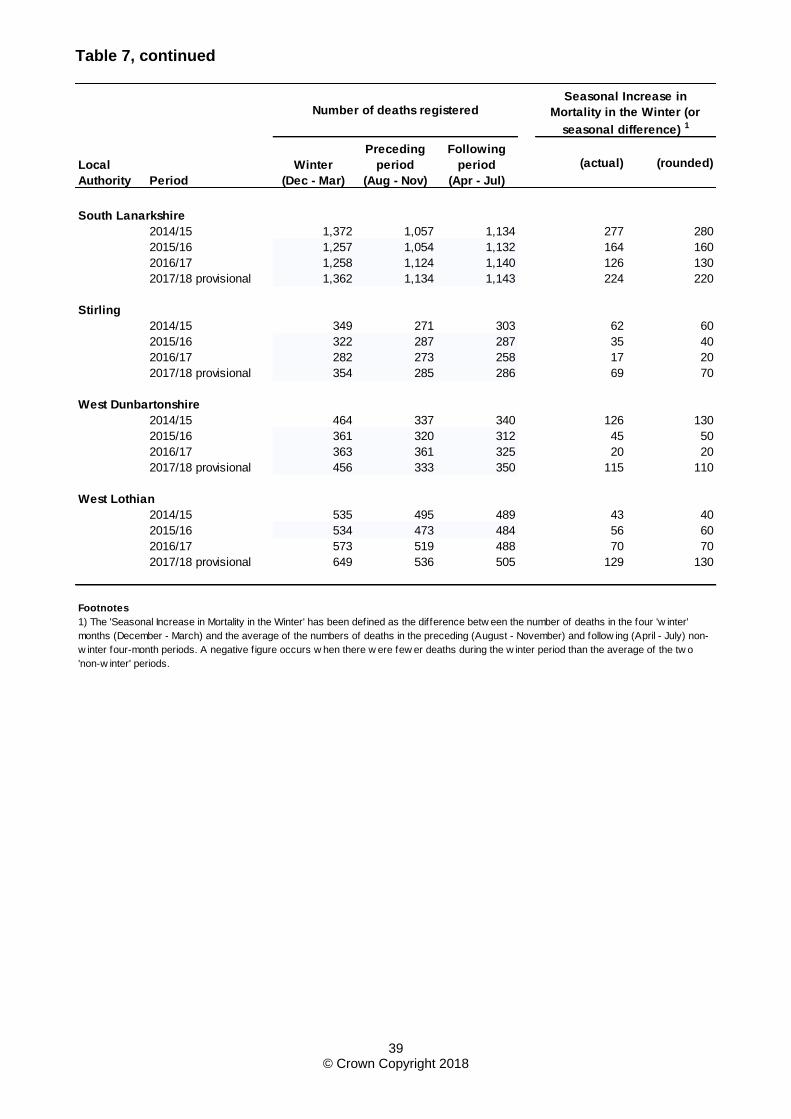
Table 7, continued
Local
Authority Period
Winter
(Dec - Mar)
Preceding
period
(Aug - Nov)
Following
period
(Apr - Jul)
(actual) (rounded)
Number of deaths registeredSeasonal Increase in
Mortality in the Winter (or
seasonal difference) 1
2014/15 1,372 1,057 1,134 277 280
2015/16 1,257 1,054 1,132 164 160
2016/17 1,258 1,124 1,140 126 130
2017/18 provisional 1,362 1,134 1,143 224 220
Stirling
2014/15 349 271 303 62 60
2015/16 322 287 287 35 40
2016/17 282 273 258 17 20
2017/18 provisional 354 285 286 69 70
2014/15 464 337 340 126 130
2015/16 361 320 312 45 50
2016/17 363 361 325 20 20
2017/18 provisional 456 333 350 115 110
2014/15 535 495 489 43 40
2015/16 534 473 484 56 60
2016/17 573 519 488 70 70
2017/18 provisional 649 536 505 129 130
Footnotes
West Lothian
South Lanarkshire
West Dunbartonshire
1) The 'Seasonal Increase in Mortality in the Winter' has been defined as the difference betw een the number of deaths in the four 'w inter'
months (December - March) and the average of the numbers of deaths in the preceding (August - November) and follow ing (April - July) non-
w inter four-month periods. A negative f igure occurs w hen there w ere few er deaths during the w inter period than the average of the tw o
'non-w inter' periods.
39 © Crown Copyright 2018
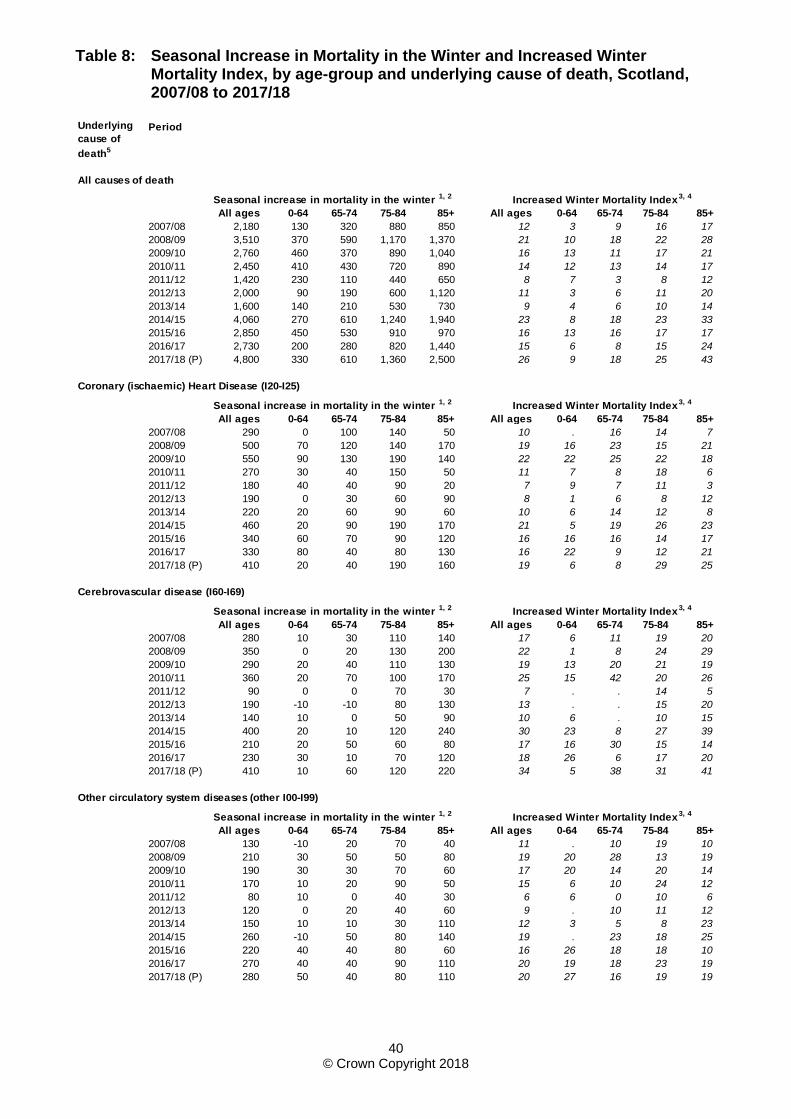
Table 8: Seasonal Increase in Mortality in the Winter and Increased Winter Mortality Index, by age-group and underlying cause of death, Scotland, 2007/08 to 2017/18
Period
All ages 0-64 65-74 75-84 85+ All ages 0-64 65-74 75-84 85+
2007/08 2,180 130 320 880 850 12 3 9 16 17
2008/09 3,510 370 590 1,170 1,370 21 10 18 22 28
2009/10 2,760 460 370 890 1,040 16 13 11 17 21
2010/11 2,450 410 430 720 890 14 12 13 14 17
2011/12 1,420 230 110 440 650 8 7 3 8 12
2012/13 2,000 90 190 600 1,120 11 3 6 11 20
2013/14 1,600 140 210 530 730 9 4 6 10 14
2014/15 4,060 270 610 1,240 1,940 23 8 18 23 33
2015/16 2,850 450 530 910 970 16 13 16 17 17
2016/17 2,730 200 280 820 1,440 15 6 8 15 24
2017/18 (P) 4,800 330 610 1,360 2,500 26 9 18 25 43
All ages 0-64 65-74 75-84 85+ All ages 0-64 65-74 75-84 85+
2007/08 290 0 100 140 50 10 . 16 14 7
2008/09 500 70 120 140 170 19 16 23 15 21
2009/10 550 90 130 190 140 22 22 25 22 18
2010/11 270 30 40 150 50 11 7 8 18 6
2011/12 180 40 40 90 20 7 9 7 11 3
2012/13 190 0 30 60 90 8 1 6 8 12
2013/14 220 20 60 90 60 10 6 14 12 8
2014/15 460 20 90 190 170 21 5 19 26 23
2015/16 340 60 70 90 120 16 16 16 14 17
2016/17 330 80 40 80 130 16 22 9 12 21
2017/18 (P) 410 20 40 190 160 19 6 8 29 25
All ages 0-64 65-74 75-84 85+ All ages 0-64 65-74 75-84 85+
2007/08 280 10 30 110 140 17 6 11 19 20
2008/09 350 0 20 130 200 22 1 8 24 29
2009/10 290 20 40 110 130 19 13 20 21 19
2010/11 360 20 70 100 170 25 15 42 20 26
2011/12 90 0 0 70 30 7 . . 14 5
2012/13 190 -10 -10 80 130 13 . . 15 20
2013/14 140 10 0 50 90 10 6 . 10 15
2014/15 400 20 10 120 240 30 23 8 27 39
2015/16 210 20 50 60 80 17 16 30 15 14
2016/17 230 30 10 70 120 18 26 6 17 20
2017/18 (P) 410 10 60 120 220 34 5 38 31 41
All ages 0-64 65-74 75-84 85+ All ages 0-64 65-74 75-84 85+
2007/08 130 -10 20 70 40 11 . 10 19 10
2008/09 210 30 50 50 80 19 20 28 13 19
2009/10 190 30 30 70 60 17 20 14 20 14
2010/11 170 10 20 90 50 15 6 10 24 12
2011/12 80 10 0 40 30 6 6 0 10 6
2012/13 120 0 20 40 60 9 . 10 11 12
2013/14 150 10 10 30 110 12 3 5 8 23
2014/15 260 -10 50 80 140 19 . 23 18 25
2015/16 220 40 40 80 60 16 26 18 18 10
2016/17 270 40 40 90 110 20 19 18 23 19
2017/18 (P) 280 50 40 80 110 20 27 16 19 19
Increased Winter Mortality Index3, 4
Seasonal increase in mortality in the winter 1, 2 Increased Winter Mortality Index3, 4
Seasonal increase in mortality in the winter 1, 2 Increased Winter Mortality Index3, 4
Increased Winter Mortality Index3, 4
Underlying
cause of
death5
All causes of death
Coronary (ischaemic) Heart Disease (I20-I25)
Cerebrovascular disease (I60-I69)
Other circulatory system diseases (other I00-I99)
Seasonal increase in mortality in the winter 1, 2
Seasonal increase in mortality in the winter 1, 2
40 © Crown Copyright 2018
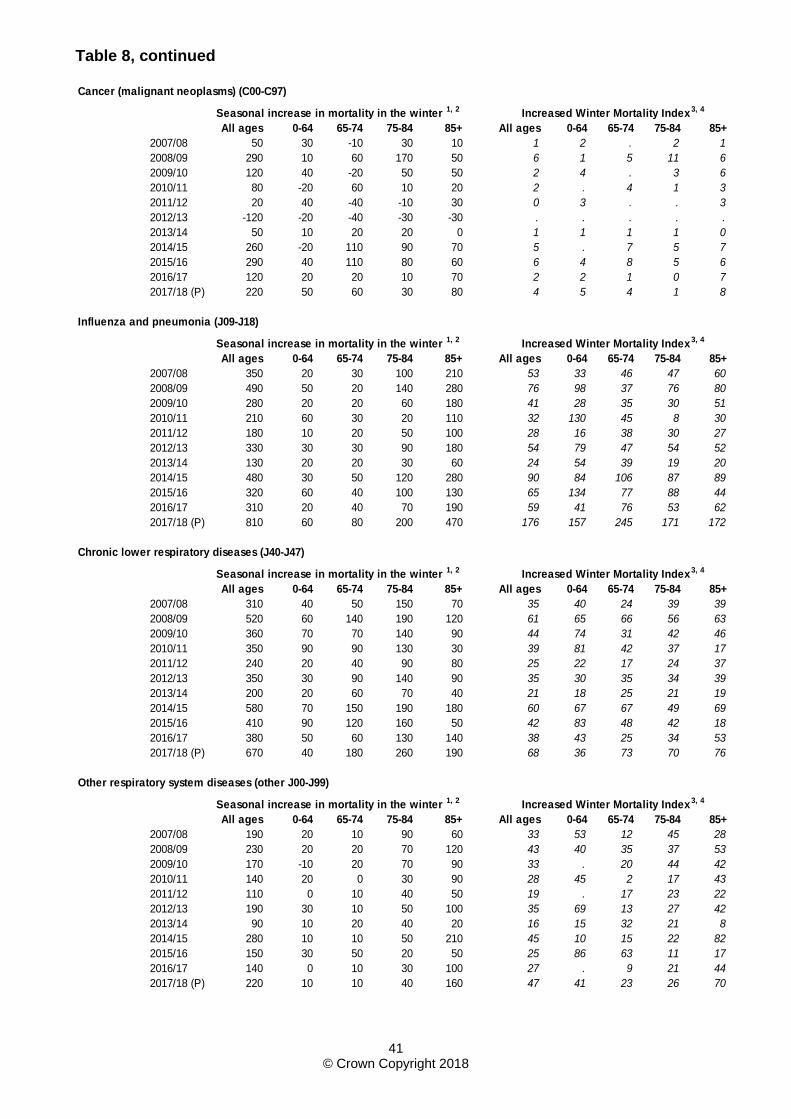
Table 8, continued
All ages 0-64 65-74 75-84 85+ All ages 0-64 65-74 75-84 85+
2007/08 50 30 -10 30 10 1 2 . 2 1
2008/09 290 10 60 170 50 6 1 5 11 6
2009/10 120 40 -20 50 50 2 4 . 3 6
2010/11 80 -20 60 10 20 2 . 4 1 3
2011/12 20 40 -40 -10 30 0 3 . . 3
2012/13 -120 -20 -40 -30 -30 . . . . .
2013/14 50 10 20 20 0 1 1 1 1 0
2014/15 260 -20 110 90 70 5 . 7 5 7
2015/16 290 40 110 80 60 6 4 8 5 6
2016/17 120 20 20 10 70 2 2 1 0 7
2017/18 (P) 220 50 60 30 80 4 5 4 1 8
All ages 0-64 65-74 75-84 85+ All ages 0-64 65-74 75-84 85+
2007/08 350 20 30 100 210 53 33 46 47 60
2008/09 490 50 20 140 280 76 98 37 76 80
2009/10 280 20 20 60 180 41 28 35 30 51
2010/11 210 60 30 20 110 32 130 45 8 30
2011/12 180 10 20 50 100 28 16 38 30 27
2012/13 330 30 30 90 180 54 79 47 54 52
2013/14 130 20 20 30 60 24 54 39 19 20
2014/15 480 30 50 120 280 90 84 106 87 89
2015/16 320 60 40 100 130 65 134 77 88 44
2016/17 310 20 40 70 190 59 41 76 53 62
2017/18 (P) 810 60 80 200 470 176 157 245 171 172
All ages 0-64 65-74 75-84 85+ All ages 0-64 65-74 75-84 85+
2007/08 310 40 50 150 70 35 40 24 39 39
2008/09 520 60 140 190 120 61 65 66 56 63
2009/10 360 70 70 140 90 44 74 31 42 46
2010/11 350 90 90 130 30 39 81 42 37 17
2011/12 240 20 40 90 80 25 22 17 24 37
2012/13 350 30 90 140 90 35 30 35 34 39
2013/14 200 20 60 70 40 21 18 25 21 19
2014/15 580 70 150 190 180 60 67 67 49 69
2015/16 410 90 120 160 50 42 83 48 42 18
2016/17 380 50 60 130 140 38 43 25 34 53
2017/18 (P) 670 40 180 260 190 68 36 73 70 76
All ages 0-64 65-74 75-84 85+ All ages 0-64 65-74 75-84 85+
2007/08 190 20 10 90 60 33 53 12 45 28
2008/09 230 20 20 70 120 43 40 35 37 53
2009/10 170 -10 20 70 90 33 . 20 44 42
2010/11 140 20 0 30 90 28 45 2 17 43
2011/12 110 0 10 40 50 19 . 17 23 22
2012/13 190 30 10 50 100 35 69 13 27 42
2013/14 90 10 20 40 20 16 15 32 21 8
2014/15 280 10 10 50 210 45 10 15 22 82
2015/16 150 30 50 20 50 25 86 63 11 17
2016/17 140 0 10 30 100 27 . 9 21 44
2017/18 (P) 220 10 10 40 160 47 41 23 26 70
Increased Winter Mortality Index3, 4
Seasonal increase in mortality in the winter 1, 2 Increased Winter Mortality Index3, 4
Seasonal increase in mortality in the winter 1, 2 Increased Winter Mortality Index3, 4
Seasonal increase in mortality in the winter 1, 2 Increased Winter Mortality Index3, 4
Seasonal increase in mortality in the winter 1, 2
Cancer (malignant neoplasms) (C00-C97)
Influenza and pneumonia (J09-J18)
Chronic lower respiratory diseases (J40-J47)
Other respiratory system diseases (other J00-J99)
41 © Crown Copyright 2018
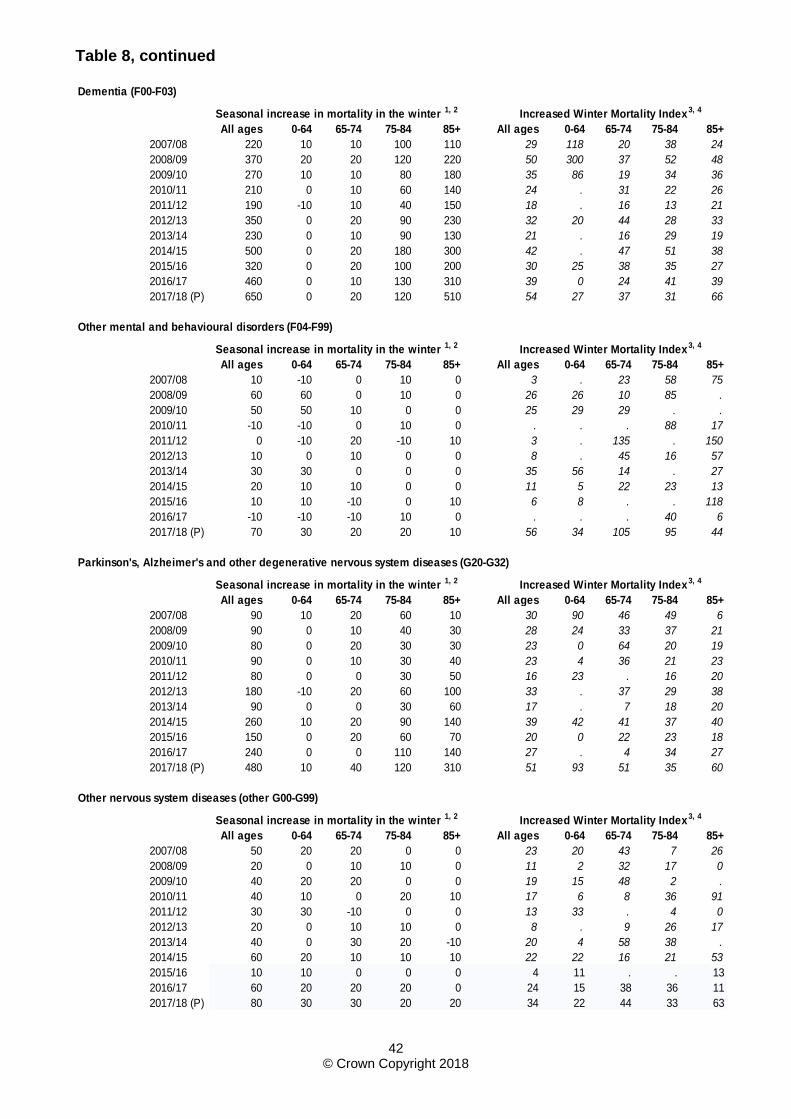
Table 8, continued
All ages 0-64 65-74 75-84 85+ All ages 0-64 65-74 75-84 85+
2007/08 220 10 10 100 110 29 118 20 38 24
2008/09 370 20 20 120 220 50 300 37 52 48
2009/10 270 10 10 80 180 35 86 19 34 36
2010/11 210 0 10 60 140 24 . 31 22 26
2011/12 190 -10 10 40 150 18 . 16 13 21
2012/13 350 0 20 90 230 32 20 44 28 33
2013/14 230 0 10 90 130 21 . 16 29 19
2014/15 500 0 20 180 300 42 . 47 51 38
2015/16 320 0 20 100 200 30 25 38 35 27
2016/17 460 0 10 130 310 39 0 24 41 39
2017/18 (P) 650 0 20 120 510 54 27 37 31 66
All ages 0-64 65-74 75-84 85+ All ages 0-64 65-74 75-84 85+
2007/08 10 -10 0 10 0 3 . 23 58 75
2008/09 60 60 0 10 0 26 26 10 85 .
2009/10 50 50 10 0 0 25 29 29 . .
2010/11 -10 -10 0 10 0 . . . 88 17
2011/12 0 -10 20 -10 10 3 . 135 . 150
2012/13 10 0 10 0 0 8 . 45 16 57
2013/14 30 30 0 0 0 35 56 14 . 27
2014/15 20 10 10 0 0 11 5 22 23 13
2015/16 10 10 -10 0 10 6 8 . . 118
2016/17 -10 -10 -10 10 0 . . . 40 6
2017/18 (P) 70 30 20 20 10 56 34 105 95 44
All ages 0-64 65-74 75-84 85+ All ages 0-64 65-74 75-84 85+
2007/08 90 10 20 60 10 30 90 46 49 6
2008/09 90 0 10 40 30 28 24 33 37 21
2009/10 80 0 20 30 30 23 0 64 20 19
2010/11 90 0 10 30 40 23 4 36 21 23
2011/12 80 0 0 30 50 16 23 . 16 20
2012/13 180 -10 20 60 100 33 . 37 29 38
2013/14 90 0 0 30 60 17 . 7 18 20
2014/15 260 10 20 90 140 39 42 41 37 40
2015/16 150 0 20 60 70 20 0 22 23 18
2016/17 240 0 0 110 140 27 . 4 34 27
2017/18 (P) 480 10 40 120 310 51 93 51 35 60
All ages 0-64 65-74 75-84 85+ All ages 0-64 65-74 75-84 85+
2007/08 50 20 20 0 0 23 20 43 7 26
2008/09 20 0 10 10 0 11 2 32 17 0
2009/10 40 20 20 0 0 19 15 48 2 .
2010/11 40 10 0 20 10 17 6 8 36 91
2011/12 30 30 -10 0 0 13 33 . 4 0
2012/13 20 0 10 10 0 8 . 9 26 17
2013/14 40 0 30 20 -10 20 4 58 38 .
2014/15 60 20 10 10 10 22 22 16 21 53
2015/16 10 10 0 0 0 4 11 . . 13
2016/17 60 20 20 20 0 24 15 38 36 11
2017/18 (P) 80 30 30 20 20 34 22 44 33 63
Seasonal increase in mortality in the winter 1, 2 Increased Winter Mortality Index3, 4
Increased Winter Mortality Index3, 4
Increased Winter Mortality Index3, 4
Increased Winter Mortality Index3, 4
Dementia (F00-F03)
Other nervous system diseases (other G00-G99)
Seasonal increase in mortality in the winter 1, 2
Seasonal increase in mortality in the winter 1, 2
Seasonal increase in mortality in the winter 1, 2
Other mental and behavioural disorders (F04-F99)
Parkinson's, Alzheimer's and other degenerative nervous system diseases (G20-G32)
42 © Crown Copyright 2018
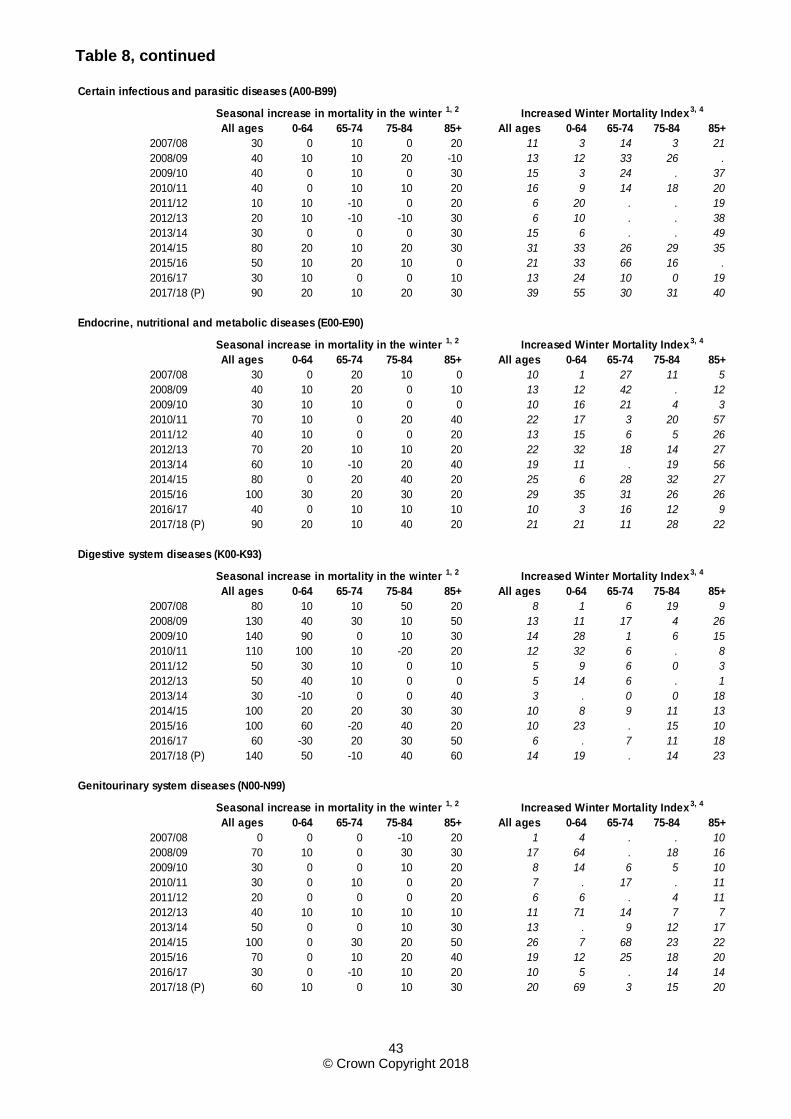
Table 8, continued
All ages 0-64 65-74 75-84 85+ All ages 0-64 65-74 75-84 85+
2007/08 30 0 10 0 20 11 3 14 3 21
2008/09 40 10 10 20 -10 13 12 33 26 .
2009/10 40 0 10 0 30 15 3 24 . 37
2010/11 40 0 10 10 20 16 9 14 18 20
2011/12 10 10 -10 0 20 6 20 . . 19
2012/13 20 10 -10 -10 30 6 10 . . 38
2013/14 30 0 0 0 30 15 6 . . 49
2014/15 80 20 10 20 30 31 33 26 29 35
2015/16 50 10 20 10 0 21 33 66 16 .
2016/17 30 10 0 0 10 13 24 10 0 19
2017/18 (P) 90 20 10 20 30 39 55 30 31 40
All ages 0-64 65-74 75-84 85+ All ages 0-64 65-74 75-84 85+
2007/08 30 0 20 10 0 10 1 27 11 5
2008/09 40 10 20 0 10 13 12 42 . 12
2009/10 30 10 10 0 0 10 16 21 4 3
2010/11 70 10 0 20 40 22 17 3 20 57
2011/12 40 10 0 0 20 13 15 6 5 26
2012/13 70 20 10 10 20 22 32 18 14 27
2013/14 60 10 -10 20 40 19 11 . 19 56
2014/15 80 0 20 40 20 25 6 28 32 27
2015/16 100 30 20 30 20 29 35 31 26 26
2016/17 40 0 10 10 10 10 3 16 12 9
2017/18 (P) 90 20 10 40 20 21 21 11 28 22
All ages 0-64 65-74 75-84 85+ All ages 0-64 65-74 75-84 85+
2007/08 80 10 10 50 20 8 1 6 19 9
2008/09 130 40 30 10 50 13 11 17 4 26
2009/10 140 90 0 10 30 14 28 1 6 15
2010/11 110 100 10 -20 20 12 32 6 . 8
2011/12 50 30 10 0 10 5 9 6 0 3
2012/13 50 40 10 0 0 5 14 6 . 1
2013/14 30 -10 0 0 40 3 . 0 0 18
2014/15 100 20 20 30 30 10 8 9 11 13
2015/16 100 60 -20 40 20 10 23 . 15 10
2016/17 60 -30 20 30 50 6 . 7 11 18
2017/18 (P) 140 50 -10 40 60 14 19 . 14 23
All ages 0-64 65-74 75-84 85+ All ages 0-64 65-74 75-84 85+
2007/08 0 0 0 -10 20 1 4 . . 10
2008/09 70 10 0 30 30 17 64 . 18 16
2009/10 30 0 0 10 20 8 14 6 5 10
2010/11 30 0 10 0 20 7 . 17 . 11
2011/12 20 0 0 0 20 6 6 . 4 11
2012/13 40 10 10 10 10 11 71 14 7 7
2013/14 50 0 0 10 30 13 . 9 12 17
2014/15 100 0 30 20 50 26 7 68 23 22
2015/16 70 0 10 20 40 19 12 25 18 20
2016/17 30 0 -10 10 20 10 5 . 14 14
2017/18 (P) 60 10 0 10 30 20 69 3 15 20
Seasonal increase in mortality in the winter 1, 2 Increased Winter Mortality Index3, 4
Seasonal increase in mortality in the winter 1, 2 Increased Winter Mortality Index3, 4
Seasonal increase in mortality in the winter 1, 2 Increased Winter Mortality Index3, 4
Increased Winter Mortality Index3, 4
Certain infectious and parasitic diseases (A00-B99)
Endocrine, nutritional and metabolic diseases (E00-E90)
Seasonal increase in mortality in the winter 1, 2
Digestive system diseases (K00-K93)
Genitourinary system diseases (N00-N99)
43 © Crown Copyright 2018
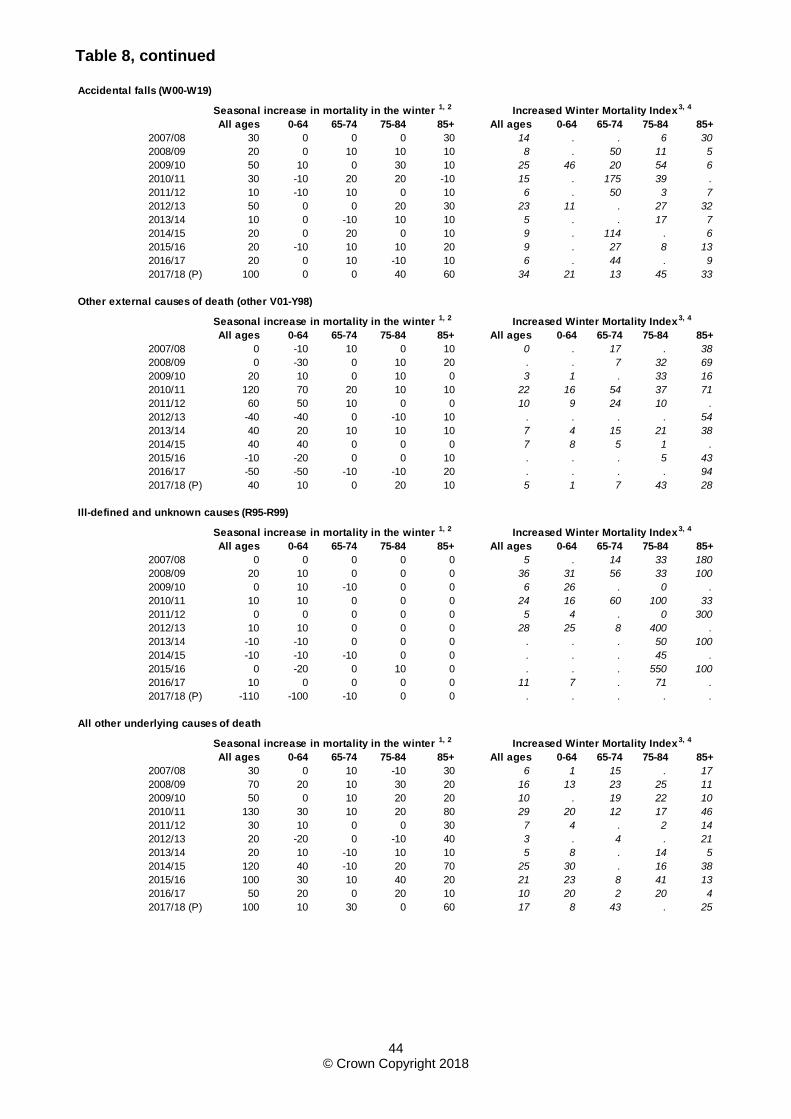
Table 8, continued
All ages 0-64 65-74 75-84 85+ All ages 0-64 65-74 75-84 85+
2007/08 30 0 0 0 30 14 . . 6 30
2008/09 20 0 10 10 10 8 . 50 11 5
2009/10 50 10 0 30 10 25 46 20 54 6
2010/11 30 -10 20 20 -10 15 . 175 39 .
2011/12 10 -10 10 0 10 6 . 50 3 7
2012/13 50 0 0 20 30 23 11 . 27 32
2013/14 10 0 -10 10 10 5 . . 17 7
2014/15 20 0 20 0 10 9 . 114 . 6
2015/16 20 -10 10 10 20 9 . 27 8 13
2016/17 20 0 10 -10 10 6 . 44 . 9
2017/18 (P) 100 0 0 40 60 34 21 13 45 33
All ages 0-64 65-74 75-84 85+ All ages 0-64 65-74 75-84 85+
2007/08 0 -10 10 0 10 0 . 17 . 38
2008/09 0 -30 0 10 20 . . 7 32 69
2009/10 20 10 0 10 0 3 1 . 33 16
2010/11 120 70 20 10 10 22 16 54 37 71
2011/12 60 50 10 0 0 10 9 24 10 .
2012/13 -40 -40 0 -10 10 . . . . 54
2013/14 40 20 10 10 10 7 4 15 21 38
2014/15 40 40 0 0 0 7 8 5 1 .
2015/16 -10 -20 0 0 10 . . . 5 43
2016/17 -50 -50 -10 -10 20 . . . . 94
2017/18 (P) 40 10 0 20 10 5 1 7 43 28
All ages 0-64 65-74 75-84 85+ All ages 0-64 65-74 75-84 85+
2007/08 0 0 0 0 0 5 . 14 33 180
2008/09 20 10 0 0 0 36 31 56 33 100
2009/10 0 10 -10 0 0 6 26 . 0 .
2010/11 10 10 0 0 0 24 16 60 100 33
2011/12 0 0 0 0 0 5 4 . 0 300
2012/13 10 10 0 0 0 28 25 8 400 .
2013/14 -10 -10 0 0 0 . . . 50 100
2014/15 -10 -10 -10 0 0 . . . 45 .
2015/16 0 -20 0 10 0 . . . 550 100
2016/17 10 0 0 0 0 11 7 . 71 .
2017/18 (P) -110 -100 -10 0 0 . . . . .
All ages 0-64 65-74 75-84 85+ All ages 0-64 65-74 75-84 85+
2007/08 30 0 10 -10 30 6 1 15 . 17
2008/09 70 20 10 30 20 16 13 23 25 11
2009/10 50 0 10 20 20 10 . 19 22 10
2010/11 130 30 10 20 80 29 20 12 17 46
2011/12 30 10 0 0 30 7 4 . 2 14
2012/13 20 -20 0 -10 40 3 . 4 . 21
2013/14 20 10 -10 10 10 5 8 . 14 5
2014/15 120 40 -10 20 70 25 30 . 16 38
2015/16 100 30 10 40 20 21 23 8 41 13
2016/17 50 20 0 20 10 10 20 2 20 4
2017/18 (P) 100 10 30 0 60 17 8 43 . 25
Seasonal increase in mortality in the winter 1, 2 Increased Winter Mortality Index3, 4
Seasonal increase in mortality in the winter 1, 2 Increased Winter Mortality Index3, 4
Seasonal increase in mortality in the winter 1, 2 Increased Winter Mortality Index3, 4
Accidental falls (W00-W19)
Other external causes of death (other V01-Y98)
Ill-defined and unknown causes (R95-R99)
Seasonal increase in mortality in the winter 1, 2 Increased Winter Mortality Index3, 4
All other underlying causes of death
44 © Crown Copyright 2018
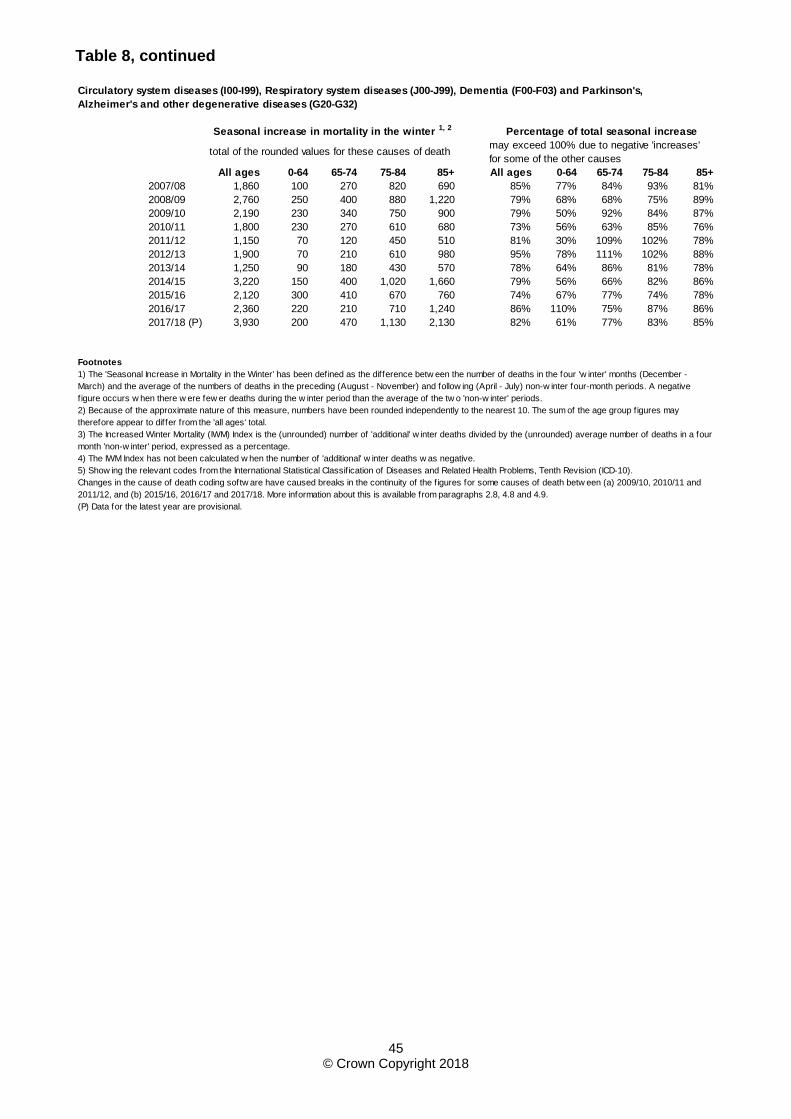
Table 8, continued
All ages 0-64 65-74 75-84 85+ All ages 0-64 65-74 75-84 85+
2007/08 1,860 100 270 820 690 85% 77% 84% 93% 81%
2008/09 2,760 250 400 880 1,220 79% 68% 68% 75% 89%
2009/10 2,190 230 340 750 900 79% 50% 92% 84% 87%
2010/11 1,800 230 270 610 680 73% 56% 63% 85% 76%
2011/12 1,150 70 120 450 510 81% 30% 109% 102% 78%
2012/13 1,900 70 210 610 980 95% 78% 111% 102% 88%
2013/14 1,250 90 180 430 570 78% 64% 86% 81% 78%
2014/15 3,220 150 400 1,020 1,660 79% 56% 66% 82% 86%
2015/16 2,120 300 410 670 760 74% 67% 77% 74% 78%
2016/17 2,360 220 210 710 1,240 86% 110% 75% 87% 86%
2017/18 (P) 3,930 200 470 1,130 2,130 82% 61% 77% 83% 85%
Footnotes
1) The 'Seasonal Increase in Mortality in the Winter' has been defined as the difference betw een the number of deaths in the four 'w inter' months (December -
March) and the average of the numbers of deaths in the preceding (August - November) and follow ing (April - July) non-w inter four-month periods. A negative
f igure occurs w hen there w ere few er deaths during the w inter period than the average of the tw o 'non-w inter' periods.
3) The Increased Winter Mortality (IWM) Index is the (unrounded) number of 'additional' w inter deaths divided by the (unrounded) average number of deaths in a four
month 'non-w inter' period, expressed as a percentage.
4) The IWM Index has not been calculated w hen the number of 'additional' w inter deaths w as negative.
(P) Data for the latest year are provisional.
5) Show ing the relevant codes from the International Statistical Classif ication of Diseases and Related Health Problems, Tenth Revision (ICD-10).
Changes in the cause of death coding softw are have caused breaks in the continuity of the f igures for some causes of death betw een (a) 2009/10, 2010/11 and
2011/12, and (b) 2015/16, 2016/17 and 2017/18. More information about this is available from paragraphs 2.8, 4.8 and 4.9.
2) Because of the approximate nature of this measure, numbers have been rounded independently to the nearest 10. The sum of the age group figures may
therefore appear to differ from the 'all ages' total.
Circulatory system diseases (I00-I99), Respiratory system diseases (J00-J99), Dementia (F00-F03) and Parkinson's,
Alzheimer's and other degenerative diseases (G20-G32)
may exceed 100% due to negative 'increases'
for some of the other causes
Seasonal increase in mortality in the winter 1, 2 Percentage of total seasonal increase
total of the rounded values for these causes of death
45 © Crown Copyright 2018
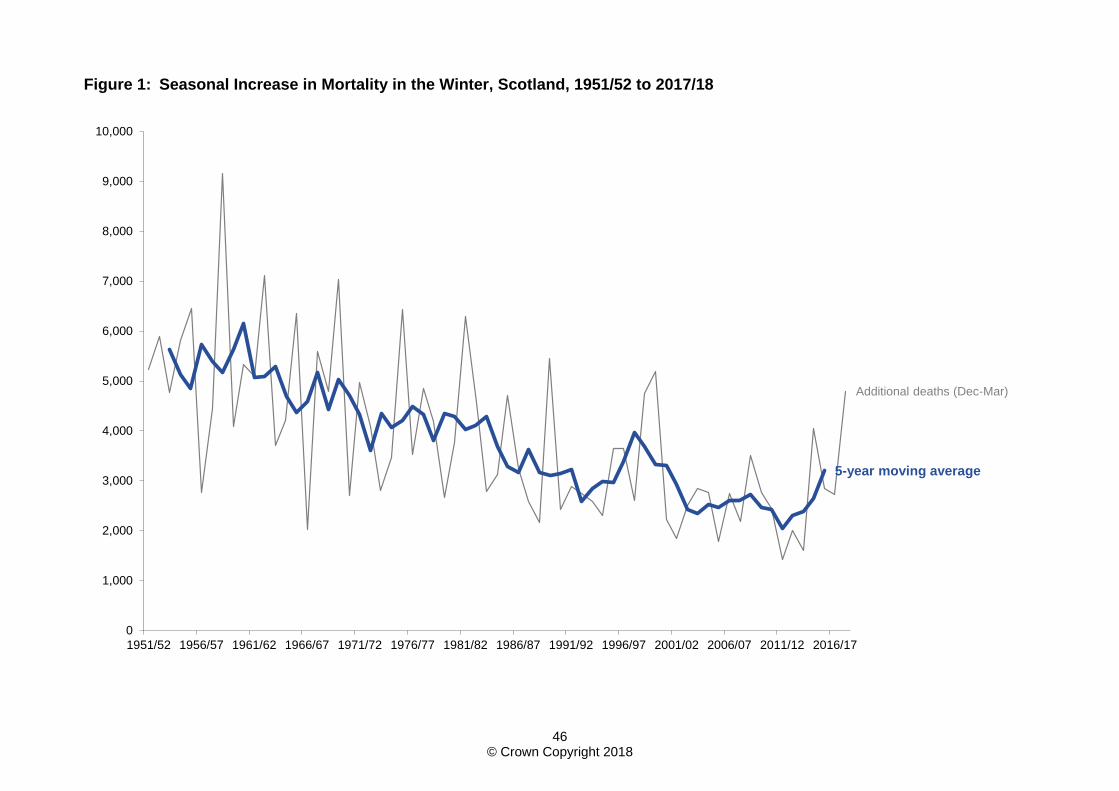
Figure 1: Seasonal Increase in Mortality in the Winter, Scotland, 1951/52 to 2017/18
Additional deaths (Dec-Mar)
5-year moving average
0
1,000
2,000
3,000
4,000
5,000
6,000
7,000
8,000
9,000
10,000
1951/52 1956/57 1961/62 1966/67 1971/72 1976/77 1981/82 1986/87 1991/92 1996/97 2001/02 2006/07 2011/12 2016/17
46 © Crown Copyright 2018
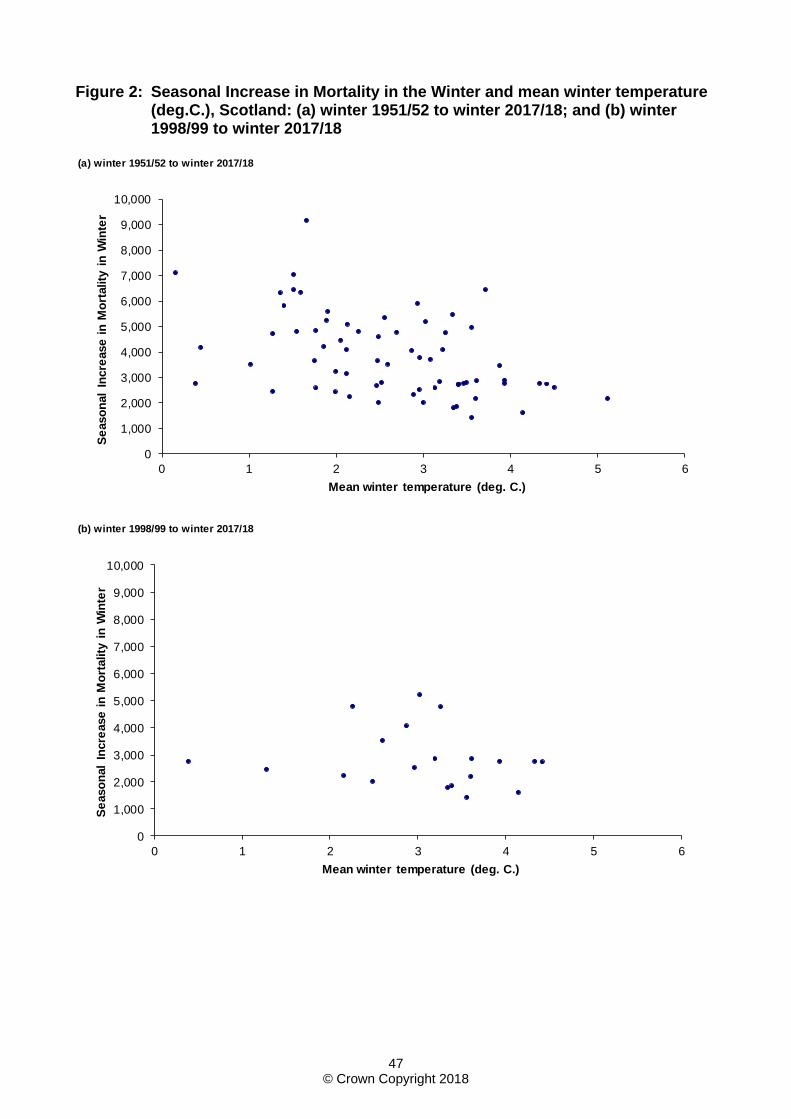
Figure 2: Seasonal Increase in Mortality in the Winter and mean winter temperature (deg.C.), Scotland: (a) winter 1951/52 to winter 2017/18; and (b) winter 1998/99 to winter 2017/18
(a) winter 1951/52 to winter 2017/18
(b) winter 1998/99 to winter 2017/18
0
1,000
2,000
3,000
4,000
5,000
6,000
7,000
8,000
9,000
10,000
0 1 2 3 4 5 6
Se
aso
nal
Incre
ase
in
Mo
rtality
in
Win
ter
Mean winter temperature (deg. C.)
0
1,000
2,000
3,000
4,000
5,000
6,000
7,000
8,000
9,000
10,000
0 1 2 3 4 5 6
Se
aso
nal
Incre
ase
in
Mo
rtality
in
Win
ter
Mean winter temperature (deg. C.)
47 © Crown Copyright 2018
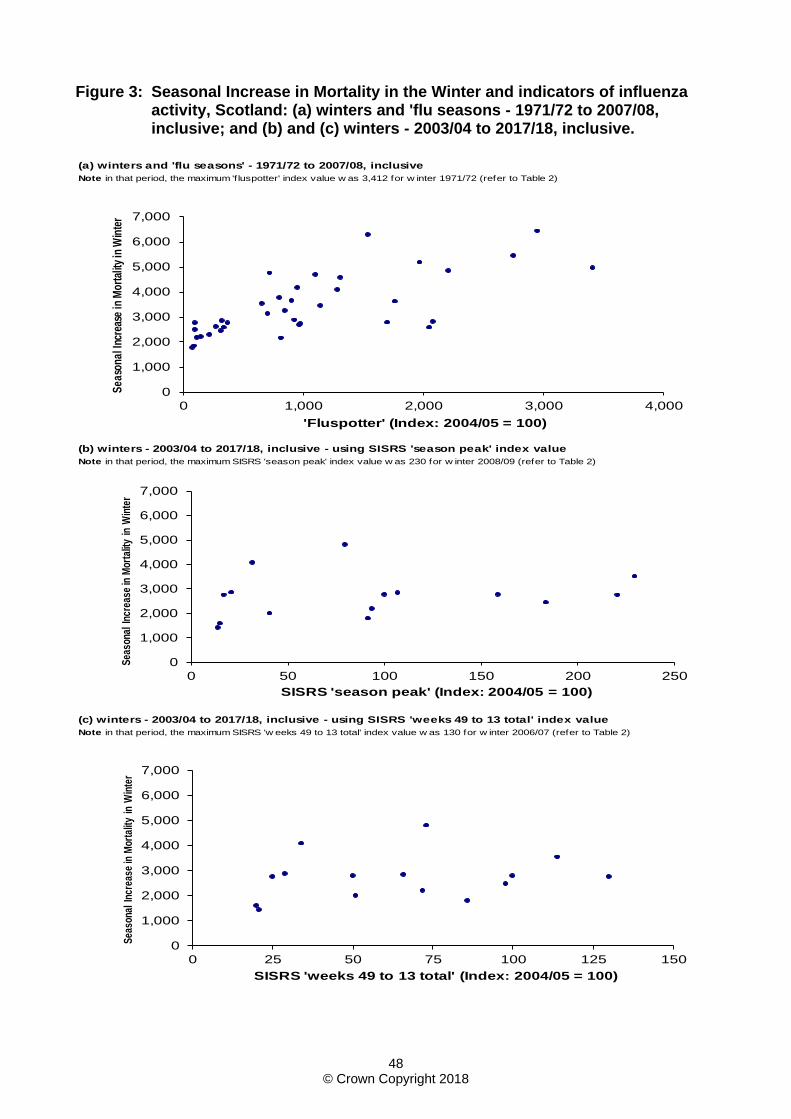
Figure 3: Seasonal Increase in Mortality in the Winter and indicators of influenza activity, Scotland: (a) winters and 'flu seasons - 1971/72 to 2007/08, inclusive; and (b) and (c) winters - 2003/04 to 2017/18, inclusive.
(b) winters - 2003/04 to 2017/18, inclusive - using SISRS 'season peak' index value
(c) winters - 2003/04 to 2017/18, inclusive - using SISRS 'weeks 49 to 13 total' index value
Note in that period, the maximum SISRS 'w eeks 49 to 13 total' index value w as 130 for w inter 2006/07 (refer to Table 2)
Note in that period, the maximum SISRS 'season peak' index value w as 230 for w inter 2008/09 (refer to Table 2)
(a) winters and 'flu seasons' - 1971/72 to 2007/08, inclusive
Note in that period, the maximum 'f luspotter' index value w as 3,412 for w inter 1971/72 (refer to Table 2)
0
1,000
2,000
3,000
4,000
5,000
6,000
7,000
0 1,000 2,000 3,000 4,000
Sea
sona
l Inc
reas
e in
Mor
talit
y in
Win
ter
'Fluspotter' (Index: 2004/05 = 100)
0
1,000
2,000
3,000
4,000
5,000
6,000
7,000
0 50 100 150 200 250
Sea
sona
l In
crea
se in
Mor
talit
y in
Win
ter
SISRS 'season peak' (Index: 2004/05 = 100)
0
1,000
2,000
3,000
4,000
5,000
6,000
7,000
0 25 50 75 100 125 150
Sea
sona
l In
crea
se in
Mor
talit
y in
Win
ter
SISRS 'weeks 49 to 13 total' (Index: 2004/05 = 100)
48 © Crown Copyright 2018
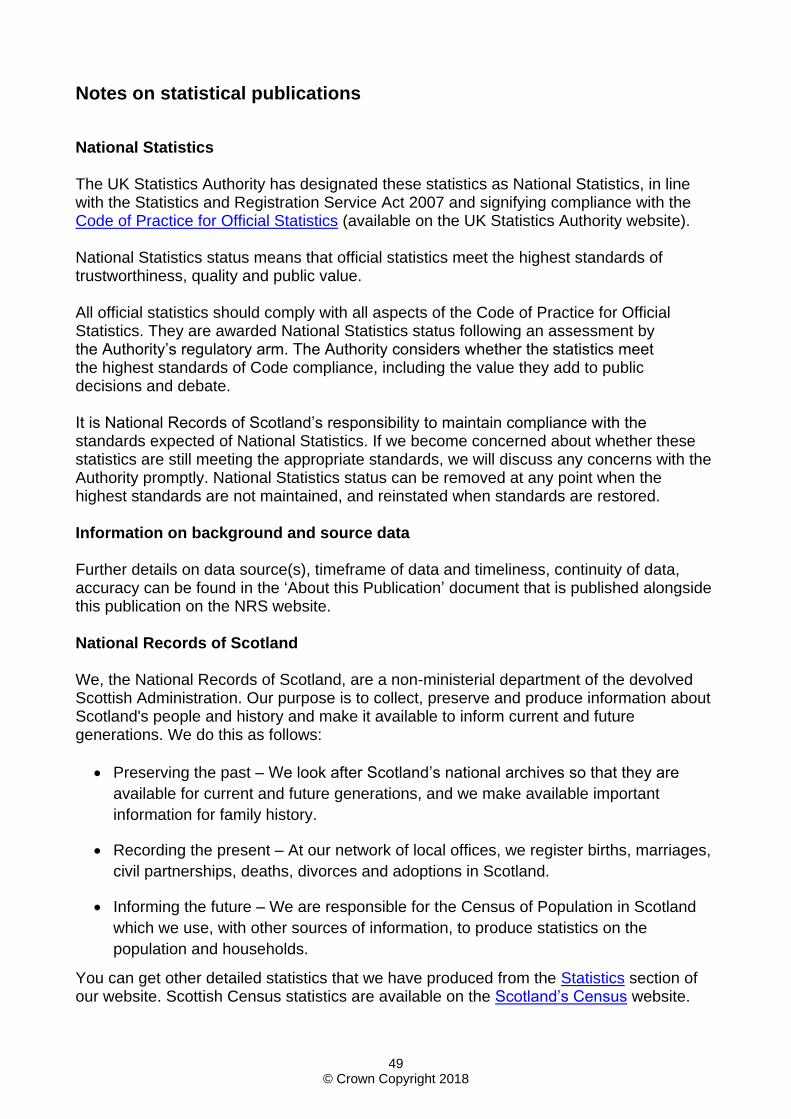
Notes on statistical publications
National Statistics
The UK Statistics Authority has designated these statistics as National Statistics, in line with the Statistics and Registration Service Act 2007 and signifying compliance with the Code of Practice for Official Statistics (available on the UK Statistics Authority website).
National Statistics status means that official statistics meet the highest standards of trustworthiness, quality and public value.
All official statistics should comply with all aspects of the Code of Practice for Official Statistics. They are awarded National Statistics status following an assessment by the Authority’s regulatory arm. The Authority considers whether the statistics meet the highest standards of Code compliance, including the value they add to public decisions and debate.
It is National Records of Scotland’s responsibility to maintain compliance with the standards expected of National Statistics. If we become concerned about whether these statistics are still meeting the appropriate standards, we will discuss any concerns with the Authority promptly. National Statistics status can be removed at any point when the highest standards are not maintained, and reinstated when standards are restored.
Information on background and source data
Further details on data source(s), timeframe of data and timeliness, continuity of data, accuracy can be found in the ‘About this Publication’ document that is published alongside this publication on the NRS website.
National Records of Scotland
We, the National Records of Scotland, are a non-ministerial department of the devolved Scottish Administration. Our purpose is to collect, preserve and produce information about Scotland's people and history and make it available to inform current and future generations. We do this as follows:
Preserving the past – We look after Scotland’s national archives so that they are
available for current and future generations, and we make available important
information for family history.
Recording the present – At our network of local offices, we register births, marriages,
civil partnerships, deaths, divorces and adoptions in Scotland.
Informing the future – We are responsible for the Census of Population in Scotland
which we use, with other sources of information, to produce statistics on the
population and households.
You can get other detailed statistics that we have produced from the Statistics section of our website. Scottish Census statistics are available on the Scotland’s Census website.
49 © Crown Copyright 2018
We also provide information about future publications on our website. If you would like us to tell you about future statistical publications, you can register your interest on the Scottish Government ScotStat website.
You can also follow us on twitter @NatRecordsScot
Revisions and Corrections
We, the National Records of Scotland, label any revisions and corrections that we have
applied to any of our statistics. These revisions and corrections are clearly marked on the
webpage of the publication as well on our revisions and corrections page available on the
NRS website.
Where applicable, revisions will also be carried out in accordance with the revisions policy
for population, migration and life events statistics available on the ONS website.
Enquiries and suggestions
Please contact our Statistics Customer Services if you need any further information. Email: [email protected]
If you have comments or suggestions that would help us improve our standards of service, please contact:
Alan Ferrier Senior Statistician National Records of Scotland Room 1/2/12 Ladywell House Ladywell Road Edinburgh EH12 7TF
Phone: 0131 314 4530 Email: [email protected]
50 © Crown Copyright 2018
The Scottish Government (SG) forms the bulk of the devolved Scottish Administration. The aim othe statistical service in the SG is to provide relevant and reliable statistical in formation, analysis anadvice that meets the needs of government, business and the people of Scotland.
f
d
Office of the Chief Statistician and Strategic Analysis Scottish Government 2W, St Andrews House Edinburgh EH1 3DG Phone: 0131 244 0442 Email: [email protected] Website: http://www.gov.scot/Topics/Statistics
The Office for National Statistics (ONS) is responsible for producing a wide range of economic and social statistics. It also carries out the Census of Population for England and Wales
Customer Contact Centre ffice for National Statistics oom 1.101 overnment Buildings ardiff Road ewport P10 8XG
hone: 0845 601 3034 inicom: 01633 815044
mail: [email protected]
ebsite: www.ons.gov.uk/
ORGCNN PM E W
The Northern Ireland Statistics and Research Agency (NISRA) is Northern Ireland’s official statistics organisation. The agency is also responsible for registering births, marriages, adoptions and deaths in Northern Ireland, and the Census of Population.
Northern Ireland Statistics and Research Agency McAuley House 2-14 Castle Street Belfast BT1 1SA Phone: 028 9034 8100 Email: [email protected] Website: www.nisra.gov.uk
Related organisations
Organisation Contact
© Crown Copyright 2018
You may use or re-use this information (not including logos) free of charge in any format or medium, under the terms of the Open Government Licence. Further is available within the Copyright & Disclaimer section of the National Records of Scotland website.
51 © Crown Copyright 2018